Embed Size (px)
Citation preview
254486 Data ScienceChapter 01-Intoduction
Assoc. Prof. Kraisak Kesorn
CSIT, Naresuan University
Outline• Data, Big Data and Challenges
• Data Science• Introduction
• Why Data Science
• Data Scientists• What do they do?
• Major/Concentration in Data Science• What courses to take.
Data All Around
• Lots of data is being collected and warehoused
• Web data, e-commerce
• Financial transactions, bank/credit transactions
• Online trading and purchasing
• Social Network
How Much Data Do We have?
• Google processes 20 PB a day (2008)
• Facebook has 60 TB of daily logs
• eBay has 6.5 PB of user data + 50 TB/day (5/2009)
• 1000 genomes project: 200 TB
• Cost of 1 TB of disk: $35
• Time to read 1 TB disk: 3 hrs
(100 MB/s)
Types of Data We Have
• Relational Data (Tables/Transaction/Legacy Data)
• Text Data (Web)
• Semi-structured Data (XML)
• Graph Data
• Social Network, Semantic Web (RDF), …
• Streaming Data
• You can afford to scan the data once
What To Do With These Data?
• Aggregation and Statistics • Data warehousing and OLAP
• Indexing, Searching, and Querying• Keyword based search
• Pattern matching (XML/RDF)
• Knowledge discovery• Data Mining
• Statistical Modeling
What is Data Science?
• An area that manages, manipulates, extracts, and interprets knowledge from tremendous amount of data
• Data science (DS) is a multidisciplinary field of study with goal to address the challenges in big data
• Data science principles apply to all data – big and small
https://hbr.org/2012/10/data-scientist-the-sexiest-job-of-the-21st-century/
What is Data Science?
• Theories and techniques from many fields and disciplines are used to investigate and analyze a large amount of data to help decision makers in many industries such as science, engineering, economics, politics, finance, and education
• Computer Science
• Pattern recognition, visualization, data warehousing, High performance computing, Databases, AI
• Mathematics
• Mathematical Modeling
• Statistics
• Statistical and Stochastic modeling, Probability.

Data Science Data Science
Real Life Examples
• Companies learn your secrets, shopping patterns, and preferences• For example, can we know if a woman is pregnant, even if she doesn’t want
us to know? Target case study
• Data Science and election (2008, 2012)• 1 million people installed the Obama Facebook app that gave access to info
on “friends”
Data Scientists
• Data Scientist• The Sexiest Job of the 21st Century
• They find stories, extract knowledge. They are not reporters

What do Data Scientists do?
• National Security
• Cyber Security
• Business Analytics
• Engineering
• Healthcare
• And more ….
Concentration in Data Science
• Mathematics and Applied Mathematics
• Applied Statistics/Data Analysis
• Solid Programming Skills (R, Python, Julia, SQL)
• Data Mining
• Data Base Storage and Management
• Machine Learning and discovery
Data Science Processes
15
Data Science Processes (Get Data)
• First, we obtain the data that we need from available data sources.
• you will need to query databases.
• You may also receive data in file formats like Microsoft Excel, CSV, TSV.
• Another popular option to gather data is connecting to Web APIs.
• Skills required
• MySQL, PostgreSQL or MongoDB
• Apache Hadoop, Spark or Flink
16
Data Science Processes (Explore Data)
• Explore: inspect the data and its properties e.g. data types like numerical data, categorical data, ordinal and nominal data etc. require different treatments.
• Clean and Filter data: if the data is unfiltered and irrelevant, the results of the analysis will not mean anything.
• Convert the data from one format to another.
• Compute descriptive statistics to extract features and test significant variables e.g. correlation.
• Utilize data visualization to help us to identify significant patterns and trends in our data.
• You will need scripting tools like Python or Azure ML to help you to scrub the data.
17
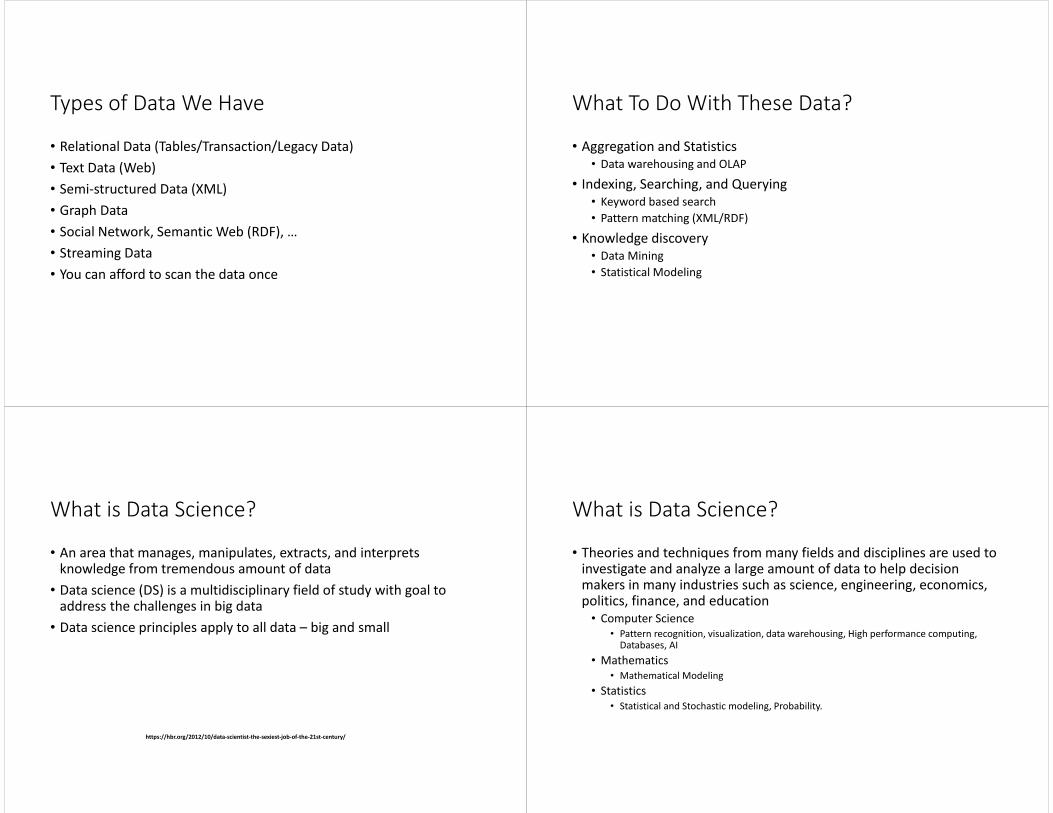
Data Science Processes (Model Data)
• Train models to perform classification
• Separate data into 2 groups: Training and Testing dataset
• Apply data mining algorithms and compare the performance
• Supervised algorithms
• Unsupervised algorithms
• Regression models
18
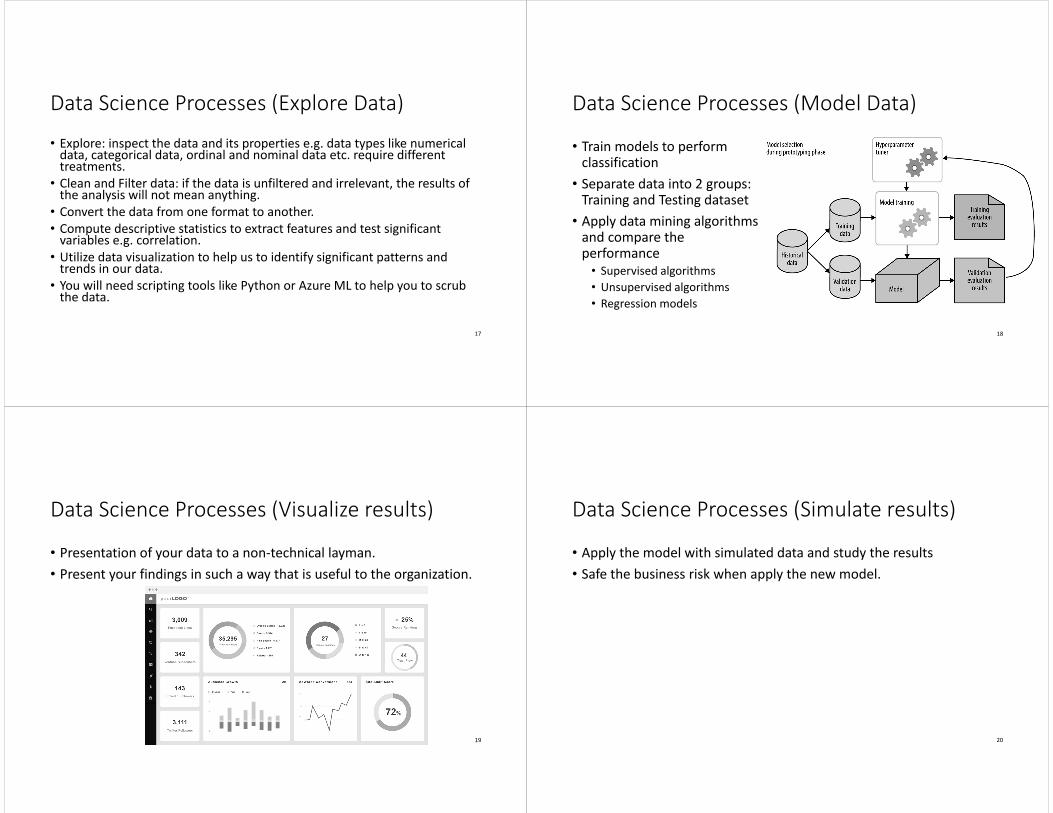
Data Science Processes (Visualize results)
• Presentation of your data to a non-technical layman.
• Present your findings in such a way that is useful to the organization.
19
Data Science Processes (Simulate results)
• Apply the model with simulated data and study the results
• Safe the business risk when apply the new model.
20
Data Science Processes (Deployment)
• Apply the model with the real data of the company
• Observe the results from the model
• Support and maintenance
• Plan to upgrade, update, and fix the model
21
Data Science with Azure ML and Python
Assoc. Prof. Kraisak Kesorn
CSIT, Naresuan University
22
Tuto
ria
l C
on
ten
t
23
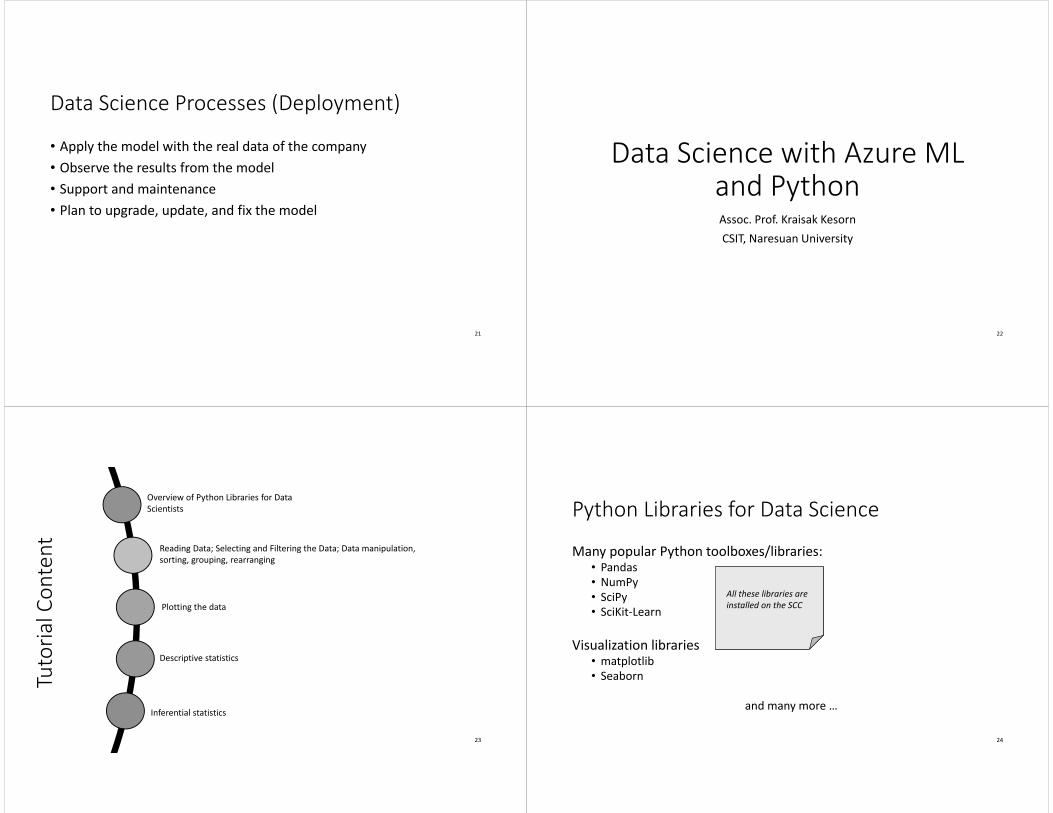
Overview of Python Libraries for Data
Scientists
Reading Data; Selecting and Filtering the Data; Data manipulation,
sorting, grouping, rearranging
Plotting the data
Descriptive statistics
Inferential statistics
Python Libraries for Data Science
Many popular Python toolboxes/libraries:• Pandas
• NumPy
• SciPy
• SciKit-Learn
Visualization libraries• matplotlib
• Seaborn
and many more …
24
All these libraries are
installed on the SCC
Python Libraries for Data Science
Pandas:
adds data structures and tools designed to work with table-like data (similar to Series and Data Frames in R)
provides tools for data manipulation: reshaping, merging, sorting, slicing, aggregation etc.
allows handling missing data
25
Link: http://pandas.pydata.org/
Python Libraries for Data Science
NumPy:
introduces objects for multidimensional arrays and matrices, as well as functions that allow to easily perform advanced mathematical and statistical operations on those objects
provides vectorization of mathematical operations on arrays and matrices which significantly improves the performance
many other python libraries are built on NumPy
26
Link: http://www.numpy.org/
Python Libraries for Data Science
SciPy:
collection of algorithms for linear algebra, differential equations, numerical integration, optimization, statistics and more
part of SciPy Stack
built on NumPy
27
Link: https://www.scipy.org/scipylib/ Link: http://scikit-learn.org/
Python Libraries for Data Science
SciKit-Learn:
provides machine learning algorithms: classification, regression, clustering, model validation etc.
built on NumPy, SciPy and matplotlib
28
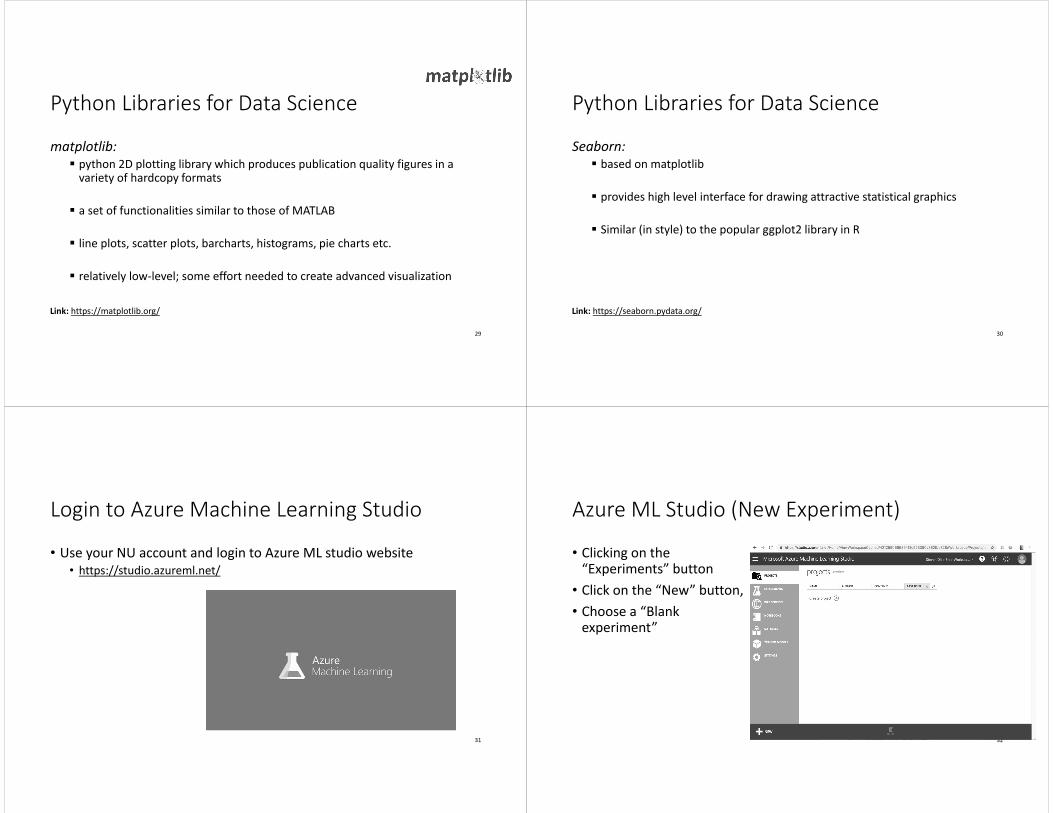
matplotlib:
python 2D plotting library which produces publication quality figures in a variety of hardcopy formats
a set of functionalities similar to those of MATLAB
line plots, scatter plots, barcharts, histograms, pie charts etc.
relatively low-level; some effort needed to create advanced visualization
Link: https://matplotlib.org/
Python Libraries for Data Science
29
Seaborn:
based on matplotlib
provides high level interface for drawing attractive statistical graphics
Similar (in style) to the popular ggplot2 library in R
Link: https://seaborn.pydata.org/
Python Libraries for Data Science
30
Login to Azure Machine Learning Studio
• Use your NU account and login to Azure ML studio website• https://studio.azureml.net/
31
Azure ML Studio (New Experiment)
• Clicking on the “Experiments” button
• Click on the “New” button,
• Choose a “Blank experiment”
32
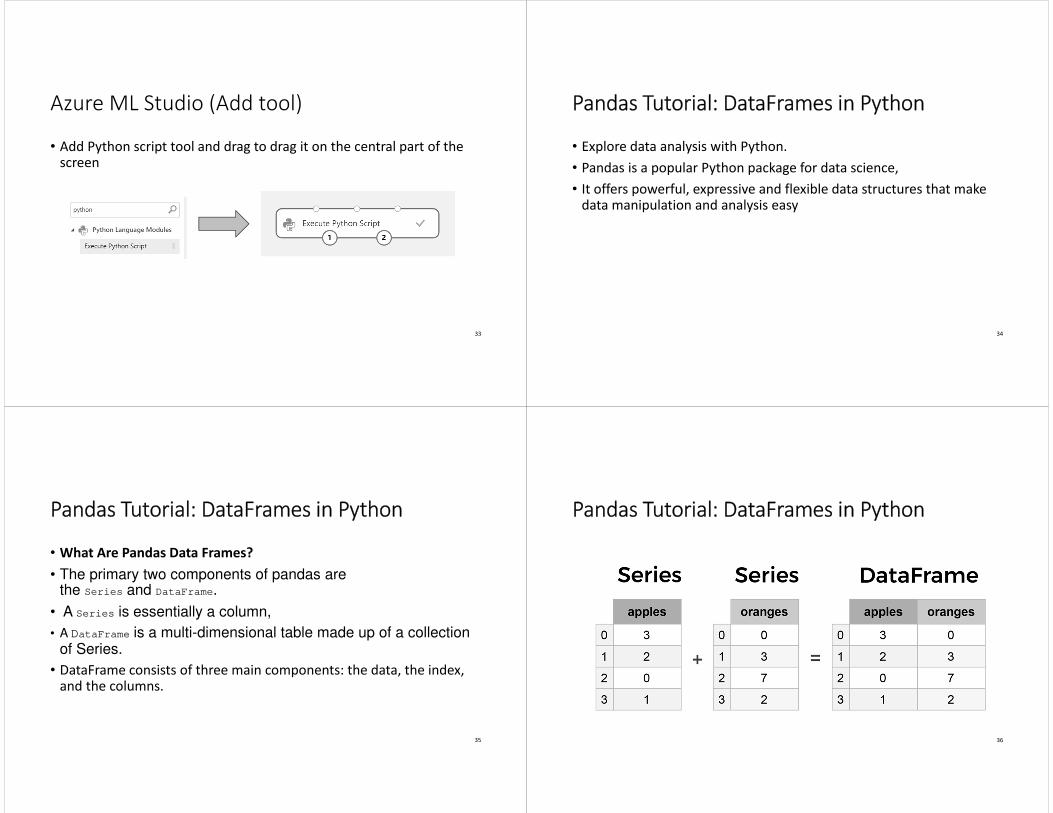
Azure ML Studio (Add tool)
• Add Python script tool and drag to drag it on the central part of the screen
33
Pandas Tutorial: DataFrames in Python
• Explore data analysis with Python.
• Pandas is a popular Python package for data science,
• It offers powerful, expressive and flexible data structures that make data manipulation and analysis easy
34
Pandas Tutorial: DataFrames in Python
• What Are Pandas Data Frames?
• The primary two components of pandas are the Series and DataFrame.
• A Series is essentially a column,
• A DataFrame is a multi-dimensional table made up of a collection of Series.
• DataFrame consists of three main components: the data, the index, and the columns.
35
Pandas Tutorial: DataFrames in Python
36
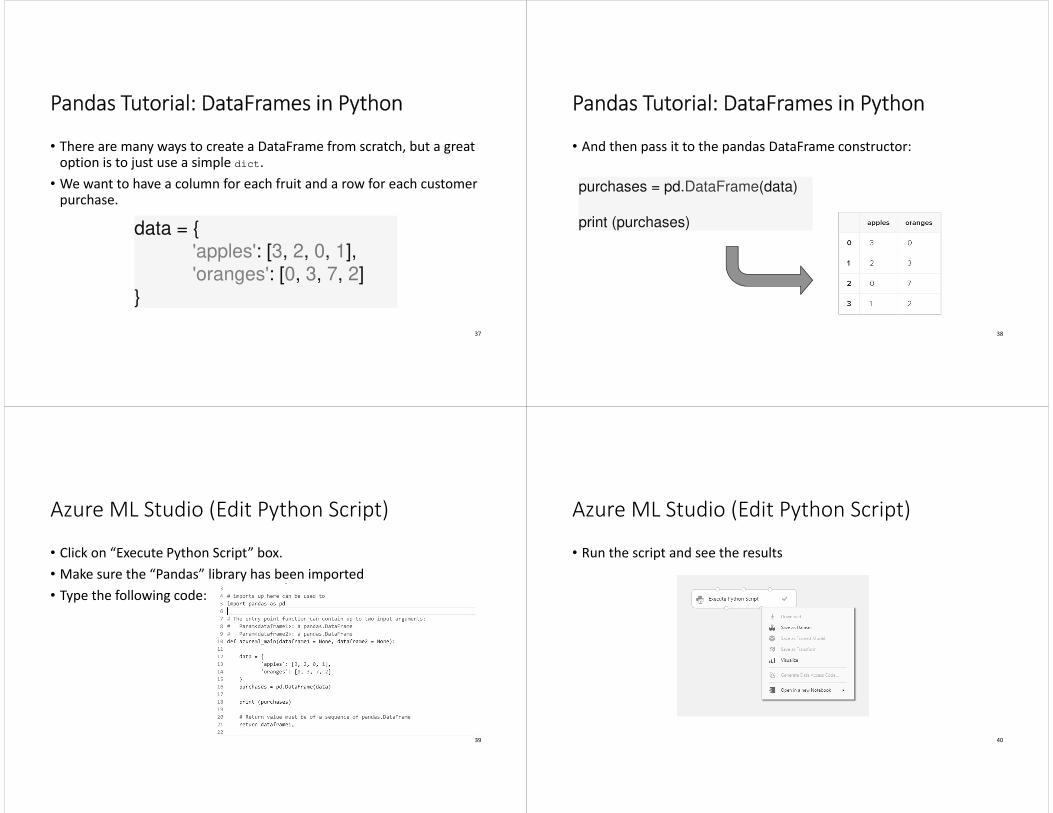
Pandas Tutorial: DataFrames in Python
• There are many ways to create a DataFrame from scratch, but a great option is to just use a simple dict.
• We want to have a column for each fruit and a row for each customer purchase.
37
data = { 'apples': [3, 2, 0, 1], 'oranges': [0, 3, 7, 2]
}
Pandas Tutorial: DataFrames in Python
• And then pass it to the pandas DataFrame constructor:
38
purchases = pd.DataFrame(data)
print (purchases)
Azure ML Studio (Edit Python Script)
• Click on “Execute Python Script” box.
• Make sure the “Pandas” library has been imported
• Type the following code:
39
Azure ML Studio (Edit Python Script)
• Run the script and see the results
40
Laboratories
• DS00: Introduction Azure ML with Python
• DS01: First Python Script
• DS02: Read data source from CSV
41
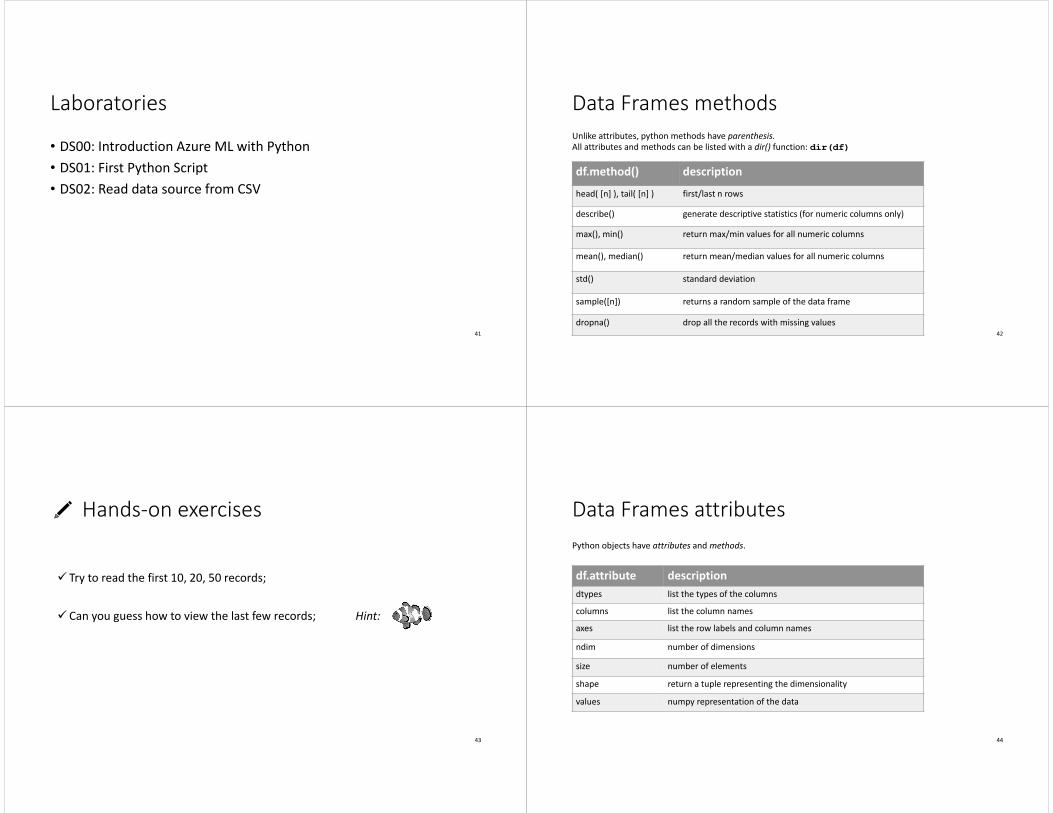
Data Frames methods
42
df.method() description
head( [n] ), tail( [n] ) first/last n rows
describe() generate descriptive statistics (for numeric columns only)
max(), min() return max/min values for all numeric columns
mean(), median() return mean/median values for all numeric columns
std() standard deviation
sample([n]) returns a random sample of the data frame
dropna() drop all the records with missing values
Unlike attributes, python methods have parenthesis.
All attributes and methods can be listed with a dir() function: dir(df)
Hands-on exercises
43
Try to read the first 10, 20, 50 records;
Can you guess how to view the last few records; Hint:
Data Frames attributes
44
Python objects have attributes and methods.
df.attribute description
dtypes list the types of the columns
columns list the column names
axes list the row labels and column names
ndim number of dimensions
size number of elements
shape return a tuple representing the dimensionality
values numpy representation of the data
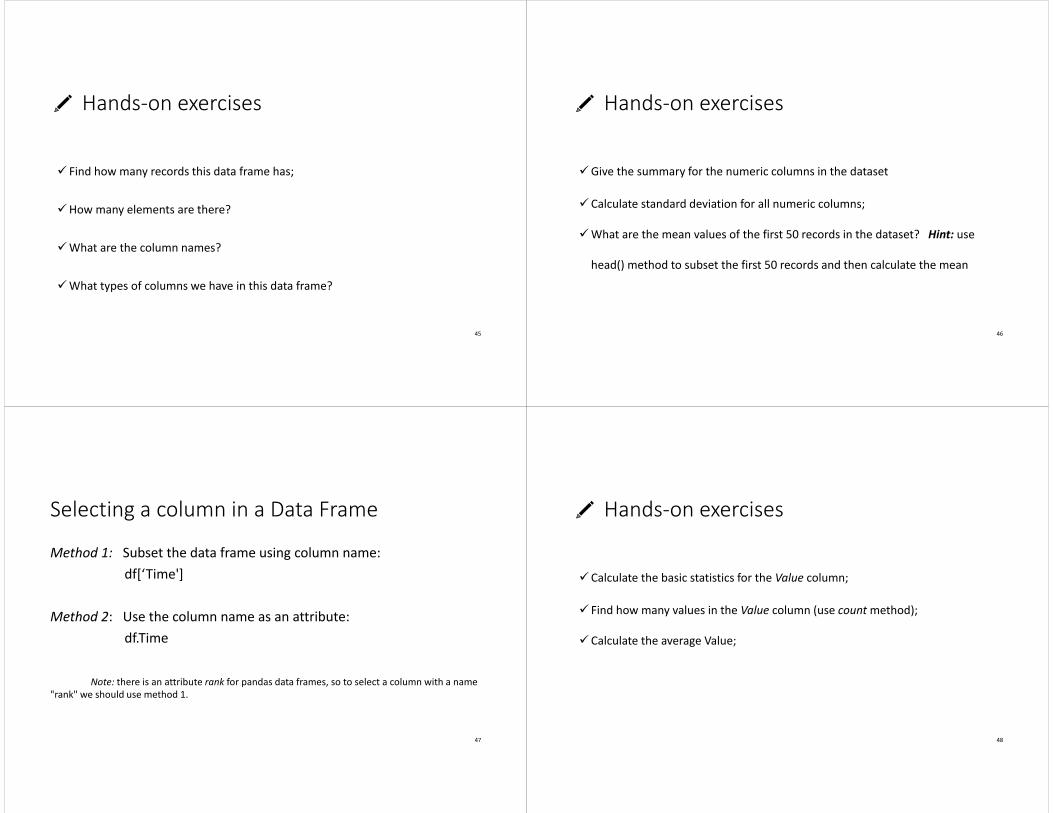
Hands-on exercises
45
Find how many records this data frame has;
How many elements are there?
What are the column names?
What types of columns we have in this data frame?
Hands-on exercises
46
Give the summary for the numeric columns in the dataset
Calculate standard deviation for all numeric columns;
What are the mean values of the first 50 records in the dataset? Hint: use
head() method to subset the first 50 records and then calculate the mean
Selecting a column in a Data Frame
Method 1: Subset the data frame using column name:
df[‘Time']
Method 2: Use the column name as an attribute:
df.Time
Note: there is an attribute rank for pandas data frames, so to select a column with a name
"rank" we should use method 1.
47
Hands-on exercises
48
Calculate the basic statistics for the Value column;
Find how many values in the Value column (use count method);
Calculate the average Value;

Data Frames groupby method
49
Using "group by" method we can:
• Split the data into groups based on some criteria
• Calculate statistics (or apply a function) to each group
In [ ]: #Group data using rank
df_geo = df.groupby([‘GEO'])
In [ ]: #Calculate mean value for each numeric column per each group
geo_data = data.groupby(['GEO'], sort=False)[['Value']].mean()
Data Frame: filtering
50
To subset the data we can apply Boolean indexing. This indexing is commonly
known as a filter. For example if we want to subset the rows in which the salary
value is greater than $120K:
In [ ]: #Calculate mean salary for each professor rank:
df_sub = df[ df['salary'] > 120000 ]
In [ ]: #Select only those rows that contain female professors:
df_f = df[ df['sex'] == 'Female' ]
Any Boolean operator can be used to subset the data:
> greater; >= greater or equal;
< less; <= less or equal;
== equal; != not equal;
Data Frames: Slicing
51
There are a number of ways to subset the Data Frame:
• one or more columns
• one or more rows
• a subset of rows and columns
Rows and columns can be selected by their position or label
Data Frames: Slicing
52
When selecting one column, it is possible to use single set of brackets, but the
resulting object will be a Series (not a DataFrame):
In [ ]: #Select column salary:
df['salary']
When we need to select more than one column and/or make the output to be a
DataFrame, we should use double brackets:
In [ ]: #Select column salary:
df[['rank','salary']]
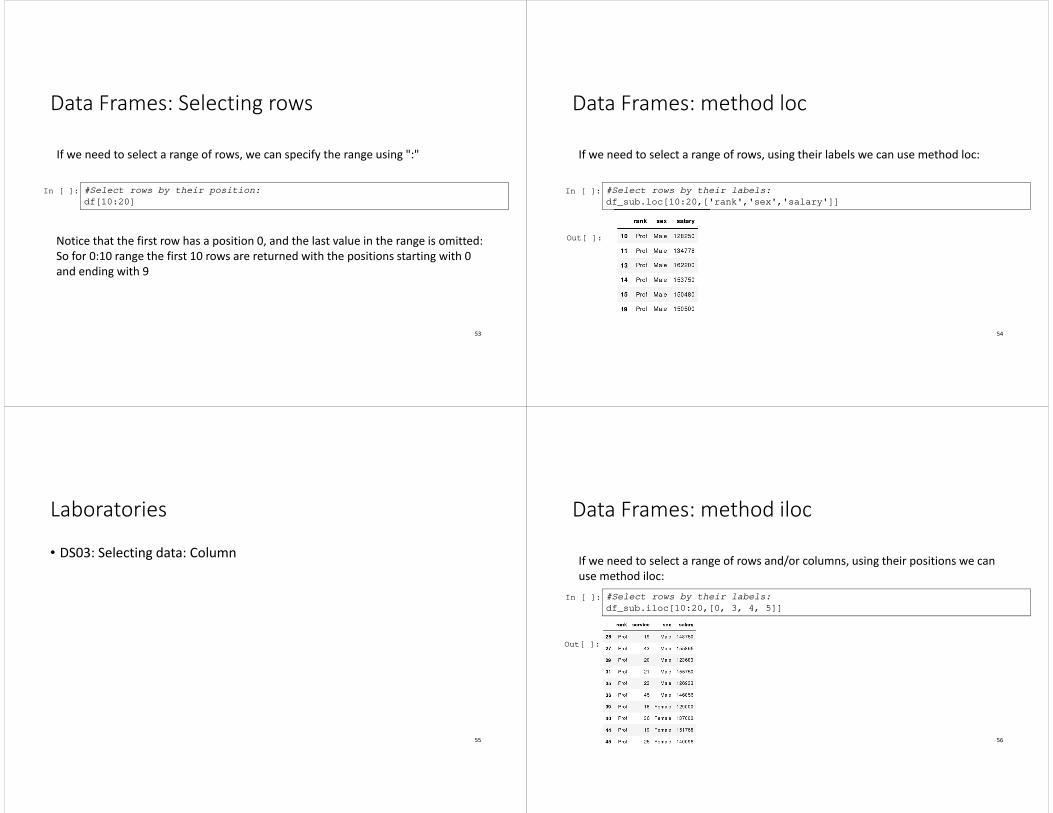
Data Frames: Selecting rows
53
If we need to select a range of rows, we can specify the range using ":"
In [ ]: #Select rows by their position:
df[10:20]
Notice that the first row has a position 0, and the last value in the range is omitted:
So for 0:10 range the first 10 rows are returned with the positions starting with 0
and ending with 9
Data Frames: method loc
54
If we need to select a range of rows, using their labels we can use method loc:
In [ ]: #Select rows by their labels:
df_sub.loc[10:20,['rank','sex','salary']]
Out[ ]:
Laboratories
• DS03: Selecting data: Column
55
Data Frames: method iloc
56
If we need to select a range of rows and/or columns, using their positions we can
use method iloc:
In [ ]: #Select rows by their labels:
df_sub.iloc[10:20,[0, 3, 4, 5]]
Out[ ]:
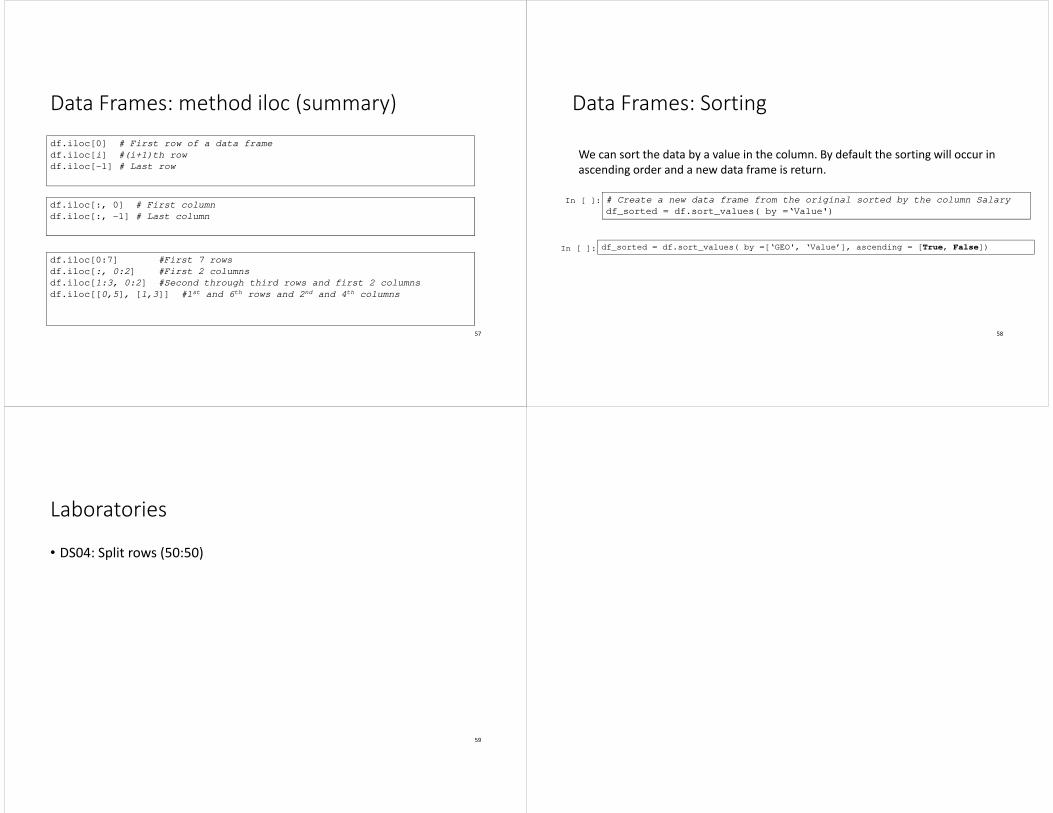
Data Frames: method iloc (summary)
57
df.iloc[0] # First row of a data frame
df.iloc[i] #(i+1)th row
df.iloc[-1] # Last row
df.iloc[:, 0] # First column
df.iloc[:, -1] # Last column
df.iloc[0:7] #First 7 rows
df.iloc[:, 0:2] #First 2 columns
df.iloc[1:3, 0:2] #Second through third rows and first 2 columns
df.iloc[[0,5], [1,3]] #1st and 6th rows and 2nd and 4th columns
Data Frames: Sorting
58
We can sort the data by a value in the column. By default the sorting will occur in
ascending order and a new data frame is return.
In [ ]: # Create a new data frame from the original sorted by the column Salary
df_sorted = df.sort_values( by =‘Value')
In [ ]: df_sorted = df.sort_values( by =[‘GEO', ‘Value’], ascending = [True, False])
Laboratories
• DS04: Split rows (50:50)
59