Embed Size (px)
Citation preview
CHAPTER – 1INTRODUCTION
General
Reinforced soil is a composite construction material consisting of soil fill strengthened by
inclusion of tensile elements. The reinforcing elements may be in different forms e.g.
metal sheets, mats, fiber reinforced plastics, geosynthetics, etc.
Fiber reinforcement is an age-old technique used in the past for making un-burnt clay
bricks (reinforced with straw). Also significant research is being conducted since 1960s
on soil reinforcement with natural and man made fibers. Fibers specifically engineered
for soil reinforcement are available now (e.g. fiber grids by synthetic industries) and have
been successfully used in many construction projects in various countries. It has been
widely reported that the properties (especially the shear strength) of the soil can be
enhanced by fiber reinforcement, resulting in more stable soil structure with high load
bearing capacities.
This project aims at using Geosynthetics for reinforcing soil and study the variation in
the reinforcement effect at different depths in case of planar sheet element form and at
different aspect ratios in case of randomly distributed fiber form.
1.2 Pavement
A Pavement is a hard crust constructed over the natural soil for the purpose of providing
a stable and even surface for the vehicles. Basic requirement of a good pavement is to
provide a stable non-yielding surface for the movement of heavy vehicles. A Pavement
layer that distributes the wheel loads through the largest area per unit thickness of the
layer is the most efficient.
Role of subgrade in pavement design-The thickness of the pavement depends upon the
properties of the subgrade. A thicker pavement is required over a weaker soil.
1
1.3 CBR Value
The CBR values are used to determine the total thickness of the flexible pavement and
thickness of various layers. The required thickness of construction above a material
decreases as the CBR value increases. The design curves give the required thickness of
construction above a material of a certain CBR value. These design curves are based on
the data collected on a number of pavements which performed satisfactorily.
1.4 Significance of reinforced soils
To improve the bearing capacity of poor soil before construction of the pavement, i.e. to
make use of unsuitable land for pavement construction. The CBR value of soil can be
increased by reinforcement which results in reduced thickness of the pavement which
means an economic design.
1.5 Geosynthetics
Many civil engineering problems in coastal areas and hilly regions need stabilization of
soft soil. To tackle such problems Geosynthetics emerged as a good solution.
Geosynthetics are made of synthetic materials such as polythene, polyester, and nylon.
Geosynthetics have high tensile strength. These can be used to increase the load carrying
capacity of the soil.
1.6 Statement of the problem
1.6.1 Objective
The primary objective of this study is to evaluate the reinforcement mechanism in
unsoaked and soaked conditions in terms of CBR value. The secondary objective is to
compare the reinforcement effect of a given Geosynthetics in planar element form and in
randomly distributed fiber form. It further includes the optimum fiber content and the
aspect ratio that is yielding maximum CBR for the materials used in this dissertation.
2
1.6.2 Necessity
CBR value is the basis for the design of pavements. Higher CBR value gives economical
pavement layers. It is therefore necessary to improve the CBR value. In this direction
efforts are made in this project to improve the CBR value through reinforcement function
of Geosynthetics. In view of the above, there is great necessity for this project work.
1.6.3 Scope
Scope of this project work is limited to conducting tests on one type of Sand collected
from River Krishna in Krishna district and one type of Geosynthetics only. Sand is tested
in both soaked and unsoaked conditions. The CBR tests are conducted in this dissertation.
Reinforcement in planar sheet form is limited to one layer only. The moulding moisture
content was maintained at OMC of the base material Sand. It is considered that, the
inclusion of fiber do not change the moulding density significantly.
1.7 Organization of the Thesis
This thesis has been organized into 4 Chapters.
1 Literature review related to unreinforced and reinforced soils is given in Chapter
2.
2 Chapter 3 deals with methodology adopted.
3 Chapter 4 deals with results and discussion.
4 Chapter 5 deals with the observations and conclusion.
3
CHAPTER-2LITERATURE REVIEW
General
Many civil engineering problems in coastal areas and hilly regions need stabilization of
soft soil. Some of these structures may be temporary for establishing roads and rail
communication links and in some accessibility by itself possesses a major problem. To
tackle such problems in civil engineering, geosynthetics emerged as a good solution.
To improve the mechanical properties of soils, a variety of materials are used for
reinforcement e.g. metallic elements, geosynthetics and others.
Mechanism of shearing resistance
Relative sliding between particles is a major factor contributing to deformation in a soil
mass. Hence, the resistance that the soil can offer to deformation will have to come
mainly from the shear resistance between the particles at their contact points. At these
points of contact, forces of attraction exist between the surface atoms of the particles. If
the normal force acting on the particles increases, the number of contact points may
increase leading to an increase in the number of bonds, thus causing the total shear
resistance to increase. The reverse may happen when the normal force decreases. It can
be said that this case is analogous to the shear resistance of a solid block of a material
like steel, which is frictional in nature. However, a part of the shear resistance may, in
some cases, be present even when the normal force is reduced to zero. This part of the
shear strength is ascribed to true cohesion between the particles and is perhaps due to
sustained contact between particles for a long duration of time.
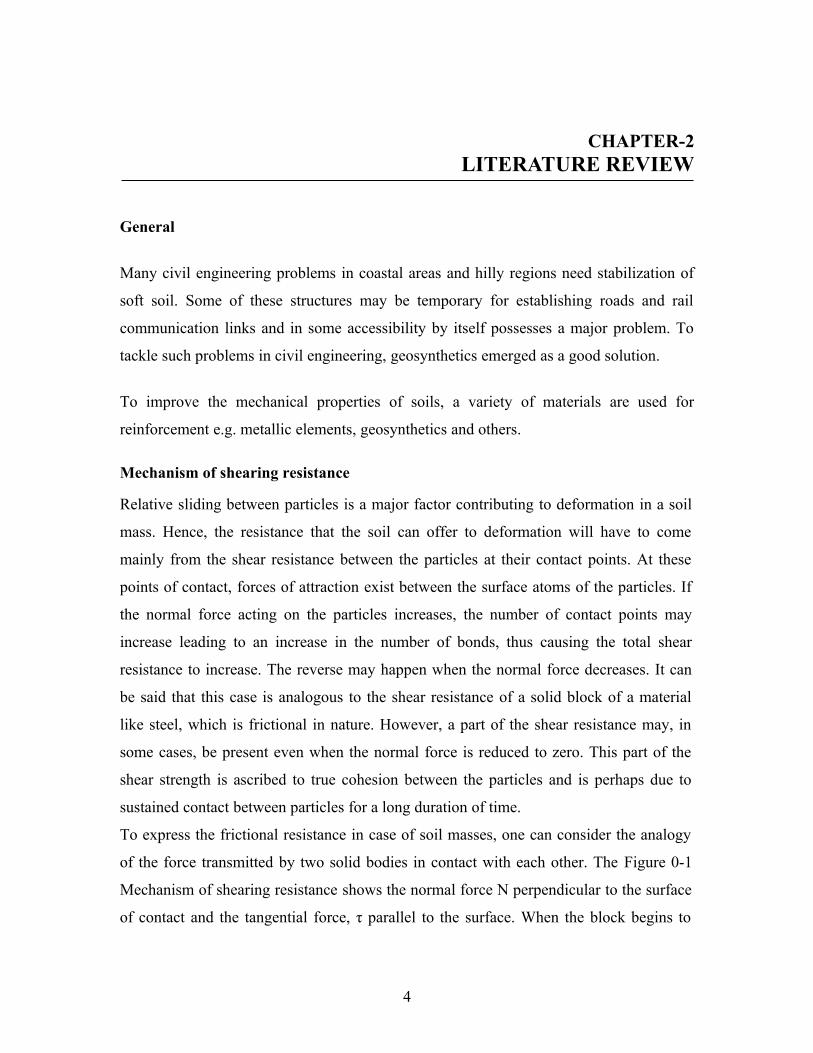
To express the frictional resistance in case of soil masses, one can consider the analogy
of the force transmitted by two solid bodies in contact with each other. The Figure 0-1
Mechanism of shearing resistance shows the normal force N perpendicular to the surface
of contact and the tangential force, τ parallel to the surface. When the block begins to
4
slide, the shearing force will have reached its maximum value. τmax is equal to μ N where
μ is called the coefficient of friction.
Figure 0-1 Mechanism of shearing resistance
In soils like sands and other granular materials, the resistance to sliding on any plane
within the soil mass depends on the normal force and the angle of internal friction.
However, in case of these soils, there is also the rolling friction in addition to the sliding
friction. Even more important in sands is the phenomenon of interlocking, which
contributes appreciably to the frictional resistance, especially if the relative density of the
sand deposits is high.
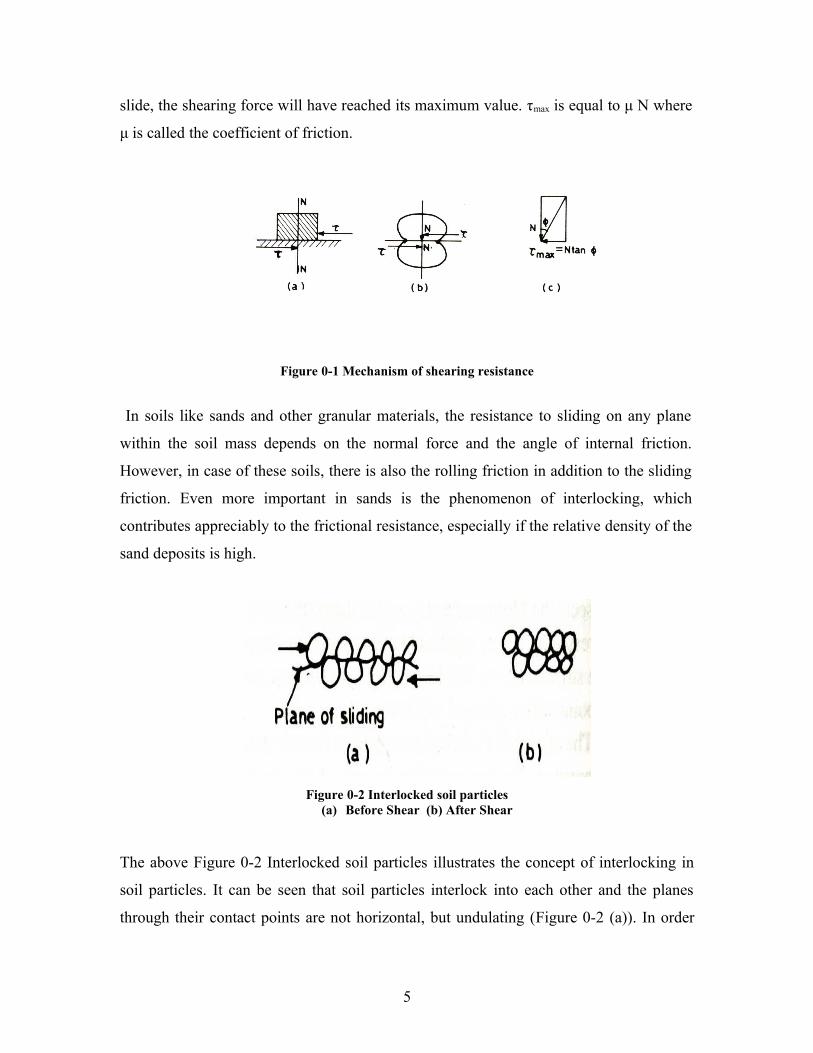
Figure 0-2 Interlocked soil particles(a) Before Shear (b) After Shear
The above Figure 0-2 Interlocked soil particles illustrates the concept of interlocking in
soil particles. It can be seen that soil particles interlock into each other and the planes
through their contact points are not horizontal, but undulating (Figure 0-2 (a)). In order
5
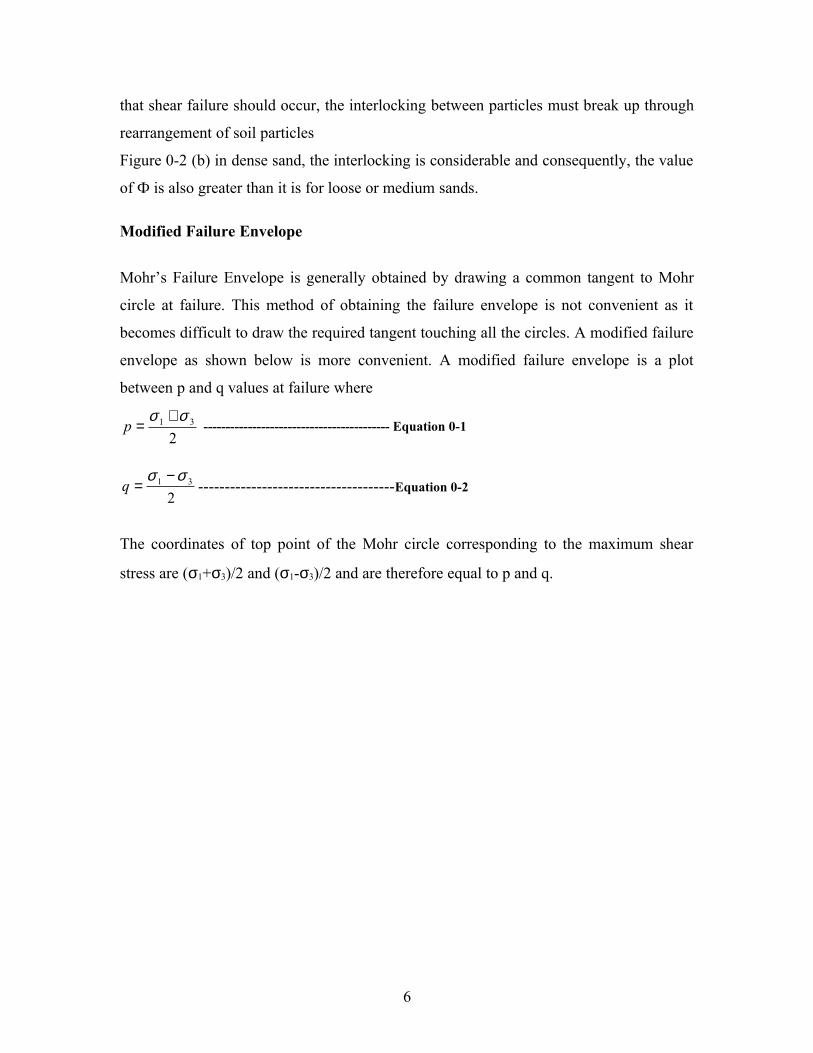
that shear failure should occur, the interlocking between particles must break up through
rearrangement of soil particles
Figure 0-2 (b) in dense sand, the interlocking is considerable and consequently, the value
of Ф is also greater than it is for loose or medium sands.
Modified Failure Envelope
Mohr’s Failure Envelope is generally obtained by drawing a common tangent to Mohr
circle at failure. This method of obtaining the failure envelope is not convenient as it
becomes difficult to draw the required tangent touching all the circles. A modified failure
envelope as shown below is more convenient. A modified failure envelope is a plot
between p and q values at failure where
231 σσ +
=p ------------------------------------------ Equation 0-1
231 σσ −
=q -------------------------------------Equation 0-2
The coordinates of top point of the Mohr circle corresponding to the maximum shear
stress are (σ1+σ3)/2 and (σ1-σ3)/2 and are therefore equal to p and q.
6
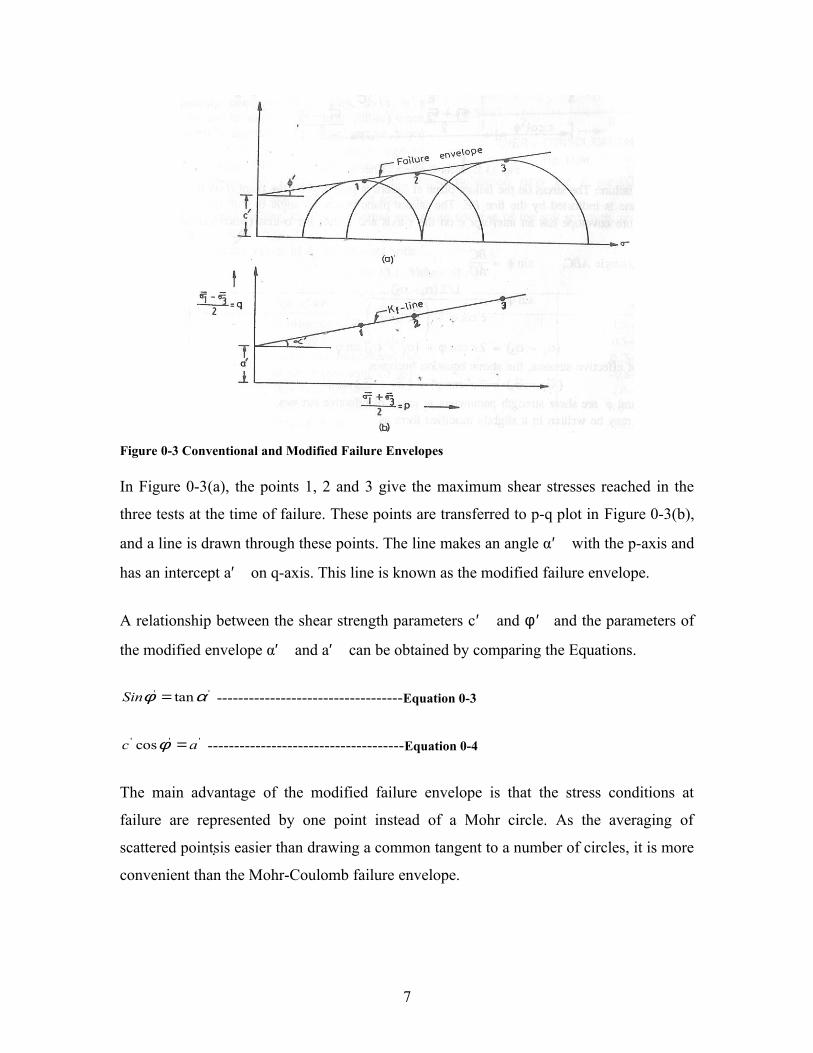
Figure 0-3 Conventional and Modified Failure Envelopes
In Figure 0-3(a), the points 1, 2 and 3 give the maximum shear stresses reached in the
three tests at the time of failure. These points are transferred to p-q plot in Figure 0-3(b),
and a line is drawn through these points. The line makes an angle α′ with the p-axis and
has an intercept a′ on q-axis. This line is known as the modified failure envelope.
A relationship between the shear strength parameters c′ and φ ′ and the parameters of
the modified envelope α′ and a′ can be obtained by comparing the Equations.
'' tanαφ =Sin -----------------------------------Equation 0-3
''' cos ac =φ -------------------------------------Equation 0-4
The main advantage of the modified failure envelope is that the stress conditions at
failure are represented by one point instead of a Mohr circle. As the averaging of
scattered pointsis easier than drawing a common tangent to a number of circles, it is more
convenient than the Mohr-Coulomb failure envelope.
7
Shear Characteristics of Cohesion less Soil
The shear strength of cohesion less soils, such as sands and non-plastic silts, is mainly
due friction between particles. In dense sands, interlocking between particles also
contributes significantly to the strength.
The stress-strain curve for dense sands exhibits a relatively high initial tangent modulus.
The stress reaches a maximum value at its peak at a comparatively low strain and then
decreases rapidly with an increasing strain and eventually becomes more or less constant.
The stress-strain curve for loose sands exhibits a relatively low initial tangent modulus.
At large strains, the stress becomes more or less constant. The dense sand shows initially
a volume decrease in a drained test, but as the strain increases, the volume starts
increasing. The loose sand shows a volume decrease throughout.
In the case of loose sand, the specimen bulges and ultimately fails by sliding
simultaneously on numerous planes. The failure is known as the plastic failure. In the
case of dense sand, the specimen shows a clear failure plane and the failure is known as
the brittle failure.
The failure envelope for dense sand can be drawn either for the peak stresses or for the
ultimate stresses. The value of the angle of shearing resistance (Ф) for the failure
envelope for peak stresses is considerably greater than that for the ultimate stresses. In
the case of loose sands, as the peak stress and the ultimate stress are identical, there is
only one failure envelope. The angle of shearing resistance in very loose state is
approximately equal to the angle of repose. The angle of repose is the angle at which a
heap of dry sand stands without any support. It has been established that air-dry sand
gives approximately the same value of (Ф) as the saturated sand. As it is easier to
perform tests on dry sand, tests can be performed on dry sand instead of saturated sand.
Review of Previous Studies
Goel (1978) summarized the work done by various research workers to find the effect of
particle size, shape, orientation, gradation, soundness, compactness of particles, type of
the test, ratio of box size to the maximum particles size and normal stress on the sand and
gravelly material. He concluded the angle of internal friction depends upon ratio of
8
specimen size to maximum particle size, shape of particle, void ratio, gradation,
confining pressure etc. The findings arrived at by different research workers regarding
the influence of different factors on shear strength parameters are not the same.
Fagnoul (1969) conducted triaxial and direct shear tests on phylitic angular material. The
sizes of sample were 20x20x7.8cm; 5x5x2cm in direct shear test and of 5cm and 50cm
diameters in triaxial test. He concluded that the specimen size to maximum particle size
ratio up to 5 and testing speed from 0.14 to 0.79 mm/minute have no effect on shear
characters of the sample. Shear strength of the specimen is affected by finer fraction, if
fines are more than 50% in well graded material. The shearing resistance does not vary
greatly with mean size of the material except for very fine particles, when the grain size,
distribution and porosity remain constant. The shear stress deformation curve is
influenced by the density considerably. The value of the angle of shearing resistance
found out by triaxial tests is lower as compared to the direct shear values.
Sowers and Sowers (1961) summed up the phenomenon of shearing resistance as
follows: When a normal load acts on a soil mass, the soil particles respond in two ways
simultaneously. Some of the particles deform more or less elastically. Some particles
undergo local crushing due to development of high stresses at their point of contact. Due
to these two responses, namely elastic distortion and crushing, translation and rotation of
the grains take place altering the pattern of voids in the soil mass. When a shear force is
made to act on the soil mass, two additional responses of the soil grains become evident.
Firstly the particles tend to roll over one another. There is a resistance to the rolling,
depending on the angle of contact and the normal stress acting at the point. When the
resistance is overcome the particles tend to roll.
The practice of building houses and roads on fibre-reinforced earth and constructing
earth walls with different types of reinforcing intrusions is an old concept. Rope fibres
and bamboo were used to strengthen rural road bases and the soil below low-cost low-
rise buildings. In recent times, this concept has been extended to other materials, like
fabrics and membranes, often termed geotextiles and geomembranes for reinforcing the
9
soil for improvement of its properties (Narain and Ratnam, 1985; Datye and Nagaraju,
1985).
The concept of reinforced earth is based on the principle of Vidal (1969) by which the
introduction of reinforcing elements in a soil mass increases the shear resistance of the
medium. In the early studies the use of reinforced earth was confined to retaining walls.
The reinforcements used consist of intrusions ranging from discrete fibres to strips, grids,
woven and non-woven fabrics of metals, paper and polymeric materials.
The first significant study on foundations has been done by Binquet and Lee (1975) who
concluded that the bearing capacity of sand increases to three times or more with
moderate amount of aluminum foil strips reinforcement. Yang (1972) and Andrews et al
(1978) also made similar studies using a single layer of mesh reinforcement.
A significant study on bearing capacity of sand reinforced with coir rope was done by
Ramanatha Ayyar, Joseph, and Beena, in the year 1988 and conclusions were drawn.
From the results of bearing capacity tests on model square footing on a deep
homogeneous sand bed with coir rope reinforcements and bamboo strip anchorages, the
following conclusions are drawn.
1. The ultimate bearing capacity can be improved by using coir rope
reinforcement’s up to about 2.5 times.
2. The most significant factor in increasing the ultimate bearing capacity is the
vertical spacing of reinforcement layers. A vertical spacing of 0.25B or less may
be adopted for increasing BCR by more than 100%.
3. The ultimate bearing capacity is not as sensitive to horizontal spacing of
reinforcing ropes as to the vertical spacing of reinforcing layers. However it is
found that beyond X/B=1, the reinforcements are ineffective. Considering the
economy and performance/B=0.5 is recommended as the optimum horizontal
spacing for reinforcing ropes in a layer.
4. The area under reinforcing has very limited influence on bearing capacity. This
area of reinforcing should be as small as possible for economical and practical
10
considerations but should cover the area of stress influence to be effective. An
area of (3B)2 is suggested for optimum results.
5. It can be seen that when the anchorages are kept closer, within the range 3B to
5B, the CBR increases.
6. Only marginal increase is obtained by adopting “mesh” pattern.
7. For a specific load, the settlement is less in reinforced sand than in unreinforced
sand.
8. The increase in volume of reinforcement certainly increases the bearing capacity
but considerably increases the settlement at failure.
An investigation was undertaken to study the behavior of reinforced earth in improving
the bearing capacity and settlement resistance under square and strip footing by
Sreekantaiah, (1988). Locally available river sand was used along with aluminum foil
strips as reinforcing material. The tests were conducted at a density of 1500kg/m3.The
parameters selected were, depth of the top layer of reinforcement below the footing and
the number of layers of reinforcement. It has been concluded that by a suitable
arrangement of the reinforcing strips, the bearing capacity and settlement resistance of
sand could be improved up to 3 times that of the unreinforced sand.
Experimental results reported by various investigators (MCgown et al 1978; Verma and
Char 1978; Gray and Ohashi 1983; Al refeai 1986; Gray and Maher 1989; Gray and
Maher 1990; Al refeai 1991) have shown that fibre reinforcement causes significant
improvement in strength and stiffness to sand. More importantly, fibre reinforced soil
exhibits greater extensibility and small loss of lost strength (i.e. greater ductility in the
composite material) as compared to sand alone or sand reinforced with high modulus
inclusions (Gray and Ohasi 1983; Gray and Al refeai 1986).
The increase in strength and stiffness is reported to be a function of sand characteristics,
particle size, shape, gradation, fibre characteristics, weight fraction, aspect ratio, skin
friction and modulus of elasticity (Gray and Maher 1989 and Maher and Gray).
11
They reported that the strength of sand increases with increase in fibre content, aspect
ratio, and soil surface friction. A better gradation i.e. increase in coefficient of
uniformity, lower sphericity and smaller average grain size (D50) of sand result in higher
fibre contribution to strength (Maher and G ray 1990, Hoare 1979) .Analyzing the results
of a series of laboratory compression and CBR tests on a sandy gravel reinforced and
randomly distributed synthetic fibres<2% by weight observed that the presence of fibres
increased the apparent angle of internal friction and ductility of the soil particularly at
low confining stress.
Verma and Char have reported similar observations in 1978 through triaxial tests on mild
steel reinforced in medium/fine sand. They observed an increase in angle of internal
friction from 36 to 45 degrees, with increase in fibre content from zero to 7% by volume.
Andersland and Khattak 1979 tested kaolinite clay reinforced with paper pulp (cellulose)
fibres in triaxial testing under confining stress of 245kpa to 441kpa.On the basis of both
stiffness and un-drained strength of clay. The effective angle of internal friction of
reinforced soil was reported to range from 20 degrees for unreinforced clay to 80.4
degrees for samples of fibre only.
Setty and Rao(1980) and Setty and Murthy(1990) carried out triaxial tests, CBR tests and
tensile strength tests on silty sand and black cotton soil reinforced with randomly
distributed polypropylene fibres. The results indicated that both the soils showed
significant increase in cohesion intercept and a slight decrease in angle of internal
friction (i.e. overall effect is to increase shear strength) with an increase in fibre content
up to 3% by weight.
Hausman (1976) hypothesized that the strength characteristics of reinforced sand
depends on the increased apparent friction angle. Brown (1977) observed that the
ultimate strength increased with decreasing the distance between the fabric discs and that
the discs which were placed at the two ends of the samples did not influence the ultimate
strength. Lee (1976) carried out a limited unconfined compression tests on compacted
12
clay samples reinforced with these narrow strips of malar type. The results showed an
increase in the ductility of sample but no increase in compression strength. The stress
strain relationships for various materials have been well documented by Holtz et al
(1982). The stress strain behaviour of reinforced soil depends on the type and form of
reinforcing elements and interactions between soil and metal strips.
Banerjee et al (2002) investigated the dimensional and mechanical properties of coir
fibres as a function of fibre length. A sufficient quantity of retted coir fibres was
collected from one particular pit in Kerala and subjected to certain tests to find out fibre
length distribution, determination of thickness, distribution of coir fibres in a husk,
tensile properties and flexural rigidity. From their studies it was concluded that the
length, thickness and linear density of fibres obtained from this particular type of husk
range from 50mm to 250mm, 130μ to 325 μ and 19tex to 60tex respectively. The longer
fibres are in general thicker than shorter ones. The fibre thickness is highly variable
along its length. The breaking load and work of rupture increases perceptibly for fibres
longer than 149mm. However the fibres shorter than 150mm exhibit very similar values.
The flexural rigidity of coir fibre that is longer than 149mm exhibit sharp increase with
the increase in fibre length.
Venkatappa Rao and Balan (2000) after conducting Drained triaxial test on specimens of
sand reinforced with coir fibres (25mm to 50mm) up to 1% reported a significant gain in
strength parameters and stiffness.
Varghese et al (1989) investigated the possibility of increasing the bearing capacity of
cohesion less soils by reinforcing with coconut fibres through model studies. It has been
observed that the bearing capacity of foundation soil will be the maximum when the
reinforcement is kept at a depth of 0.41 times the width of the foundation.
Guha (1995) reveal that coir fibre differs from jute fibres in an aspect other than
durability, jute fibres exhibit moderately high modulus as well as high tenacity and very
low elongation at break whereas coir fibres behave exactly in the opposite manner,
13

namely moderately low modulus, low tenacity and very high elongation break. This
difference persists irrespective of the length of coir fibre.
14
CHAPTER-3METHODOLOGY
The methodology adopted in this project work is as given below :
3.1. Characterization of materials used
3.2. Scheme of experiments
3.3 Procedure of experiments
3.1 Characterization of Materials
The test materials used in this work are:
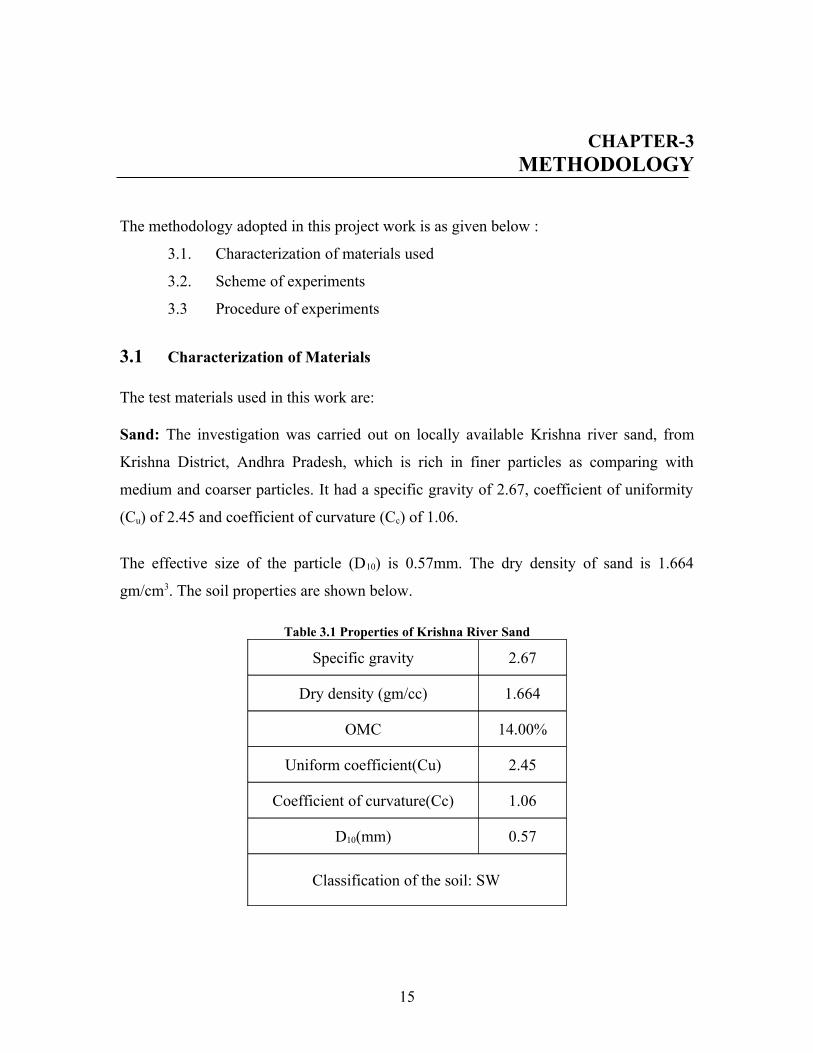
Sand: The investigation was carried out on locally available Krishna river sand, from
Krishna District, Andhra Pradesh, which is rich in finer particles as comparing with
medium and coarser particles. It had a specific gravity of 2.67, coefficient of uniformity
(Cu) of 2.45 and coefficient of curvature (Cc) of 1.06.
The effective size of the particle (D10) is 0.57mm. The dry density of sand is 1.664
gm/cm3. The soil properties are shown below.
Table 3.1 Properties of Krishna River Sand
Specific gravity 2.67
Dry density (gm/cc) 1.664
OMC 14.00%
Uniform coefficient(Cu) 2.45
Coefficient of curvature(Cc) 1.06
D10(mm) 0.57
Classification of the soil: SW
15
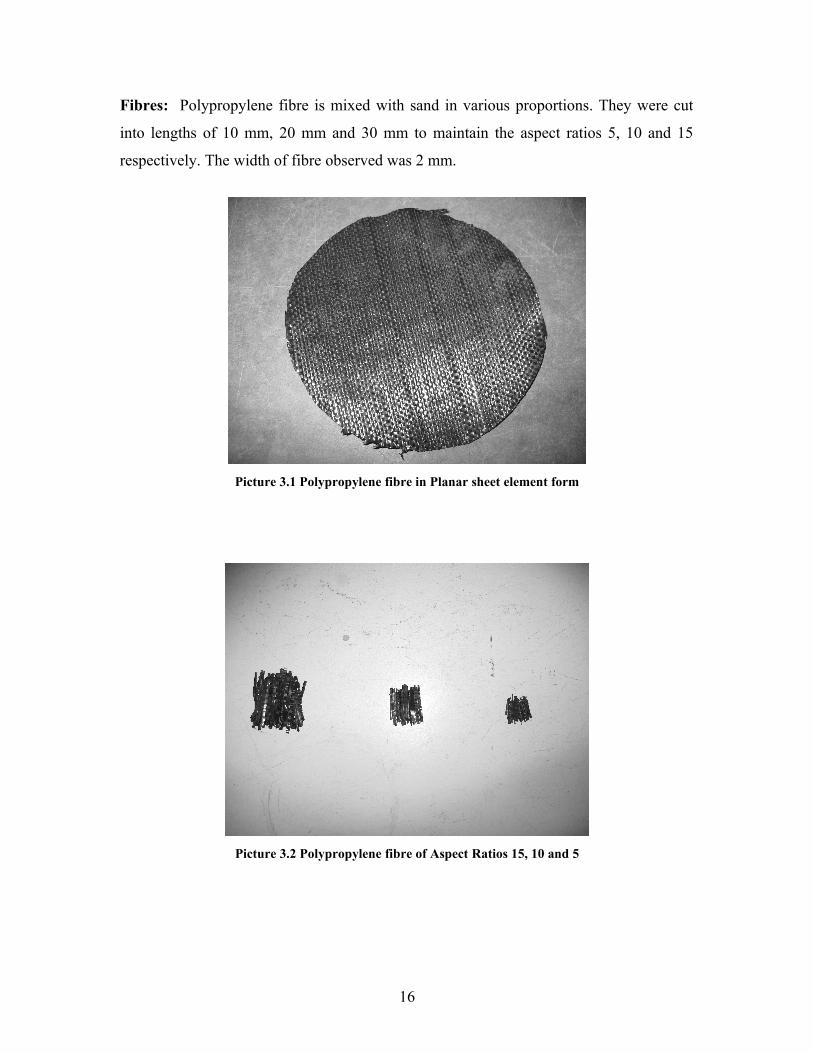
Fibres: Polypropylene fibre is mixed with sand in various proportions. They were cut
into lengths of 10 mm, 20 mm and 30 mm to maintain the aspect ratios 5, 10 and 15
respectively. The width of fibre observed was 2 mm.
Picture 3.1 Polypropylene fibre in Planar sheet element form
Picture 3.2 Polypropylene fibre of Aspect Ratios 15, 10 and 5
16
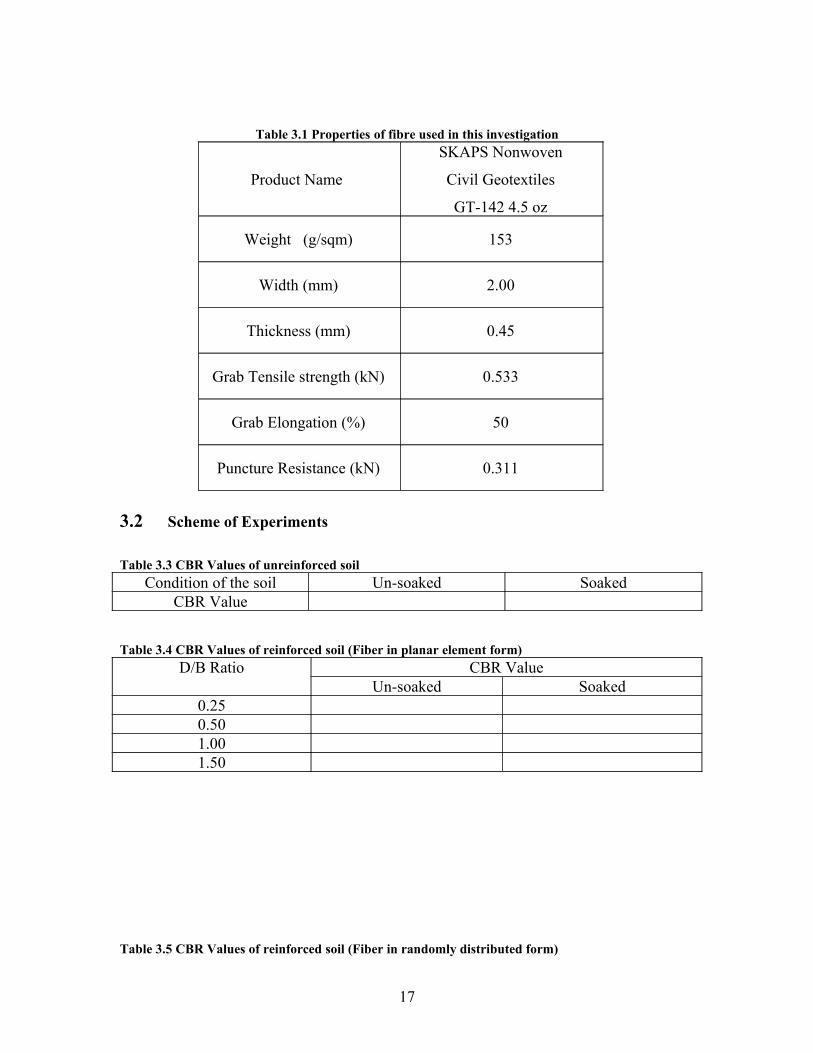
Table 3.1 Properties of fibre used in this investigation
Product Name
SKAPS Nonwoven
Civil Geotextiles
GT-142 4.5 oz
Weight (g/sqm) 153
Width (mm) 2.00
Thickness (mm) 0.45
Grab Tensile strength (kN) 0.533
Grab Elongation (%) 50
Puncture Resistance (kN) 0.311
3.2 Scheme of Experiments
Table 3.3 CBR Values of unreinforced soil
Condition of the soil Un-soaked SoakedCBR Value
Table 3.4 CBR Values of reinforced soil (Fiber in planar element form)
D/B Ratio CBR ValueUn-soaked Soaked
0.250.501.001.50
Table 3.5 CBR Values of reinforced soil (Fiber in randomly distributed form)
17
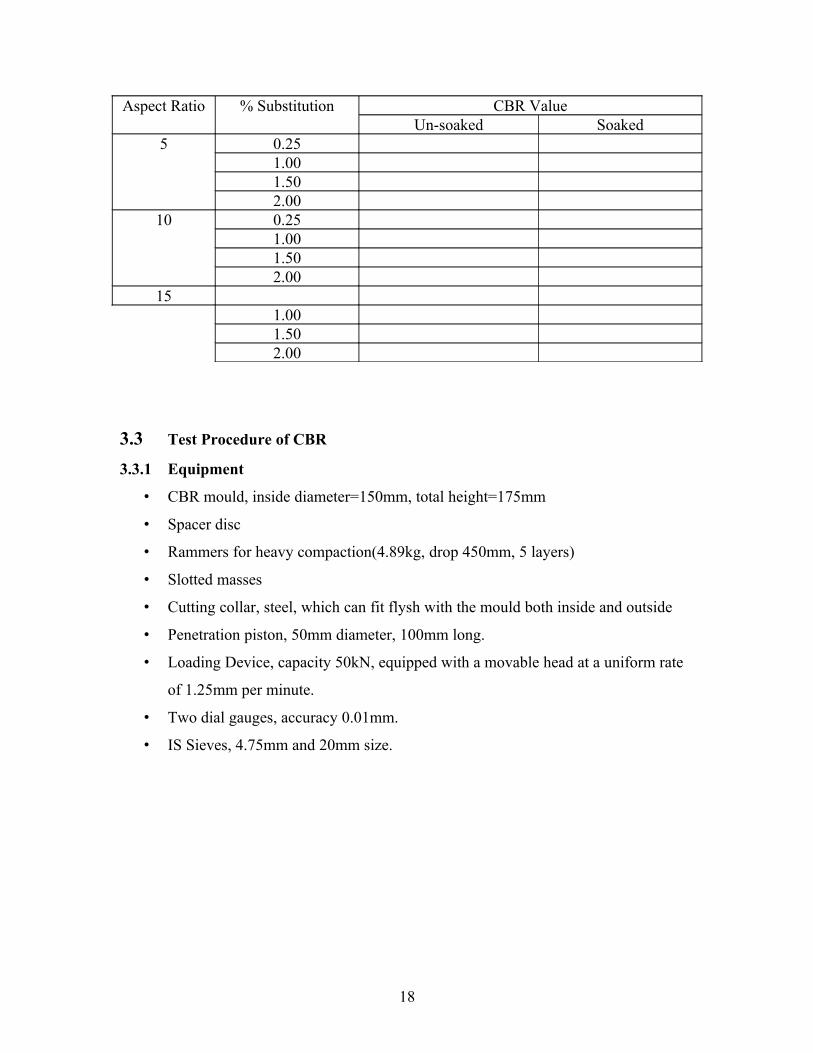
Aspect Ratio % Substitution CBR ValueUn-soaked Soaked
5 0.251.001.502.00
10 0.251.001.502.00
151.001.502.00
3.3 Test Procedure of CBR
3.3.1 Equipment
• CBR mould, inside diameter=150mm, total height=175mm
• Spacer disc
• Rammers for heavy compaction(4.89kg, drop 450mm, 5 layers)
• Slotted masses
• Cutting collar, steel, which can fit flysh with the mould both inside and outside
• Penetration piston, 50mm diameter, 100mm long.
• Loading Device, capacity 50kN, equipped with a movable head at a uniform rate
of 1.25mm per minute.
• Two dial gauges, accuracy 0.01mm.
• IS Sieves, 4.75mm and 20mm size.
18
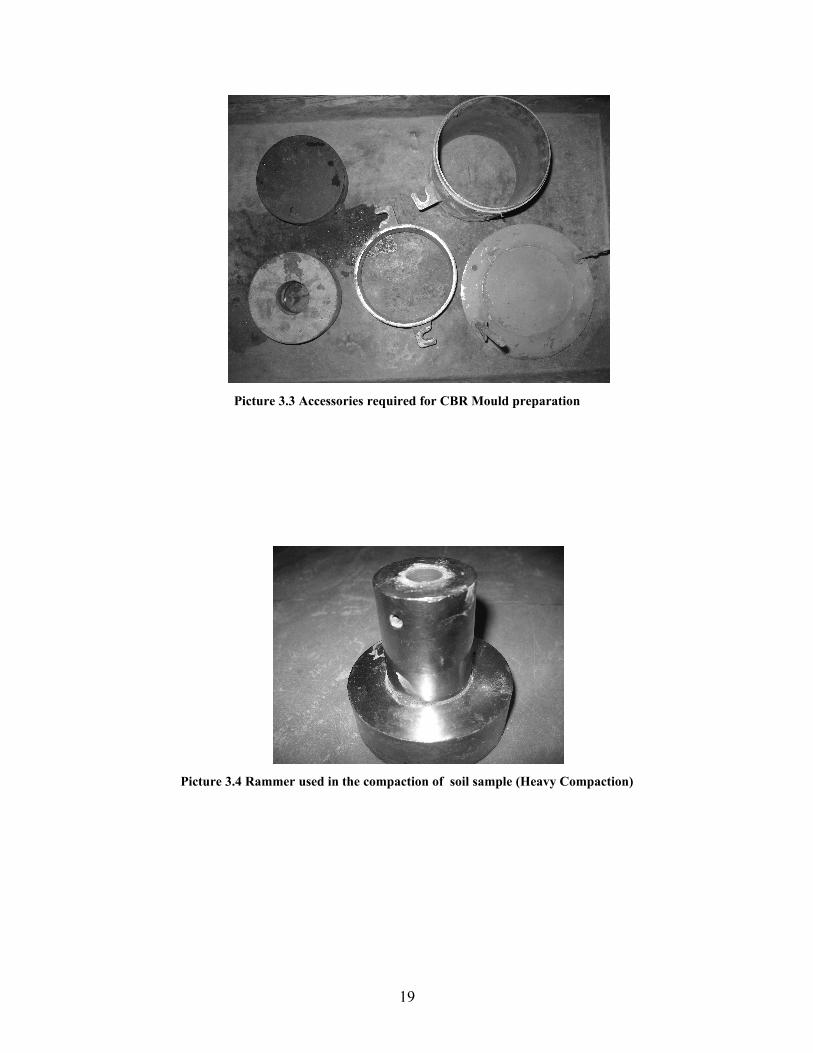
Picture 3.3 Accessories required for CBR Mould preparation
Picture 3.4 Rammer used in the compaction of soil sample (Heavy Compaction)
19
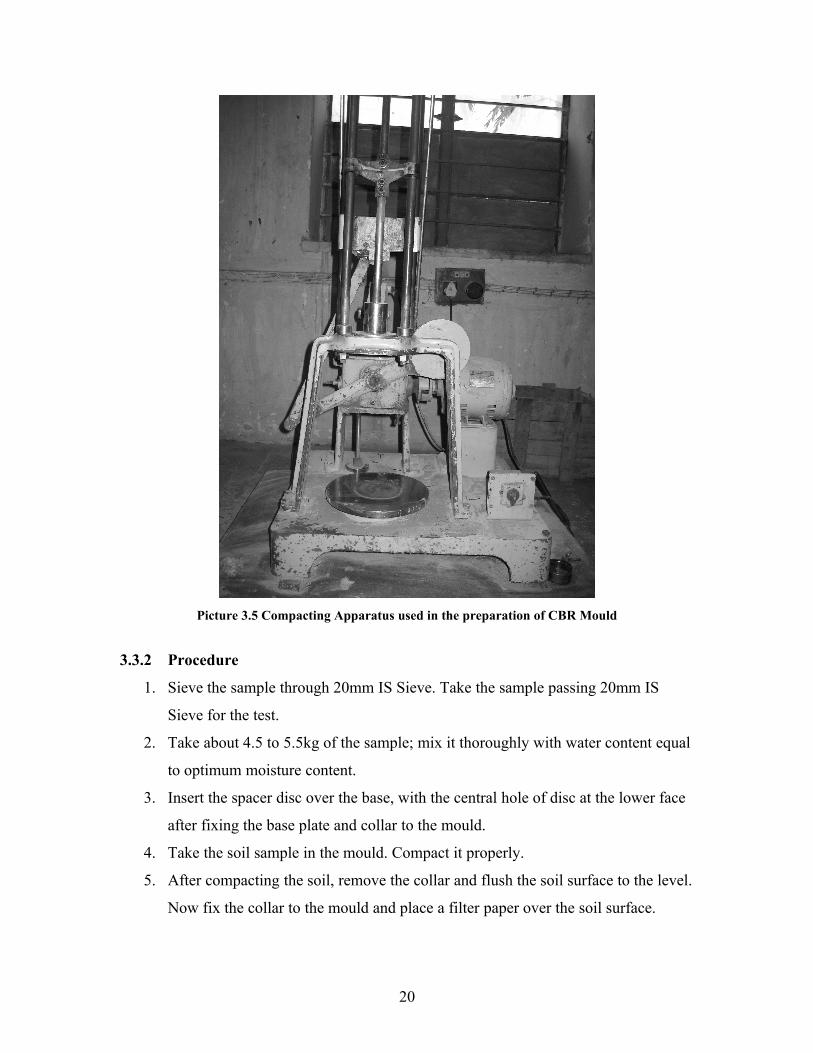
Picture 3.5 Compacting Apparatus used in the preparation of CBR Mould
3.3.2 Procedure
1. Sieve the sample through 20mm IS Sieve. Take the sample passing 20mm IS
Sieve for the test.
2. Take about 4.5 to 5.5kg of the sample; mix it thoroughly with water content equal
to optimum moisture content.
3. Insert the spacer disc over the base, with the central hole of disc at the lower face
after fixing the base plate and collar to the mould.
4. Take the soil sample in the mould. Compact it properly.
5. After compacting the soil, remove the collar and flush the soil surface to the level.
Now fix the collar to the mould and place a filter paper over the soil surface.
20
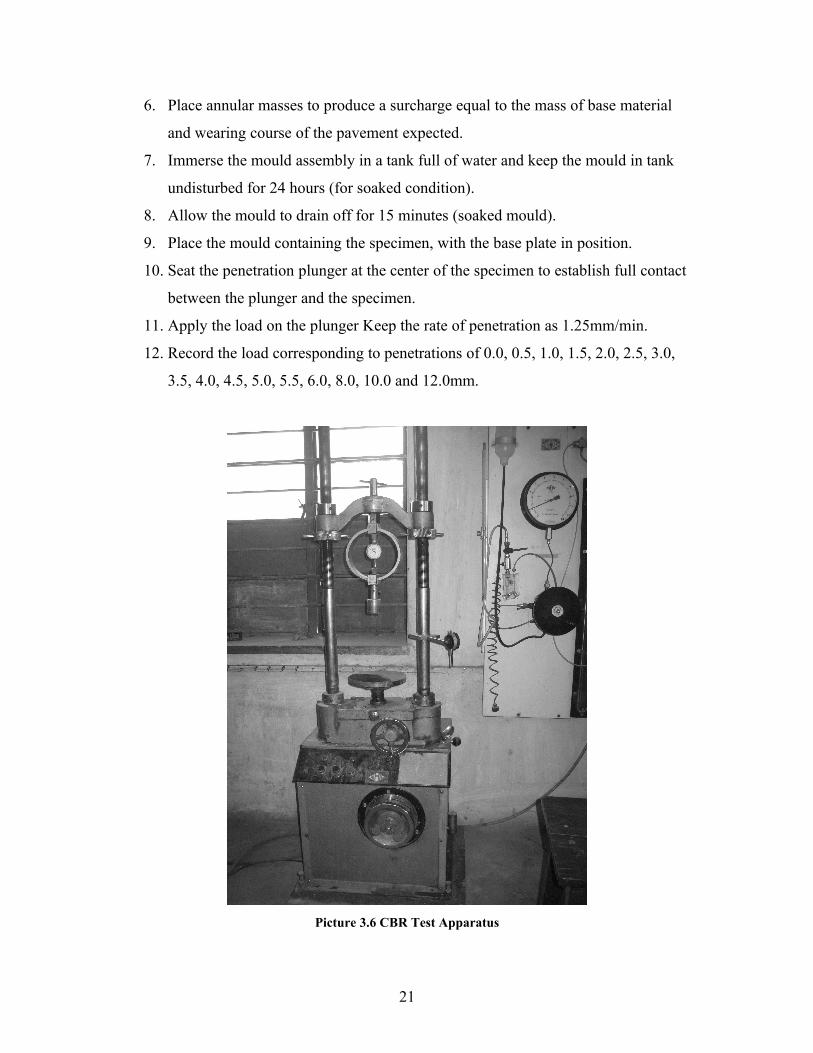
6. Place annular masses to produce a surcharge equal to the mass of base material
and wearing course of the pavement expected.
7. Immerse the mould assembly in a tank full of water and keep the mould in tank
undisturbed for 24 hours (for soaked condition).
8. Allow the mould to drain off for 15 minutes (soaked mould).
9. Place the mould containing the specimen, with the base plate in position.
10. Seat the penetration plunger at the center of the specimen to establish full contact
between the plunger and the specimen.
11. Apply the load on the plunger Keep the rate of penetration as 1.25mm/min.
12. Record the load corresponding to penetrations of 0.0, 0.5, 1.0, 1.5, 2.0, 2.5, 3.0,
3.5, 4.0, 4.5, 5.0, 5.5, 6.0, 8.0, 10.0 and 12.0mm.
Picture 3.6 CBR Test Apparatus
21
3.3.3 Calculations
Load (or pressure) sustained by the specimenat 2.5 or 5.0mm penetration
CBR% = *100
Load (or pressure) sustained by standard aggregateat corresponding penetration level
3.3.4 Standard values
The standard load values are obtained from the average of a large number of tests on
crushed stones.
Table 3.3 Standard load values for CBR test
Penetration(mm) Load(kg) Pressure(kg/cm2)
2.5
5.0
1370
2055
70
105
3.3.5 Reporting CBR Value
Normally CBR value at 2.5mm penetration which is higher than that at 5.0mm is reported
as the CBR value of the material. If the CBR value obtained from the test at 5.0mm
penetration is higher than that at 2.5mm, then the test is to be repeated for checking, if the
test again gives similar results, the higher value is reported as the CBR value.
The average CBR value of three test specimens is reported to the first decimal, as the
CBR value of the material. If the variation in CBR value between he three specimens is
more than the prescribed limits, tests should be repeated on additional three samples and
the average CBR value of six specimens is accepted.
22
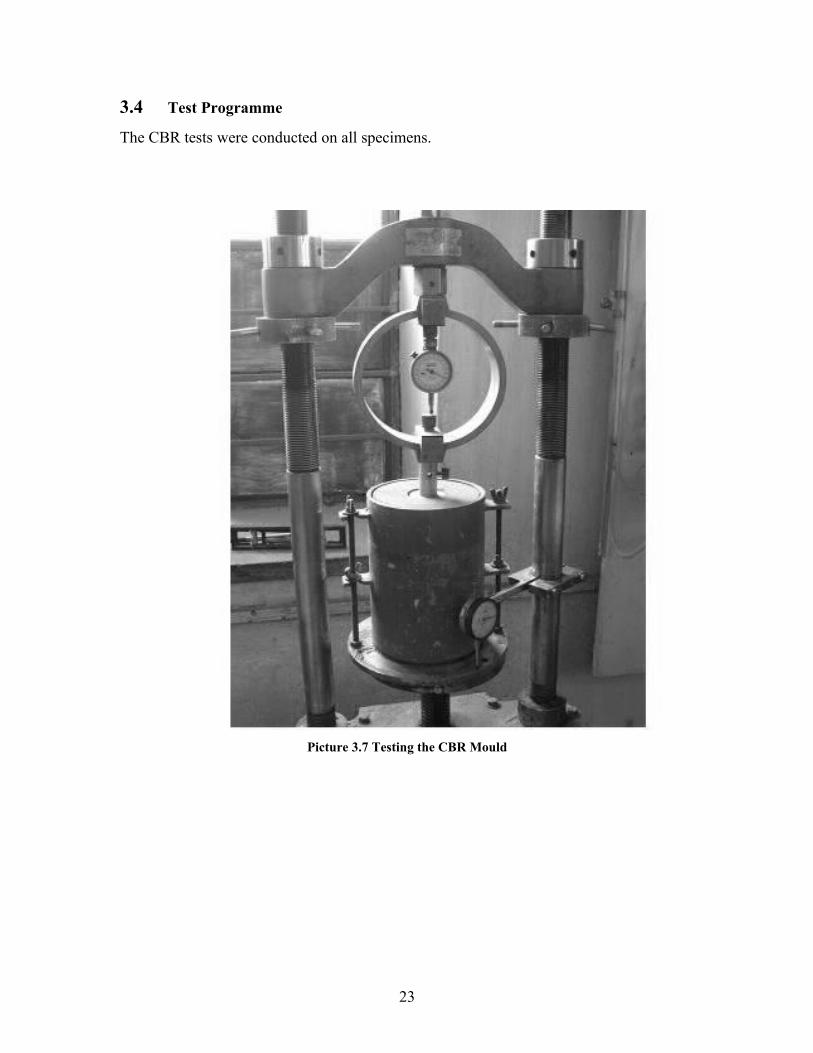
3.4 Test Programme
The CBR tests were conducted on all specimens.
Picture 3.7 Testing the CBR Mould
23
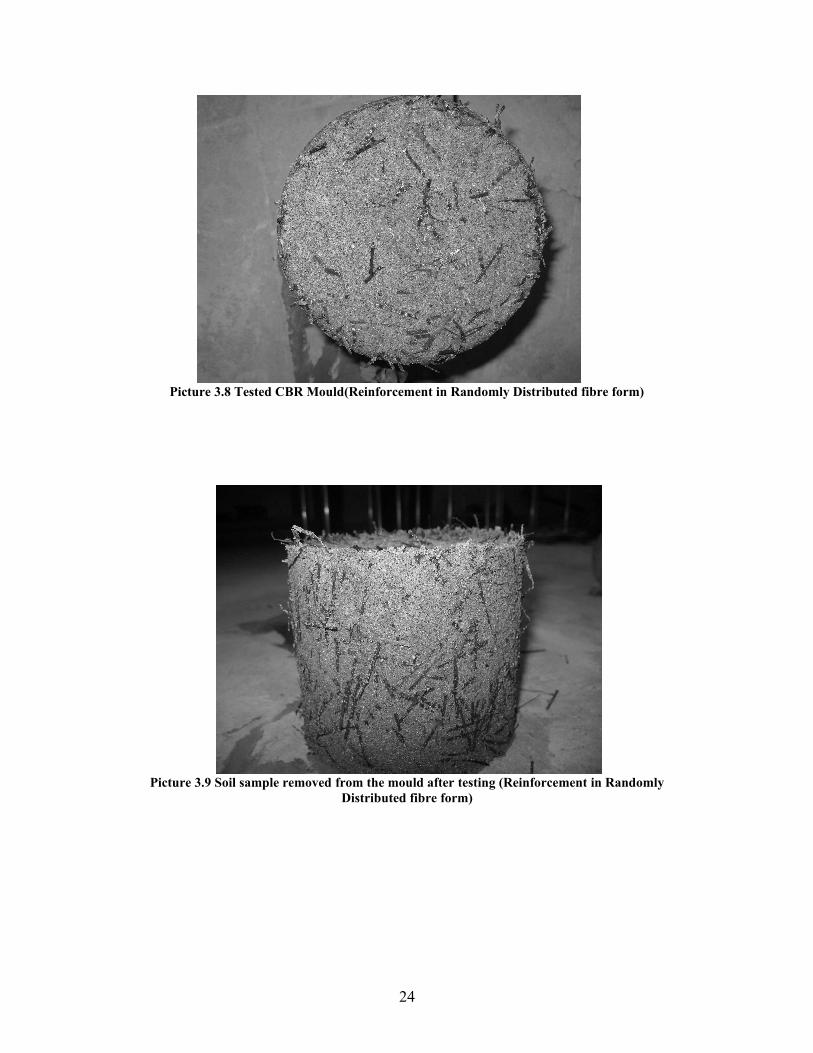
Picture 3.8 Tested CBR Mould(Reinforcement in Randomly Distributed fibre form)
Picture 3.9 Soil sample removed from the mould after testing (Reinforcement in Randomly
Distributed fibre form)
24
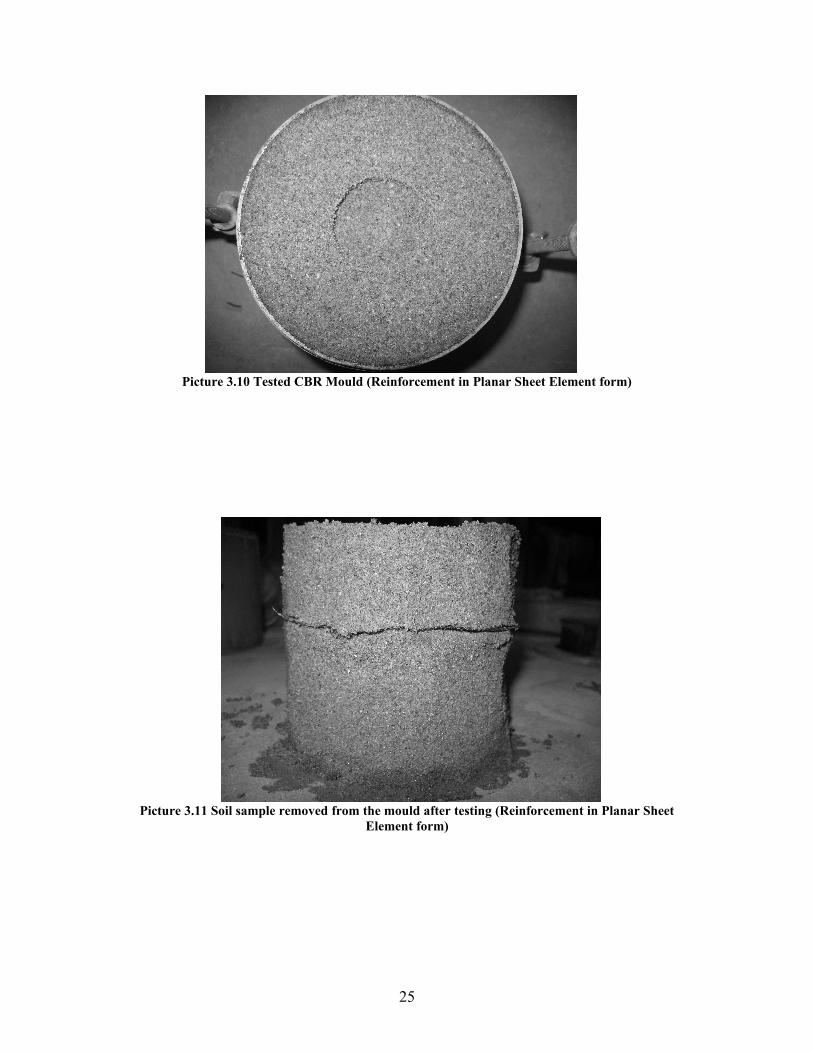
Picture 3.10 Tested CBR Mould (Reinforcement in Planar Sheet Element form)
Picture 3.11 Soil sample removed from the mould after testing (Reinforcement in Planar Sheet
Element form)
25
CHAPTER-4RESULTS AND DISCUSSION
This chapter presents results of the experimental work carried out and discusses the same in detail.
Table 4.1 CBR Values of unreinforced soil
Condition of the soil Un-soaked SoakedCBR Value 28.00 23.70
Table 4.2 CBR Values of reinforced soil (Fiber in planar element form)
D/B Ratio CBR ValueUn-soaked Soaked
0.25 46.70 39.900.50 41.60 39.101.00 38.90 35.501.50 34.00 32.10
Table 4.3 CBR Values of reinforced soil (Fiber in randomly distributed form)
Aspect Ratio % Substitution CBR ValueUn-soaked Soaked
5 0.25 32.4 30.61.00 35.0 32.11.50 35.5 31.12.00 30.2 28.8
10 0.25 44.0 40.91.00 43.8 40.41.50 47.4 44.52.00 41.7 39.3
15 0.25 31.9 36.51.00 37.5 43.81.50 41.6 40.12.00 29.5 27.9
26
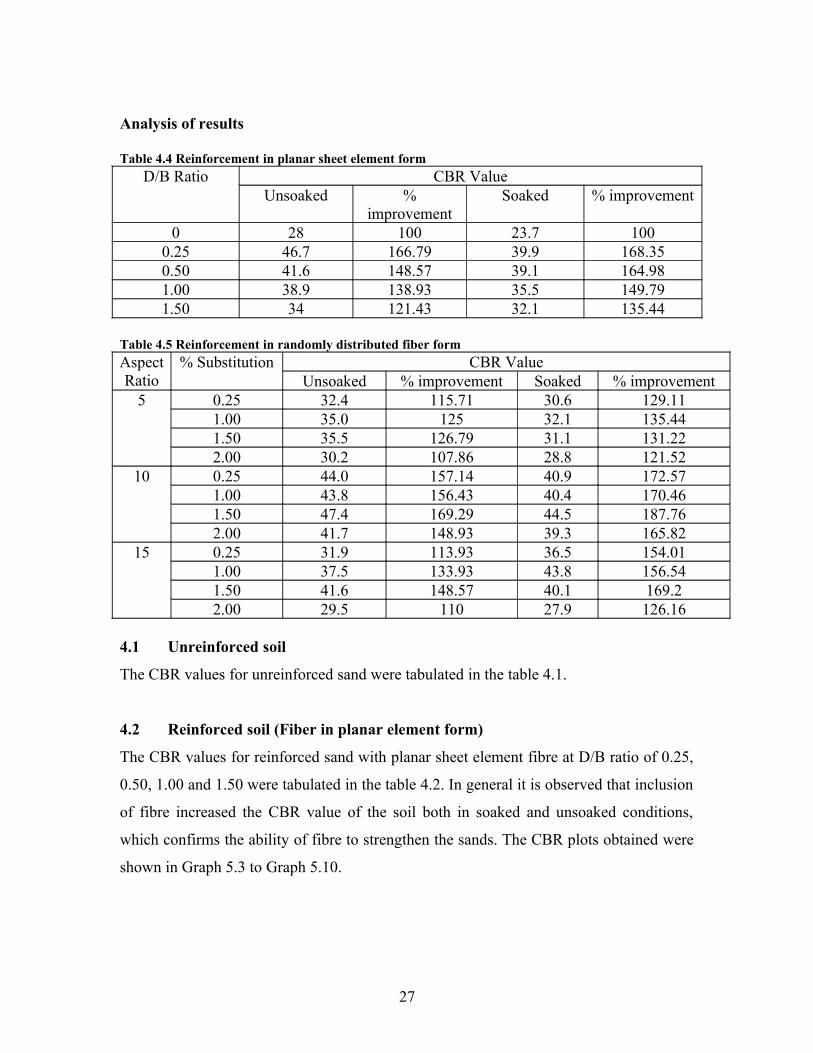
Analysis of results
Table 4.4 Reinforcement in planar sheet element form
D/B Ratio CBR ValueUnsoaked %
improvementSoaked % improvement
0 28 100 23.7 1000.25 46.7 166.79 39.9 168.350.50 41.6 148.57 39.1 164.981.00 38.9 138.93 35.5 149.791.50 34 121.43 32.1 135.44
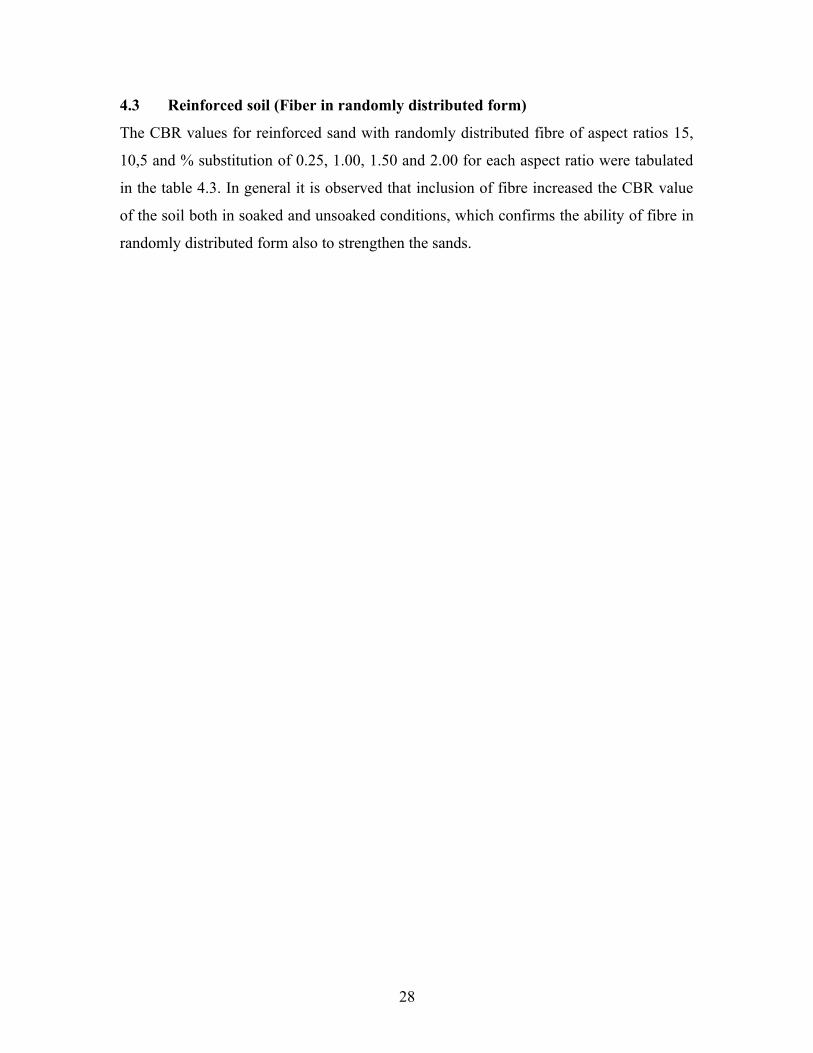
Table 4.5 Reinforcement in randomly distributed fiber form
Aspect Ratio
% Substitution CBR ValueUnsoaked % improvement Soaked % improvement
5 0.25 32.4 115.71 30.6 129.111.00 35.0 125 32.1 135.441.50 35.5 126.79 31.1 131.222.00 30.2 107.86 28.8 121.52
10 0.25 44.0 157.14 40.9 172.571.00 43.8 156.43 40.4 170.461.50 47.4 169.29 44.5 187.762.00 41.7 148.93 39.3 165.82
15 0.25 31.9 113.93 36.5 154.011.00 37.5 133.93 43.8 156.541.50 41.6 148.57 40.1 169.22.00 29.5 110 27.9 126.16
4.1 Unreinforced soil
The CBR values for unreinforced sand were tabulated in the table 4.1.
4.2 Reinforced soil (Fiber in planar element form)
The CBR values for reinforced sand with planar sheet element fibre at D/B ratio of 0.25,
0.50, 1.00 and 1.50 were tabulated in the table 4.2. In general it is observed that inclusion
of fibre increased the CBR value of the soil both in soaked and unsoaked conditions,
which confirms the ability of fibre to strengthen the sands. The CBR plots obtained were
shown in Graph 5.3 to Graph 5.10.
27
4.3 Reinforced soil (Fiber in randomly distributed form)
The CBR values for reinforced sand with randomly distributed fibre of aspect ratios 15,
10,5 and % substitution of 0.25, 1.00, 1.50 and 2.00 for each aspect ratio were tabulated
in the table 4.3. In general it is observed that inclusion of fibre increased the CBR value
of the soil both in soaked and unsoaked conditions, which confirms the ability of fibre in
randomly distributed form also to strengthen the sands.
28
CHAPTER-5OBSERVATIONS AND CONCLUTIONS
Based on the results obtained in this work, the following important observations are
made.
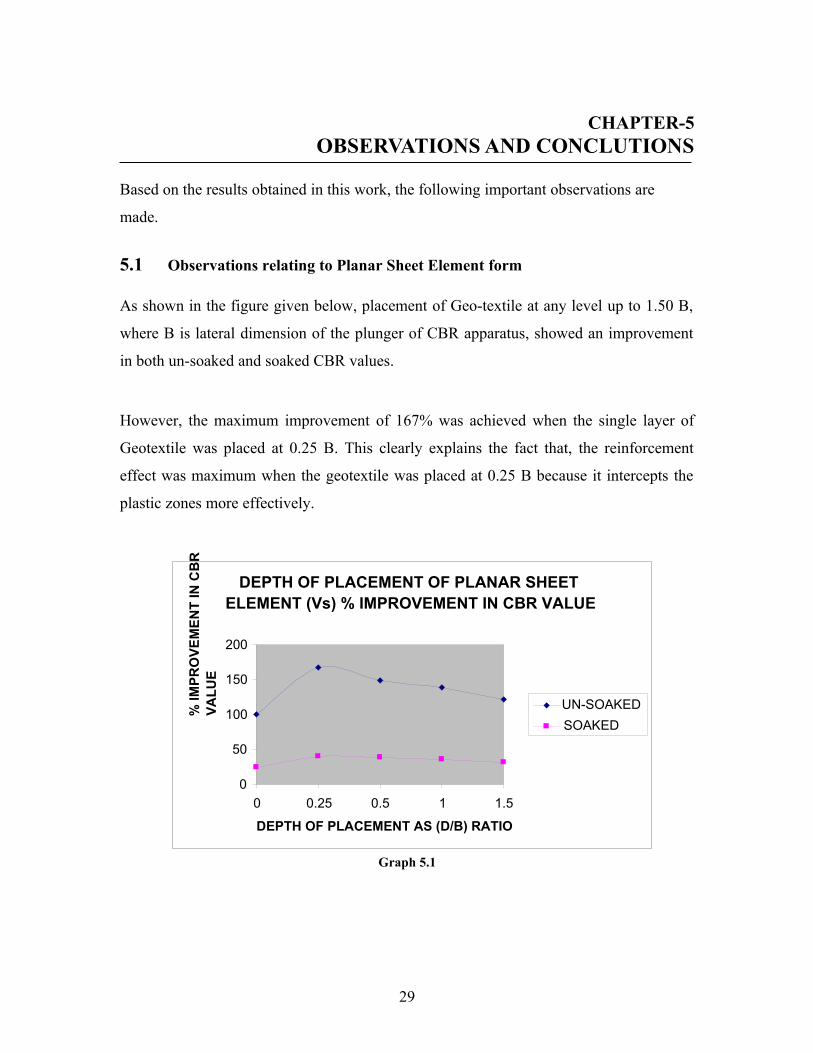
5.1 Observations relating to Planar Sheet Element form
As shown in the figure given below, placement of Geo-textile at any level up to 1.50 B,
where B is lateral dimension of the plunger of CBR apparatus, showed an improvement
in both un-soaked and soaked CBR values.
However, the maximum improvement of 167% was achieved when the single layer of
Geotextile was placed at 0.25 B. This clearly explains the fact that, the reinforcement
effect was maximum when the geotextile was placed at 0.25 B because it intercepts the
plastic zones more effectively.
Graph 5.1
DEPTH OF PLACEMENT OF PLANAR SHEET ELEMENT (Vs) % IMPROVEMENT IN CBR VALUE
0
50
100
150
200
0 0.25 0.5 1 1.5
DEPTH OF PLACEMENT AS (D/B) RATIO
% IM
PR
OV
EM
EN
T IN
CB
R
VA
LU
E
UN-SOAKED
SOAKED
29
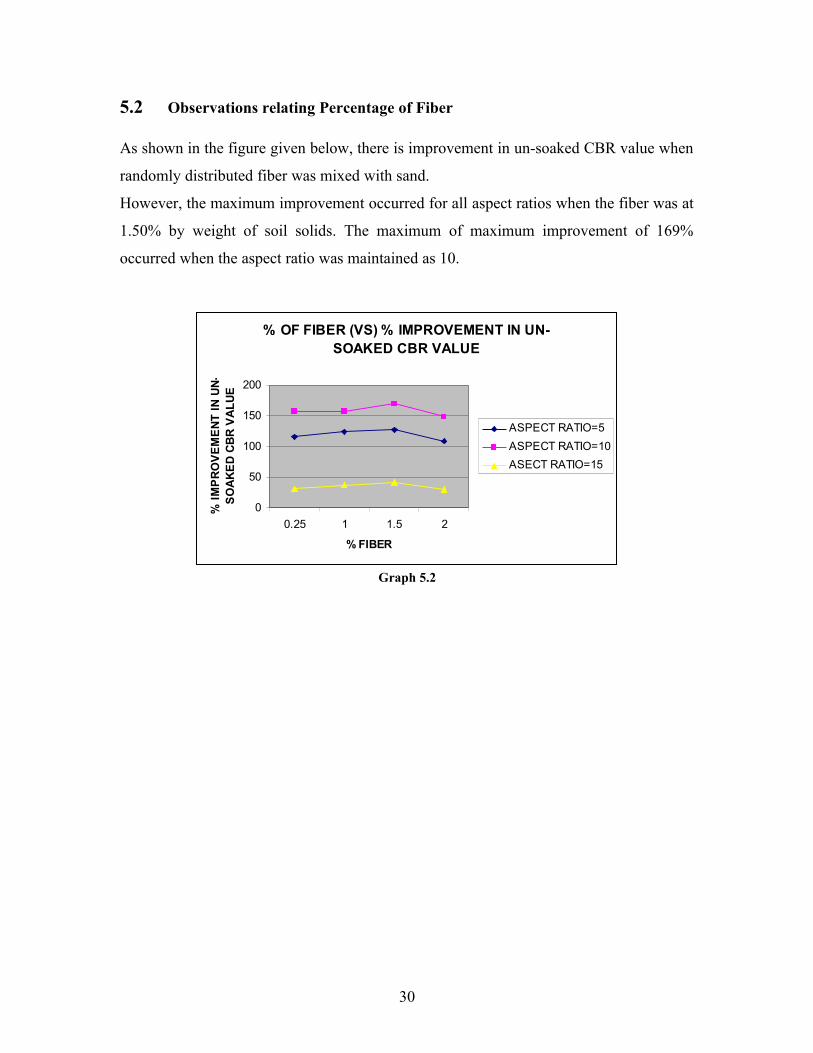
5.2 Observations relating Percentage of Fiber
As shown in the figure given below, there is improvement in un-soaked CBR value when
randomly distributed fiber was mixed with sand.
However, the maximum improvement occurred for all aspect ratios when the fiber was at
1.50% by weight of soil solids. The maximum of maximum improvement of 169%
occurred when the aspect ratio was maintained as 10.
% OF FIBER (VS) % IMPROVEMENT IN UN-SOAKED CBR VALUE
0
50
100
150
200
0.25 1 1.5 2
% FIBER
% I
MP
RO
VE
ME
NT
IN
UN
-S
OA
KE
D C
BR
VA
LU
E
ASPECT RATIO=5
ASPECT RATIO=10
ASECT RATIO=15
Graph 5.2
30
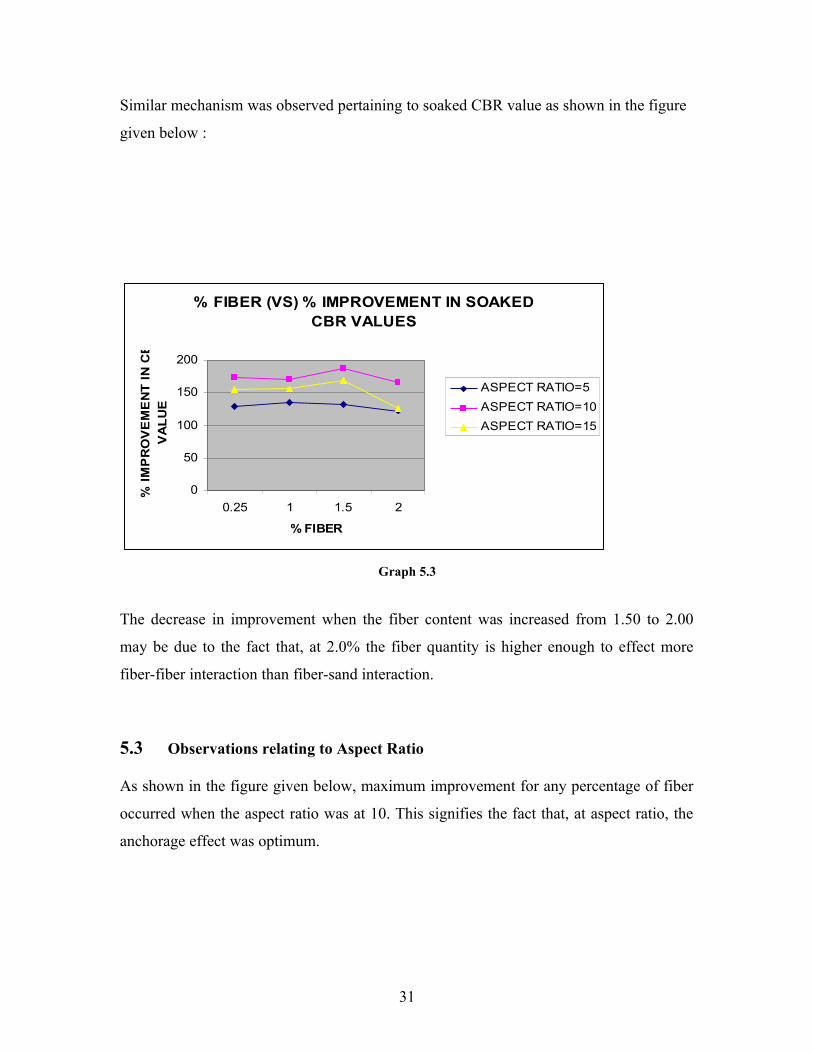
Similar mechanism was observed pertaining to soaked CBR value as shown in the figure
given below :
% FIBER (VS) % IMPROVEMENT IN SOAKED CBR VALUES
0
50
100
150
200
0.25 1 1.5 2
% FIBER
% I
MP
RO
VE
ME
NT
IN
CB
R
VA
LU
E
ASPECT RATIO=5
ASPECT RATIO=10
ASPECT RATIO=15
Graph 5.3
The decrease in improvement when the fiber content was increased from 1.50 to 2.00
may be due to the fact that, at 2.0% the fiber quantity is higher enough to effect more
fiber-fiber interaction than fiber-sand interaction.
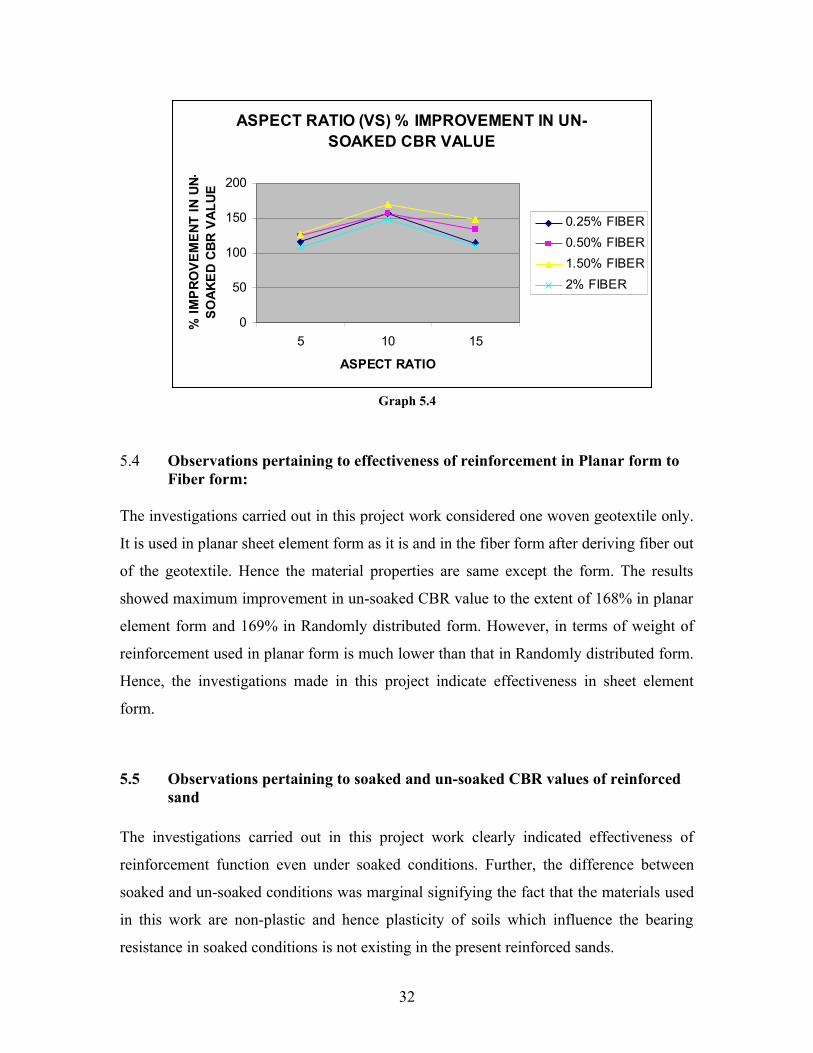
5.3 Observations relating to Aspect Ratio
As shown in the figure given below, maximum improvement for any percentage of fiber
occurred when the aspect ratio was at 10. This signifies the fact that, at aspect ratio, the
anchorage effect was optimum.
31
ASPECT RATIO (VS) % IMPROVEMENT IN UN-SOAKED CBR VALUE
0
50
100
150
200
5 10 15
ASPECT RATIO
% I
MP
RO
VE
ME
NT
IN
UN
-S
OA
KE
D C
BR
VA
LU
E0.25% FIBER
0.50% FIBER
1.50% FIBER
2% FIBER
Graph 5.4
5.4 Observations pertaining to effectiveness of reinforcement in Planar form to Fiber form:
The investigations carried out in this project work considered one woven geotextile only.
It is used in planar sheet element form as it is and in the fiber form after deriving fiber out
of the geotextile. Hence the material properties are same except the form. The results
showed maximum improvement in un-soaked CBR value to the extent of 168% in planar
element form and 169% in Randomly distributed form. However, in terms of weight of
reinforcement used in planar form is much lower than that in Randomly distributed form.
Hence, the investigations made in this project indicate effectiveness in sheet element
form.
5.5 Observations pertaining to soaked and un-soaked CBR values of reinforced sand
The investigations carried out in this project work clearly indicated effectiveness of
reinforcement function even under soaked conditions. Further, the difference between
soaked and un-soaked conditions was marginal signifying the fact that the materials used
in this work are non-plastic and hence plasticity of soils which influence the bearing
resistance in soaked conditions is not existing in the present reinforced sands.
32
5.6 Conclusions
Based on the investigations carried out in this project work the following conclusions are
made:
1 The CBR value can be improved by reinforcing the material.
2 The improvement in CBR value was observed when reinforcement
material was used in planar sheet element form as well as in randomly
distributed form.
3 The maximum improvement in un-soaked CBR value was 168% in planar
sheet element form when placed at a depth equal to 0.25 times size of the
plunger and 169% in randomly distributed form with an aspect ratio of 10
and at a fiber content of 1.50%.
4 The investigations showed that, reinforcement in sheet element form is
more economical and effective.
5 The investigations showed that, reinforcement effect is present even under
soaked conditions.
6 The investigations showed that when the materials are non-plastic, there
will not be serious drop in CBR value under soaked conditions.
33
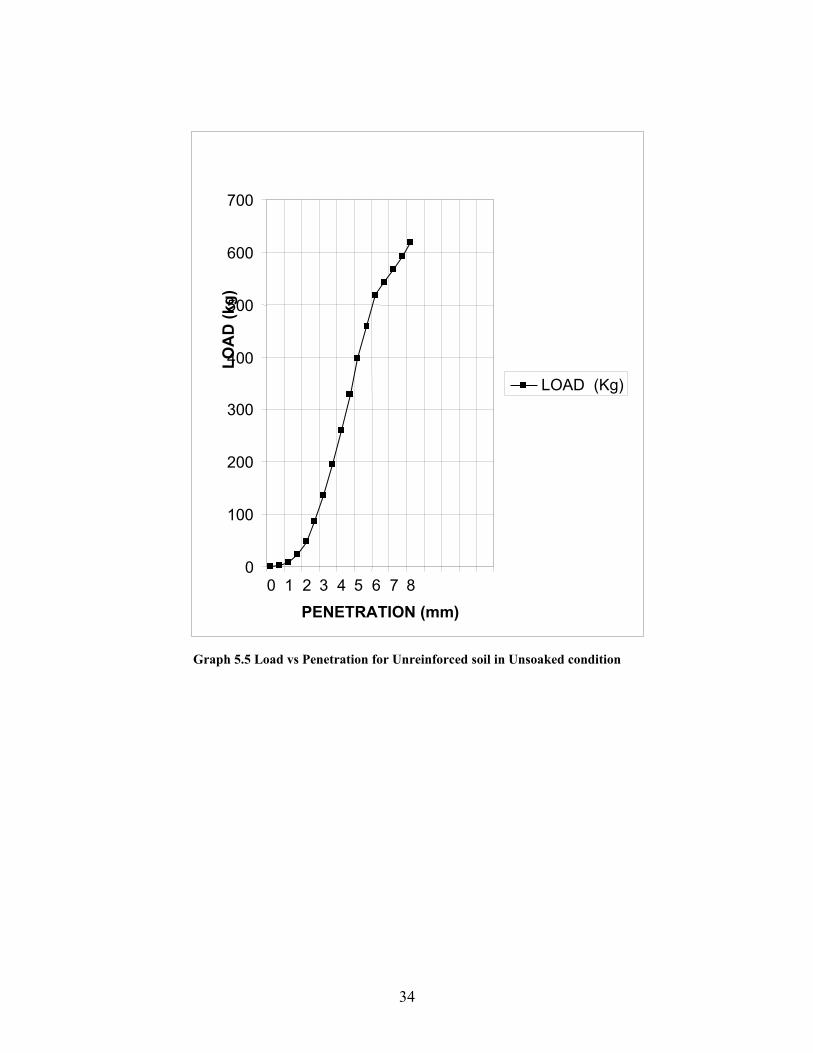
Graph 5.5 Load vs Penetration for Unreinforced soil in Unsoaked condition
0
100
200
300
400
500
600
700
0 1 2 3 4 5 6 7 8
PENETRATION (mm)
LO
AD
(kg
)
LOAD (Kg)
34
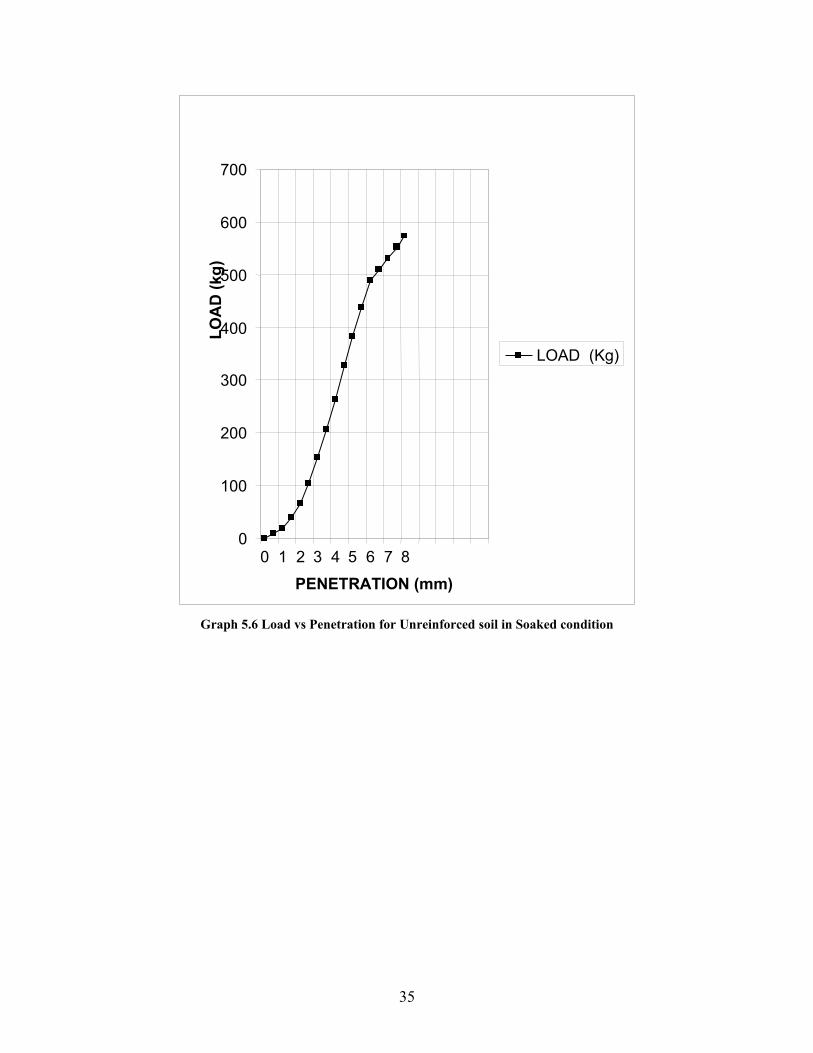
Graph 5.6 Load vs Penetration for Unreinforced soil in Soaked condition
0
100
200
300
400
500
600
700
0 1 2 3 4 5 6 7 8
PENETRATION (mm)
LO
AD
(kg
)
LOAD (Kg)
35
REFERENCES
1. Al-Refeai, T. and Al-Suhaibani, A., 1998, Dynamic and Static Characterization of
polypropylene fibre-reinforced dune sand, Geosynthetics International, vol., 5, 443-
456.
2. Banerjee, P.K., R. Chattopadhyay, and A. Guha (2002) Investigations into
homogeneity of coir fibres, Indian journal of fibre and textile research, vol. 27.
3. Gray D. H and Al-Refeai (1986), Behaviour of fabric versus fibre reinforced sand,
Journal of Geotechnical Engineering, vol 112.
4. Radoslaw L.Michalowski and Aigen Zhao, Failure of fibre-reinforced granular soils,
Journal of Geotechnical Engineering, 1996, vol.122, 226-232.
5. Shashi K Gulhati and Manoj Datta, (2005), Geotechnical Engineering, Tata McGraw-
Hill publishing company Ltd. (565-568).
6. Scott, “Effect of material properties on compactability and bearing capacity”,
Transportation Engineering Journal, No.4, Vol 120, pp. 570-587.
7. Yong.R.N and B.P.Winterkorn, “Soil Properties and Behaviour”, Elsevier Scientific
Publishing Ci., Amster Dam, 1975.
8. Arora.K.R, “Soil Mechanics and Foundation Engineering”, 1980, pp.357-375, 773-778.
9. Khanna.S.K. and C.E.G.Justo, “Highway Engineering”, Nem Chand & Bros, Roorkee,
1984.
10. IRC: 37, “Guidelines for the Design of Flexible Pavements”, IRC, 1970
36


![content.alfred.com · B 4fr C#m 4fr G#m 4fr E 6fr D#sus4 6fr D# q = 121 Synth. Bass arr. for Guitar [B] 2 2 2 2 2 2 2 2 2 2 2 2 2 2 2 2 2 2 2 2 2 2 2 2 2 2 2 2 2 2 2 2 5](https://img.pdfslide.net/doc/110x75/5e81a9850b29a074de117025/b-4fr-cm-4fr-gm-4fr-e-6fr-dsus4-6fr-d-q-121-synth-bass-arr-for-guitar-b.jpg)