Embed Size (px)
Citation preview
131
2.6 Non-Estuarine Wetlands
2.6.1 Non-Estuarine Wetlands Target Definition
This target is intended to reflect the palustrine (wetlands containing emergent vegetation,
i.e., not open water) systems of the watershed, with the exception of the Salmon River
estuary, which was treated separately (Section 2.2) because of its transitional role
between the Salmon River and Lake Ontario, and its linkage to larger dune/wetland
complexes along the lake’s eastern shore. Palustrine wetlands are those that are
permanently saturated by seepage; permanently flooded; or are seasonally or
intermittently flooded if the vegetative cover is dominated by species that are tolerant of
saturated soils (hydrophytes), the soils display physical and chemical features of being
saturated, and a hydrologic regime exists that leads to seasonally flooded or saturated
conditions (Cowardin et al. 1979).
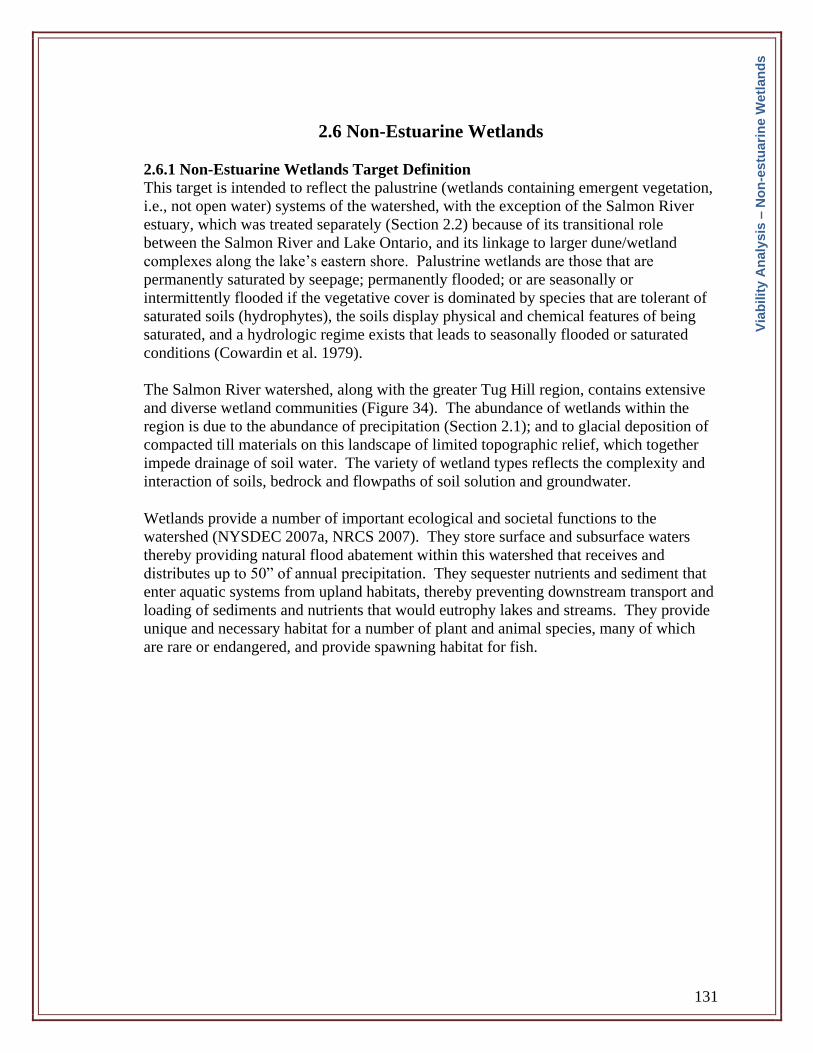
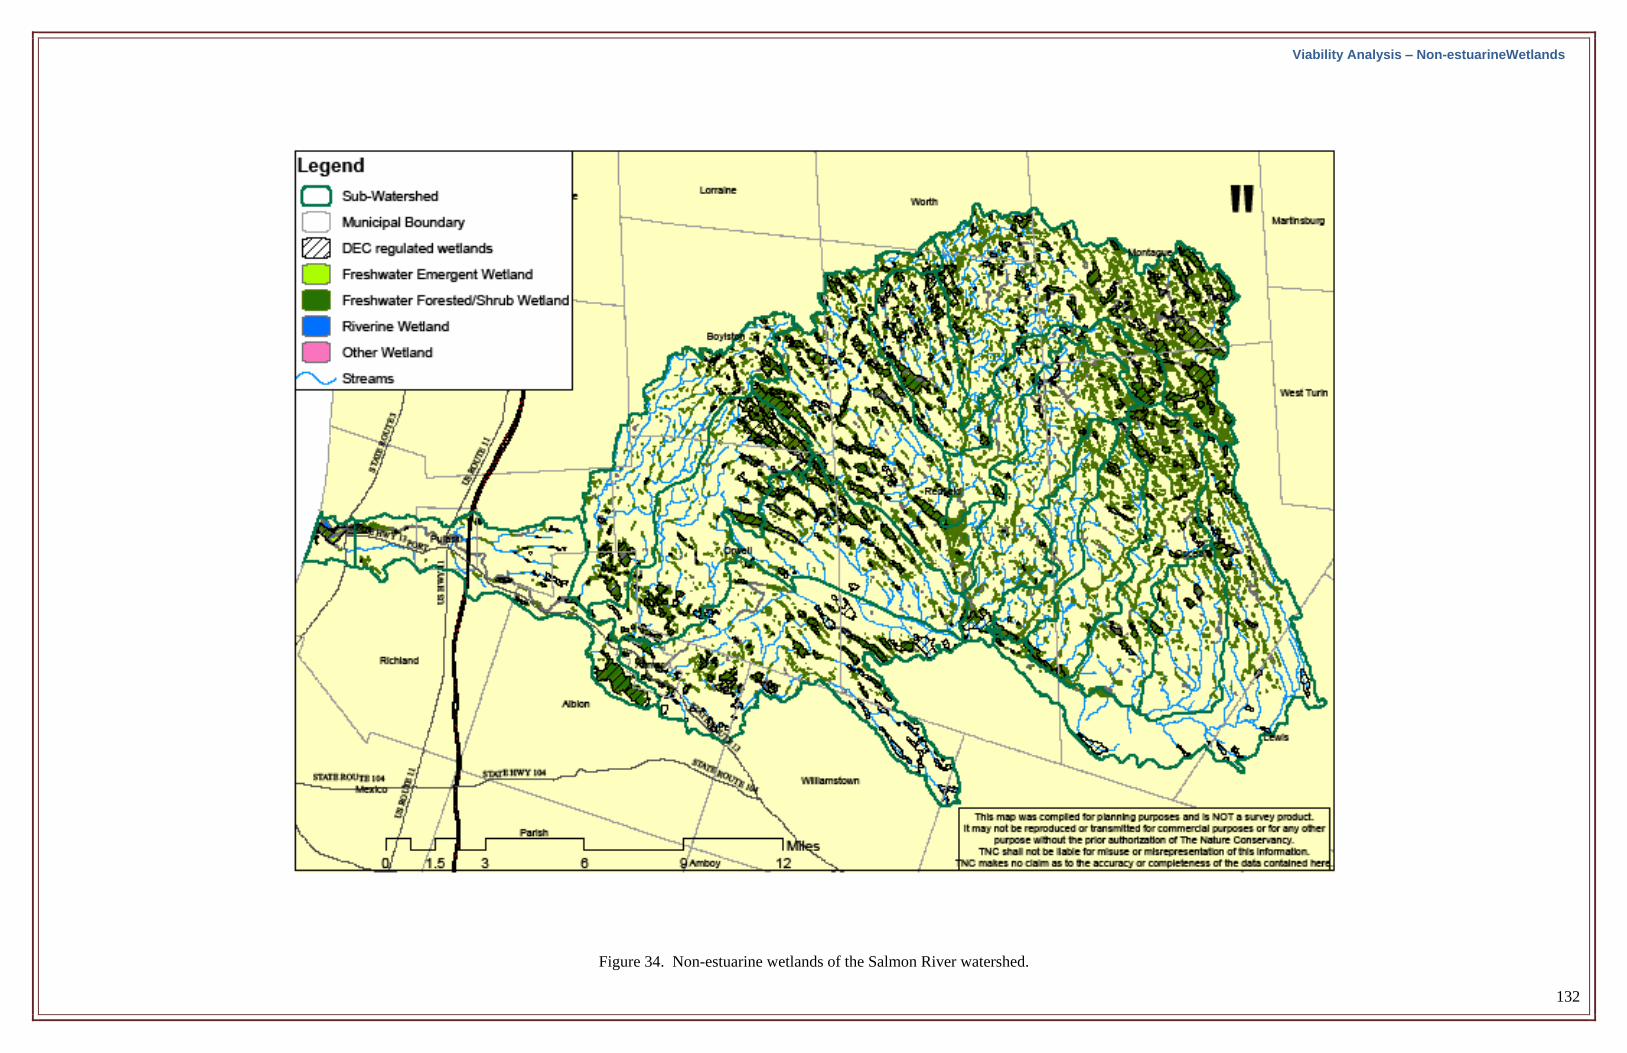
The Salmon River watershed, along with the greater Tug Hill region, contains extensive
and diverse wetland communities (Figure 34). The abundance of wetlands within the
region is due to the abundance of precipitation (Section 2.1); and to glacial deposition of
compacted till materials on this landscape of limited topographic relief, which together
impede drainage of soil water. The variety of wetland types reflects the complexity and
interaction of soils, bedrock and flowpaths of soil solution and groundwater.
Wetlands provide a number of important ecological and societal functions to the
watershed (NYSDEC 2007a, NRCS 2007). They store surface and subsurface waters
thereby providing natural flood abatement within this watershed that receives and
distributes up to 50” of annual precipitation. They sequester nutrients and sediment that
enter aquatic systems from upland habitats, thereby preventing downstream transport and
loading of sediments and nutrients that would eutrophy lakes and streams. They provide
unique and necessary habitat for a number of plant and animal species, many of which
are rare or endangered, and provide spawning habitat for fish.
Via
bilit
y A
naly
sis
– N
on
-es
tua
rin
e W
etl
an
ds
132
Figure 34. Non-estuarine wetlands of the Salmon River watershed.
Viability Analysis – Non-estuarineWetlands
133
2.6.2 Non-Estuarine Wetland Viability
2.6.2.1 KEA: SIZE – Wetland Area
The ability of wetland systems to provide ecosystem services is related to both the
absolute area of wetlands (i.e., habitat availability for unique communities and rare
species) and the proportion of land area occupied by wetlands (efficiency of nutrient
retention and hydrologic regulation in watershed).
Indicator – Total Surface Area of Wetlands (ac): This indictor provides an estimated
current baseline of wetland area for each of the sub-watersheds. There are no historic
estimates of wetland area for the watershed. Future levels of wetland area can be
assessed as deviations from existing levels. Potential sources of information to
quantify wetland conversion rates include NYSDEC and US Army Corps of
Engineers permitting programs, however, not all activities are permitted. Still, permit
records may provide insight to areas of the watershed where conversion pressures are
greatest. Another source of information would be photo interpretation of ASCS aerial
imagery, which is currently obtained on two-year increments.
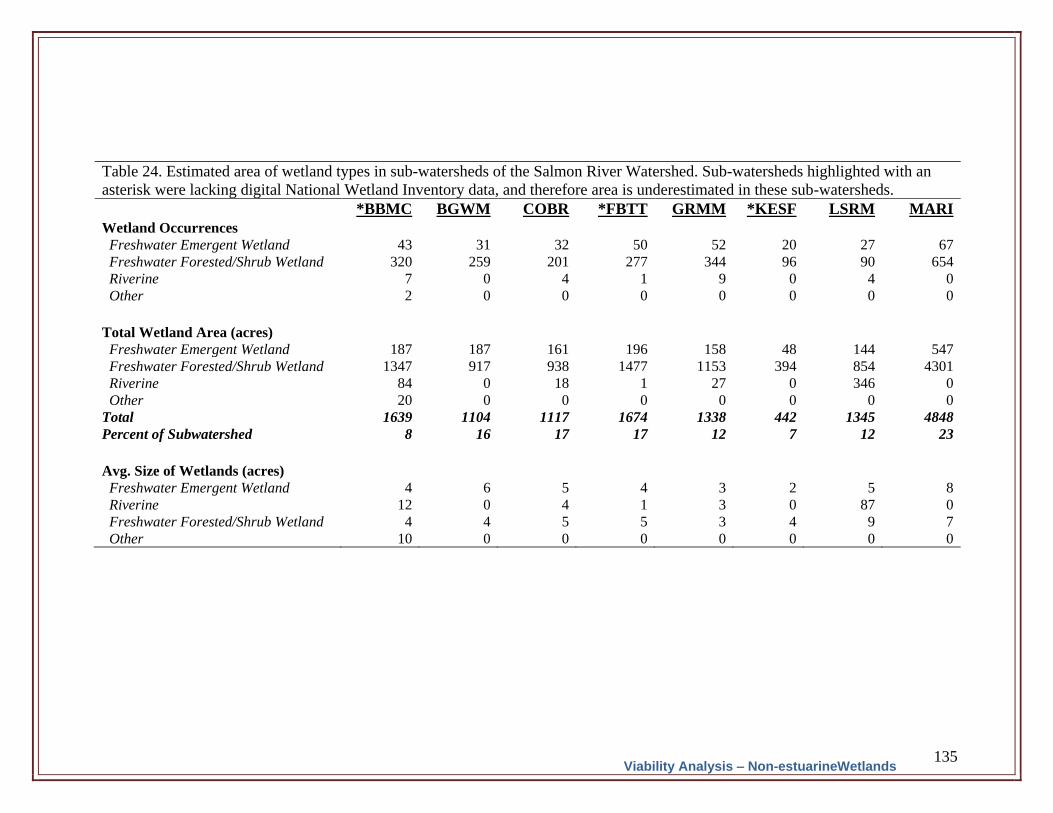
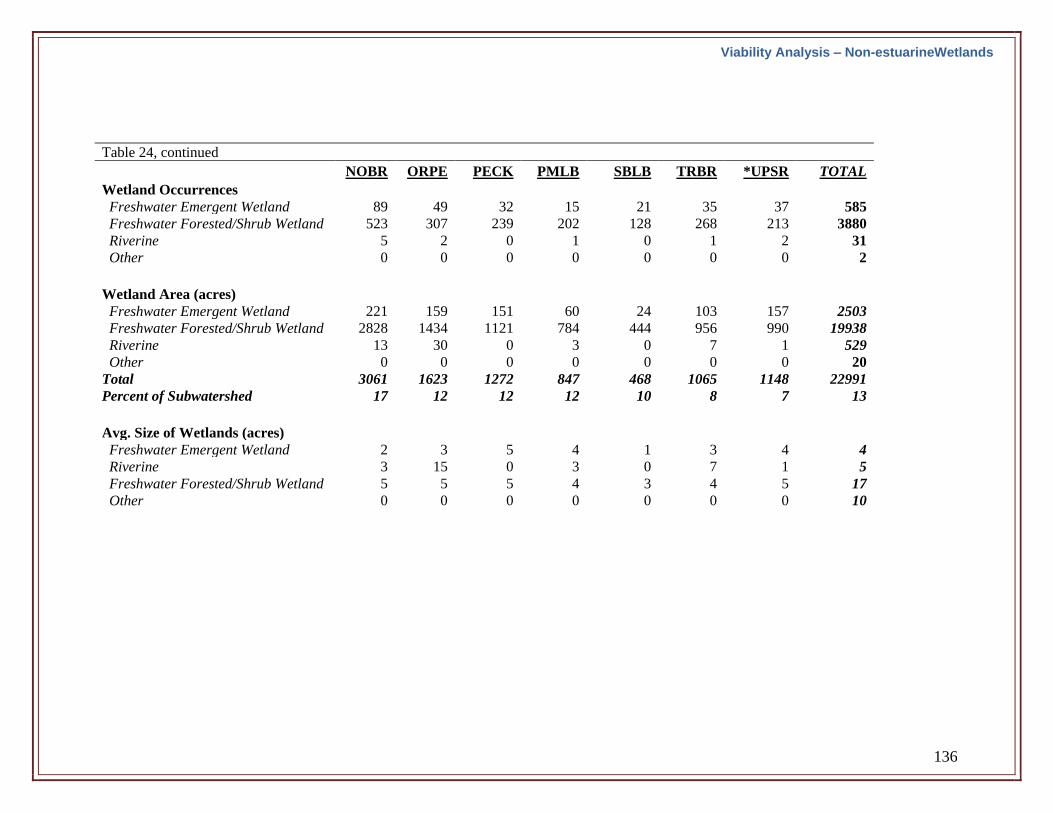
Current Condition - Unranked: Total palustrine (excluding lakes and ponds) wetland
area within the watershed is approximately 23,000 acres (Table 24). Note that the
data layers utilized in making this estimate include the NYSDEC Regulated
Wetlands, which only maps wetlands ≥12.4 acres, and the US Fish and Wildlife
Service National Wetlands Inventory (NWI), which is derived from air photo
analysis. Both data sources likely under-represent total wetland area because the
smallest wetland are not included or detected. A recent estimate suggests that
approximately 1/3 of New York’s fens remain unmapped due to their small size or
non-jurisdictional status (Bedford and Godwin 2003). It should also be noted that no
digital NWI data were available for portions of some sub-watersheds (see Table 24).
Therefore, reported areas are underestimated for these sub-watersheds.
Indicator – Percent of Total Land Area as Wetlands: There are no historic records of
wetland area or proportion of land base as wetland in the watershed and its respective
sub-watersheds. The following data are provided for comparisons among sub-
watersheds and for baseline information to facilitate future comparisons.
Current Condition – Good: The total 23,000 acres of wetland within the watershed
represents approximately 13% of the watershed’s land base. Forested and
scrub/shrub wetlands consistently are the most abundant wetland category in all sub-
watersheds. For those sub-watersheds with complete data, wetland coverage ranged
from 23% (Mad River drainage) to 8% (Trout Brook drainage). No baseline
information is available on preexisting wetland acreage and cover in the watershed. It
is possible that some wetlands were drained for agriculture in the lower sub-
watersheds and that those losses persist (e.g., in the Trout Brook sub-watershed,
which has 8% wetland area, and is among the most heavily farmed, see Figure 5). If
Via
bilit
y A
naly
sis
– N
on
-es
tua
rin
e W
etl
an
ds

134
wetlands were originally drained for agriculture in the upper sub-watersheds it is
likely that sufficient time has passed to permit wetland hydrology and vegetation in
impacted areas to return to natural conditions since the wide-scale abandonment of
agriculture around the turn of the 20th
century. Given the lack of development
pressures in the upper sub-watersheds, it is not believed that wetland losses to
development have been great there.
Via
bilit
y A
naly
sis
– N
on
-es
tua
rin
e W
etl
an
ds
135
Table 24. Estimated area of wetland types in sub-watersheds of the Salmon River Watershed. Sub-watersheds highlighted with an
asterisk were lacking digital National Wetland Inventory data, and therefore area is underestimated in these sub-watersheds.
*BBMC BGWM COBR *FBTT GRMM *KESF LSRM MARI
Wetland Occurrences Freshwater Emergent Wetland 43 31 32 50 52 20 27 67 Freshwater Forested/Shrub Wetland 320 259 201 277 344 96 90 654 Riverine 7 0 4 1 9 0 4 0 Other 2 0 0 0 0 0 0 0
Total Wetland Area (acres) Freshwater Emergent Wetland 187 187 161 196 158 48 144 547 Freshwater Forested/Shrub Wetland 1347 917 938 1477 1153 394 854 4301 Riverine 84 0 18 1 27 0 346 0 Other 20 0 0 0 0 0 0 0 Total 1639 1104 1117 1674 1338 442 1345 4848 Percent of Subwatershed 8 16 17 17 12 7 12 23
Avg. Size of Wetlands (acres) Freshwater Emergent Wetland 4 6 5 4 3 2 5 8 Riverine 12 0 4 1 3 0 87 0 Freshwater Forested/Shrub Wetland 4 4 5 5 3 4 9 7 Other 10 0 0 0 0 0 0 0
Viability Analysis – Non-estuarineWetlands
136
Table 24, continued
NOBR ORPE PECK PMLB SBLB TRBR *UPSR TOTAL
Wetland Occurrences Freshwater Emergent Wetland 89 49 32 15 21 35 37 585 Freshwater Forested/Shrub Wetland 523 307 239 202 128 268 213 3880 Riverine 5 2 0 1 0 1 2 31 Other 0 0 0 0 0 0 0 2
Wetland Area (acres) Freshwater Emergent Wetland 221 159 151 60 24 103 157 2503 Freshwater Forested/Shrub Wetland 2828 1434 1121 784 444 956 990 19938 Riverine 13 30 0 3 0 7 1 529 Other 0 0 0 0 0 0 0 20 Total 3061 1623 1272 847 468 1065 1148 22991 Percent of Subwatershed 17 12 12 12 10 8 7 13
Avg. Size of Wetlands (acres) Freshwater Emergent Wetland 2 3 5 4 1 3 4 4 Riverine 3 15 0 3 0 7 1 5 Freshwater Forested/Shrub Wetland 5 5 5 4 3 4 5 17 Other 0 0 0 0 0 0 0 10
Viability Analysis – Non-estuarineWetlands
137
2.6.2.2 KEA-CONDITION –Wetland community types
A number of wetland community types are known to occur within the Salmon River
watershed. Type descriptions are provided by Edinger et al. (2002), and detailed
descriptions of exemplary occurrences within the watershed are provided by Howard
(2006). Species composition has also been documented in several other area wetlands
(A. Nelson, in Dru Associates 2001). Generalized descriptions (taken from Edinger et al.
2002) of wetland community types occurring within the watershed are included in section
2.6.2.11. Wetland community types (and NY Natural Heritage Rankings) occurring in
the watershed are:
-Black spruce – tamarack bog (G4G5 S3)
-Floodplain forest (G3G4 S2S3)
-Hemlock-hardwood swamp (G4G5 S4)
-Red maple – hardwood swamp (G5 S4S5)
-Spruce-fir swamp (G3G4 S3)
-Vernal Pool (G4 S3S4)
-Dwarf Shrub Bog (G4 S3)
-Inland poor fen (G4 S3)
-Shrub swamp (G5 S5)
-Sedge meadow (G5 S4) -Shallow emergent marsh (G5 S5)
Indicator – Area (ac) of Wetland Community Types: Area of respective community
types is a direct measure of habitat availability and ecosystem functions.
Current Condition – Unranked: There is currently no accurate quantitative estimation
for the amount of different wetland community types, or for the historic abundance of
these community types in the watershed. Recent efforts have been made to apply GIS
models to predict the occurrence of these communities, but several local wetland
scientists concluded that the accuracy of these predictive models currently suffers
from a lack of data.
2.6.2.3 KEA – CONDITION – Invasive Species
Indicator – Frequency of Invasive Plant Occurrence in Wetlands: Table 4 presents the
criteria used to rank community viability in relation to occurrence and/or dominance
of invasive species.
Current Condition – Good: There are currently no monitoring efforts for invasive
plant species in the watershed, so no quantitative data are available with which to
rank this indicator. However, several local wetland scientists agreed that there is a
remarkable lack of invasive plant species in the wetlands they have visited in the
watershed. Species such as purple loosestrife and Phragmites tend to occur at lower
elevations, and glossy buckthorn (Rhamnus frangula) has been observed in some
peatlands.
Via
bilit
y A
naly
sis
– N
on
-es
tua
rin
e W
etl
an
ds
138
2.6.2.4 KEA – CONDITION – Rare Species Populations
Several species of concern are known to inhabit wetland communities within the
watershed. Species reported by Howard (2006) include:
Jacob’s-ladder (Polemonium vanbruntiae) – G3G4 S3
Lesser bladderwort (Utricularia minor) – G5 S3
Pied-billed grebe (Podilymbus podiceps) – G5 S3B,S1N
Pitcher plant borer moth (Papaipema appassionata) – G4 SU
The following viability ratings are based upon NY Natural Heritage reports of known
occurrences within the watershed. Element distribution models for predicting additional
occurrences of these species have been developed but require verification.
Indicator – Jacob’s-ladder Population Density:
Current Condition – Excellent: The New York Natural Heritage program rated the
occurrence of this plant in the town of Montague as excellent (Howard 2006). This
report indicated thousands of plants in an 8-acre site.
Indicator – Lesser Bladderwort Population Density:
Current Condition – Fair: The New York Natural Heritage program rated the
occurrence of this plant in the town of Albion as fair (Howard 2006). This report
indicated a small colony in a 1-acre, undisturbed area.
Indicator – Pied-billed Grebe Occurrence:
Current Condition – Fair to Poor: The New York Natural Heritage (Howard 2006)
program reported the sighting in 2005 of one territorial male in a marsh in Orwell.
Indicator – Pitcher Plant Borer Moth Occurrence:
Current Condition – Excellent: The New York Natural Heritage program reported the
occurrence of 40 acres of required habitat at a bog in Albion (Howard 2006).
2.6.2.5 KEA – CONDITION – Pests and Pathogens
There are few pests and pathogens of concern currently influencing wetland community
composition in the watershed.
Indicator – Viburnum Leaf Beetle Occurrence: The viburnum leaf beetle (Pyrrhalta
viburni) is native to most areas of Europe and was first observed in Ontario in 1947
and in New York in 1996. Symptoms of infestation are skeletonized leaves in the
spring (May-June), heavily chewed leaves in the summer (July-September), and
terminal twigs with characteristic egg “caps” arranged in straight rows, seen
throughout the summer months. Host plants include many Viburnum species (e.g.,
arrow-wood, cranberry bush). For more information see:
http://www.ceris.purdue.edu/napis/pests/vlb/news/fs-vlb.html.
Via
bilit
y A
naly
sis
– N
on
-es
tua
rin
e W
etl
an
ds
139
Viability ranking for this indicator is provided in Table 4.
Current Condition - Poor: No quantitative data exist for viburnum beetle infestations
in the watershed, however local botanists have reported recent widespread defoliation
and mortality of arrow-wood throughout the Tug Hill region.
2.6.2.6 KEA- Condition - Sentinel Group Abundance (Migratory Birds,
Amphibians)
Certain groups, or guilds, of wildlife require wetlands for some aspects of their life
histories, and therefore the populations of these groups may serve as “sentinels” of
wetland viability in the watershed.
Indicator – Amphibian and Reptile Densities and/or Frequencies: There are no sources
of data specific to the watershed indicating expected abundance of amphibians and
reptiles in different wetland types. The only available information on amphibian
populations is derived from the New York Amphibian and Reptile Atlas database
(NYSDEC 2007). This database lists presence/absence of species throughout New
York on the scale of a USGS 7-1/2” quadrangle, and can be used to infer the
frequency of occurrence of certain species across the region relative to the whole of
New York. It should be noted that this approach, which is based on relative
frequencies in New York, is not sensitive to negative effects of global amphibian and
reptile declines that would influence populations across New York.
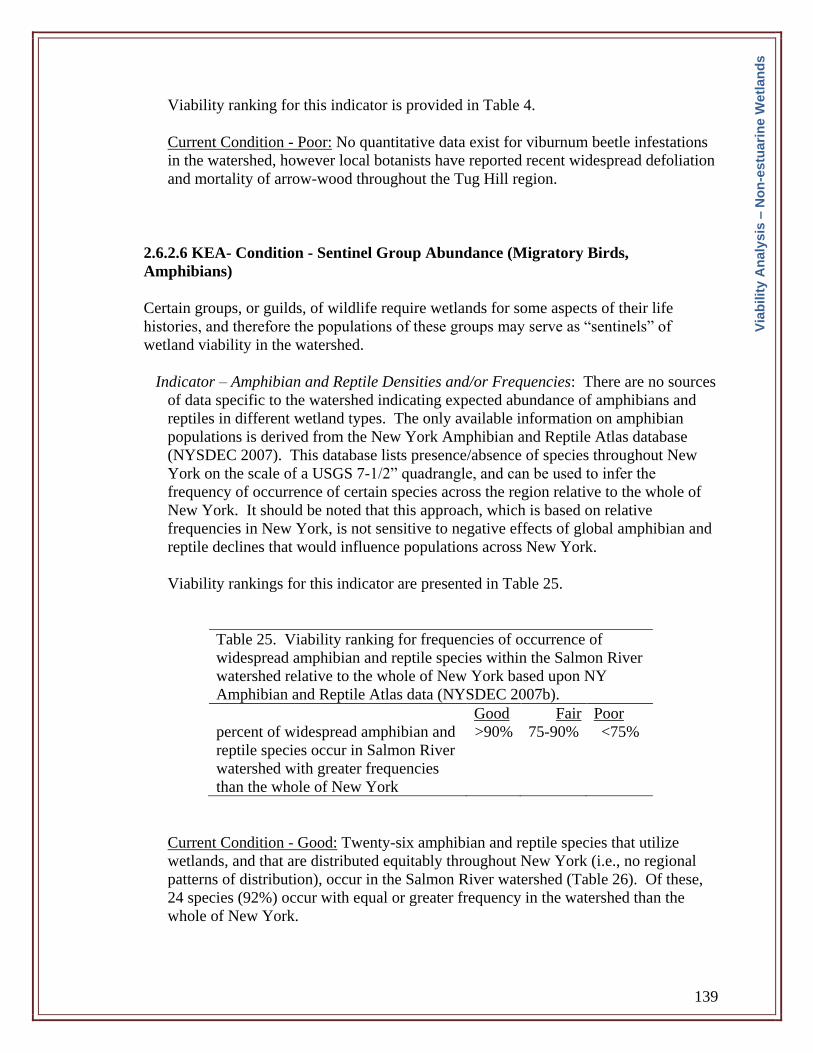
Viability rankings for this indicator are presented in Table 25.
Table 25. Viability ranking for frequencies of occurrence of
widespread amphibian and reptile species within the Salmon River
watershed relative to the whole of New York based upon NY
Amphibian and Reptile Atlas data (NYSDEC 2007b).
Good Fair Poor
percent of widespread amphibian and
reptile species occur in Salmon River
watershed with greater frequencies
than the whole of New York
>90% 75-90% <75%
Current Condition - Good: Twenty-six amphibian and reptile species that utilize
wetlands, and that are distributed equitably throughout New York (i.e., no regional
patterns of distribution), occur in the Salmon River watershed (Table 26). Of these,
24 species (92%) occur with equal or greater frequency in the watershed than the
whole of New York.
Via
bilit
y A
naly
sis
– N
on
-es
tua
rin
e W
etl
an
ds
140
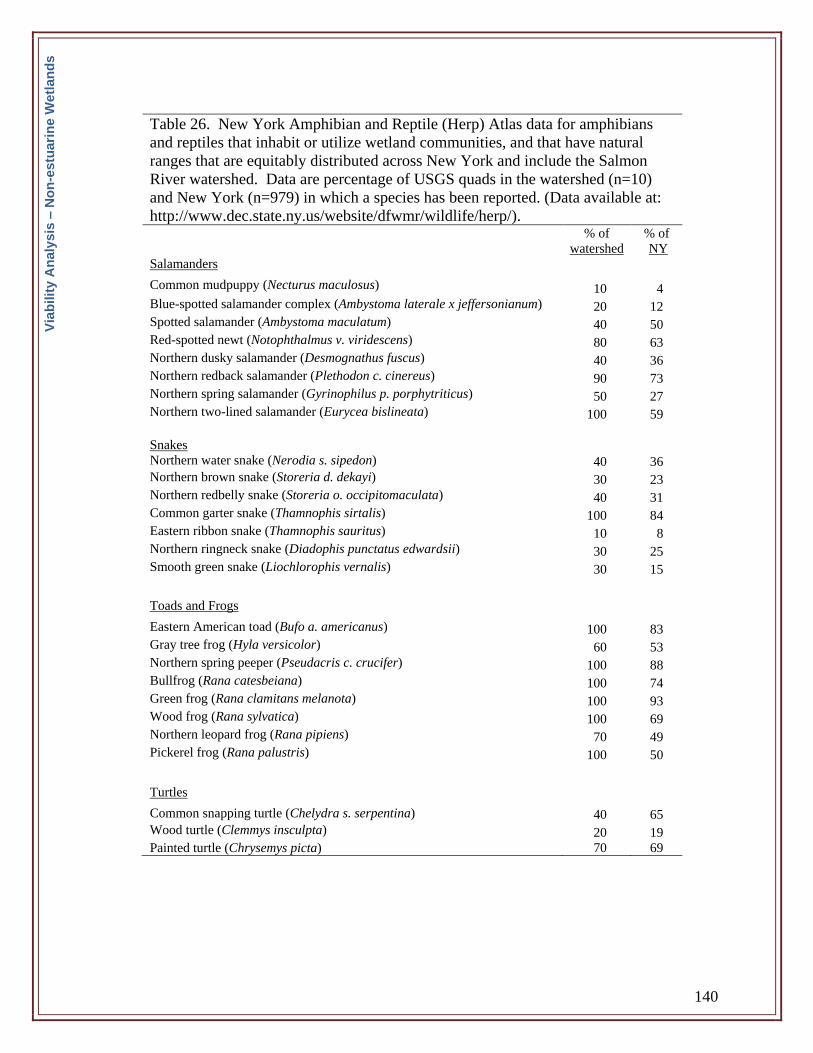
Table 26. New York Amphibian and Reptile (Herp) Atlas data for amphibians
and reptiles that inhabit or utilize wetland communities, and that have natural
ranges that are equitably distributed across New York and include the Salmon
River watershed. Data are percentage of USGS quads in the watershed (n=10)
and New York (n=979) in which a species has been reported. (Data available at:
http://www.dec.state.ny.us/website/dfwmr/wildlife/herp/).
% of
watershed
% of
NY
Salamanders
Common mudpuppy (Necturus maculosus) 10 4
Blue-spotted salamander complex (Ambystoma laterale x jeffersonianum) 20 12
Spotted salamander (Ambystoma maculatum) 40 50
Red-spotted newt (Notophthalmus v. viridescens) 80 63
Northern dusky salamander (Desmognathus fuscus) 40 36
Northern redback salamander (Plethodon c. cinereus) 90 73
Northern spring salamander (Gyrinophilus p. porphytriticus) 50 27
Northern two-lined salamander (Eurycea bislineata) 100 59
Snakes
Northern water snake (Nerodia s. sipedon) 40 36
Northern brown snake (Storeria d. dekayi) 30 23
Northern redbelly snake (Storeria o. occipitomaculata) 40 31
Common garter snake (Thamnophis sirtalis) 100 84
Eastern ribbon snake (Thamnophis sauritus) 10 8
Northern ringneck snake (Diadophis punctatus edwardsii) 30 25
Smooth green snake (Liochlorophis vernalis) 30 15
Toads and Frogs
Eastern American toad (Bufo a. americanus) 100 83
Gray tree frog (Hyla versicolor) 60 53
Northern spring peeper (Pseudacris c. crucifer) 100 88
Bullfrog (Rana catesbeiana) 100 74
Green frog (Rana clamitans melanota) 100 93
Wood frog (Rana sylvatica) 100 69
Northern leopard frog (Rana pipiens) 70 49
Pickerel frog (Rana palustris) 100 50
Turtles
Common snapping turtle (Chelydra s. serpentina) 40 65
Wood turtle (Clemmys insculpta) 20 19
Painted turtle (Chrysemys picta) 70 69
Via
bilit
y A
naly
sis
– N
on
-es
tua
rin
e W
etl
an
ds
141
Indicator – Numbers of Breeding or Migratory Waterfowl: Personnel at NYSDEC
Bureau of Wildlife indicate that no quantitative data exist for migratory waterfowl use
of wetlands within the watershed or in NYSDEC wildlife management units of the
greater Tug Hill region. Furthermore, there is no guidance with which to rank
expected levels of use, except to provide long-term trend data for the wetland systems
of the watershed.
Current Condition - Unranked:
2.6.2.7 KEA-Condition-Hydrology
Different wetland types develop through variations in quantity and quality of surface and
groundwater flow. For instance, fen communities require nutrient-enriched groundwater
discharge in order to develop, and their categorization into “rich,” “medium,” and “poor”
fen types reflects nutrient levels of the water sources. For other wetland communities the
stage and duration of flooding dictates community assemblage, and year-to-year variation
in water levels may serve as a source of disturbance that maintains a diverse species mix.
Within a given wetland complex diversity of community types reflects, in part, the
combinations and location of water sources feeding the system (Drexler and Bedford
2002). Hydrologic alterations that would negatively influence wetland community
occurrence include declines in surface water flow; ditching or tiling of wetland areas;
breaching of impoundments; filling of wetlands above prevailing surface water or
groundwater levels; and lowering of groundwater levels.
Indicator – Regional Annual Water Surplus (inches): The abundance of wetlands in the
greater Tug Hill region is due, in large part, to the high levels of precipitation that
sustain wetland hydrology. Annual water surplus is the measure of excess
precipitation (surplus = precipitation minus losses by evaporation and plant
transpiration) that eventually contributes to surface waters and groundwater.
Deviations in annual water surplus from natural levels of variation would indicate
potential for region-wide disruptions of wetland hydrology.
Average water surplus values range from 40” of surplus water at the highest
elevations of the Tug Hill Plateau to approximately 16” at Lake Ontario (Eschner et
al. 1974). No data were obtained with which to analyze the historic range of variation
in these levels for the region.
Current Condition – Good: Prevailing water surplus levels currently sustain
widespread and diverse wetlands within the watershed.
Indicator – Source Alteration (% from groundwater and surface water): The source and
quality of water supply to individual wetland systems dictates wetland community
type and condition. Viability ranking for this indicator requires hydrologic
information for each wetland community type, and these relationships have been
established in other areas supporting similar communities. However, to make this a
Via
bilit
y A
naly
sis
– N
on
-es
tua
rin
e W
etl
an
ds
142
useful indicator for this watershed assessment, distributions of respective community
types must first be known.
Current Condition – Unranked: A group of local wetland scientists suggested that no
reliable information currently exists to accurately characterize the distribution of
respective wetland types within the watershed, and therefore, to infer localized
hydrologic regimes that support those wetlands.
2.6.2.8 KEA- Condition - Toxins
A number of toxins may bioaccumulate in aquatic foodwebs and therefore may adversely
affect wetland biota. These include PCBs, DDT, Mirex and mercury. Substantial
monitoring for these compounds is conducted for game fish due to the potential for
human consumption. Contamination of non-game species has received far less
consideration with which to draw inference regarding the viability of natural resource
targets in the Salmon River watershed. Furthermore, with the exception of game fish, no
monitoring programs of toxins are known to exist for game or non-game species of the
watershed.
Indicator – Game Fish Tissue Mercury Concentration: Section 2.2.2.8 presents
background on toxic effects, sources of contamination and viability ranking criteria
for mercury.
Current Condition – Lower sub-watersheds - Fair: Elevated mercury levels are known
to occur in fish in the lower Salmon River, but currently there are no fish
consumption advisories for mercury in fish taken from the lower Salmon River
(NYSDOH 2006). It is possible that the sources of mercury contamination in fish of
the lower watershed also impact other wetland fauna due to migrations of salmonines.
Current Condition – Upper sub-watersheds – Unranked: In 2006 the NYSDEC listed
the Redfield Reservoir as a Section 303(d) Impaired Water due to mercury
contamination in some fish (NYSDOH 2006). It is likely that the mercury source for
the reservoir is internal loading from sediments due to water fluctuations. Therefore
conditions within the reservoir should not be extrapolated beyond the reservoir.
However, mercury is liberated from soils and sediments in the toxic methyl form
under conditions that are common in wetlands (Evers et al. 2007). Given the
extensive wetland systems within the watershed, it is possible that mercury
contamination may be problematic here. No other information exists with which to
rank this indicator for upper sub-watersheds.
Via
bilit
y A
naly
sis
– N
on
-es
tua
rin
e W
etl
an
ds
143
Indicator – Snapping Turtle Egg PCB Concentrations: Section 2.2.2.8 presents
background on toxic effects, sources of contamination and viability ranking criteria
for PCB.
PCB contamination threats in wetlands have recently been addressed using snapping
turtle eggs (Table 9), which have been shown to be highly correlated with
contaminant concentrations in liver and adipose (fat) tissue (Pagano et al. 1999).
Turtles accumulate persistent contaminants in their tissues from food and water taken
directly from the wetland systems they inhabit, so their contamination levels directly
reflect those of their immediate environments.
Current Condition – Upper sub-watersheds, Unranked; Lower sub-watersheds, Fair:
There are no data available for snapping turtle PCB concentrations in the watershed.
However, Pagano et al. (1999) reported snapping turtle egg concentrations to be 1.5
mg/kg at the nearby Rice Creek Biological Station in Oswego County. The regional
source for PCB contamination is believed to be Lake Ontario, with migratory
salmonines serving to disperse PCBs when they move inland from the lake.
Therefore, sub-watersheds above the Lighthouse Hill Reservoir are isolated from this
source. PCB concentrations in sport fish are known to be lower in the Redfield
Reservoir compared to the lower reaches of the Salmon River (Section 2.5.2.4).
Therefore, it is probable that PCB concentrations in wetland fauna will be lower in
the upper sub-watersheds than in the lower sub-watersheds.
Indicator - Indicator – Mink Jaw Lesions: Section 2.2.2.8 presents background on
ranking criteria for PCBs based upon occurrence of cancerous lesions in mink jaws.
Current Condition – Lower sub-watersheds – Poor: There are no data available
reporting the occurrence of cancerous lesions in mink for the Salmon River
watershed. However, based upon the work of Beckett and Haynes (2007) in the
Rochester Embayment, mink feeding within the Lake Ontario system appear to be
exposed to sufficiently high PCB concentrations to induce growth of lesions in jaw
tissue and this exposure is apparently from food sources exposed to contaminated
water in Lake Ontario.
Current Condition – Upper sub-watersheds – Unranked: No data are available that
suggest exposure of mink to PCB concentrations sufficiently high to cause cancerous
lesions in waterways where prey species are isolated from Lake Ontario.
Indicator – Snapping Turtle Egg Mirex Concentrations: Section 2.2.2.8 presents
background on toxic effects, sources of contamination and viability ranking criteria
for Mirex.
As with PCBs this indicator will be ranked using criteria based on snapping turtle
eggs (Table 9).
Current Condition – Upper sub-watersheds, Good; Lower sub-watersheds, Fair: There
are no data available for snapping turtle Mirex concentrations in the watershed.
Via
bilit
y A
naly
sis
– N
on
-es
tua
rin
e W
etl
an
ds
144
However, Pagano et al. (1999) reported Mirex concentrations in snapping turtle eggs
to be 0.04 kg/mg at the nearby Rice Creek Biological Station in Oswego County. As
with PCBs, the regional source for Mirex contamination is believed to be Lake
Ontario, with sub-watersheds above the Lighthouse Hill Reservoir being isolated
from this source. Mirex concentrations in sport fish are known to be lower in the
Redfield Reservoir compared to the lower reaches of the Salmon River (Section
2.5.2.4). Therefore, it is probable that Mirex contamination of wetland fauna will be
lower in the upper sub-watersheds than in the lower sub-watersheds.
2.6.2.9 KEA-Condition-Eutrophying Nutrients (Nitrogen and Phosphorus)
Wetlands play key roles in cycling of nitrogen (N) and phosphorus (P). Nutrient cycling
processes in wetlands are complex and are influenced by a number of factors including
pH and oxidation-reduction capacity (Osmond et al. 1995) and the local abundance of
nitrogen-fixing organisms (e.g., speckled alder, Hurd et al. 2005). In general, however,
wetlands tend to remove these nutrients from ground and surface waters. For instance,
wetland buffers in agricultural areas have been shown to reduce the amount of N and P
reaching streams by approximately 60% and 20-50% respectively (Illinois Groundwater
Consortium 1995). Phosphorus is typically removed by sedimentation of plant litter or
formation of insoluble precipitates with calcium and iron (Osmund et al. 1995). Nitrogen
is removed from soil and surface water through sedimentation of plant litter and through
the microbe-mediated process of denitrification (Saunder and Kalff 2001), which forms
gaseous N2 that is then released to the atmosphere.
Although wetlands are capable of long-term sequestration and removal of N and P, high
inputs of these nutrients are known to reduce wetland biodiversity. Potential sources of
excess P in wetlands include agriculture runoff (e.g., Illinois Groundwater Consortium
1995; Drexler and Bedford 2002) and point sources such as sewage treatment plants.
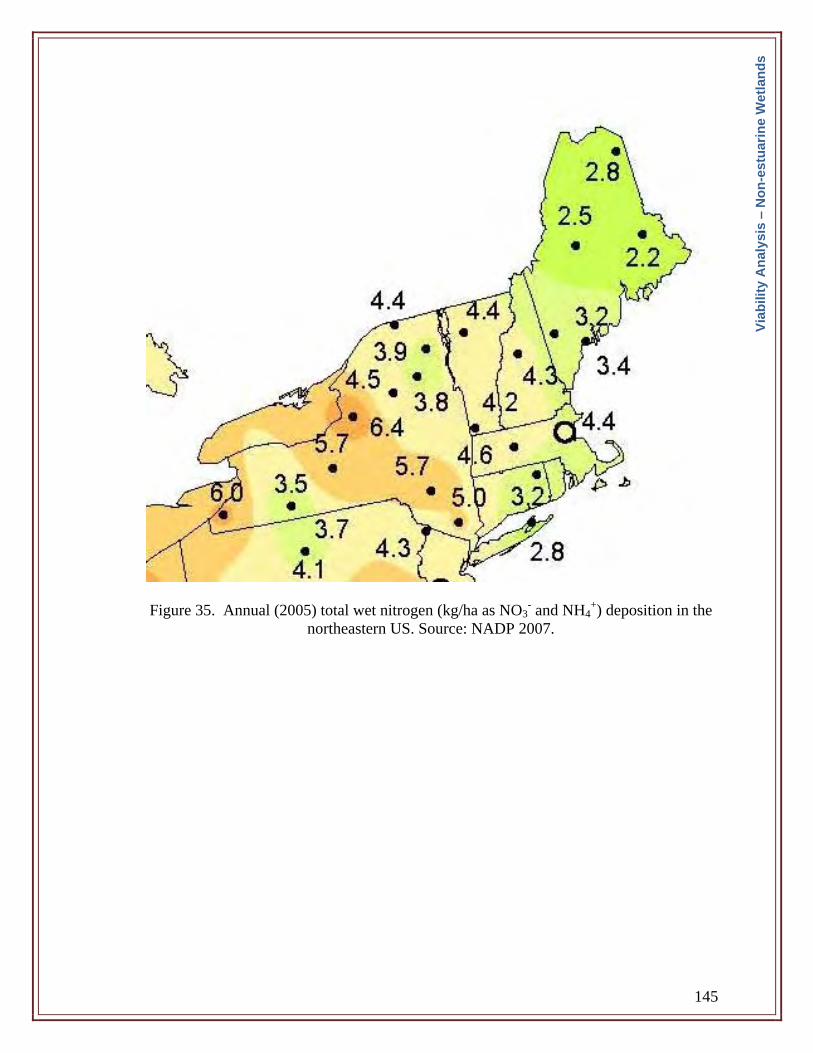
Excess N inputs are derived from agriculture runoff, atmospheric deposition (Hurd et al.
2005), and, when present, N-fixing plants (Hurd et al. 2005). Inputs traced to elevated N
deposition include linkages to N-saturated upland forests (see Section 2.7), and these may
be significant to the Salmon River watershed because of the high level of atmospheric N
deposition to the Tug Hill region (Figure 35).
Drexler and Bedford (2002) found that P concentrations in wetland soils were strongly
and negatively correlated with vascular plant and bryophyte richness in a fen in central
New York. Plant species with the genetic capacity to increase growth rates in response to
elevated N and P availability are able to competitively displace other slow-growing
species. These competitive interactions can reduce biodiversity and lead to local
problems of weedy or invasive species such as Phragmites (Rickey and Anderson 2004)
and possibly Typha (Drexler and Bedford 2002).
Via
bilit
y A
naly
sis
– N
on
-es
tua
rin
e W
etl
an
ds
145
Figure 35. Annual (2005) total wet nitrogen (kg/ha as NO3- and NH4
+) deposition in the
northeastern US. Source: NADP 2007.
Via
bilit
y A
naly
sis
– N
on
-es
tua
rin
e W
etl
an
ds
146
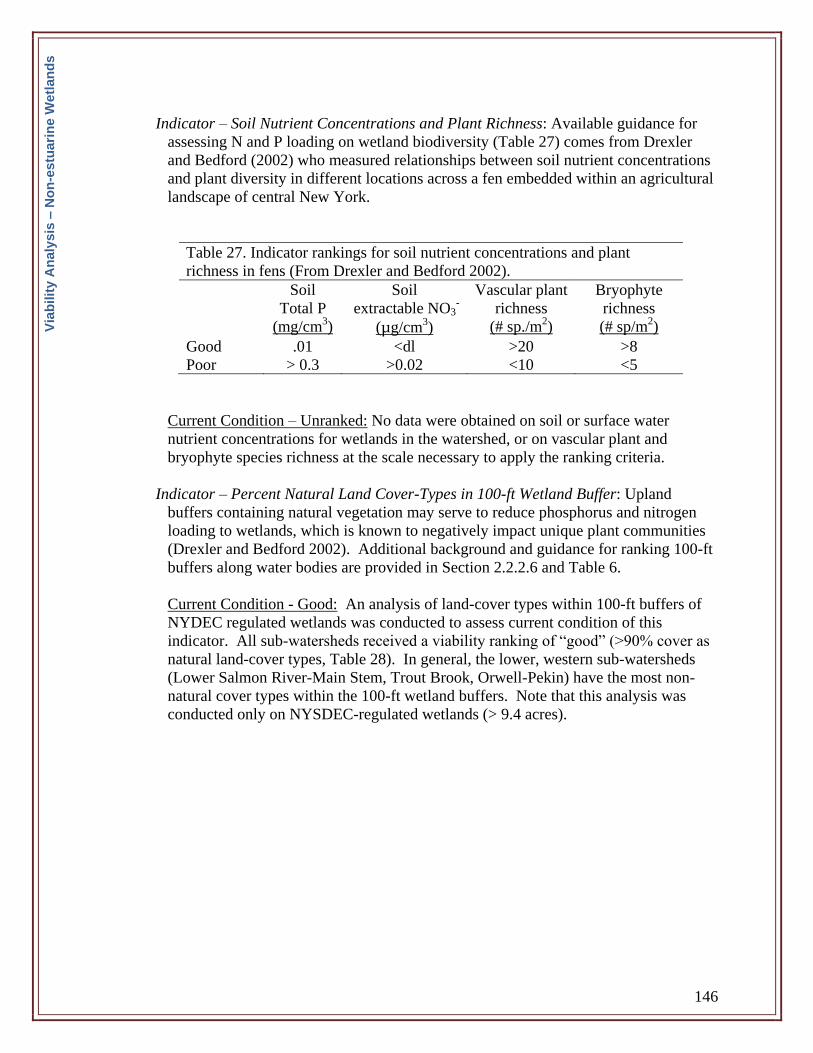
Indicator – Soil Nutrient Concentrations and Plant Richness: Available guidance for
assessing N and P loading on wetland biodiversity (Table 27) comes from Drexler
and Bedford (2002) who measured relationships between soil nutrient concentrations
and plant diversity in different locations across a fen embedded within an agricultural
landscape of central New York.
Table 27. Indicator rankings for soil nutrient concentrations and plant
richness in fens (From Drexler and Bedford 2002).
Soil
Total P
(mg/cm3)
Soil
extractable NO3-
(μg/cm3)
Vascular plant
richness
(# sp./m2)
Bryophyte
richness
(# sp/m2)
Good .01 <dl >20 >8
Poor > 0.3 >0.02 <10 <5
Current Condition – Unranked: No data were obtained on soil or surface water
nutrient concentrations for wetlands in the watershed, or on vascular plant and
bryophyte species richness at the scale necessary to apply the ranking criteria.
Indicator – Percent Natural Land Cover-Types in 100-ft Wetland Buffer: Upland
buffers containing natural vegetation may serve to reduce phosphorus and nitrogen
loading to wetlands, which is known to negatively impact unique plant communities
(Drexler and Bedford 2002). Additional background and guidance for ranking 100-ft
buffers along water bodies are provided in Section 2.2.2.6 and Table 6.
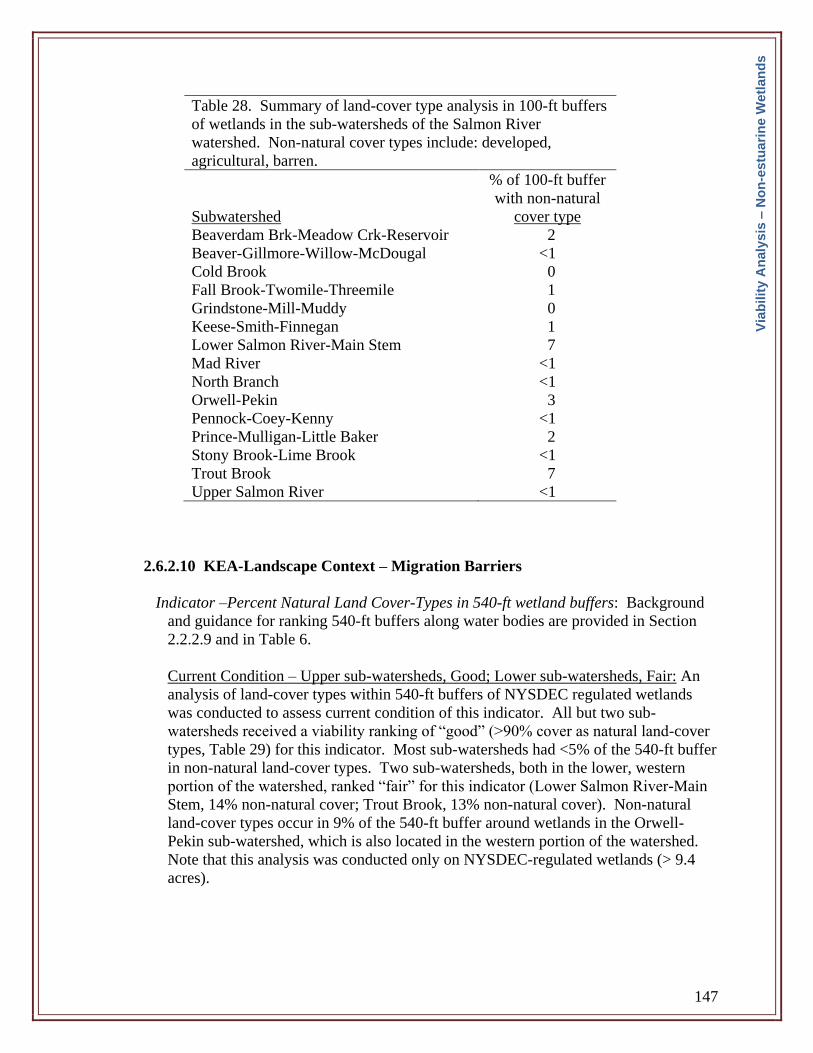
Current Condition - Good: An analysis of land-cover types within 100-ft buffers of
NYDEC regulated wetlands was conducted to assess current condition of this
indicator. All sub-watersheds received a viability ranking of “good” (>90% cover as
natural land-cover types, Table 28). In general, the lower, western sub-watersheds
(Lower Salmon River-Main Stem, Trout Brook, Orwell-Pekin) have the most non-
natural cover types within the 100-ft wetland buffers. Note that this analysis was
conducted only on NYSDEC-regulated wetlands (> 9.4 acres).
Via
bilit
y A
naly
sis
– N
on
-es
tua
rin
e W
etl
an
ds
147
Table 28. Summary of land-cover type analysis in 100-ft buffers
of wetlands in the sub-watersheds of the Salmon River
watershed. Non-natural cover types include: developed,
agricultural, barren.
Subwatershed
% of 100-ft buffer
with non-natural
cover type
Beaverdam Brk-Meadow Crk-Reservoir 2
Beaver-Gillmore-Willow-McDougal <1
Cold Brook 0
Fall Brook-Twomile-Threemile 1
Grindstone-Mill-Muddy 0
Keese-Smith-Finnegan 1
Lower Salmon River-Main Stem 7
Mad River <1
North Branch <1
Orwell-Pekin 3
Pennock-Coey-Kenny <1
Prince-Mulligan-Little Baker 2
Stony Brook-Lime Brook <1
Trout Brook 7
Upper Salmon River <1
2.6.2.10 KEA-Landscape Context – Migration Barriers
Indicator –Percent Natural Land Cover-Types in 540-ft wetland buffers: Background
and guidance for ranking 540-ft buffers along water bodies are provided in Section
2.2.2.9 and in Table 6.
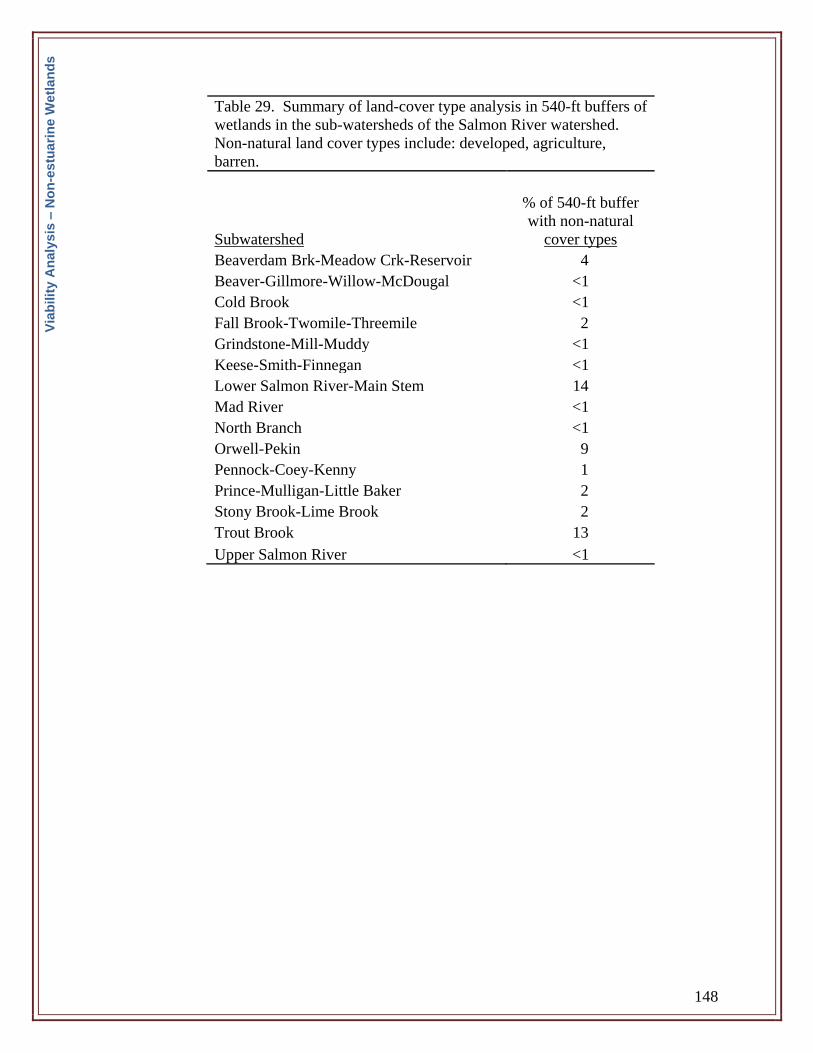
Current Condition – Upper sub-watersheds, Good; Lower sub-watersheds, Fair: An
analysis of land-cover types within 540-ft buffers of NYSDEC regulated wetlands
was conducted to assess current condition of this indicator. All but two sub-
watersheds received a viability ranking of “good” (>90% cover as natural land-cover
types, Table 29) for this indicator. Most sub-watersheds had <5% of the 540-ft buffer
in non-natural land-cover types. Two sub-watersheds, both in the lower, western
portion of the watershed, ranked “fair” for this indicator (Lower Salmon River-Main
Stem, 14% non-natural cover; Trout Brook, 13% non-natural cover). Non-natural
land-cover types occur in 9% of the 540-ft buffer around wetlands in the Orwell-
Pekin sub-watershed, which is also located in the western portion of the watershed.
Note that this analysis was conducted only on NYSDEC-regulated wetlands (> 9.4
acres).
Via
bilit
y A
naly
sis
– N
on
-es
tua
rin
e W
etl
an
ds
148
Table 29. Summary of land-cover type analysis in 540-ft buffers of
wetlands in the sub-watersheds of the Salmon River watershed.
Non-natural land cover types include: developed, agriculture,
barren.
Subwatershed
% of 540-ft buffer
with non-natural
cover types
Beaverdam Brk-Meadow Crk-Reservoir 4
Beaver-Gillmore-Willow-McDougal <1
Cold Brook <1
Fall Brook-Twomile-Threemile 2
Grindstone-Mill-Muddy <1
Keese-Smith-Finnegan <1
Lower Salmon River-Main Stem 14
Mad River <1
North Branch <1
Orwell-Pekin 9
Pennock-Coey-Kenny 1
Prince-Mulligan-Little Baker 2
Stony Brook-Lime Brook 2
Trout Brook 13
Upper Salmon River <1
Via
bilit
y A
naly
sis
– N
on
-es
tua
rin
e W
etl
an
ds
149
Indicator – Length of Road Bisecting 540-ft Wide Wetland Buffers:
Road crossings have been shown to be a significant source of mortality to amphibians
and reptiles (Hels and Buchwald 2001; Gibbs and Shriver 2005), especially those that
breed in aquatic habitats and must cross roads to travel between hibernation and
breeding sites.
No guidance is currently available to suggest quantifiable ratings related to road
densities and mortality risks in amphibian/reptile populations. Subjective ranking
criteria for this indicator are provided in Table 11 using the criterion of Semlitsch
(1998) in which an estimated 95% of salamander populations occur within 540 ft of
wetlands.
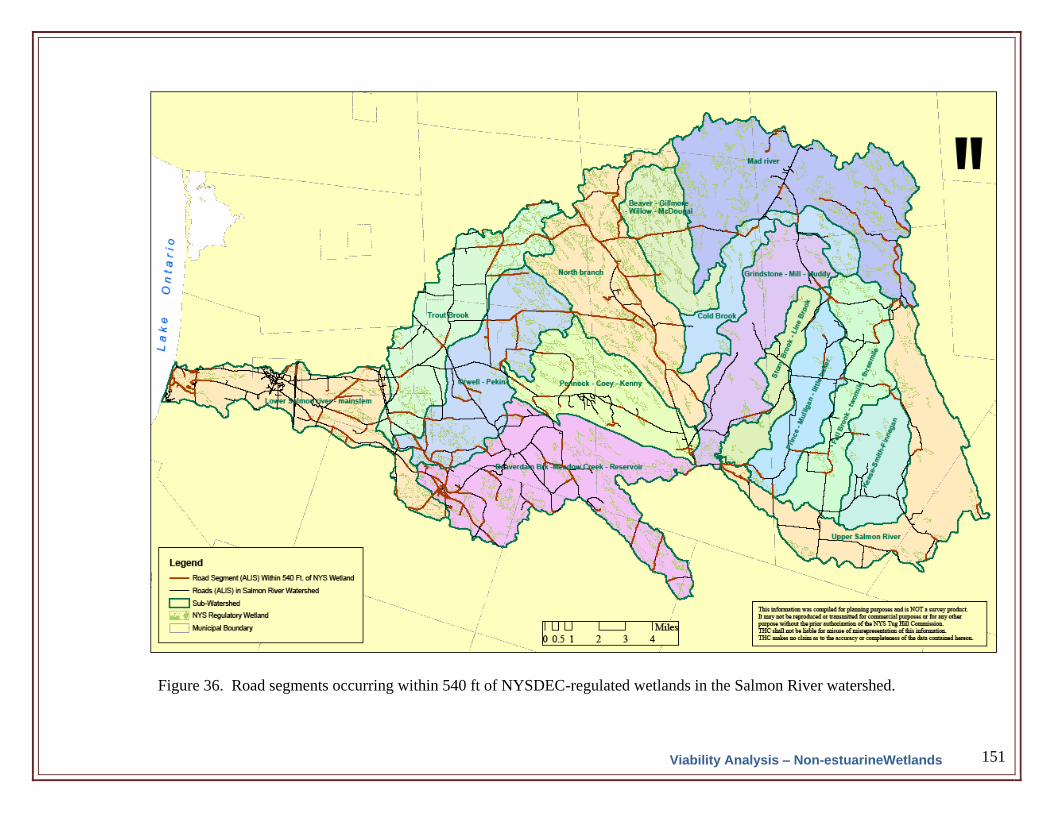
Current Condition – Unranked: An analysis was conducted of total road length
intersecting 540-ft wide buffers around NYSDEC-regulated wetlands as a preliminary
estimate of road densities within wetlands buffers in the watershed (Figure 36). Note
that this analysis was conducted using only the mapped NYSDEC wetlands (>9.2
acres). Due to the fact that dirt and gated roads were not discerned from paved roads
in this analysis, the results may overstate the potential for amphibian and reptile
mortality by vehicles since traffic volume and speed are expected to be substantially
lower on many road segments. However, it should also be noted that many of the dirt
roads and gated paths are open to ATV traffic and therefore may still pose threats to
migrating reptiles and amphibians. No determinations were made of viability for this
indicator. Data are presented as a baseline for future analyses.
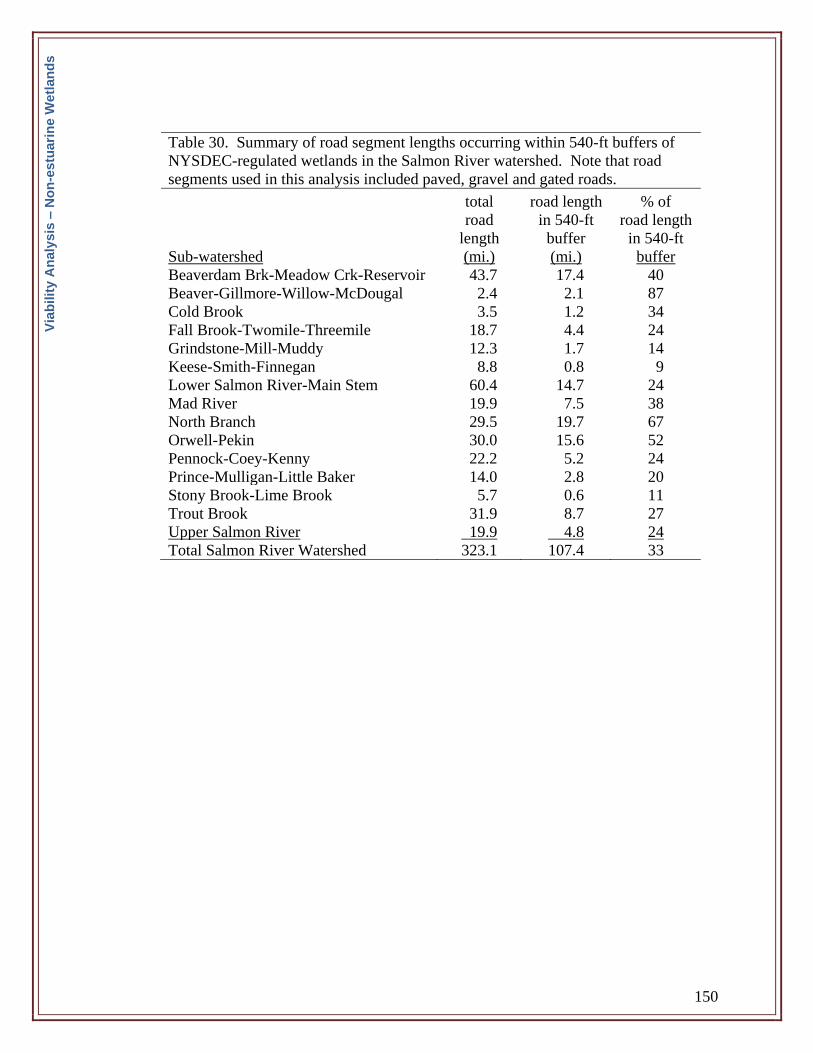
Results of the analysis are presented in Table 30. An estimated total of ~107 miles of
road segments (~33%) occur in the watershed within 540 ft of NYSDEC-regulated
wetlands. On a sub-watershed basis, road segments in wetland buffers ranged from
0.6 to 19.7 miles. Sub-watersheds with the greatest length of road within 540-ft
buffers are North Branch (19.7 miles, 67% of total road length), Beaverdam Brook-
Meadow Creek-Reservoir (17.4 miles, 40%), Orwell-Pekin (15.6 miles, 52%) and
Lower Salmon River-Main Stem (14.7 miles, 24%).
Via
bilit
y A
naly
sis
– N
on
-es
tua
rin
e W
etl
an
ds
150
Table 30. Summary of road segment lengths occurring within 540-ft buffers of
NYSDEC-regulated wetlands in the Salmon River watershed. Note that road
segments used in this analysis included paved, gravel and gated roads.
Sub-watershed
total
road
length
(mi.)
road length
in 540-ft
buffer
(mi.)
% of
road length
in 540-ft
buffer
Beaverdam Brk-Meadow Crk-Reservoir 43.7 17.4 40
Beaver-Gillmore-Willow-McDougal 2.4 2.1 87
Cold Brook 3.5 1.2 34
Fall Brook-Twomile-Threemile 18.7 4.4 24
Grindstone-Mill-Muddy 12.3 1.7 14
Keese-Smith-Finnegan 8.8 0.8 9
Lower Salmon River-Main Stem 60.4 14.7 24
Mad River 19.9 7.5 38
North Branch 29.5 19.7 67
Orwell-Pekin 30.0 15.6 52
Pennock-Coey-Kenny 22.2 5.2 24
Prince-Mulligan-Little Baker 14.0 2.8 20
Stony Brook-Lime Brook 5.7 0.6 11
Trout Brook 31.9 8.7 27
Upper Salmon River 19.9 4.8 24
Total Salmon River Watershed 323.1 107.4 33
Via
bilit
y A
naly
sis
– N
on
-es
tua
rin
e W
etl
an
ds
151
Figure 36. Road segments occurring within 540 ft of NYSDEC-regulated wetlands in the Salmon River watershed.
Viability Analysis – Non-estuarineWetlands
152
2.6.2.11 Generalized descriptions of wetland communities occurring in the
watershed (from Edinger et al. 2002).
-Black spruce – tamarack bog (G4G5 S3)
These conifer-dominated wetlands occur on acidic peatlands in cool, poorly drained
depressions throughout upstate New York but are most common in the Adirondacks
ecozone. Characteristic trees are black spruce (Picea mariana) and tamarack (Larix
laricina). Canopy cover is quite variable, ranging from open canopy woodlands with as
little as 20% cover of evenly spaced canopy trees to closed canopy forests with 80 to 90%
cover. In the more open canopy stands there is usually a well-developed shrublayer
characterized by several shrubs typical of bogs: leatherleaf (Chamaedaphne calyculata),
sheep laurel (Kalmia angustifolia), highbush blueberry (Vaccinium corymbosum),
Labrador tea (Rhododendron groenlandicum), mountain holly (Nemopanthus
mucronatus), and wild raisin (Viburnum nudum var.cassinoides). In closed canopy stands
the shrublayer is usually sparse, but species composition is similar. The dominant
groundcover consists of several species of Sphagnum moss, with scattered sedges and
forbs. Characteristic herbs are the sedge Carex trisperma, cotton grass (Eriophorum
spp.), pitcher plant (Sarracenia purpurea), bunchberry (Cornus canadensis), and
cinnamon fern (Osmunda cinnamomea). In shady areas where the canopy is dense, gold
thread (Coptis trifolia) and creeping snowberry (Gaultheria hispidula) may be found.
Vascular plant diversity is usually low in these forested peatlands, but bryophyte and
epiphytic lichen flora may be diverse. Characteristic animals include three-toed
woodpecker (Picoides tridactylus), black-backed woodpecker (Picoides arcticus), olive-
sided flycatcher (Contopus borealis), gray jay (Perisoreus canadensis), Lincoln's sparrow
(Melospiza lincolnii), white-throated sparrow (Zonotrichia albicollis), golden-crowned
kinglet (Regulus satrapa), spruce grouse (Dendragapus canadensis), and four-toed
salamander (Hemidactylium scutatum).
-Floodplain forest (G3G4 S2S3)
This is a broadly defined hardwood forest type that occurs throughout upstate New York
north of the coastal lowlands on mineral soil deposits of low floodplain terraces and river
deltas. These sites are annually flooded in spring, and high areas are flooded irregularly.
Some sites may be quite dry by late summer. The most abundant trees include silver
maple (Acer saccharinum), ashes (Fraxinus pensylvanica, F. nigra,F. americana),
cottonwood (Populus deltoides), red maple (Acer rubrum), box elder (Acer negundo),
elms (Ulmus americana, U. rubra), hickories (Carya cordiformis, C. ovata, C. laciniosa),
butternut and black walnut (Juglans cinerea, J. nigra), sycamore (Platanus occidentalis),
oaks (Quercus bicolor, Q. palustris), and river birch (Betula nigra). Other less frequently
occurring trees include hackberry (Celtis occidentalis), tulip tree (Liriodendron
tulipifera), basswood (Tilia americana), and sugar maple (Acer saccharum). Introduced
trees, such as white willow (Salix alba) and black locust (Robinia pseudo-acacia), have
become established in some floodplain forests. The most abundant shrubs include
spicebush (Lindera benzoin), ironwood (Carpinus carolinianus), bladdernut (Staphylea
trifoliata), speckled alder (Alnus incana spp. rugosa), dogwoods (Cornus sericea,
C.foemina spp. racemosa, C. amomum), viburnums (Viburnum cassinoides, V.
Via
bilit
y A
naly
sis
– N
on
-es
tua
rin
e W
etl
an
ds
153
prunifolium, V. dentatum, V. lentago), and sapling canopy trees. Invasive exotic shrubs
that may be locally abundant include shrub honeysuckles (Lonicera tatarica, L.
morrowii), and multiflora rose (Rosa multiflora). Other less frequently occurring shrubs
include meadowsweet (Spiraea alba var. latifolia) and winterberry (Ilex verticillata). The
most abundant vines include poison ivy (Toxicodendron radicans), wild grapes (Vitis
riparia, Vitis spp.), Virginia creeper (Parthenocissus quinquefolia), virgin's bower
(Clematis virginiana), and, less frequently, moonseed (Menispermum canadense). The
most abundant herbs include sensitive fern (Onoclea sensibilis), jewelweeds (Impatiens
capensis, I. pallida), ostrich fern (Matteuccia struthiopteris), white snakeroot
(Eupatorium rugosum), wood nettle (Laportea canadensis), false nettle (Boehmeria
cylindrica), goldenrods (Solidago gigantea, S. canadensis, Solidago spp.), lizard’s tail
(Saururus cernuus), and jumpseed (Polygonum virginianum). Invasive exotic herbs that
may be locally abundant include moneywort (Lysimachia nummularia), garlic mustard
(Alliaria petiolata), dame’s rockets (Hesperis matronalis), and stilt grass (Microstegium
vimineum). Characteristic birds include yellow-throated vireo (Vireo flavifrons), tufted
titmouse (Parus bicolor), redbellied woodpecker (Melanerpes carolinus), and pileated
woodpecker (Dryocopus pileatus).
-Hemlock-hardwood swamp (G4G5 S4):
These common and widespread communities occur throughout upstate New York north
of the coastal lowlands on mineral soils and deep muck in depressions that receive
groundwater discharge. Some occurrences are very small (1 to 2 acres). Water levels in
these swamps typically fluctuate seasonally; they may be flooded in spring and relatively
dry by late summer. Forest canopies are normally closed (70 to 90%). Shrub layers are
sparse and species diversity low. Canopies are dominated by hemlock (Tsuga
canadensis), and co-dominated by yellow birch (Betula alleghaniensis) and red maple
(Acer rubrum). Other less frequently occurring trees include white pine, (Pinus strobus),
black gum (Nyssa sylvatica), and green ash (Fraxinus pennsylvanica). Characteristic
shrubs include highbush blueberry (Vaccinium corymbosum), various viburnums
(Viburnumcassinoides, V. lentago,and V. lanatanoides), winterberry (Ilex verticillata),
and mountain holly (Nemopanthus mucronatus). Characteristic herbs are cinnamon fern
(Osmunda cinnamomea) and sensitive fern (Onoclea sensibilis), sedges (Carex
trisperma, C. folliculata, and C. bromoides), goldthread, (Coptis trifolia), Canada
mayflower (Maianthemum canadense), mountain sorrel (Oxalis montana), foamflower
(Tiarella cordifolia), and sarsparilla (Aralia nudicaulis).
-Red maple – hardwood swamp (G5 S4S5)
These swamps occur throughout New York in poorly drained depressions, usually on
inorganic soils. This is a broadly defined community with many variants. Red maple
(Acer rubrum) is either the only canopy dominant, or it is codominant with one or more
hardwoods including ashes (Fraxinus pennsylvanica, F. nigra, and F. americana), elms
(Ulmus americana and U. rubra), yellow birch (Betula alleghaniensis), and swamp white
oak (Quercus bicolor). Other tree species include butternut (Juglans cinerea),bitternut
hickory (Carya cordiformis), black gum (Nyssa sylvatica), ironwood (Carpinus
carolinianus), and white pine (Pinus strobus). The shrub layer is usually well-developed
and may be quite dense. Characteristic shrubs are winterberry (Ilex verticillata),
Via
bilit
y A
naly
sis
– N
on
-es
tua
rin
e W
etl
an
ds
154
spicebush (Lindera benzoin), alder (Alnus incana ssp. rugosa), viburnums (Viburnum
recognitum, and V. cassinoides), highbush blueberry (Vaccinium corymbosum), common
elderberry (Sambucus canadensis), and various shrubby dogwoods (Cornus sericea, C.
racemosa, and C. amomum). The herbaceous layer may be quite diverse and is often
dominated by ferns, including sensitive fern (Onoclea sensibilis), cinnamon fern
(Osmunda cinnamomea), royal fern (O. regalis), and marsh fern (Thelypteris palustris),
with much lesser amounts of crested wood fern (Dryopteris cristata), and spinulose wood
fern (Dryopteris carthusiana). Characteristic herbs include skunk cabbage (Symplocarpus
foetidus), white hellebore (Veratrum viride), sedges (Carex stricta, C. lacustris, and C.
intumescens), jewelweed (Impatiens capensis), false nettle (Boehmeria cylindrica), arrow
arum (Peltandra virginica), tall meadow rue (Thalictrum pubescens), and marsh marigold
(Caltha palustris). Examples of wetland fauna include wood duck (Aix sponosa),
American black duck (Anas rubripes), northern water thrush (Seiurus noveboracensis),
beaver (Castor canadensis), river otter (Lutra canadensis), and mink (Mustela vison).
These swamps provide breeding habitat for many wetland-dependent species, such as
spring peeper (Pseudacris crucifer), American toad (Bufo americanus), wood frog (Rana
sylvatica), and spotted salamander (Ambystoma maculatum).
-Spruce-fir swamp (G3G4 S3):
Spruce-fir swamps are found primarily in the Adirondacks, Tug Hill, and Catskills in
basins or along edges of open waters. In the Adirondacks and the Tug Hill these swamps
are often found in drainage basins occasionally flooded by beaver (Castor canadensis).
These communities typically have a closed canopy (80 to 90% cover). The dominant tree
is usually red spruce (Picea rubens). Codominant trees include balsam fir (Abies
balsamea), red maple (Acer rubrum), and black spruce (Picea mariana) . Other tree
species include yellow birch (Betula alleghaniensis), white pine (Pinus strobus), and
hemlock (Tsuga canadensis). The shrublayer is often sparse and includes mountain holly
(Nemopanthus mucronatus), alders (Alnus viridis ssp. crispus, A. incana ssp. rugosa),
blueberries (Vaccinium corymbosum, V. myrtilloides), wild raisin (Viburnum
cassinoides), mountain ash (Sorbus americana), and winterberry (Ilex verticillata).
Characteristic herbs are cinnamon fern (Osmundacinnamomea), sedges (Carex trisperma,
C. folliculata), gold thread (Coptis trifolia), bunchberry (Cornus canadensis), starflower
(Trientalis borealis), wood sorrel (Oxalis acetosella), creeping snowberry (Gaultheria
hispidula), and dewdrop (Dalibarda repens). The non-vascular layer is often dominated
by Sphagnum species (S. girgensohnii, S. centrale,and S. angustifolium) along with
Bazzania trilobata and Pleurozium schreberi. A characteristic bird of spruce-fir swamps
is the northern water thrush (Seiurus noveboracensis).
-Vernal Pool (G4 S3S4):
Vernal pools are aquatic communities associated with intermittently to ephemerally
(springtime) ponded, small, shallow depressions within upland forests (or other terrestrial
communities). Vernal pools are typically flooded in spring or after heavy rains but are
usually dry during summer. Vernal pools typically occupy a small, confined basin (i.e., a
standing waterbody without a flowing outlet) but may be associated with intermittent
streams. Several hydrologic types of vernal pools have been identified and 5-7
ecoregional variants have been identified in New York that differ in dominant vascular
Via
bilit
y A
naly
sis
– N
on
-es
tua
rin
e W
etl
an
ds
155
plants, amphibians and invertebrates, as well as water chemistry, water temperature,
substrate type, and surrounding forest type. Note: Several foresters who contributed to
this Salmon River watershed assessment indicate that vernal pool communities are
frequently created in managed woodlands when machinery causes the formation of
localized depressions. Vernal pool communities include a diverse group of invertebrates
and amphibians that depend upon temporary pools as breeding habitat. Since vernal pools
cannot support fish populations, there is no threat of fish predation on amphibian eggs or
invertebrate larvae. Characteristic animals of vernal pools include species of amphibians,
reptiles, crustaceans, mollusks, annelids. Obligate vernal pool amphibians include
spotted salamander (Ambystoma maculatum), blue-spotted salamander (A. laterale),
Jefferson’s salamander (A. jeffersonianum), marbled salamander (A. opacum) and wood
frog (Rana sylvatica). Fairy shrimp (Anostraca) are obligate vernal pool crustaceans, with
Eubranchipus spp. being the most common. Facultative vernal pool amphibians include
four-toed salamander (Hemidactylium scutatum), red-spotted newt (Notophthalmus
viridescens), spring peeper (Pseudacris crucifer), gray tree frog (Hyla versicolor), green
frog (Rana clamitans), American toad (Bufo americanus), and Fowler’s toad (B.
woodhousei fowleri). Facultative vernal pool reptiles include painted turtle (Chrysemys
picta), spotted turtle (Clemmys guttata), and snapping turtle (Chelydra serpentina).
Facultative vernal pool mollusks include freshwater fingernail clams (Sphaerium sp.,
Musculium sp., and Pisidium sp.) and aquatic amphibious snails (Physa sp., Lymnaea sp.,
and Helisoma sp.). Facultative vernal pool insects include diving beetles (Dytiscidae),
whirligig beetles (Gyrinidae), dobsonflies (Corydalidae), caddisflies (Trichoptera),
dragonflies (Anisoptera), damselflies (Zygoptera), mosquitoes (Cuculidae), springtails
(Collembula) and water striders (Gerris sp.). Leeches (Hirudinea) are a facultative vernal
pool annelid. Characteristic vascular plants may include mannagrass (Glyceria sp.),
spikerush (Eleocharis acicularis), water purslane (Ludwigia palustris), naiad (Najas sp.),
duckweed (Lemna minor), and water hemlock (Cicuta maculata). Characteristic
bryophytes may include Brachythecium rivulare, Calliergon sp. and Sphagnum spp.
-Dwarf Shrub Bog (G4 S3):
These communities occur throughout upstate New York north of the coastal lowlands on
peat soils where surface and soil water is nutrient-poor and acidic. Communities are
dominated by low-growing (<1 m tall), evergreen, ericaceous shrubs and peat mosses
(Sphagnum spp.). The surface of the peatland is typically a mosaic of hummock/hollow
microtopography. The hummocks tend to have a higher abundance of shrubs than the
hollows; however, these bogs have more than 50% cover of low-growing shrubs. The
dominant shrubs are leatherleaf (Chamaedaphne calyculata), sheep laurel (Kalmia
angustifolia), bog laurel (K. polifolia), Labrador tea (Rhododendron groenlandicum), and
cranberry (Vaccinium oxycoccos, V. macrocarpon). Dominant graminoids are the sedge
Carex trisperma and tawny cottongrass (Eriophorum virginicum). Other characteristic,
but less common, plants are round-leaf sundew (Drosera rotundifolia), pitcher plant
(Sarracenia purpurea), bog rosemary (Andromeda glaucophylla), huckleberry
(Gaylussacia baccata), black chokeberry (Aronia melanocarpa), highbush blueberry
(Vaccinium corymbosum), water-willow (Decodon verticillatus), meadow sweet (Spiraea
alba var. latifolia, S. tomentosa),, marsh St. John's-wort (Triadenum virginicum), and the
Via
bilit
y A
naly
sis
– N
on
-es
tua
rin
e W
etl
an
ds
156
sedges Carex canescens, Carex pauciflora, and Rhynchospora alba. Scattered stunted
trees may be present, including black spruce (Picea mariana), tamarack (Larix laricina),
and red maple (Acer rubrum). Characteristic peat mosses that form a nearly continuous
carpet under the shrubs include Sphagnum magellanicum, S. rubellum, S. fallax, S.
fuscum, S. papillosum, and S. angustifolium. Characteristic animals include common
yellowthroat (Geothlypis trichas), song sparrow (Melospiza melodia), savannah sparrow
(Passerculus sandwichensis), masked shrew (Sorex cinereus), meadow jumping mouse
(Zapus hudsonius), southern bog lemming (Synaptomys cooperi), and wood frog (Rana
sylvatica).
-Inland poor fen (G4 S3):
These communities occur throughout upstate New York north of the coastal lowlands on
peat (Sphagnum) soils that are fed by water with low mineral concentrations and pH
values (3.5-5.0). The dominant species are Sphagnum mosses, with scattered sedges,
shrubs, and stunted trees. Characteristic mosses include Sphagnum rubellum, S.
magellanicum, S. papillosum, S. cuspidatum, S. fuscum, S. angustifolium, S. fallax, and S.
russowii. Characteristic herbs include sedges (Carex oligosperma, C. exilis, C. limosa, C.
trisperma, C.utriculata, C. paupercula, C. canescens), white beakrush (Rhynchospora
alba), cottongrasses (Eriophorum vaginatum ssp. spissum, E. virginicum), round-leaf
sundew (Drosera rotundifolia), and pitcher-plant (Sarracenia purpurea). Shrubs and
dwarf shrubs usually have less than 50% cover (i.e., not dominated by shrubs as in dwarf
shrub bogs). Characteristic shrubs include cranberry (Vaccinium oxycoccos, V.
macrocarpon), bog laurel (Kalmia polifolia), sheep laurel (K. angustifolia), sweet-gale
(Myrica gale), black chokeberry (Aronia melanocarpa), leatherleaf (Chamaedaphne
calyculata), bog rosemary (Andromeda glaucophylla), and Labrador tea (Rhododendron
groenlandicum). Scattered, stunted trees such as tamarack (Larix laricina), black spruce
(Picea mariana) or red maple (Acer rubrum) may be present.
-Shrub swamp (G5 S5):
Shrub swamps are broadly defined communities that occur throughout New York on
mineral soil or muck. They are dominated by tall shrubs that occur along lake shores and
river banks, in wet depressions, or in transition zones between marshes and upland
communities. In northern New York many shrub swamps are dominated by alder (Alnus
incana ssp. rugosa). Other characteristic shrubs include meadow-sweet (Spiraea alba
var. latifolia), steeple-bush (Spiraea tomentosa), gray dogwood (Cornus foemina ssp.
racemosa), swamp azalea (Rhododendron viscosum), highbush blueberry (Vaccinium
corymbosum), maleberry (Lyonia ligustrina), smooth alder (Alnus serrulata), spicebush
(Lindera benzoin), willows (Salix bebbiana, S. discolor, S. lucida, S. petiolaris), wild
raisin (Viburnum cassinoides), and arrowwood (Viburnum recognitum). Birds that may
be found in shrub swamps include common species such as common yellowthroat
(Geothlypis trichas); and rare species such as American bittern (Botaurus lentiginosus),
alder flycatcher (Empidonax alnorum), willow flycatcher (E. trallii), and Lincoln’s
sparrow (Passerella lincolnii).
Via
bilit
y A
naly
sis
– N
on
-es
tua
rin
e W
etl
an
ds
157
-Sedge meadow (G5 S4):
Sedge meadows are scattered throughout upstate New York north of the coastal lowlands
and are common in the Adirondack ecozone. They occur on organic soils (muck or
fibrous peat) that are permanently saturated and seasonally flooded. Peats are usually
fibrous, not sphagnous, and are usually underlain by deep muck. The dominant herbs
must be members of the sedge family (Cyperaceae), typically of the genus Carex. Sedge
meadows are dominated by peat and tussock-forming sedges such as tussock-sedge
(Carex stricta), with at least 50% cover. They are often codominated by bluejoint grass
(Calamagrostis canadensis) with less than 50% cover, and other sedges (Carex spp.,
including C. utriculata, C. vesicaria, and C. canescens). Other frequently occurring
plants with low percent cover include marsh cinquefoil (Potentilla palustris), sensitive
fern (Onoclea sensibilis) manna grasses (Glyceria spp., G. canadensis), swamp
loosestrife (Lysimachia terrestris), hairgrass (Agrostis scabra), marsh St. John’s-wort
(Triadenum virginicum), water horsetail (Equisetum fluviatile), tall meadow-rue
(Thalictrum pubescens), spike rushes (Eleocharis acicularis, E. obtusa), sweetflag
(Acorus americanus), spotted joe-pye-weed (Eupatorium maculatum), purple-stem
angelica (Angelica purpurea), three-way sedge (Dulichium arundinaceum), and bulrushes
(Scirpus spp.). Sparse shrubs may be present, such as meadow sweet (Spiraea alba var.
latifolia, S. tomentosa), leatherleaf (Chamaedaphne calyculata), sweet gale (Myrica
gale), and alder (Alnus spp.).
-Shallow emergent marsh (G5 S5):
Shallow emergent marshes occur throughout New York, typically in lake basins and
along streams. They often intergrade with deep emergent marshes, shrub swamps and
sedge meadows, and they may occur together in a complex mosaic in a large wetland.
These communities occur on mineral or deep muck soils (rather than true peat) that are
permanently saturated and seasonally flooded. Water depths may range from 6 in to 3 ft
during flood stages, but the water level usually drops by mid to late summer and the
substrate is exposed during an average year. The most abundant herbaceous plants
include bluejoint grass (Calamagrostis canadensis), cattails (Typha latifolia, T.
angustifolia, T. x glauca), sedges (Carex spp.), marsh fern (Thelypteris palustris), manna
grasses (Glyceria pallida, G. canadensis), spikerushes (Eleocharis smalliana, E. obtusa),
bulrushes (Scirpus cyperinus, S. tabernaemontani, S. atrovirens), threeway sedge
(Dulichium arundinaceum), sweetflag (Acorus americanus), tall meadow-rue (Thalictrum
pubescens), marsh St. John’s-wort (Triadenum virginicum), arrowhead (Sagittaria
latifolia), goldenrods (Solidago rugosa, S. gigantea), eupatoriums (Eupatorium
maculatum, E. perfoliatum), smartweeds (Polygonum coccineum, P. amphibium, P.
hydropiperoides), marsh bedstraw (Galium palustre), jewelweed (Impatiens capensis),
and loosestrifes (Lysimachia thyrsiflora, L. terrestris, L. ciliata). Frequently in degraded
examples, reed canary grass (Phalaris arundinacea) and/or purple loosestrife (Lythrum
salicaria) may become abundant. Sedges (Carex spp.) may be abundant in shallow
emergent marshes, but are not usually dominant. Marshes must have less than 50% cover
of peat and tussock-forming sedges such as tussock sedge (Carex stricta), otherwise it
may be classified as a sedge meadow. Characteristic shallow emergent marsh sedges
include Carex stricta, C. lacustris, C. lurida, C. hystricina, C. alata, C. vulpinoidea, C.
comosa, C. utriculata, C. scoparia, C. gynandra, C. stipata, and C. crinita. Other plants
Via
bilit
y A
naly
sis
– N
on
-es
tua
rin
e W
etl
an
ds
158
characteristic of shallow emergent marshes (most frequent listed first) include blue flag
iris (Iris versicolor), sensitive fern (Onoclea sensibilis), common skullcap (Scutellaria
galericulata), beggerticks (Bidens spp.), water-horehounds (Lycopus uniflorus, L.
americanus), bur-weeds (Sparganium americanum, S. eurycarpum), swamp milkweed
(Asclepias incarnata), water-hemlock (Cicuta bulbifera), asters (Aster umbellatus, A.
puniceus), marsh bellflower (Campanula aparinoides), water purslane (Ludwigia
palustris), royal and cinnamon ferns (Osmunda regalis, O. cinnamomea), marsh
cinquefoil (Potentilla palustris), rushes (Juncus effusus, J. canadensis), arrowleaf
(Peltandra virginica), purple-stem angelica (Angelica atropurpurea), water docks
(Rumex orbiculatus, R. verticillatus), turtlehead (Chelone glabra), waterparsnip (Sium
suave), and cardinal flower (Lobelia cardinalis). Shallow emergent marshes may have
scattered shrubs including rough alder (Alnus incana ssp. rugosa), water willow
(Decodon verticillatus), shrubby dogwoods (Cornus amomum, C. sericea), willows (Salix
spp.), meadow sweet (Spiraea alba var. latifolia), and buttonbush (Cephalanthus
occidentalis). Areas with greater than 50% shrub cover are classified as shrub swamps.
Amphibians that may be found in shallow emergent marshes include frogs such as
eastern American toad (Bufo a. americanus), northern spring peeper (Pseudoacris c.
crucifer), green frog (Rana clamitans melanota), and wood frog (Rana sylvatica); and
salamanders such as northern redback salamander (Plethodon c. cinereus) (Hunsinger
1999). Birds that may be found include red-winged blackbird (Agelaius phoeniceus),
marsh wren (Cistothorus palustris), and common yellowthroat (Geothlypis trichas).
Via
bilit
y A
naly
sis
– N
on
-es
tua
rin
e W
etl
an
ds
159
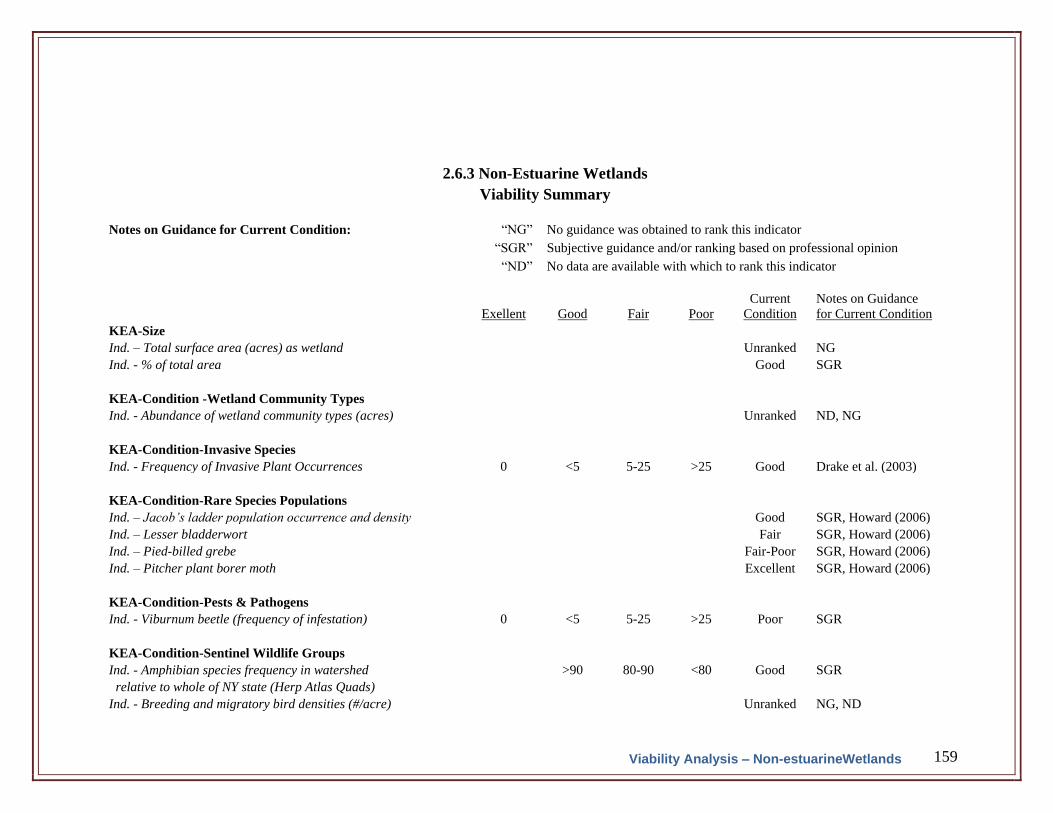
2.6.3 Non-Estuarine Wetlands
Viability Summary
Notes on Guidance for Current Condition: “NG” No guidance was obtained to rank this indicator
“SGR” Subjective guidance and/or ranking based on professional opinion
“ND” No data are available with which to rank this indicator
Exellent Good Fair Poor
Current
Condition
Notes on Guidance
for Current Condition
KEA-Size
Ind. – Total surface area (acres) as wetland Unranked NG
Ind. - % of total area Good SGR
KEA-Condition -Wetland Community Types
Ind. - Abundance of wetland community types (acres) Unranked ND, NG
KEA-Condition-Invasive Species
Ind. - Frequency of Invasive Plant Occurrences 0 <5 5-25 >25 Good Drake et al. (2003)
KEA-Condition-Rare Species Populations
Ind. – Jacob’s ladder population occurrence and density Good SGR, Howard (2006)
Ind. – Lesser bladderwort Fair SGR, Howard (2006)
Ind. – Pied-billed grebe Fair-Poor SGR, Howard (2006)
Ind. – Pitcher plant borer moth Excellent SGR, Howard (2006)
KEA-Condition-Pests & Pathogens
Ind. - Viburnum beetle (frequency of infestation) 0 <5 5-25 >25 Poor SGR
KEA-Condition-Sentinel Wildlife Groups
Ind. - Amphibian species frequency in watershed >90 80-90 <80 Good SGR
relative to whole of NY state (Herp Atlas Quads)
Ind. - Breeding and migratory bird densities (#/acre) Unranked NG, ND
Viability Analysis – Non-estuarineWetlands
160
Exellent Good Fair Poor
Current
Condition
Notes on Guidance
for Current Condition
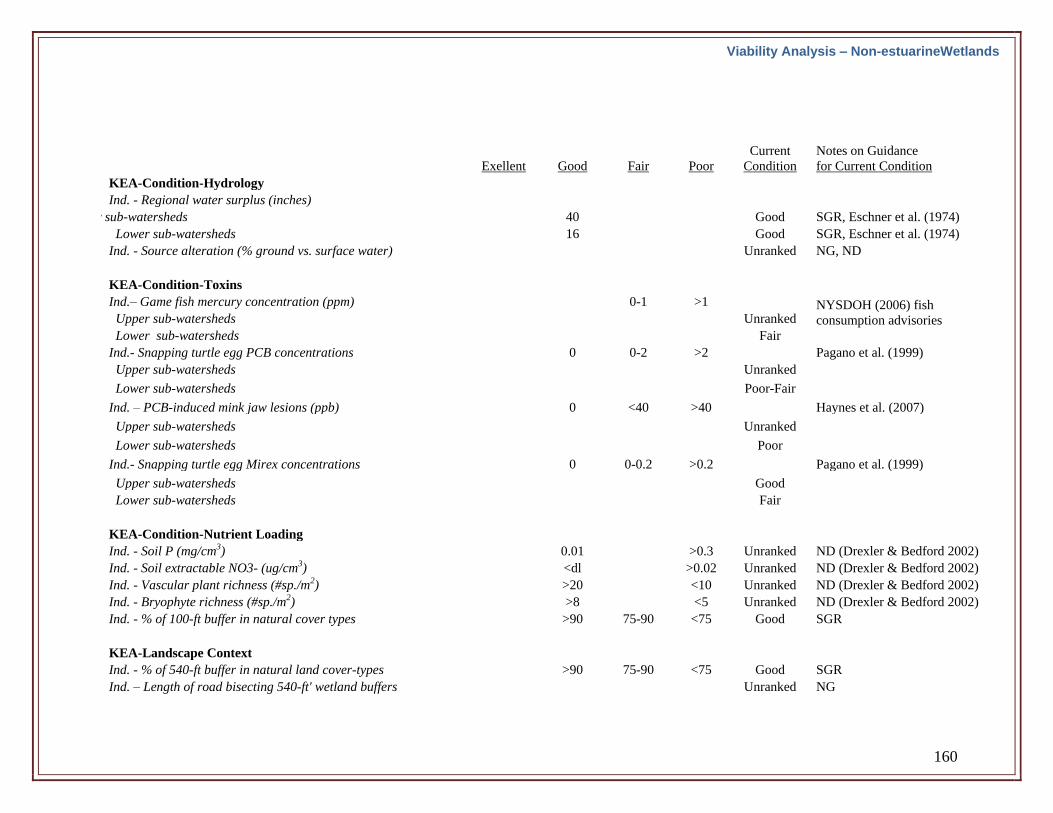
KEA-Condition-Hydrology
Ind. - Regional water surplus (inches)
Upper sub-watersheds 40 Good SGR, Eschner et al. (1974)
Lower sub-watersheds 16 Good SGR, Eschner et al. (1974)
Ind. - Source alteration (% ground vs. surface water) Unranked NG, ND
KEA-Condition-Toxins
Ind.– Game fish mercury concentration (ppm) 0-1 >1 NYSDOH (2006) fish
consumption advisories
Upper sub-watersheds Unranked
Lower sub-watersheds Fair
Ind.- Snapping turtle egg PCB concentrations 0 0-2 >2 Pagano et al. (1999)
Upper sub-watersheds Unranked
Lower sub-watersheds Poor-Fair
Ind. – PCB-induced mink jaw lesions (ppb) 0 <40 >40 Haynes et al. (2007)
Upper sub-watersheds Unranked
Lower sub-watersheds Poor
Ind.- Snapping turtle egg Mirex concentrations 0 0-0.2 >0.2 Pagano et al. (1999)
Upper sub-watersheds Good
Lower sub-watersheds Fair
KEA-Condition-Nutrient Loading
Ind. - Soil P (mg/cm3) 0.01 >0.3 Unranked ND (Drexler & Bedford 2002)
Ind. - Soil extractable NO3- (ug/cm3) <dl >0.02 Unranked ND (Drexler & Bedford 2002)
Ind. - Vascular plant richness (#sp./m2) >20 <10 Unranked ND (Drexler & Bedford 2002)
Ind. - Bryophyte richness (#sp./m2) >8 <5 Unranked ND (Drexler & Bedford 2002)
Ind. - % of 100-ft buffer in natural cover types >90 75-90 <75 Good SGR
KEA-Landscape Context
Ind. - % of 540-ft buffer in natural land cover-types >90 75-90 <75 Good SGR
Ind. – Length of road bisecting 540-ft' wetland buffers Unranked NG
Viability Analysis – Non-estuarineWetlands
161
2.7 Matrix Forest
2.7.1 Matrix Forest Target Definition
The matrix forest includes the majority of land cover in the watershed and represents the
mix of upland, terrestrial forest cover of varying composition and successional stages,
including early successional shrub and herbaceous vegetation types. The incorporation of
early-successional shrub/sapling and grasslands in this target reflect the realization that
many agricultural grasslands and abandoned fields provide habitat for a variety of
wildlife species that would have naturally been uncommon in the Northeast. Purposeful
management of these grasslands will perpetuate the occurrence of many species that are
currently declining in the Northeast. Also, although wetland forest types are embedded
within this matrix, for the purpose of this analysis, the wetland forest types are considered
within the non-estuarine wetland target.
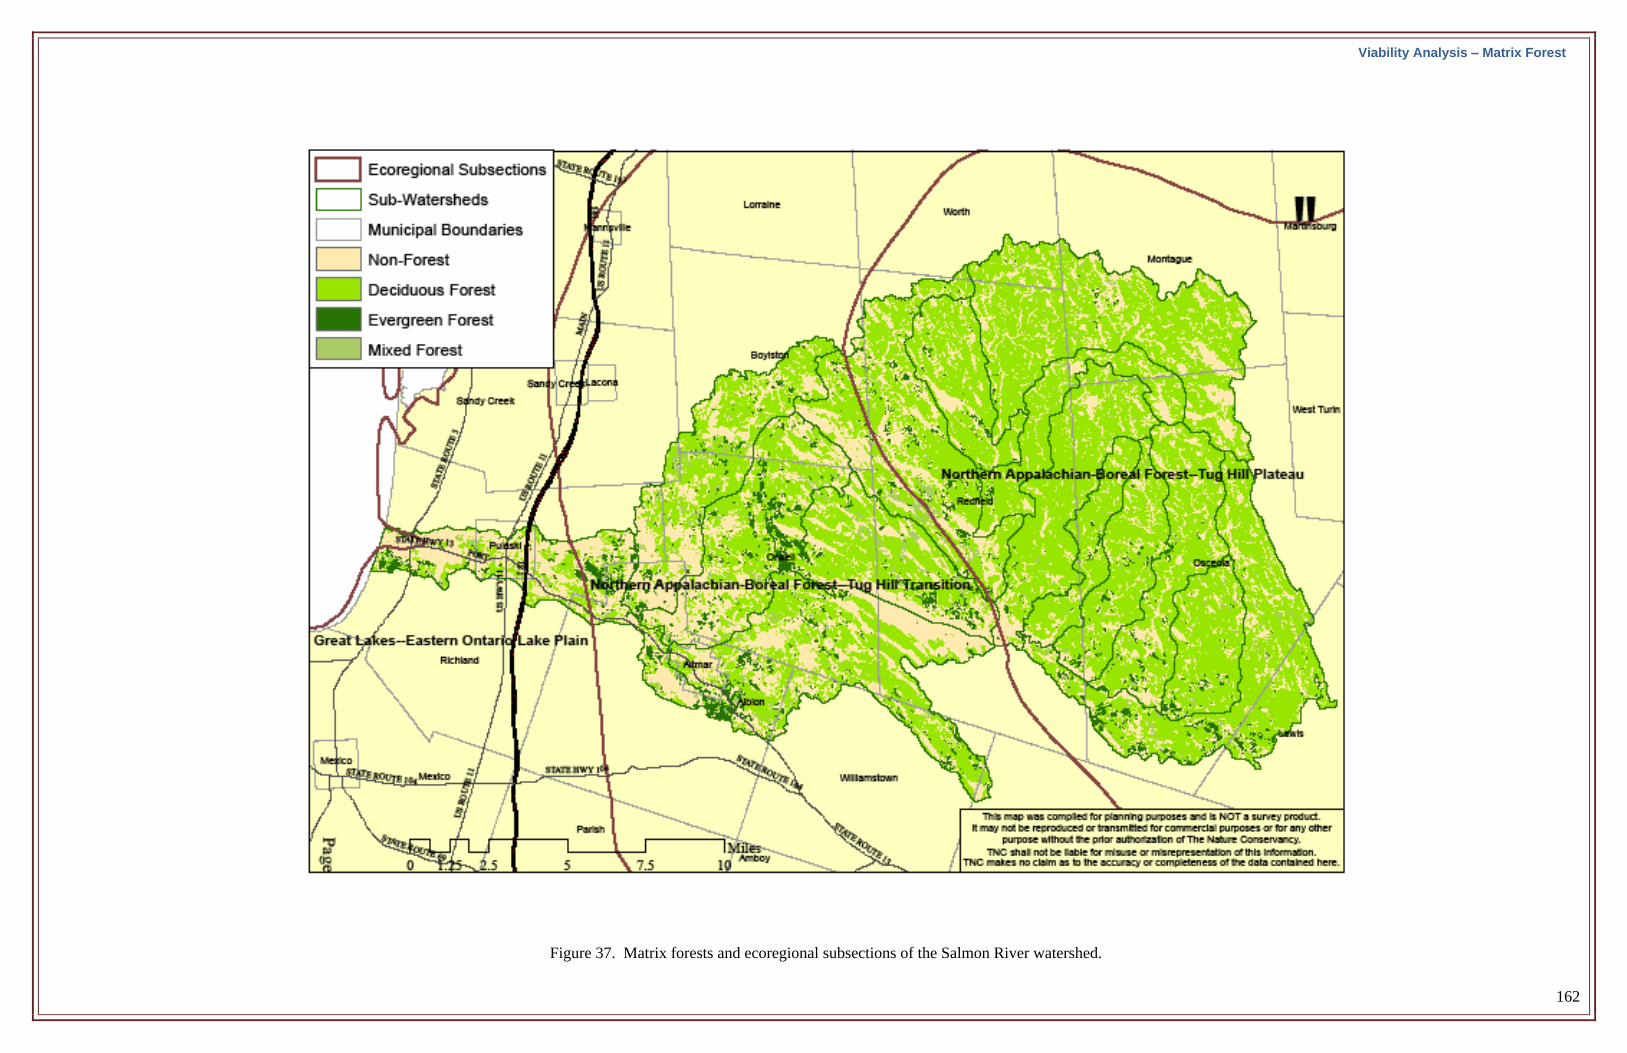
The forests of the Salmon River Watershed span two broad ecoregional subsections
(Figure 37). The Eastern Lake Ontario Lake Plain Subsection of the Great Lakes
Ecoregion occurs at the lowest elevations of the watershed. This intergrades with forests
at higher elevations to the east that are included in the Tug Hill Plateau Subsection of the
Northern Appalachian – Boreal Forest Ecoregion (USDA Forest Service 2004, 2005).
Tug Hill Plateau Subsection – The upper elevations of the interior Tug Hill Plateau
represent the extreme western limit of this ecoregional unit. Forests are dominated by
boreal red spruce-balsam fir types at high elevations and in areas of poor soil
drainage. Lower elevations and better drained soils are dominated by sugar maple,
yellow birch and American beech, with an admixture of eastern hemlock and red
spruce. Natural disturbances include severe wind events (frontal and cyclonic), winter
ice storms, and several insect pests and diseases.
Eastern Lake Ontario Lake Plain Subsection – This ecoregional unit is characterized
by relatively flat topographic relief and shallow drainages associated with rolling
glacial till-plains and glacial lake deposits (including clays, silt, marl, peat and muck,
beach ridges and dunes). Sedimentary rocks (Ordovician, Silurian and Devonian)
underlie the glacial deposits. Potential natural vegetation types include beech-maple
mesic forests with a mixture of oaks and hickories, and aspen. Climatic-induced
disturbances include winter ice storms and frontal and cyclonic wind events.
Via
bilit
y A
naly
sis
– M
atr
ix F
ore
st
162
Figure 37. Matrix forests and ecoregional subsections of the Salmon River watershed.
Viability Analysis – Matrix Forest
163
The current structure and composition of forests in the Salmon River watershed, like
most forest landscapes across the Northeast, have resulted from agricultural land use,
logging and settlement of the past century. Stout (1958) and Hotchkiss (1932) report that
forest composition at the time of European settlement was characterized by northern
hardwoods (American beech, sugar maple, yellow birch) with an abundant mix of red
spruce, eastern white pine, eastern hemlock, balsam fir and tamarack (primarily on lower
slopes and swamp edges). In the transitional Tug Hill fringe, northern hardwoods
dominated with hemlock, white pine, and some spruce restricted to stream sides and
ravines. Logging for softwoods began late in the 19th
century and, as transportation
capacity improved (e.g., Glenfield & Western Railroad), hardwoods began to be
extracted. At the turn of the 20th
century, widespread abandonment of marginal
agricultural sites around the Tug Hill fringe resulted in the establishment of successional
hardwood stands (primarily red maple and cherry), while conifer plantations were created
through reforestation efforts on several NY State Forests (Stout 1958). Heavy selective
cutting across the Tug Hill in the past has resulted in poorly stocked stands with low
proportions of high quality timber (Temporary State Commission on the Tug Hill
1976:40) and increased dominance of red maple (Stout 1958).
2.7.2. Matrix Forest Viability
2.7.2.1. KEA: SIZE – Forest Area and Cover
Indicator – Total Area of Contiguous Forest Cover (ac): Forest area provides an
estimator of total gross forest ecosystem and social functions (e.g., carbon
sequestration capacity; supply of raw materials for renewable forest products
industry; and recreational opportunities such as hunting, fishing, hiking, skiing and
snowmobiling). Furthermore, some ecosystem functions cannot be realized until
forests reach a minimum size threshold (e.g., habitat for numerous forest-dwelling
organisms including many animals that require large home ranges or interior forest
conditions). Current guidance on forest reserve size suggests that at least 25,000
acres of contiguous forest are required to permit natural ecosystem processes to occur
unabated, and to support viable populations of all forest-dwelling organisms native to
northeastern forest types (Anderson et al. 2004).
Current Condition: Upper sub-watersheds, Good; Lower-subwatersheds, Fair:
Forests of the upper sub-watersheds are contiguous with those of the greater Tug Hill
region, and together they occupy the western extreme of the Tug Hill “Core Forest”
(Figures 6 and 37). The Core Forest is a large (~150,000 acres) complex of forest and
wetlands that has remained unfragmented by large roads, utility rights-of-way,
heavily-used water bodies, agriculture and other cultural features. It represents the
third largest intact forest landscape in New York (after the Adirondacks and
Catskills), and the westernmost portion of the Northern Forest, which spans northern
portions of New York, Vermont, New Hampshire and Maine. Forests of the extreme
western portions of the lower sub-watersheds, and all of the Lower Salmon River
Via
bilit
y A
naly
sis
– M
atr
ix F
ore
st
164
Main Stem sub-watershed, are highly fragmented and do not form any forested blocks
>25,000 acres.
Indicator – Percent Forest Cover: Percent of a landscape in forest cover is a better
approximation of capacity for forests to provide localized ecosystem services
regardless of total forest cover. These localized functions include nutrient
sequestration, hydrologic and sedimentation control, and riparian buffers that help to
sustain healthy aquatic communities throughout the watershed. Ranking criteria for
percent of upland cover-types in forest are:
Poor Fair Good
% of upland cover-types <75% 75-90% >90%
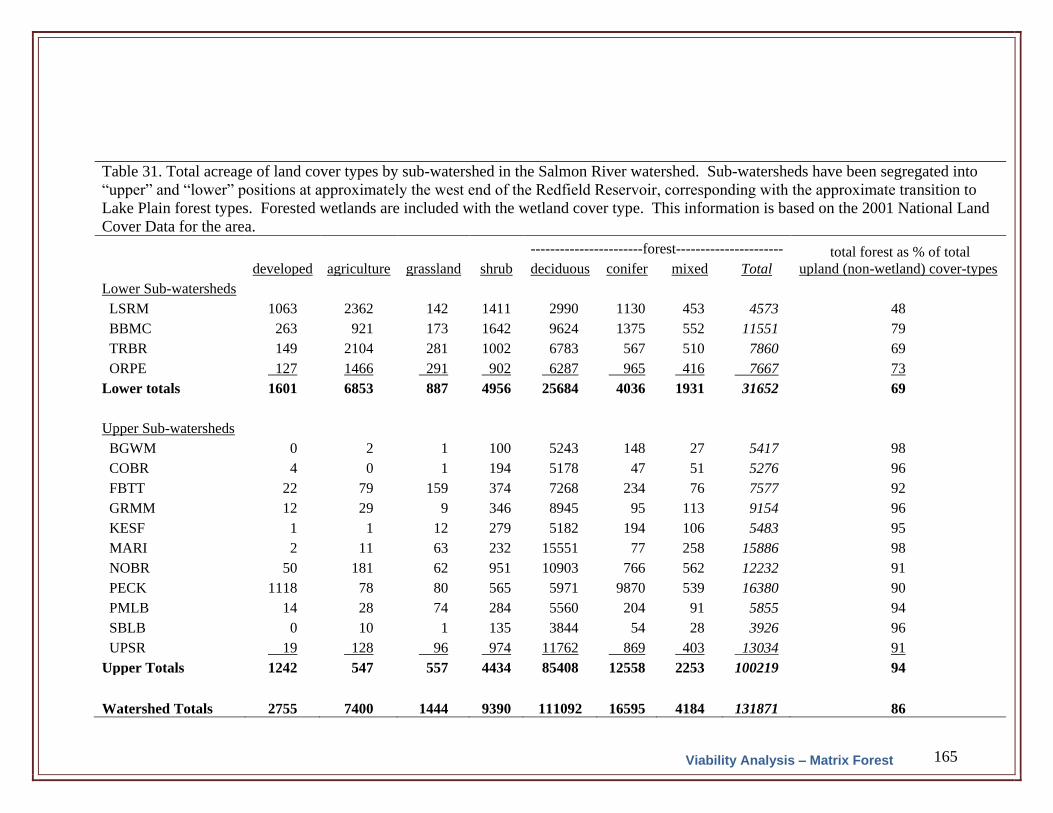
Current Condition: Upper sub-watersheds, Good; Lower sub-watersheds, Poor: The
Salmon River watershed is heavily forested, with the matrix forests (excluding
forested wetlands) occupying approximately 86% (~131,800 acres) of the watershed’s
total upland land base. As a percentage of upland (non-wetland) cover-types, forests
comprise 94% of the land area in the upper, eastern sub-watersheds. All of the upper
sub-watersheds possess ≥90% forest cover in uplands. Forest cover in the uplands of
the lower, western sub-watersheds ranged from 48-79% and averaged 69% (Table
31).
Via
bilit
y A
naly
sis
– M
atr
ix F
ore
st
165
Table 31. Total acreage of land cover types by sub-watershed in the Salmon River watershed. Sub-watersheds have been segregated into
“upper” and “lower” positions at approximately the west end of the Redfield Reservoir, corresponding with the approximate transition to
Lake Plain forest types. Forested wetlands are included with the wetland cover type. This information is based on the 2001 National Land
Cover Data for the area.
-----------------------forest---------------------- total forest as % of total upland (non-wetland) cover-types developed agriculture grassland shrub deciduous conifer mixed Total
Lower Sub-watersheds
LSRM 1063 2362 142 1411 2990 1130 453 4573 48
BBMC 263 921 173 1642 9624 1375 552 11551 79
TRBR 149 2104 281 1002 6783 567 510 7860 69
ORPE 127 1466 291 902 6287 965 416 7667 73
Lower totals 1601 6853 887 4956 25684 4036 1931 31652 69
Upper Sub-watersheds
BGWM 0 2 1 100 5243 148 27 5417 98
COBR 4 0 1 194 5178 47 51 5276 96
FBTT 22 79 159 374 7268 234 76 7577 92
GRMM 12 29 9 346 8945 95 113 9154 96
KESF 1 1 12 279 5182 194 106 5483 95
MARI 2 11 63 232 15551 77 258 15886 98
NOBR 50 181 62 951 10903 766 562 12232 91
PECK 1118 78 80 565 5971 9870 539 16380 90
PMLB 14 28 74 284 5560 204 91 5855 94
SBLB 0 10 1 135 3844 54 28 3926 96
UPSR 19 128 96 974 11762 869 403 13034 91
Upper Totals 1242 547 557 4434 85408 12558 2253 100219 94
Watershed Totals 2755 7400 1444 9390 111092 16595 4184 131871 86
Viability Analysis – Matrix Forest

166
Indicator – Area by Forest Cover-Type: Broad forest cover-types provide habitat for a
variety of different wildlife, plant and microbial species. Within the Salmon River
watershed, known broad forest cover types include deciduous hardwood, conifer
(natural hemlock, spruce, pine, and conifer plantations), and forests having natural
mixtures of hardwoods and conifer (spruce, hemlock and pine). Historic natural
abundances of forest types are not known for the watershed. However, at lower
elevations, conifer-dominated stands (hemlock and pine) occurred along waterways,
wetlands and wetland edges and shaded ravines. At upper elevations, conifer stands
(spruce, fir, hemlock and pine) occurred along wetland edges and waterways, and
upland forests contained a substantial conifer (spruce) component (Hotchkiss 1932,
Stout 1958).
Current Condition – Unranked: The matrix forests of the watershed are dominated by
deciduous types (Table 32). Note that this analysis does not include forested wetlands,
which include a number of conifer types (spruce, fir, tamarack, hemlock). The high
proportion (60%) of conifer types in the Pennock-Coey-Kenny sub-watershed reflects the
large number of State reforestation areas there. The amount of mixed forest types is low
given the historic accounts of spruce, hemlock and white pine admixtures in the original
forests of the watershed. This likely reflects the historic level of selective cutting for
conifers during the 19th
century. However, it should be noted that red spruce regeneration
was encountered on 41% of sampled hardwood dominated forests across the Tug Hill,
including sites within the Salmon River watershed (Section 2.7.2.9). Therefore red spruce
appears to be reestablishing across its range in the upper sub-watersheds.
Via
bilit
y A
naly
sis
– M
atr
ix F
ore
st
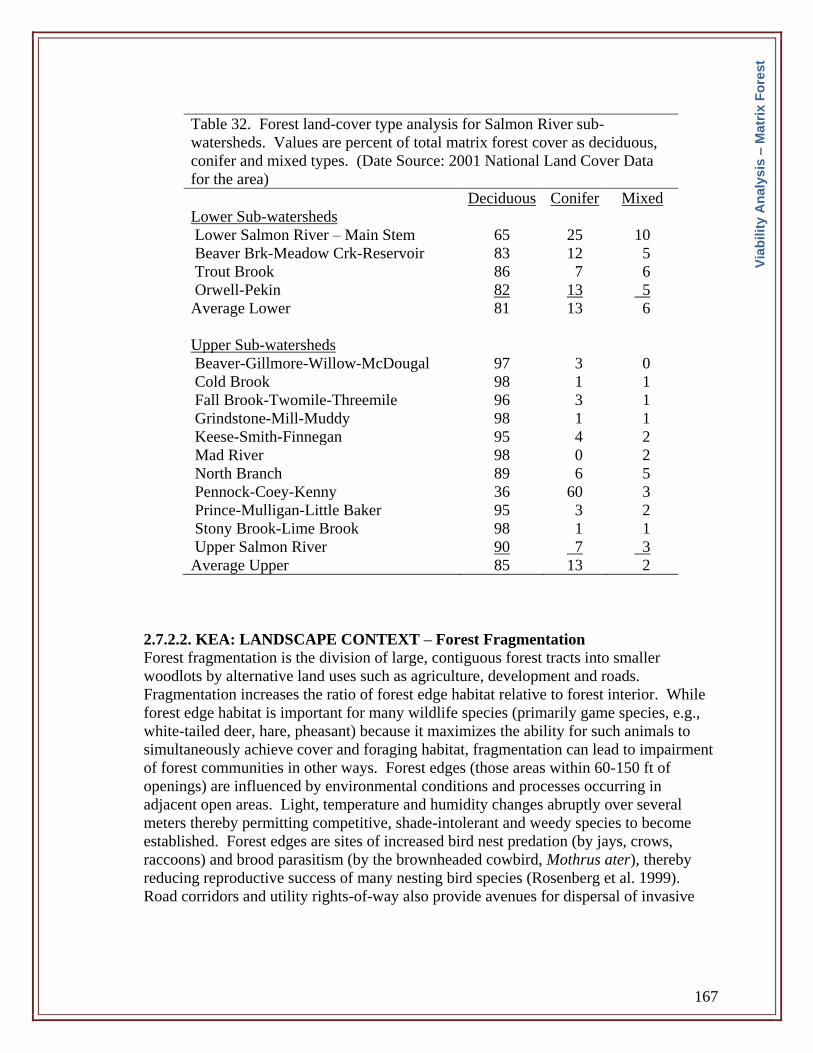
167
Table 32. Forest land-cover type analysis for Salmon River sub-
watersheds. Values are percent of total matrix forest cover as deciduous,
conifer and mixed types. (Date Source: 2001 National Land Cover Data
for the area)
Deciduous Conifer Mixed
Lower Sub-watersheds
Lower Salmon River – Main Stem 65 25 10
Beaver Brk-Meadow Crk-Reservoir 83 12 5
Trout Brook 86 7 6
Orwell-Pekin 82 13 5
Average Lower 81 13 6
Upper Sub-watersheds
Beaver-Gillmore-Willow-McDougal 97 3 0
Cold Brook 98 1 1
Fall Brook-Twomile-Threemile 96 3 1
Grindstone-Mill-Muddy 98 1 1
Keese-Smith-Finnegan 95 4 2
Mad River 98 0 2
North Branch 89 6 5
Pennock-Coey-Kenny 36 60 3
Prince-Mulligan-Little Baker 95 3 2
Stony Brook-Lime Brook 98 1 1
Upper Salmon River 90 7 3
Average Upper 85 13 2
2.7.2.2. KEA: LANDSCAPE CONTEXT – Forest Fragmentation
Forest fragmentation is the division of large, contiguous forest tracts into smaller
woodlots by alternative land uses such as agriculture, development and roads.
Fragmentation increases the ratio of forest edge habitat relative to forest interior. While
forest edge habitat is important for many wildlife species (primarily game species, e.g.,
white-tailed deer, hare, pheasant) because it maximizes the ability for such animals to
simultaneously achieve cover and foraging habitat, fragmentation can lead to impairment
of forest communities in other ways. Forest edges (those areas within 60-150 ft of
openings) are influenced by environmental conditions and processes occurring in
adjacent open areas. Light, temperature and humidity changes abruptly over several
meters thereby permitting competitive, shade-intolerant and weedy species to become
established. Forest edges are sites of increased bird nest predation (by jays, crows,
raccoons) and brood parasitism (by the brownheaded cowbird, Mothrus ater), thereby
reducing reproductive success of many nesting bird species (Rosenberg et al. 1999).
Road corridors and utility rights-of-way also provide avenues for dispersal of invasive
Via
bilit
y A
naly
sis
– M
atr
ix F
ore
st
168
plants. Some evidence indicates that even relatively narrow fragmenting features, such as
infrequently used truck trails, can prevent some species from crossing over them into
adjoining habitat.
Some forest management practices such as clearcutting will also temporarily fragment
forests, but with time, forest cover reestablishes. Additionally, these forests in early
stages of development provide habitat for a variety of organisms not found in more
mature forests. Therefore, fragmentation by agriculture, development, or roads has a
greater impact on forest species because it is more permanent and vegetation
management is more intensive.
Indicator – Edge:Area Ratio: A simple and direct measure of fragmentation is the ratio
of forest perimeter to area. With increasing amount of non-forest land types that abut
forest parcels of equal area, the edge:area ratio will increase, thereby indicating the
degree to which edge habitat occurs within the parcels. For this study, a ratio was
developed representing the total length of “non forest” edge (miles) to area of forest
(ac) within each of the sub-watersheds. Note that for this analysis fragmenting
features included all unnatural land cover types (development, agriculture, barren
land, roads and trails) as well as some natural land cover types (wetlands, grasslands,
shrub lands, open water).
No guidance was obtained for ranking this indicator. Viability rankings are
subjective and based upon the range of conditions currently existing in the upper sub-
watersheds, which are known to contain relatively intact forests that are naturally
fragmented by extensive wetland systems.
Current Condition- Upper Sub-watersheds, Good; Lower Sub-watersheds, Fair: The
forests of the upper sub-watersheds are largely contiguous and unfragmented by non-
natural vegetation types. Edge:area ratios ranged from 0.1 to 0.3 for these sub-
watersheds. Major fragmenting features in these sub-watersheds are roads and trails,
as well was open wetland communities. The edge:area ratio for the lower sub-
watersheds were 10- to 25-fold greater then the upper watersheds due to the
prevalence of agriculture and development there (Table 33).
Via
bilit
y A
naly
sis
– M
atr
ix F
ore
st
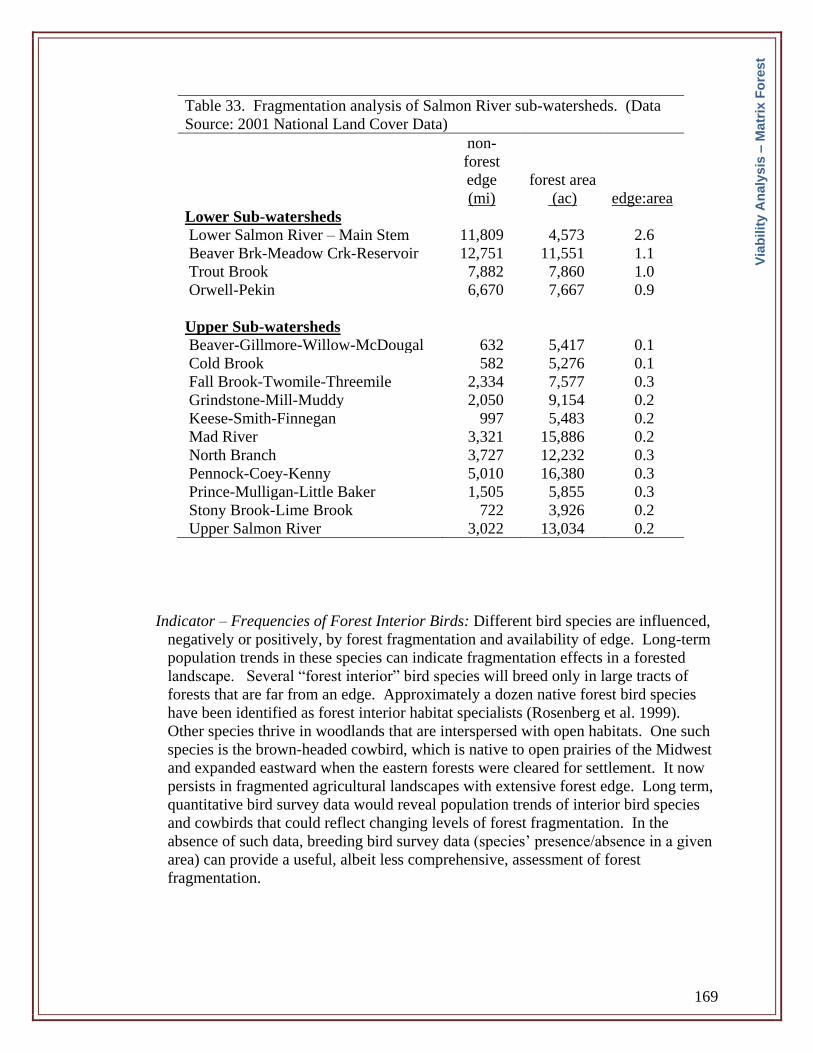
169
Table 33. Fragmentation analysis of Salmon River sub-watersheds. (Data
Source: 2001 National Land Cover Data)
non-
forest
edge
(mi)
forest area
(ac)
edge:area
Lower Sub-watersheds
Lower Salmon River – Main Stem 11,809 4,573 2.6
Beaver Brk-Meadow Crk-Reservoir 12,751 11,551 1.1
Trout Brook 7,882 7,860 1.0
Orwell-Pekin 6,670 7,667 0.9
Upper Sub-watersheds
Beaver-Gillmore-Willow-McDougal 632 5,417 0.1
Cold Brook 582 5,276 0.1
Fall Brook-Twomile-Threemile 2,334 7,577 0.3
Grindstone-Mill-Muddy 2,050 9,154 0.2
Keese-Smith-Finnegan 997 5,483 0.2
Mad River 3,321 15,886 0.2
North Branch 3,727 12,232 0.3
Pennock-Coey-Kenny 5,010 16,380 0.3
Prince-Mulligan-Little Baker 1,505 5,855 0.3
Stony Brook-Lime Brook 722 3,926 0.2
Upper Salmon River 3,022 13,034 0.2
Indicator – Frequencies of Forest Interior Birds: Different bird species are influenced,
negatively or positively, by forest fragmentation and availability of edge. Long-term
population trends in these species can indicate fragmentation effects in a forested
landscape. Several “forest interior” bird species will breed only in large tracts of
forests that are far from an edge. Approximately a dozen native forest bird species
have been identified as forest interior habitat specialists (Rosenberg et al. 1999).
Other species thrive in woodlands that are interspersed with open habitats. One such
species is the brown-headed cowbird, which is native to open prairies of the Midwest
and expanded eastward when the eastern forests were cleared for settlement. It now
persists in fragmented agricultural landscapes with extensive forest edge. Long term,
quantitative bird survey data would reveal population trends of interior bird species
and cowbirds that could reflect changing levels of forest fragmentation. In the
absence of such data, breeding bird survey data (species’ presence/absence in a given
area) can provide a useful, albeit less comprehensive, assessment of forest
fragmentation.
Via
bilit
y A
naly
sis
– M
atr
ix F
ore
st
170
Current Condition – Unranked: No absolute ranking can be made with this indicator;
however inference can be made regarding the impacts of greater fragmentation in
western portion of watershed. New York State Breeding Bird Atlas data (2000-2005)
were used to determine the frequency of occurrence of “forest interior indicator
species” (Rosenberg et al. 1999) within the western (more fragmented) and eastern
(less fragmented) portions of the Salmon River watershed. The data from this source
provide presence/absence of a species over a 5-year period within a census “block,”
four of which are used to cover a 7.5’ USGS Topographic Quad Map. These data
provide no measure of species abundance. This analysis (summarized in Table 34)
provides some evidence suggesting less frequent distributions of forest interior
species in the western, more fragmented section of the watershed. Of the twelve
interior specialist species identified by Rosenberg et al. (1999), one (bay-breasted
warbler) has not been observed in the watershed, and six occurred in over 90% of the
blocks in both the western and eastern portions of the watershed. However, when
substantial difference in frequencies (>10%) occurred between the western and
eastern portions of the watershed, the eastern forests tended to have greater
occurrences of the interior indicator species than the western forests, while the
cowbird (edge specialist) was more frequent in the western forests.
Via
bilit
y A
naly
sis
– M
atr
ix F
ore
st
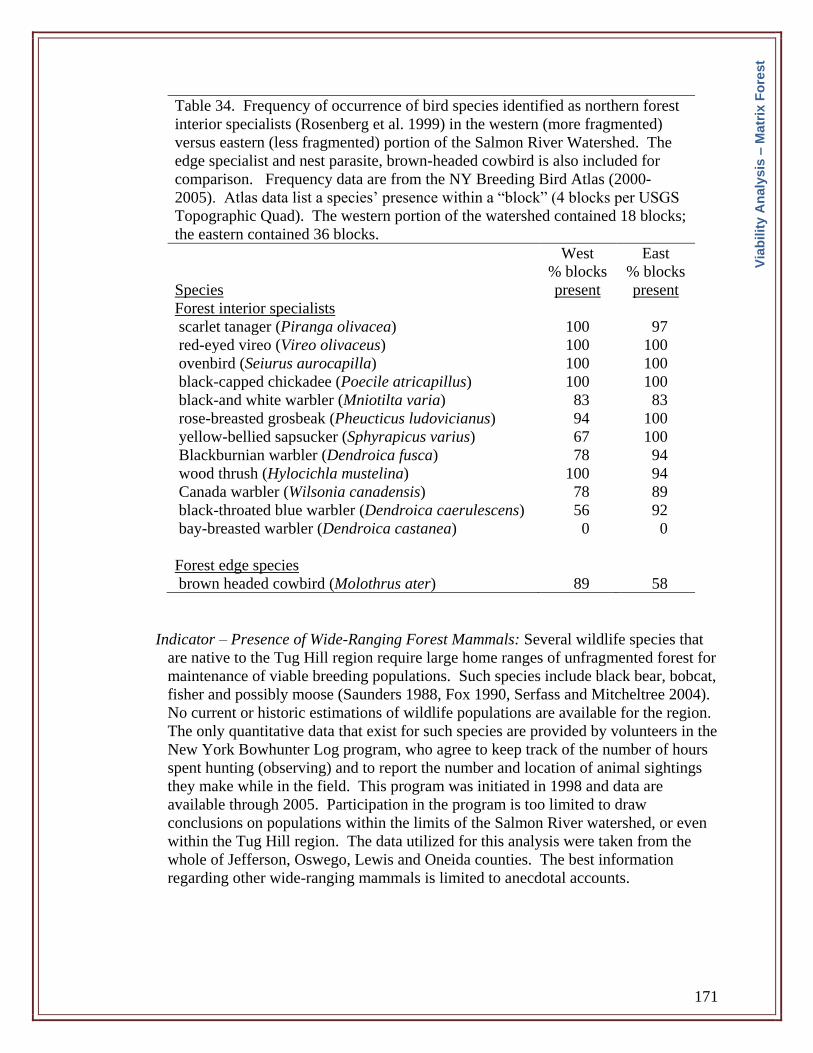
171
Table 34. Frequency of occurrence of bird species identified as northern forest
interior specialists (Rosenberg et al. 1999) in the western (more fragmented)
versus eastern (less fragmented) portion of the Salmon River Watershed. The
edge specialist and nest parasite, brown-headed cowbird is also included for
comparison. Frequency data are from the NY Breeding Bird Atlas (2000-
2005). Atlas data list a species’ presence within a “block” (4 blocks per USGS
Topographic Quad). The western portion of the watershed contained 18 blocks;
the eastern contained 36 blocks.
Species
West
% blocks
present
East
% blocks
present
Forest interior specialists
scarlet tanager (Piranga olivacea) 100 97
red-eyed vireo (Vireo olivaceus) 100 100
ovenbird (Seiurus aurocapilla) 100 100
black-capped chickadee (Poecile atricapillus) 100 100
black-and white warbler (Mniotilta varia) 83 83
rose-breasted grosbeak (Pheucticus ludovicianus) 94 100
yellow-bellied sapsucker (Sphyrapicus varius) 67 100
Blackburnian warbler (Dendroica fusca) 78 94
wood thrush (Hylocichla mustelina) 100 94
Canada warbler (Wilsonia canadensis) 78 89
black-throated blue warbler (Dendroica caerulescens) 56 92
bay-breasted warbler (Dendroica castanea) 0 0
Forest edge species
brown headed cowbird (Molothrus ater) 89 58
Indicator – Presence of Wide-Ranging Forest Mammals: Several wildlife species that
are native to the Tug Hill region require large home ranges of unfragmented forest for
maintenance of viable breeding populations. Such species include black bear, bobcat,
fisher and possibly moose (Saunders 1988, Fox 1990, Serfass and Mitcheltree 2004).
No current or historic estimations of wildlife populations are available for the region.
The only quantitative data that exist for such species are provided by volunteers in the
New York Bowhunter Log program, who agree to keep track of the number of hours
spent hunting (observing) and to report the number and location of animal sightings
they make while in the field. This program was initiated in 1998 and data are
available through 2005. Participation in the program is too limited to draw
conclusions on populations within the limits of the Salmon River watershed, or even
within the Tug Hill region. The data utilized for this analysis were taken from the
whole of Jefferson, Oswego, Lewis and Oneida counties. The best information
regarding other wide-ranging mammals is limited to anecdotal accounts.
Via
bilit
y A
naly
sis
– M
atr
ix F
ore
st
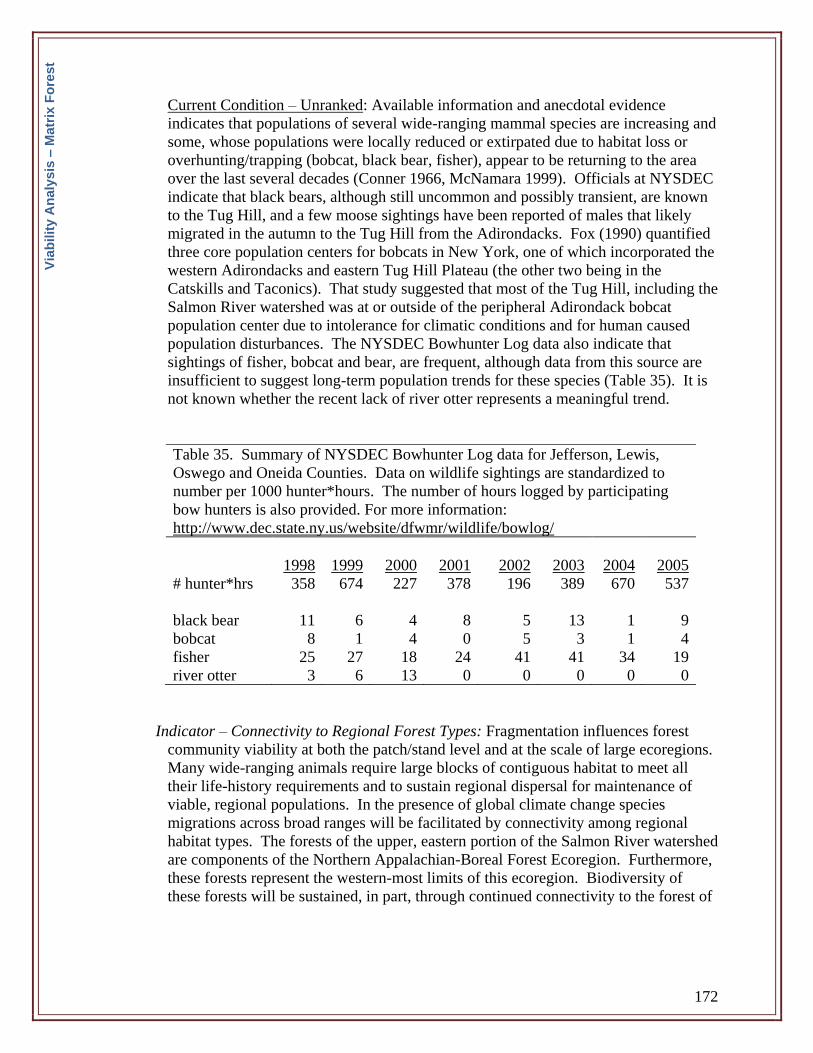
172
Current Condition – Unranked: Available information and anecdotal evidence
indicates that populations of several wide-ranging mammal species are increasing and
some, whose populations were locally reduced or extirpated due to habitat loss or
overhunting/trapping (bobcat, black bear, fisher), appear to be returning to the area
over the last several decades (Conner 1966, McNamara 1999). Officials at NYSDEC
indicate that black bears, although still uncommon and possibly transient, are known
to the Tug Hill, and a few moose sightings have been reported of males that likely
migrated in the autumn to the Tug Hill from the Adirondacks. Fox (1990) quantified
three core population centers for bobcats in New York, one of which incorporated the
western Adirondacks and eastern Tug Hill Plateau (the other two being in the
Catskills and Taconics). That study suggested that most of the Tug Hill, including the
Salmon River watershed was at or outside of the peripheral Adirondack bobcat
population center due to intolerance for climatic conditions and for human caused
population disturbances. The NYSDEC Bowhunter Log data also indicate that
sightings of fisher, bobcat and bear, are frequent, although data from this source are
insufficient to suggest long-term population trends for these species (Table 35). It is
not known whether the recent lack of river otter represents a meaningful trend.
Table 35. Summary of NYSDEC Bowhunter Log data for Jefferson, Lewis,
Oswego and Oneida Counties. Data on wildlife sightings are standardized to
number per 1000 hunter*hours. The number of hours logged by participating
bow hunters is also provided. For more information:
http://www.dec.state.ny.us/website/dfwmr/wildlife/bowlog/
1998 1999 2000 2001 2002 2003 2004 2005
# hunter*hrs 358 674 227 378 196 389 670 537
black bear 11 6 4 8 5 13 1 9
bobcat 8 1 4 0 5 3 1 4
fisher 25 27 18 24 41 41 34 19
river otter 3 6 13 0 0 0 0 0
Indicator – Connectivity to Regional Forest Types: Fragmentation influences forest
community viability at both the patch/stand level and at the scale of large ecoregions.
Many wide-ranging animals require large blocks of contiguous habitat to meet all
their life-history requirements and to sustain regional dispersal for maintenance of
viable, regional populations. In the presence of global climate change species
migrations across broad ranges will be facilitated by connectivity among regional
habitat types. The forests of the upper, eastern portion of the Salmon River watershed
are components of the Northern Appalachian-Boreal Forest Ecoregion. Furthermore,
these forests represent the western-most limits of this ecoregion. Biodiversity of
these forests will be sustained, in part, through continued connectivity to the forest of
Via
bilit
y A
naly
sis
– M
atr
ix F
ore
st
173
the greater Tug Hill region, and likewise to the Adirondack and northern Appalachian
forests. Similarly, forests of the lower, western portion of the watershed represent the
eastern extreme of the Great Lakes Ecoregion (Figure 38), and require connectivity to
other communities within that ecoregion.
Current Condition – Upper sub-watersheds, Good-Fair; Lower sub-watersheds, Poor:
The upper sub-watersheds are embedded within the Tug Hill forest matrix, which
represents a ~150,000-acre roadless region of forests and wetlands. However, the
Tug Hill, itself, is bounded by agriculture in the Black River Valley to the north and
east, and in the Mohawk Valley to the south; by development to the north
(Watertown) and south (Syracuse metropolitan area); and by Oneida Lake to the
south. With the exception of a narrow forested corridor, extending toward the
southwestern Adirondacks, and located south of Booneville and through the Webster
Hill, Jackson Hill, Buck Hill, Clark Hill and Benn Mountain State Forests, there is no
connectivity between the Tug Hill and other components of the Northern
Appalachian-Boreal Forest Ecoregion in the Adirondacks and New York’s Southern
Tier (Figure 38). Forests of the lower sub-watersheds are highly fragmented and
embedded within a matrix of agricultural land use. The Great Lakes forests as a
whole are highly fragmented.
2.7.2.3 KEA: CONDITION – Distribution of Forest Successional Stages
Natural and human-caused forest disturbances reduce competition for resources (soil
nutrients, water, light and space) thereby permitting entry of additional species to a
community. Periodic disturbances of intermediate spatial extent, intensity and return
interval are key natural features in the maintenance of biodiversity. A disturbance regime
consisting of frequent, extensive and intensive disturbances will lead to communities
dominated by ruderal (“weedy” or “invasive”) species that are capable of rapid growth
and reproduction and long-distance dispersal. Disturbance regimes that are infrequent,
small and mild will lead to ecosystems dominated by slow growing species that are
tolerant of low resource availability. However, disturbance regimes that span
intermediate conditions of these extremes permit co-occurrence of species of differing
life histories.
There is virtually no guidance for a successional patch type distribution that would
optimize biodiversity at a landscape scale. The current landscapes of the Tug Hill and
Salmon River watershed very likely have greater diversities of forest age classes today
than before European settlement when disturbance regimes were controlled primarily by
natural events (wind, ice, frontal winds). Clearing for agriculture and intensive logging
during the mid- to late-19th
century increased the abundance of early successional
community types, thereby providing opportunities for grasslands and shrub lands to
establish along with the variety of birds, mammals and insects that flourish in these
communities, including pheasant, woodcock, grouse, hare, cottontail rabbit, and
numerous songbirds (e.g., Chambers 1983, Keller et al 2003, PADCNR 2007).
Via
bilit
y A
naly
sis
– M
atr
ix F
ore
st
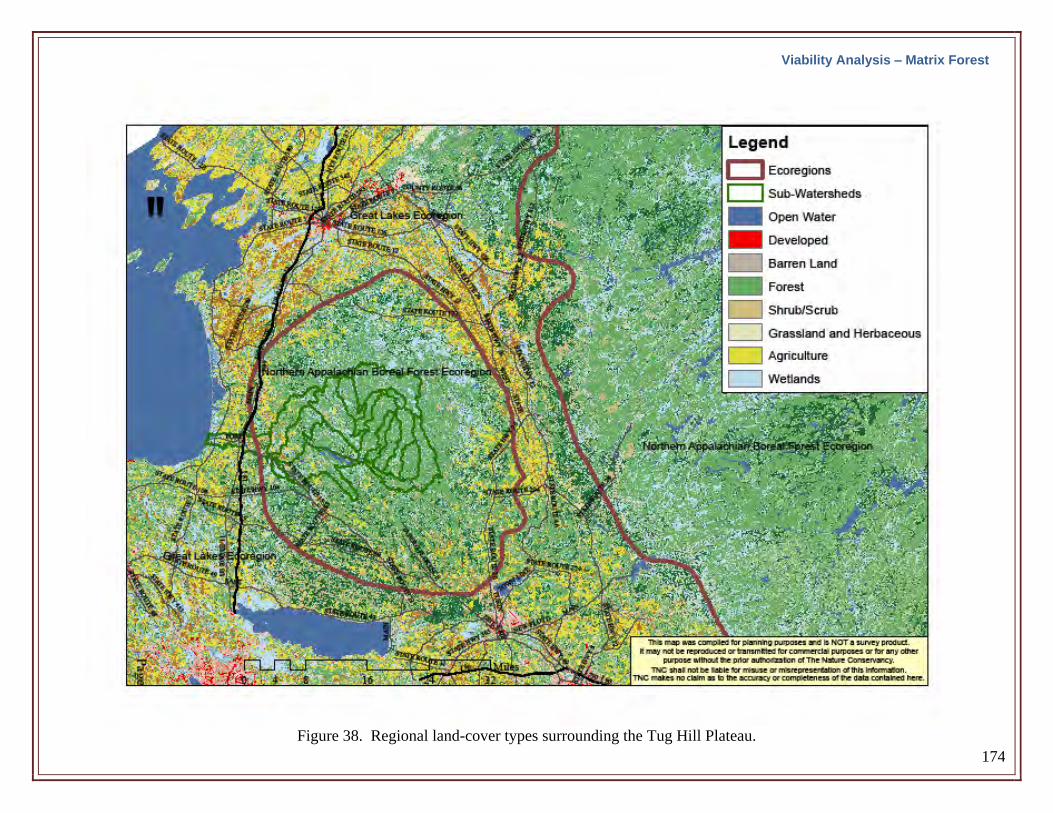
174
Figure 38. Regional land-cover types surrounding the Tug Hill Plateau.
Viability Analysis – Matrix Forest
175
Importantly, grasslands that are maintained open, but not regularly mowed, provide
critical habitat for some species that are not common to the region due to the natural lack
of grassland communities in the region, reversion of open fields to woodlands due to
agricultural abandonment, and the fragmentation or development of those grasslands that
remain.
Indicator – Forest Stand-Size Class Distributions: Forest stands are traditionally
categorized into stand-size classes that can be used to provide limited guidance on
developmental stage of the stand. Periodic forest monitoring of permanent plots is
conducted nationally by the US Forest Service Forest Inventory and Analysis (FIA)
Program (USDA Forest Service 2007). Among the data included in this inventory are
those necessary to define the following forest stand-size classes (Alerich and Drake
1995):
-Sapling stand: a stand with at least half the live trees as saplings (1-4.9”
diameter) or seedlings.
-Poletimber stand: a stand with half or more of the live trees as poletimber trees
(5-9” for softwoods; 5-11” for hardwoods) or sawtimber trees (>9” dia for
softwoods, >11” dia for hardwoods) and in which poletimber stocking exceeds
that of sawtimber.
-Sawtimber stand: a stand with half or more of the live trees as poletimber or
sawtimber trees, and in which stocking of sawtimber trees is equal to or greater
than poletimber trees.
The sample size of FIA plots within the Salmon River watershed is not large enough
to draw accurate conclusions regarding specific forest conditions there. However,
assuming that conditions within the Salmon River watershed reflect those of the
greater Tug Hill region, these data can be used to draw inferences regarding changes
in forest developmental stages across the Tug Hill and, therefore, within the
watershed. Furthermore, the current regional stand-size class distribution for the Tug
Hill can be compared to that estimated about 35 years ago by Geis et al. (1974). That
estimation utilized land classification data compiled on a town-wide basis through the
Land Use and Natural Resource Inventory program (LUNR) of the New York State
Office of Planning Services (NYSOPS 1972). By combining US Forest Service
timber inventory data for “commercial forest land” reported on a county-wide level
for Jefferson, Lewis, Oneida and Oswego Counties (Ferguson and Mayer 1970) with
town-wide estimates of land uses falling within the definition of “commercial forest
land” (mature forest, forest brushland, plantations, inactive agriculture) for those
towns within the Tug Hill region, Geis et al. (1974) estimated the stand-size class
distribution for the towns of the Tug Hill. Comparable county-wide timber resource
data from 2004 were obtained from the US Forest Service FIA program and
combined with the 2001 National Land Cover Data to provide an updated analysis
similar to that of Geis et al. (1974).
Via
bilit
y A
naly
sis
– M
atr
ix F
ore
st
176
Deviation from expected size class distributions provide insight to differences in
extent and intensity of disturbance regimes relative to expected natural regimes.
Frelich and Lorimer (1991a, 1991b) estimated that 73% of the area in northern
hardwood landscapes subjected to natural disturbance regimes would be maintained
as mature, multi-aged sawtimber (with 4% representing old, multi-aged forests); 20%
as multi-aged, pole-size stands; 7% as even-aged sapling, pole or small sawtimber
stands.
Current Condition – Unranked: The Frelich and Lorimer (1991a, 1991b) studies
provide a model against which observed forest stand-size class distributions can be
compared. However the FIA data are not sufficient to discern several categories such
as “old, multi-aged sawtimber,” “mature, multi-aged sawtimber” and “even aged
small sawtimber.” Even still, this analysis reveals recent (30- to 40-year), regional
trends in the forest stand-size class distribution. Figure 39 illustrates the estimated
1968 and 2004 stand-size class distributions for towns in Jefferson, Lewis, Oneida
and Oswego counties that fall within the limits of the Tug Hill. These data indicate
that the overall amount of commercial forest land did not change appreciably during
this time. However, these data illustrate an overall trend in forest maturation during
this period; a trend that was initiated with widespread agricultural abandonment in the
early 20th
century. Substantial areas of sapling- and poletimber-size classes have
advanced to sawtimber-size stands. Figure 40 presents the same stand-size class
distributions from 1968 and 2004 as percentages of total available commercial forest
land, and compares these distributions to the Frelich and Lorimer (1991a, 1991b)
model distribution for natural northern hardwood forest landscapes. This figure
illustrates that the current regional forest stand-size class distribution is closer than
the 1968 distribution to one that reflects natural disturbance regimes for northern
hardwood forest types.
Via
bilit
y A
naly
sis
– M
atr
ix F
ore
st
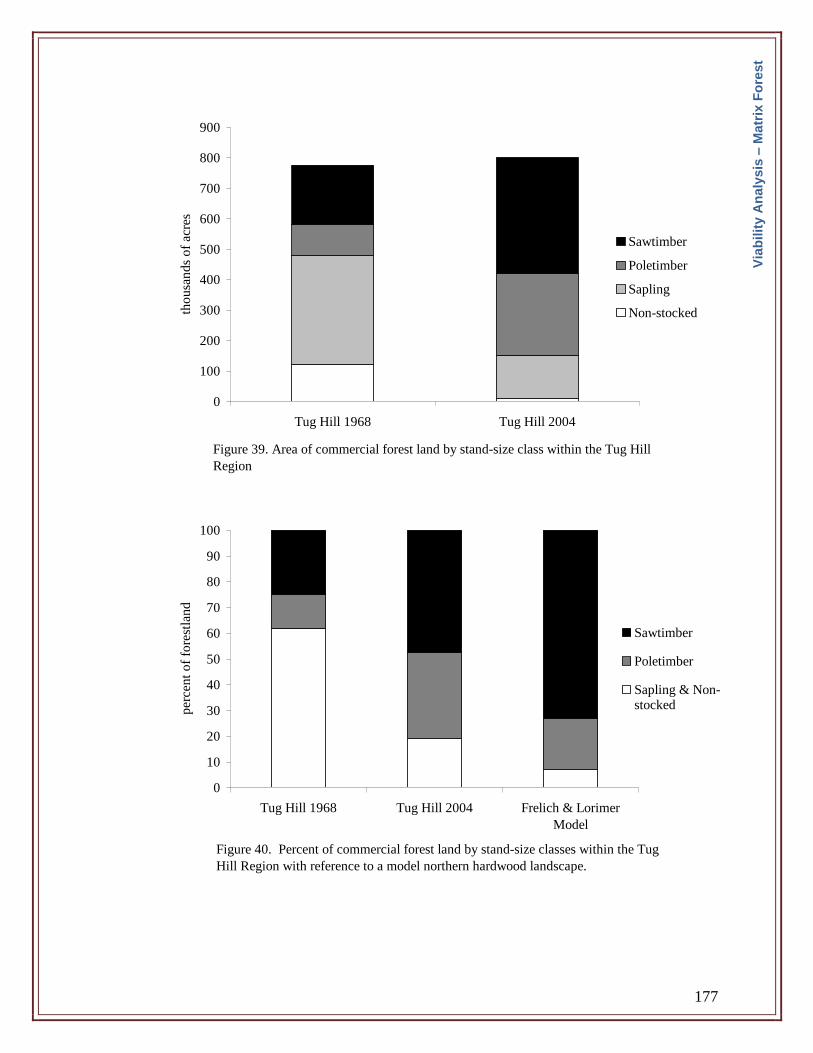
177
Figure 39. Area of commercial forest land by stand-size class within the Tug Hill
Region
0
100
200
300
400
500
600
700
800
900
Tug Hill 1968 Tug Hill 2004
tho
usa
nd
s o
f ac
res
Sawtimber
Poletimber
Sapling
Non-stocked
Figure 40. Percent of commercial forest land by stand-size classes within the Tug
Hill Region with reference to a model northern hardwood landscape.
0
10
20
30
40
50
60
70
80
90
100
Tug Hill 1968 Tug Hill 2004 Frelich & Lorimer
Model
per
cen
t o
f fo
rest
lan
d
Sawtimber
Poletimber
Sapling & Non-stocked
Via
bilit
y A
naly
sis
– M
atr
ix F
ore
st
178
Indicator – Early Successional Community Cover (ac) and Percent Cover: Estimates
of total and percent cover of early successional communities (inactive grassland and
shrub land) is a direct measure of the abundance of these habitats in the landscape.
However, there are no historic estimates of the abundance of these habitats under
natural disturbance regimes for the region, nor were any records obtained that provide
estimates of regional historic maximums for early successional communities at the
turn of the 20th
century.
Current Condition – Good: Shrub lands and inactive grasslands occupy
approximately 11% (~5800 ac) and 4% (~5000) of the lower and upper sub-
watersheds, respectively (Table 31). The current total area of early successional
habitat is undoubtedly lower than the historic maximum in the late 19th
and early 20th
centuries when farmland was widely abandoned on marginal sites, but probably
higher than conditions under natural disturbance regimes.
The USDA Grassland Reserve Program (GRP) offers landowners the opportunity to
protect or rehabilitate grasslands on their property. The NYSDEC, in conjunction
with the USDA, has identified critical areas within New York (“Grassland Wildlife
Zones”) where landowners are encouraged to manage their properties for grassland
habitat. There are no Grassland Reserve Zones within the Salmon River watershed
(Figure 41), indicating that the watershed has low potential for management of
natural grassland habitat.
Indicator – Grassland Bird Species Occurrence: The New York State Landowner
Incentive Grassland Protection Program (NYSDEC 2007c) identifies nine grassland
bird species that are known to be in decline in New York since 1966, eight of which
occur historically in the Salmon River watershed. No data exist on actual population
sizes of these species, nor do any baseline data exist suggesting their historic
abundance in the region. New York Breeding Bird Atlas census data can be used to
determine their relative abundance within the watershed.
Current Condition - Unranked: Table 36 presents the frequency of occurrence for the
eight grassland species identified by the NY Landowner Incentive Grassland
Protection Program in the upper and lower portions of the watershed. Total
occurrences of these species were greater in the western portion of the watershed
relative to the eastern, reflecting the greater abundance of early successional
communities there.
Via
bilit
y A
naly
sis
– M
atr
ix F
ore
st
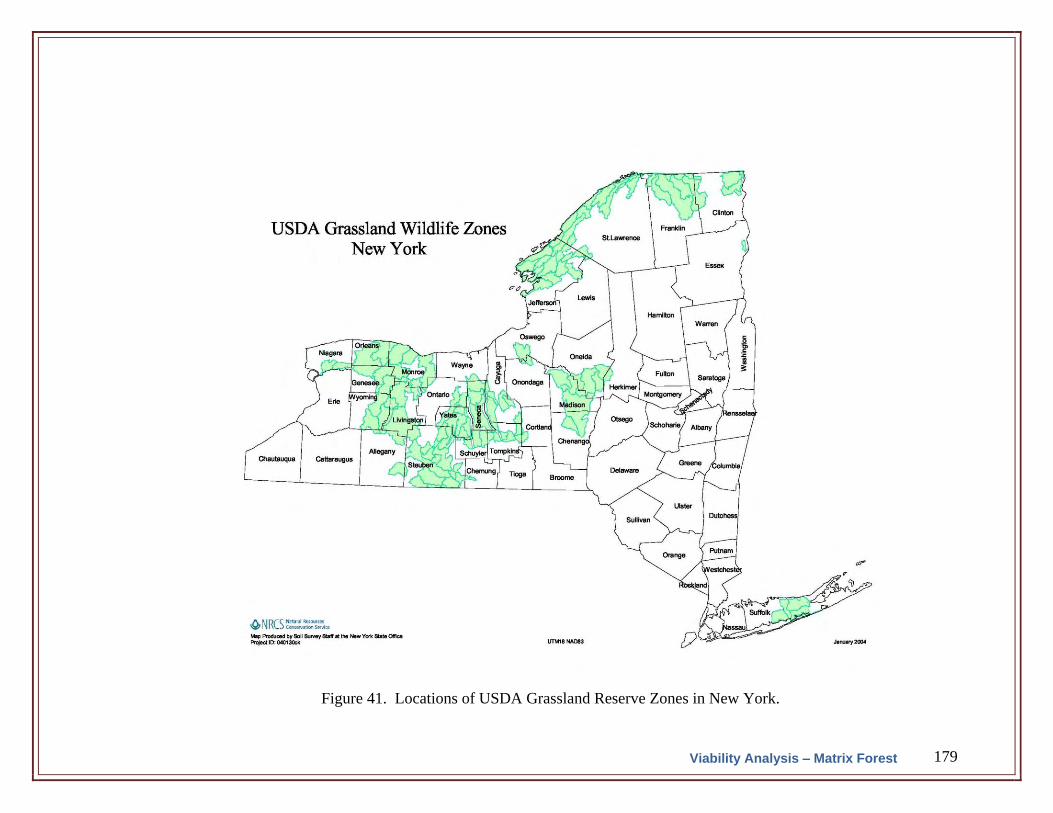
179
Figure 41. Locations of USDA Grassland Reserve Zones in New York.
Viability Analysis – Matrix Forest
180
Table 36. Frequency of occurrence of grassland bird
species (NY Landowner Incentive Grassland Protection
Program) in the Salmon River watershed. Data are from
the New York Breeding Bird Atlas (2000-2005). Census
blocks were partitioned into lower (n=18) and upper
(n=36) portions of the watershed roughly at the Salmon
River reservoir.
Lower
Watershed
Upper
Watershed
Henslow’s sparrow
(Ammodramus henslowii)
0 0
grasshopper sparrow
(Ammodramus savannarum)
17 8
vesper sparrow
(Pooecetes gramineus)
28 6
horned lark
(Eremophila alpestris)
6 0
eastern meadowlark
(Sturnella magna)
50 11
savannah sparrow
(Passerculus sandwichensis)
89 36
northern harrier
(Circus cyaneus)
28 3
bobolink
(Dolichonyx oryzivorus)
83 31
2.7.2.4 KEA: CONDITION – Forest Structural Diversity
Terrestrial and aquatic ecologists have long recognized that habitat heterogeneity is
important for maintaining biodiversity. This is readily observable through the
distribution of community types and individual species across a landscape such as the
Tug Hill, which has complex soils and hydrologic regimes (e.g., Hotchkiss 1932, Geis et
al. 1974, Howard 2006). A variety of forest “patch types” or successional stages (e.g.,
grasslands; shrub lands; and sapling, pole, and sawtimber forest size classes) provide
intermediate-scale habitat heterogeneity that supports greater diversity of plants and
animals than an equal area of a single patch type (Chambers 1983, Keller et al 2003).
Finally, within patches, structural complexity associated with tree diameter distributions,
decaying logs of different species and decay stages, and standing dead trees provides
additional habitat heterogeneity that maintains populations of numerous organisms that
Via
bilit
y A
naly
sis
– M
atr
ix F
ore
st
181
rely on such structural features (e.g., Chambers 1983, Harmon et al. 1986, Hansen et al.
1991, DeGraaf et al. 1992, McGee and Kimmerer 2002, Root et al. 2007ab).
Indicator – Large Tree Densities: Large, old trees, whether they occur in natural,
unmanaged forests, or in selection or reserve shelterwood stands provide unique and
necessary habitat for a number of arboreal taxa such as lichens (Root et al. 2007a),
oribatid mites (Root et al. 2007b), bryophytes (McGee and Kimmerer 2002),
myxomycetes (Stephenson 1989), and large cavity-nesting or roosting birds and
mammals (Chamber 1983, DeGraaf et al. 1992). The minimum density of large trees
(i.e., >20 inches dbh) required to sustain viable populations of species that utilize
them (many of which are small and dispersal limited) is not known, and is probably
influenced by a variety of interacting factors. Under historic, natural disturbance
regimes in northern hardwood forests (as estimated by Runkle 1982, Frelich and
Lorimer 1991a), densities of large trees average approximately 20 trees/ac ≥ 20”dbh
(McGee et al. 1999). Widely applied selection system cutting guides developed for
northern hardwood forests recommend 8 trees/ac ≥ 20”dbh (Arbogast 1957) and
northern hardwood stands in the central Adirondacks and in Cortland County have
been managed under selection system for sawtimber while maintaining approximately
7-10 trees/ac ≥ 20” dbh (Bohn and Nyland 2006).
Table 37. Criteria for ranking forest structural diversity viability based upon live,
large tree (>20” dbh) densities.
Large Tree Densities
Poor
Fair
Good
Excellent
Number of trees >20” dbh per acre 0-2 3-6 7-10 >10
Current Condition – Fair: The only data available on live canopy tree diameter
distributions for the watershed are from 44 northern hardwood sites located across the
Tug Hill region, extending into the watershed to approximately Redfield (McGee
unpublished). These measurements were taken at randomly located plots on lands
owned by The Nature Conservancy, NYSDEC East Branch Fish Creek Conservation
Easement Lands, and NYSDEC State Forests and Wildlife Management Areas. The
average live tree density (>4” dbh) is 220 trees per acre, with an average of 3
trees/acre greater than 20” dbh (Figure 42). No data were located that describe
canopy structure in the Lake Plain forests in the lower sub-watersheds.
Via
bilit
y A
naly
sis
– M
atr
ix F
ore
st
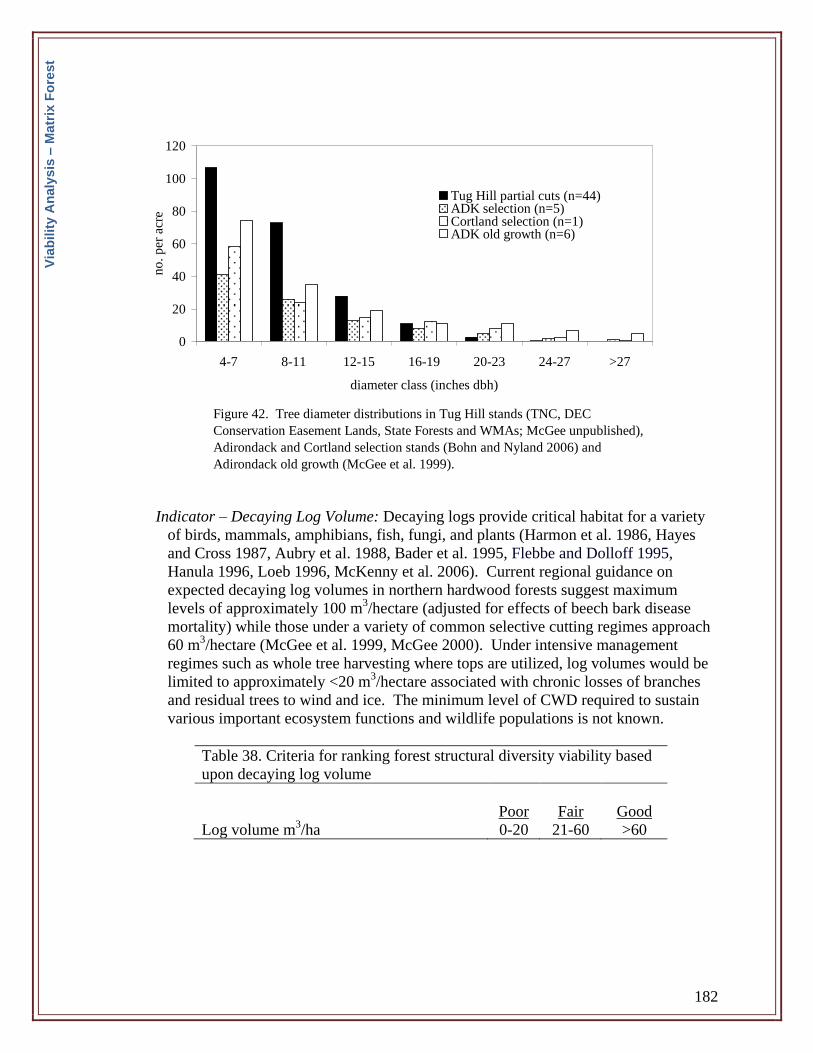
182
Indicator – Decaying Log Volume: Decaying logs provide critical habitat for a variety
of birds, mammals, amphibians, fish, fungi, and plants (Harmon et al. 1986, Hayes
and Cross 1987, Aubry et al. 1988, Bader et al. 1995, Flebbe and Dolloff 1995,
Hanula 1996, Loeb 1996, McKenny et al. 2006). Current regional guidance on
expected decaying log volumes in northern hardwood forests suggest maximum
levels of approximately 100 m3/hectare (adjusted for effects of beech bark disease
mortality) while those under a variety of common selective cutting regimes approach
60 m3/hectare (McGee et al. 1999, McGee 2000). Under intensive management
regimes such as whole tree harvesting where tops are utilized, log volumes would be
limited to approximately <20 m3/hectare associated with chronic losses of branches
and residual trees to wind and ice. The minimum level of CWD required to sustain
various important ecosystem functions and wildlife populations is not known.
Table 38. Criteria for ranking forest structural diversity viability based
upon decaying log volume
Poor
Fair
Good
Log volume m3/ha 0-20 21-60 >60
Figure 42. Tree diameter distributions in Tug Hill stands (TNC, DEC
Conservation Easement Lands, State Forests and WMAs; McGee unpublished),
Adirondack and Cortland selection stands (Bohn and Nyland 2006) and
Adirondack old growth (McGee et al. 1999).
0
20
40
60
80
100
120
4-7 8-11 12-15 16-19 20-23 24-27 >27
diameter class (inches dbh)
no
. p
er a
cre
Tug Hill partial cuts (n=44)ADK selection (n=5)Cortland selection (n=1)ADK old growth (n=6)
Via
bilit
y A
naly
sis
– M
atr
ix F
ore
st
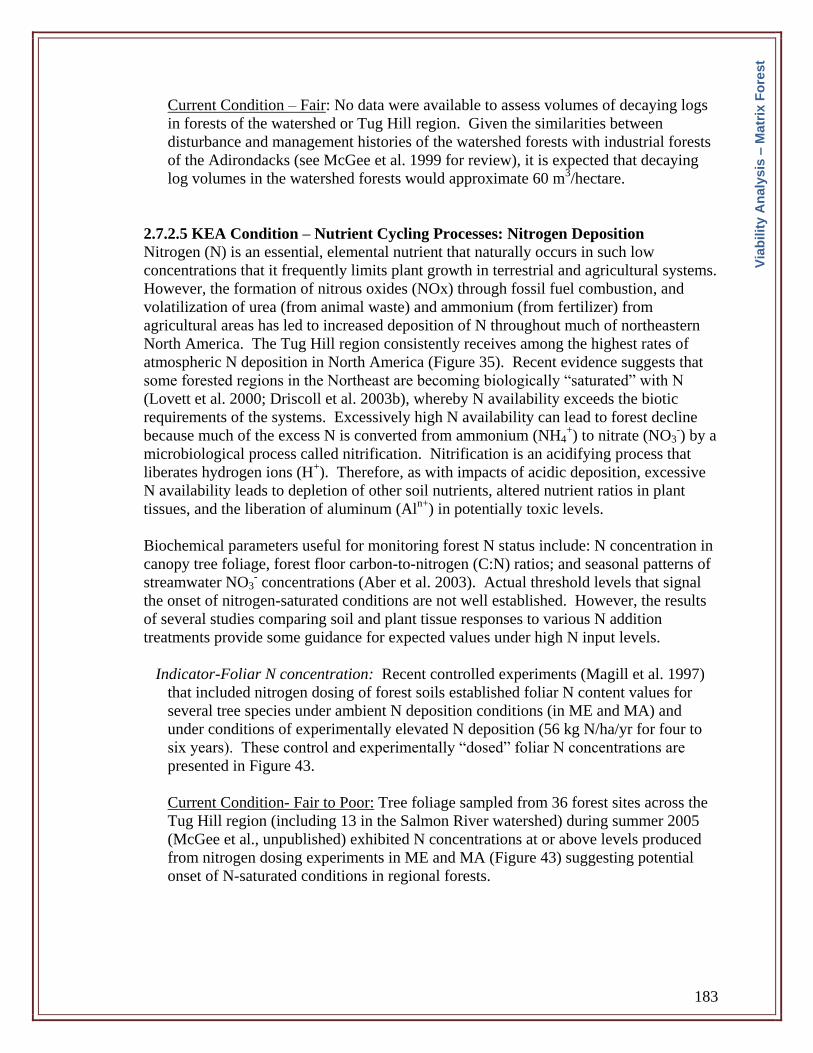
183
Current Condition – Fair: No data were available to assess volumes of decaying logs
in forests of the watershed or Tug Hill region. Given the similarities between
disturbance and management histories of the watershed forests with industrial forests
of the Adirondacks (see McGee et al. 1999 for review), it is expected that decaying
log volumes in the watershed forests would approximate 60 m3/hectare.
2.7.2.5 KEA Condition – Nutrient Cycling Processes: Nitrogen Deposition
Nitrogen (N) is an essential, elemental nutrient that naturally occurs in such low
concentrations that it frequently limits plant growth in terrestrial and agricultural systems.
However, the formation of nitrous oxides (NOx) through fossil fuel combustion, and
volatilization of urea (from animal waste) and ammonium (from fertilizer) from
agricultural areas has led to increased deposition of N throughout much of northeastern
North America. The Tug Hill region consistently receives among the highest rates of
atmospheric N deposition in North America (Figure 35). Recent evidence suggests that
some forested regions in the Northeast are becoming biologically “saturated” with N
(Lovett et al. 2000; Driscoll et al. 2003b), whereby N availability exceeds the biotic
requirements of the systems. Excessively high N availability can lead to forest decline
because much of the excess N is converted from ammonium (NH4+) to nitrate (NO3
-) by a
microbiological process called nitrification. Nitrification is an acidifying process that
liberates hydrogen ions (H+). Therefore, as with impacts of acidic deposition, excessive
N availability leads to depletion of other soil nutrients, altered nutrient ratios in plant
tissues, and the liberation of aluminum (Aln+
) in potentially toxic levels.
Biochemical parameters useful for monitoring forest N status include: N concentration in
canopy tree foliage, forest floor carbon-to-nitrogen (C:N) ratios; and seasonal patterns of
streamwater NO3- concentrations (Aber et al. 2003). Actual threshold levels that signal
the onset of nitrogen-saturated conditions are not well established. However, the results
of several studies comparing soil and plant tissue responses to various N addition
treatments provide some guidance for expected values under high N input levels.
Indicator-Foliar N concentration: Recent controlled experiments (Magill et al. 1997)
that included nitrogen dosing of forest soils established foliar N content values for
several tree species under ambient N deposition conditions (in ME and MA) and
under conditions of experimentally elevated N deposition (56 kg N/ha/yr for four to
six years). These control and experimentally “dosed” foliar N concentrations are
presented in Figure 43.
Current Condition- Fair to Poor: Tree foliage sampled from 36 forest sites across the
Tug Hill region (including 13 in the Salmon River watershed) during summer 2005
(McGee et al., unpublished) exhibited N concentrations at or above levels produced
from nitrogen dosing experiments in ME and MA (Figure 43) suggesting potential
onset of N-saturated conditions in regional forests.
Via
bilit
y A
naly
sis
– M
atr
ix F
ore
st
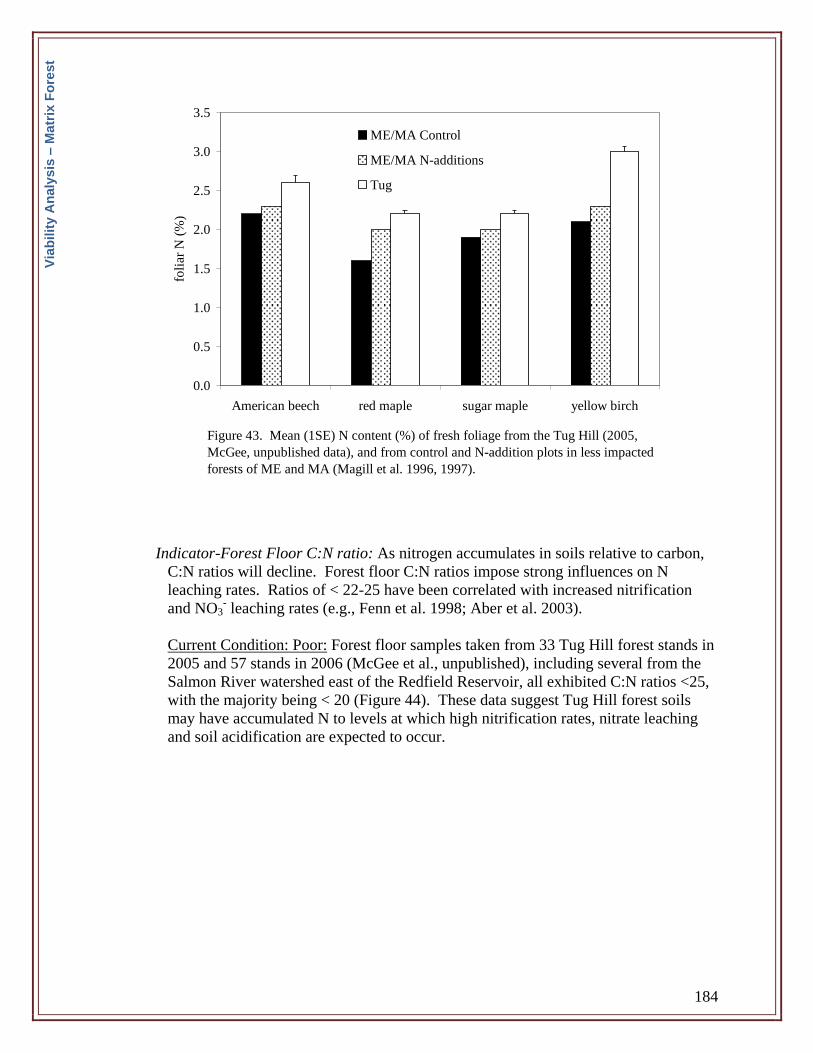
184
Indicator-Forest Floor C:N ratio: As nitrogen accumulates in soils relative to carbon,
C:N ratios will decline. Forest floor C:N ratios impose strong influences on N
leaching rates. Ratios of < 22-25 have been correlated with increased nitrification
and NO3- leaching rates (e.g., Fenn et al. 1998; Aber et al. 2003).
Current Condition: Poor: Forest floor samples taken from 33 Tug Hill forest stands in
2005 and 57 stands in 2006 (McGee et al., unpublished), including several from the
Salmon River watershed east of the Redfield Reservoir, all exhibited C:N ratios <25,
with the majority being < 20 (Figure 44). These data suggest Tug Hill forest soils
may have accumulated N to levels at which high nitrification rates, nitrate leaching
and soil acidification are expected to occur.
Figure 43. Mean (1SE) N content (%) of fresh foliage from the Tug Hill (2005,
McGee, unpublished data), and from control and N-addition plots in less impacted
forests of ME and MA (Magill et al. 1996, 1997).
0.0
0.5
1.0
1.5
2.0
2.5
3.0
3.5
American beech red maple sugar maple yellow birch
foli
ar N
(%
)
ME/MA Control
ME/MA N-additions
Tug
Via
bilit
y A
naly
sis
– M
atr
ix F
ore
st
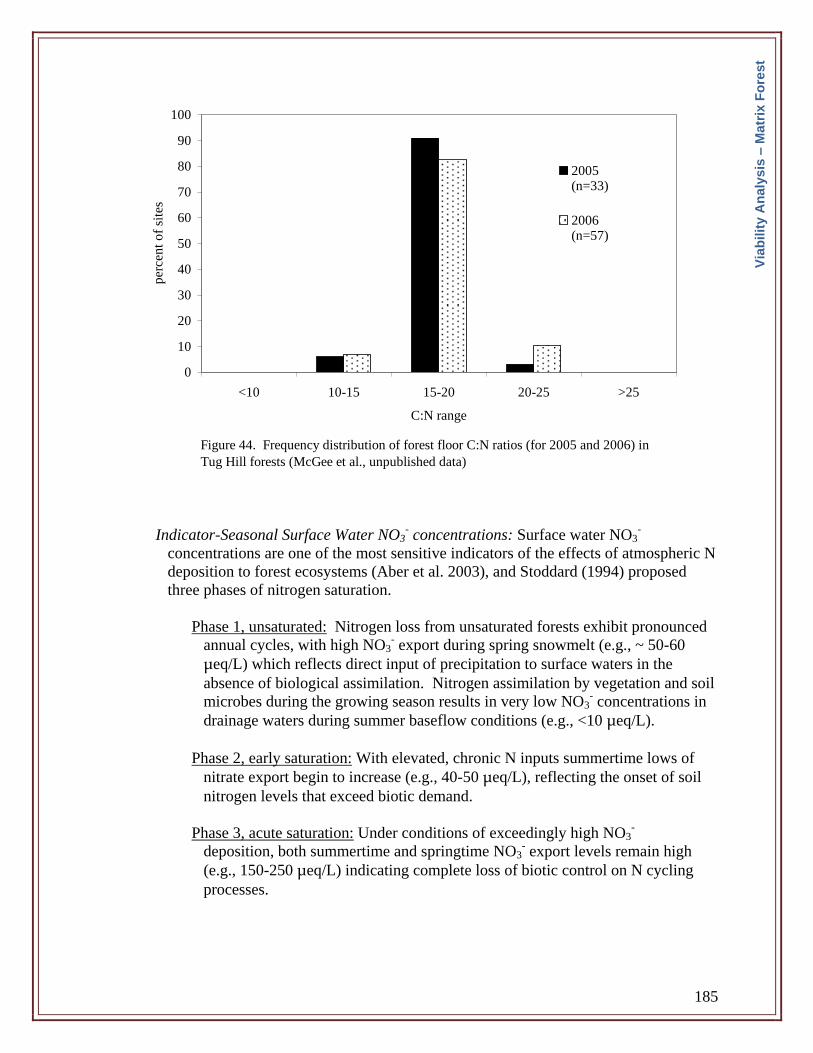
185
Indicator-Seasonal Surface Water NO3- concentrations: Surface water NO3
-
concentrations are one of the most sensitive indicators of the effects of atmospheric N
deposition to forest ecosystems (Aber et al. 2003), and Stoddard (1994) proposed
three phases of nitrogen saturation.
Phase 1, unsaturated: Nitrogen loss from unsaturated forests exhibit pronounced
annual cycles, with high NO3- export during spring snowmelt (e.g., ~ 50-60
μeq/L) which reflects direct input of precipitation to surface waters in the
absence of biological assimilation. Nitrogen assimilation by vegetation and soil
microbes during the growing season results in very low NO3- concentrations in
drainage waters during summer baseflow conditions (e.g., <10 μeq/L).
Phase 2, early saturation: With elevated, chronic N inputs summertime lows of
nitrate export begin to increase (e.g., 40-50 μeq/L), reflecting the onset of soil
nitrogen levels that exceed biotic demand.
Phase 3, acute saturation: Under conditions of exceedingly high NO3-
deposition, both summertime and springtime NO3- export levels remain high
(e.g., 150-250 μeq/L) indicating complete loss of biotic control on N cycling
processes.
Figure 44. Frequency distribution of forest floor C:N ratios (for 2005 and 2006) in
Tug Hill forests (McGee et al., unpublished data)
0
10
20
30
40
50
60
70
80
90
100
<10 10-15 15-20 20-25 >25
C:N range
per
cen
t o
f si
tes
2005(n=33)
2006(n=57)
Via
bilit
y A
naly
sis
– M
atr
ix F
ore
st

186
Current Condition: Good to Fair: Headwater streams in the Tug Hill region
exhibited an average ( 1 SE) of 24 2 μeq/L NO3- (range: 2-80) during spring
2006 and 12 1 μeq/L NO3- (range: 2-39) during the summer 2006 (McGee et al.,
unpublished data). Somewhat elevated NO3- concentrations (10-40 μeq/L) in
several of the summer samples suggest the potential for some headwaters within
the region to be entering the early stages of N saturation.
2.7.2.6 KEA Condition – Nutrient Cycling Processes: Acidification
Acidic deposition leads to the leaching of several base cation mineral nutrients (e.g.,
calcium (Ca2+
), magnesium (Mg2+
) and potassium (K+). Soil nutrient depletion, in turn,
leads to foliar Mg2+
and Ca2+
deficiencies and increased solubility of Aln+
, which causes
dysfunction to plant root systems. These conditions predispose forests to decline from
multiple stresses including drought, insect defoliation and freezing damage (Bailey et al.
2004; Horsley et al. 1999; Shortle et al. 1997). Acid-induced losses of calcium from
forest soils have also been implicated in the decline of forest-dwelling species with high
reliance on calcium for egg shells or carapaces (e.g., terrestrial snails).
Indicator – Soil pH: Soil pH is a direct measure of soil acidity. However, soil pH is a
function of base cation availability in soil parent material, and many of the regional
soils are naturally acidic (ranging to extremely acidic, pH<4.5, NCSS 1981). Despite
this natural acidity, pH can still be used to suggest the resilience of soils to additional
acidifying processes.
Current Condition – Upper sub-watersheds, Fair; Lower sub-watersheds, Good :
Upland forest and agricultural soils in the higher, eastern sub-watersheds are
generally strongly to extremely acid (e.g., Worth-Empeyville, Westbury and Colton-
Hinkley soil series) owing in large part to naturally low buffering capacity of the
material from which the soils formed. Soils dominating the cultivated and forested
uplands of the western sub-watersheds are generally better buffered, and range from
strongly- and medium-acid to neutral or slightly alkaline. Therefore the soils of the
lower sub-watersheds generally have better buffering capacity against detrimental
impacts of acidic deposition.
Indicator-Foliar Ca:Al Ratio: With acid-induced leaching of base cations from soils
and increased solubility of Aln+
in soil solution, foliar Ca:Al ratios will decline. Aber
et al. (1995) and Magill et al. (1997) reported foliar Ca:Al ratios in northern
hardwood forest sites in ME and MA on acid soils. These sites included experimental
controls and plots that were further acidified through N fertilization. They found
Ca:Al ratios of ~300-550 (depending on species) on control plots and ~200-450
(depending on species) on experimentally acidified plots.
Via
bilit
y A
naly
sis
– M
atr
ix F
ore
st
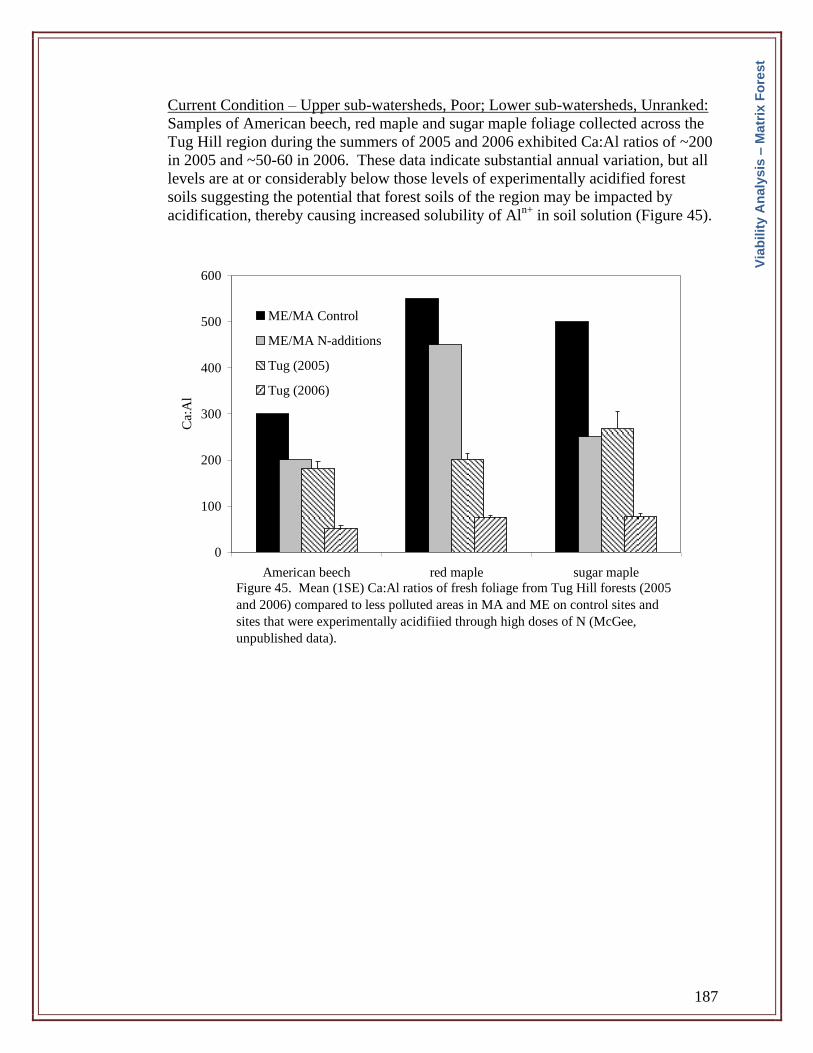
187
Current Condition – Upper sub-watersheds, Poor; Lower sub-watersheds, Unranked:
Samples of American beech, red maple and sugar maple foliage collected across the
Tug Hill region during the summers of 2005 and 2006 exhibited Ca:Al ratios of ~200
in 2005 and ~50-60 in 2006. These data indicate substantial annual variation, but all
levels are at or considerably below those levels of experimentally acidified forest
soils suggesting the potential that forest soils of the region may be impacted by
acidification, thereby causing increased solubility of Aln+
in soil solution (Figure 45).
Figure 45. Mean (1SE) Ca:Al ratios of fresh foliage from Tug Hill forests (2005
and 2006) compared to less polluted areas in MA and ME on control sites and
sites that were experimentally acidifiied through high doses of N (McGee,
unpublished data).
0
100
200
300
400
500
600
American beech red maple sugar maple
Ca:
Al
ME/MA Control
ME/MA N-additions
Tug (2005)
Tug (2006)
Via
bilit
y A
naly
sis
– M
atr
ix F
ore
st
188
2.7.2.7 KEA Condition – Toxins.
An environmental toxin of growing national interest is mercury (Hg). In its biologically
active form (methyl-mercury, MeHg) this element bioaccumulates in the food chain,
thereby causing greater exposure to higher-level carnvivores. Mercury is a neurotoxin
that leads to reduced reproductive success and impaired motor skills in wildife and
humans (Driscoll et al. 2007). Mercury enters forest ecosystems by uptake of gaseous Hg
through pores in leaves, where it then passes into the food chain through decomposition
of leaf litter by detritivores such as slugs, snails, woodlice and millipedes. These
invertebrates are then consumed by predaceous invertebrates such as centipedes and
spiders, which are in turn consumed by foraging birds, and importantly, by ground
foraging birds such as the wood thrush (Evers and Duron 2006).
Indicator-Insectivorous Bird Blood Mercury Concentration: Blood mercury
concentration is a direct indicator of cumulative exposure to mercury. Ground-
foraging woodland species such as wood thrush are at greatest risk of exposure.
Table 39. Criteria for ranking blood mercury concentration in woodland
birds (based on thresholds leading to risk of negative reproductive impacts,
Evers and Duron 2006).
good fair Poor
blood Hg concentration ( g/g) <1 1 1.4
risk of negative reproductive impacts low likely High
Current Condition - Good: In a survey across New York and Pennsylvania, including
a site in the Tug Hill region, blood mercury concentration of wood thrushes was
found to be above expected levels for uncontaminated sites, but still below levels that
would cause negative reproductive impacts (Evers and Duron 2006).
2.7.2.8 KEA Condition – Forest Understory Community Composition and Diversity
A number of factors influence the composition and diversity of native forest understory
vascular plants. First, site conditions (moisture and nutrient availability) importantly
influence the suite of species that occupy a particular location based upon their respective
tolerance for limited moisture and nutrients. Past disturbance history also influences
understory plant composition. Past agricultural activities, such as cultivation and
pasturing, are known to reduce the number and types of species that occur in second-
growth forests that reestablish on abandoned agricultural lands. Natural and human
canopy disturbances also influence the abundance and composition of understory plants
by altering resource (i.e., light, soil moisture and nutrients) availability in the understory.
Intense canopy disturbances or repeated low intensity disturbances favor the
establishment of more competitive, shade-intolerant, and invasive species.
Via
bilit
y A
naly
sis
– M
atr
ix F
ore
st
189
Indicator – Invasive Plant Species Frequencies of Occurrence: Invasive species are those
non-native organisms whose introduction to an ecosystem causes or is likely to cause
economic or environmental harm (NYSISTF 2005). Many invasive plant species are
competitive or weedy plants that are able to displace others, thereby reducing diversity of
other plants and organisms that rely on a diverse assemblage of plants. The frequency of
occurrence of an invasive species within an area of interest, and/or the density or percent
cover within communities when they occur are indicators of the local distribution and
degree of community dominance by invasive species. Table 4 ranks community
composition based upon the frequency of occurrence or dominance of invasive species.
Current Condition – Upper sub-watersheds, Good; Lower sub-watersheds, Unranked:
There is currently no comprehensive list of invasive plant species in New York, but
the New York State Invasive Species Task Force and the Adirondack Park Invasive
Plant Program offer guidance for some species to monitor on a local or regional basis
(Table 40). There are currently no efforts to systematically monitor invasive plants
within the Salmon River watershed or greater Tug Hill region, and few data sources
are available with which to gauge distribution of invasives within the watershed. In
an October, 2001 survey of the Salmon River greenway corridor (Dru Assoc., 2001),
field biologists completed NY Natural Heritage reporting forms for 36 upland
hardwood and conifer plantation sites. No invasive plant species were recorded on
these Heritage reporting forms, but a few invasive species were included in the flora
checklist for the corridor’s study area (Table 40). McGee (unpublished data) reported
no invasive plant species on 49 upland forest sites on NY State and private lands
across the Tug Hill (including several in the Salmon River watershed east of the
Redfield Reservoir). McGee’s survey excluded sites within 100 m of a road and
therefore was biased against encountering invasive species. These surveys suggest
that, although terrestrial invasive plant species are present within the watershed, they
are not dominant components of the forest flora. Other species are known,
anecdotally, to occur within the watershed (J. Chairvolotti personal communication,
Table 40) but quantitative information regarding their frequencies of occurrence or
local dominance is not available. Information regarding invasive plant occurrences in
forests of the lower sub-watersheds is especially lacking.
Via
bilit
y A
naly
sis
– M
atr
ix F
ore
st
190
Table 40. Terrestrial invasive plants currently monitored by the Adirondack Park
Invasive Plant Program (APIPP 2007). Known occurrences within the Salmon
River Watershed are denoted by a letter referencing a specific source.
Common Name
Scientific Name
Present
in
Watershed
garlic mustard
Russian and autumn olive
fly and Tatarian honeysuckle
purple loosestrife
white sweet-clover
common reed grass
Japanese knotweed
common and smooth buckthorn
black locust
black swallowwort
Alliaria petiolata
Elaeagnus angustifolia. E. umbellata
Lonicera morrowii, L. tatarica
Lythrum salicaria
Melilotus alba
Phragmites australis
Polygonum cuspidatum
Rhamnus cathartica, R. frangula
Robinia pseudoacacia
Vincetoxicum nigrum
Present1, 2
Present1
Present1
Present2
Present2
Present1
Present2
Sources: (1) Dru Assoc., 2001; (2) Chairvolotti, J., Oswego County District
Forester, personal communication, March, 2007.
Indicator – Native Forest Herb Densities/Frequencies: A number of shade-tolerant,
native forest herb species characterize the understories of the regional forests
(Hotchkiss 1932, McNamara 1999). Many of these species lack resilience to extreme
disturbance events due to low sexual reproductive success and slow vegetative
growth rates (Bierzychudek 1982). A recent literature review indicates that, while the
relative abundance of shade-tolerant forest herbs may decline relative to more
competitive and weedy species directly following forest management activities, with
canopy closure their abundances generally appear to return to pre-existing levels
(Roberts and Gilliam 2003). However, disturbances that remove soil seed banks and
kill root stock (agriculture) appear to have greater negative consequences for this
suite of species (e.g., Singleton et al. 2001). Therefore, post-agricultural second-
growth forests display highly reduced forest herb diversity.
Current Condition – Upper sub-watersheds, Good; Lower sub-watersheds, Unranked:
No quantitative information exists that would provide baseline conditions for forest
herb species cover or frequencies in forests of the watershed or greater Tug Hill
region. Hotchkiss (1932) provided a subjective rank-ordered species list for herbs
commonly found in climax forests of the Tug Hill. A recent unpublished survey was
conducted of forest herb species frequencies in 49 northern hardwood study sites
across the Tug Hill (McGee, unpublished), including sites in the watershed westward
to approximately Redfield. That study found that many of the common species listed
by Hotchkiss continued to be among the most frequently encountered in the region’s
forests (Table 41). However, McGee also found that a number of more competitive
Via
bilit
y A
naly
sis
– M
atr
ix F
ore
st
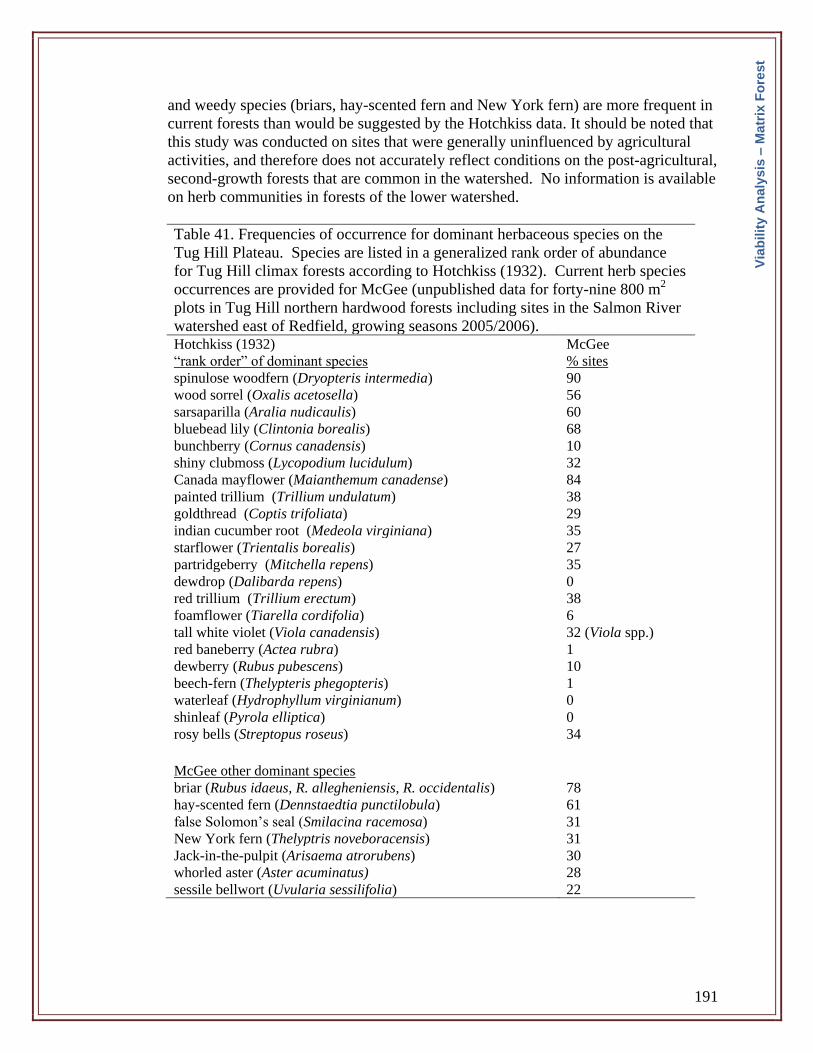
191
and weedy species (briars, hay-scented fern and New York fern) are more frequent in
current forests than would be suggested by the Hotchkiss data. It should be noted that
this study was conducted on sites that were generally uninfluenced by agricultural
activities, and therefore does not accurately reflect conditions on the post-agricultural,
second-growth forests that are common in the watershed. No information is available
on herb communities in forests of the lower watershed.
Table 41. Frequencies of occurrence for dominant herbaceous species on the
Tug Hill Plateau. Species are listed in a generalized rank order of abundance
for Tug Hill climax forests according to Hotchkiss (1932). Current herb species
occurrences are provided for McGee (unpublished data for forty-nine 800 m2
plots in Tug Hill northern hardwood forests including sites in the Salmon River
watershed east of Redfield, growing seasons 2005/2006). Hotchkiss (1932) “rank order” of dominant species
McGee % sites
spinulose woodfern (Dryopteris intermedia) 90 wood sorrel (Oxalis acetosella) 56 sarsaparilla (Aralia nudicaulis) 60 bluebead lily (Clintonia borealis) 68 bunchberry (Cornus canadensis) 10 shiny clubmoss (Lycopodium lucidulum) 32 Canada mayflower (Maianthemum canadense) 84 painted trillium (Trillium undulatum) 38 goldthread (Coptis trifoliata) 29 indian cucumber root (Medeola virginiana) 35 starflower (Trientalis borealis) 27 partridgeberry (Mitchella repens) 35 dewdrop (Dalibarda repens) 0 red trillium (Trillium erectum) 38 foamflower (Tiarella cordifolia) 6 tall white violet (Viola canadensis) 32 (Viola spp.) red baneberry (Actea rubra) 1 dewberry (Rubus pubescens) 10 beech-fern (Thelypteris phegopteris) 1 waterleaf (Hydrophyllum virginianum) 0 shinleaf (Pyrola elliptica) 0 rosy bells (Streptopus roseus) 34
McGee other dominant species briar (Rubus idaeus, R. allegheniensis, R. occidentalis) 78 hay-scented fern (Dennstaedtia punctilobula) 61 false Solomon’s seal (Smilacina racemosa) 31 New York fern (Thelyptris noveboracensis) 31 Jack-in-the-pulpit (Arisaema atrorubens) 30 whorled aster (Aster acuminatus) 28 sessile bellwort (Uvularia sessilifolia) 22
Via
bilit
y A
naly
sis
– M
atr
ix F
ore
st
192
2.7.2.9 KEA Condition – Forest Tree Regeneration
The maintenance of productive, well-stocked and diverse forests requires abundant and
well-distributed tree regeneration to replace trees that die naturally or are removed by
logging activities. Several variables influence the regeneration of ecologically and
commercially desirable tree species including site conditions, herbivory, competition by
herbaceous and other woody species, and, in working forests, the application of
silvicultural prescriptions that ensure adequate seed production and optimal growing
conditions for species and genotypes that are best suited for a given site and management
objective (Nyland 1996).
Indicator – Regeneration Frequency: The proportion of sites on which seedlings of
component forest species occur provides a measurement of potential for regeneration
of respective species across the watershed.
Current Condition – Good: Little information is available with which to draw
conclusions regarding forest tree regeneration trends in the watershed. The data
currently available include only frequency of occurrence on 49 northern hardwood
sites within the Tug Hill region, including some in the watershed east of the Redfield
Reservoir (McGee, unpublished); and frequency of occurrence on 30 hardwood and 6
plantation sites along the Salmon River Corridor below Redfield (Dru Assoc., 2001).
Only one non-native species (Norway spruce) was listed among regeneration in these
two surveys (Table 42). This species is not considered invasive in this area, and it
occurred with low frequencies in existing plantations. No invasive tree species were
recorded in the regeneration layer of the watershed’s forests. Red maple was the
most abundant seedling/sapling in the higher elevation forests (89% of sites),
followed by black cherry, striped maple, American beech and yellow birch. Sugar
maple and red spruce occurred on approximately 40% of sites. In lower elevation
forests west of Redfield, American beech was the most abundant seedling/sapling
(60% of sites), followed by maple (undetermined), striped maple, hemlock and red
oak.
Indicator – Regeneration Density: Seedling and sapling densities, by height class, of
component forest tree species provide the best indication of potential regeneration
success.
Current Condition – Unranked: No data were obtained reporting seedling/sapling
densities in the forests of the watershed.
Via
bilit
y A
naly
sis
– M
atr
ix F
ore
st
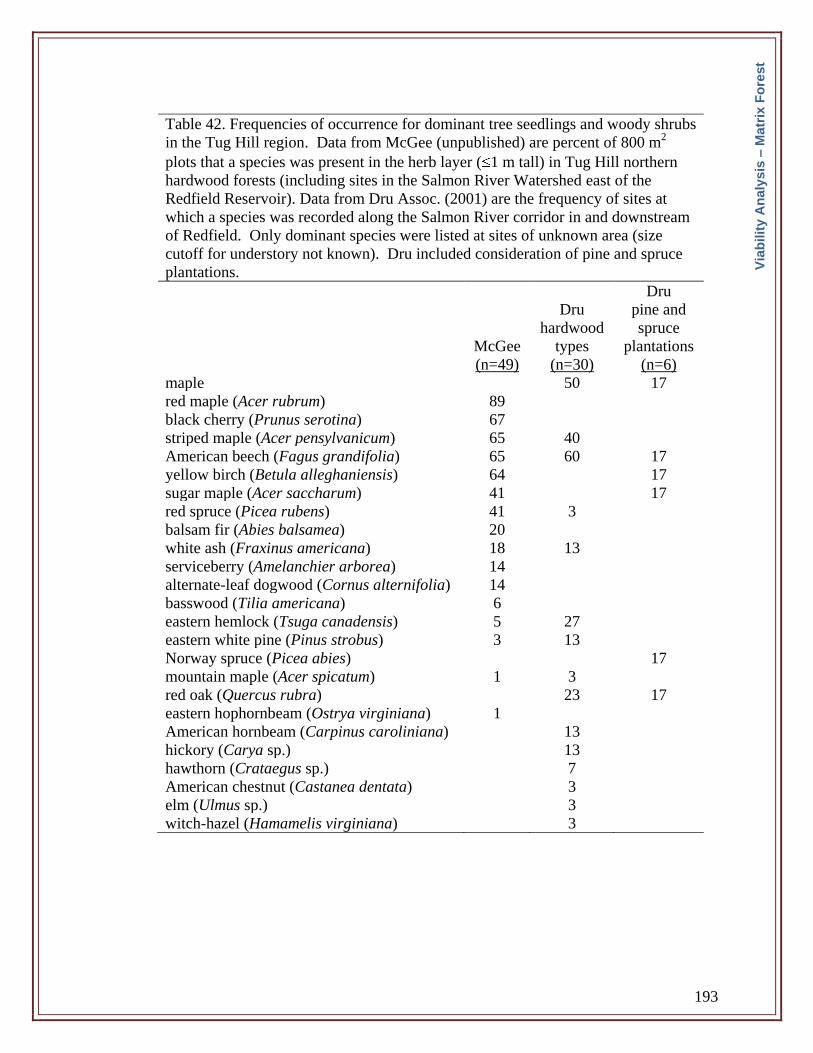
193
Table 42. Frequencies of occurrence for dominant tree seedlings and woody shrubs
in the Tug Hill region. Data from McGee (unpublished) are percent of 800 m2
plots that a species was present in the herb layer ( 1 m tall) in Tug Hill northern
hardwood forests (including sites in the Salmon River Watershed east of the
Redfield Reservoir). Data from Dru Assoc. (2001) are the frequency of sites at
which a species was recorded along the Salmon River corridor in and downstream
of Redfield. Only dominant species were listed at sites of unknown area (size
cutoff for understory not known). Dru included consideration of pine and spruce
plantations.
McGee
(n=49)
Dru
hardwood
types
(n=30)
Dru
pine and
spruce
plantations
(n=6)
maple 50 17
red maple (Acer rubrum) 89
black cherry (Prunus serotina) 67
striped maple (Acer pensylvanicum) 65 40
American beech (Fagus grandifolia) 65 60 17
yellow birch (Betula alleghaniensis) 64 17
sugar maple (Acer saccharum) 41 17
red spruce (Picea rubens) 41 3
balsam fir (Abies balsamea) 20
white ash (Fraxinus americana) 18 13
serviceberry (Amelanchier arborea) 14
alternate-leaf dogwood (Cornus alternifolia) 14
basswood (Tilia americana) 6
eastern hemlock (Tsuga canadensis) 5 27
eastern white pine (Pinus strobus) 3 13
Norway spruce (Picea abies) 17
mountain maple (Acer spicatum) 1 3
red oak (Quercus rubra) 23 17
eastern hophornbeam (Ostrya virginiana) 1
American hornbeam (Carpinus caroliniana) 13
hickory (Carya sp.) 13
hawthorn (Crataegus sp.) 7
American chestnut (Castanea dentata) 3
elm (Ulmus sp.) 3
witch-hazel (Hamamelis virginiana) 3
Via
bilit
y A
naly
sis
– M
atr
ix F
ore
st
194
2.7.2.10 KEA –CONDITION: Forest Overstory Composition
Current forest overstory reflects the cumulative effects of past disturbances on the
capacity for component species to regenerate. Current overstory composition and
diversity may deviate from expected due to a number of factors such as disease (beech
bark disease, chestnut blight, Dutch elm disease), changes in the extent and intensity of
natural or human disturbances (e.g., declining oak dominance in Appalachian forests due
to changes in fire frequencies; or abundance of successional species following
widespread clearing and abandonment of agricultural lands), or deliberate management
decisions to favor certain species.
Indicator – Invasive Species Frequencies/Dominance: The frequency of occurrence of
invasive species, and/or the density or percent cover within communities when they
occur are indicators of the local distribution and degree of community dominance by
invasive species. Table 4 ranks community composition based upon the frequency of
occurrence or dominance of invasive species.
Current Condition – Upper sub-watersheds, Good; Lower sub-watersheds, Unranked:
No invasive species were recorded in any of the overstory layers in 147 samples of
Tug Hill forests, including sites extending to lower elevations to approximately
Orwell (Table 43). It should be noted that none of the sample locations occurred in
the Lake Plain forests, where growing conditions, increased development, and
fragmentation may lead to increased occurrences of invasive species.
Indicator – Rank Abundance of Native Component Species: Forest species composition
constantly shifts in geologic time scales due to fluctuations in climate (e.g.,
deglaciation) and otherwise can vary on more narrow time scales due to natural
perturbations. Monitoring canopy composition (and regeneration) permits for the
detection of long-term compositional trends, which may indicate meaningful
environmental change. Historic considerations of the natural vegetation of the region
indicate that these forests were dominated by various combinations of American
beech, yellow birch and sugar maple, with an abundant admixture of conifers (red
spruce, hemlock, white pine balsam fir, all of which increased in abundance near
swamps and stream valleys). In the transitional Tug Hill fringe, northern hardwoods
dominated with hemlock, white pine, and some spruce restricted to stream sides and
ravines (Hotchkiss 1932, Stout 1958). A forest landscape in which the dominance of
native species that are adapted to prevailing site conditions and historic disturbance
regimes is maintained indicates no substantial, widespread perturbation. Large
change in the dominance distribution of forest overstory trees on a landscape scale
indicates the occurrence of some historic shift in regeneration processes.
Current Condition – Upper sub-watersheds, Fair; Lower sub-watersheds, Unranked:
Table 43 summarizes available data regarding forest canopy composition (based on
average relative stand basal area and frequency of occurrence across sampled stands).
These data are limited primarily to the upper elevations and transitional sections of
Via
bilit
y A
naly
sis
– M
atr
ix F
ore
st
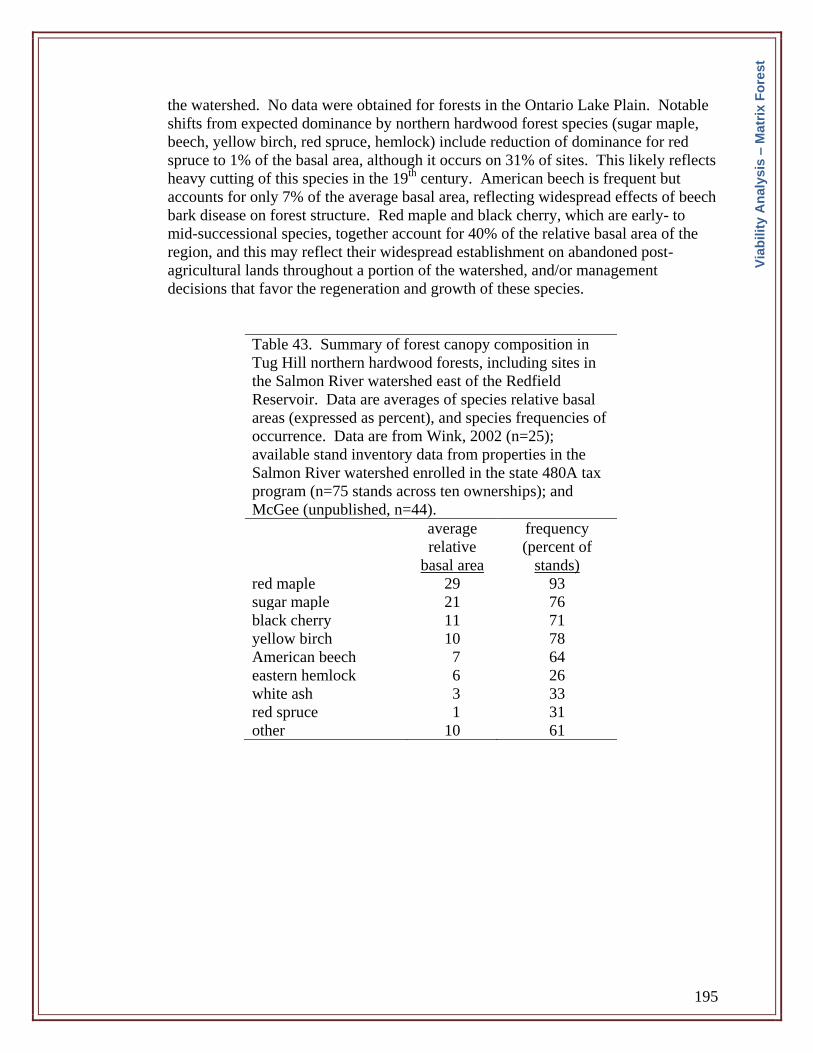
195
the watershed. No data were obtained for forests in the Ontario Lake Plain. Notable
shifts from expected dominance by northern hardwood forest species (sugar maple,
beech, yellow birch, red spruce, hemlock) include reduction of dominance for red
spruce to 1% of the basal area, although it occurs on 31% of sites. This likely reflects
heavy cutting of this species in the 19th
century. American beech is frequent but
accounts for only 7% of the average basal area, reflecting widespread effects of beech
bark disease on forest structure. Red maple and black cherry, which are early- to
mid-successional species, together account for 40% of the relative basal area of the
region, and this may reflect their widespread establishment on abandoned post-
agricultural lands throughout a portion of the watershed, and/or management
decisions that favor the regeneration and growth of these species.
Table 43. Summary of forest canopy composition in
Tug Hill northern hardwood forests, including sites in
the Salmon River watershed east of the Redfield
Reservoir. Data are averages of species relative basal
areas (expressed as percent), and species frequencies of
occurrence. Data are from Wink, 2002 (n=25);
available stand inventory data from properties in the
Salmon River watershed enrolled in the state 480A tax
program (n=75 stands across ten ownerships); and
McGee (unpublished, n=44).
average
relative
basal area
frequency
(percent of
stands)
red maple 29 93
sugar maple 21 76
black cherry 11 71
yellow birch 10 78
American beech 7 64
eastern hemlock 6 26
white ash 3 33
red spruce 1 31
other 10 61
V
iab
ilit
y A
naly
sis
– M
atr
ix F
ore
st

196
2.7.2.11. KEA – CONDITION: Forest Pests and Pathogens
A number of forest pathogens (fungi, bacteria, viruses) and insect pests are endemic to,
have been introduced to, or are of potential concern to northern forest ecosystems in
general, and to the matrix forests of the Salmon River watershed in particular.
Indicator – Sirex Woodwasp Distribution: Sirex woodwasp (Sirex noctilio) is a wood-
boring pest of conifers, primarily 2 & 3-needled pines. In New York, it is a recently
introduced invasive species that was first discovered near the town of Fulton in 2004.
Since then, the Sirex woodwasp has been confirmed in over half of the counties in the
state, including those counties which contain the Salmon River Watershed. It has
also been detected in Pennsylvania, Vermont, and Ontario. Scots pine, red pine,
Austrian pine, and eastern white pine are all susceptible hosts occurring in the
watershed.
The female woodwasp drills a series of holes in the host tree with her ovipositor,
through which she injects an egg along with a toxic mucus and a blue-stain fungus,
which prepare the host tree for invasion by hatching larvae. The cumulative result of
the toxin, fungus, and larval tunneling is death of the tree within 2-3 years.
At this time it is unclear what the long-term ecological impact of Sirex woodwasp
will be in the watershed. The majority of trees attacked in New York have been
weak, overtopped or otherwise pre-disposed hosts. However there have also been
cases of dominant, vigorous trees attacked and killed, and worldwide Sirex has
caused millions of dollars in timber losses, primarily within monoculture plantations.
(More information is available online at http://www.na.fs.fed.us/fhp/sww/.)
Current Condition – Fair: A few specimens of Sirex have been trapped in Oswego
County. Given the abundance of native eastern white pine and the number of
NYSDEC reforestation areas in the watershed that contain white, red and Scots pines,
this species poses a serious threat to the regional forests.
Indicator – Forest Tent Caterpillar Distributions: Eastern (Malacosoma americanum)
and forest (Malacosoma disstria) tent caterpillars are two important tree pests in New
York. These defoliators can cause widespread damage to a variety of native
hardwood species. The forest tent caterpillar is the most common defoliator pest in
northern hardwood forest types and, in the Northeast, sugar maple is the principle
host. Outbreaks in the Lake States typically last for 3-4 years, occur at 7-12 year
intervals, and can cover areas as large as 40,000 km2 (Wink 2002; Wink and Allen
2007). Depending on the intensity and extent of defoliation, forest trees may
experience diminished productivity (40-90%), direct mortality (2% of dominant and
codominant sugar maples, and14% of intermediate and suppressed trees), or may be
predisposed to forest decline through other contributing agents such as past
disturbance or drought.
Via
bilit
y A
naly
sis
– M
atr
ix F
ore
st
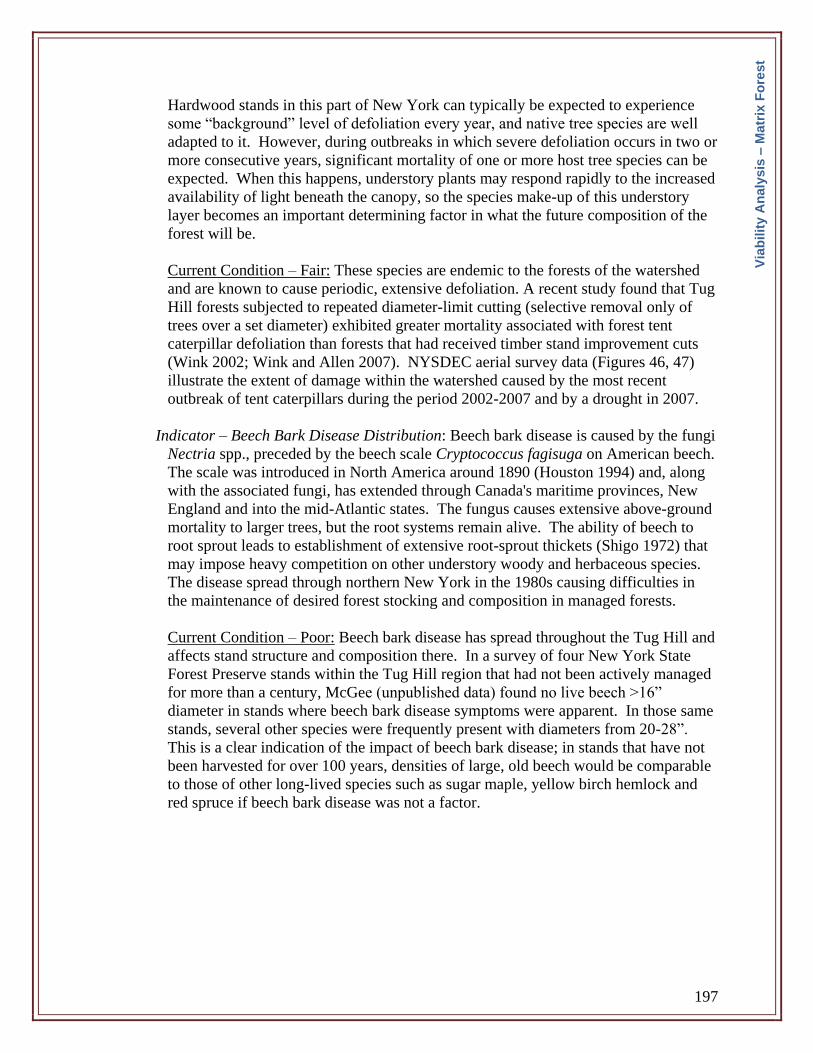
197
Hardwood stands in this part of New York can typically be expected to experience
some “background” level of defoliation every year, and native tree species are well
adapted to it. However, during outbreaks in which severe defoliation occurs in two or
more consecutive years, significant mortality of one or more host tree species can be
expected. When this happens, understory plants may respond rapidly to the increased
availability of light beneath the canopy, so the species make-up of this understory
layer becomes an important determining factor in what the future composition of the
forest will be.
Current Condition – Fair: These species are endemic to the forests of the watershed
and are known to cause periodic, extensive defoliation. A recent study found that Tug
Hill forests subjected to repeated diameter-limit cutting (selective removal only of
trees over a set diameter) exhibited greater mortality associated with forest tent
caterpillar defoliation than forests that had received timber stand improvement cuts
(Wink 2002; Wink and Allen 2007). NYSDEC aerial survey data (Figures 46, 47)
illustrate the extent of damage within the watershed caused by the most recent
outbreak of tent caterpillars during the period 2002-2007 and by a drought in 2007.
Indicator – Beech Bark Disease Distribution: Beech bark disease is caused by the fungi
Nectria spp., preceded by the beech scale Cryptococcus fagisuga on American beech.
The scale was introduced in North America around 1890 (Houston 1994) and, along
with the associated fungi, has extended through Canada's maritime provinces, New
England and into the mid-Atlantic states. The fungus causes extensive above-ground
mortality to larger trees, but the root systems remain alive. The ability of beech to
root sprout leads to establishment of extensive root-sprout thickets (Shigo 1972) that
may impose heavy competition on other understory woody and herbaceous species.
The disease spread through northern New York in the 1980s causing difficulties in
the maintenance of desired forest stocking and composition in managed forests.
Current Condition – Poor: Beech bark disease has spread throughout the Tug Hill and
affects stand structure and composition there. In a survey of four New York State
Forest Preserve stands within the Tug Hill region that had not been actively managed
for more than a century, McGee (unpublished data) found no live beech >16”
diameter in stands where beech bark disease symptoms were apparent. In those same
stands, several other species were frequently present with diameters from 20-28”.
This is a clear indication of the impact of beech bark disease; in stands that have not
been harvested for over 100 years, densities of large, old beech would be comparable
to those of other long-lived species such as sugar maple, yellow birch hemlock and
red spruce if beech bark disease was not a factor.
Via
bilit
y A
naly
sis
– M
atr
ix F
ore
st
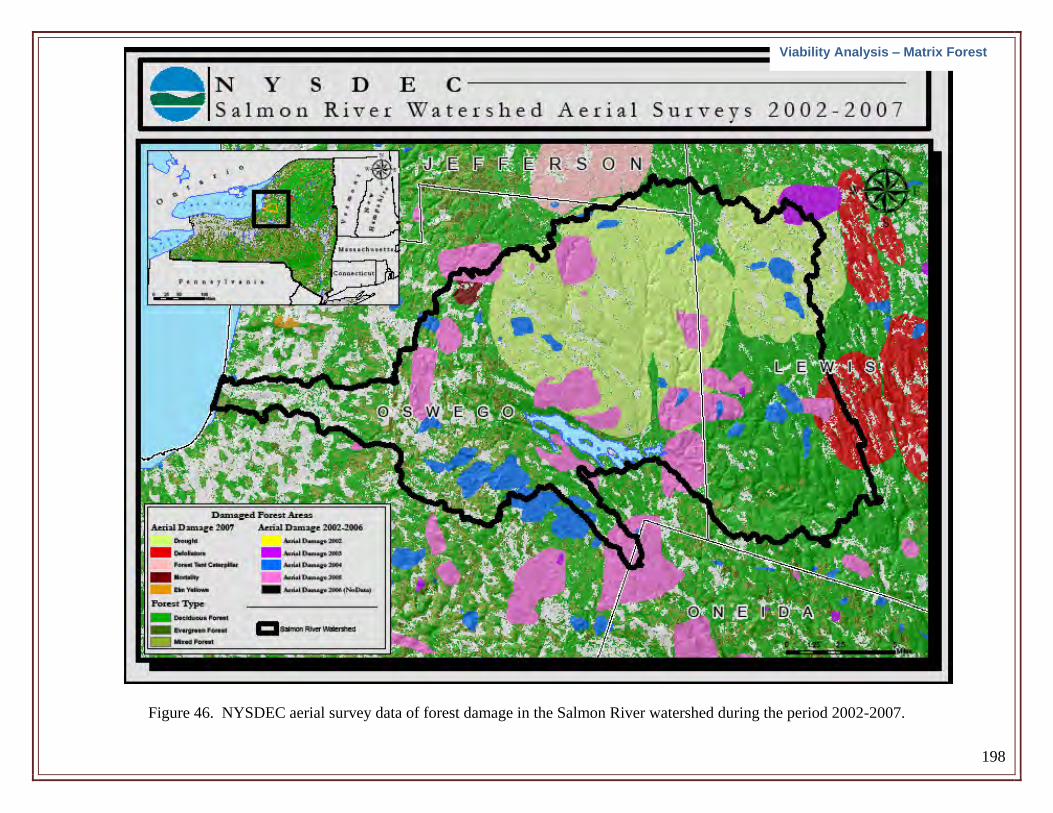
198
Figure 46. NYSDEC aerial survey data of forest damage in the Salmon River watershed during the period 2002-2007.
Viability Analysis – Matrix Forest
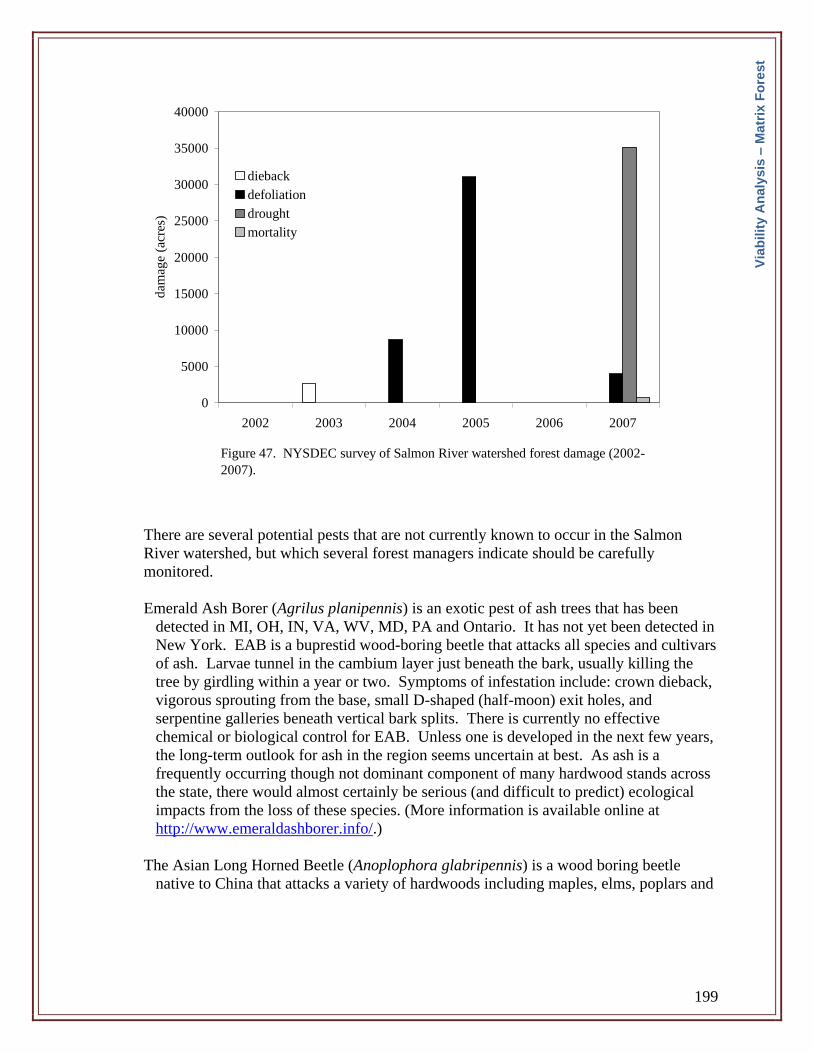
199
There are several potential pests that are not currently known to occur in the Salmon
River watershed, but which several forest managers indicate should be carefully
monitored.
Emerald Ash Borer (Agrilus planipennis) is an exotic pest of ash trees that has been
detected in MI, OH, IN, VA, WV, MD, PA and Ontario. It has not yet been detected in
New York. EAB is a buprestid wood-boring beetle that attacks all species and cultivars
of ash. Larvae tunnel in the cambium layer just beneath the bark, usually killing the
tree by girdling within a year or two. Symptoms of infestation include: crown dieback,
vigorous sprouting from the base, small D-shaped (half-moon) exit holes, and
serpentine galleries beneath vertical bark splits. There is currently no effective
chemical or biological control for EAB. Unless one is developed in the next few years,
the long-term outlook for ash in the region seems uncertain at best. As ash is a
frequently occurring though not dominant component of many hardwood stands across
the state, there would almost certainly be serious (and difficult to predict) ecological
impacts from the loss of these species. (More information is available online at
http://www.emeraldashborer.info/.)
The Asian Long Horned Beetle (Anoplophora glabripennis) is a wood boring beetle
native to China that attacks a variety of hardwoods including maples, elms, poplars and
Figure 47. NYSDEC survey of Salmon River watershed forest damage (2002-
2007).
0
5000
10000
15000
20000
25000
30000
35000
40000
2002 2003 2004 2005 2006 2007
dam
age
(acr
es)
dieback
defoliation
drought
mortality
Via
bilit
y A
naly
sis
– M
atr
ix F
ore
st

200
willows. Infestations have been found in New York City, northern New Jersey, Illinois
and Ontario. (More information is available online at http://www.uvm.edu/albeetle/.)
The maple-dominated forests of northern New York, including the Salmon River
watershed are highly susceptible to infestation by the beetle (TNC 2007).
Hemlock Wooly Adelgid (Adelges tsugae) is a scale insect native to east Asia that has
infested and caused extensive mortality to hemlock trees in New England, and mid-
Atlantic states. It is currently restricted to the lower Hudson and Delaware Valleys in
New York. Its ability to spread northward into colder climatic regions in New York is
currently unclear, but given the distribution of hemlock throughout New York, the
adelgid could potentially cause extensive ecological damage to New York’s forests.
(More information is available online at http://www.na.fs.fed.us/fhp/hwa/.)
Via
bilit
y A
naly
sis
– M
atr
ix F
ore
st
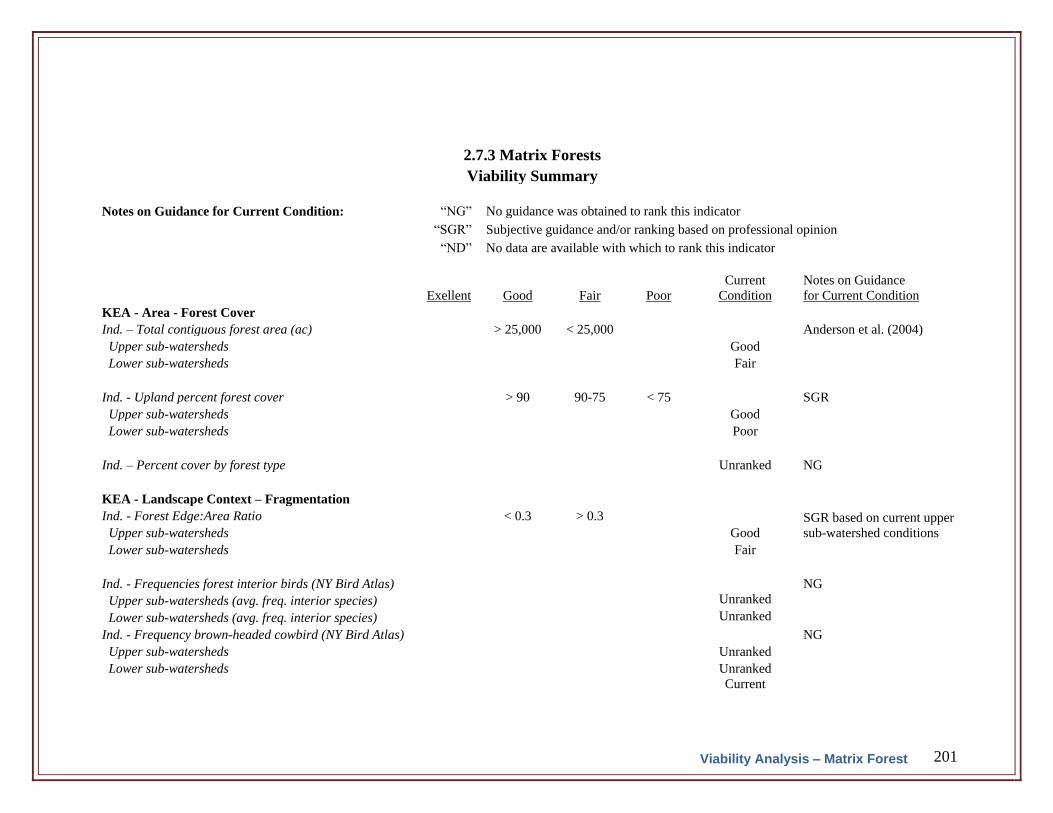
201
2.7.3 Matrix Forests
Viability Summary
Notes on Guidance for Current Condition: “NG” No guidance was obtained to rank this indicator
“SGR” Subjective guidance and/or ranking based on professional opinion
“ND” No data are available with which to rank this indicator
Exellent Good Fair Poor
Current
Condition
Notes on Guidance
for Current Condition
KEA - Area - Forest Cover
Ind. – Total contiguous forest area (ac) > 25,000 < 25,000 Anderson et al. (2004)
Upper sub-watersheds Good
Lower sub-watersheds Fair
Ind. - Upland percent forest cover > 90 90-75 < 75 SGR
Upper sub-watersheds Good
Lower sub-watersheds Poor
Ind. – Percent cover by forest type Unranked NG
KEA - Landscape Context – Fragmentation
Ind. - Forest Edge:Area Ratio < 0.3 > 0.3 SGR based on current upper
sub-watershed conditions Upper sub-watersheds Good
Lower sub-watersheds Fair
Ind. - Frequencies forest interior birds (NY Bird Atlas) NG
Upper sub-watersheds (avg. freq. interior species) Unranked
Lower sub-watersheds (avg. freq. interior species) Unranked
Ind. - Frequency brown-headed cowbird (NY Bird Atlas) NG
Upper sub-watersheds Unranked
Lower sub-watersheds Unranked
Current
Viability Analysis – Matrix Forest
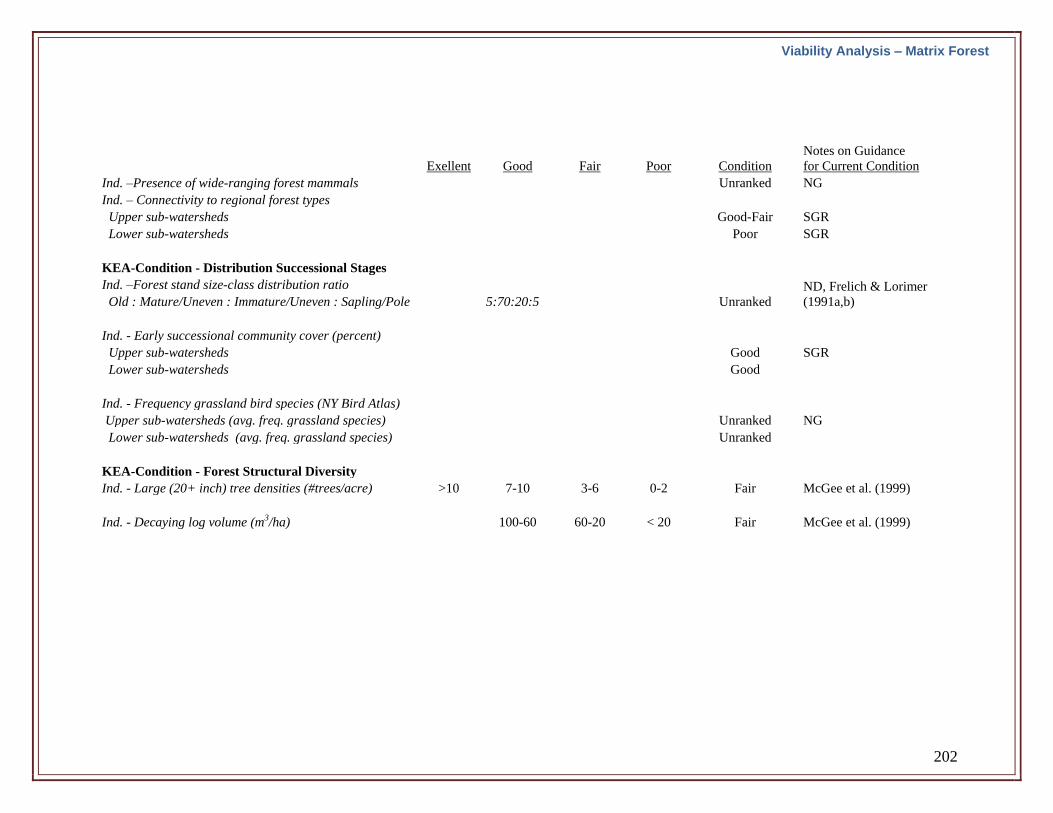
202
Exellent
Good
Fair
Poor
Condition
Notes on Guidance
for Current Condition
Ind. –Presence of wide-ranging forest mammals Unranked NG
Ind. – Connectivity to regional forest types
Upper sub-watersheds Good-Fair SGR
Lower sub-watersheds Poor SGR
KEA-Condition - Distribution Successional Stages
Ind. –Forest stand size-class distribution ratio ND, Frelich & Lorimer
(1991a,b) Old : Mature/Uneven : Immature/Uneven : Sapling/Pole 5:70:20:5 Unranked
Ind. - Early successional community cover (percent)
Upper sub-watersheds Good SGR
Lower sub-watersheds Good
Ind. - Frequency grassland bird species (NY Bird Atlas)
Upper sub-watersheds (avg. freq. grassland species) Unranked NG
Lower sub-watersheds (avg. freq. grassland species) Unranked
KEA-Condition - Forest Structural Diversity
Ind. - Large (20+ inch) tree densities (#trees/acre) >10 7-10 3-6 0-2 Fair McGee et al. (1999)
Ind. - Decaying log volume (m3/ha) 100-60 60-20 < 20 Fair McGee et al. (1999)
Viability Analysis – Matrix Forest
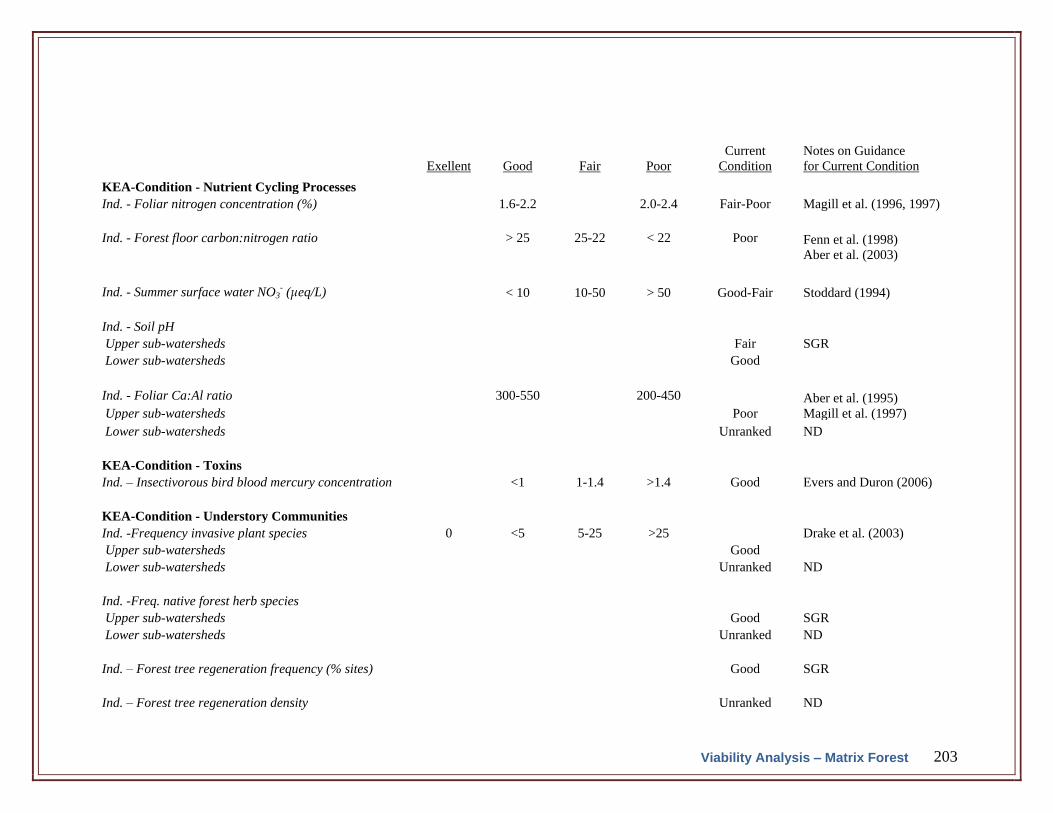
203
Exellent Good Fair Poor
Current
Condition
Notes on Guidance
for Current Condition
KEA-Condition - Nutrient Cycling Processes
Ind. - Foliar nitrogen concentration (%) 1.6-2.2 2.0-2.4 Fair-Poor Magill et al. (1996, 1997)
Ind. - Forest floor carbon:nitrogen ratio > 25 25-22 < 22 Poor Fenn et al. (1998)
Aber et al. (2003)
Ind. - Summer surface water NO3- (μeq/L) < 10 10-50 > 50 Good-Fair Stoddard (1994)
Ind. - Soil pH
Upper sub-watersheds Fair SGR
Lower sub-watersheds Good
Ind. - Foliar Ca:Al ratio 300-550 200-450 Aber et al. (1995)
Magill et al. (1997) Upper sub-watersheds Poor
Lower sub-watersheds Unranked ND
KEA-Condition - Toxins
Ind. – Insectivorous bird blood mercury concentration <1 1-1.4 >1.4 Good Evers and Duron (2006)
KEA-Condition - Understory Communities
Ind. -Frequency invasive plant species 0 <5 5-25 >25 Drake et al. (2003)
Upper sub-watersheds Good
Lower sub-watersheds Unranked ND
Ind. -Freq. native forest herb species
Upper sub-watersheds Good SGR
Lower sub-watersheds Unranked ND
Ind. – Forest tree regeneration frequency (% sites) Good SGR
Ind. – Forest tree regeneration density Unranked ND
Viability Analysis – Matrix Forest
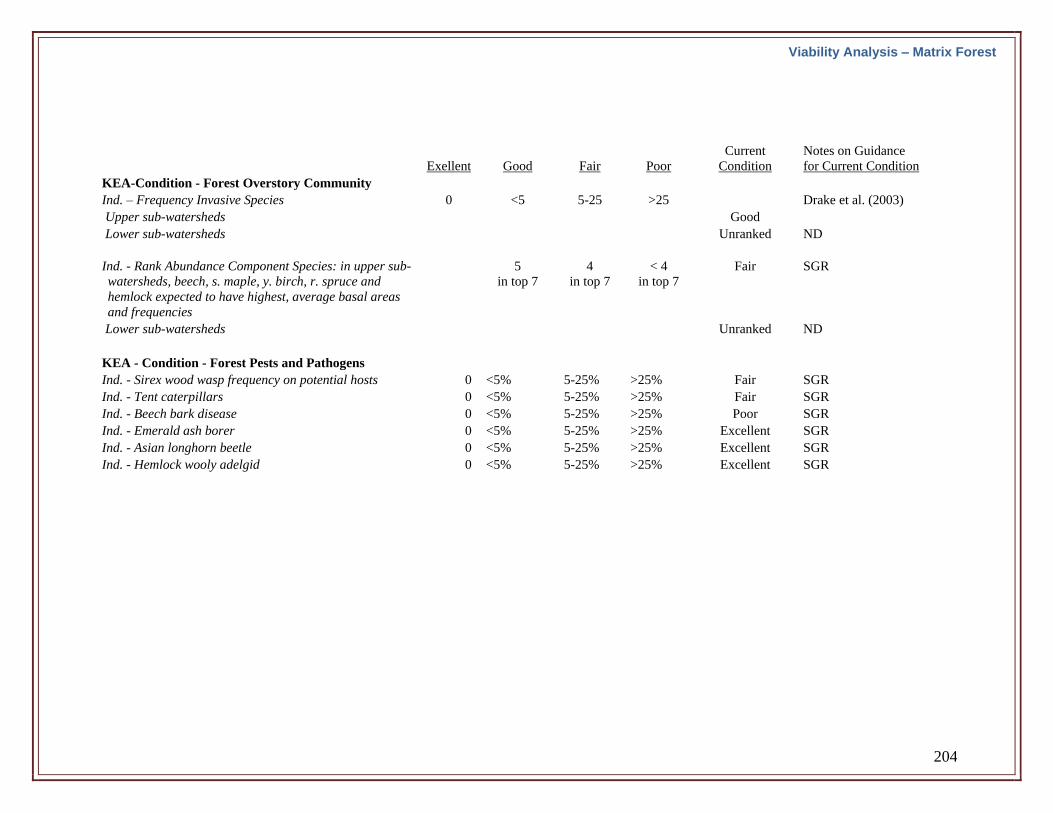
204
Exellent Good Fair Poor
Current
Condition
Notes on Guidance
for Current Condition
KEA-Condition - Forest Overstory Community
Ind. – Frequency Invasive Species 0 <5 5-25 >25 Drake et al. (2003)
Upper sub-watersheds Good
Lower sub-watersheds Unranked ND
Ind. - Rank Abundance Component Species: in upper sub-
watersheds, beech, s. maple, y. birch, r. spruce and
hemlock expected to have highest, average basal areas
and frequencies
5
in top 7
4
in top 7
< 4
in top 7
Fair
SGR
Lower sub-watersheds Unranked ND
KEA - Condition - Forest Pests and Pathogens
Ind. - Sirex wood wasp frequency on potential hosts 0 <5% 5-25% >25% Fair SGR
Ind. - Tent caterpillars 0 <5% 5-25% >25% Fair SGR
Ind. - Beech bark disease 0 <5% 5-25% >25% Poor SGR
Ind. - Emerald ash borer 0 <5% 5-25% >25% Excellent SGR
Ind. - Asian longhorn beetle 0 <5% 5-25% >25% Excellent SGR
Ind. - Hemlock wooly adelgid 0 <5% 5-25% >25% Excellent SGR
Viability Analysis – Matrix Forest
205
2.8 Salmon River Gorge and Steep Slope Communities
2.8.1 Gorge and Steep Slope Target Definition
One of the pronounced geologic features of the Tug Hill region is the numerous, steep
and often deep gorges (or “gulfs”) that have formed from the erosive actions of high-
velocity streams eroding weak shale and thin-bedded sandstone bedrock (Hotchkiss
1932). Most of the Tug Hill’s western fringe gulfs (Inman, Bear, Shingle, Lorraine,
Totman and Mooney Gulfs) occur outside the Salmon River watershed and the only such
pronounced feature within the watershed is the Salmon River Gorge, which begins at a
34-m high falls and continues downstream for approximately 1000 m. The Gorge
includes 35-m high sheer cliffs and talus slopes that support unique plant assemblages
and several rare plant species. The Gorge represents a unique natural resource within the
Salmon River Watershed, and it emerged as a stand-alone conservation target because it
was believed that its natural and cultural values, future condition, and management were
independent of the Main Stem of the Salmon River and of the Matrix Forest targets.
Apart from the cultural and scenic values of the Salmon River gorge and other regional
gulfs, their ecological uniqueness is due to their deep, shaded valleys, and the presence of
sheer, moist cliffs, and talus slopes. It is these physical and topographic conditions of the
gulfs and the Salmon River gorge that permit the unique assemblage of uncommon
species there. The upper slopes and rims are dominated by conifers and successional
hardwoods including white pine, eastern hemlock, northern white-cedar and aspens.
Several researchers have reported on the unique plant assemblages and rare species that
occur within these gulfs (Hotchkiss 1932, Geis et al. 1974).
In addition to the gorge, numerous other less prominent areas (e.g., Mad River Falls)
exist along many streams in the watershed that contain sheer outcroppings or steep-slopes
of more moderate relief (Figure 48). Although not as visually imposing as the region’s
gulfs, these geologic features may possess the combination of conditions that support
unique biological elements. Therefore, these other, more modest “steep slope”
communities have been included in this target to extend consideration beyond the Salmon
River gorge.
The viability analyses for the gorge and the other steep slope communities will be treated
separately in this section.
Via
bilit
y A
naly
sis
– S
alm
on
Riv
er
Go
rge
/Ste
ep
Slo
pe
s
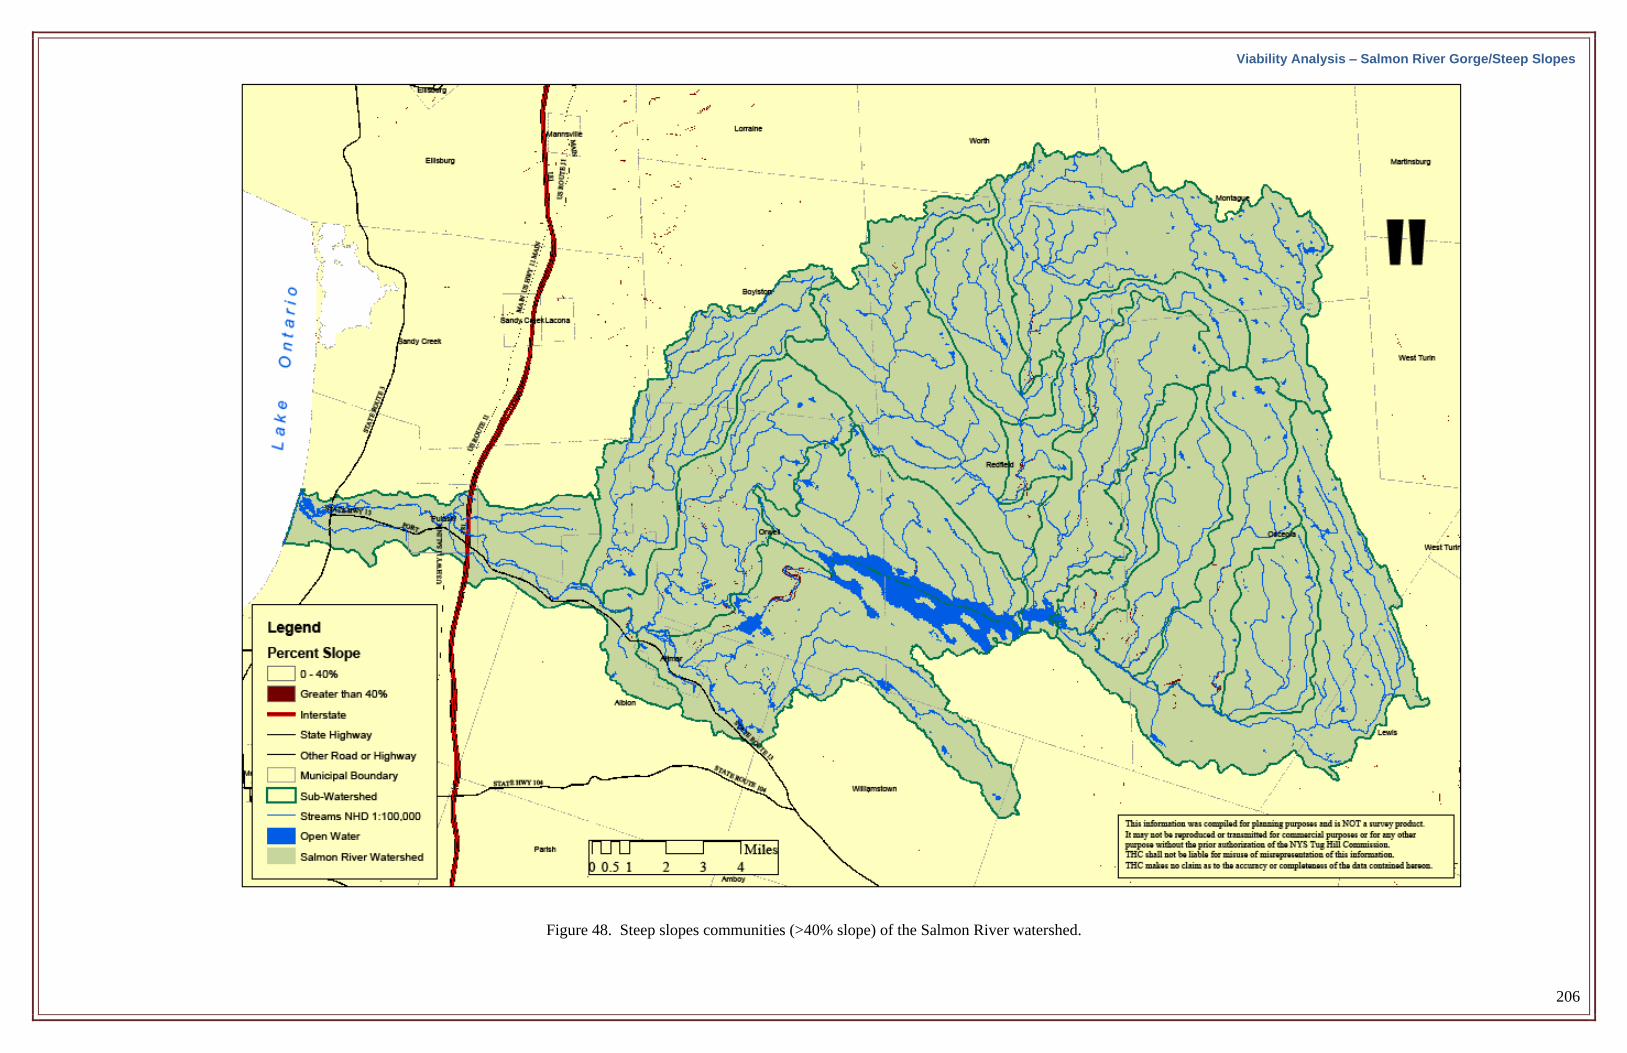
206
Figure 48. Steep slopes communities (>40% slope) of the Salmon River watershed.
Viability Analysis – Salmon River Gorge/Steep Slopes

207
2.8.2 Salmon River Gorge Viability Analysis
The Salmon River Gorge (Figure 49) begins at the 110-ft falls where an outcropping of
Oswego sandstone overlays softer Pulaski shale deposits, thereby leading to relatively
rapid erosion of the Gorge through the lower shales below the falls, which flow over the
upper sandstone stratum. The Gorge continues downstream from the falls for
approximately 3000 ft and is characterized by 120-ft shale cliffs and talus slopes.
Sawchuck (2006) provides a detailed assessment of current condition.
The 112-acre area immediately surrounding the falls and gorge was purchased by the
State of New York in 1993 and is currently managed as a Unique Area (Figure 49). An
NYSDEC Unit Management Plan was recently developed for this area (Sawchuck 2006).
2.8.2.1 KEA – Water Flow
Water flow over the falls and through the gorge (the “Bypass Reach”) has the potential to
be quite low due to natural reduction in flow during dry summer periods (which would be
approximately 60 cfs). However, current low flows are due primarily to diversions for
hydropower production. Water flow from the Salmon River Reservoir is diverted from
the river to a pipline in order to drive the Bennett’s Bridge hydropower station. Prior to
recent licensing agreements, the falls frequently experienced very low or no flow during
summer dry periods due to the diversion of water to the generating plant. Currently,
minimum flow rates through the Bypass Reach are set by the Federal Energy Regulatory
Commission (FERC) licensing agreement to maintain the aesthetic qualities of the falls.
The guidelines are:
- from July 1 – September 30, flow shall not be less than 20 cfs;
- from October 1 – June 31, flow shall not be less than 7 cfs .
High flow can exceed 10,000 cfs during emergency releases for high water levels in the
Reservoir.
Minimum flow rate over the falls may also be important for a number of cliff-dwelling
organisms (mosses, lichens, ferns) that require moist, humid substrate. It is not known
whether the minimum flows set for aesthetic purposes are sufficient to maintain viable
populations of these organisms. Furthermore, it is not known whether the historic,
regulated minimum flows have caused contraction or extirpation of such organisms.
Via
bilit
y A
naly
sis
– S
alm
on
Riv
er
Go
rge
/Ste
ep
Slo
pe
s
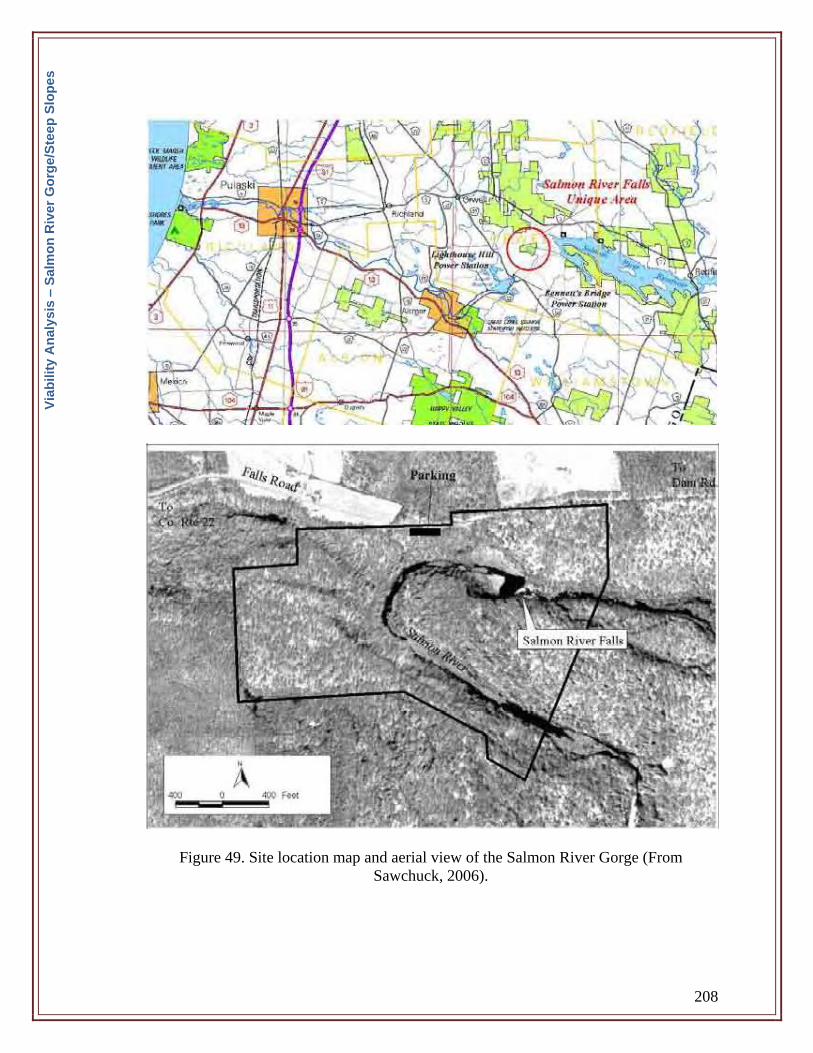
208
Figure 49. Site location map and aerial view of the Salmon River Gorge (From
Sawchuck, 2006).
Via
bilit
y A
naly
sis
– S
alm
on
Riv
er
Go
rge
/Ste
ep
Slo
pe
s
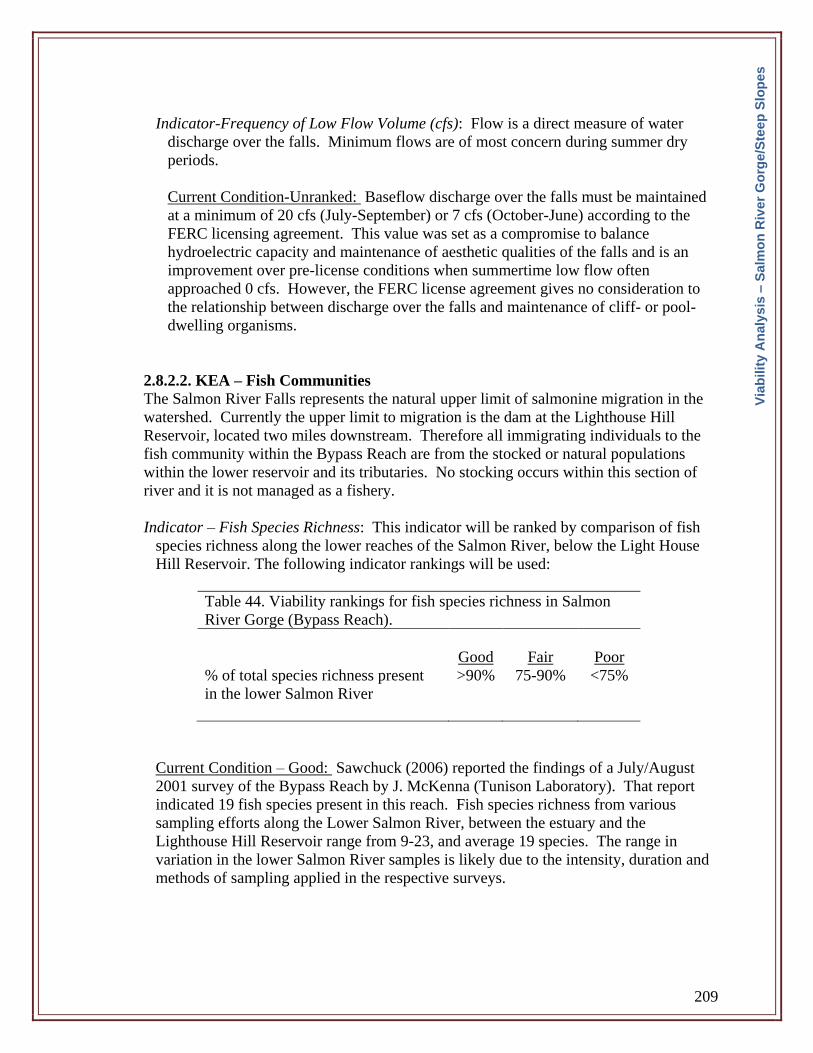
209
Indicator-Frequency of Low Flow Volume (cfs): Flow is a direct measure of water
discharge over the falls. Minimum flows are of most concern during summer dry
periods.
Current Condition-Unranked: Baseflow discharge over the falls must be maintained
at a minimum of 20 cfs (July-September) or 7 cfs (October-June) according to the
FERC licensing agreement. This value was set as a compromise to balance
hydroelectric capacity and maintenance of aesthetic qualities of the falls and is an
improvement over pre-license conditions when summertime low flow often
approached 0 cfs. However, the FERC license agreement gives no consideration to
the relationship between discharge over the falls and maintenance of cliff- or pool-
dwelling organisms.
2.8.2.2. KEA – Fish Communities
The Salmon River Falls represents the natural upper limit of salmonine migration in the
watershed. Currently the upper limit to migration is the dam at the Lighthouse Hill
Reservoir, located two miles downstream. Therefore all immigrating individuals to the
fish community within the Bypass Reach are from the stocked or natural populations
within the lower reservoir and its tributaries. No stocking occurs within this section of
river and it is not managed as a fishery.
Indicator – Fish Species Richness: This indicator will be ranked by comparison of fish
species richness along the lower reaches of the Salmon River, below the Light House
Hill Reservoir. The following indicator rankings will be used:
Table 44. Viability rankings for fish species richness in Salmon
River Gorge (Bypass Reach).
Good
Fair
Poor
% of total species richness present
in the lower Salmon River
>90% 75-90% <75%
Current Condition – Good: Sawchuck (2006) reported the findings of a July/August
2001 survey of the Bypass Reach by J. McKenna (Tunison Laboratory). That report
indicated 19 fish species present in this reach. Fish species richness from various
sampling efforts along the Lower Salmon River, between the estuary and the
Lighthouse Hill Reservoir range from 9-23, and average 19 species. The range in
variation in the lower Salmon River samples is likely due to the intensity, duration and
methods of sampling applied in the respective surveys.
Via
bilit
y A
naly
sis
– S
alm
on
Riv
er
Go
rge
/Ste
ep
Slo
pe
s
210
2.8.2.3 KEA – Plant Communities
Sawchuck (2006) described four distinct plant community types within the Unique Area
(Figure 50):
- northern hardwood forest (67 acres);
- hemlock forest (9 acres);
- shale talus slope woodlands (19 acres);
- shale cliff and talus community (6 acres).
Of these four community types, the talus slope and the shale cliff / tallus communities
have been classified by the New York Natural Heritage Program with a state ranking of
S3 (typically 21-100 occurrences of limited acreage). Therefore these are not protected
communities, but they are unique. Edinger et al. (2002) provide the following general
descriptions of these two community types, and Howard (2006) provides specific
descriptions of the communities within the gorge.
- shale talus slope woodland: These are open and closed canopy woodlands
(normally <50% canopy cover) that occur on shale talus slopes throughout
New York north of the coastal lowlands. Soils are unstable, shallow, and
typically dry and very well-drained. Characteristic species include chestnut,
red and white oak (Quercus montana, Q. rubra, Q. alba), pignut hickory
(Carya glabra), white pine (Pinus strobus), white ash (Fraxinus americana),
eastern red-cedar (Juniperus virginiana), sumac (Rhus glabra), scrub oak (Q.
prinoides), poison ivy (Toxicodendron radicans), penstemon (Penstemon
hirsutus), everlasting (Antennaria plantaginifolia), Pennsylvania sedge (Carex
pensylvanica).
- shale cliff and talus community: These communities occur throughout upstate
NY north of the Coastal Lowlands on nearly vertical outcrops of shale. The
communities include ledges and small talus areas. The unstable nature of
shale leads to uneven slopes and numerous rock crevices. Soil development is
minimal and vegetation sparse. Communities are not well documented and
vary based on exposure, aspect and moisture. Edinger et al. (2002) provide a
list of characteristic species for this community type for New York including
blunt-lobed woodsia (Woodsia obtusa), rusty woodsia (W. ilvensis),
penstemon (Penstemon hirsutus), herb-robert (Geranium robertianum),
cyperus (Cyperus filiculmis), little bluestem (Schizachyrium scoparium), panic
grass (Panicum linearifolium), Pennsylvania sedge (Carex pensylvanica), and
eastern red cedar (Juniperus virginiana).
Sawchuck (2006) lists the following species for the Salmon River gorge shale
cliff and talus community: flat-top aster (Aster umbellatus), grass of parnassia
(Parnassia glauca), bladder fern (Cystopteris), Bigelows sedge (Carex
bigelowii), and clearweed (Pilea fontana).
Via
bilit
y A
naly
sis
– S
alm
on
Riv
er
Go
rge
/Ste
ep
Slo
pe
s
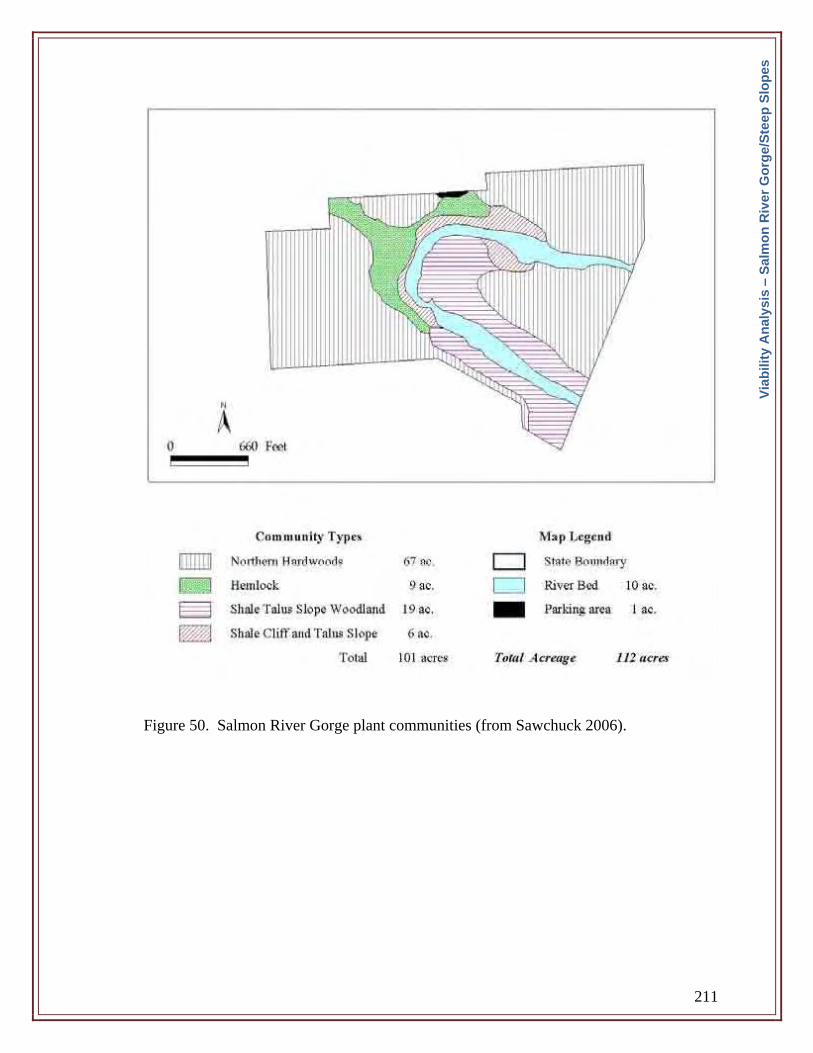
211
Figure 50. Salmon River Gorge plant communities (from Sawchuck 2006).
Via
bilit
y A
naly
sis
– S
alm
on
Riv
er
Go
rge
/Ste
ep
Slo
pe
s
212
Howard (2006) described additional unique communities within the gorge.
- calcareous cliff community: This occurs along the Salmon River above the
lower reservoir. Portions are shaded by trees and shrubs above the cliff. Some
moist seeps occur along the outcrop. Plant species composition includes
infrequent occurrence of Alnus incana and Rubus odorata. Herb layer is
dominated by Parnassia glauca, Deschampsia cespitosa, Lobelia kalmii,
Primula mistassinica, Cystopteris bulbifera and Symphyotrichum ciliolatum.
Mosses and liverworts are common.
- calcareous shoreline outcrop: This occurs within the Salmon River gorge and at
the falls. It is regularly flooded and scoured by ice and water. Vegetation is
primarily in cracks of the bedrock. Common species include Oenothera
perennis, Carex flava, Danthonia spicata, Drosera rotundifolia, Equisetum sp.,
Erigeron sp., Eupatorium perfoliatum, Houstonia caerulea, Hypericum
ellipticum, Lycopus americanus, Osmunda regalis, Parnassia glauca, Pilosella
piloselloides, Prunella vulgaris, Spiranthes lucida, Symphyotrichum ontarione,
Triadenum fraseri, Trichophorum alpinum Lobelia kalmii.
Two state-protected plant species (Heritage rank S2 = demonstrably vulnerable due to
few remaining occurrences) occur within the shale cliff and talus communities of the
Salmon River gorge: yellow mountain saxifrage (Saxifraga aizoides) and birds-eye
primrose (Primula mistassinica).
Indicator – Native plant community composition:
Current Condition
Calcareous Cliff Community – Good: These communities are small, but they occur in
a contained and protected landscape (Howard 2006).
Calcareous Shoreline Outcrop – Good: These communities have high species
richness and occur in a protected landscape. Some consideration should be given to
range of variation in water flow over the falls and the extent to which this influences
community composition (Howard 2006).
Shale Cliff and Talus Communities – Good: The community has high species
richness, is in a protected landscape and is inaccessible.
Shale Talus Slope Woodland – Good: Howard (2006) rated the occurrence of this
community type at this location.
Indicator – Threatened species population stability: Population densities of the
saxifrage and primrose should be monitored to assess trends through time and to
guide management decisions to ensure their long-term success as this site.
Current Condition – Good: No long-term data are available on these species, but
monitoring is planned as part of the Unique Area Unit Management Plan. These
species are known to have persisted here for several decades and given the state
management of the cliff communities, there appears to be good possibilities for long-
term success. Impacts of ice climbing are of potential concern for these species since
ice formations occur along the shaded cliffs that these species occupy.
Via
bilit
y A
na
lys
is –
Sa
lmo
n R
ive
r G
org
e/S
tee
p S
lop
es
213
Indicator – Invasive Species Cover or Frequencies of Occurrence: Table 4 summarizes
viability rankings for community composition based upon the frequency of
occurrence or dominance of invasive species.
Current Condition – Good: No invasive plant species were reported in the Unit
Management Plan to occur in the Unique Area (Sawchuck 2006) but it is unclear
whether a systematic search for invasives had been conducted. The area abuts a
paved road and trails are being developed in certain areas of the unit. Therefore,
potential exists for the establishment and spread of invasive plants.
2.8.3 Other Steep Slope Communities Viability Analysis
In addition to the Gorge, numerous other less prominent areas are known or are likely to
exist in the watershed that provide for unique combinations of habitats such as exposed
bedrock (shale, sandstone or limestone), moist and shaded microenvironments, and talus
slopes. Locations that have unusual or locally uncommon combinations of environmental
conditions provide habitat for rare species.
Several GIS analyses were conducted in an effort to make a first approximation of the
potential locations for steep slope communities or rare biological element occurrences
within the watershed. At this time, these analyses have only limited data to utilize, and
most have not been extensively ground-truthed. Therefore it is likely that the accuracy of
these models is limited. Even still, these analyses provide a starting point for identifying
potentially unique areas in watershed.
Figures 51 through 53 illustrate the results of element distribution models for the
occurrence of various outcrop and steep slope communities, and rare species that utilize
such locations (yellow mountain-saxifrage and birds-eye primrose, Figure 51; smooth
cliff brake, Figure 52; and alpine cliff fern, Figure 53).
Via
bilit
y A
naly
sis
– S
alm
on
Riv
er
Go
rge
/Ste
ep
Slo
pe
s
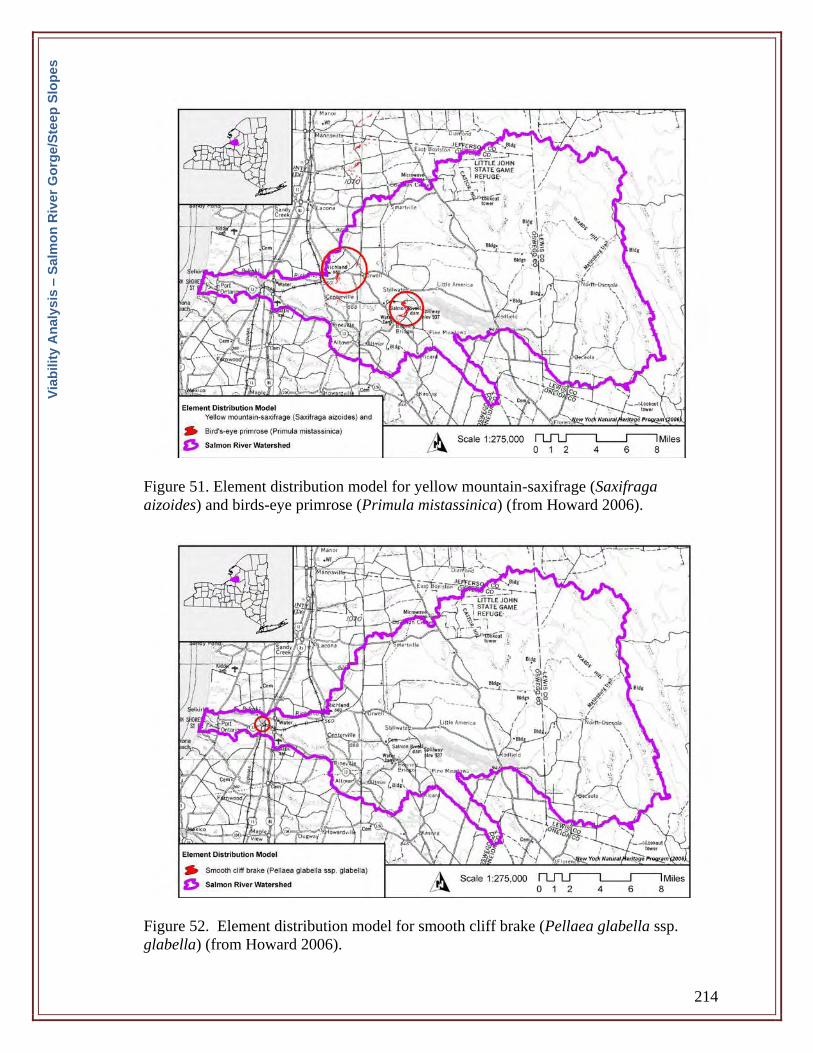
214
Figure 51. Element distribution model for yellow mountain-saxifrage (Saxifraga
aizoides) and birds-eye primrose (Primula mistassinica) (from Howard 2006).
Figure 52. Element distribution model for smooth cliff brake (Pellaea glabella ssp.
glabella) (from Howard 2006).
Via
bilit
y A
naly
sis
– S
alm
on
Riv
er
Go
rge
/Ste
ep
Slo
pe
s
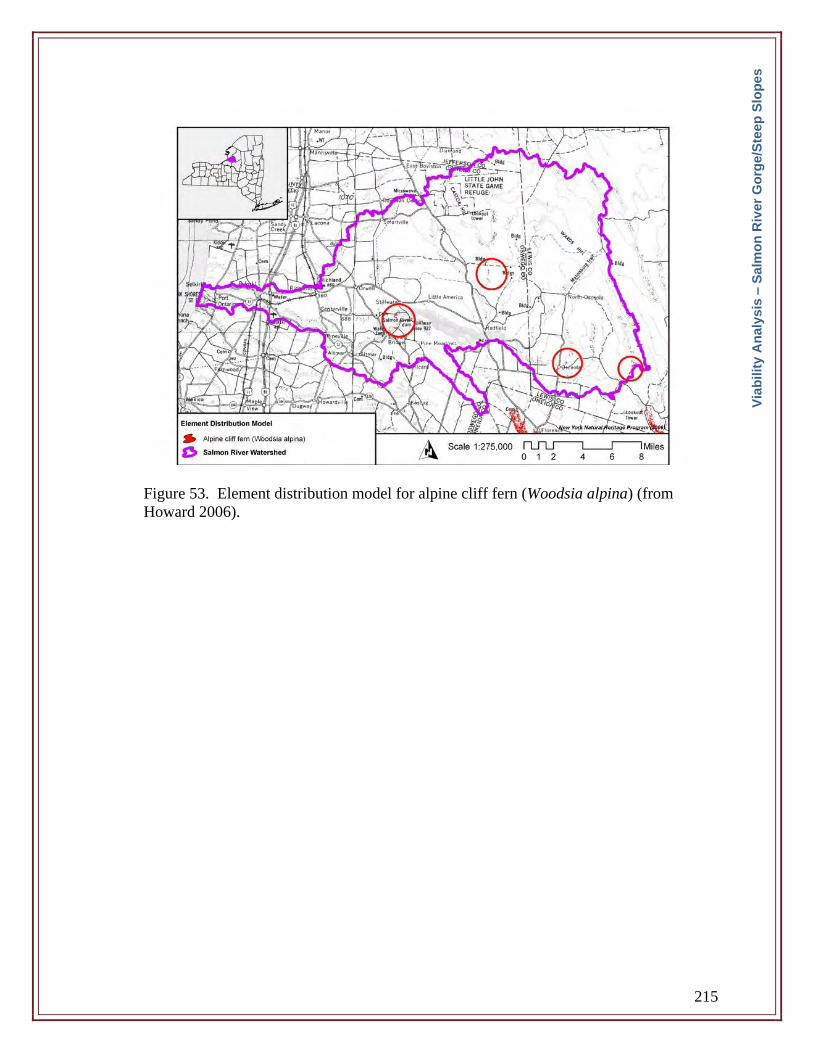
215
Figure 53. Element distribution model for alpine cliff fern (Woodsia alpina) (from
Howard 2006).
Via
bilit
y A
naly
sis
– S
alm
on
Riv
er
Go
rge
/Ste
ep
Slo
pe
s
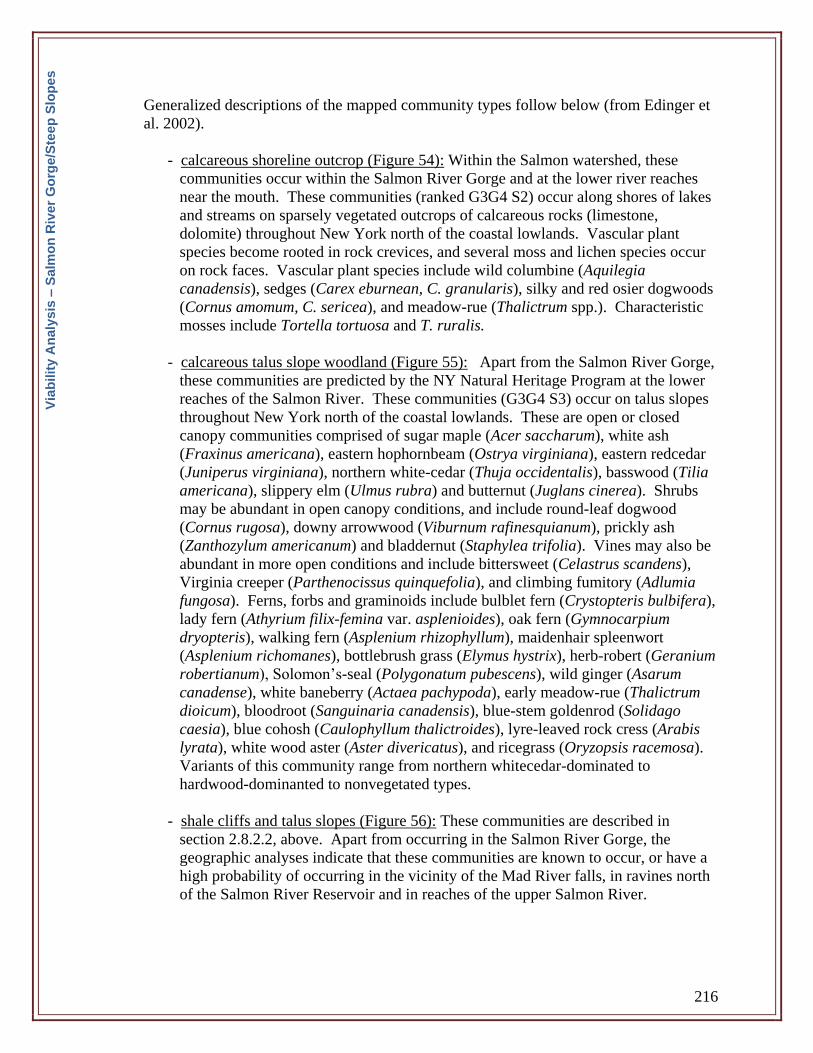
216
Generalized descriptions of the mapped community types follow below (from Edinger et
al. 2002).
- calcareous shoreline outcrop (Figure 54): Within the Salmon watershed, these
communities occur within the Salmon River Gorge and at the lower river reaches
near the mouth. These communities (ranked G3G4 S2) occur along shores of lakes
and streams on sparsely vegetated outcrops of calcareous rocks (limestone,
dolomite) throughout New York north of the coastal lowlands. Vascular plant
species become rooted in rock crevices, and several moss and lichen species occur
on rock faces. Vascular plant species include wild columbine (Aquilegia
canadensis), sedges (Carex eburnean, C. granularis), silky and red osier dogwoods
(Cornus amomum, C. sericea), and meadow-rue (Thalictrum spp.). Characteristic
mosses include Tortella tortuosa and T. ruralis.
- calcareous talus slope woodland (Figure 55): Apart from the Salmon River Gorge,
these communities are predicted by the NY Natural Heritage Program at the lower
reaches of the Salmon River. These communities (G3G4 S3) occur on talus slopes
throughout New York north of the coastal lowlands. These are open or closed
canopy communities comprised of sugar maple (Acer saccharum), white ash
(Fraxinus americana), eastern hophornbeam (Ostrya virginiana), eastern redcedar
(Juniperus virginiana), northern white-cedar (Thuja occidentalis), basswood (Tilia
americana), slippery elm (Ulmus rubra) and butternut (Juglans cinerea). Shrubs
may be abundant in open canopy conditions, and include round-leaf dogwood
(Cornus rugosa), downy arrowwood (Viburnum rafinesquianum), prickly ash
(Zanthozylum americanum) and bladdernut (Staphylea trifolia). Vines may also be
abundant in more open conditions and include bittersweet (Celastrus scandens),
Virginia creeper (Parthenocissus quinquefolia), and climbing fumitory (Adlumia
fungosa). Ferns, forbs and graminoids include bulblet fern (Crystopteris bulbifera),
lady fern (Athyrium filix-femina var. asplenioides), oak fern (Gymnocarpium
dryopteris), walking fern (Asplenium rhizophyllum), maidenhair spleenwort
(Asplenium richomanes), bottlebrush grass (Elymus hystrix), herb-robert (Geranium
robertianum), Solomon’s-seal (Polygonatum pubescens), wild ginger (Asarum
canadense), white baneberry (Actaea pachypoda), early meadow-rue (Thalictrum
dioicum), bloodroot (Sanguinaria canadensis), blue-stem goldenrod (Solidago
caesia), blue cohosh (Caulophyllum thalictroides), lyre-leaved rock cress (Arabis
lyrata), white wood aster (Aster divericatus), and ricegrass (Oryzopsis racemosa).
Variants of this community range from northern whitecedar-dominated to
hardwood-dominanted to nonvegetated types.
- shale cliffs and talus slopes (Figure 56): These communities are described in
section 2.8.2.2, above. Apart from occurring in the Salmon River Gorge, the
geographic analyses indicate that these communities are known to occur, or have a
high probability of occurring in the vicinity of the Mad River falls, in ravines north
of the Salmon River Reservoir and in reaches of the upper Salmon River.
Via
bilit
y A
naly
sis
– S
alm
on
Riv
er
Go
rge
/Ste
ep
Slo
pe
s

217
- shoreline outcrop (Figure 57): These communities (NY Heritage ranking G5 S5)
are mapped at the lower reaches of the Salmon River near the mouth. They occur
along shores of lakes and streams on sparsely vegetated outcrops of noncalcareous
rocks throughout New York north of the coastal lowlands. These shorelines are
normally exposed to wave action and ice scour. A variety of lichens and vascular
plant species adapted to open conditions and shallow soils occur in these habitats
including blueberries (Vaccinium angustifolium, V. pallidum), huckleberry
(Gaylussacia baccata), poverty-grass (Danthonia spicata), hairgrass (Deschampsia
flexuosa) along with several lichen species. More data are required on this
community type.
Via
bilit
y A
naly
sis
– S
alm
on
Riv
er
Go
rge
/Ste
ep
Slo
pe
s
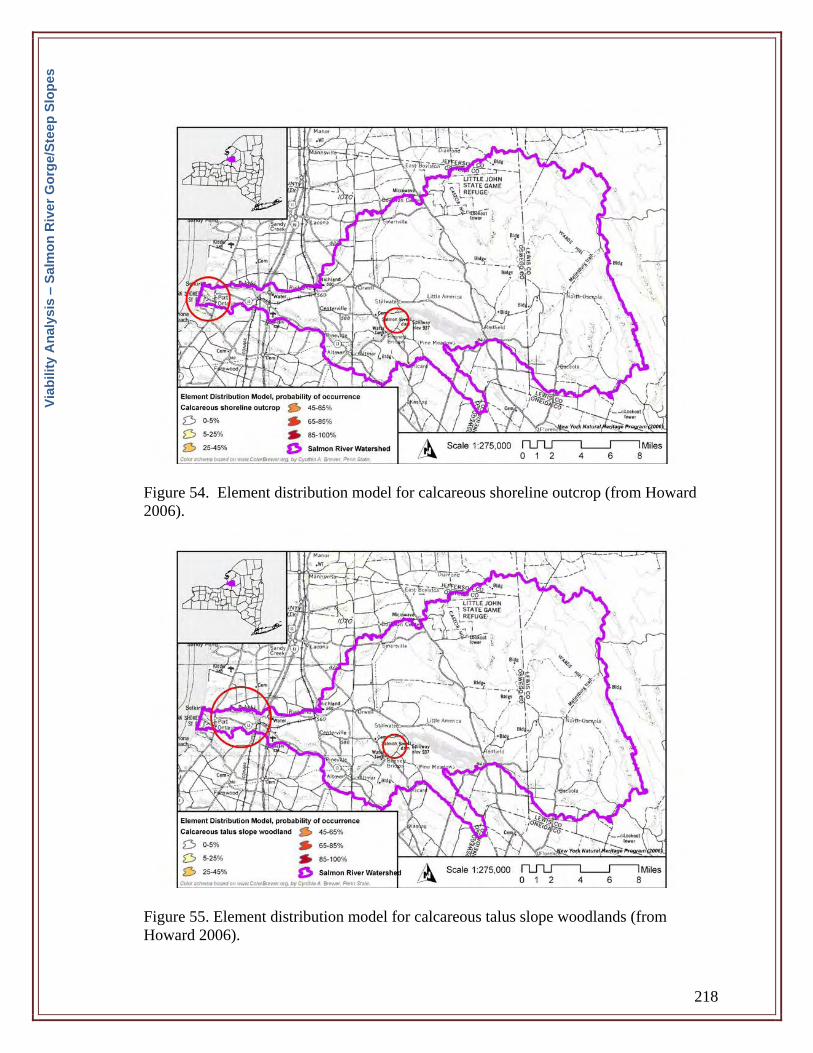
218
Figure 54. Element distribution model for calcareous shoreline outcrop (from Howard
2006).
Figure 55. Element distribution model for calcareous talus slope woodlands (from
Howard 2006).
Via
bilit
y A
naly
sis
– S
alm
on
Riv
er
Go
rge
/Ste
ep
Slo
pe
s
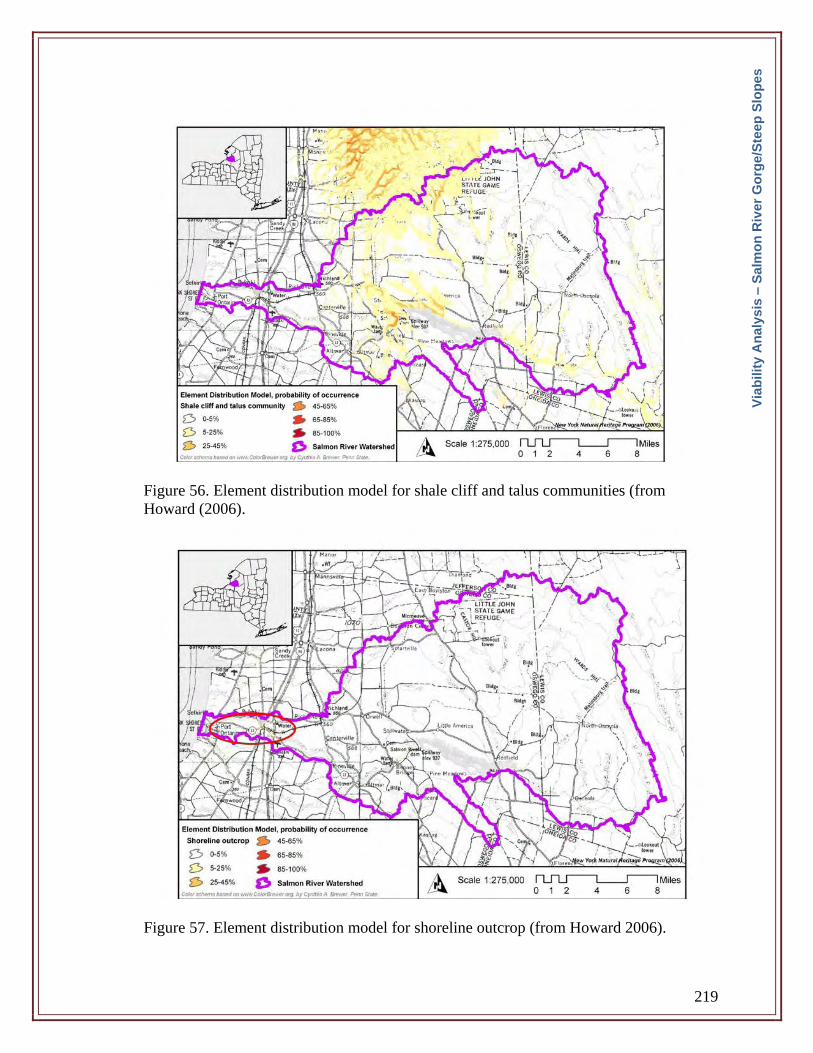
219
Figure 56. Element distribution model for shale cliff and talus communities (from
Howard (2006).
Figure 57. Element distribution model for shoreline outcrop (from Howard 2006).
Via
bilit
y A
naly
sis
– S
alm
on
Riv
er
Go
rge
/Ste
ep
Slo
pe
s
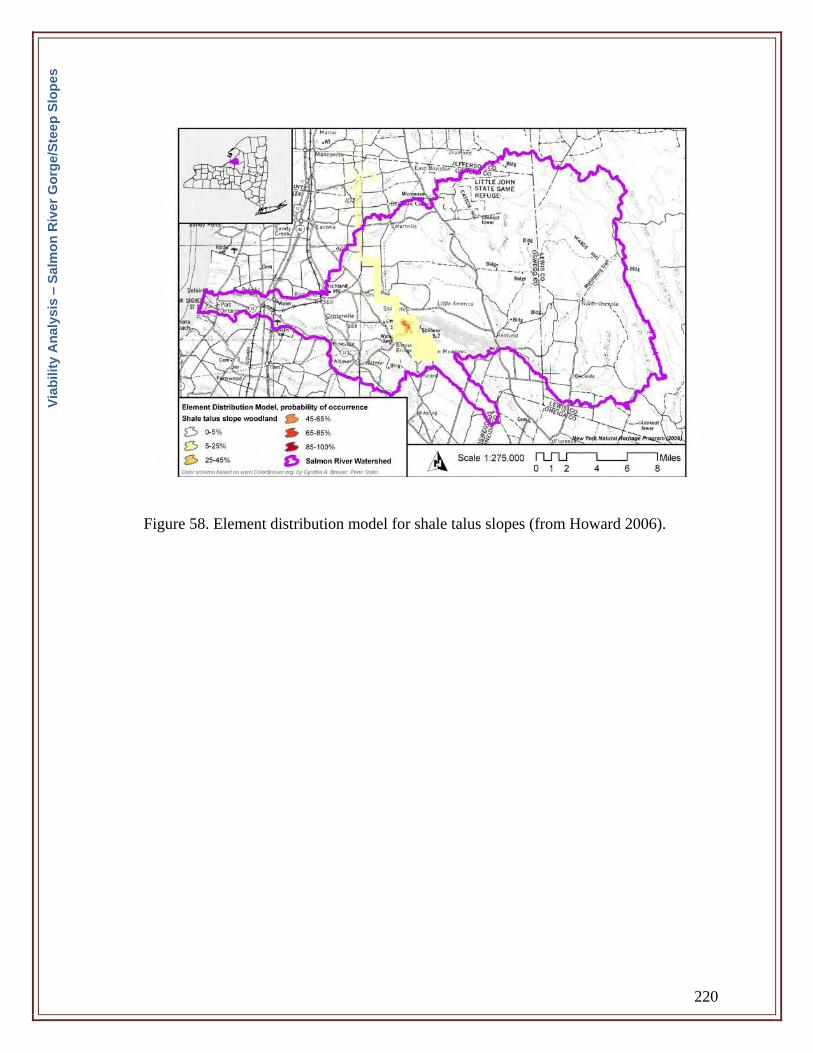
220
Figure 58. Element distribution model for shale talus slopes (from Howard 2006).
Via
bilit
y A
naly
sis
– S
alm
on
Riv
er
Go
rge
/Ste
ep
Slo
pe
s

221
2.8.3.1 Key Ecological Attributes, Indicators and Viability Ranking for Steep Slope
Communities and Species
There is currently no information, with the exception of the element distribution models,
on the actual distribution, community composition and viability ranking of the other steep
slope communities in the watershed.
Via
bilit
y A
naly
sis
– S
alm
on
Riv
er
Go
rge
/Ste
ep
Slo
pe
s
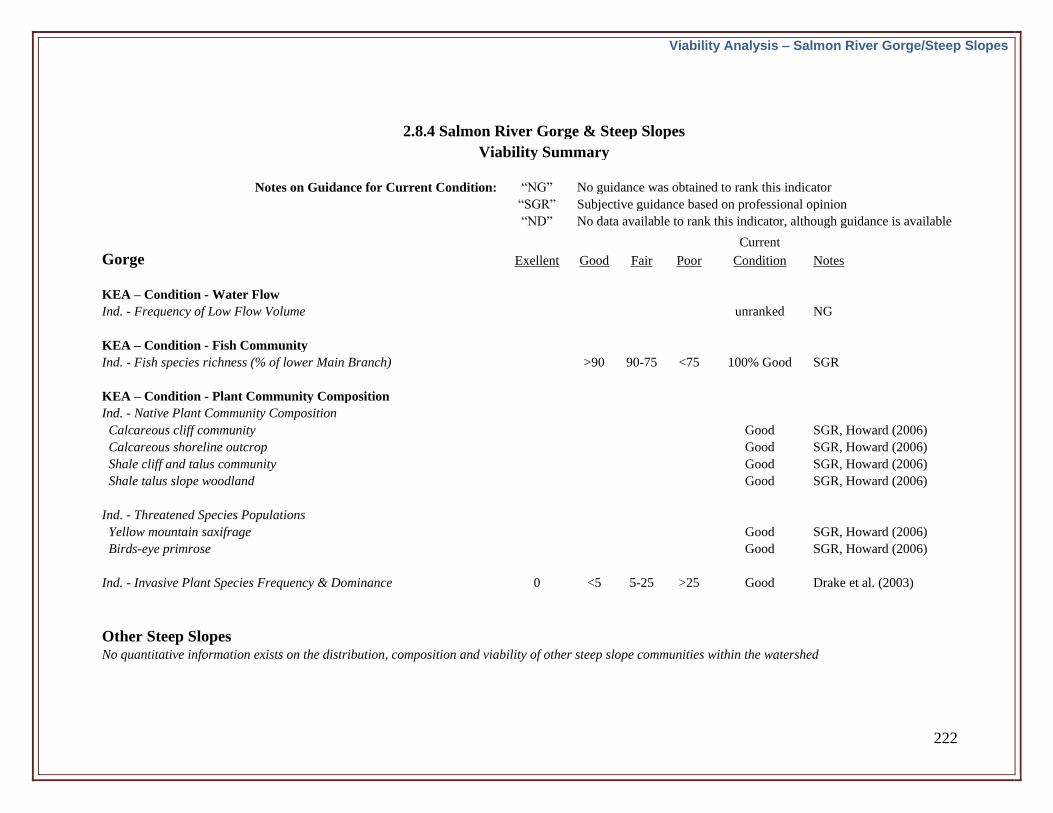
222
2.8.4 Salmon River Gorge & Steep Slopes
Viability Summary
Notes on Guidance for Current Condition: “NG” No guidance was obtained to rank this indicator
“SGR” Subjective guidance based on professional opinion
“ND” No data available to rank this indicator, although guidance is available
Current
Gorge Exellent Good Fair Poor Condition Notes
KEA – Condition - Water Flow
Ind. - Frequency of Low Flow Volume unranked NG
KEA – Condition - Fish Community
Ind. - Fish species richness (% of lower Main Branch) >90 90-75 <75 100% Good SGR
KEA – Condition - Plant Community Composition
Ind. - Native Plant Community Composition
Calcareous cliff community Good SGR, Howard (2006)
Calcareous shoreline outcrop Good SGR, Howard (2006)
Shale cliff and talus community Good SGR, Howard (2006)
Shale talus slope woodland Good SGR, Howard (2006)
Ind. - Threatened Species Populations
Yellow mountain saxifrage Good SGR, Howard (2006)
Birds-eye primrose Good SGR, Howard (2006)
Ind. - Invasive Plant Species Frequency & Dominance 0 <5 5-25 >25 Good Drake et al. (2003)
Other Steep Slopes
No quantitative information exists on the distribution, composition and viability of other steep slope communities within the watershed
Viability Analysis – Salmon River Gorge/Steep Slopes
223
3.0 REFERENCES CITED
Aber, J.D., C.L. Goodale, S.V. Ollinger, M.L. Smith, A.H. Magill, M.E. Martin, R.A. Hallett, J.L. Stoddard.
2003. Is nitrogen deposition altering the nitrogen status of Northeastern forests. Bioscience 53:375-389
Albert, D.A. 2001. Natural community abstract for Great Lakes marsh. Michigan Natural Features Inventory,
Lansing, MI, 11p. <http://web4.msue.msu.edu/mnfi/abstracts/ecology/Great_lakes_marsh.pdf>.
Alerich, C.L. and D.A. Drake. 1995. Forest Statistics for New York: 1980 and 1993. USDA Forest Service
Resource Bulletin NE-132. USDA Forest Service, Radnor, PA.
Anderson, M., S. Bernstein, F. Lowenstein, N. Smith and S. Pickering. 2004. Determining the Size of Eastern
Forest Reserves. The Nature Conservancy, Conservation Science Program, Boston, MA.
APIPP 2007. Terrestrial Invasive Plant Project. Adirondack Park Invasive Plant Program. March 22, 2007
<http://www.adkinvasives.com/Index.html>.
Arbogast, C., Jr. 1957. Marking Guides for Northern Hardwoods Under the Selection System. USDA Forest
Service, Lake States Experiment Station Technical Note 337.
Aubry, K.B., L.L.C. Jones, and P.A. Hall. 1988. Use of woody debris by plethodontid salamanders in Douglas-
fir forests in Washington. In: Management of amphibians, reptiles and small mammals in North America:
proceedings of the symposium. Technical coordination by Szaro, R.C., Severson, K.E., and Patton, D.R.
USDA Forest Service General Technical Report RM-166. p. 32-37.
Bader, P., S. Jansson, and B.G. Jonsson. 1995. Wood-inhabiting fungi and substratum decline in selectively
logged boreal spruce forests. Biological Conservation 72:355-362.
Bailey, S.W., S.B. Horsley, R.P. Long and R.A. Hallett. 2004. Influence of edaphic factors on sugar maple
nutrition and health on the Allegheny Plateau. Soil Science Society of America Journal 68:243-252.
Baird, A.R.T and D.G. Wetmore. 2006. Riparian Buffers Modifications and Mitigation Guidance Manual.
Virginia Dept. of Conservation and Recreation, Chesapeake Bay Local Assistance. Richmond, VA.
<http://www.cblad.state.va.us/ripbuffstat.cfm>.
Bedford, B.L. and K.S. Godwin. 2003. Fends of the United States: distribution, characteristics and scientific
connection versus legal isolation. Wetlands 23(3):608-629.
Bierzychudek, P. 1982. Life histories and demography of shade-tolerant temperate forest herbs: a review. New
Phytologist 90:757-776.
Bode, R.W., M.A. Novak and L.E. Abele. 1996. Quality Assurance Work Plan for Biological Stream
Monitoring in New York State. New York State Department of Environmental Conservation, Albany, NY.
89 pp.
Bode, R.W., M.A. Novak and L.E. Abele. 1997. Salmon River Biological Assessment. New York State
Department of Environmental Conservation, Bureau of Watershed Assessment and Research, Division of
Water, Albany, NY.
Bohn, K.K. and R.D. Nyland. 2006. Long-term monitoring of stand development after selection system
silviculture in uneven-aged northern hardwoods of New York State. Pages 53-61 In: Irland, L.C., A.E.
Camp, J.C. Brissette and Z.R. Donohew (Eds.) Long-term Silvicultural and Ecological Studies: Results for
Re
fere
nce
s

224
Science and Management. The Global Institute of Sustainable Forestry GISF Research Paper 005. Yale
University, New Haven, CT.
Bonanno, S.E. 1992. Vegetation of a Lake Ontario Dune Barrier, Oswego and Jefferson Counties, New York,
Under High and Low Recreation Pressure. MS Thesis. State University of New York – College of
Environmental Science and Forestry, Syracuse, NY. 80 p.
Brabrand, A., A.G. Koestler and R. Borgstrom. 2002. Lake spawning of brown trout related to groundwater
influx. Journal of Fish Biology 60:751-763.
Brocke, R.H. and J.P. Zarnetske. 1974. Wild Animals and Fish. Pages 158-232 In: Resources of the Tug Hill
Region. Prepared for The Temporary Commission on Tug Hill by the State University of New York College
of Environmental Science and Forestry, Syracuse, NY.
Carlson, D.M., T.P. Simon, R.L. Dufour and A.J. Carlson. 2006. Fish collections and assemblages as indicators
of conditions in shallow areas of New York’s Lake Ontario and connecting waters. Pages 507-523 In T.P.
Simon and P.M. Stewart. Coastal Wetlands of the Laurentian Great Lakes: Health, Habitat and Indicators.
Bloomington IN.
Chambers, R.E. 1983. Integrating Timber and Wildlife Management. State University of New York College of
Environmental Science and Forestry. Syracuse, NY.
Conner, P.F. 1966. The Mammals of the Tug Hill Plateau, New York. New York Museum and Science Service,
State University of New York, Bulletin No. 406. Albany, NY.
Cornell Lab of Ornithology. 2007. All About Birds. 11 April 2007.
<http://www.birds.cornell.edu/AllAboutBirds/BirdGuide/Pied-billed_Grebe_dtl.html>.
Cowardin, L.M., V. Carter, F.C. Golet and E.T. LaRoe. 1979. Classification of Wetlands and Deepwater
Habitats of the United States. Office of Biological Services, US Fish and Wildlife Service, Washington, D.C.
Coughlin, S.M., Jr. 2004. Atlantic Salmon Restoration in the Southern Lake Ontario Watershed: Evaluating
Anthropogenic, Bioenergetic and Competitive Constraints. PhD Disseration, State University of New York -
College of Environmental Science and Forestry, Syracuse, NY.
Cressey, G.B. 1966. Land Forms. Chapter 7 In: Thompson, J.D. (ed.) Geography of New York State. Syracuse
University Press, Syracuse, NY.
DeGraaf, R.M., M. Yamasaki, W.B. Leak and J.W. Lanier. 1992. New England Wildlife: Management of
Forested Habitats. USDA Forest Service General Technical Report NE-144. Radnor, PA. 271 p.
Drake, S., J.F. Weltzin and P.D. Parr. 2003. Assessment of non-native invasive plant species on the United State
Department of Energy Oak Ridge National Environmental Research Park. Castanea 68:15-30.
Drexler, J.Z. and B.L. Bedford. 2002. Pathways of nutrient loading and impacts on plant diversity in a New
York peatland. Wetlands 22(2):263-281.
Driscoll, C.T., K.M. Driscoll, M.J. Mitchell and D.J. Raynal. 2003a. Effects of acidic deposition on forest and
aquatic ecosystems in New York State. Environmental Pollution 123:327-336.
Driscoll, C.T. Y-J Han, C.Y. Chen, D.C. Evers, K.F. Lambert, T.M. Holsen, N.C. Kamman and R.K. Munson.
2007. Mercury contamination in forest and freshwater ecosystems in the Northeastern United States.
BioScience 57:17-28.
Re
fere
nce
s
225
Driscoll, C.T., G.B. Lawrence, A.J. Bulger, T.J. Butler, C.S. Cronan, C. Eagar, K.F. Lambert, G.E. Likens, J.L.
Stoddard, and K.C. Weathers. 2001. Acidic deposition in the northeastern United States: sources and inputs,
ecosystem effects and management strategies. BioScience 51:180-198.
Driscoll, D.T., D.Whitall, J.Aber, E. Boyer, M. Castro, C. Cronan, C. L. Goodale, P. Groffman, C. Hopkinson,
K. Lambert, G. Lawrence and S. Ollinger. 2003b. Nitrogen pollution in the northeastern United States:
sources, effects, and management options. BioScience 53(4):357-374.
Dru Associates, Inc. 2001. Salmon River Greenway Corridor Bio-Inventory: Final Report. Dru Assoc., Glen
Cove, NY.
Eastern Brook Trout Join Venture. 2005. Conserving the Eastern Brook Trout: An Overview of Status, Threats
and Trends. Conservation Strategy Work Group, Eastern Brook Trout Join Venture.
<http://www.mmbtu.org/Conserving_Eastern_Brook_Trout.pdf>.
Edinger, G.J., D.J. Evans, S. Gebauer, T.G. Howard, D.M. Hunt and A.M. Olivero (Editors). 2002. Ecological
Communities of New York State. 2nd Edition. A revised and expanded edition of Carol Reschke’s Ecological
Communities of New York State. (Draft for review). New York Natural Heritage Program, New York State
Department of Environmental Conservation, Albany, NY. 9 February 2007
<http://www.dec.state.ny.us/website/dfwmr/heritage/draft_ecny2002.htm >.
Eschner, A., J. Osinski, D. Howe and S. Schupe. 1974. Water Resources. Pages 86-119 In: Resources of the
Tug Hill Region. Prepared for The Temporary Commission on Tug Hill by the State University of New York
College of Environmental Science and Forestry, Syracuse, NY.
Everitt, D.W. 2006. Natural Reproduction and Spawning Site Characteristics of Chinook Salmon
(Oncorhynchus tshawytscha) in the Salmon River, New York. MS Thesis. State University of New York –
College of Environmental Science and Forestry, Syracuse, NY.
Evers, D.C. and M. Duron. 2006. Developing an Exposure Profile for Mercury in Breeding Birds of New York
and Pennsylvania, 2005. Report BRI 2006-11 submitted to The Nature Conservancy. BioDiversity Research
Institute, Gorham, ME.
Evers, D.C., Y. Han, C.T. Driscoll, N.C. Kamman, M. Goodale, K.F. Lambert, T.M. Holsen, C.Y. Chen, T.A.
Clair and T. Butler. 2007. Biological mercury hotspots in the northeastern United States and southeastern
Canada. BioScience 57:29-43.
Faigenbaum, H.M. 1940. Chemical investigation of the Lake Ontario watershed. Pages 117-146 In: A
Biological Survey of the Lake Ontario Watershed. State of New York Conservation Department.
Fenn, M.E., M.A. Poth, J.D. Aber, J.S. Baron, B.T. Bormann, D.W. Johnson, A.D. Lemly, S.G. McNulty, D.F.
Ryan and R. Stottlemyer. 1998. Nitrogen excess in North American ecosystems: predisposing factors,
ecosystem responses and management strategies. Ecological Applications 8:706-733.
FERC. 1996. License Agreement with Niagara Mohawk Power Corporation. Project no. 11408-000. Issued
February 21, 1996. US Federal Energy Regulatory Commission.
Ferguson, R.H. and C.E. Mayer. 1970. The Timber Resources of New York. US Department of Agriculture
Forest Service. Resource Bulletin NE-20. Northeast Forest Research Station. Radnor, PA.
Flebbe, P. and A. Dolloff. 1995. Trout use of woody debris and habitat in Appalachian Wilderness streams of
North Carolina. North American Journal of Fisheries Management 15: 579-590
Forester, D. 2007. Salmon River Watershed Assessment, Workshop I: Natural Resource Targets. Prepared for
The New York State Tug Hill Commission, Watertown, NY.
Re
fere
nce
s
226
Fox, L.B. 1990. Ecology and Population Biology of the Bobcat, Felis rufus, in New York. PhD Dissertation.
State University of New York – College of Environmental Science and Forestry. Syracuse, NY.
Frelich, L.E. and C.G. Lorimer. 1991a. Natural disturbance regimes in hemlock-hardwood forests of the Upper
Great Lakes Region. Ecological Monographs 61:145-164.
Frelich, L.E. and C.G. Lorimer. 1991b. A simulation of landscape-level stand dynamics in the northern
hardwood region. Journal of Ecology 79:223-233.
Geiss, J.W., L.M. Cutler and J.W. Mundy. 1974. Vegetation and Land Use. Pages 122-155 In: Resources of the
Tug Hill Region. Prepared for The Temporary Commission on Tug Hill by the State University of New York
College of Environmental Science and Forestry, Syracuse, NY.
Gibbs, J.P. and W.G. Shriver. 2005. Can road mortality limit populations of pool-breeding amphibians?
Wetland Ecology and Management 13(3):281-289.
Grayson, T.H., L.F. Cooper, A.B. Wrathmell, J.R. Evenden, J. Roper, J. Andrew and M.L. Gilpin. 2002. Host
responses to Renibacterium salmoninarum and specific components of the pathogen reveal the mechanisms
of immune suppression and activation. Immunology 106: 273-283.
Hallock, J.L. 2003. Effects of a Recently-Licensed Hydroelectric Project and Channel Gradient on Benthic
Macroinvertebrates in the Salmon River, New York. M.S. Thesis. State University of New York – College
of Environmental Science and Forestry, Syracuse, NY.
Hansen, A.J., T.A. Spies, F.J. Swanson, and J.L. Ohmann. 1991. Conserving biodiversity in managed forests:
lessons from natural forests. BioScience 41:382-392.
Hanula, J.L. 1996. Relationship of wood-feeding insects and coarse woody debris. Pages 55-81 In: Biodiversity and
coarse woody debris in southern forests. Proceedings of the workshop on coarse woody debris in southern
forests: effects on biodiversity. Edited by: McMinn, J.W. and D.A. Crossley, Jr. USDA Forest Service General
Technical Report SE-94. Ashville, NC.
Hayes, J.P. and S.P. Cross. 1987. Characteristics of logs used by western red-backed voles, Clethrionomys
californicus, and deer mice, Peromyscus maniculatus. Canadian Field Naturalist 101:543-546.
Haynes, J.M., S.T. Wellman and J.J. Pagano. 2007. RAP Progress in the Rochester Embayment of Lake Ontario:
Population Monitoring, Trophic Relationships, and Levels of Bioaccumulative Chemicals of Concern in Mink, a
Sentinel Species. Final Report to The New York Great Lakes Protection Fund, Buffalo, NY.
Harman, W.N., M.F. Albright, P.H. Lord and D. King. 2000. The nuisance aquatic macrophytes of Oswego
County: 1998-1999 update on the distributions of plants in 15 selected aquatic environments. SUNY-
Oneonta Biological Field Station BFS Technical Report #7. Cooperstown, NY.
Harmon, M.E., J.F. Franklin, F.J. Swanson, P. Sollins, S.V. Gregory, J.D. Lattin, N.H. Anderson, S.P. Cline,
N.J. Aumen, J.R. Sedell, G.W. Lienkaemper, K. Cromack, Jr., and K.W. Cummins. 1986. Ecology of coarse
woody debris in temperate ecosystems. Pages 133-276 In: Advances in Ecological Research, Vol. 15. Edited
by MacFadyen, A. and Ford, E.D. Academic Press. New York, NY.
Hels, T. and E. Buchwald. 2001. The effect of road kills on amphibian populations. Biological Conservation
99(3): 331-340.
Hotchkiss, N. 1932. A Botanical Survey of the Tug Hill Plateau. New York State Museum Bulletin No. 287.
The University of the State of New York, Albany, NY.
Re
fere
nce
s

227
Horsley, S.B., R.P. Long, S.W. Bailey, R.A. Hallet and T.J. Hall. 1999. Factors contributing to sugar maple
decline along topographic gradients on the glaciated and unglaciated Allegheny Plateau. Pages 60-62 In:.)
Sugar Maple Ecology and Health: Proceedings of an International Symposium. Edited by: Horsley, S.B. and
R.P. Long. USDA Forest Service General Technical Report NE-261.
Houston, D.R., 1994. Major now tree disease epidemics: beech bark disease. Annual Review of Phytopathology.
32:75-87.
Howard, T.G. 2006. Salmon River Watershed Inventory and Landscape Analysis. Prepared for the New York
State Tug Hill Commission. The New York Natural Heritage Program, New York State Department of
Environmental Conservation, Albany, NY.
Hunt, D.M., G.J. Edinger, A. L. Feldmann, J.J. Schmid and C.N. Voight. 2005. Tug Hill: Stream System
Inventory & Watershed Integrity Analysis. NY Natural Heritage Program, Albany, NY.
Hurd, T., K. Gokkaya, B.D. Kiernan and D.J. Raynal. 2005. Nitrogen sources in Adirondack wetlands
dominated by nitrogen-fixing shrubs. Wetlands 25(1):192-199.
Illinois Groundwater Consortium. 1995. Artificial Wetlands are Working to Reduce Nitrogen Pollution.
Groundwater Bulletin No. 2. Southern Illinois University, Carbondale, IL.
ILOSLR Study Board 2006. Options for Managing Lake Ontario and St. Lawrence River Water Levels and
Flows. International Lake Ontario – St. Lawrence River Study Board. Final Report to the International Joint
Commission, Ottawa, ON.
Johnson, J.H. 1978. Natural Rproduction and Juvenile Ecology of Pacific Salmon and Steelhead Trout in
Tributaries of the Salmon River, New York. MS Thesis. State University of New York - College of
Environmental Science and Forestry, Syracuse, NY.
Johnson, J.H. and N.H. Ringler. 1981. Natural reproduction and juvenile ecology of Pacific salmon and rainbow
trout in tributaries of the Salmon River, New York. New York Fish and Game Journal. 28:49-60.
Keller, J.K., M.E. Richmond and C.R. Smith. 2003. An explanation of patterns of breeding bird species richness
and density following clearcutting in northeastern USA forests. Forest Ecology and Management 174:541-
544.
Kennen, J.G., S.J. Wisniewski, N. H. Ringler and H.M. Hawkinds. 1994. Application and modification of an
auger trap to quantify emigrating fishes in Lake Ontario tributaries. North American Journal of Fisheries
Management 14:828-836.
Klapproth, J.C. and J.E. Johnson. 2000. Understanding the science behind riparian forest buffers: effects on
water quality. Virginia Cooperative Extension, Virginia Polytechnic Institute. Publication No. 420-151.
<http://www.ext.vt.edu/pubs/forestry/420-151/420-151.html>.
Kozuchowski, E., C. Millard, C. Lowie and E.A. Poole. 1994. Fisheries Enhancement Plan for the Salmon
River, New York. US Fish and Wildlife Service. Administrative Report 94-04. Amherst, NY.
Leaf, A.L. and R.F. Wittwer. 1974. Soils and Geology. Pages 8-35 In: Resources of the Tug Hill Region.
Prepared for The Temporary Commission on Tug Hill by the State University of New York College of
Environmental Science and Forestry, Syracuse, NY.
Loeb, S.C. 1996. The role of coarse woody debris in the ecology of southeastern mammals. Pages 108-188 In:
Biodiversity and coarse woody debris in southern forests. Proceedings of the workshop on coarse woody debris
in southern forests: effects on biodiversity. Edited by: McMinn, J.W. and D.A. Crossley, Jr. USDA Forest
Service General Technical Report SE-94. Ashville, NC.
Re
fere
nce
s

228
Loukmas, J.J., S.O. Quinn and J. Bloomfield. 2006. Total and Methyl Mercury in the Neversink Reservoir
Watershed. New York State Department of Environmental Conservation, Division of Fish, Wildlife and Marine
Resources, and Division of Water. Albany, NY.
Lovett, G.M., K.C. Weathers and W.V. Sobczak. 2000. Nitrogen saturation and retention in forested watersheds
of the Catskill Mountains, New York. Ecological Applications 10:73-84.
Magill, A.H., J.D. Aber, J.J. Hendricks, R.D. Bowden, J.M. Melillo and P.A. Steudler. 1997. Biogeochemical
response of forest ecosystems to simulated chronic nitrogen deposition. Ecological Applications 7:402-415.
McKenny, H.C., W.S. Keeton and T.M. Donovan. 2006. Effects of structural complexity enhancement on
eastern red-backed salamander (Plethodon cinereus) populations in northern hardwood forests. Forest
Ecology and Management 230:186-196.
McGee, G.G. 2000. The contribution of beech bark disease-induced mortality to coarse woody debris loads in
northern hardwood stands of Adirondack Park, New York, USA. Canadian Journal of Forest Research
30:1453-1462.
McGee, G.G. and R.W. Kimmerer. 2002. Forest age and management effects on epiphytic bryophyte
communities in Adirondack northern hardwood forests, New York, USA. Canadian Journal of Forest
Research.32:1562-1576.
McGee, G.G., D.J. Leopold, and R.D. Nyland. 1999. Structural characteristics of old-growth, maturing, and
partially-cut northern hardwood stands. Ecological Applications 9:1316-1329.
McKenna, J.E., Jr. and J.H. Johnson. 2005. Juvenile rainbow trout production in New York tributaries of Lake
Ontario: implications for Atlantic salmon restoration. North American Journal of Fisheries Management
25:391-403.
McKenna, J.E., Jr., J.P. McDonald, C. Castiglione, S.S. Morrison, K.P. Kowalski and D.R. Passino-Reader.
2006. A broadscale fish habitat model development process: Genesee Basin, New York. American Fisheries
Society Symposium 48:533-554.
McNamara, R. 1999. Tug Hill: A Four Season Guide to the Natural Side. North Country Books, Utica, NY.
Mehaffey, M.H., M.S. Nash, T.G. Wade, C.M. Edmonds, D.W. Ebert, K.B. Jones and A. Rager. 2001. A
Landscape Assessment of the Catskill/Delaware Watersheds 1975-1988: New York City’s Water Supply
Watersheds. EPA/600/R-01/075. US Environmental Protection Agency, Washington, DC.
<http://www.epa.gov/nerlesd1/land-sci/ny.htm >.
Meixler, M.S., K.A. Arend and M.B. Bain. 2005. Fish community support in wetlands within protected
embayments of Lake Ontario. Journal of Great Lakes Research 31(1):188-196.
Michigan DNR. 2007. Fish Identification. Michigan Department of Natural Resources.
<http://www.michigan.gov/dnr/0,1607,7-153-10364_18958---,00.html>.
Miller, T.S., D.A. Sherwood and M.M. Krebs. 1989. Hydrology and Water Quality of the Tug Hill Glacial
Aquifer in Northern New York. US Geological Survey. Ithaca, NY.
Mueller, D.K. and D.R. Helsel. 1996. Nutrients in the Nation’s Waters – Too Much of a Good Thing? US
Geological Survey Circular 1136. <http://water.usgs.gov/nawqa/circ-1136/h6.html#PHOS>.
NADP. 2007. National Atmospheric Deposition Program (NRSP-3). NADP Program Office, Illinois State
Water Survey, Champaign, IL, USA. 15 February 2007. <http://nadp.sws.uiuc.edu/>.
Re
fere
nce
s
229
NCSS. 1981. Soil Survey of Oswego County, New York. USDA Soil Conservation Service, National
Cooperative Soil Survey. Washington, DC.
New York Conservation Department. 1939. A Biological Survey of the Lake Ontario Watershed. Supplemental
to 29th Annual Report, 1939. J.B. Lyon Company, Albany, NY.
New York State Invasive Species Task Force. 2005. Final Report of the New York State Invasive Species Task
Force, Public Review Draft. Albany, NY.
<http://www.dec.state.ny.us/website/dfwmr/habitat/istf/istfdraft.pdf>.
Novak, M.A. and R. W. Bode. 1992. Percent model affinity: a new measure of macroinvertebrate community
composition. Journal of the North American Benthological Society 11(1):80-85.
NRCS. 2007. Wetland Functions and Values Fact Sheet. USDA Natural Resources Conservation Service,
Washington, DC. 5 April 2007. <http://www.nrcs.usda.gov/programs/farmbill/1996/FuncFact.html>.
Nyland, R.D. 1996. Silviculture Concepts and Applications. McGraw-Hill, Boston, MA.
NYSDEC. 2006a. New York State Comprehensive Wildlife Conservation Strategy. New York State
Department of Environmental Conservation, Albany, NY.
<http://www.dec.state.ny.us/website/dfwmr/swg/cwcsmainpg.html>.
NYSDEC. 2006b. DEC Investigates Death of Lake Ontario Water Birds. New York State Department of
Environmental Conservation, Press Office, Albany, NY. Press Release (10/24/2006). 18 January 2008.
<http://www.dec.ny.gov/press/12707.html>.
NYSDEC. 2006c. Section 303(d) List of Impaired Waters Requiring a TMDL. New York State Department of
Environmental Conservation, Division of Water, Albany, NY. 13 March 2007.
<http://www.dec.state.ny.us/website/dow/303d2006.pdf>.
NYSDEC. 2007a. Freshwater Wetlands Program. New York State Department of Environmental Conservation,
Division of Fish, Wildlife and Marine Resources, Albany, NY. 5 April 2007.
<http://www.dec.state.ny.us/website/dfwmr/habitat/fwwprog.htm#wet>.
NYSDEC. 2007b. New York Amphibian and Reptile Atlas. New York State Department of Environmental
Conservation, Albany, NY. 23 February 2007. <http://www.dec.ny.gov/animals/7140.html >.
NYSDEC. 2007c. LIP Grassland Protection Program. New York State Department of Environmental
Conservation, Bureau of Wildlife, Albany, NY. 5 April 2007.
<http://www.dec.state.ny.us/website/dfwmr/wildlife/lip/lipgrasslands.html>.
NYSDEC. 2008. Lake Sturgeon Fact Sheet. New York State Department of Environmental Conservation,
Bureau of Fisheries, Albany, NY. 16 April 2008. <http://www.dec.ny.gov/animals/26035.html>.
NYSDOH. 2006. Chemicals in Sportfish and Game: 2006-07 Health Advisories. New York State Department
of Health, Albany, NY. <http://www.health.state.ny.us/environmental/outdoors/fish/docs/fish.pdf>.
NYSISTF. 2005. Final Report of the New York State Invasive Species Task Force, Public Review Draft.
Albany, NY. <http://www.dec.state.ny.us/website/dfwmr/habitat/istf/istfdraft.pdf>.
NYSOPS. 1972. LUNR Classification Manual. State of New York Office of Planning Services, Albany, NY.
Osmond, D.L., D.E. Line, J.A. Gale, R.W. Gannon, C.B. Knott, K.A. Bartenhagen, M.H. Turner, S.W. Coffey,
J. Spooner, J. Wells, J.C. Walker, L.L. Hargrove, M.A. Foster, P.D. Robillard, and D.W. Lehning. 1995.
WATERSHEDSS: Water, Soil and Hydro-Environmental Decision Support System.
<http://h2osparc.wq.ncsu.edu.>
Re
fere
nce
s
230
PADCNR. 2007. Early Successional Forest. Pennsylvania Department of Conservation and Natural
Resources., Harrisburg, PA. 5 April 2007. <http://www.dcnr.state.pa.us/wlhabitat/forest/earlyforest.htm>.
Pagano, J.J., P.A. Rosenbaum, R.N. Roberts, G.M. Sumner and L.V. Williamson. 1999. Assessment of maternal
contaminant burden by analysis of snapping turtle eggs. Journal of Great Lakes Research 25(4):950-961.
PAN Database – Chemicals 2007. Pesticide Action Network North America. 14 April 2007.
<http://www.pesticideinfo.org/Detail_Chemical.jsp?Rec_Id=PC32789>.
Patuxent Widlife Research Center. 2005. Bird Population Studies. 21 August, 2007. <http://www.mbr-
pwrc.usgs.gov/>.
Petreszyn, J.M. 1990. Oswego County Aquatic Vegetation Management Program, 1990 County-Wide
Assessment. Report No. 1:1-50. Oswego, NY.
Rickey, M.A. and R.C. Anderson. 2004. Effects of nitrogen addition on the invasive grass Phragmites australis
and a native competitor Spartina pectinata. Journal of Applied Ecology 41:888-896.
Roberts, M.R. and F.S. Gilliam 2003. Response of the herbaceous layer to disturbance in eastern forests. Pages
302- 322 In: Herbaceous Layer in Forests of Eastern North America. Edited by: Roberts, M.R. and F.S.
Gilliam. Oxford University Press.
Root, H.T., G.G. McGee and R.D. Nyland. 2007a. Effects of two silvicultural management regimes with large
tree retention on epiphytic lichen communities in Adirondack northern hardwoods, New York, USA.
Canadian Journal of Forest Research 37:1854-1866.
Root, H.T., G.G. McGee and R.A. Norton. 2007b. Arboreal mite communities on epiphytic lichens of the
Adirondack Mountains of New York, USA. The Northeastern Naturalist 14:425-438.
Rosenberg, K.V., R.W. Rohrbaugh, Jr., S.E. Barker, J.D. Lowe, R.S. Hames, and A.A. Dhondt. 1999. A Land
Manager’s Guide to Improving Habitat for Scarlet Tanegers and Other Forest-Dwelling Interior Birds. The
Cornell Lab of Ornithology, Ithaca, NY.
Runkle, J.R. 1982. Patterns of disturbance in some old-growth mesic forests of eastern North America.
Ecology 63:1533-1546.
Saunder, D.L. and J. Kalff. 2001. Nitrogen retention in wetlands, lakes and rivers. Hydrobiologia 443:205-212.
Saunders, D. A. 1988. Adirondack Mammals. State University of New York - College of Environmental
Science and Forestry. Syracuse, NY.
Sawchuck, D.J. 2006. Salmon River Falls Unique Area Unit Management Plan. New York State Department of
Environmental Conservation, Division of Lands and Forests, Altmar, NY.
<http://www.dec.state.ny.us/website/dlf/publands/ump/reg7/salmonrivertext.pdf.>
Schreiber, R.K. 2007. Acid Deposition. US National Biological Service. Kearneysville, WV, USA. 14 April
2007. <http://biology.usgs.gov/s+t/frame/u204.htm>.
Semlitsch, R. D. 1998. Biological delineation of terrestrial buffer zones for pond-breeding salamanders.
Conservation Biology 12(5):1113-1119.
Serfass, T.L. and D. Mitcheltree. 2004. Wildlife Notes: Fishers. Pennsylvania Game Commission. 18 March
2007. <http://www.pgc.state.pa.us/pgc/cwp/view.asp?a=458&q=150804>.
Re
fere
nce
s
231
Shigo, A.L. 1972. The beech bark disease today in the northeastern United States. Journal of Forestry 70:286-
289.
Shortle, W.C. K.T. Smith, R. Minocha, G.B. Lawrence and M.B. David. 1997. Acid deposition, cation
mobilization and stress in healthy red spruce trees. Journal of Environmental Quality 267:871-876.
Singleton, R., S. Gardescu, P.L. Marks and M.A. Geber. 2001. Forest herb colonization of post-agricultural
forests in central New York State, USA. Journal of Ecology 89:325-338.
Stephenson, S.L. 1989. Distribution and ecology of myxomycetes in temperate forests. II. Patterns of
occurrence on bark surface of living trees, leaf litter and dung. Mycologia 81:608-621.
Stoddard, J.L., J.S. Kahl, f.A. Deviney, D.R. DeWalle, C.T. Driscoll, A.T. Herlihy, J.H. Kellogg, P.S. Murdoch,
Jr. Webb and K.E. Webster. 2003. Response of Surface Water Chemistry to the Clean Air Act Amendments
of 1990. US Environmental Protection Agency. EPA 620/R-03/001. Washington, DC.
<http://www.epa.gov/ord/htm/CAAA-2002-report-2col-rev-4.pdf>.
Stout, N.J. 1958. Atlas of Forestry in New York. State University of New York College of Forestry at Syracuse.
Bulletin 41. Syracuse, NY.
Stoddard, J.C. 1994. Long tern changes in watershed retention of N: its causes and aquatic consequences Pages
223-284 In: Baker, L.A. (ed.) Environmental Chemistry of Lakes and Reservoirs. Advances in Chemistry
Series 237.
Sylte, T.L. and J.C. Fischenich. 2002. Techniques for Measuring Substrate Embeddedness. EMRPP Technical
Notes Collectin (ERDC TN-EMRRP-SR-36). US Army Engineer Research and Development Center,
Vickburg, MS. < http://el.erdc.usace.army.mil/elpubs/pdf/sr36.pdf>.
Temporary State Commission on the Tug Hill. 1976. The Tug Hill Region: Preparing for the Future. Report of
the Temporary State Commission on the Tug Hill, Presented to the Governor and Legislature of the State of
New York. Albany, NY.
TNC. 2003. The Five-S Framework for Site Conservation: A Practitioners Handbook for Site Conservation
Planning and Measuring Conservation Success. 3rd Edition. The Nature Conservancy.
< http://conserveonline.org/docs/2000/11/5-SVOL1.pdf>.
TNC. 2007. Asian Long Horned Beetle Risk Map. TNC Global Invasives Species Team. The Nature
Conservancy. <http://tncweeds.ucdavis.edu/photosmore.html >.
USDA Forest Service. 2002. A Summary of Technical Considerations to Minimize the Blockage of Fish at
Culverts on the National Forests of Alaska. US Department of Agriculture Forest Service, Alaska Region.
<http://www.fs.fed.us/r10/ro/policy-reports/wfew/fish_blockage_at_culverts.pdf>.
USDA Forest Service. 2004 Bailey’s Ecoregions and Subregions of the United States, Puerto Rico, and the
U.S. Virgin Islands: Ntional Atlas of the United States. Reston, VA.
USDA Forest Service. 2005. Northeastern Area Forest Sustainability and Planning. USDA Forest Service
ECOMAP Team, Washington, DC, USA.
<http://na.fs.fed.us/sustainability/ecomap/provinces/sec_211/s211.shtm>.
USDA Forest Service. 2007. Forest Inventory and Analysis National Program. US Forest Service, Arlington,
VA. <http://fia.fs.fed.us/>.
USDA NRCS. 2008. Web Soil Survey. US Department of Agriculture National Resource Conservation
Service. Washington, DC. <http://websoilsurvey.nrcs.usda.gov/app/>.
Re
fere
nce
s

232
USEPA. 1997. Mercury study report to Congress Volume VIII: Characterization of human health and wildlife
risks from mercury exposure in the United States. EPA-452/R-97-009. Office of Air Quality Planning and
Standards and Office of Research and Development, Washington, DC.
USEPA. 2007a. Carlson's Trophic State Index. 27 March 2007.
<http://www.epa.gov/bioindicators/aquatic/carlson.html>.
USEPA. 2007b. Effects of Acid Rain - Surface Waters and Aquatic Animals. 4 April 2007
<http://www.epa.gov/acidrain/effects/surface_water.html>.
US Fish and Wildlife Service. 2007. Black Tern Fact Sheet. 16 March 2007. <http://mountain-
prairie.fws.gov/blacktern/sacp.htm >.
USGS. 2006. Nonindigenous Aquatic Species Fact Sheet - Cyprinus carpio. 10 October 2007.
<http://nas.er.usgs.gov/queries/FactSheet.asp?speciesID=4>.
Vitousek, P.M., J.Aber, R.W. Howarth, G.E. Likens, P.A. Matson, D.W. Schindler, W.H. Schlesigner and G.D.
Tilman. 1997. Human alteration of the global nitrogen cycle: causes and consequences. Issues in Ecology.
Ecological Society of America, Washington, DC.
Wildridge, P.J. 1990. Natural Reproduction of Pacific Salmon and Steelhead Trout in Lake Ontario Tributaries.
MS Thesis. State University of New York - College of Environmental Science and Forestry. Syracuse, NY.
Wink, R. A. 2002. The Combined Effects of Defoliation by the Forest Tent Caterpillar and Partial Cutting on
Tug Hill Hardwoods. PhD Disseration, State University of New York - College of Environmental Science
and Forestry, Syracuse, NY.
Wink, R.A. and D.C. Allen. 2007. The combined effects of defoliation and modified timber stand improvement
on hardwoods in the Tug Hill region of New York. Northern Journal of Applied Forestry 24(1):43-51.
Woodrow, D.L., C.E. McClennen and W.F. Ahrnsbrak. 2002. Eastern Lake Ontario Sand Transport Study
(ELOSTS): Final Report on Sediment Transport Patterns and Management Implications for Eastern Lake
Ontario. A report and technical appendix submitted to The Nature Conservancy.
Wright, J.P., C.G. Jones and A.S. Flecker. 2002. An ecosystem engineer, the beaver, increases species richness
at the landscape scale. Oecologia 132:96-101.
Zollweg, E.C., R.F. Elliott, T.D. Hill, H.R. Quinlan, E. Trotmeter and J.W. Weisser. 2003. Proceedings of the
Great Lakes Lake Sturgeon Coordination Meeting, December 11-12, 2002. US Fish and Wildlife Service,
Washington, DC. <http://www.fws.gov/midwest/greatlakes/GLSturgeonCoordMttg02.pdf>.
Re
fere
nce
s
233
APPENDIX 1
SALMON RIVER WATERSHED
NATURAL RESOURCES ASSESSMENT
PROCEEDINGS OF WORKSHOP ONE: NATURAL RESOURCE
TARGETS
Ap
pe
nd
ix 1
– T
arg
ets
Wo
rksh
op
234
Salmon River Watershed Natural Resources Assessment
Workshop One: Natural Resource Targets
A Report of Workshop Process and Products
September 25, 2006
Prepared for: NYSDEC, Division of Fish, Wildlife and Marine Resources Tug Hill Tomorrow Land Trust Oswego County Environmental Management Council New York Natural Heritage Program The Nature Conservancy SUNY College of Environmental Science and Forestry SUNY Oswego New York Sea Grant NYS Tug Hill Commission Prepared by: Deborah Forester Engaging People
Ap
pe
nd
ix 1
– T
arg
ets
Wo
rksh
op

235
Contents Introduction ................................................................................................................ 1 Participants ................................................................................................................ 1 Conservation Target Identification ........................................................................... 1 Viability Analyses ....................................................................................................... 2 Workshop Evaluation ................................................................................................ 3 Next Steps .................................................................................................................. 3 Appendices Appendix One – Participants Appendix Two – Target Identification Appendix Three – Viability Analyses Appendix Four – Workshop Evaluation Results
Ap
pe
nd
ix 1
– T
arg
ets
Wo
rksh
op
236
Introduction On September 25, 2006, a workshop was held in the Snow Building in Pulaski, NY to begin a conservation planning process for the Salmon River Watershed as part of the Salmon River Watershed Natural Resource Assessment Project. The overall project objective is to develop a hands-on land use planning tool for the Salmon River watershed that highlights the significant natural resource assets in the area that can be used by both individual land owners and agencies when making decisions about land use and local planning. The planning process relies on local knowledge and ecological expertise to identify important conservation targets, outline threats to those targets, and develop strategies to abate those threats. The key planning work is done in open forums (workshops) where participants of varied backgrounds can share information and perspectives. Between workshops, information is compiled by partner agencies and organizations, and shared with other participants to facilitate informed decision-making. The objectives of this particular workshop were to:
1. Identify and prioritize conservation targets for the Salmon River watershed, and
2. Become familiar with the Conservation Action Planning process, including viability assessments.
Participants Thirty-eight people attended the workshop (a complete list of participants is included as Appendix One). Participants represented government agencies, non-profit organizations, universities, municipalities, sportsmen, and private industry. Workshop organizers strived for a cross section of stakeholders to represent the different interest groups and knowledge within the watershed.
Conservation Target Identification The first step in the planning process is to identify conservation targets. The targets should represent the full range of biodiversity within the watershed. They may include individual species, natural communities, or entire ecosystems. In order to do this, workshop participants worked in small groups to select potential targets. Using index cards and a sticky board, potential targets were shared with all participants. Through discussion, participants grouped related targets. A final list of eight conservation targets was drawn up that includes: 1. Freshwater Estuary 2. Non-estuarine Wetlands
Ap
pe
nd
ix 1
– T
arg
ets
Wo
rksh
op
237
3. High Order Riverine System 4. Open Water 5. Open Terrestrial Communities 6. Forest 7. Falls/Gorge 8. Headwater Streams A complete listing of potential targets and how they were grouped is included in Appendix Two.
Viability Analyses A next important step in the planning process is to conduct viability analyses for each of the conservation targets. Much of this work will be done between workshops. In order to capitalize on participants’ knowledge about targets and help participants become familiar with the viability assessment process, information to be included in viability analyses was collected for four of the targets. The four targets selected were large riverine systems, non-estuarine wetlands, forests, and headwater streams. The viability analyses will focus on three key concepts: key ecological attributes (KEAs), indicators, and acceptable range of variation of those indicators. The definitions used in this process are: Key Ecological Attributes (KEAs): Aspects of a target's biology or ecology that, if missing or altered, would lead to the loss of that target over time. As such, attributes define the target’s viability or integrity (e.g. water chemistry, population size). Indicators: Measurable entities related to a specific attribute. Indicators should be measurable, precise, and sensitive (e.g. pH, spawning adults observed per hour). There may be several indicators associated with each attribute. Acceptable range of variation: Defines the limits of variation that allow the target to persist over time. An acceptable range of variation establishes the minimum criteria for identifying a conservation target as conserved or not (e.g. pH between 6.0 and 7.5). For each of the four selected targets, participants brainstormed key ecological attributes. They then listed indicators and acceptable ranges of variation for selected attributes. The results are included in Appendix Three.
Ap
pe
nd
ix 1
– T
arg
ets
Wo
rksh
op

238
Workshop Evaluation Results At the conclusion of the day, participants were asked to fill out an evaluation of the workshop process and logistics. Twenty-two participants completed evaluations. The results will help organizers in planning and facilitating future workshops. The full results of the evaluation are included in Appendix Four. Over 80% of participants generally or strongly agreed that they understood the purpose of the Salmon River Watershed Natural Resources Assessment, and that their time at the workshop was well spent. Most participants acknowledged that they understood the planning process and the concepts used during the workshop (specifically conservation target and viability analysis). While the majority of respondents felt that the target selection process was productive, two did not. Several people did not completely understand how the workshop products would be used. The workshop logistics (advance materials, facilitation, format, room, and food and drink) were rated as “good” or better by most participants. About one quarter of the participants rated the advance materials and methods for achieving the workshop objectives as “fair.”
Next Steps Over the next few months Greg McGee, a professor and researcher at the State University of New York College of Environmental Science and Forestry will facilitate the completion of viability analyses for each of the identified targets. He will work with professionals with specific knowledge of each of the targets and use best available data to compile the analyses. Concurrently, members of the Tug Hill Commission will continue to raise awareness among town councils and local residents as to the methods and purpose of the Salmon River Watershed Natural Resource Assessment. A second workshop to identify threats to the identified targets is tentatively scheduled for April 2007. It is anticipated that many of the participants of this first workshop will attend. They will be joined by additional people with knowledge of the Salmon River Watershed and its resources. The information amassed in the viability analyses, as well as feedback from the outreach efforts, will help to inform the second major step of the process.
Ap
pe
nd
ix 1
– T
arg
ets
Wo
rksh
op

239
Appendix One – Workshop Participants Dudley Bailey Fall Brook Club John Bartow NYS Tug Hill Commission Paul Baxter Salmon Rivers Council of Governments Dan Bishop NYS DEC Michelle Brown The Nature Conservancy Mike Connerton NYSDEC, Cape Vincent Fisheries Station Patrick Crast Harden Furniture Ed Delaney Village of Pulaski Debbie Forester (facilitator) Engaging People Linda Garrett Tug Hill Tomorrow Land Trust Linda Gibbs NYS Tug Hill Commission Christine Gray Oswego County Dept. of Planning and Tourism Charlie Hall SUNY ESF Tim Howard NYNHP Jim Johnson Tunison Laboratory of Aquatic Science Marie Kautz NYS DEC
Dave MacNeil NY Sea Grant Amy Mahar NYS DEC Region 8 Katie Malinowski NYS Tug Hill Commission Dick McDonald NYS DEC Greg McGee SUNY ESF Jim McKenna Tunison Laboratory of Aquatic Science Bob McNamara Self-employed John Muller Gutchess Lumber Fred Munk NYS DEC Region 6 Richard Pancoe NYS DEC Michelle Peach The Nature Conservancy Mary Penney NY Sea Grant Jerry Rasmussen NYS DEC Peter Rosenbaum SUNY Oswego, Dept. of Biological Sciences Dan Sawchuck NYS DEC Rich Smardon SUNY ESF
Ap
pe
nd
ix 1
– T
arg
ets
Wo
rksh
op

240
Gerry Smith Self-employed Tracey Tomajer NYS DEC Jessica Trump Oswego County Dept. of Planning and Tourist Fran Verdoliva NYS DEC Dave White NY Sea Grant Fran Yerdon Town of Osceola
Ap
pe
nd
ix 1
– T
arg
ets
Wo
rksh
op
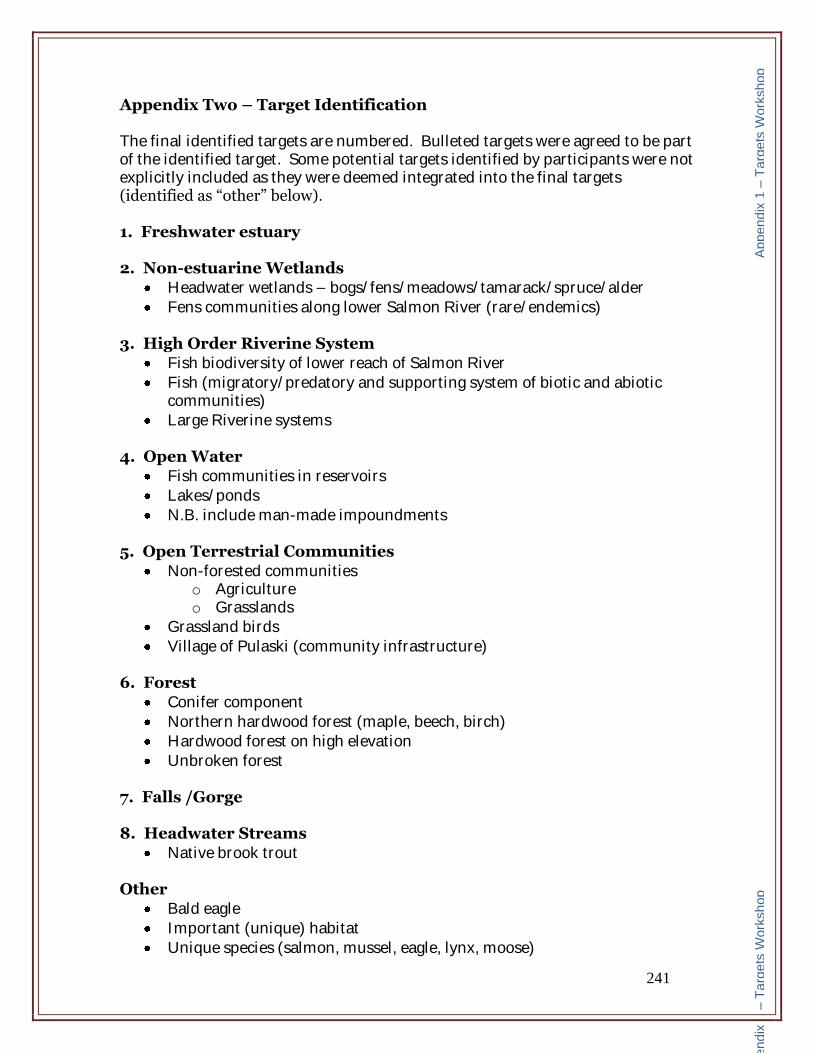
241
Appendix Two – Target Identification The final identified targets are numbered. Bulleted targets were agreed to be part of the identified target. Some potential targets identified by participants were not explicitly included as they were deemed integrated into the final targets (identified as “other” below). 1. Freshwater estuary 2. Non-estuarine Wetlands
Headwater wetlands – bogs/fens/meadows/tamarack/spruce/alder
Fens communities along lower Salmon River (rare/endemics) 3. High Order Riverine System
Fish biodiversity of lower reach of Salmon River
Fish (migratory/predatory and supporting system of biotic and abiotic communities)
Large Riverine systems 4. Open Water
Fish communities in reservoirs
Lakes/ponds
N.B. include man-made impoundments 5. Open Terrestrial Communities
Non-forested communities o Agriculture o Grasslands
Grassland birds
Village of Pulaski (community infrastructure) 6. Forest
Conifer component
Northern hardwood forest (maple, beech, birch)
Hardwood forest on high elevation
Unbroken forest 7. Falls /Gorge 8. Headwater Streams
Native brook trout Other
Bald eagle
Important (unique) habitat
Unique species (salmon, mussel, eagle, lynx, moose)
Ap
pe
nd
ix 1
– T
arg
ets
Wo
rksh
op
Ap
pe
nd
ix 1
– T
arg
ets
Wo
rksh
op

242
Wetlands (needs to be narrowed)
Uncommon elements of biodiversity – fauna
Upland habitats and associated biotic communities
Hydrology – groundwater and sub-surface water
Intact aquatic communities
Riparian zones
Riparian vegetative communities (temperature maintenance and water quality)
Aquatic habitats
Water quality
Ap
pe
nd
ix 1
– T
arg
ets
Wo
rksh
op
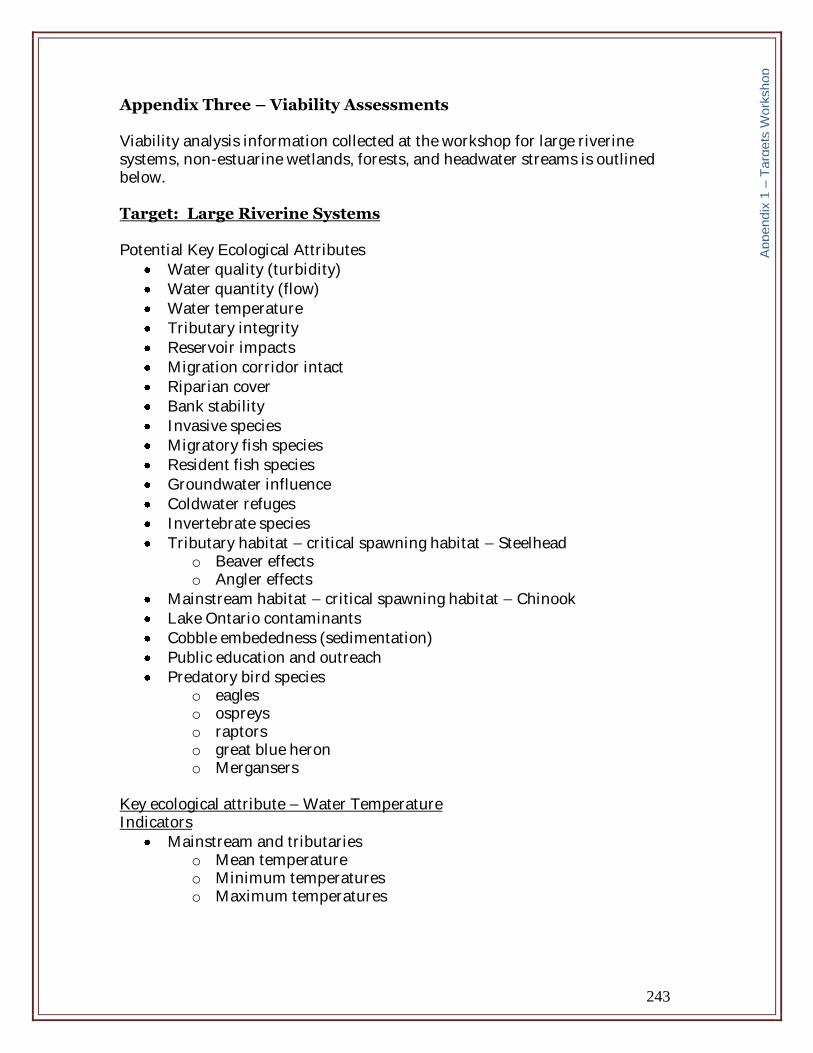
243
Appendix Three – Viability Assessments Viability analysis information collected at the workshop for large riverine systems, non-estuarine wetlands, forests, and headwater streams is outlined below. Target: Large Riverine Systems Potential Key Ecological Attributes
Water quality (turbidity)
Water quantity (flow)
Water temperature
Tributary integrity
Reservoir impacts
Migration corridor intact
Riparian cover
Bank stability
Invasive species
Migratory fish species
Resident fish species
Groundwater influence
Coldwater refuges
Invertebrate species
Tributary habitat – critical spawning habitat – Steelhead o Beaver effects o Angler effects
Mainstream habitat – critical spawning habitat – Chinook
Lake Ontario contaminants
Cobble embededness (sedimentation)
Public education and outreach
Predatory bird species o eagles o ospreys o raptors o great blue heron o Mergansers
Key ecological attribute – Water Temperature Indicators
Mainstream and tributaries o Mean temperature o Minimum temperatures o Maximum temperatures
Ap
pe
nd
ix 1
– T
arg
ets
Wo
rksh
op
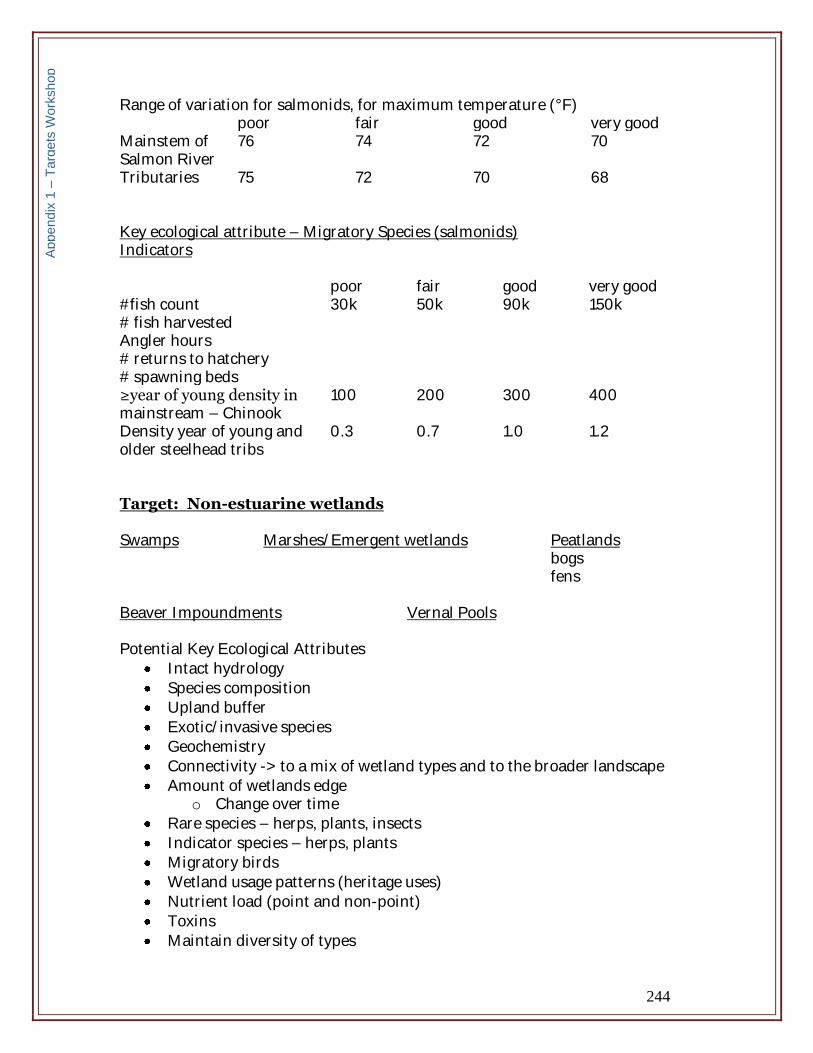
244
Range of variation for salmonids, for maximum temperature (°F) poor fair good very good Mainstem of Salmon River
76 74 72 70
Tributaries 75 72 70 68 Key ecological attribute – Migratory Species (salmonids) Indicators poor fair good very good #fish count 30k 50k 90k 150k # fish harvested Angler hours # returns to hatchery # spawning beds ≥year of young density in mainstream – Chinook
100 200 300 400
Density year of young and older steelhead tribs
0.3 0.7 1.0 1.2
Target: Non-estuarine wetlands Swamps Marshes/Emergent wetlands Peatlands bogs fens Beaver Impoundments Vernal Pools Potential Key Ecological Attributes
Intact hydrology
Species composition
Upland buffer
Exotic/invasive species
Geochemistry
Connectivity -> to a mix of wetland types and to the broader landscape
Amount of wetlands edge o Change over time
Rare species – herps, plants, insects
Indicator species – herps, plants
Migratory birds
Wetland usage patterns (heritage uses)
Nutrient load (point and non-point)
Toxins
Maintain diversity of types
Ap
pe
nd
ix 1
– T
arg
ets
Wo
rksh
op
245
Key ecological attribute – Nutrient load Indicators
Nitrogen – trates – trites
Phosphorus
pH
dissolved oxygen (water or soil characteristics
conductivity ** range of variability will depend on specific wetland type Key ecological attribute – Buffer/Wetland edge Indicators
proportion of natural vs. non-natural cover -> change over time (ASCS air photos every two years or NYS air photos)
wetland size (loss or expansion)
disturbance -- % of area, type
roads in buffer Range of variability – Wetland buffer Indicators poor fair good very good % natural cover w/i 500 (?)m buffer
≤ 80% 80-95% 95-100%
Key ecological attribute – Intact hydrology Indicators
water source (surface, subsurface, comb.) o source alteration (% from different sources)
flow reduction (look for blockages, i.e. road, stuffed culvert) – surface flow
wetland water level -> minimum and variability
pool longevity for vernal pools -> 2-3 weeks ** The group thought that priority should be given to isolated wetlands, which might be more susceptible to changes in hydrology Target: Forest Potential key ecological attributes 1. Condition
composition o woody plants o conifer hardwood o understory o bird communities
structure
Ap
pe
nd
ix 1
– T
arg
ets
Wo
rksh
op
246
o canopy diameter distribution o cwd o successional stage
“forest health” o pH, N loading
2. Size 3. Landscape context
connectivity/fragmentation Threats Adelgid Sirex (wood wasp) Key ecological attribute – Structure Indicators
density #trees/acre
diameter distribution #trees/dia class
tree quality o % AGS o % UGS
snags #snags/acre
downed coarse woody debris ft3/acre
canopy closure
indicator species
regeneration
shrub/herb layer #/m2 composition Key ecological attribute – Composition Indicators
bird indicator species o abundance
#birds/hr #birds/mile
amphibian
% invasives
herb layer composition
Ap
pe
nd
ix 1
– T
arg
ets
Wo
rksh
op
247
Target: Freshwater Estuary Notes for future use: Freshwater estuary target can roughly be mapped as the area west of Route 3 Private ownership (development opportunity) is one of the largest threats The freshwater estuary target is the target most heavily impacted by recreation
boat launch motorized
heavily used Potential key ecological attributes
water quality
accessibility of passage: aquatic system
habitat and freshwater estuarine processes
water level – quantity (flow)
coastal wetland integrity
black tern populations integrity
flooding regime
riparian zone
hydrology
seasonal abundance of game fish
resident assemblage of fish and other organisms
index of species diversity Key ecological attribute – Water quality Indicators
pH * village of Pulaski collecting data * hatchery – Brookfield Power collecting data
dissolved oxygen
total suspended solids
metals
PCBs
Temperature ** as far as we know, water quality is ok Key ecological attribute – Black tern population integrity (specific nesting habitat) ** ask Gerry Smith Indicators
# of birds
# of nests
# of fledglings
amount of appropriate habitat (grass in wetlands)
Ap
pe
nd
ix 1
– T
arg
ets
Wo
rksh
op
248
Key ecological attribute – Hydrology regime Indicators
water level
flow volume*
flow timing*
miles of natural channel
ground water/water table *ask Dan Bishop/Dan Sawchuk/Fran Verdoliva specific information available/needed:
How does the lake impact the freshwater estuary target? – IJC How much of the freshwater estuary was included in FERQ relicensing?
Target: Headwater streams Potential key ecological attributes
cold water
forest cover/alder swamp mix
macroinvertebrate community
spawning habitat
springs/seeps/interaction with groundwater
beavers
low road density
presence of large woody debris in stream
low level of vehicle disturbance
one or more species of trout present
beginning of stream system
presence of fur-bearing animals
clear water
low nutrient levels
presence of mussels Key ecological attribute – Water conditions Indicators
65-70°F maximum
pH 05-08
conductivity 45-200
turbidity
dissolved oxygen (5-9)
phosphorus < 10ppl Key ecological attribute – Vegetative cover Indicators
% cover – 75% minimum in riparian zone
Ap
pe
nd
ix 1
– T
arg
ets
Wo
rksh
op
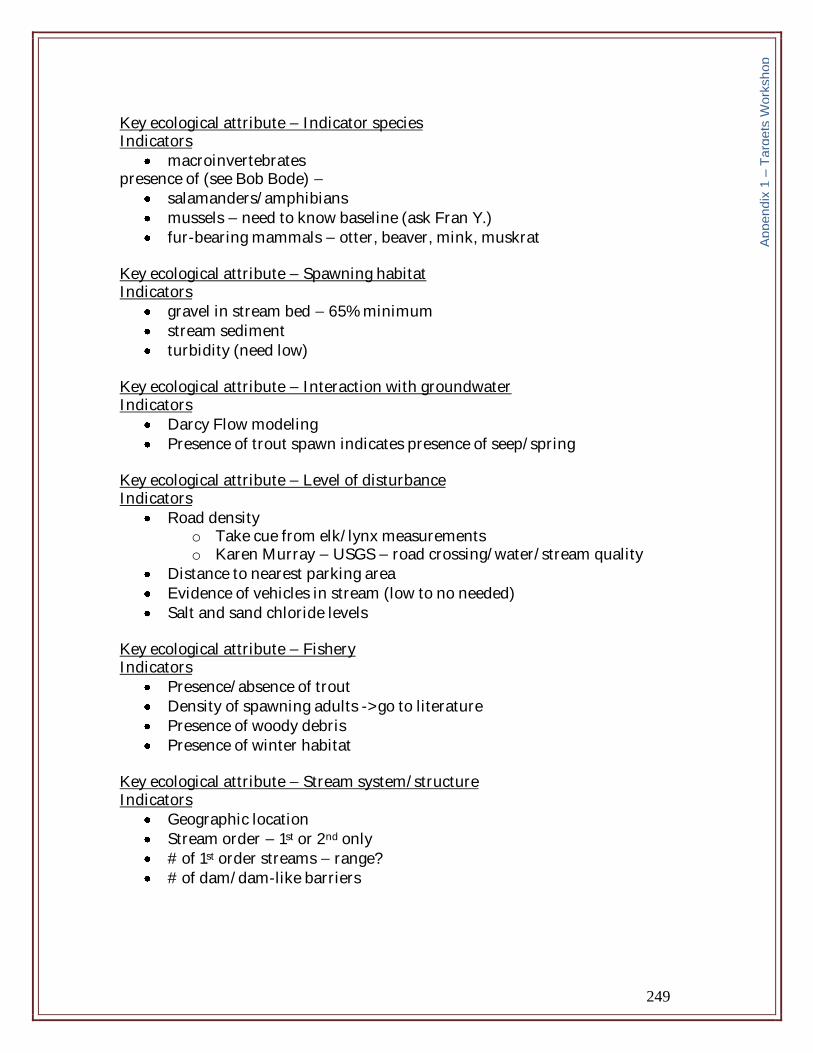
249
Key ecological attribute – Indicator species Indicators
macroinvertebrates presence of (see Bob Bode) –
salamanders/amphibians
mussels – need to know baseline (ask Fran Y.)
fur-bearing mammals – otter, beaver, mink, muskrat Key ecological attribute – Spawning habitat Indicators
gravel in stream bed – 65% minimum
stream sediment
turbidity (need low) Key ecological attribute – Interaction with groundwater Indicators
Darcy Flow modeling
Presence of trout spawn indicates presence of seep/spring Key ecological attribute – Level of disturbance Indicators
Road density o Take cue from elk/lynx measurements o Karen Murray – USGS – road crossing/water/stream quality
Distance to nearest parking area
Evidence of vehicles in stream (low to no needed)
Salt and sand chloride levels
Key ecological attribute – Fishery Indicators
Presence/absence of trout
Density of spawning adults ->go to literature
Presence of woody debris
Presence of winter habitat Key ecological attribute – Stream system/structure Indicators
Geographic location
Stream order – 1st or 2nd only
# of 1st order streams – range?
# of dam/dam-like barriers
Ap
pe
nd
ix 1
– T
arg
ets
Wo
rksh
op
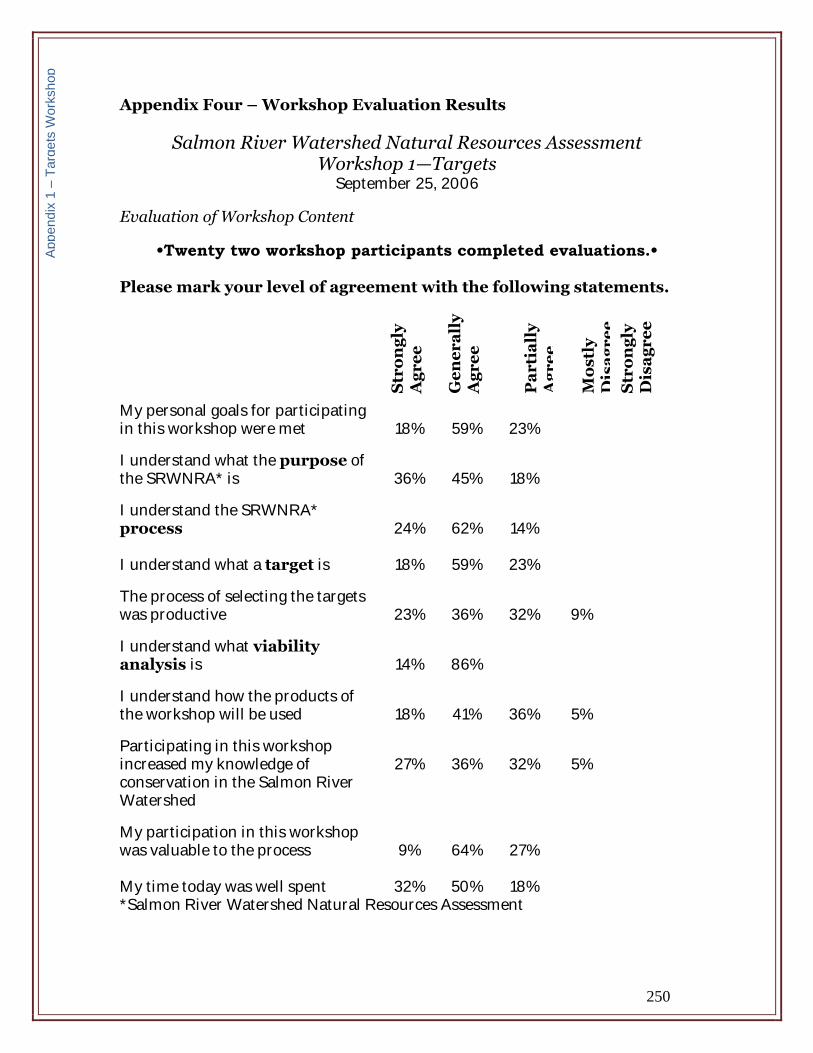
250
Appendix Four – Workshop Evaluation Results
Salmon River Watershed Natural Resources Assessment Workshop 1—Targets
September 25, 2006
Evaluation of Workshop Content
•Twenty two workshop participants completed evaluations.•
Please mark your level of agreement with the following statements.
Str
on
gly
A
gr
ee
Ge
ne
ra
lly
A
gr
ee
Pa
rti
all
y
Ag
re
e
Mo
stl
y
Dis
ag
re
e
Str
on
gly
D
isa
gr
ee
My personal goals for participating in this workshop were met
18%
59%
23%
I understand what the purpose of the SRWNRA* is
36%
45%
18%
I understand the SRWNRA* process
24%
62%
14%
I understand what a target is
18% 59% 23%
The process of selecting the targets was productive
23%
36%
32%
9%
I understand what viability analysis is
14%
86%
I understand how the products of the workshop will be used
18%
41%
36%
5%
Participating in this workshop increased my knowledge of conservation in the Salmon River Watershed
27%
36%
32%
5%
My participation in this workshop was valuable to the process
9%
64%
27%
My time today was well spent 32% 50% 18% *Salmon River Watershed Natural Resources Assessment
Ap
pe
nd
ix 1
– T
arg
ets
Wo
rksh
op

251
How might you and/or your organization use the information shared during this workshop?
Raising awareness; best vehicle may be a draft summary and updates through a newsletter
Future agency planning
Talking to town government and sportsman organizations
Contributing data and identifying targets
As an example of a collaborative planning process, and for use in an open space course taught at SUNY ESF
Management plans
Information, data, and recommendations can be used in the DEC’s UMP process
Identify needed research
Natural resource management
Later in the process the information can be used in outreach What do you see as the most significant challenge to the success of conservation in the Salmon River Watershed?
Getting all significant parties involved in the planning process and helping them to gain buy-in to the plan
Acceptance by residents (5)
Acceptance from management agencies
Acceptance by local government
Local participation
Reconciling major economic aspects of recreational fishing and habitat preservation goals
Working with snowmobilers and ATVers
Development, recreation, and economic pressure
Money
Resolving conflicting resource use
Need more integration of terrestrial and aquatic management
Citizen and government interest
Can you recommend others who might benefit from, or be able to contribute towards, this natural resource assessment process? Please provide names, organization, and any other contact information you might have. Or ask us to send you an email next week reminding you to send us this information!
Brookfield Power
Oswego County Planning researcher did a plan south of Salmon River Corridor
Jeff Devine, Executive Director, Save the County Land Trust
Representative from Trust for Public Lands
NYC is interested in this whole region
Stakeholder groups: conservation fishing, landowners
Ap
pe
nd
ix 1
– T
arg
ets
Wo
rksh
op
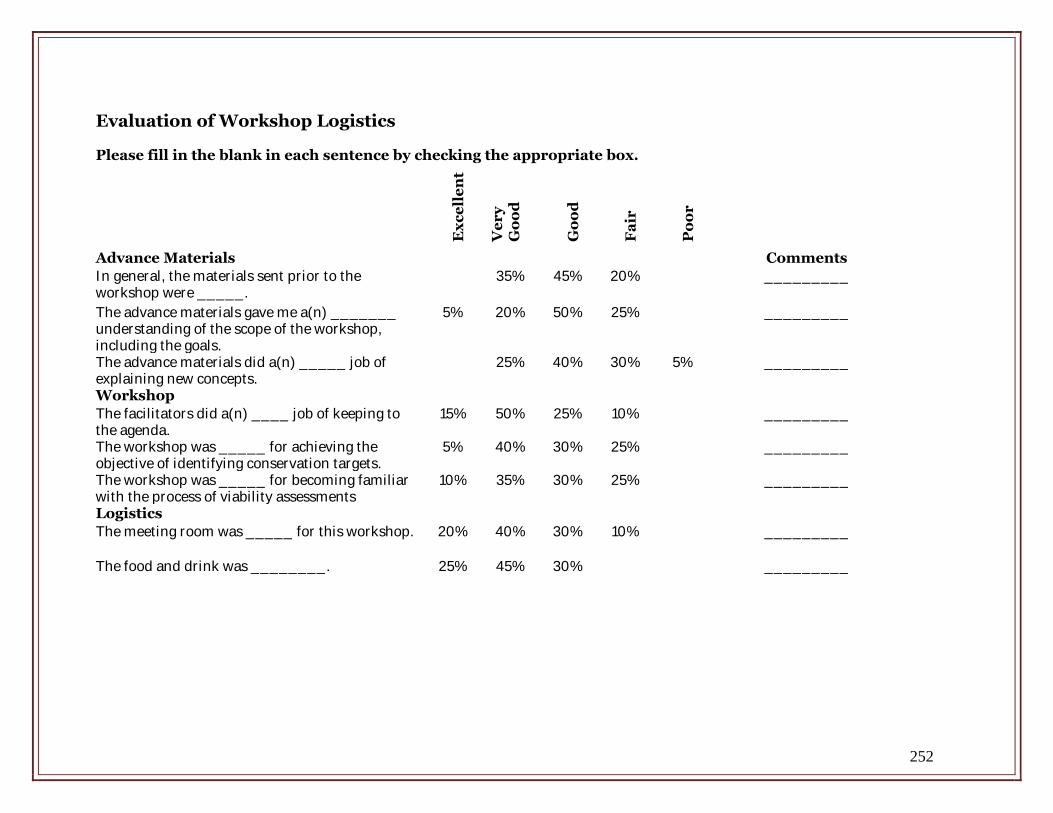
252
Evaluation of Workshop Logistics
Please fill in the blank in each sentence by checking the appropriate box.
Ex
ce
lle
nt
Ve
ry
G
oo
d
Go
od
Fa
ir
Po
or
Advance Materials Comments In general, the materials sent prior to the workshop were _____.
35% 45% 20% _________
The advance materials gave me a(n) _______ understanding of the scope of the workshop, including the goals.
5% 20% 50% 25% _________
The advance materials did a(n) _____ job of explaining new concepts.
25% 40% 30% 5% _________
Workshop The facilitators did a(n) ____ job of keeping to the agenda.
15% 50% 25% 10% _________
The workshop was _____ for achieving the objective of identifying conservation targets.
5% 40% 30% 25% _________
The workshop was _____ for becoming familiar with the process of viability assessments
10% 35% 30% 25% _________
Logistics The meeting room was _____ for this workshop.
20% 40% 30% 10% _________
The food and drink was ________. 25% 45% 30% _________

253
APPENDIX 2
The following individuals participated on the working groups and/or contributed substantially to
data acquisition and analyses during the development of the Salmon River Watershed Viability
Analysis.
Forest Target:
Tom Bell, NYSDEC
Art Brooks, Brooks Forestry Associates
Pat Crast, Harden Lumber
Jim Farquhar, NYSDEC
Ed Kautz, NYSDEC
John Mueller, Gutchess Lumber
Fred Munk, NYSDEC
Michelle Peach, TNC
Dave Riehlman, NYSDEC
Dan Sawchuck, NYSDEC
Charles Smith, Cornell University
Jerry Smith
Fran Verdoliva, NYSDEC
Wetlands:
Sandy Bonanno
Linda Gibbs, THC
Sandy Doran, US Fish & Wildlife Service
Andrew Nelson, SUNY-Oswego
Michelle Peach, TNC
Peter Rosenbaum, SUNY-Oswego
Rich Smardon, SUNY-ESF
Aquatics:
Dan Bishop, NYSDEC
Mike Connerton, NYSDEC
Frank Flack, NYSDEC
Michelle Henry, USGS, Tunison Laboratory
Jim Johnson, USGS, Tunison Laboratory
Roger Klindt, NYSDEC
Amy Mahar, NYSDEC
Dick McDonald, NYSDEC
Jim McKenna, USGS, Tunison Laboratory
Andy Noyes, NYSDEC
Neil Ringler, SUNY-ESF
Larry Skinner, NYSDEC
Fran Verdoliva, NYSDEC
Ap
pe
nd
ix 2
– W
ork
ing
Gro
pu
s
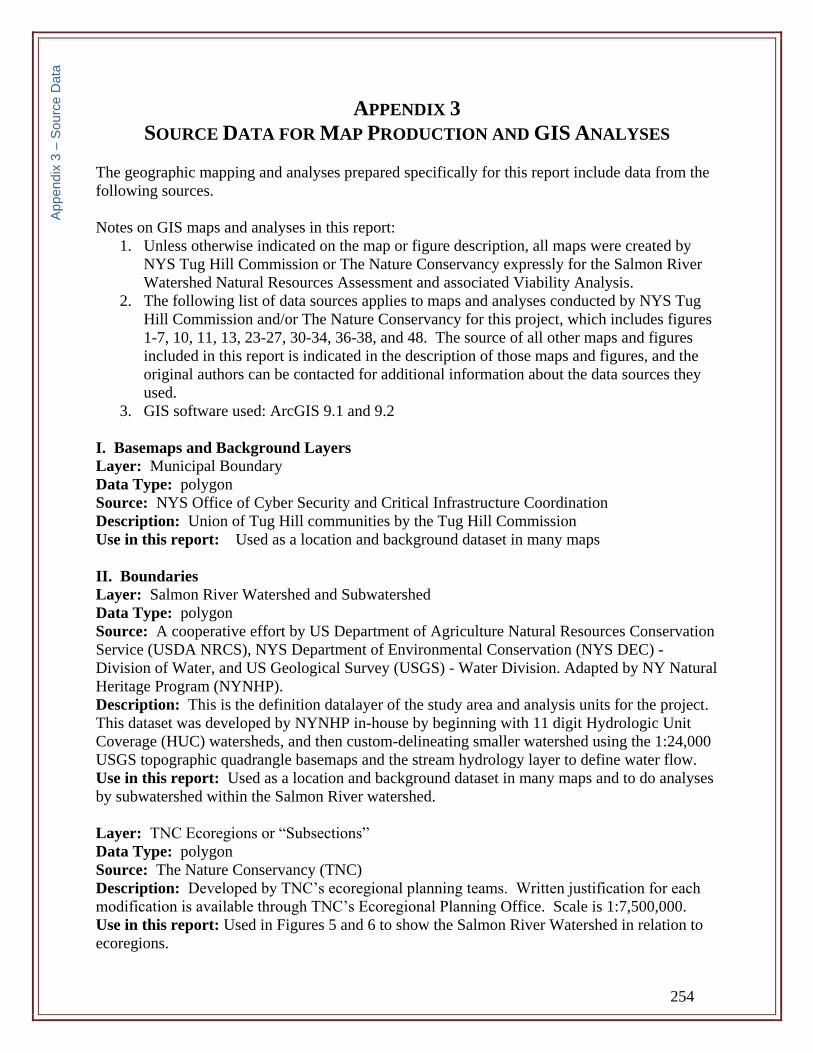
254
APPENDIX 3
SOURCE DATA FOR MAP PRODUCTION AND GIS ANALYSES
The geographic mapping and analyses prepared specifically for this report include data from the
following sources.
Notes on GIS maps and analyses in this report:
1. Unless otherwise indicated on the map or figure description, all maps were created by
NYS Tug Hill Commission or The Nature Conservancy expressly for the Salmon River
Watershed Natural Resources Assessment and associated Viability Analysis.
2. The following list of data sources applies to maps and analyses conducted by NYS Tug
Hill Commission and/or The Nature Conservancy for this project, which includes figures
1-7, 10, 11, 13, 23-27, 30-34, 36-38, and 48. The source of all other maps and figures
included in this report is indicated in the description of those maps and figures, and the
original authors can be contacted for additional information about the data sources they
used.
3. GIS software used: ArcGIS 9.1 and 9.2
I. Basemaps and Background Layers
Layer: Municipal Boundary
Data Type: polygon
Source: NYS Office of Cyber Security and Critical Infrastructure Coordination
Description: Union of Tug Hill communities by the Tug Hill Commission
Use in this report: Used as a location and background dataset in many maps
II. Boundaries
Layer: Salmon River Watershed and Subwatershed
Data Type: polygon
Source: A cooperative effort by US Department of Agriculture Natural Resources Conservation
Service (USDA NRCS), NYS Department of Environmental Conservation (NYS DEC) -
Division of Water, and US Geological Survey (USGS) - Water Division. Adapted by NY Natural
Heritage Program (NYNHP).
Description: This is the definition datalayer of the study area and analysis units for the project.
This dataset was developed by NYNHP in-house by beginning with 11 digit Hydrologic Unit
Coverage (HUC) watersheds, and then custom-delineating smaller watershed using the 1:24,000
USGS topographic quadrangle basemaps and the stream hydrology layer to define water flow.
Use in this report: Used as a location and background dataset in many maps and to do analyses
by subwatershed within the Salmon River watershed.
Layer: TNC Ecoregions or “Subsections”
Data Type: polygon
Source: The Nature Conservancy (TNC)
Description: Developed by TNC’s ecoregional planning teams. Written justification for each
modification is available through TNC’s Ecoregional Planning Office. Scale is 1:7,500,000.
Use in this report: Used in Figures 5 and 6 to show the Salmon River Watershed in relation to
ecoregions.
Ap
pe
nd
ix 3
– S
ou
rce
Da
ta
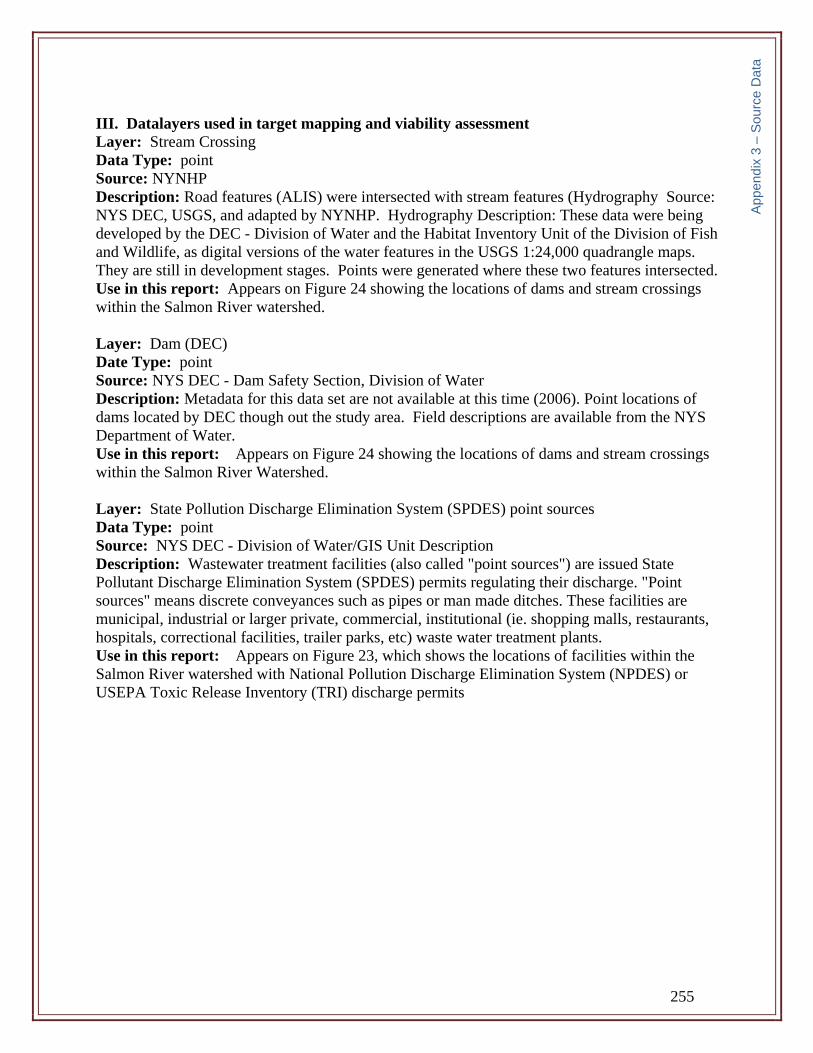
255
III. Datalayers used in target mapping and viability assessment
Layer: Stream Crossing
Data Type: point
Source: NYNHP
Description: Road features (ALIS) were intersected with stream features (Hydrography Source:
NYS DEC, USGS, and adapted by NYNHP. Hydrography Description: These data were being
developed by the DEC - Division of Water and the Habitat Inventory Unit of the Division of Fish
and Wildlife, as digital versions of the water features in the USGS 1:24,000 quadrangle maps.
They are still in development stages. Points were generated where these two features intersected.
Use in this report: Appears on Figure 24 showing the locations of dams and stream crossings
within the Salmon River watershed.
Layer: Dam (DEC)
Date Type: point
Source: NYS DEC - Dam Safety Section, Division of Water
Description: Metadata for this data set are not available at this time (2006). Point locations of
dams located by DEC though out the study area. Field descriptions are available from the NYS
Department of Water.
Use in this report: Appears on Figure 24 showing the locations of dams and stream crossings
within the Salmon River Watershed.
Layer: State Pollution Discharge Elimination System (SPDES) point sources
Data Type: point
Source: NYS DEC - Division of Water/GIS Unit Description
Description: Wastewater treatment facilities (also called "point sources") are issued State
Pollutant Discharge Elimination System (SPDES) permits regulating their discharge. "Point
sources" means discrete conveyances such as pipes or man made ditches. These facilities are
municipal, industrial or larger private, commercial, institutional (ie. shopping malls, restaurants,
hospitals, correctional facilities, trailer parks, etc) waste water treatment plants.
Use in this report: Appears on Figure 23, which shows the locations of facilities within the
Salmon River watershed with National Pollution Discharge Elimination System (NPDES) or
USEPA Toxic Release Inventory (TRI) discharge permits
Ap
pe
nd
ix 3
– S
ou
rce
Da
ta
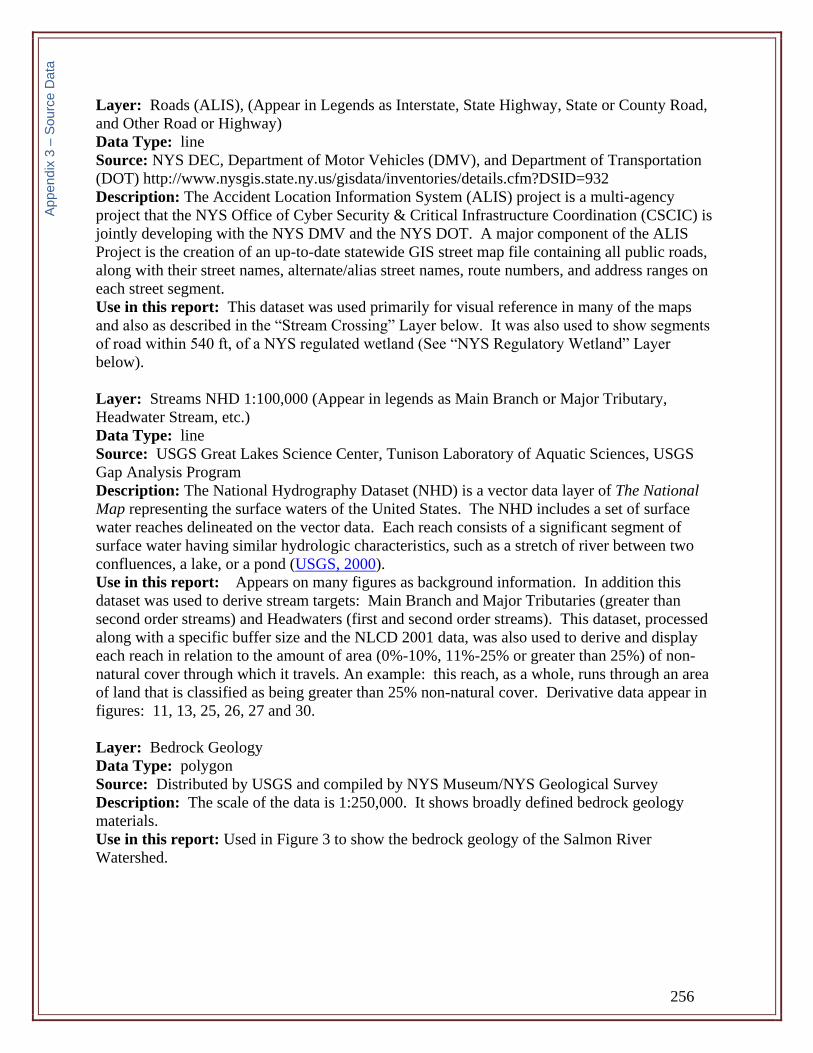
256
Layer: Roads (ALIS), (Appear in Legends as Interstate, State Highway, State or County Road,
and Other Road or Highway)
Data Type: line
Source: NYS DEC, Department of Motor Vehicles (DMV), and Department of Transportation
(DOT) http://www.nysgis.state.ny.us/gisdata/inventories/details.cfm?DSID=932
Description: The Accident Location Information System (ALIS) project is a multi-agency
project that the NYS Office of Cyber Security & Critical Infrastructure Coordination (CSCIC) is
jointly developing with the NYS DMV and the NYS DOT. A major component of the ALIS
Project is the creation of an up-to-date statewide GIS street map file containing all public roads,
along with their street names, alternate/alias street names, route numbers, and address ranges on
each street segment.
Use in this report: This dataset was used primarily for visual reference in many of the maps
and also as described in the “Stream Crossing” Layer below. It was also used to show segments
of road within 540 ft, of a NYS regulated wetland (See “NYS Regulatory Wetland” Layer
below).
Layer: Streams NHD 1:100,000 (Appear in legends as Main Branch or Major Tributary,
Headwater Stream, etc.)
Data Type: line
Source: USGS Great Lakes Science Center, Tunison Laboratory of Aquatic Sciences, USGS
Gap Analysis Program
Description: The National Hydrography Dataset (NHD) is a vector data layer of The National
Map representing the surface waters of the United States. The NHD includes a set of surface
water reaches delineated on the vector data. Each reach consists of a significant segment of
surface water having similar hydrologic characteristics, such as a stretch of river between two
confluences, a lake, or a pond (USGS, 2000).
Use in this report: Appears on many figures as background information. In addition this
dataset was used to derive stream targets: Main Branch and Major Tributaries (greater than
second order streams) and Headwaters (first and second order streams). This dataset, processed
along with a specific buffer size and the NLCD 2001 data, was also used to derive and display
each reach in relation to the amount of area (0%-10%, 11%-25% or greater than 25%) of non-
natural cover through which it travels. An example: this reach, as a whole, runs through an area
of land that is classified as being greater than 25% non-natural cover. Derivative data appear in
figures: 11, 13, 25, 26, 27 and 30.
Layer: Bedrock Geology
Data Type: polygon
Source: Distributed by USGS and compiled by NYS Museum/NYS Geological Survey
Description: The scale of the data is 1:250,000. It shows broadly defined bedrock geology
materials.
Use in this report: Used in Figure 3 to show the bedrock geology of the Salmon River
Watershed.
Ap
pe
nd
ix 3
– S
ou
rce
Da
ta
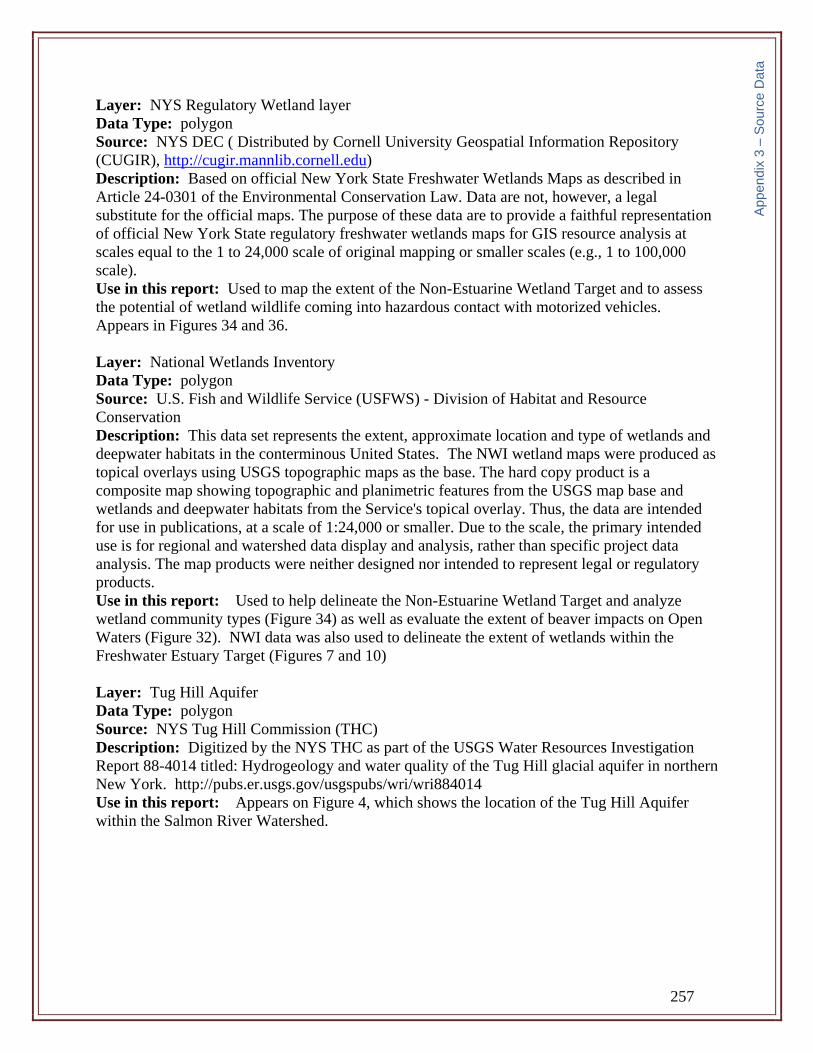
257
Layer: NYS Regulatory Wetland layer
Data Type: polygon
Source: NYS DEC ( Distributed by Cornell University Geospatial Information Repository
(CUGIR), http://cugir.mannlib.cornell.edu)
Description: Based on official New York State Freshwater Wetlands Maps as described in
Article 24-0301 of the Environmental Conservation Law. Data are not, however, a legal
substitute for the official maps. The purpose of these data are to provide a faithful representation
of official New York State regulatory freshwater wetlands maps for GIS resource analysis at
scales equal to the 1 to 24,000 scale of original mapping or smaller scales (e.g., 1 to 100,000
scale).
Use in this report: Used to map the extent of the Non-Estuarine Wetland Target and to assess
the potential of wetland wildlife coming into hazardous contact with motorized vehicles.
Appears in Figures 34 and 36.
Layer: National Wetlands Inventory
Data Type: polygon
Source: U.S. Fish and Wildlife Service (USFWS) - Division of Habitat and Resource
Conservation
Description: This data set represents the extent, approximate location and type of wetlands and
deepwater habitats in the conterminous United States. The NWI wetland maps were produced as
topical overlays using USGS topographic maps as the base. The hard copy product is a
composite map showing topographic and planimetric features from the USGS map base and
wetlands and deepwater habitats from the Service's topical overlay. Thus, the data are intended
for use in publications, at a scale of 1:24,000 or smaller. Due to the scale, the primary intended
use is for regional and watershed data display and analysis, rather than specific project data
analysis. The map products were neither designed nor intended to represent legal or regulatory
products.
Use in this report: Used to help delineate the Non-Estuarine Wetland Target and analyze
wetland community types (Figure 34) as well as evaluate the extent of beaver impacts on Open
Waters (Figure 32). NWI data was also used to delineate the extent of wetlands within the
Freshwater Estuary Target (Figures 7 and 10)
Layer: Tug Hill Aquifer
Data Type: polygon
Source: NYS Tug Hill Commission (THC)
Description: Digitized by the NYS THC as part of the USGS Water Resources Investigation
Report 88-4014 titled: Hydrogeology and water quality of the Tug Hill glacial aquifer in northern
New York. http://pubs.er.usgs.gov/usgspubs/wri/wri884014
Use in this report: Appears on Figure 4, which shows the location of the Tug Hill Aquifer
within the Salmon River Watershed.
Ap
pe
nd
ix 3
– S
ou
rce
Da
ta
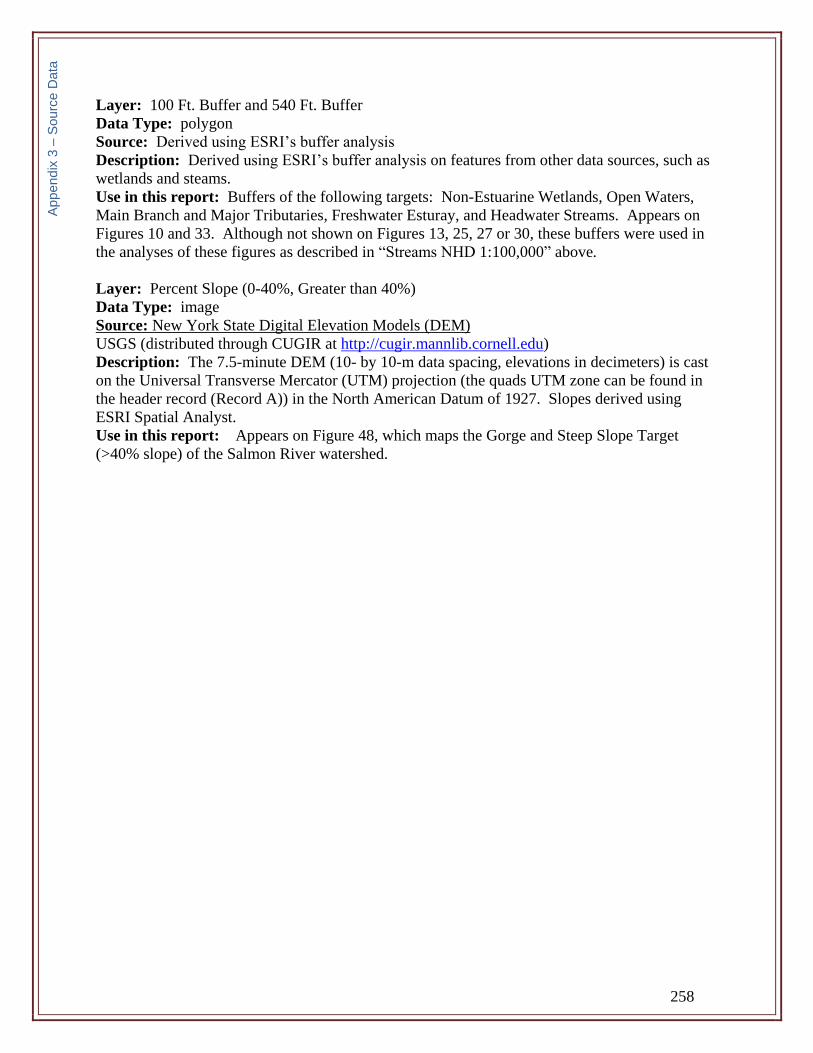
258
Layer: 100 Ft. Buffer and 540 Ft. Buffer
Data Type: polygon
Source: Derived using ESRI’s buffer analysis
Description: Derived using ESRI’s buffer analysis on features from other data sources, such as
wetlands and steams.
Use in this report: Buffers of the following targets: Non-Estuarine Wetlands, Open Waters,
Main Branch and Major Tributaries, Freshwater Esturay, and Headwater Streams. Appears on
Figures 10 and 33. Although not shown on Figures 13, 25, 27 or 30, these buffers were used in
the analyses of these figures as described in “Streams NHD 1:100,000” above.
Layer: Percent Slope (0-40%, Greater than 40%)
Data Type: image
Source: New York State Digital Elevation Models (DEM)
USGS (distributed through CUGIR at http://cugir.mannlib.cornell.edu)
Description: The 7.5-minute DEM (10- by 10-m data spacing, elevations in decimeters) is cast
on the Universal Transverse Mercator (UTM) projection (the quads UTM zone can be found in
the header record (Record A)) in the North American Datum of 1927. Slopes derived using
ESRI Spatial Analyst.
Use in this report: Appears on Figure 48, which maps the Gorge and Steep Slope Target
(>40% slope) of the Salmon River watershed.
Ap
pe
nd
ix 3
– S
ou
rce
Da
ta
259
Layer: National Land Cover Database (NLCD) Land Classification (Appear in map legends in
various ways)
Data Type: image, polygon
Source: NLCD 2001 U.S. Geological Survey <http://www.mrlc.gov>
Description: The NLCD 2001 for mapping zone 64 was produced through a cooperative project
conducted by the Multi-Resolution Land Characteristics (MRLC) Consortium. The MRLC
Consortium is a partnership of federal agencies (www.mrlc.gov), consisting of the USGS, the
National Oceanic and Atmospheric Administration (NOAA), the U.S. Environmental Protection
Agency (EPA), the U.S. Department of Agriculture (USDA), the U.S. Forest Service (USFS), the
National Park Service (NPS), the U.S. Fish and Wildlife Service (FWS), the Bureau of Land
Management (BLM) and the USDA NRCS. The MRLC data set consists of 30 by 30-meter cells
that correspond to an area on the earth. <http://www.mrlc.gov/mrlc2k.asp>.
Use in this report: This dataset, or derivatives from it, appear on many figures as background
information. When used as a background dataset to show landcover (e.g. Figures 5, 6, 7, and
10), NLCD 2001 Data was often reclassified as shown in the table below under “Reclassification
2.” In several figures NLCD 2001 Data was reclassified into one of three categories shown in the
table below under “Reclassification 1” to derive the Open Waters, Natural Vegetative Cover, and
Non-natural Vegetative Cover classifications (e.g. Figures 13, 25, 27, 30, and 33). These maps
were then used to derive Percent Non-Natural Vegetative Cover parameters, the results of which
are described in the text. NLCD 2001 Data was also used to map the geographical extent and
community types of the Matrix Forest Target in Figure 37.
Data Classification Reclassification 1 Reclassification 2
Open Water Open Water Open Water
Developed, Open Space Non-natural Vegetative Cover Developed
Developed, Low Intensity Non-natural Vegetative Cover Developed
Developed, Medium
Intensity
Non-natural Vegetative Cover Developed
Developed, High Intensity Non-natural Vegetative Cover Developed
Barren Land
(Rock/Sand/Clay)
Non-natural Vegetative Cover Barren Land
Deciduous Forest Natural Vegetative Cover Forest
Evergreen Forest Natural Vegetative Cover Forest
Mixed Forest Natural Vegetative Cover Forest
Shrub/Scrub Natural Vegetative Cover Shrub/Scrub
Grassland/Herbaceous Non-natural Vegetative Cover Grassland/Herbaceous
Pasture/Hay Non-natural Vegetative Cover Agriculture
Cultivated Crops Non-natural Vegetative Cover Agriculture
Woody Wetlands Natural Vegetative Cover Freshwater
Forested/Shrub Wetland
Emergent Herbaceous
Wetland
Natural Vegetative Cover Freshwater Emergent
Wetland
Ap
pe
nd
ix 3
– S
ou
rce
Da
ta