Embed Size (px)
Citation preview
28/05/2008
The demand for personal air transport in Europe
ILA Conference
Berlin, 28 May 2008
28/05/2008 Page 2
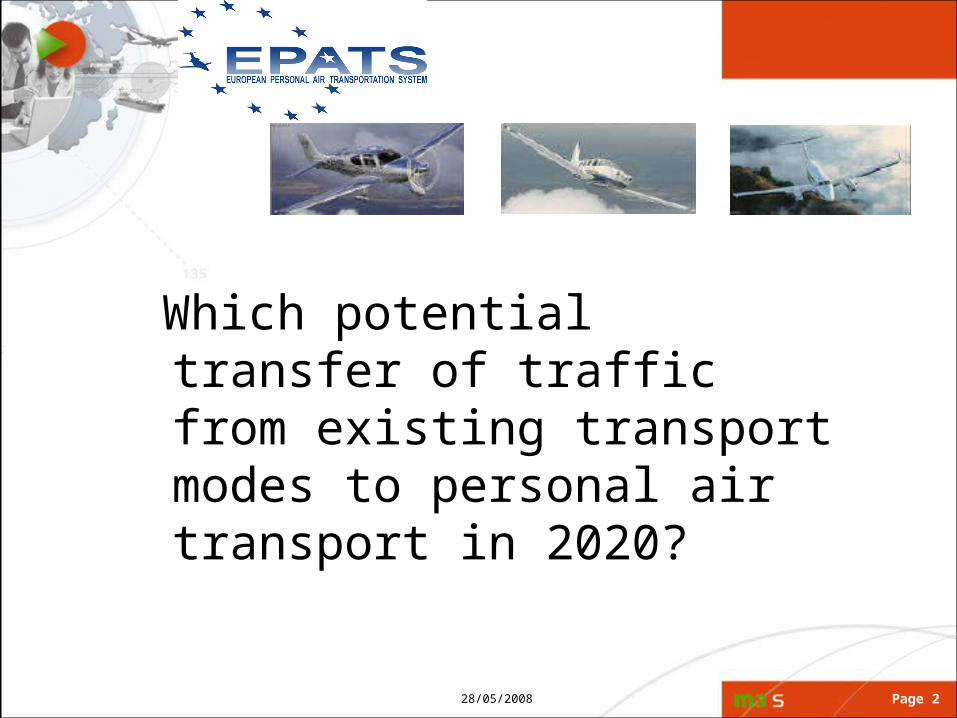
Which potential transfer of traffic from existing transport modes to personal air transport in 2020?

28/05/2008 Page 3
Method
Estimation Method
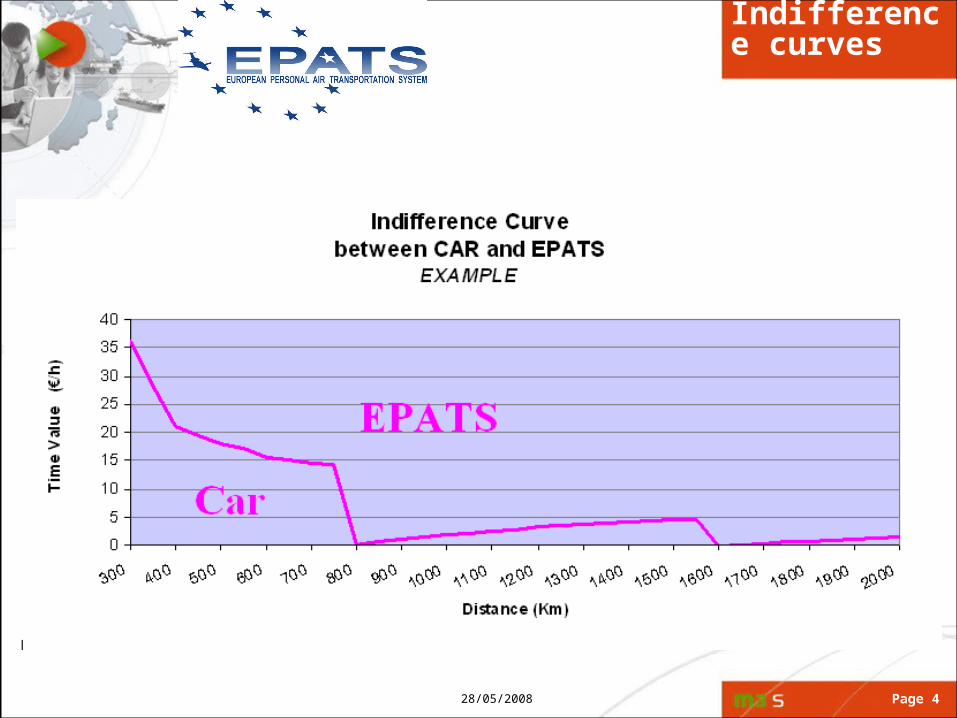
Generalised Cost method including:–The direct cost borne by the traveller–The travel time and its associated cost value
A traveller will choose the transport mode that minimizes his/her generalised cost
28/05/2008 Page 4
Indifference curves
28/05/2008 Page 5
Method
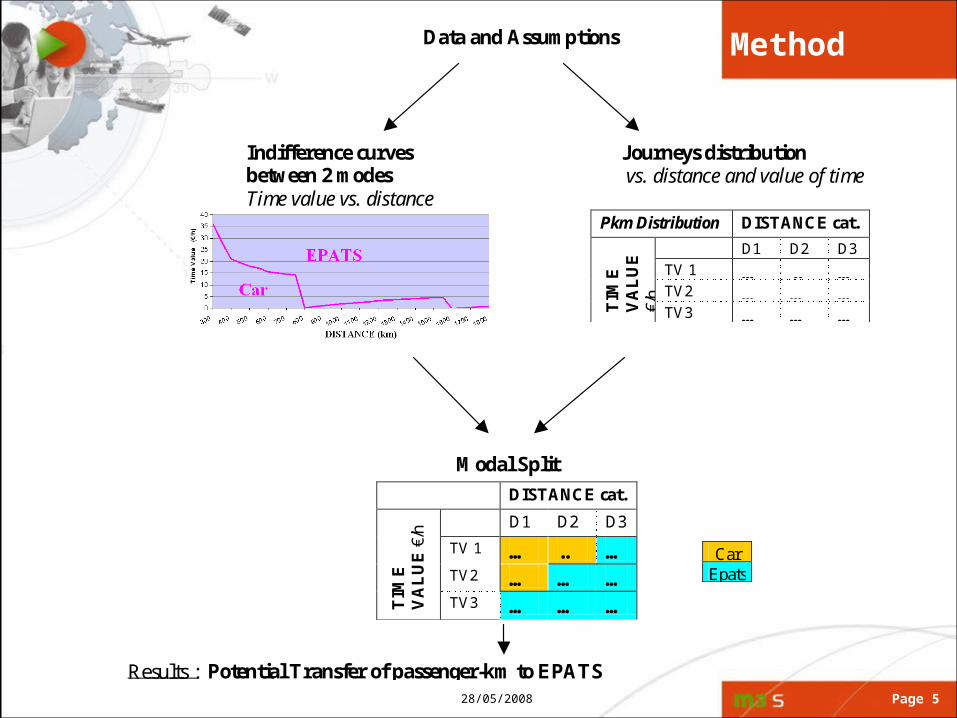
Data and Assumptions
Indifference curves Journeys distribution between 2 modes vs. distance and value of time Time value vs. distance
Modal Split
Results : Potential Transfer of passenger-km to EPATS
Pkm Distribution DISTANCE cat.
D1 D2 D3
TV 1 … .. … TV2 … … …
TIM
E
VA
LU
E
€/h
TV3 … … …
DISTANCE cat.
D1 D2 D3
TV 1 … .. … TV2 … … …
TIM
E
VA
LU
E €
/h
TV3 … … …
Car Epats
28/05/2008 Page 6
Connections
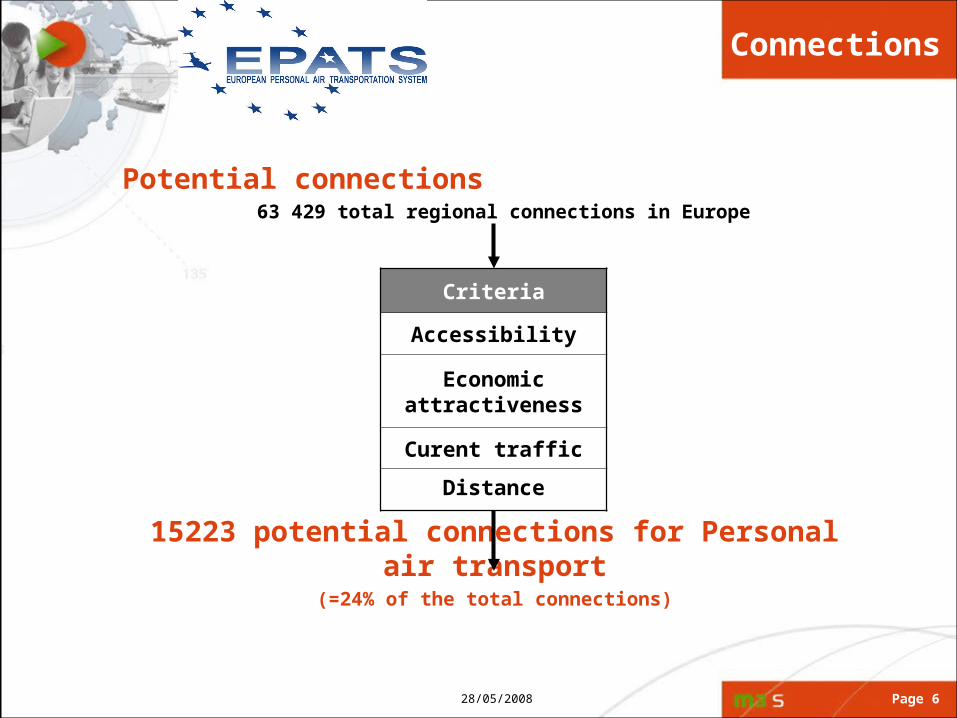
Potential connections63 429 total regional connections in Europe
15223 potential connections for Personal air transport
(=24% of the total connections)
Criteria
Accessibility
Economic attractiveness
Curent traffic
Distance
28/05/2008 Page 7
Transport modes
Transport modes
–EPATS generalised cost for traveller compared with the corresponding gesneralised costs of
•Road transport•Traditional air transport•High speed rail transport
–High-speed rail not kept since always preferred to EPATS
28/05/2008 Page 8
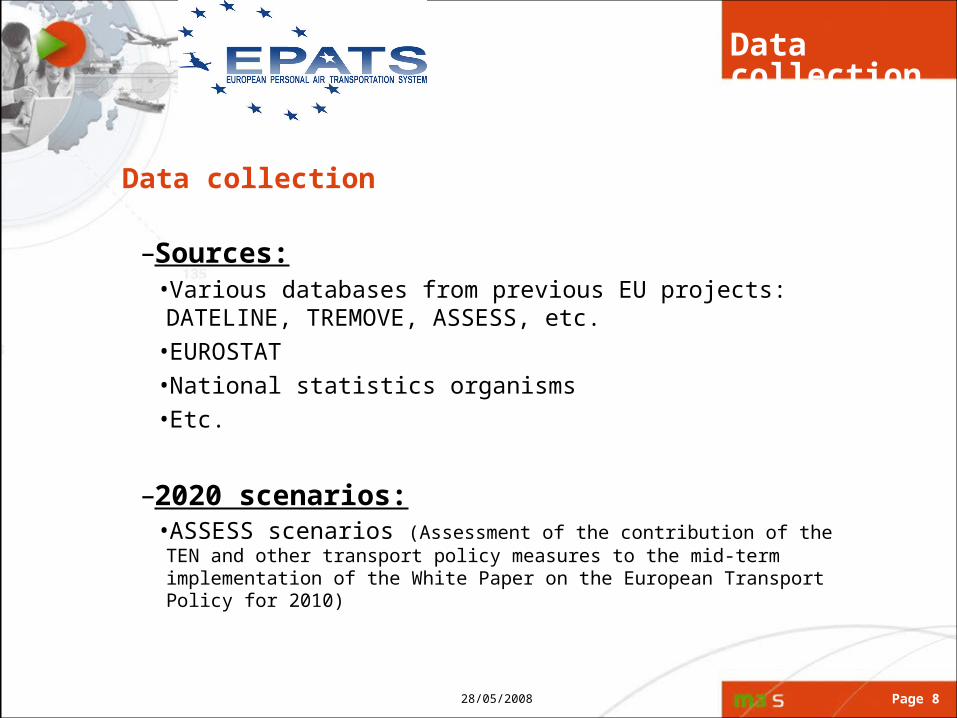
Data collection
Data collection
–Sources:•Various databases from previous EU projects: DATELINE, TREMOVE, ASSESS, etc.
•EUROSTAT•National statistics organisms•Etc.
–2020 scenarios:•ASSESS scenarios (Assessment of the contribution of the TEN and other transport policy measures to the mid-term implementation of the White Paper on the European Transport Policy for 2010)
28/05/2008 Page 9
Traffic
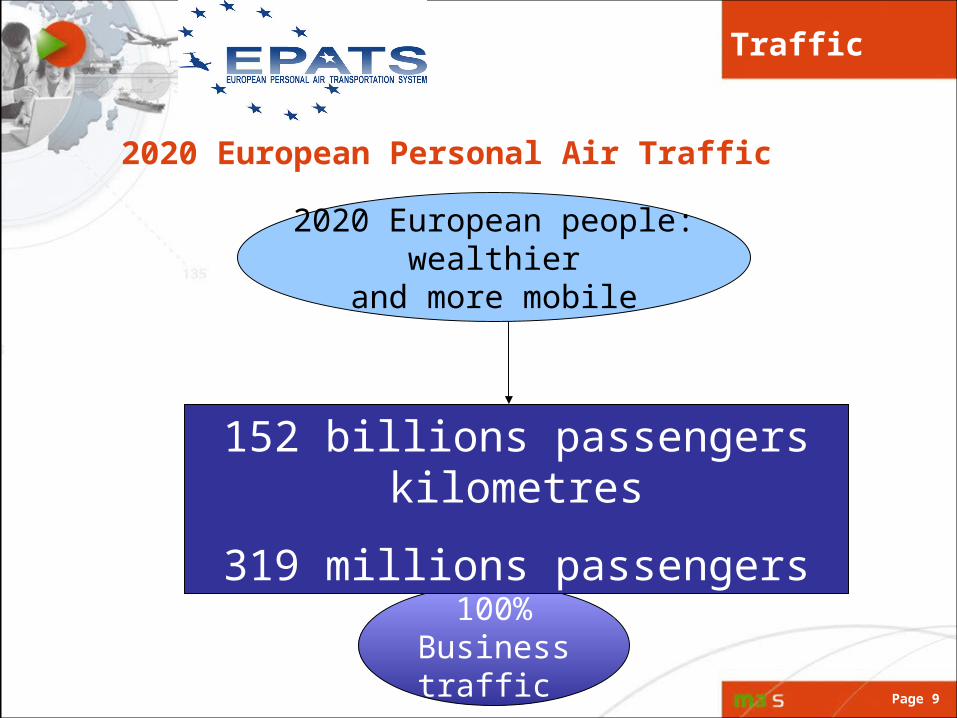
2020 European Personal Air Traffic
100% Business traffic
2020 European people: wealthier
and more mobile
152 billions passengers kilometres
319 millions passengers
28/05/2008 Page 10
2020 Flights
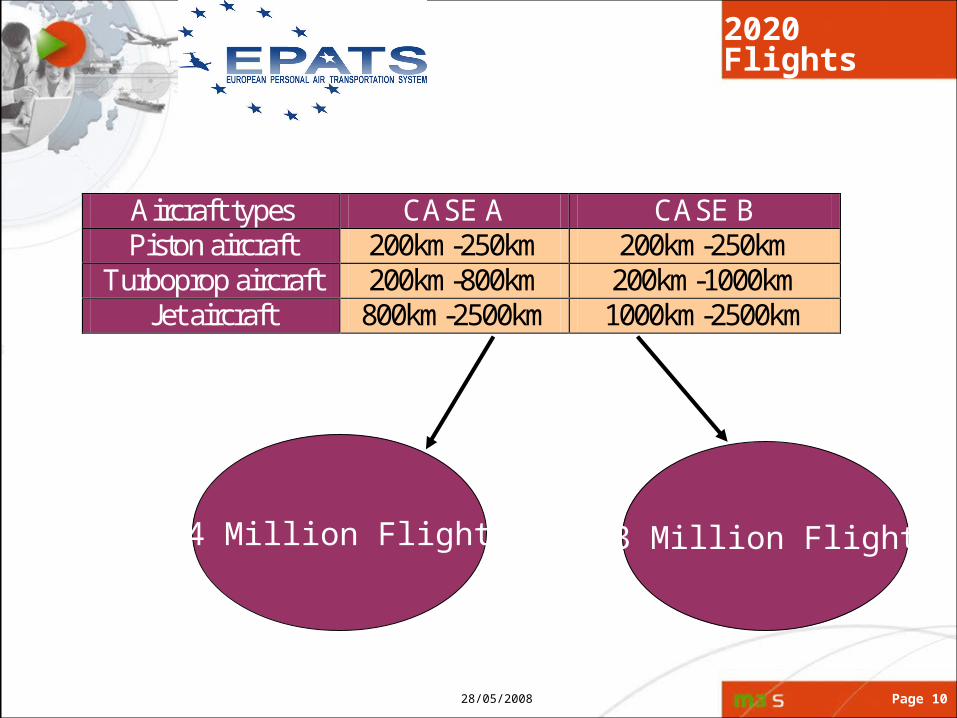
44 Million Flights 43 Million Flights
Aircraft types CASE A CASE B Piston aircraft 200km-250km 200km-250km
Turboprop aircraft 200km-800km 200km-1000km Jet aircraft 800km-2500km 1000km-2500km
28/05/2008 Page 11
2020 Flights
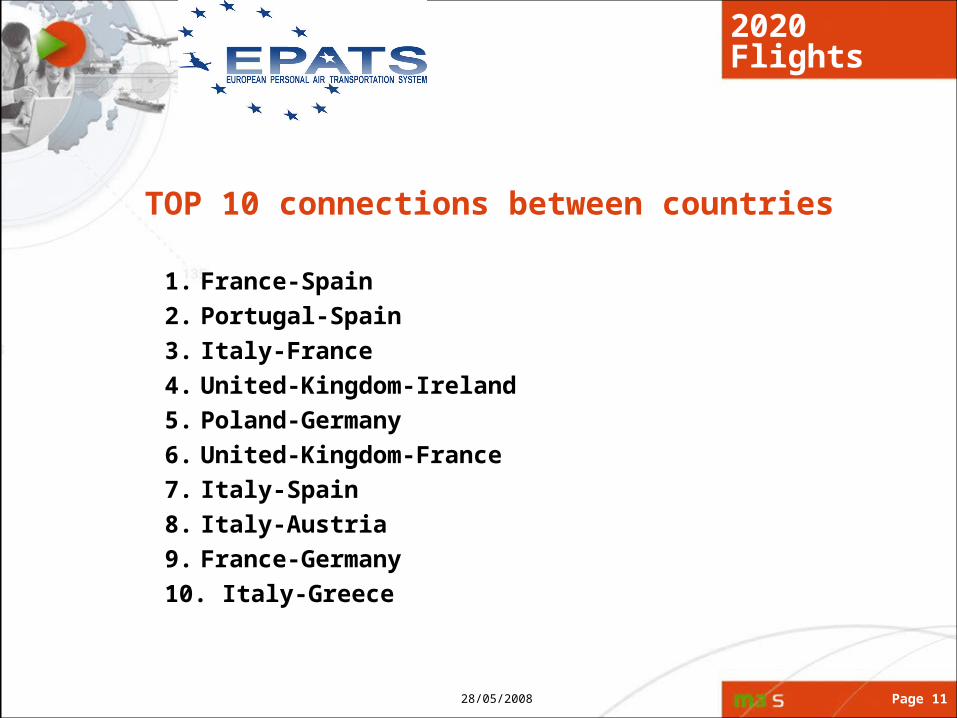
TOP 10 connections between countries
1. France-Spain
2. Portugal-Spain
3. Italy-France
4. United-Kingdom-Ireland
5. Poland-Germany
6. United-Kingdom-France
7. Italy-Spain
8. Italy-Austria
9. France-Germany
10. Italy-Greece

28/05/2008 Page 12
2020 Fleet
90 000 personal aircraft in Europe
Piston56%
Turboprop18%
Jet26%
28/05/2008 Page 13
France
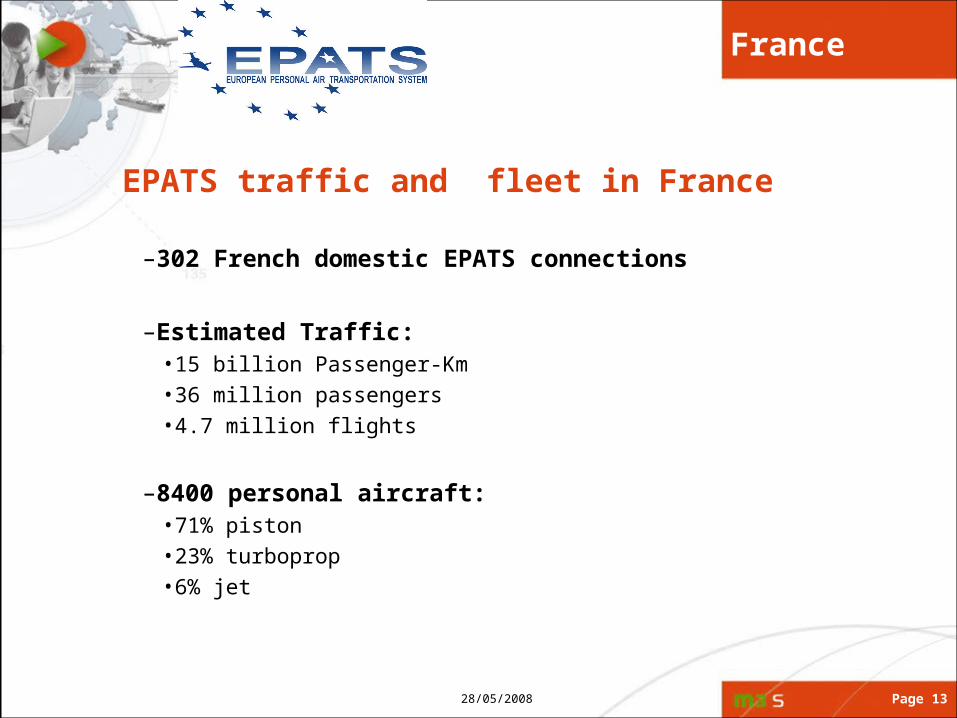
EPATS traffic and fleet in France
–302 French domestic EPATS connections
–Estimated Traffic: •15 billion Passenger-Km•36 million passengers•4.7 million flights
–8400 personal aircraft:•71% piston•23% turboprop•6% jet
28/05/2008 Page 14
Poland
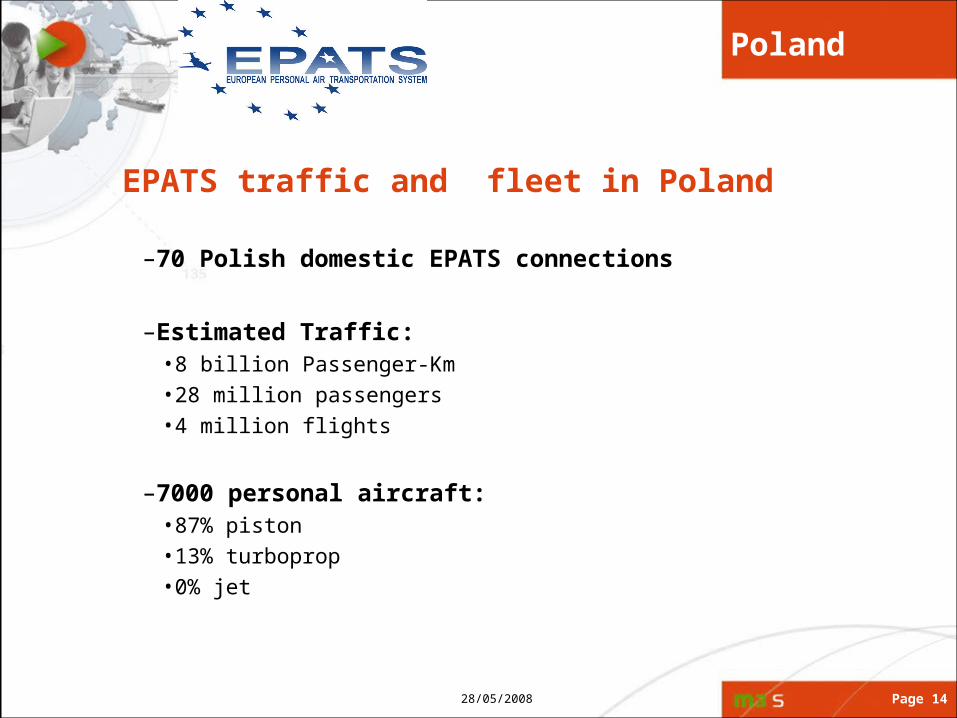
EPATS traffic and fleet in Poland
–70 Polish domestic EPATS connections
–Estimated Traffic: •8 billion Passenger-Km•28 million passengers•4 million flights
–7000 personal aircraft:•87% piston•13% turboprop•0% jet
28/05/2008 Page 15
Sensitivity analysis
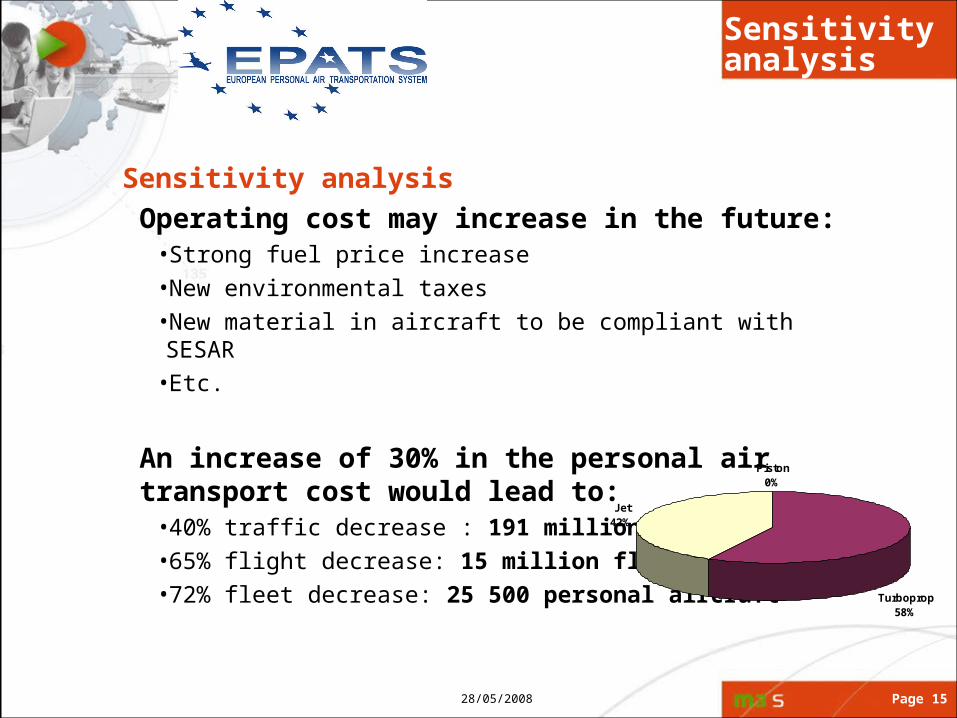
Sensitivity analysis
Operating cost may increase in the future:•Strong fuel price increase•New environmental taxes•New material in aircraft to be compliant with SESAR•Etc.
An increase of 30% in the personal air transport cost would lead to:
•40% traffic decrease : 191 million Pax•65% flight decrease: 15 million flights•72% fleet decrease: 25 500 personal aircraft
Piston0%
Jet42%
Turboprop58%
28/05/2008 Page 16
Sensitivity analysis
Sensitivity analysis
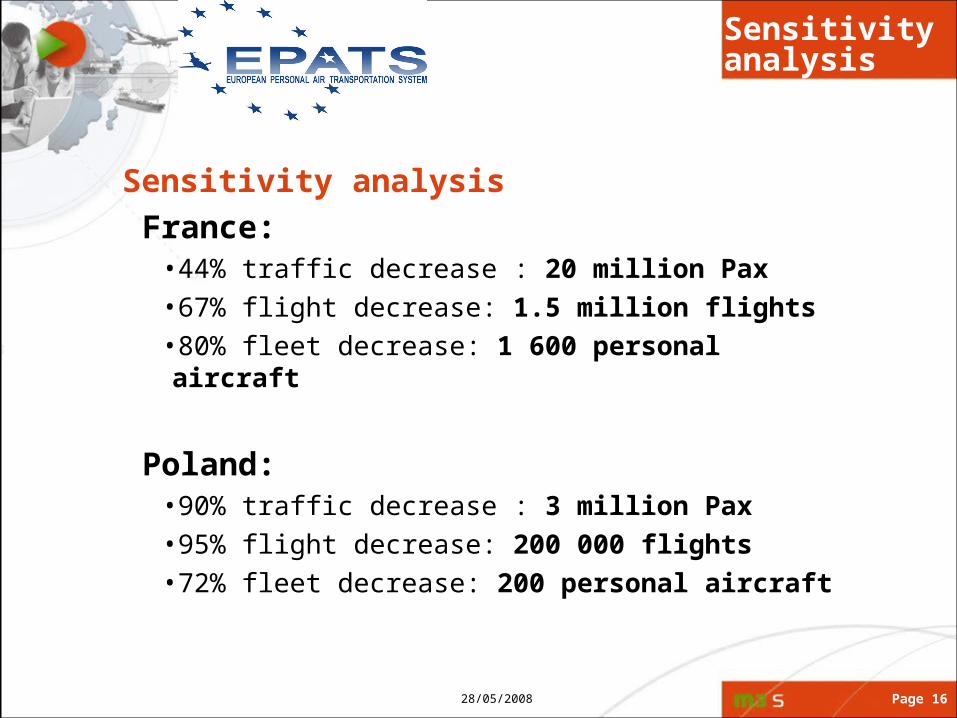
France:•44% traffic decrease : 20 million Pax•67% flight decrease: 1.5 million flights•80% fleet decrease: 1 600 personal aircraft
Poland:•90% traffic decrease : 3 million Pax•95% flight decrease: 200 000 flights•72% fleet decrease: 200 personal aircraft
28/05/2008 Page 17
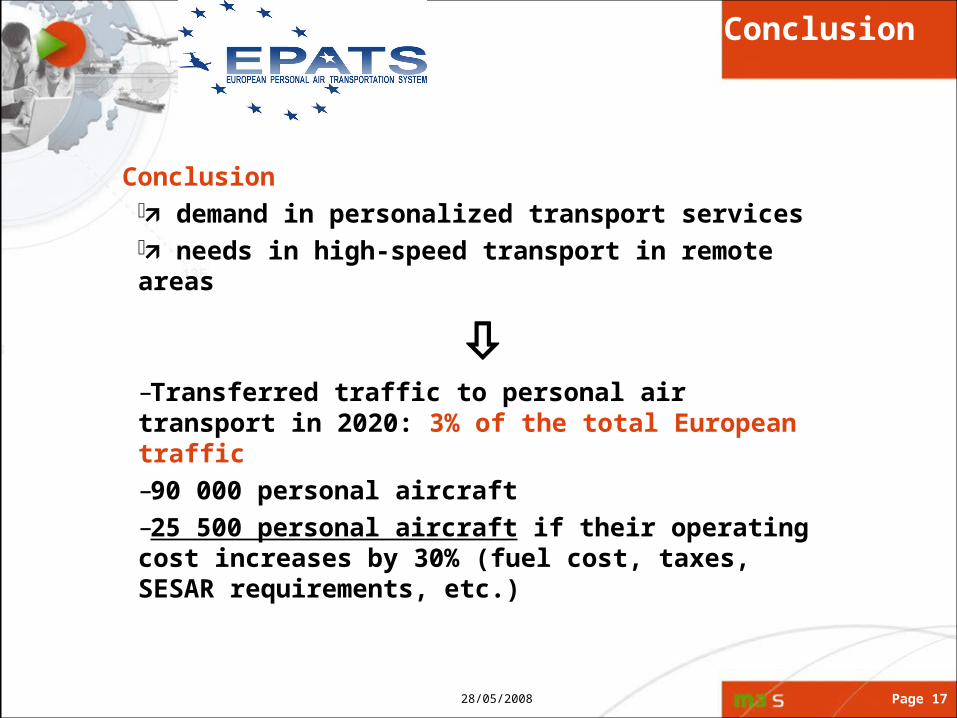
Conclusion
Conclusion demand in personalized transport services needs in high-speed transport in remote areas
–Transferred traffic to personal air transport in 2020: 3% of the total European traffic–90 000 personal aircraft–25 500 personal aircraft if their operating cost increases by 30% (fuel cost, taxes, SESAR requirements, etc.)

28/05/2008 Page 18
Thank you very much for your attention!
Any questions?