Embed Size (px)
DESCRIPTION
data
Citation preview
AXG-9-29432-01 document.xls
COMPARATIVE ANALYSIS OF ALTERNATIVE MEANS
for
REMOVING NONCONDENSABLE GASES
from
FLASHED-STEAM GEOTHERMAL POWER PLANTS
by Subcontractors :
Martin Vorum, P.E.
and
Eugene A. Fritzler, P.E.
Subcontract Number AXG-9-29432-01Under Prime Contract Number DE-AC36-98GO10337
for Contractor :
Midwest Research InstituteNational Renewable Energy Laboratory Division
1617 Cole BoulevardGolden, Colorado 80401
March 2000
AXG-9-29432-01 document.xls
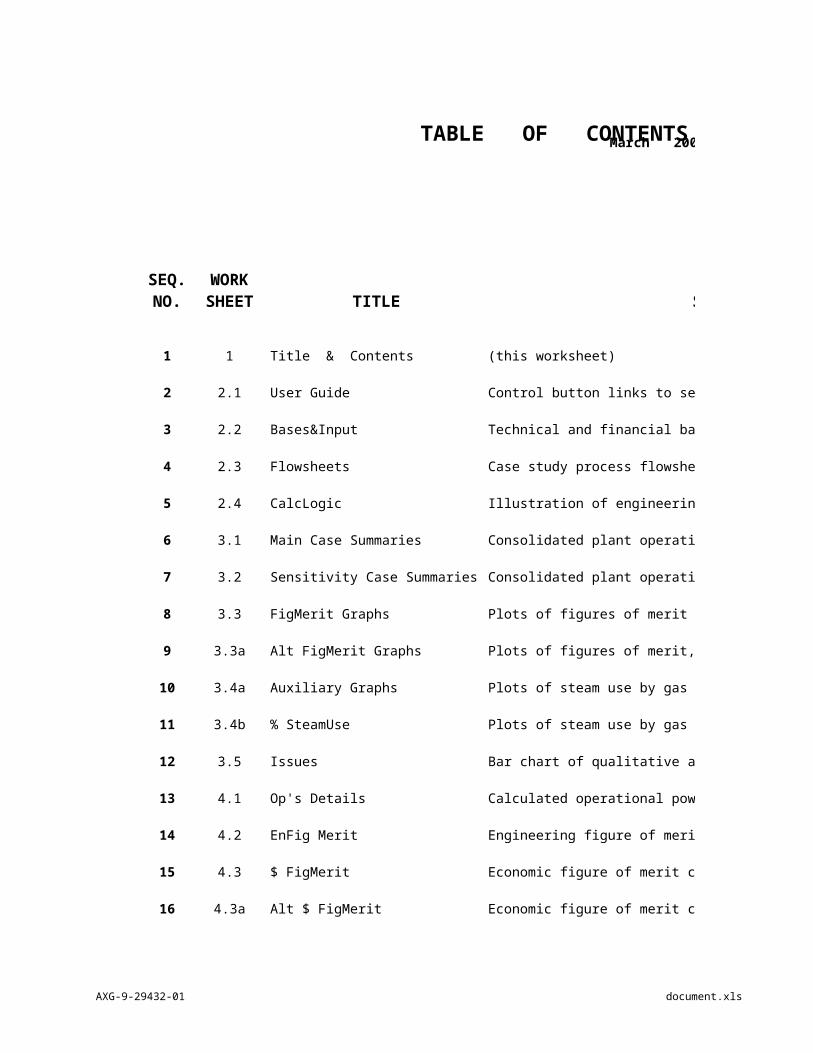
TABLE OF CONTENTS
TITLE SUMMARY
1 1 Title & Contents (this worksheet)
2 2.1 User Guide Control button links to sections of spreadsheet
3 2.2 Bases&Input Technical and financial bases and assumptions of study
4 2.3 Flowsheets Case study process flowsheets -- mass and energy flows
5 2.4 CalcLogic Illustration of engineering calculation sequences
6 3.1 Main Case Summaries Consolidated plant operating data -- primary input to this spreadsheet
7 3.2 Sensitivity Case Summaries Consolidated plant operating data -- secondary input, special conditions
8 3.3 FigMerit Graphs Plots of figures of merit versus noncondensable gas values (primary data results)
9 3.3a Alt FigMerit Graphs Plots of figures of merit, using NPV results for economic analyses.
10 3.4a Auxiliary Graphs Plots of steam use by gas removal systems -- mass flow demand
11 3.4b % SteamUse Plots of steam use by gas removal systems -- percent of turbine feed rates
12 3.5 Issues Bar chart of qualitative advantages/disadvantages
13 4.1 Op's Details Calculated operational power plant performance profiles
14 4.2 EnFig Merit Engineering figure of merit calculations -- relative performance efficiency
15 4.3 $ FigMerit Economic figure of merit calculations -- Simple Payback Period
16 4.3a Alt $ FigMerit Economic figure of merit calculations -- Net Present Value results
17 4.3b Present Values Net Present Value calculation details
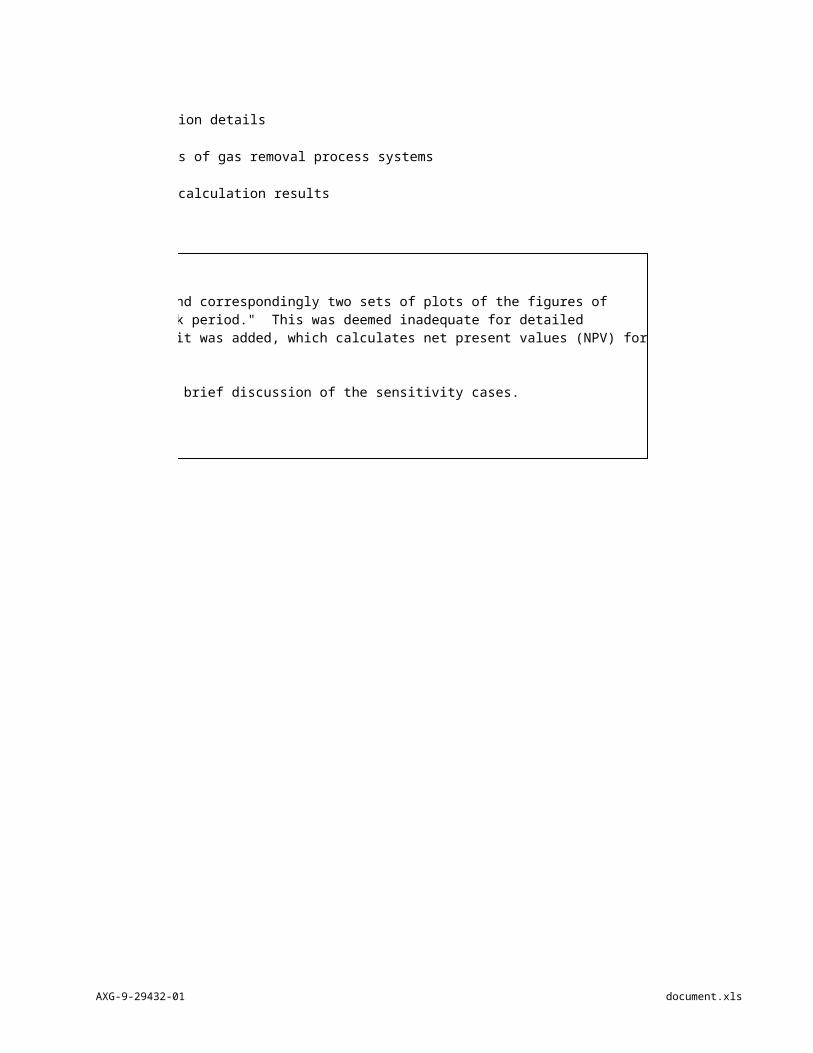
18 4.4 CostData Installation and unit costs of gas removal process systems
SEQ.NO.
WORK SHEET
AXG-9-29432-01 document.xls
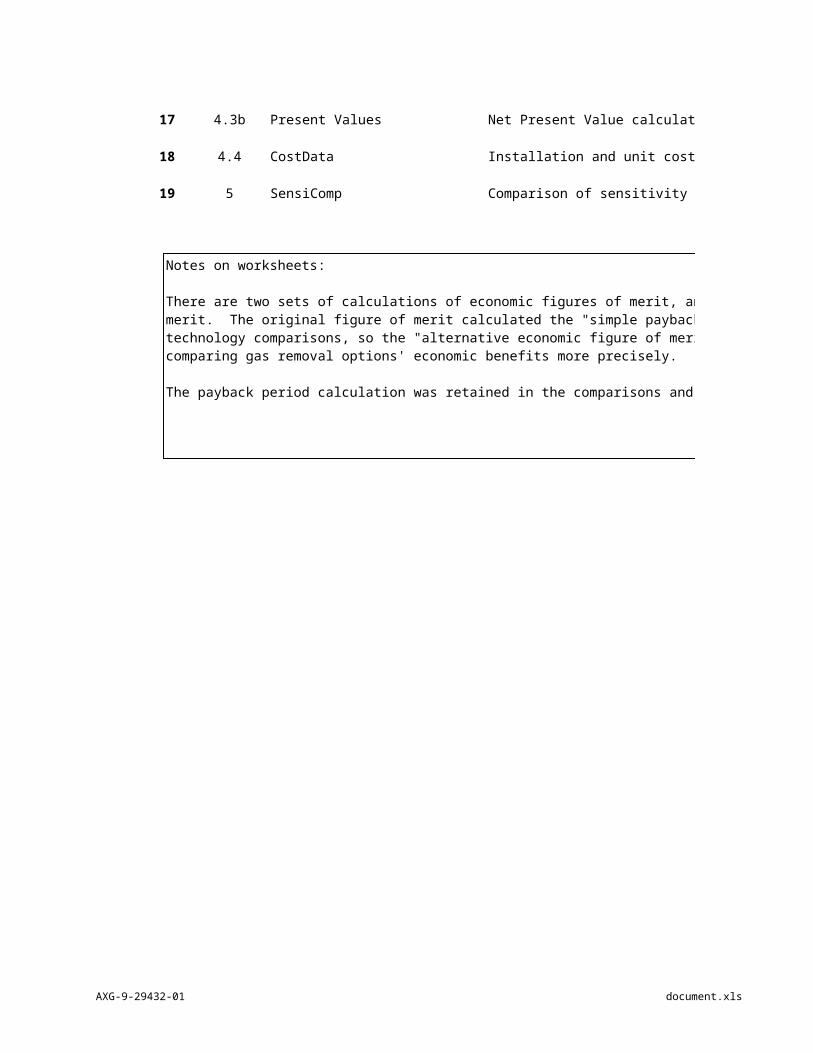
19 5 SensiComp Comparison of sensitivity calculation results
Notes on worksheets:
There are two sets of calculations of economic figures of merit, and correspondingly two sets of plots of the figures of merit. The original figure of merit calculated the "simple payback period." This was deemed inadequate for detailed technology comparisons, so the "alternative economic figure of merit was added, which calculates net present values (NPV) for comparing gas removal options' economic benefits more precisely.
The payback period calculation was retained in the comparisons and brief discussion of the sensitivity cases.
AXG-9-29432-01 document.xls
COMPARATIVE ANALYSIS OF ALTERNATIVE MEANS
for
REMOVING NONCONDENSABLE GASES
from
FLASHED-STEAM GEOTHERMAL POWER PLANTS
by Subcontractors :
Martin Vorum, P.E.
and
Eugene A. Fritzler, P.E.
Subcontract Number AXG-9-29432-01Under Prime Contract Number DE-AC36-98GO10337
for Contractor :
Midwest Research InstituteNational Renewable Energy Laboratory Division
1617 Cole BoulevardGolden, Colorado 80401
March 2000
AXG-9-29432-01 document.xls
TABLE OF CONTENTS
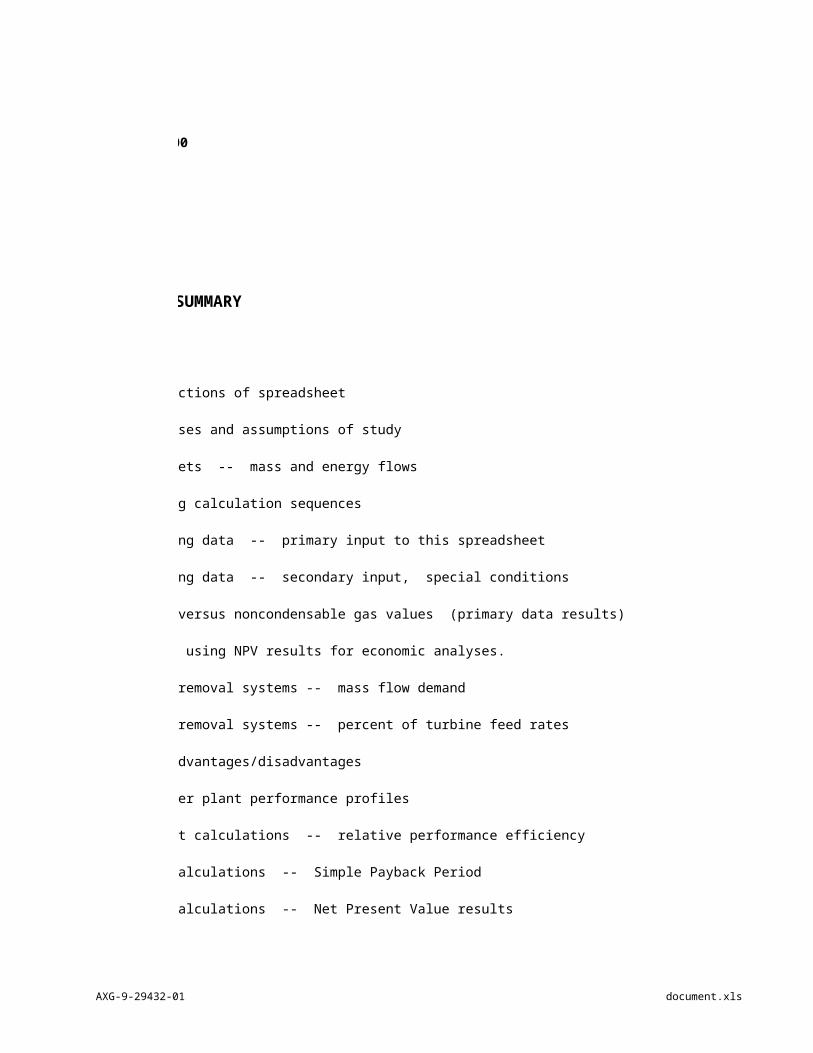
SUMMARY
Control button links to sections of spreadsheet
Technical and financial bases and assumptions of study
Case study process flowsheets -- mass and energy flows
Illustration of engineering calculation sequences
Consolidated plant operating data -- primary input to this spreadsheet
Consolidated plant operating data -- secondary input, special conditions
Plots of figures of merit versus noncondensable gas values (primary data results)
Plots of figures of merit, using NPV results for economic analyses.
Plots of steam use by gas removal systems -- mass flow demand
Plots of steam use by gas removal systems -- percent of turbine feed rates
Bar chart of qualitative advantages/disadvantages
Calculated operational power plant performance profiles
Engineering figure of merit calculations -- relative performance efficiency
Economic figure of merit calculations -- Simple Payback Period
Economic figure of merit calculations -- Net Present Value results
Net Present Value calculation details
Installation and unit costs of gas removal process systems
AXG-9-29432-01 document.xls
Comparison of sensitivity calculation results
Notes on worksheets:
There are two sets of calculations of economic figures of merit, and correspondingly two sets of plots of the figures of merit. The original figure of merit calculated the "simple payback period." This was deemed inadequate for detailed technology comparisons, so the "alternative economic figure of merit was added, which calculates net present values (NPV) for comparing gas removal options' economic benefits more precisely.
The payback period calculation was retained in the comparisons and brief discussion of the sensitivity cases.
Sheet 2.1 UserGuide
AXG-9-29432-01document.xls Page 2.9 10:22:18
04/18/2023
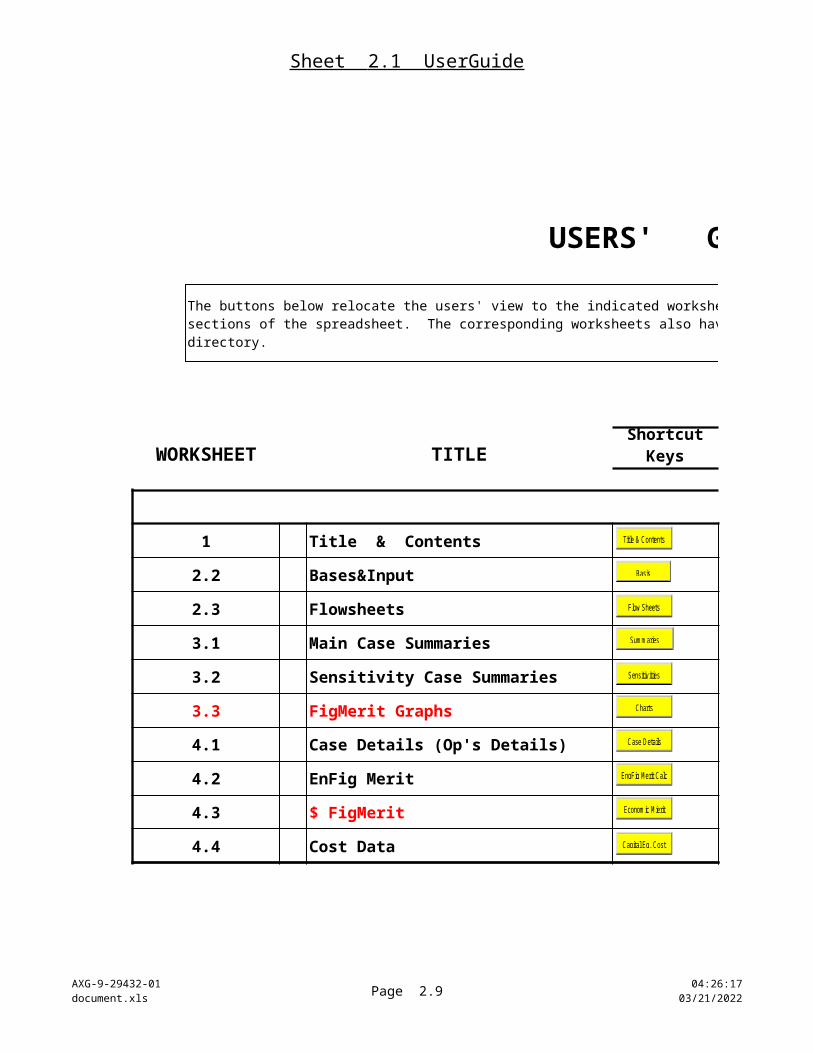
USERS' GUIDE
WORKSHEET TITLE SUMMARY
1 Title & Contents Title page and table of contents
2.2 Bases&Input Technical bases and assumptions of study
2.3 Flowsheets Case study process flowsheets
3.1 Main Case Summaries Consolidated case study results
3.2 Sensitivity Case Summaries Sensitivity Case Study Results
3.3 FigMerit Graphs Plots of case study results
4.1 Case Details (Op's Details) Project case studies: power plant data performance data
4.2 EnFig Merit Engineering figure of merit calculations
4.3 $ FigMerit Economic figure of merit calculations
4.4 Cost Data Costs of major equipment units
Shortcut Keys
The buttons below relocate the users' view to the indicated worksheet. Use these to quickly navigate the key sections of the spreadsheet. The corresponding worksheets also have "return" buttons to come back to this central directory.
Basis
Summaries
Charts
Case Details
Flow Sheets
EngFig Merit Calc
Capital Eq. Cost
Economic Mierit
Sensitiv ities
Title & Contents
Sheet 2.1 UserGuide
AXG-9-29432-01document.xls Page 2.10 10:22:18
04/18/2023
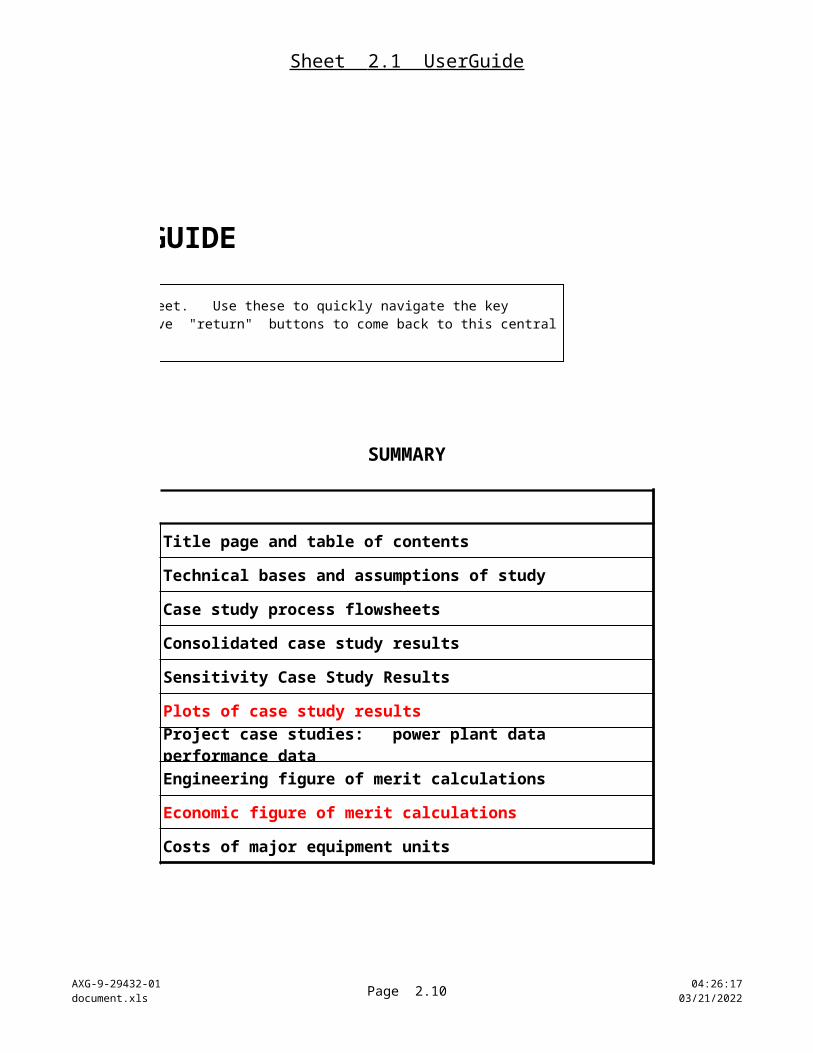
USERS' GUIDE
SUMMARY
Title page and table of contents
Technical bases and assumptions of study
Case study process flowsheets
Consolidated case study results
Sensitivity Case Study Results
Plots of case study results
Project case studies: power plant data performance data
Engineering figure of merit calculations
Economic figure of merit calculations
Costs of major equipment units
The buttons below relocate the users' view to the indicated worksheet. Use these to quickly navigate the key sections of the spreadsheet. The corresponding worksheets also have "return" buttons to come back to this central directory.
Sheet 2.2 Bases&Input
AXG-9-29432-01document.xls
2.2.11 10:22:1804/18/2023
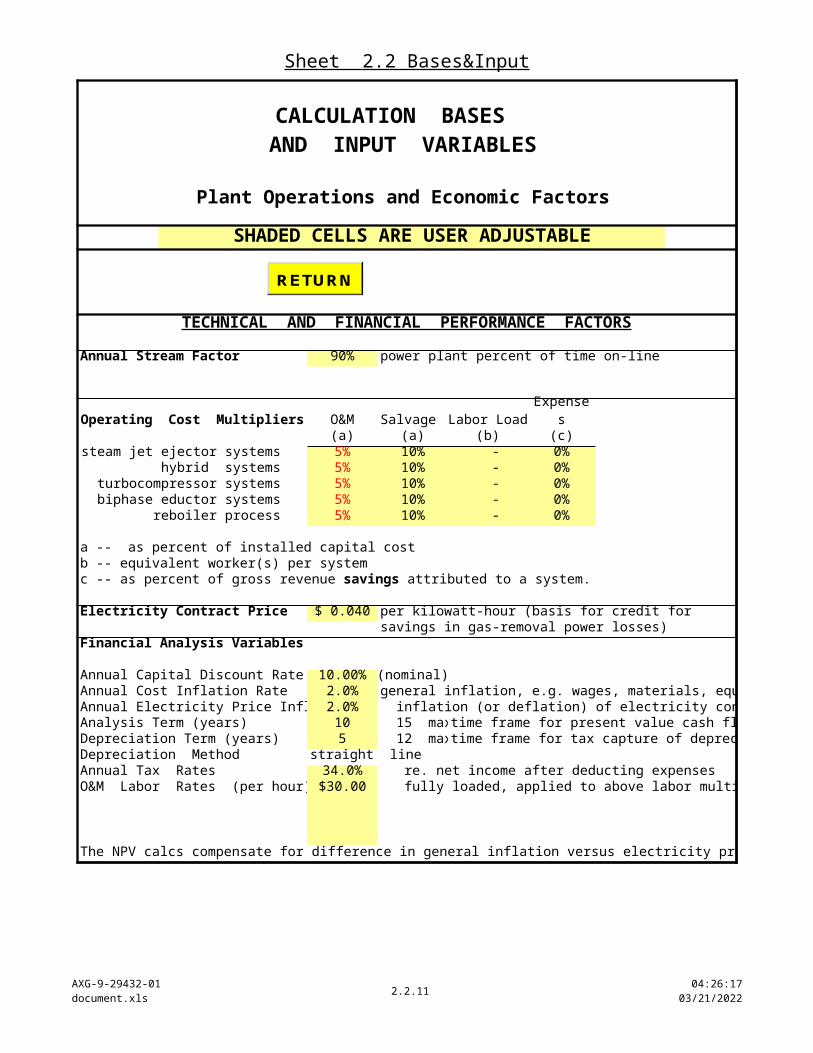
SHADED CELLS ARE USER ADJUSTABLE
TECHNICAL AND FINANCIAL PERFORMANCE FACTORS
Annual Stream Factor 90% power plant percent of time on-line
Operating Cost Multipliers O&M Salvage Labor Load(a) (a) (b) (c)
steam jet ejector systems 5% 10% - 0%hybrid systems 5% 10% - 0%
turbocompressor systems 5% 10% - 0%biphase eductor systems 5% 10% - 0%
reboiler process 5% 10% - 0%
a -- as percent of installed capital costb -- equivalent worker(s) per system
Electricity Contract Price $ 0.040 per kilowatt-hour (basis for credit forsavings in gas-removal power losses)
Financial Analysis Variables
Annual Capital Discount Rate 10.00% (nominal)Annual Cost Inflation Rate 2.0% general inflation, e.g. wages, materials, equipment, etc.Annual Electricity Price Inflation 2.0% inflation (or deflation) of electricity contract priceAnalysis Term (years) 10 15 max. time frame for present value cash flowsDepreciation Term (years) 5 12 max. time frame for tax capture of depreciationDepreciation Method straight lineAnnual Tax Rates 34.0% re. net income after deducting expensesO&M Labor Rates (per hour) $ 30.00 fully loaded, applied to above labor multiplier
The NPV calcs compensate for difference in general inflation versus electricity price inflation.
Expenses
c -- as percent of gross revenue savings attributed to a system.
CALCULATION BASES AND INPUT VARIABLES
Plant Operations and Economic Factors
RETURN
Sheet 2.2 Bases&Input
AXG-9-29432-01document.xls
2.2.12 10:22:1804/18/2023
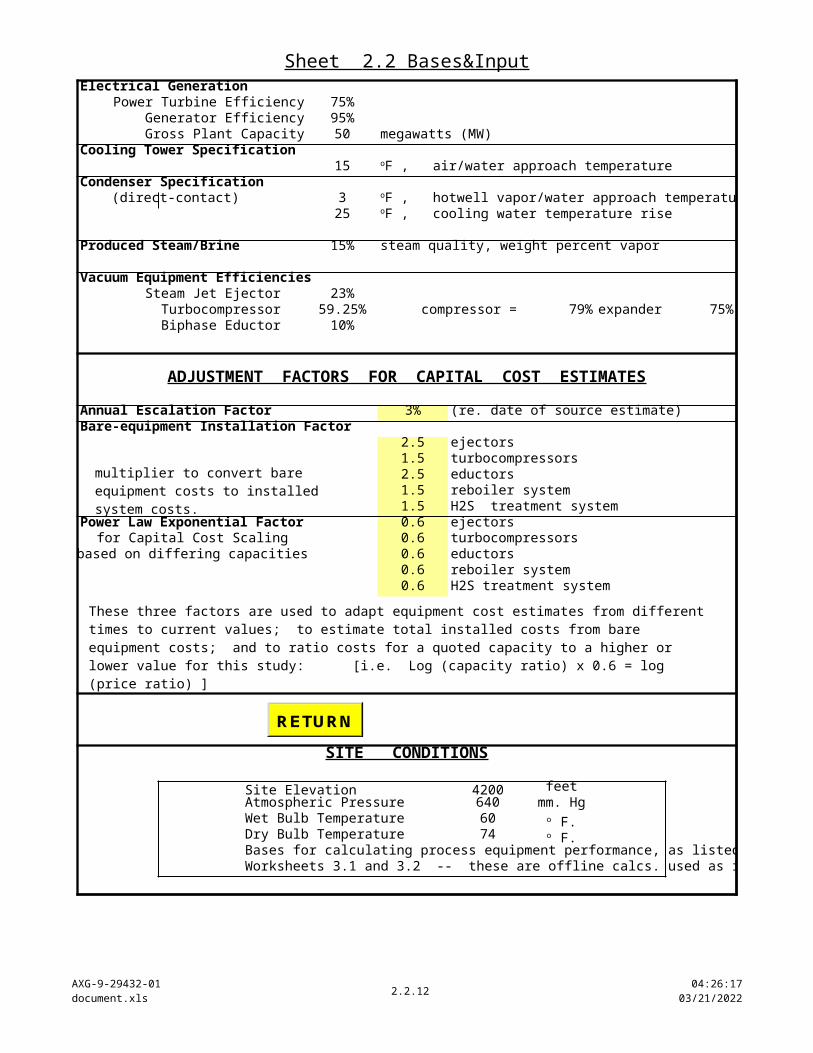
Electrical GenerationPower Turbine Efficiency 75%
Generator Efficiency 95%Gross Plant Capacity 50 megawatts (MW)
Cooling Tower Specification15
Condenser Specification(direct-contact) 3
25
Produced Steam/Brine 15% steam quality, weight percent vapor
Vacuum Equipment EfficienciesSteam Jet Ejector 23%Turbocompressor 59.25% compressor = 79% expander 75%Biphase Eductor 10%
ADJUSTMENT FACTORS FOR CAPITAL COST ESTIMATES
Annual Escalation Factor 3% (re. date of source estimate)Bare-equipment Installation Factor
2.5 ejectors1.5 turbocompressors2.5 eductors1.5 reboiler system1.5 H2S treatment system
Power Law Exponential Factor 0.6 ejectorsfor Capital Cost Scaling 0.6 turbocompressors
based on differing capacities 0.6 eductors0.6 reboiler system0.6 H2S treatment system
SITE CONDITIONS
Site Elevation 4200 feetAtmospheric Pressure 640 mm. HgWet Bulb Temperature 60Dry Bulb Temperature 74Bases for calculating process equipment performance, as listed in Worksheets 3.1 and 3.2 -- these are offline calcs. used as input here.
oF , air/water approach temperature
oF , hotwell vapor/water approach temperatureoF , cooling water temperature rise
o F.o F.
These three factors are used to adapt equipment cost estimates from different times to current values; to estimate total installed costs from bare equipment costs; and to ratio costs for a quoted capacity to a higher or lower value for this study: [i.e. Log (capacity ratio) x 0.6 = log (price ratio) ]
multiplier to convert bare equipment costs to installed system costs.
RETURN
Sheet 2.2 Bases&Input
AXG-9-29432-01document.xls
2.2.13 10:22:1804/18/2023
general inflation, e.g. wages, materials, equipment, etc.
AXG-9-29432-01document.xls Page 2.3.14 10:22:18
04/18/2023
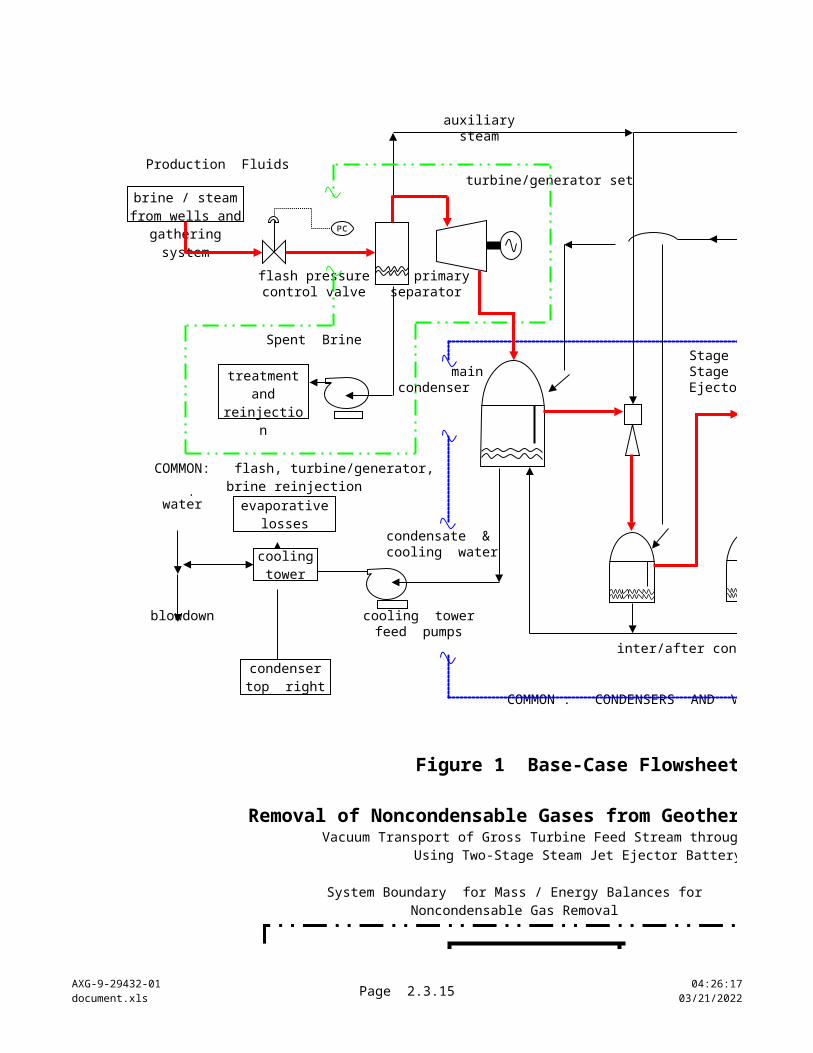
auxiliarysteam
Production Fluidsturbine/generator set
flash pressure primary control valve separator
Spent BrineStage 1 &
main Stage 2condenser Ejectors
makeupwater
condensate &cooling water
blowdown cooling towerfeed pumps
COMMON : CONDENSERS AND VACUUM GAS REMOVAL
steam & gases
Power & Utilities = 50 MW grossGeothermal
Resource Production and
Gathering Systems
Vacuum & Heat
Rejection Systems
Produced Fluid Flash
Separator
Electrical Generation
Systems
System Boundary for Mass / Energy Balances for Noncondensable Gas Removal
brine / steam from wells and
gathering system
treatment and
reinjection
Figure 1 Base-Case Flowsheet
Removal of Noncondensable Gases from Geothermal Power PlantVacuum Transport of Gross Turbine Feed Stream through Condensers
Using Two-Stage Steam Jet Ejector Battery
cooling tower
condensertop right
evaporativelosses
inter/after condensers
COMMON: flash, turbine/generator, brine reinjection
AXG-9-29432-01document.xls Page 2.3.15 10:22:18
04/18/2023
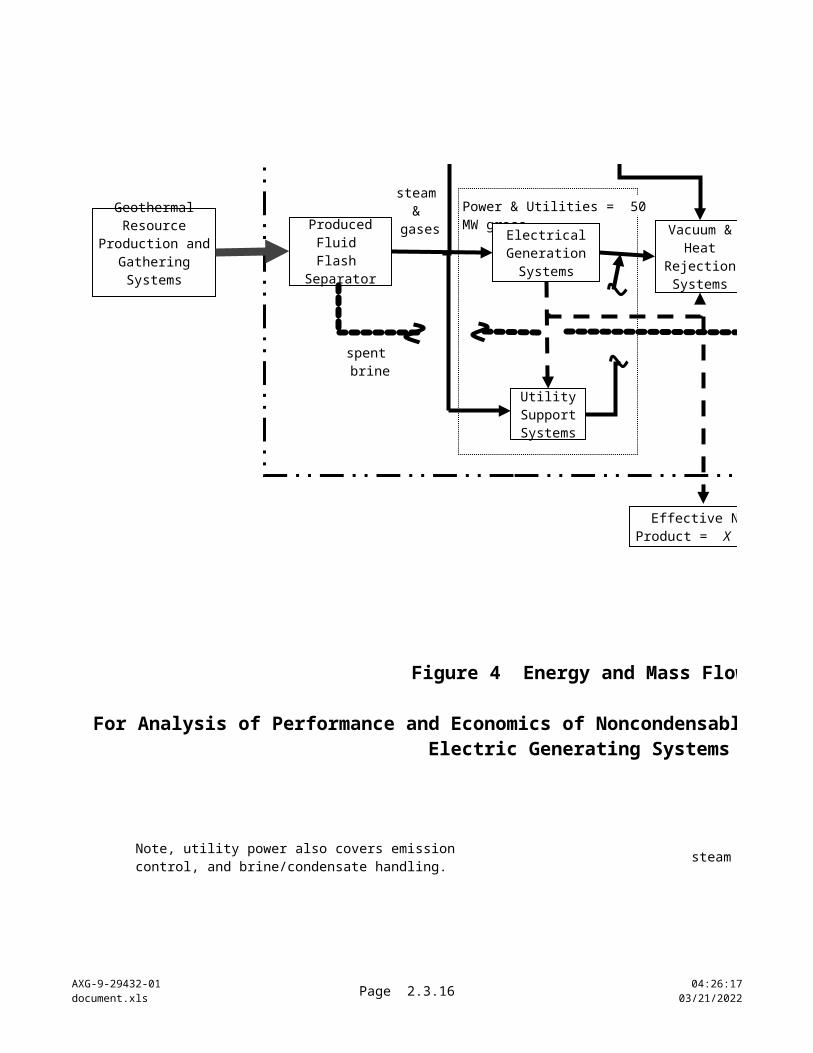
steam / gas flow path Note, utility power also covers emission control, and brine/condensate handling.
Figure 4 Energy and Mass Flow
For Analysis of Performance and Economics of Noncondensable Gas Removal From Geothermal Electric Generating Systems
steam & gases
Effective Net Product = X MW
Geothermal Resource
Production and Gathering Systems
Vacuum & Heat
Rejection Systems
Produced Fluid Flash
Separator
Electrical Generation
Systems
Utility Support Systems
spent brine
AXG-9-29432-01document.xls Page 2.3.16 10:22:18
04/18/2023
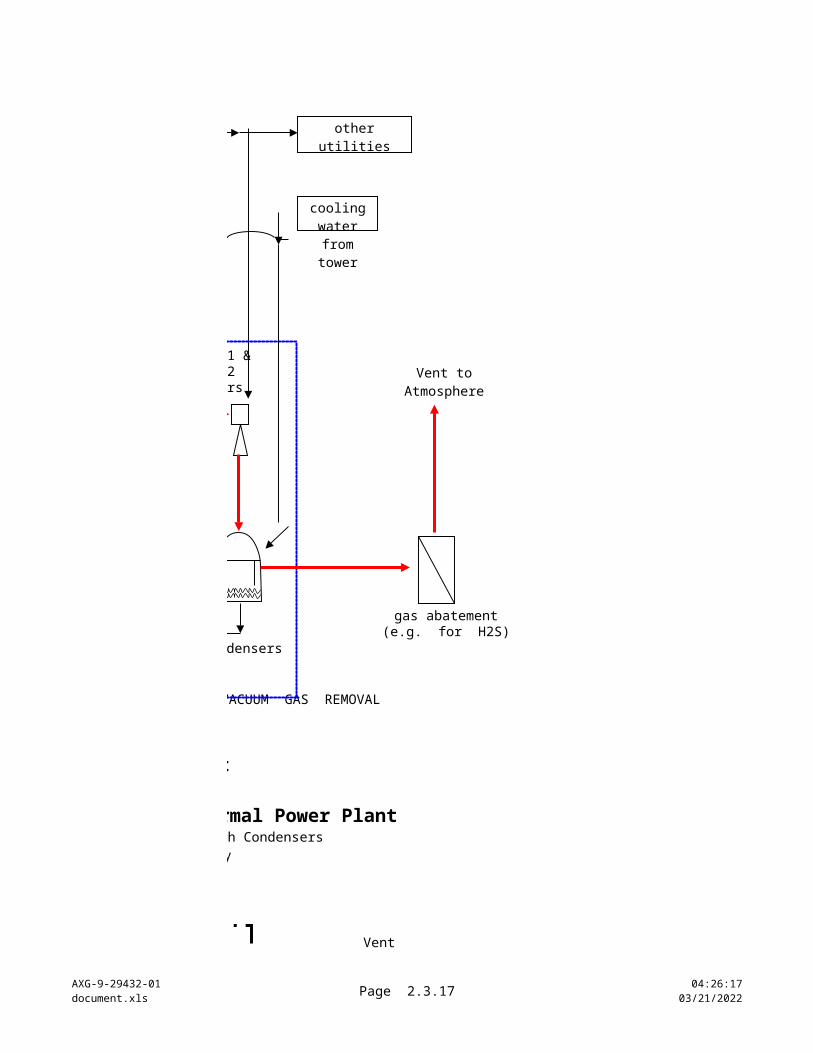
Stage 1 &Stage 2Ejectors
gas abatement(e.g. for H2S)
COMMON : CONDENSERS AND VACUUM GAS REMOVAL
Vacuum & Heat
Rejection Systems
Emissions Control
Systems
Vent
otherutilities
cooling water from
tower
Figure 1 Base-Case Flowsheet
Removal of Noncondensable Gases from Geothermal Power PlantVacuum Transport of Gross Turbine Feed Stream through Condensers
Using Two-Stage Steam Jet Ejector Battery
inter/after condensers
Vent to Atmosphere
AXG-9-29432-01document.xls Page 2.3.17 10:22:18
04/18/2023
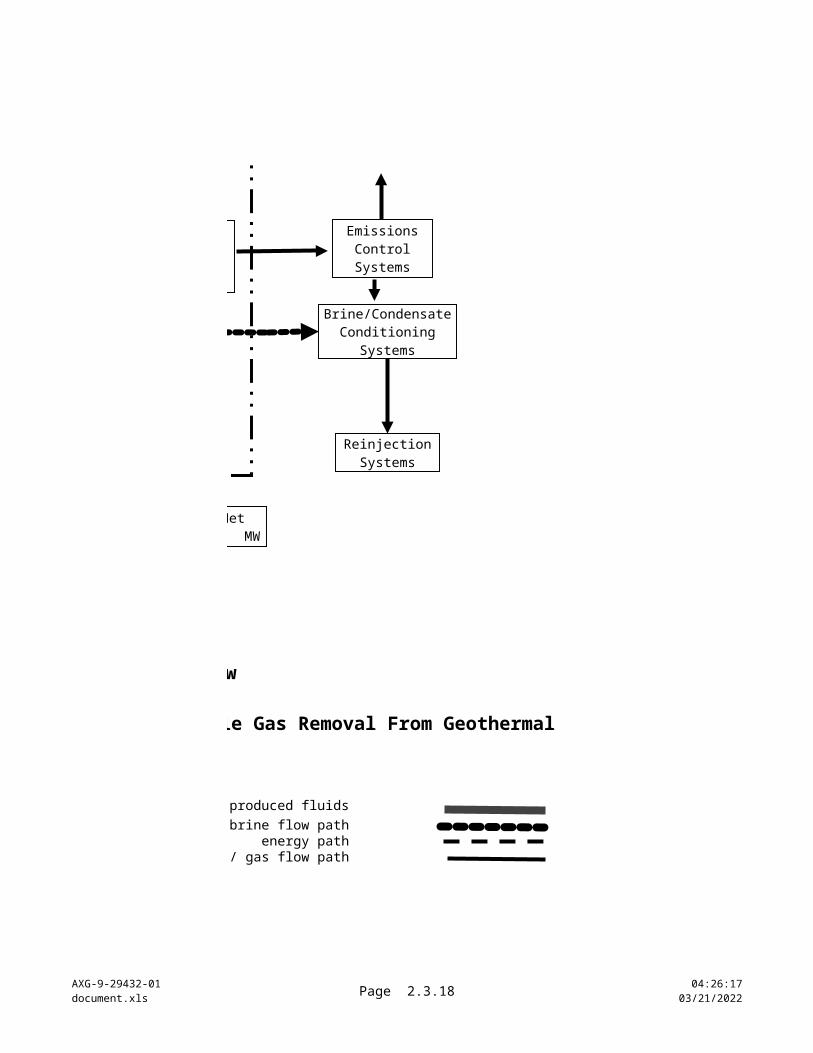
produced fluids brine flow path
energy path steam / gas flow path
Figure 4 Energy and Mass Flow
For Analysis of Performance and Economics of Noncondensable Gas Removal From Geothermal Electric Generating Systems
Effective Net Product = X MW
Brine/Condensate Conditioning
Systems
Reinjection Systems
Vacuum & Heat
Rejection Systems
Emissions Control
Systems
AXG-9-29432-01document.xls Page 2.3.18 10:22:18
04/18/2023
RETURN
RETURN
AXG-9-29432-01document.xls Page 2.3.19 10:22:18
04/18/2023
RETURN
AXG-9-29432-01document.xls Page 2.4.20 10:22:18
04/18/2023
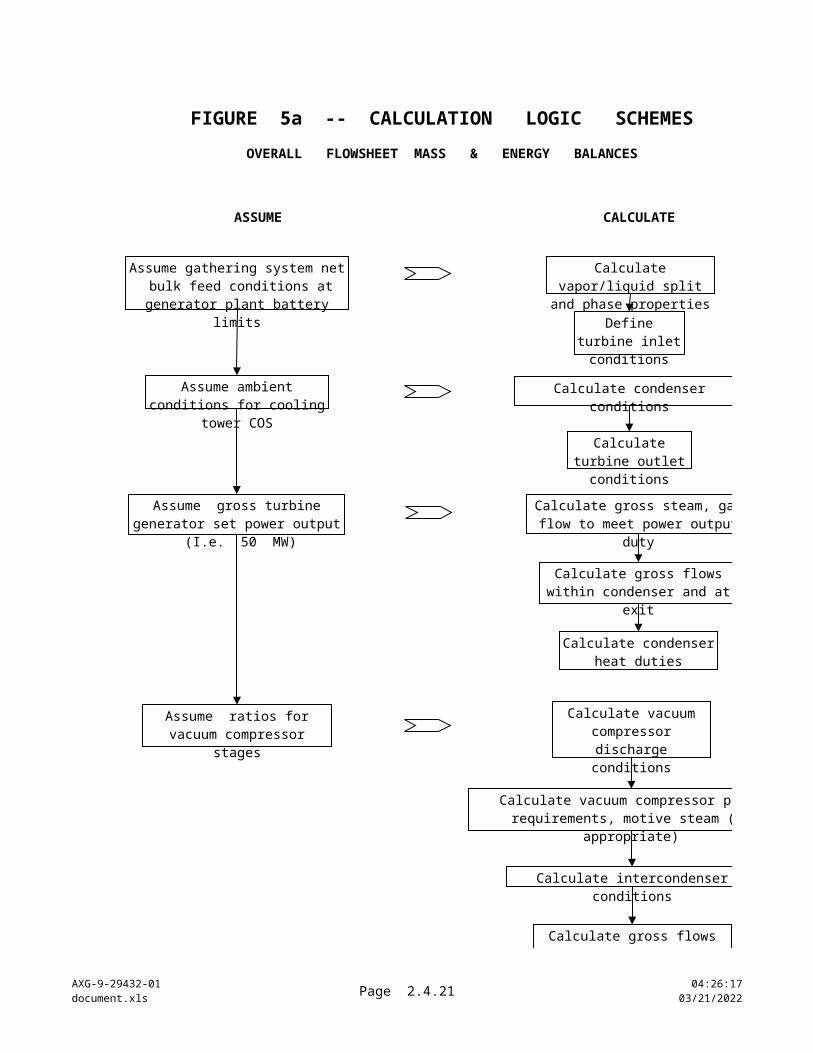
FIGURE 5a -- CALCULATION LOGIC SCHEMES
OVERALL FLOWSHEET MASS & ENERGY BALANCES
ASSUME CALCULATE
Calculate vapor/liquid split and phase
properties
Calculate condenser conditions
Calculate turbine outlet conditions
Calculate gross steam, gas flow to meet power output duty
Calculate gross flows within condenser and at exit
Calculate condenser heat duties
Define turbine inlet conditions
Calculate vacuum compressor discharge
conditions
Calculate vacuum compressor power requirements, motive steam (as appropriate)
Calculate gross flows within intercondenser and at exit
Calculate intercondenser heat duties
Calculate intercondenser conditions
Assume ambient conditions for cooling tower COS
Assume gross turbine generator set power output (I.e. 50 MW)
Assume ratios for vacuum compressor stages
Assume gathering system net bulk feed conditions at generator
plant battery limits
AXG-9-29432-01document.xls Page 2.4.21 10:22:18
04/18/2023
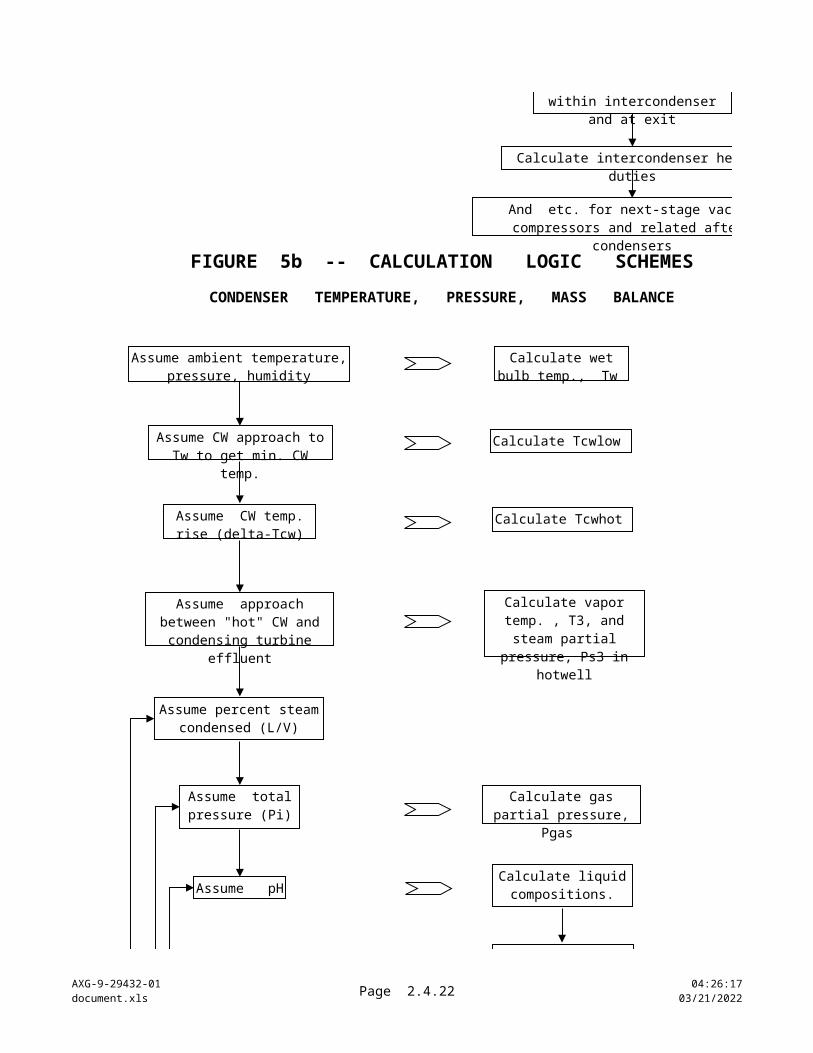
FIGURE 5b -- CALCULATION LOGIC SCHEMES
CONDENSER TEMPERATURE, PRESSURE, MASS BALANCE
ASSUME CALCULATE
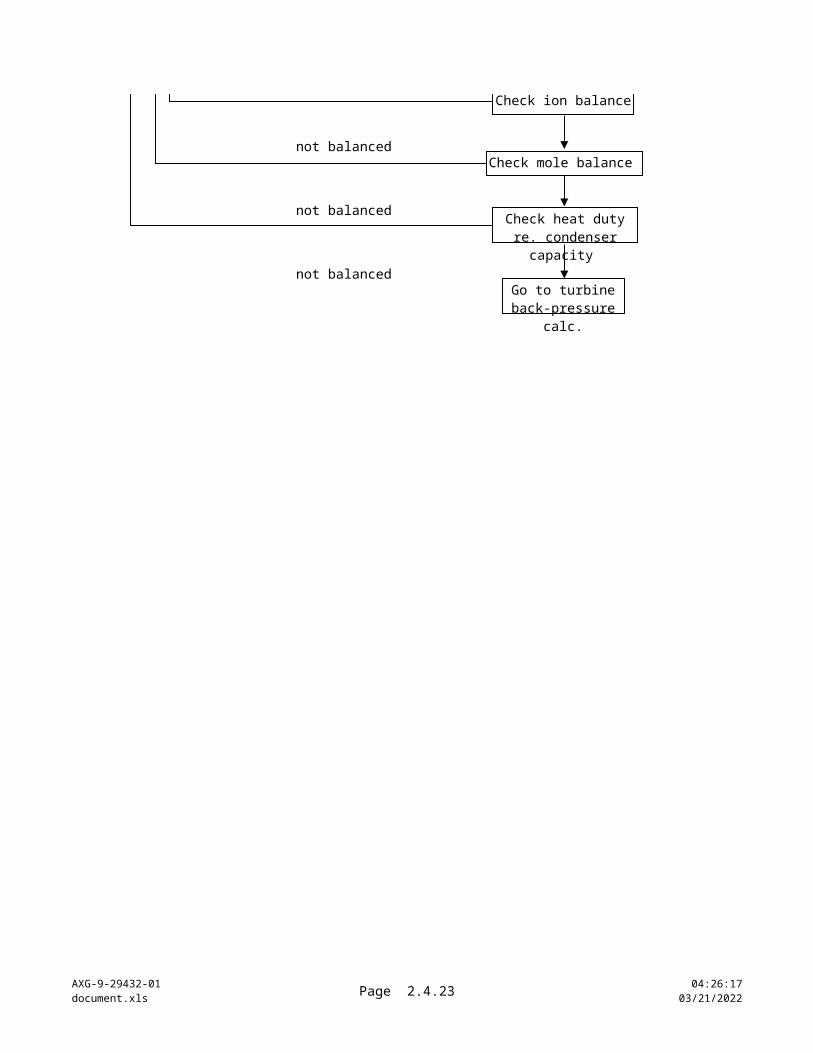
not balancedbalanced
not balanced
Assume ambient temperature, pressure, humidity
Assume CW approach to Tw to get min. CW temp.
Assume CW temp. rise (delta-Tcw)
Assume approach between "hot" CW and condensing
turbine effluent
Assume percent steam condensed (L/V)
Assume total pressure (Pi)
Assume pH
Check heat duty re. condenser capacity
Calculate wet bulb temp., Tw
Calculate Tcwlow
Calculate Tcwhot
Calculate vapor temp. , T3, and steam partial
pressure, Ps3 in hotwell
Calculate gas partial pressure, Pgas
Calculate liquid compositions.
Check mole balance
Check ion balance
Calculate intercondenser heat duties
And etc. for next-stage vacuum compressors and related after-condensers
AXG-9-29432-01document.xls Page 2.4.22 10:22:18
04/18/2023
balanced
not balancedbalancedGo to turbine
back-pressure calc.
Check heat duty re. condenser capacity
AXG-9-29432-01document.xls Page 2.4.23 10:22:18
04/18/2023
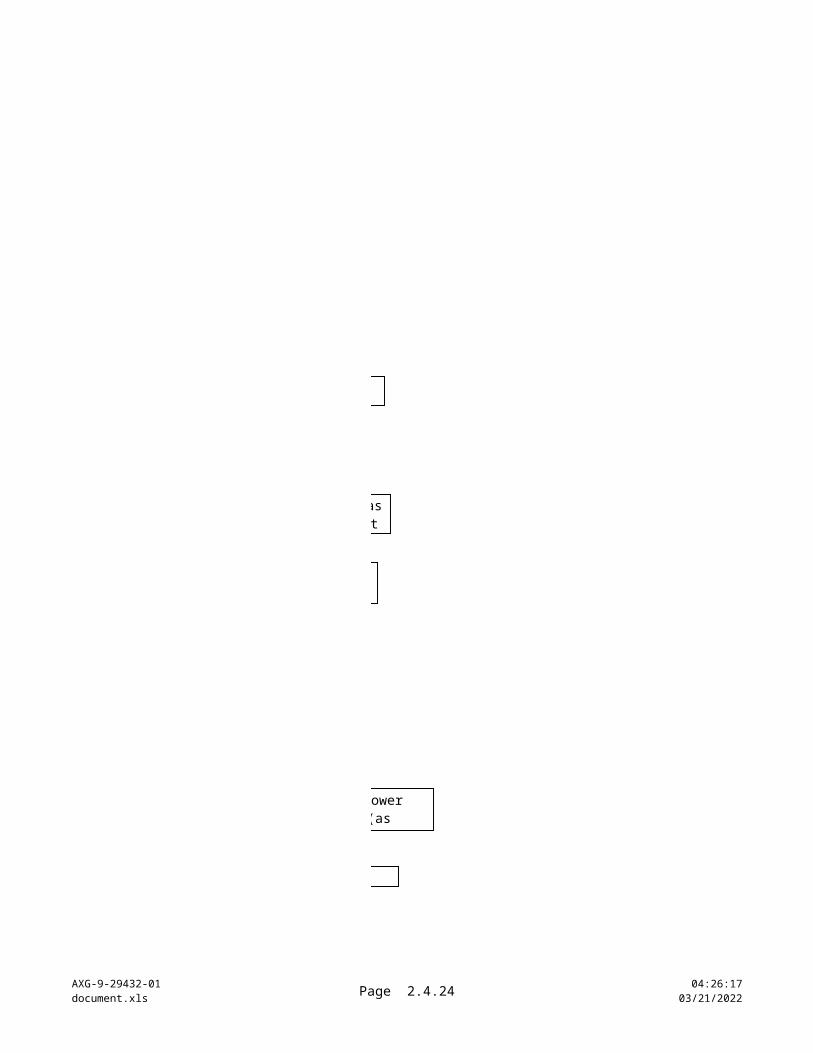
FIGURE 5a -- CALCULATION LOGIC SCHEMES
OVERALL FLOWSHEET MASS & ENERGY BALANCES
Calculate condenser conditions
Calculate gross steam, gas flow to meet power output duty
Calculate gross flows within condenser and at exit
Calculate vacuum compressor power requirements, motive steam (as appropriate)
Calculate intercondenser heat duties
Calculate intercondenser conditions
AXG-9-29432-01document.xls Page 2.4.24 10:22:18
04/18/2023
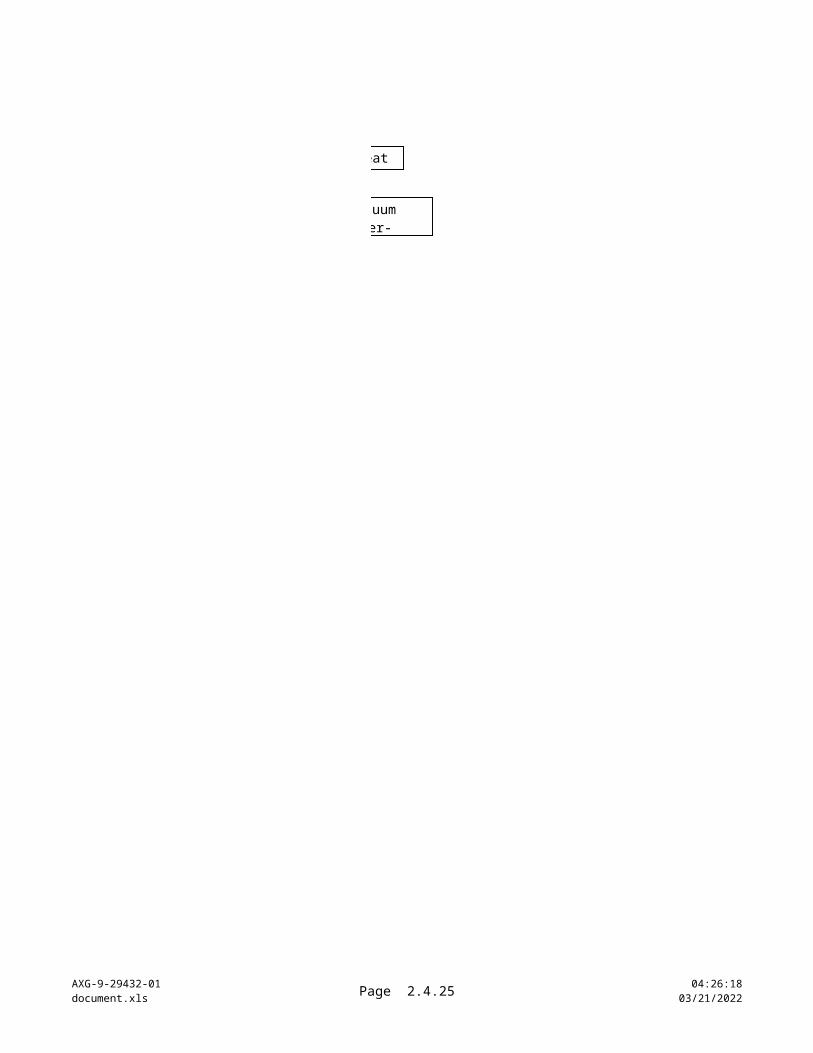
FIGURE 5b -- CALCULATION LOGIC SCHEMES
CONDENSER TEMPERATURE, PRESSURE, MASS BALANCE
Calculate intercondenser heat duties
And etc. for next-stage vacuum compressors and related after-condensers
AXG-9-29432-01document.xls Page 2.4.25 10:22:18
04/18/2023

Sheet 3.1 Main Case Summaries
AXG-9-29432-01document.xls
Page 3.1.26 10:22:1804/18/2023
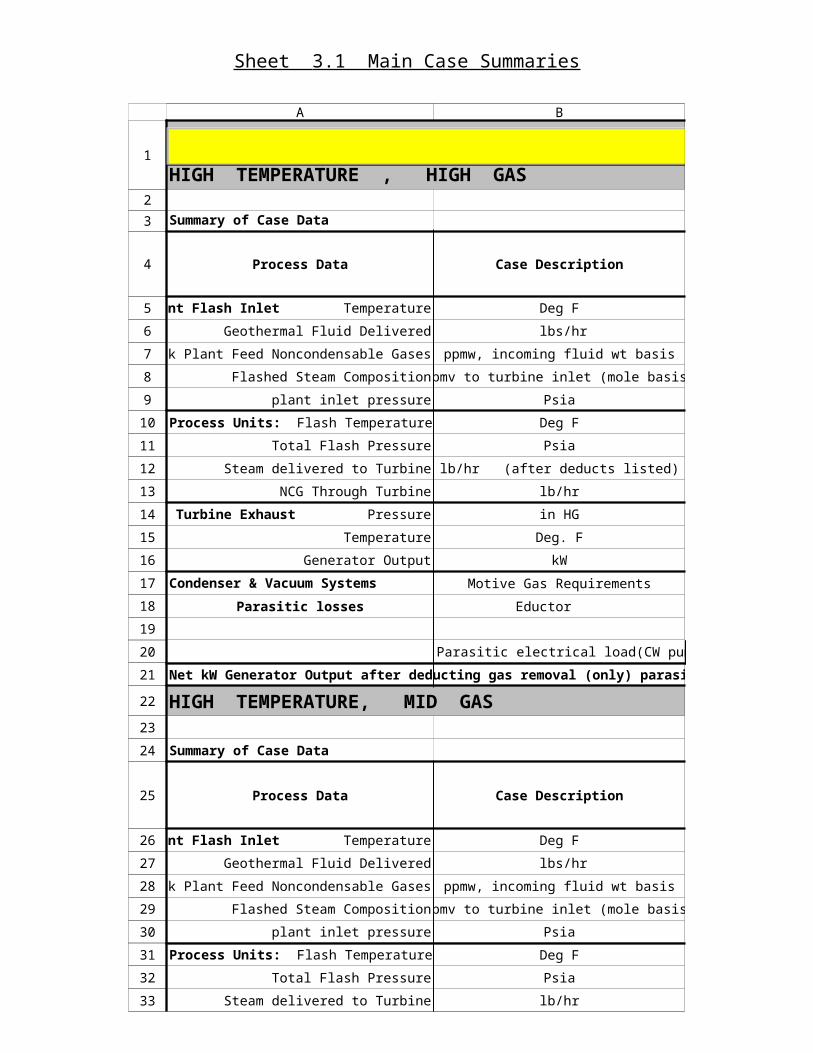
HIGH TEMPERATURE , HIGH GAS
Summary of Case Data
Process Data Case Description
Deg F
Geothermal Fluid Delivered lbs/hr
Bulk Plant Feed Noncondensable Gases ppmw, incoming fluid wt basis
Flashed Steam Composition ppmv to turbine inlet (mole basis)
plant inlet pressure Psia
Deg F
Total Flash Pressure Psia
Steam delivered to Turbine lb/hr (after deducts listed)
NCG Through Turbine lb/hr
in HG
Temperature Deg. F
Generator Output kW
Condenser & Vacuum Systems Motive Gas Requirements
Parasitic losses Eductor
Parasitic electrical load(CW pumps, CT fans, Eductor brine repressure pumps) kW
Net kW Generator Output after deducting gas removal (only) parasitic losses
HIGH TEMPERATURE, MID GAS
Summary of Case Data
Process Data Case Description
Deg F
Geothermal Fluid Delivered lbs/hr
Bulk Plant Feed Noncondensable Gases ppmw, incoming fluid wt basis
Flashed Steam Composition ppmv to turbine inlet (mole basis)
plant inlet pressure Psia
Deg F
Total Flash Pressure Psia
Steam delivered to Turbine lb/hr
NCG Through Turbine lb/hr
in HG
Temperature Deg. F
Plant Flash Inlet Temperature
Process Units: Flash Temperature
Turbine Exhaust Pressure
Plant Flash Inlet Temperature
Process Units: Flash Temperature
Turbine Exhaust Pressure
RETURN
A B
1
2
3
4
5
6
7
8
9
10
11
12
13
14
15
16
17
18
19
20
21
22
23
24
25
26
27
28
29
30
31
32
33
34
35
36
Sheet 3.1 Main Case Summaries
AXG-9-29432-01document.xls
Page 3.1.27 10:22:1804/18/2023
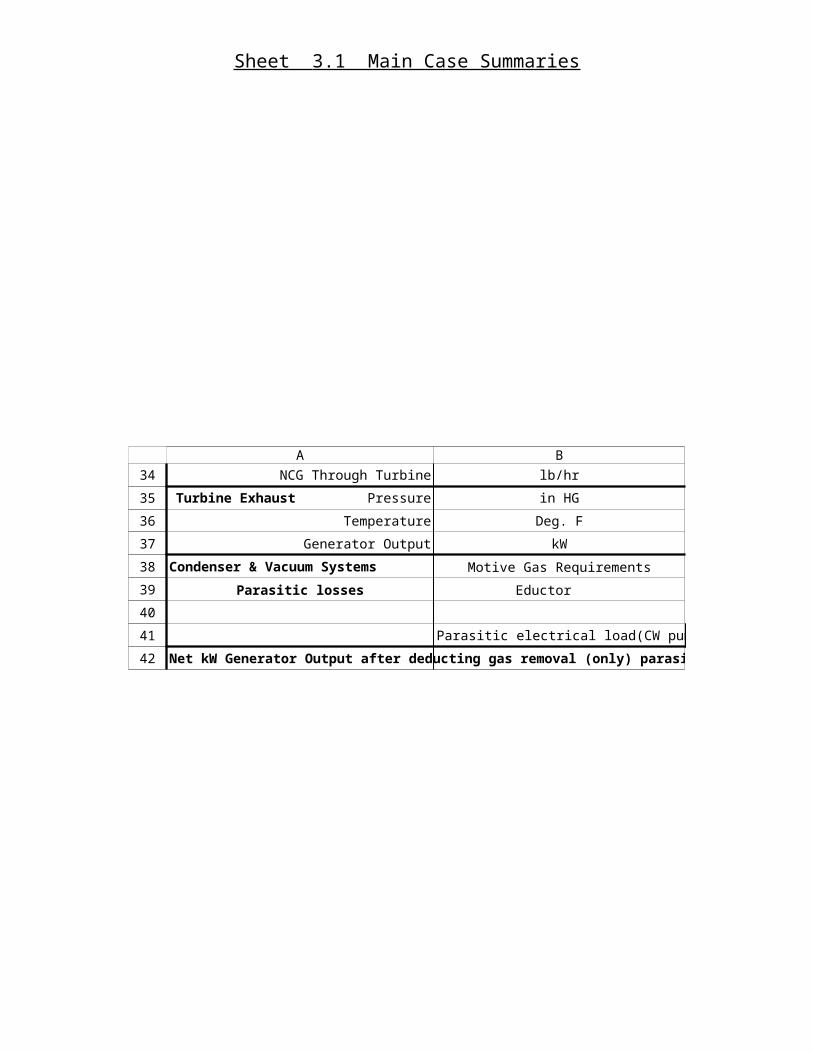
Generator Output kW
Condenser & Vacuum Systems Motive Gas Requirements
Parasitic losses Eductor
Parasitic electrical load(CW pumps, CT fans, Eductor brine repressure pumps) kW
Net kW Generator Output after deducting gas removal (only) parasitic losses
A B
37
38
39
40
41
42
Sheet 3.1 Main Case Summaries
AXG-9-29432-01document.xls
Page 3.1.28 10:22:1804/18/2023
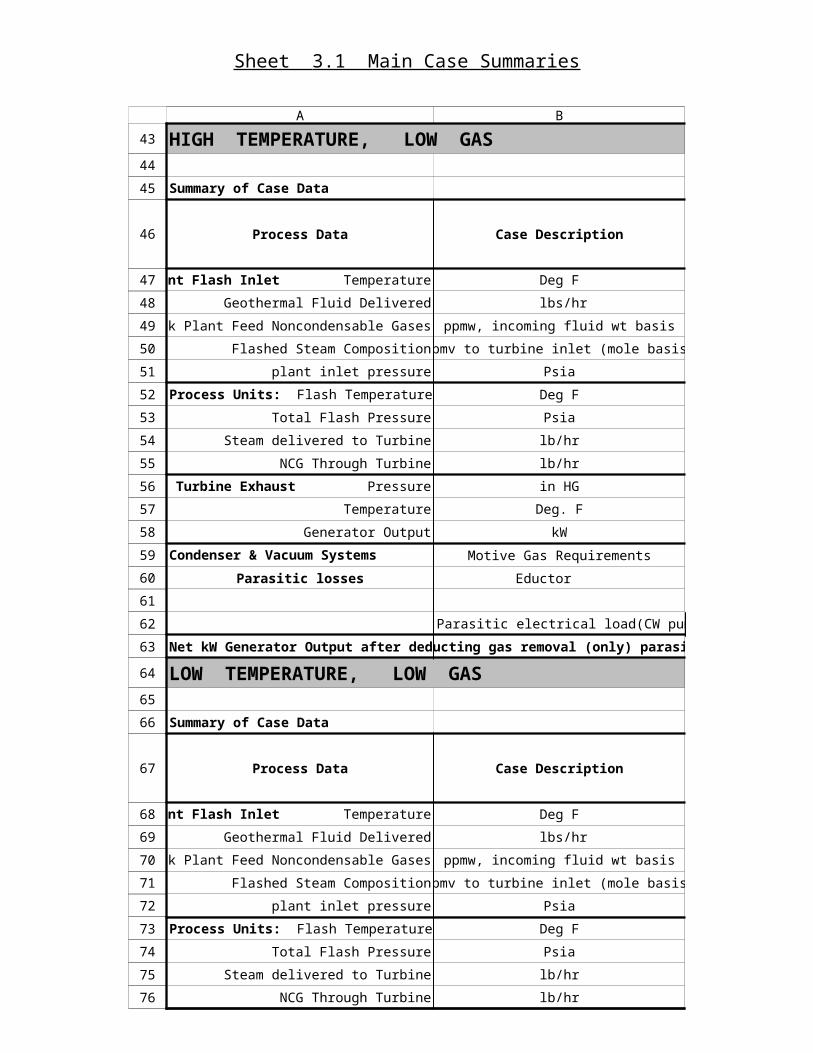
HIGH TEMPERATURE, LOW GAS
Summary of Case Data
Process Data Case Description
Deg F
Geothermal Fluid Delivered lbs/hr
Bulk Plant Feed Noncondensable Gases ppmw, incoming fluid wt basis
Flashed Steam Composition ppmv to turbine inlet (mole basis)
plant inlet pressure Psia
Deg F
Total Flash Pressure Psia
Steam delivered to Turbine lb/hr
NCG Through Turbine lb/hr
in HG
Temperature Deg. F
Generator Output kW
Condenser & Vacuum Systems Motive Gas Requirements
Parasitic losses Eductor
Parasitic electrical load(CW pumps, CT fans, Eductor brine repressure pumps) kW
Net kW Generator Output after deducting gas removal (only) parasitic losses
LOW TEMPERATURE, LOW GAS
Summary of Case Data
Process Data Case Description
Deg F
Geothermal Fluid Delivered lbs/hr
Bulk Plant Feed Noncondensable Gases ppmw, incoming fluid wt basis
Flashed Steam Composition ppmv to turbine inlet (mole basis)
plant inlet pressure Psia
Deg F
Total Flash Pressure Psia
Steam delivered to Turbine lb/hr
NCG Through Turbine lb/hr
in HG
Temperature Deg. F
Generator Output kW
Plant Flash Inlet Temperature
Process Units: Flash Temperature
Turbine Exhaust Pressure
Plant Flash Inlet Temperature
Process Units: Flash Temperature
Turbine Exhaust Pressure
A B
43
44
45
46
47
48
49
50
51
52
53
54
55
56
57
58
59
60
61
62
63
64
65
66
67
68
69
70
71
72
73
74
75
76
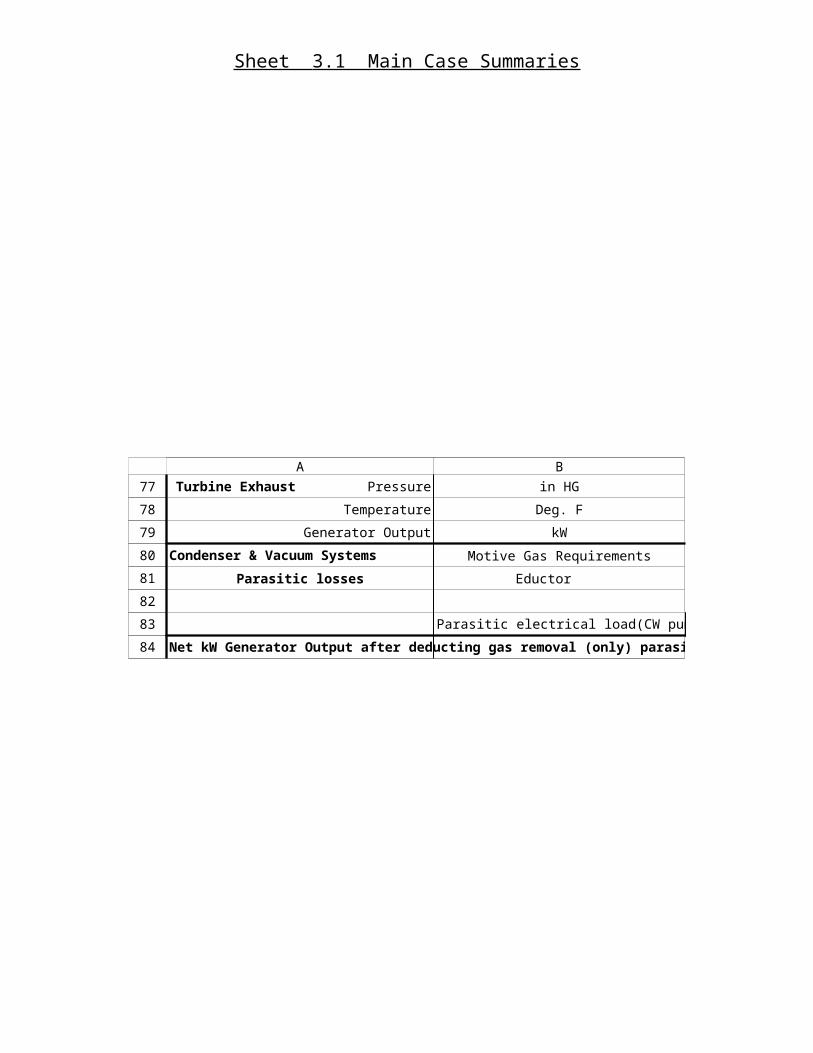
77
78
79
Sheet 3.1 Main Case Summaries
AXG-9-29432-01document.xls
Page 3.1.29 10:22:1804/18/2023
Condenser & Vacuum Systems Motive Gas Requirements
Parasitic losses Eductor
Parasitic electrical load(CW pumps, CT fans, Eductor brine repressure pumps) kW
Net kW Generator Output after deducting gas removal (only) parasitic losses
A B
80
81
82
83
84
Sheet 3.1 Main Case Summaries
AXG-9-29432-01document.xls
Page 3.1.30 10:22:1804/18/2023
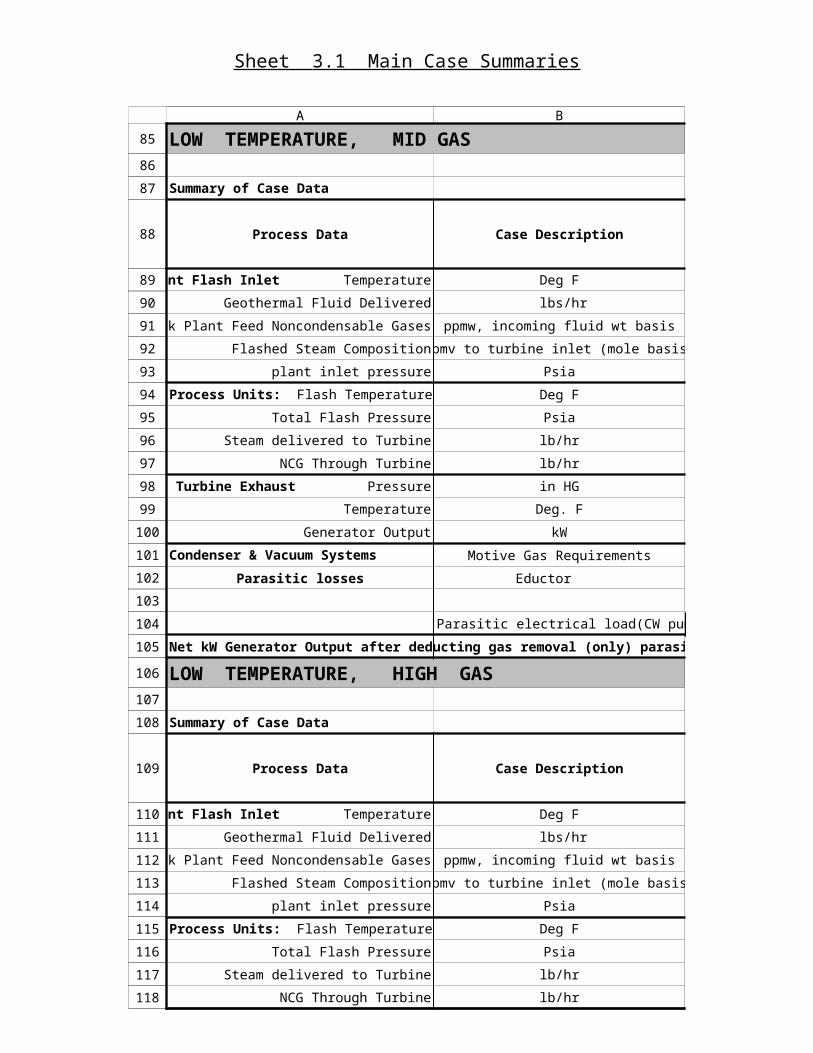
LOW TEMPERATURE, MID GAS
Summary of Case Data
Process Data Case Description
Deg F
Geothermal Fluid Delivered lbs/hr
Bulk Plant Feed Noncondensable Gases ppmw, incoming fluid wt basis
Flashed Steam Composition ppmv to turbine inlet (mole basis)
plant inlet pressure Psia
Deg F
Total Flash Pressure Psia
Steam delivered to Turbine lb/hr
NCG Through Turbine lb/hr
in HG
Temperature Deg. F
Generator Output kW
Condenser & Vacuum Systems Motive Gas Requirements
Parasitic losses Eductor
Parasitic electrical load(CW pumps, CT fans, Eductor brine repressure pumps) kW
Net kW Generator Output after deducting gas removal (only) parasitic losses
LOW TEMPERATURE, HIGH GAS
Summary of Case Data
Process Data Case Description
Deg F
Geothermal Fluid Delivered lbs/hr
Bulk Plant Feed Noncondensable Gases ppmw, incoming fluid wt basis
Flashed Steam Composition ppmv to turbine inlet (mole basis)
plant inlet pressure Psia
Deg F
Total Flash Pressure Psia
Steam delivered to Turbine lb/hr
NCG Through Turbine lb/hr
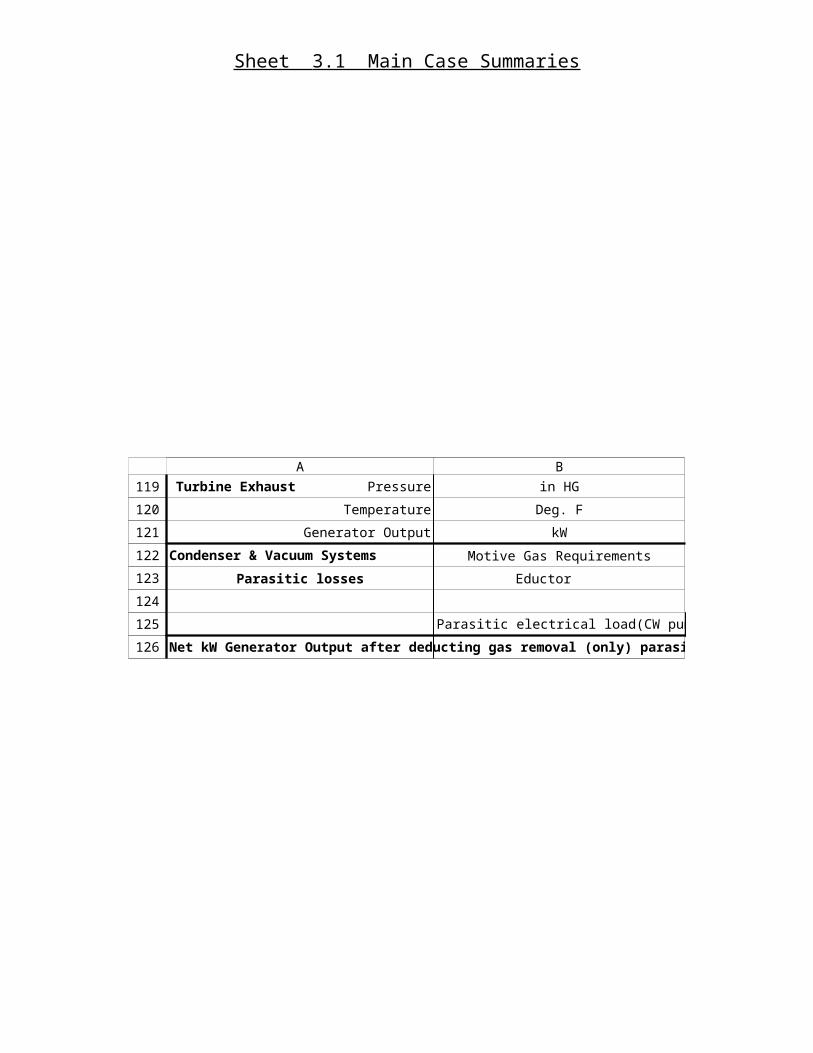
in HG
Temperature Deg. F
Generator Output kW
Plant Flash Inlet Temperature
Process Units: Flash Temperature
Turbine Exhaust Pressure
Plant Flash Inlet Temperature
Process Units: Flash Temperature
Turbine Exhaust Pressure
A B
85
86
87
88
89
90
91
92
93
94
95
96
97
98
99
100
101
102
103
104
105
106
107
108
109
110
111
112
113
114
115
116
117
118
119
120
121
Sheet 3.1 Main Case Summaries
AXG-9-29432-01document.xls
Page 3.1.31 10:22:1804/18/2023
Condenser & Vacuum Systems Motive Gas Requirements
Parasitic losses Eductor
Parasitic electrical load(CW pumps, CT fans, Eductor brine repressure pumps) kW
Net kW Generator Output after deducting gas removal (only) parasitic losses
A B
122
123
124
125
126
Sheet 3.1 Main Case Summaries
AXG-9-29432-01document.xls
Page 3.1.32 10:22:1804/18/2023
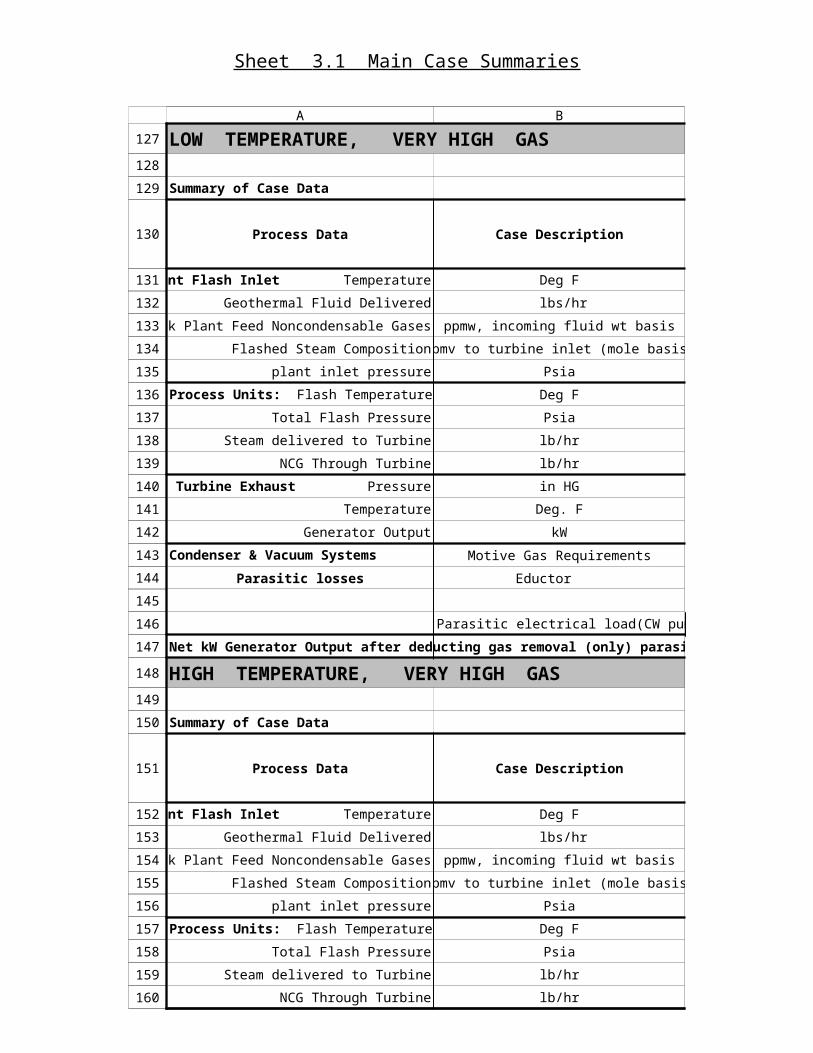
LOW TEMPERATURE, VERY HIGH GAS
Summary of Case Data
Process Data Case Description
Deg F
Geothermal Fluid Delivered lbs/hr
Bulk Plant Feed Noncondensable Gases ppmw, incoming fluid wt basis
Flashed Steam Composition ppmv to turbine inlet (mole basis)
plant inlet pressure Psia
Deg F
Total Flash Pressure Psia
Steam delivered to Turbine lb/hr
NCG Through Turbine lb/hr
in HG
Temperature Deg. F
Generator Output kW
Condenser & Vacuum Systems Motive Gas Requirements
Parasitic losses Eductor
Parasitic electrical load(CW pumps, CT fans, Eductor brine repressure pumps) kW
Net kW Generator Output after deducting gas removal (only) parasitic losses
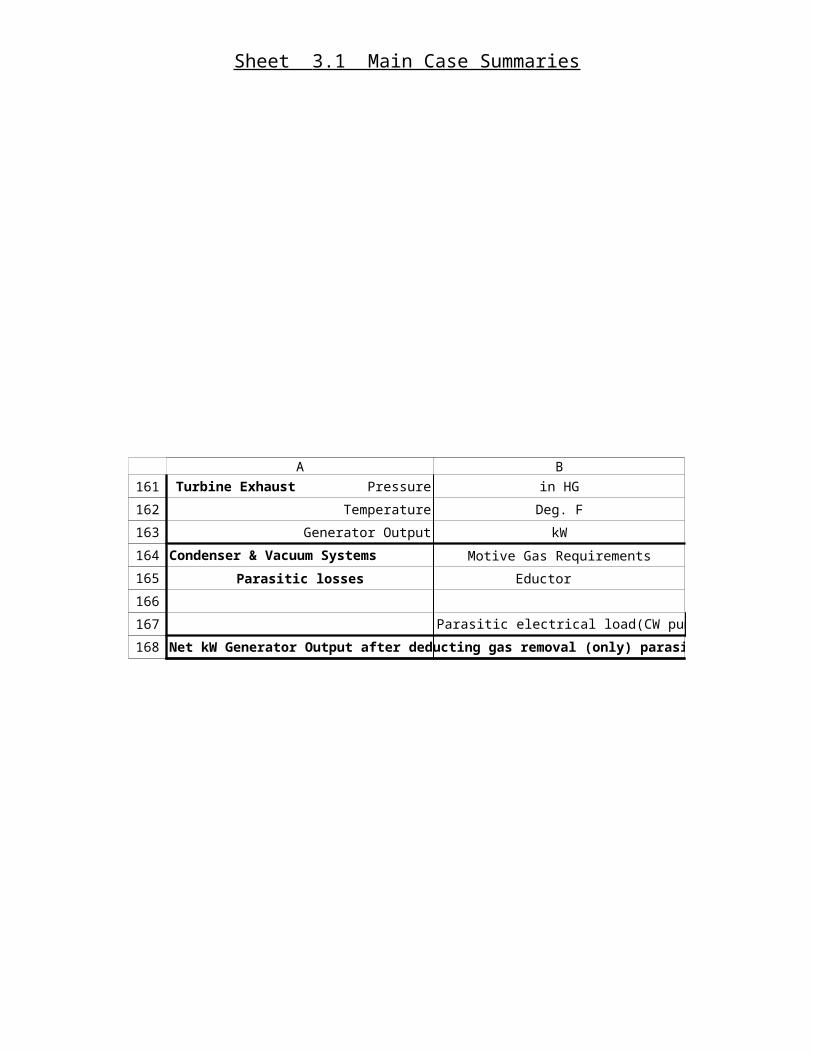
HIGH TEMPERATURE, VERY HIGH GAS
Summary of Case Data
Process Data Case Description
Deg F
Geothermal Fluid Delivered lbs/hr
Bulk Plant Feed Noncondensable Gases ppmw, incoming fluid wt basis
Flashed Steam Composition ppmv to turbine inlet (mole basis)
plant inlet pressure Psia
Deg F
Total Flash Pressure Psia
Steam delivered to Turbine lb/hr
NCG Through Turbine lb/hr
in HG
Temperature Deg. F
Generator Output kW
Plant Flash Inlet Temperature
Process Units: Flash Temperature
Turbine Exhaust Pressure
Plant Flash Inlet Temperature
Process Units: Flash Temperature
Turbine Exhaust Pressure
A B
127
128
129
130
131
132
133
134
135
136
137
138
139
140
141
142
143
144
145
146
147
148
149
150
151
152
153
154
155
156
157
158
159
160
161
162
163
Sheet 3.1 Main Case Summaries
AXG-9-29432-01document.xls
Page 3.1.33 10:22:1804/18/2023
Condenser & Vacuum Systems Motive Gas Requirements
Parasitic losses Eductor
Parasitic electrical load(CW pumps, CT fans, Eductor brine repressure pumps) kW
Net kW Generator Output after deducting gas removal (only) parasitic losses
A B
164
165
166
167
168
Sheet 3.1 Main Case Summaries
AXG-9-29432-01document.xls
Page 3.1.34 10:22:1804/18/2023
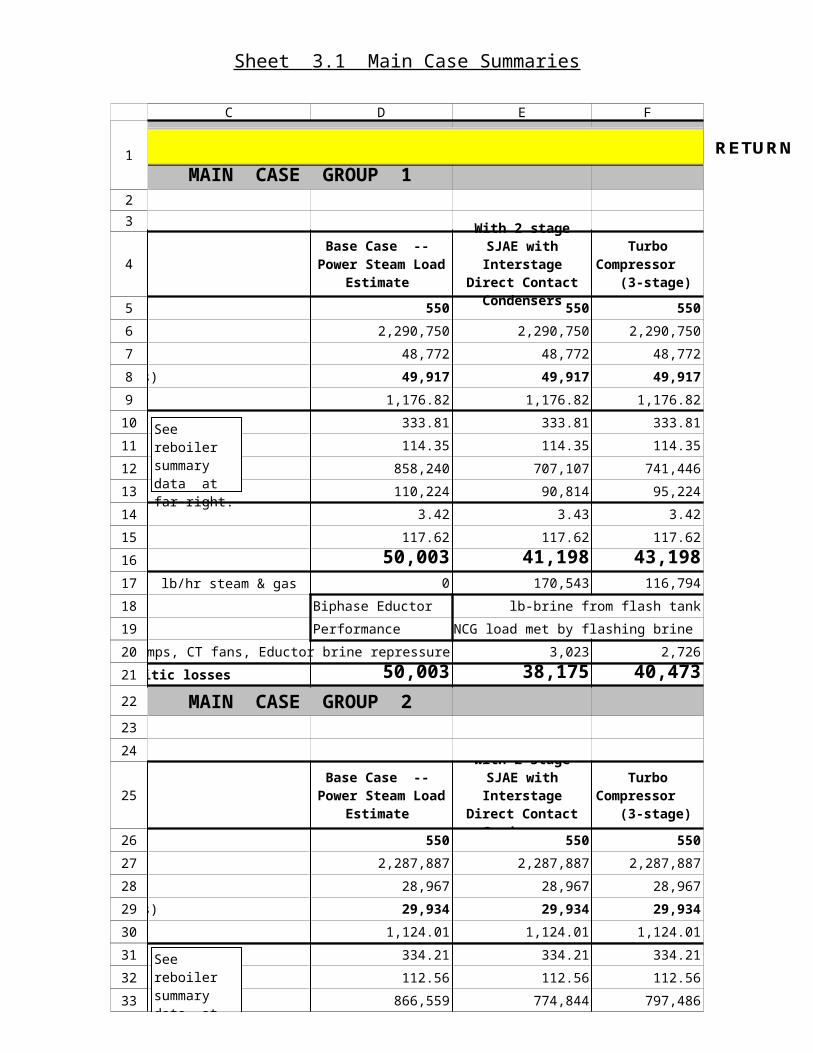
MAIN CASE GROUP 1HIGH TEMPERATURE, HIGH GAS, 60 DEG WET BULB
550 550 550
2,290,750 2,290,750 2,290,750
48,772 48,772 48,772
49,917 49,917 49,917
1,176.82 1,176.82 1,176.82
333.81 333.81 333.81
114.35 114.35 114.35
858,240 707,107 741,446
110,224 90,814 95,224
3.42 3.43 3.42
117.62 117.62 117.62
50,003 41,198 43,198lb/hr steam & gas 0 170,543 116,794
Biphase Eductor lb-brine from flash tank
Performance NCG load met by flashing brine
Parasitic electrical load(CW pumps, CT fans, Eductor brine repressure pumps) kW 3,023 2,726
Net kW Generator Output after deducting gas removal (only) parasitic losses 50,003 38,175 40,473
MAIN CASE GROUP 2HIGH TEMPERATURE, MID GAS, 60 DEG WET BULB
550 550 550
2,287,887 2,287,887 2,287,887
28,967 28,967 28,967
29,934 29,934 29,934
1,124.01 1,124.01 1,124.01
334.21 334.21 334.21
112.56 112.56 112.56
866,559 774,844 797,486
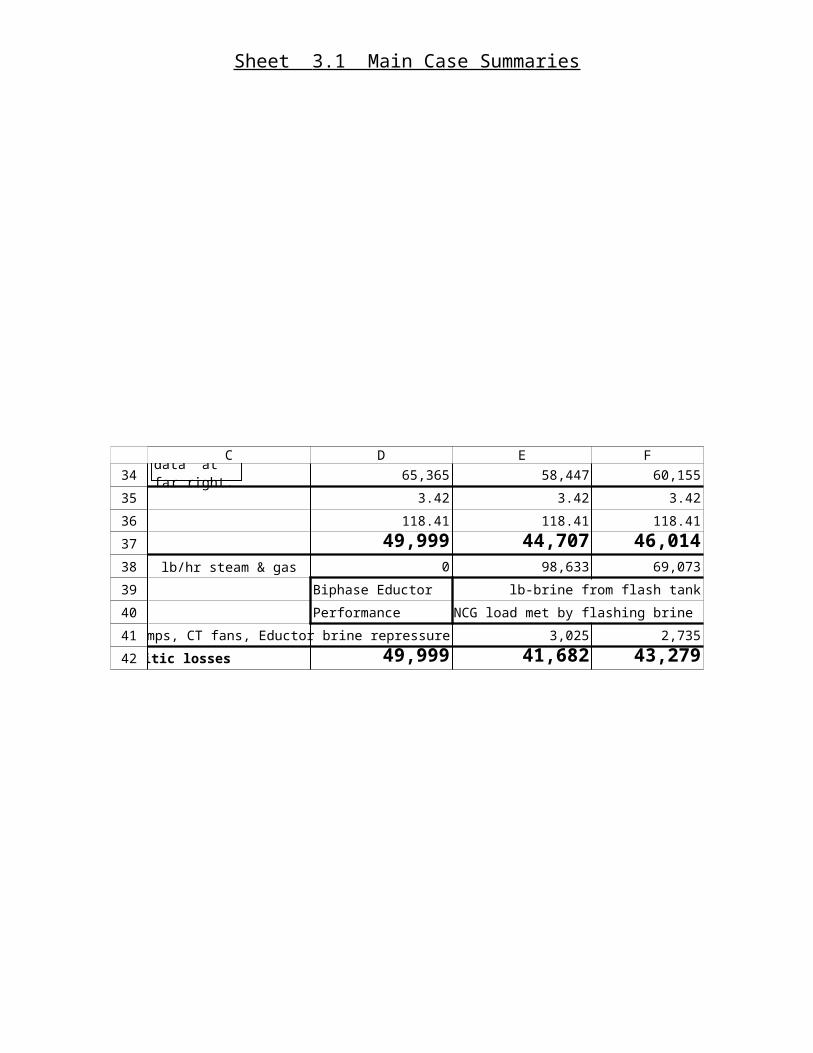
65,365 58,447 60,155
3.42 3.42 3.42
118.41 118.41 118.41
Base Case -- Power Steam Load
Estimate
With 2 stage SJAE with Interstage Direct Contact Condensers
Turbo Compressor
(3-stage)
Base Case -- Power Steam Load
Estimate
With 2 stage SJAE with Interstage Direct Contact Condensers
Turbo Compressor
(3-stage)
See reboiler summary data at far right.
See reboiler summary data at far right.
RETURN
C D E F
1
2
3
4
5
6
7
8
9
10
11
12
13
14
15
16
17
18
19
20
21
22
23
24
25
26
27
28
29
30
31
32
33
34
35
36
Sheet 3.1 Main Case Summaries
AXG-9-29432-01document.xls
Page 3.1.35 10:22:1804/18/2023
49,999 44,707 46,014lb/hr steam & gas 0 98,633 69,073
Biphase Eductor lb-brine from flash tank
Performance NCG load met by flashing brine
Parasitic electrical load(CW pumps, CT fans, Eductor brine repressure pumps) kW 3,025 2,735
Net kW Generator Output after deducting gas removal (only) parasitic losses 49,999 41,682 43,279
C D E F
37
38
39
40
41
42
Sheet 3.1 Main Case Summaries
AXG-9-29432-01document.xls
Page 3.1.36 10:22:1804/18/2023
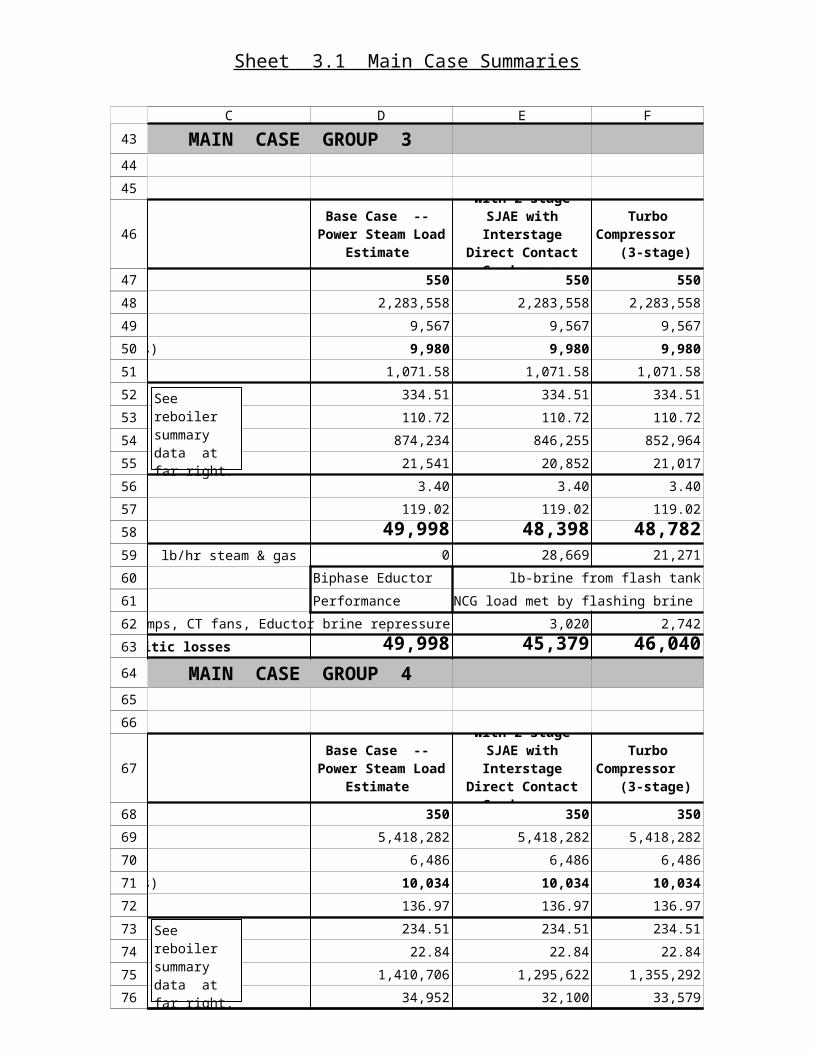
MAIN CASE GROUP 3HIGH TEMPERATURE, LOW GAS, 60 DEG WET BULB
550 550 550
2,283,558 2,283,558 2,283,558
9,567 9,567 9,567
9,980 9,980 9,980
1,071.58 1,071.58 1,071.58
334.51 334.51 334.51
110.72 110.72 110.72
874,234 846,255 852,964
21,541 20,852 21,017
3.40 3.40 3.40
119.02 119.02 119.02
49,998 48,398 48,782lb/hr steam & gas 0 28,669 21,271
Biphase Eductor lb-brine from flash tank
Performance NCG load met by flashing brine
Parasitic electrical load(CW pumps, CT fans, Eductor brine repressure pumps) kW 3,020 2,742
Net kW Generator Output after deducting gas removal (only) parasitic losses 49,998 45,379 46,040
MAIN CASE GROUP 4LOW TEMPERATURE, LOW GAS, 60 DEG WET BULB
350 350 350
5,418,282 5,418,282 5,418,282
6,486 6,486 6,486
10,034 10,034 10,034
136.97 136.97 136.97
234.51 234.51 234.51
22.84 22.84 22.84
1,410,706 1,295,622 1,355,292
34,952 32,100 33,579
3.40 3.40 3.40
119.02 119.02 119.02
50,000 45,921 48,036
Base Case -- Power Steam Load
Estimate
With 2 stage SJAE with Interstage Direct Contact Condensers
Turbo Compressor
(3-stage)
Base Case -- Power Steam Load
Estimate
With 2 stage SJAE with Interstage Direct Contact Condensers
Turbo Compressor
(3-stage)
See reboiler summary data at far right.
See reboiler summary data at far right.
C D E F
43
44
45
46
47
48
49
50
51
52
53
54
55
56
57
58
59
60
61
62
63
64
65
66
67
68
69
70
71
72
73
74
75
76
77
78
79
Sheet 3.1 Main Case Summaries
AXG-9-29432-01document.xls
Page 3.1.37 10:22:1804/18/2023
lb/hr steam & gas 0 117,936 55,415
Biphase Eductor lb-brine from flash tank
Performance NCG load met by flashing brine
Parasitic electrical load(CW pumps, CT fans, Eductor brine repressure pumps) kW 5,319 4,790
Net kW Generator Output after deducting gas removal (only) parasitic losses 50,000 40,602 43,246
C D E F
80
81
82
83
84

Sheet 3.1 Main Case Summaries
AXG-9-29432-01document.xls
Page 3.1.38 10:22:1804/18/2023
MAIN CASE GROUP 5
350 350 350
5,395,099 5,395,099 5,395,099
19,748 19,748 19,748
30,065 30,065 30,065
141.59 141.59 141.59
234.23 234.23 234.23
23.19 23.19 23.19
1,398,657 1,036,288 1,218,217
105,976 78,519 92,304
3.42 3.42 3.42
118.46 118.46 118.46
49,998 37,045 43,548lb/hr steam & gas 0 389,825 180,440
Biphase Eductor lb-brine from flash tank
Performance NCG load met by flashing brine
Parasitic electrical load(CW pumps, CT fans, Eductor brine repressure pumps) kW 5,344 4,779
Net kW Generator Output after deducting gas removal (only) parasitic losses 49,998 31,700 38,770
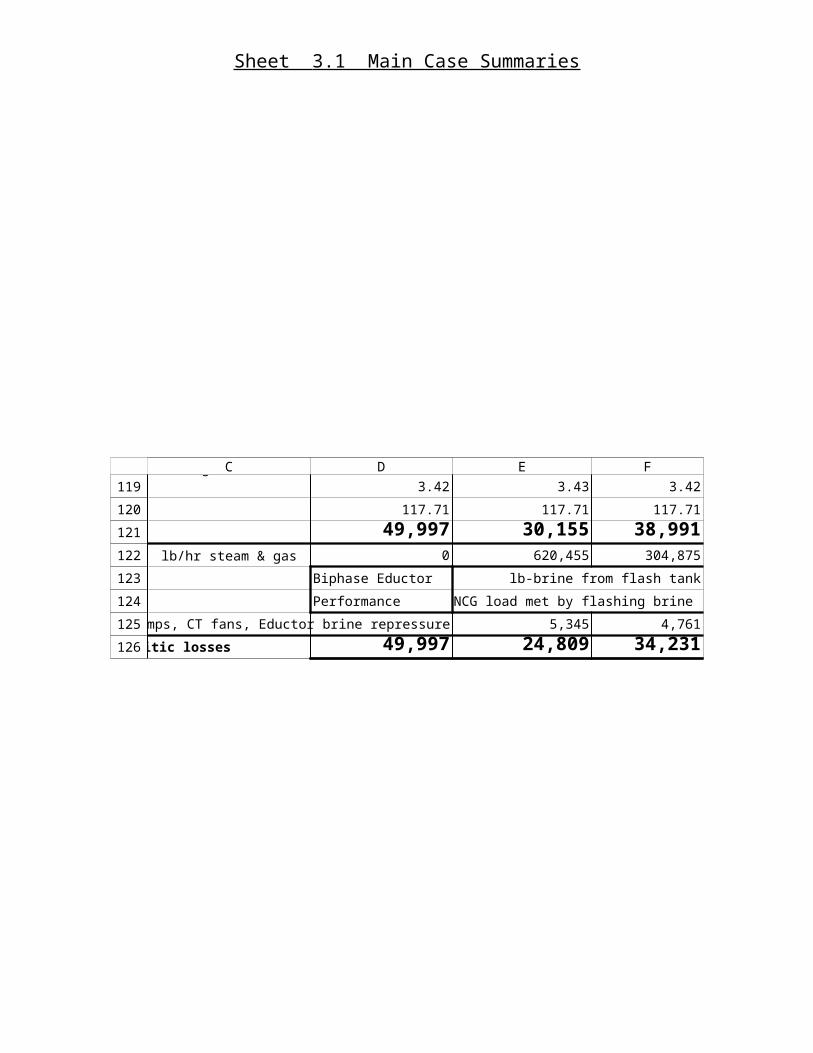
MAIN CASE GROUP 6LOW TEMPERATURE, HIGH GAS, 60 DEG WET BULB
350 350 350
5,364,701 5,364,701 5,364,701
33,425 33,425 33,425
50,053 50,053 50,053146.16 146.16 146.16
233.85 233.85 233.85
23.52 23.52 23.52
1,384,975 835,315 1,080,100
178,383 107,587 139,115
3.42 3.43 3.42
117.71 117.71 117.71
49,997 30,155 38,991
Base Case -- Power Steam Load
Estimate
With 2 stage SJAE with Interstage Direct Contact Condensers
Turbo Compressor
(3-stage)
Base Case -- Power Steam Load
Estimate
With 2 stage SJAE with Interstage Direct Contact Condensers
Turbo Compressor
(3-stage)
See reboiler summary data at far right.
See reboiler summary data at far right.
C D E F
85
86
87
88
89
90
91
92
93
94
95
96
97
98
99
100
101
102
103
104
105
106
107
108
109
110
111
112
113
114
115
116
117
118
119
120
121

Sheet 3.1 Main Case Summaries
AXG-9-29432-01document.xls
Page 3.1.39 10:22:1804/18/2023
lb/hr steam & gas 0 620,455 304,875
Biphase Eductor lb-brine from flash tank
Performance NCG load met by flashing brine
Parasitic electrical load(CW pumps, CT fans, Eductor brine repressure pumps) kW 5,345 4,761
Net kW Generator Output after deducting gas removal (only) parasitic losses 49,997 24,809 34,231
C D E F
122
123
124
125
126
Sheet 3.1 Main Case Summaries
AXG-9-29432-01document.xls
Page 3.1.40 10:22:1804/18/2023
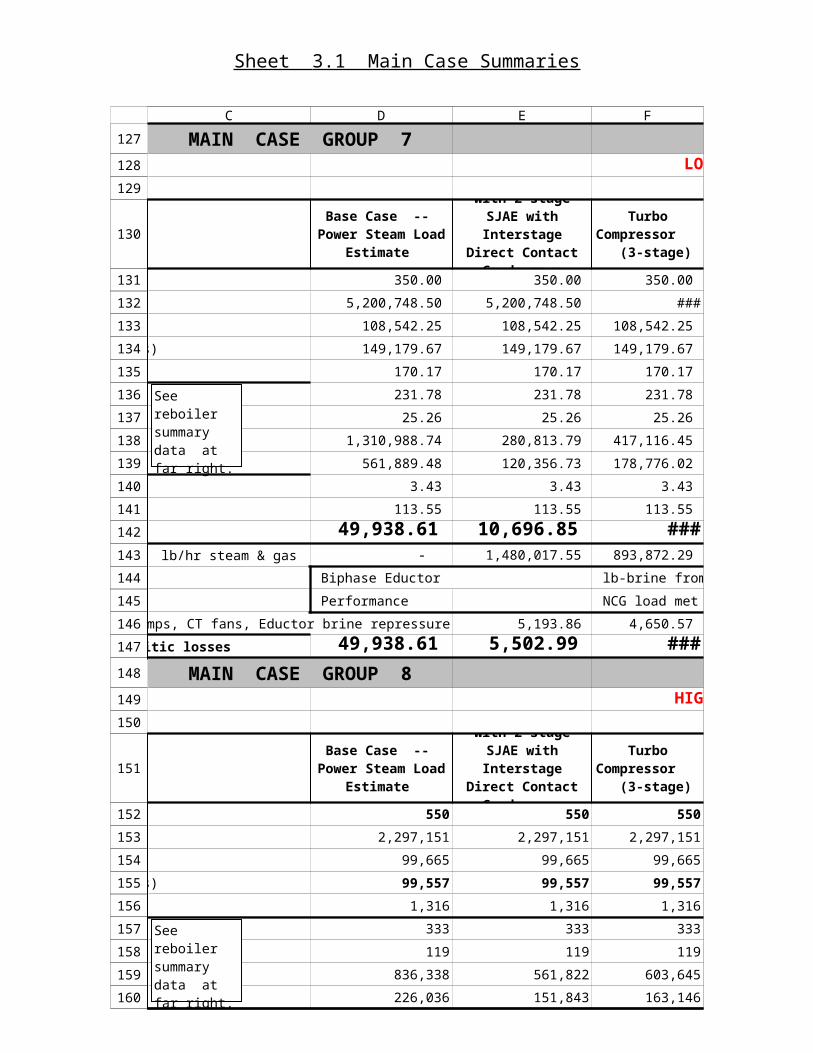
MAIN CASE GROUP 7LOW TEMPERATURE, VERY HIGH GAS, 60 DEG WET BULB
350.00 350.00 350.00
5,200,748.50 5,200,748.50 5,200,748.50
108,542.25 108,542.25 108,542.25
149,179.67 149,179.67 149,179.67
170.17 170.17 170.17
231.78 231.78 231.78
25.26 25.26 25.26
1,310,988.74 280,813.79 417,116.45
561,889.48 120,356.73 178,776.02
3.43 3.43 3.43
113.55 113.55 113.55
49,938.61 10,696.85 15,888.94 lb/hr steam & gas - 1,480,017.55 893,872.29
Biphase Eductor lb-brine from fla
Performance NCG load met by
Parasitic electrical load(CW pumps, CT fans, Eductor brine repressure pumps) kW 5,193.86 4,650.57
Net kW Generator Output after deducting gas removal (only) parasitic losses 49,938.61 5,502.99 11,238.36
MAIN CASE GROUP 8HIGH TEMPERATURE, VERY HIGH GAS, 60 DEG WET BULB
550 550 550
2,297,151 2,297,151 2,297,151
99,665 99,665 99,665
99,557 99,557 99,557
1,316 1,316 1,316
333 333 333
119 119 119
836,338 561,822 603,645
226,036 151,843 163,146
3.43 3.43 3.43
115 115 115
49,993 33,583 36,083
Base Case -- Power Steam Load
Estimate
With 2 stage SJAE with Interstage Direct Contact Condensers
Turbo Compressor
(3-stage)
Base Case -- Power Steam Load
Estimate
With 2 stage SJAE with Interstage Direct Contact Condensers
Turbo Compressor
(3-stage)
See reboiler summary data at far right.
See reboiler summary data at far right.
C D E F
127
128
129
130
131
132
133
134
135
136
137
138
139
140
141
142
143
144
145
146
147
148
149
150
151
152
153
154
155
156
157
158
159
160
161
162
163
Sheet 3.1 Main Case Summaries
AXG-9-29432-01document.xls
Page 3.1.41 10:22:1804/18/2023
lb/hr steam & gas 0 348,709 232,693
Biphase Eductor lb-brine from flash tank
Performance NCG load met by flashing brine
Parasitic electrical load(CW pumps, CT fans, Eductor brine repressure pumps) kW 3,001 2,699
Net kW Generator Output after deducting gas removal (only) parasitic losses 49,993 30,583 33,385
C D E F
164
165
166
167
168

Sheet 3.1 Main Case Summaries
AXG-9-29432-01document.xls
Page 3.1.42 10:22:1804/18/2023
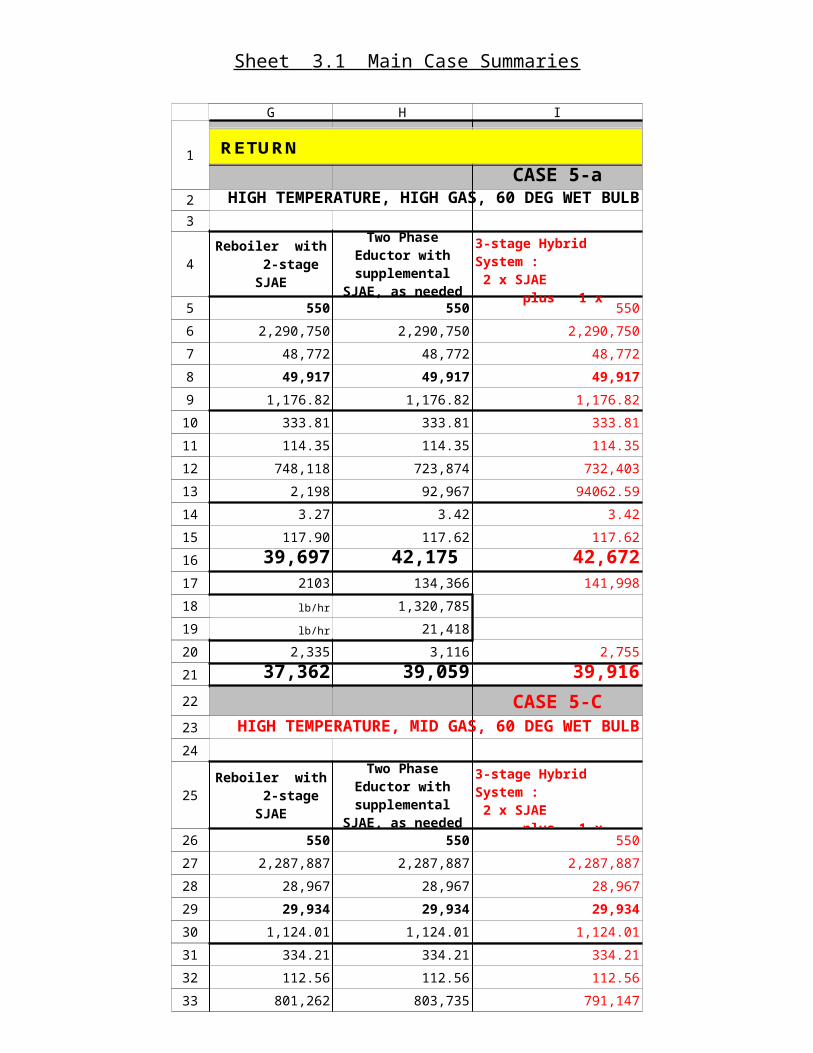
CASE 5-aHIGH TEMPERATURE, HIGH GAS, 60 DEG WET BULB
550 550 550
2,290,750 2,290,750 2,290,750
48,772 48,772 48,772
49,917 49,917 49,917
1,176.82 1,176.82 1,176.82
333.81 333.81 333.81
114.35 114.35 114.35
748,118 723,874 732,403
2,198 92,967 94062.59
3.27 3.42 3.42
117.90 117.62 117.62
39,697 42,175 42,6722103 134,366 141,998
lb/hr 1,320,785
lb/hr 21,418
2,335 3,116 2,755
37,362 39,059 39,916
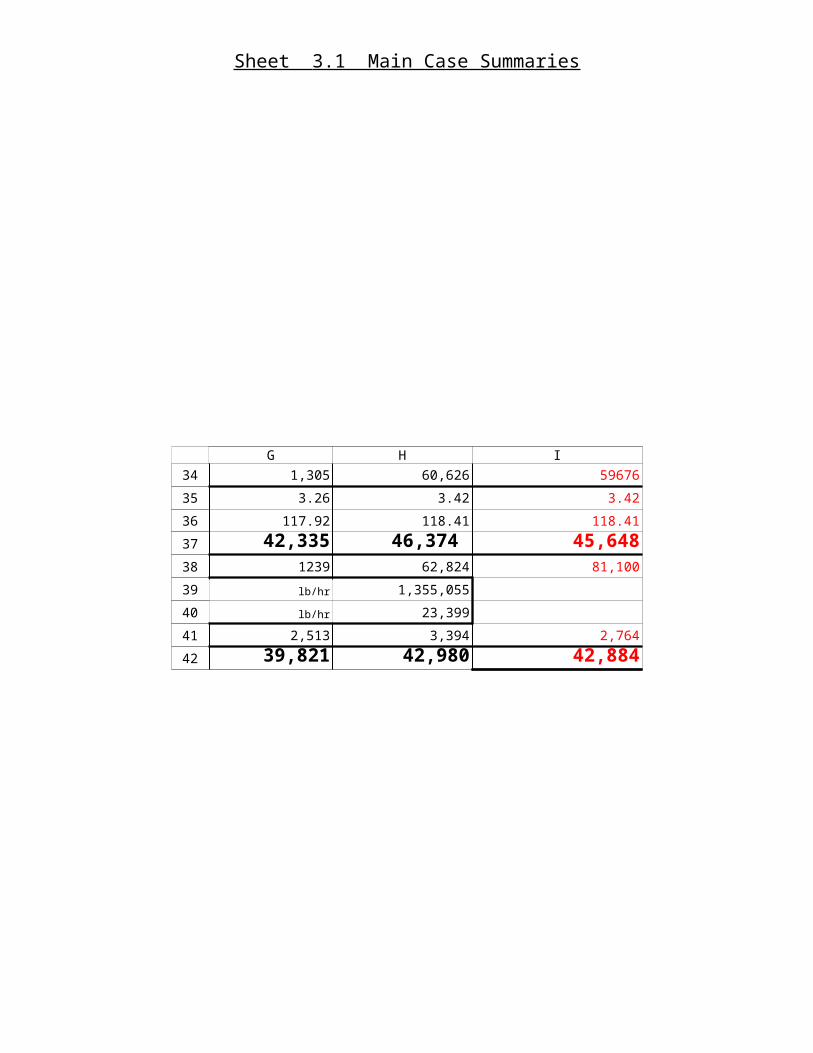
CASE 5-CHIGH TEMPERATURE, MID GAS, 60 DEG WET BULB
550 550 550
2,287,887 2,287,887 2,287,887
28,967 28,967 28,967
29,934 29,934 29,934
1,124.01 1,124.01 1,124.01
334.21 334.21 334.21
112.56 112.56 112.56
801,262 803,735 791,147
1,305 60,626 59676
3.26 3.42 3.42
117.92 118.41 118.41
Reboiler with 2-stage SJAE
Two Phase Eductor with supplemental SJAE, as needed
3-stage Hybrid System : 2 x SJAE plus 1 x turbocomp.
Reboiler with 2-stage SJAE
Two Phase Eductor with supplemental SJAE, as needed
3-stage Hybrid System : 2 x SJAE plus 1 x turbocomp.
RETURN
G H I
1
2
3
4
5
6
7
8
9
10
11
12
13
14
15
16
17
18
19
20
21
22
23
24
25
26
27
28
29
30
31
32
33
34
35
36
Sheet 3.1 Main Case Summaries
AXG-9-29432-01document.xls
Page 3.1.43 10:22:1804/18/2023
42,335 46,374 45,6481239 62,824 81,100
lb/hr 1,355,055
lb/hr 23,399
2,513 3,394 2,764
39,821 42,980 42,884
G H I
37
38
39
40
41
42
Sheet 3.1 Main Case Summaries
AXG-9-29432-01document.xls
Page 3.1.44 10:22:1804/18/2023
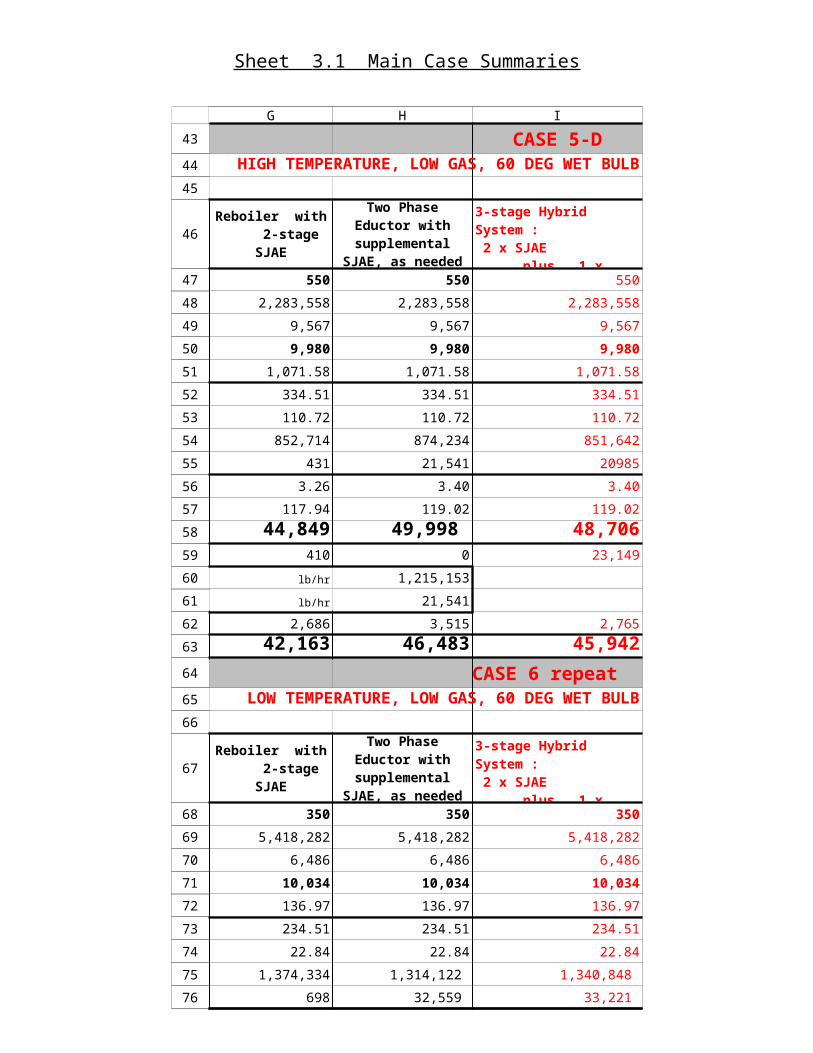
CASE 5-DHIGH TEMPERATURE, LOW GAS, 60 DEG WET BULB
550 550 550
2,283,558 2,283,558 2,283,558
9,567 9,567 9,567
9,980 9,980 9,980
1,071.58 1,071.58 1,071.58
334.51 334.51 334.51
110.72 110.72 110.72
852,714 874,234 851,642
431 21,541 20985
3.26 3.40 3.40
117.94 119.02 119.02
44,849 49,998 48,706410 0 23,149
lb/hr 1,215,153
lb/hr 21,541
2,686 3,515 2,765
42,163 46,483 45,942
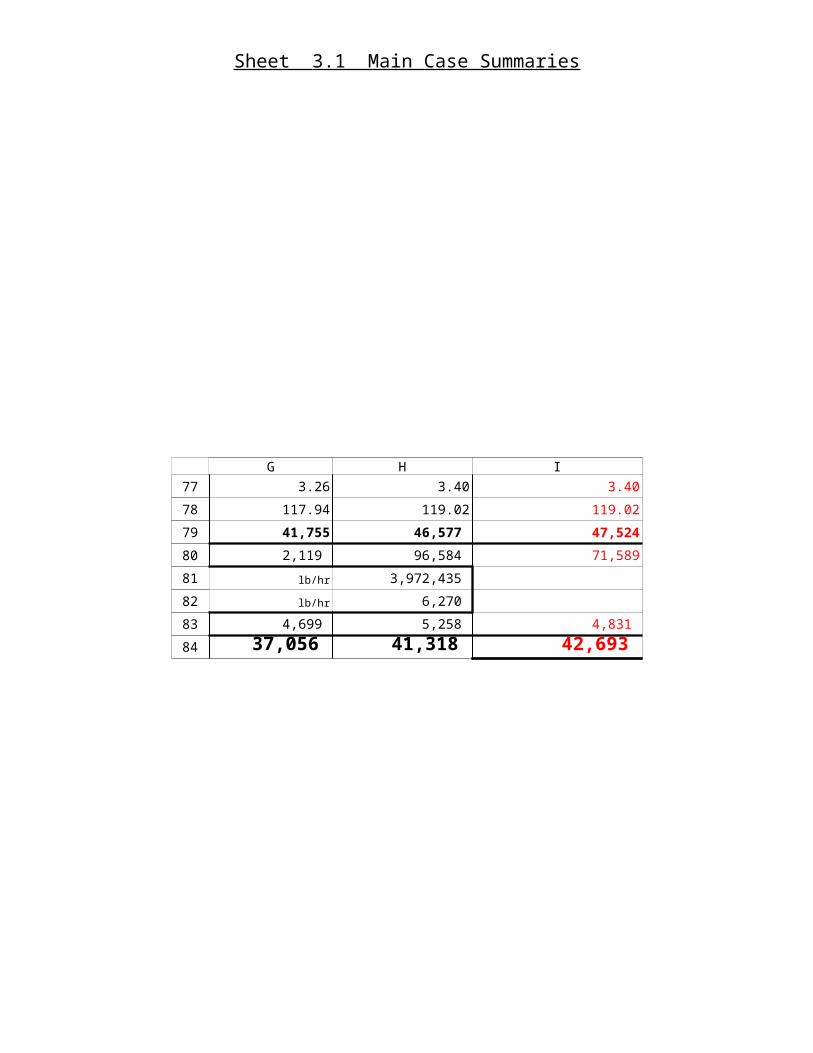
CASE 6 repeat LOW TEMPERATURE, LOW GAS, 60 DEG WET BULB
350 350 350
5,418,282 5,418,282 5,418,282
6,486 6,486 6,486
10,034 10,034 10,034
136.97 136.97 136.97
234.51 234.51 234.51
22.84 22.84 22.84
1,374,334 1,314,122 1,340,848
698 32,559 33,221
3.26 3.40 3.40
117.94 119.02 119.02
41,755 46,577 47,524
Reboiler with 2-stage SJAE
Two Phase Eductor with supplemental SJAE, as needed
3-stage Hybrid System : 2 x SJAE plus 1 x turbocomp.
Reboiler with 2-stage SJAE
Two Phase Eductor with supplemental SJAE, as needed
3-stage Hybrid System : 2 x SJAE plus 1 x turbocomp.
G H I
43
44
45
46
47
48
49
50
51
52
53
54
55
56
57
58
59
60
61
62
63
64
65
66
67
68
69
70
71
72
73
74
75
76
77
78
79
Sheet 3.1 Main Case Summaries
AXG-9-29432-01document.xls
Page 3.1.45 10:22:1804/18/2023
2,119 96,584 71,589
lb/hr 3,972,435
lb/hr 6,270
4,699 5,258 4,831
37,056 41,318 42,693
G H I
80
81
82
83
84
Sheet 3.1 Main Case Summaries
AXG-9-29432-01document.xls
Page 3.1.46 10:22:1804/18/2023
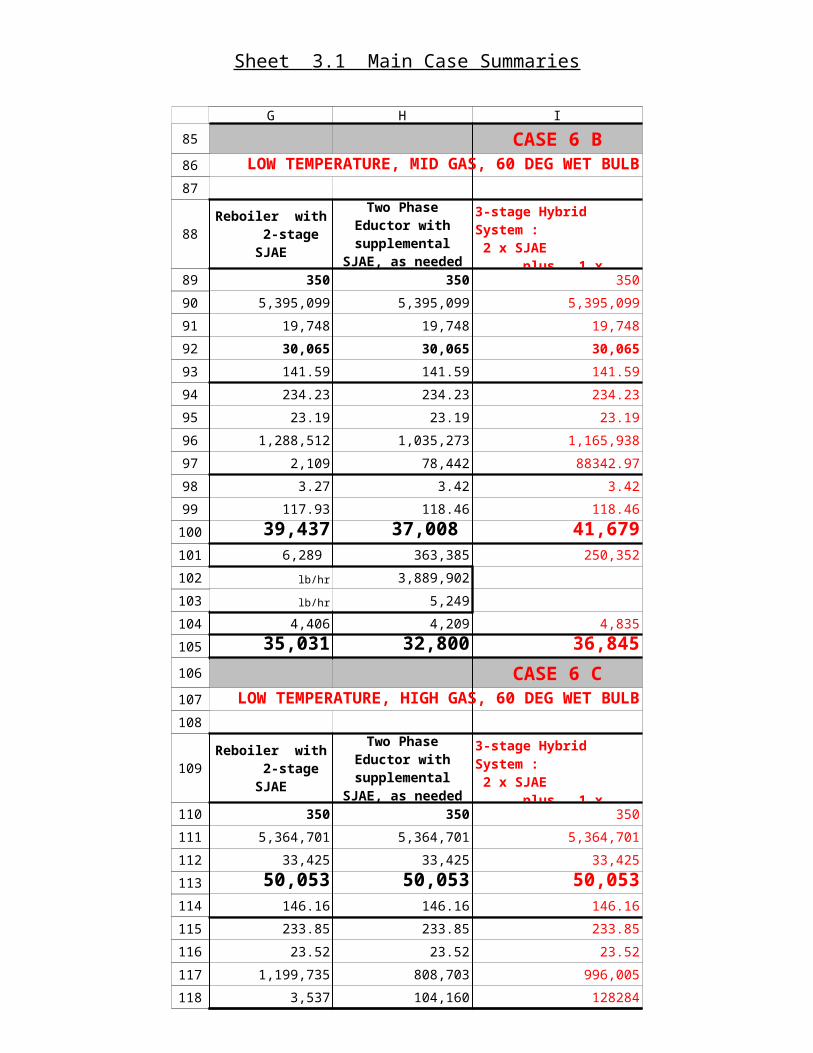
CASE 6 BLOW TEMPERATURE, MID GAS, 60 DEG WET BULB
350 350 350
5,395,099 5,395,099 5,395,099
19,748 19,748 19,748
30,065 30,065 30,065
141.59 141.59 141.59
234.23 234.23 234.23
23.19 23.19 23.19
1,288,512 1,035,273 1,165,938
2,109 78,442 88342.97
3.27 3.42 3.42
117.93 118.46 118.46
39,437 37,008 41,679 6,289 363,385 250,352
lb/hr 3,889,902
lb/hr 5,249
4,406 4,209 4,835
35,031 32,800 36,845
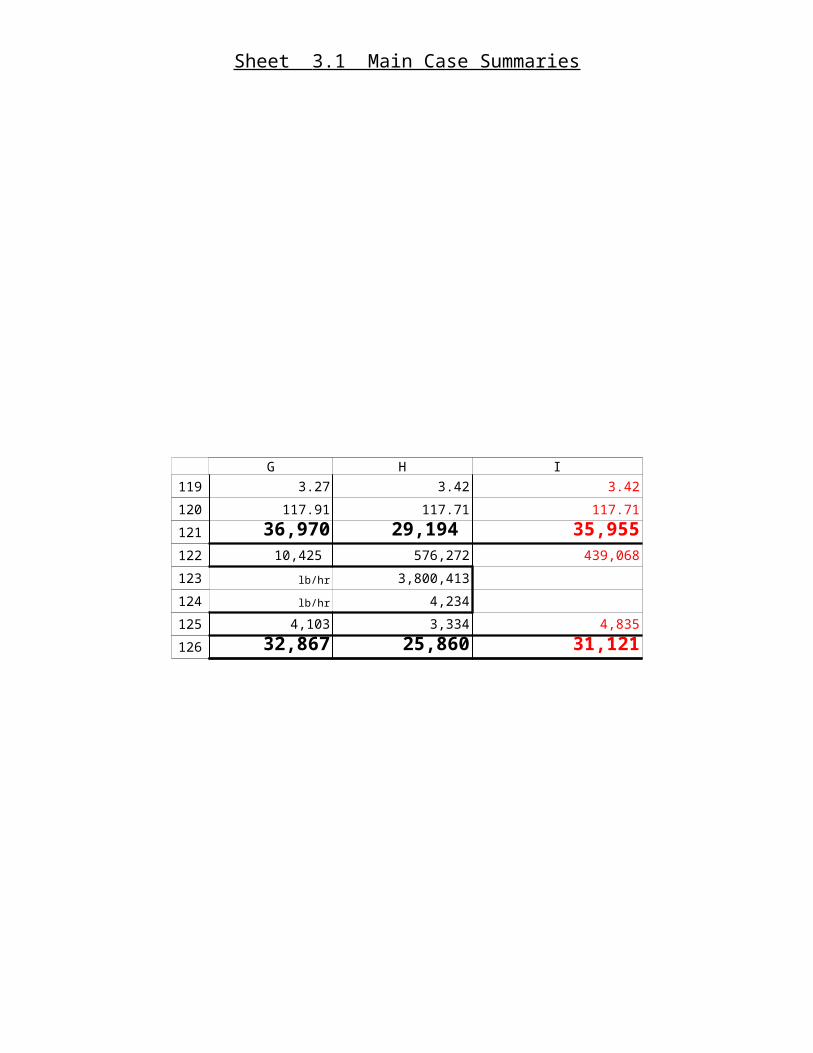
CASE 6 CLOW TEMPERATURE, HIGH GAS, 60 DEG WET BULB
350 350 350
5,364,701 5,364,701 5,364,701
33,425 33,425 33,425
50,053 50,053 50,053146.16 146.16 146.16
233.85 233.85 233.85
23.52 23.52 23.52
1,199,735 808,703 996,005
3,537 104,160 128284
3.27 3.42 3.42
117.91 117.71 117.71
36,970 29,194 35,955
Reboiler with 2-stage SJAE
Two Phase Eductor with supplemental SJAE, as needed
3-stage Hybrid System : 2 x SJAE plus 1 x turbocomp.
Reboiler with 2-stage SJAE
Two Phase Eductor with supplemental SJAE, as needed
3-stage Hybrid System : 2 x SJAE plus 1 x turbocomp.
G H I
85
86
87
88
89
90
91
92
93
94
95
96
97
98
99
100
101
102
103
104
105
106
107
108
109
110
111
112
113
114
115
116
117
118
119
120
121
Sheet 3.1 Main Case Summaries
AXG-9-29432-01document.xls
Page 3.1.47 10:22:1804/18/2023
10,425 576,272 439,068
lb/hr 3,800,413
lb/hr 4,234
4,103 3,334 4,835
32,867 25,860 31,121
G H I
122
123
124
125
126
Sheet 3.1 Main Case Summaries
AXG-9-29432-01document.xls
Page 3.1.48 10:22:1804/18/2023
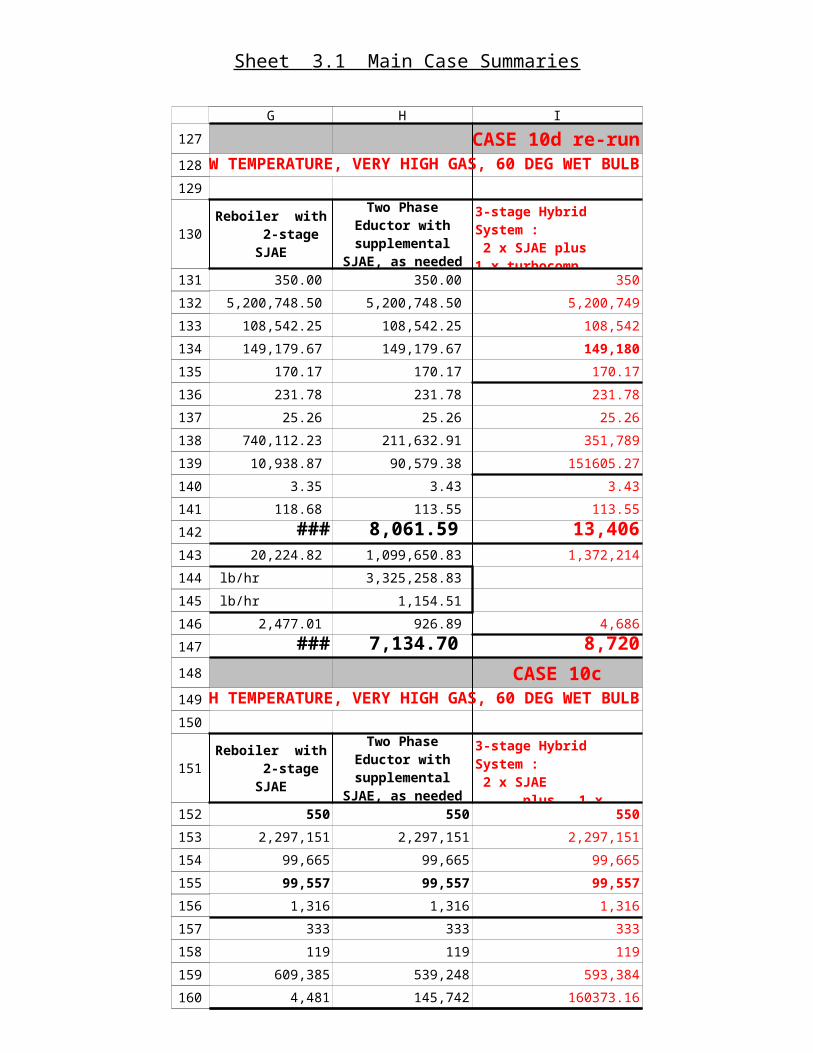
CASE 10d re-runLOW TEMPERATURE, VERY HIGH GAS, 60 DEG WET BULB
350.00 350.00 350
5,200,748.50 5,200,748.50 5,200,749
108,542.25 108,542.25 108,542
149,179.67 149,179.67 149,180
170.17 170.17 170.17
231.78 231.78 231.78
25.26 25.26 25.26
740,112.23 211,632.91 351,789
10,938.87 90,579.38 151605.27
3.35 3.43 3.43
118.68 113.55 113.55
23,395.22 8,061.59 13,406 20,224.82 1,099,650.83 1,372,214
lb/hr 3,325,258.83
lb/hr 1,154.51
2,477.01 926.89 4,686
20,918.21 7,134.70 8,720
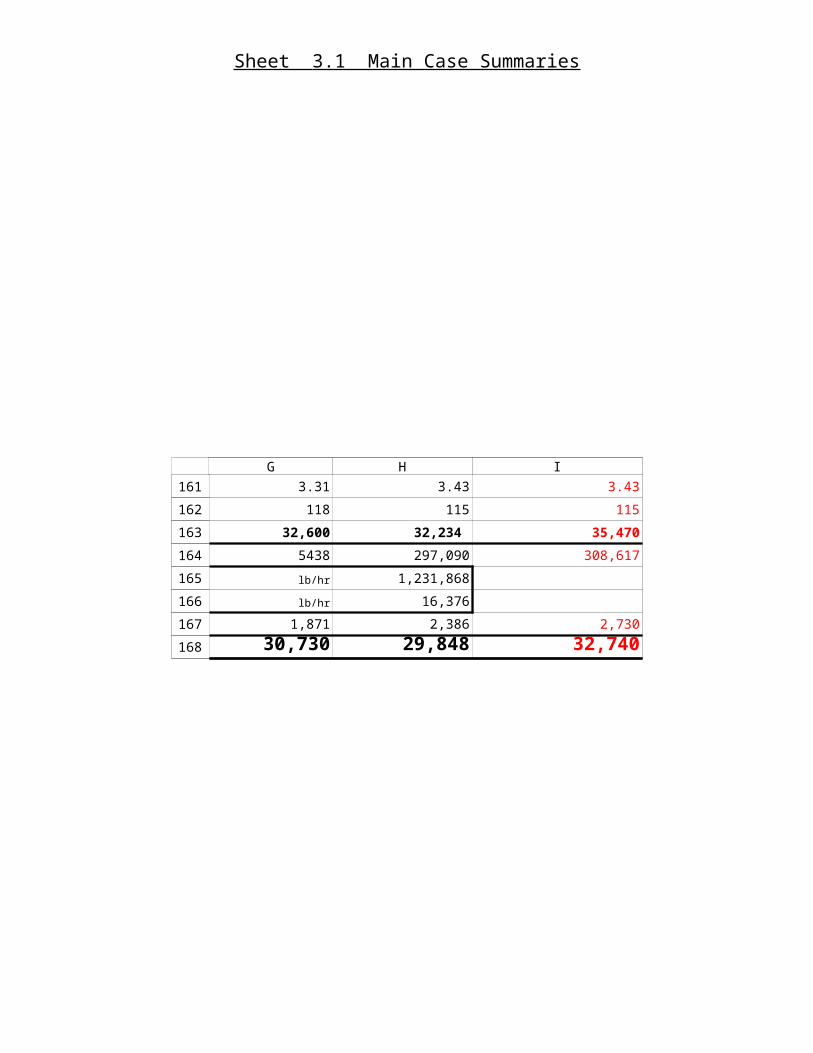
CASE 10cHIGH TEMPERATURE, VERY HIGH GAS, 60 DEG WET BULB
550 550 550
2,297,151 2,297,151 2,297,151
99,665 99,665 99,665
99,557 99,557 99,557
1,316 1,316 1,316
333 333 333
119 119 119
609,385 539,248 593,384
4,481 145,742 160373.16
3.31 3.43 3.43
118 115 115
32,600 32,234 35,470
Reboiler with 2-stage SJAE
Two Phase Eductor with supplemental SJAE, as needed
3-stage Hybrid System : 2 x SJAE plus 1 x turbocomp. REPLACEMENT MARCH 30
Reboiler with 2-stage SJAE
Two Phase Eductor with supplemental SJAE, as needed
3-stage Hybrid System : 2 x SJAE plus 1 x turbocomp.
G H I
127
128
129
130
131
132
133
134
135
136
137
138
139
140
141
142
143
144
145
146
147
148
149
150
151
152
153
154
155
156
157
158
159
160
161
162
163
Sheet 3.1 Main Case Summaries
AXG-9-29432-01document.xls
Page 3.1.49 10:22:1804/18/2023
5438 297,090 308,617
lb/hr 1,231,868
lb/hr 16,376
1,871 2,386 2,730
30,730 29,848 32,740
G H I
164
165
166
167
168
Sheet 3.1 Main Case Summaries
AXG-9-29432-01document.xls
Page 3.1.50 10:22:1804/18/2023
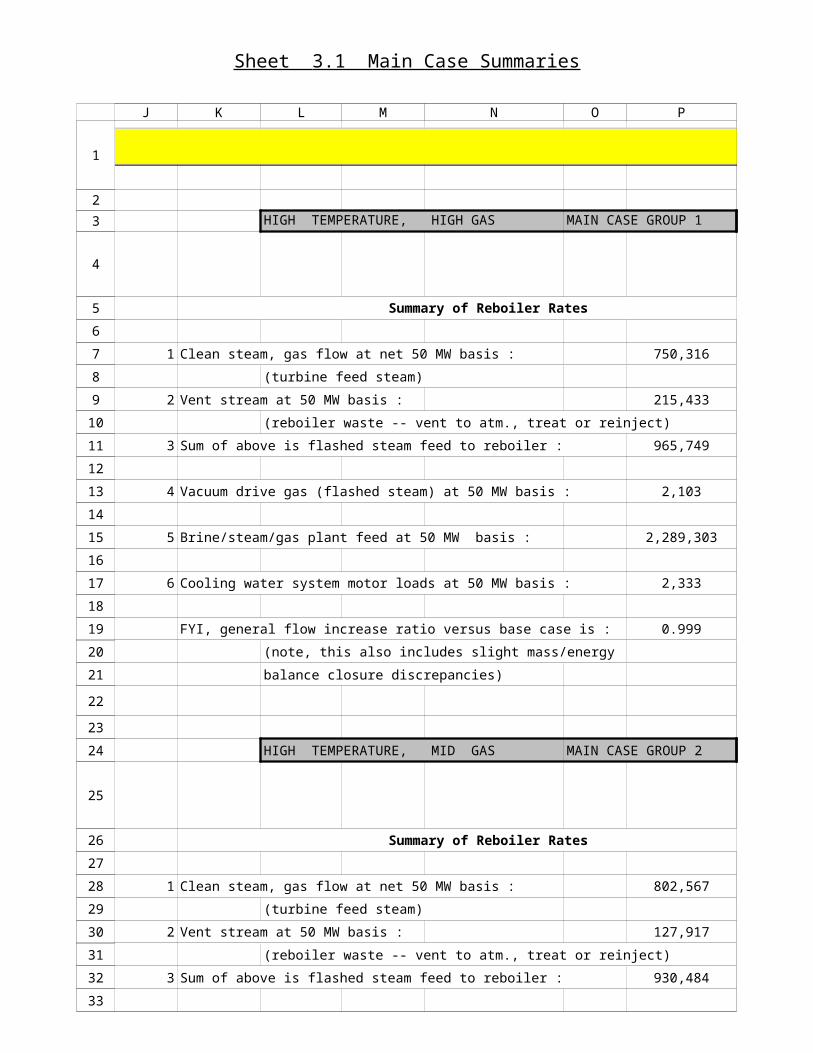
HIGH TEMPERATURE, HIGH GAS MAIN CASE GROUP 1
Summary of Reboiler Rates
1 Clean steam, gas flow at net 50 MW basis : 750,316
(turbine feed steam)
2 Vent stream at 50 MW basis : 215,433
(reboiler waste -- vent to atm., treat or reinject)
3 Sum of above is flashed steam feed to reboiler : 965,749
4 Vacuum drive gas (flashed steam) at 50 MW basis : 2,103
5 Brine/steam/gas plant feed at 50 MW basis : 2,289,303
6 Cooling water system motor loads at 50 MW basis : 2,333
FYI, general flow increase ratio versus base case is : 0.999
(note, this also includes slight mass/energy
balance closure discrepancies)
HIGH TEMPERATURE, MID GAS MAIN CASE GROUP 2
Summary of Reboiler Rates
1 Clean steam, gas flow at net 50 MW basis : 802,567
(turbine feed steam)
2 Vent stream at 50 MW basis : 127,917
(reboiler waste -- vent to atm., treat or reinject)
3 Sum of above is flashed steam feed to reboiler : 930,484
4 Vacuum drive gas (flashed steam) at 50 MW basis : 1,239
5 Brine/steam/gas plant feed at 50 MW basis : 2,287,396
RETURN
J K L M N O P
1
2
3
4
5
6
7
8
9
10
11
12
13
14
15
16
17
18
19
20
21
22
23
24
25
26
27
28
29
30
31
32
33
34
35
36
Sheet 3.1 Main Case Summaries
AXG-9-29432-01document.xls
Page 3.1.51 10:22:1804/18/2023
6 Cooling water system motor loads at 50 MW basis : 2,513
FYI, general flow increase ratio versus base case is : 1.000
(note, this also includes slight mass/energy
balance closure discrepancies)
J K L M N O P
37
38
39
40
41
42

Sheet 3.1 Main Case Summaries
AXG-9-29432-01document.xls
Page 3.1.52 10:22:1804/18/2023
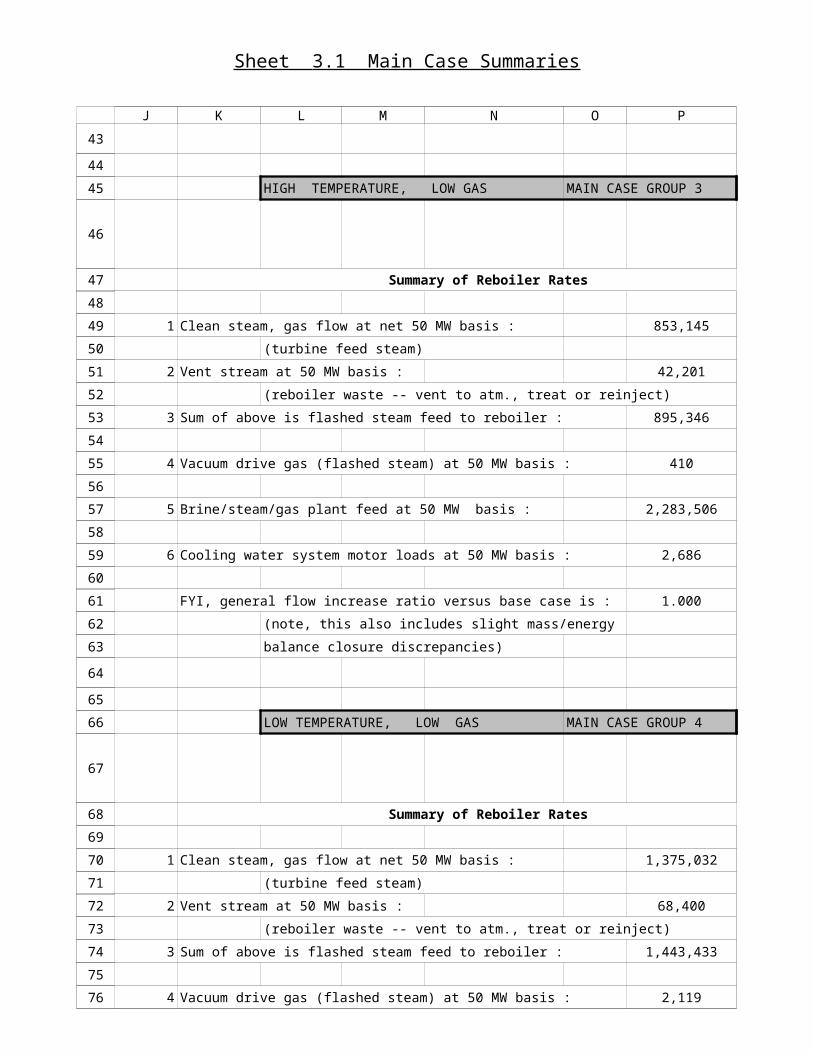
HIGH TEMPERATURE, LOW GAS MAIN CASE GROUP 3
Summary of Reboiler Rates
1 Clean steam, gas flow at net 50 MW basis : 853,145
(turbine feed steam)
2 Vent stream at 50 MW basis : 42,201
(reboiler waste -- vent to atm., treat or reinject)
3 Sum of above is flashed steam feed to reboiler : 895,346
4 Vacuum drive gas (flashed steam) at 50 MW basis : 410
5 Brine/steam/gas plant feed at 50 MW basis : 2,283,506
6 Cooling water system motor loads at 50 MW basis : 2,686
FYI, general flow increase ratio versus base case is : 1.000
(note, this also includes slight mass/energy
balance closure discrepancies)
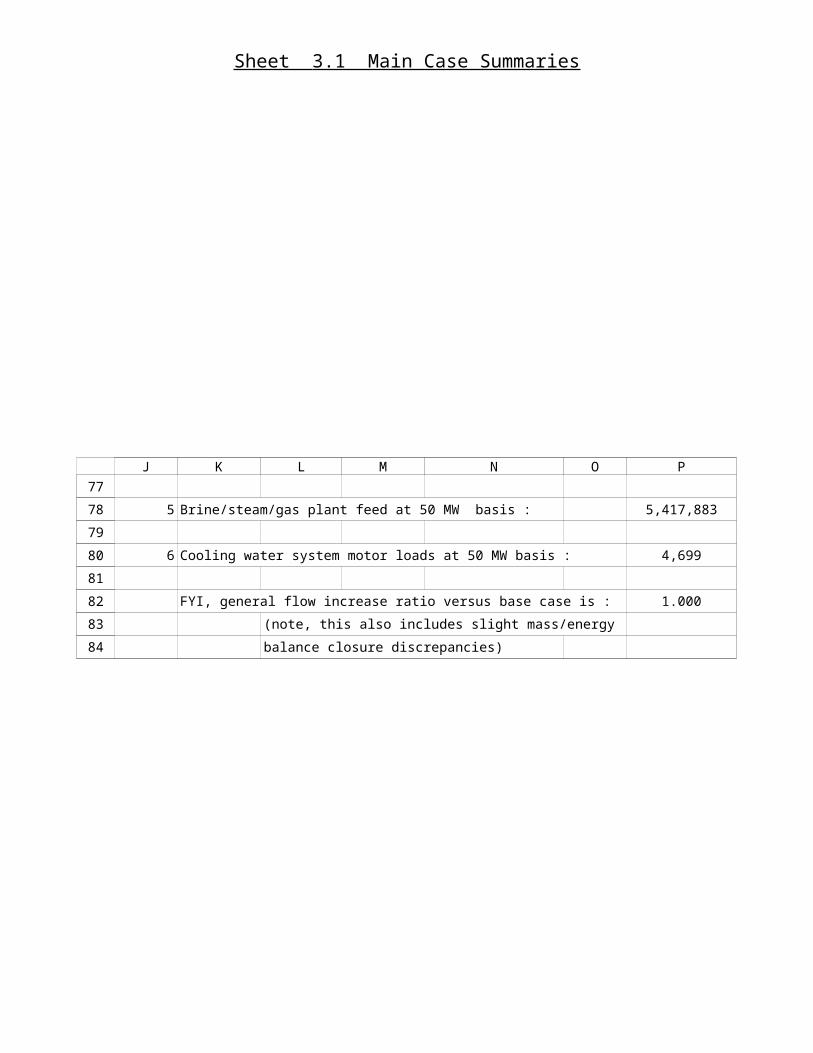
LOW TEMPERATURE, LOW GAS MAIN CASE GROUP 4
Summary of Reboiler Rates
1 Clean steam, gas flow at net 50 MW basis : 1,375,032
(turbine feed steam)
2 Vent stream at 50 MW basis : 68,400
(reboiler waste -- vent to atm., treat or reinject)
3 Sum of above is flashed steam feed to reboiler : 1,443,433
4 Vacuum drive gas (flashed steam) at 50 MW basis : 2,119
5 Brine/steam/gas plant feed at 50 MW basis : 5,417,883
J K L M N O P
43
44
45
46
47
48
49
50
51
52
53
54
55
56
57
58
59
60
61
62
63
64
65
66
67
68
69
70
71
72
73
74
75
76
77
78
79
Sheet 3.1 Main Case Summaries
AXG-9-29432-01document.xls
Page 3.1.53 10:22:1804/18/2023
6 Cooling water system motor loads at 50 MW basis : 4,699
FYI, general flow increase ratio versus base case is : 1.000
(note, this also includes slight mass/energy
balance closure discrepancies)
J K L M N O P
80
81
82
83
84
Sheet 3.1 Main Case Summaries
AXG-9-29432-01document.xls
Page 3.1.54 10:22:1804/18/2023
LOW TEMPERATURE, MID GAS MAIN CASE GROUP 5
Summary of Reboiler Rates
1 Clean steam, gas flow at net 50 MW basis : 1,290,621
(turbine feed steam)
2 Vent stream at 50 MW basis : 206,704
(reboiler waste -- vent to atm., treat or reinject)
3 Sum of above is flashed steam feed to reboiler : 1,497,326
4 Vacuum drive gas (flashed steam) at 50 MW basis : 6,289
5 Brine/steam/gas plant feed at 50 MW basis : 5,391,445
6 Cooling water system motor loads at 50 MW basis : 4,403
FYI, general flow increase ratio versus base case is : 0.999
(note, this also includes slight mass/energy
balance closure discrepancies)
LOW TEMPERATURE, HIGH GAS MAIN CASE GROUP 6
Summary of Reboiler Rates
1 Clean steam, gas flow at net 50 MW basis : 1,203,272
(turbine feed steam)
2 Vent stream at 50 MW basis : 346,618
(reboiler waste -- vent to atm., treat or reinject)
3 Sum of above is flashed steam feed to reboiler : 1,549,890
4 Vacuum drive gas (flashed steam) at 50 MW basis : 10,425
5 Brine/steam/gas plant feed at 50 MW basis : 5,354,261
J K L M N O P
85
86
87
88
89
90
91
92
93
94
95
96
97
98
99
100
101
102
103
104
105
106
107
108
109
110
111
112
113
114
115
116
117
118
119
120
121

Sheet 3.1 Main Case Summaries
AXG-9-29432-01document.xls
Page 3.1.55 10:22:1804/18/2023
6 Cooling water system motor loads at 50 MW basis : 4,095
FYI, general flow increase ratio versus base case is : 0.998
(note, this also includes slight mass/energy
balance closure discrepancies)
J K L M N O P
122
123
124
125
126

Sheet 3.1 Main Case Summaries
AXG-9-29432-01document.xls
Page 3.1.56 10:22:1804/18/2023
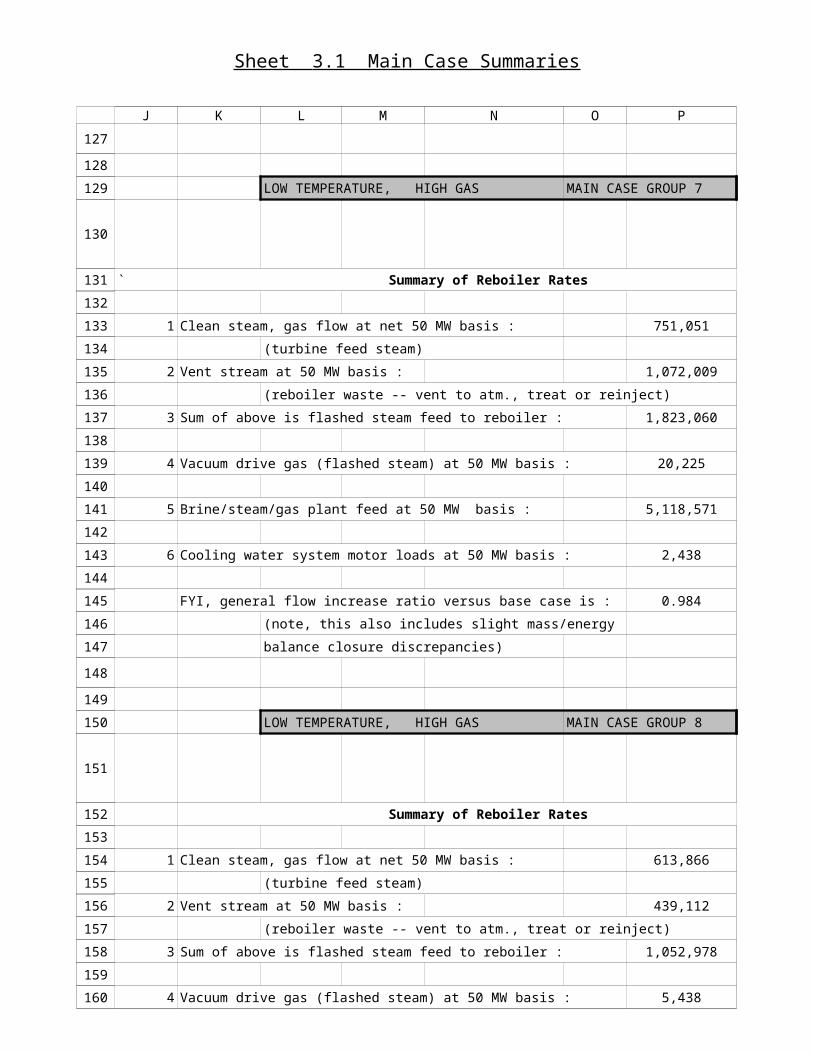
LOW TEMPERATURE, HIGH GAS MAIN CASE GROUP 7
` Summary of Reboiler Rates
1 Clean steam, gas flow at net 50 MW basis : 751,051
(turbine feed steam)
2 Vent stream at 50 MW basis : 1,072,009
(reboiler waste -- vent to atm., treat or reinject)
3 Sum of above is flashed steam feed to reboiler : 1,823,060
4 Vacuum drive gas (flashed steam) at 50 MW basis : 20,225
5 Brine/steam/gas plant feed at 50 MW basis : 5,118,571
6 Cooling water system motor loads at 50 MW basis : 2,438
FYI, general flow increase ratio versus base case is : 0.984
(note, this also includes slight mass/energy
balance closure discrepancies)
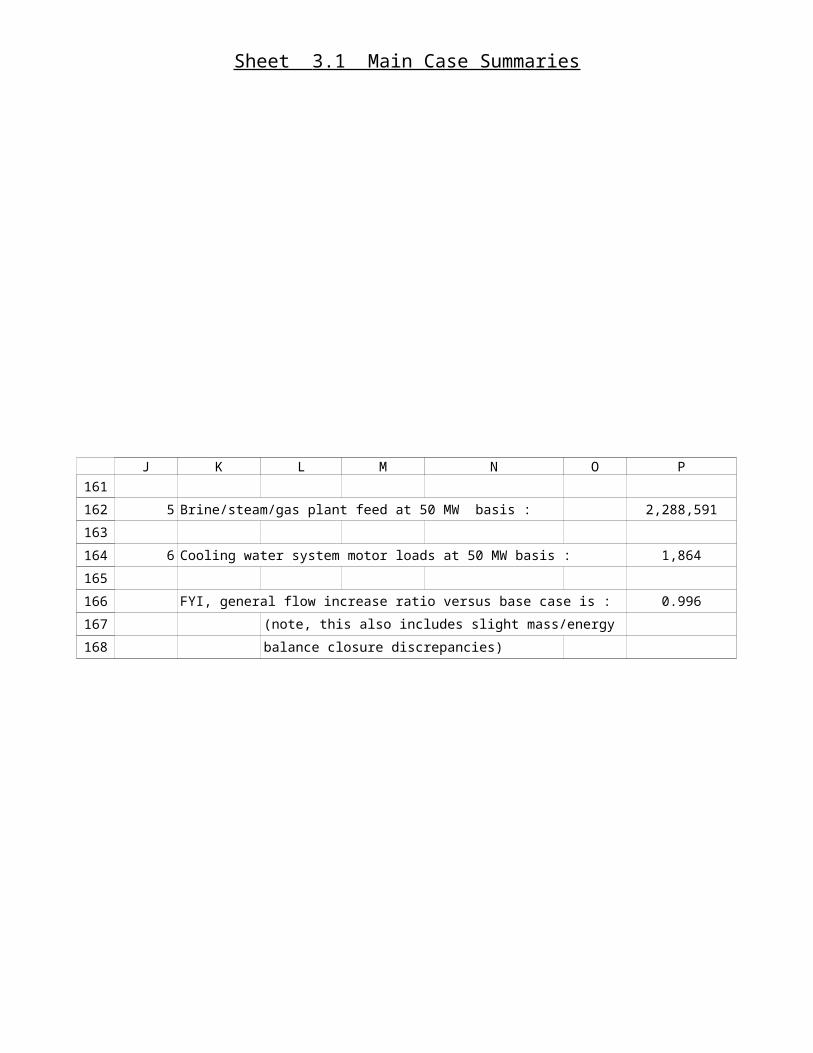
LOW TEMPERATURE, HIGH GAS MAIN CASE GROUP 8
Summary of Reboiler Rates
1 Clean steam, gas flow at net 50 MW basis : 613,866
(turbine feed steam)
2 Vent stream at 50 MW basis : 439,112
(reboiler waste -- vent to atm., treat or reinject)
3 Sum of above is flashed steam feed to reboiler : 1,052,978
4 Vacuum drive gas (flashed steam) at 50 MW basis : 5,438
5 Brine/steam/gas plant feed at 50 MW basis : 2,288,591
J K L M N O P
127
128
129
130
131
132
133
134
135
136
137
138
139
140
141
142
143
144
145
146
147
148
149
150
151
152
153
154
155
156
157
158
159
160
161
162
163
Sheet 3.1 Main Case Summaries
AXG-9-29432-01document.xls
Page 3.1.57 10:22:1804/18/2023
6 Cooling water system motor loads at 50 MW basis : 1,864
FYI, general flow increase ratio versus base case is : 0.996
(note, this also includes slight mass/energy
balance closure discrepancies)
J K L M N O P
164
165
166
167
168
Sheet 3.1 Main Case Summaries
AXG-9-29432-01document.xls
Page 3.1.58 10:22:1804/18/2023
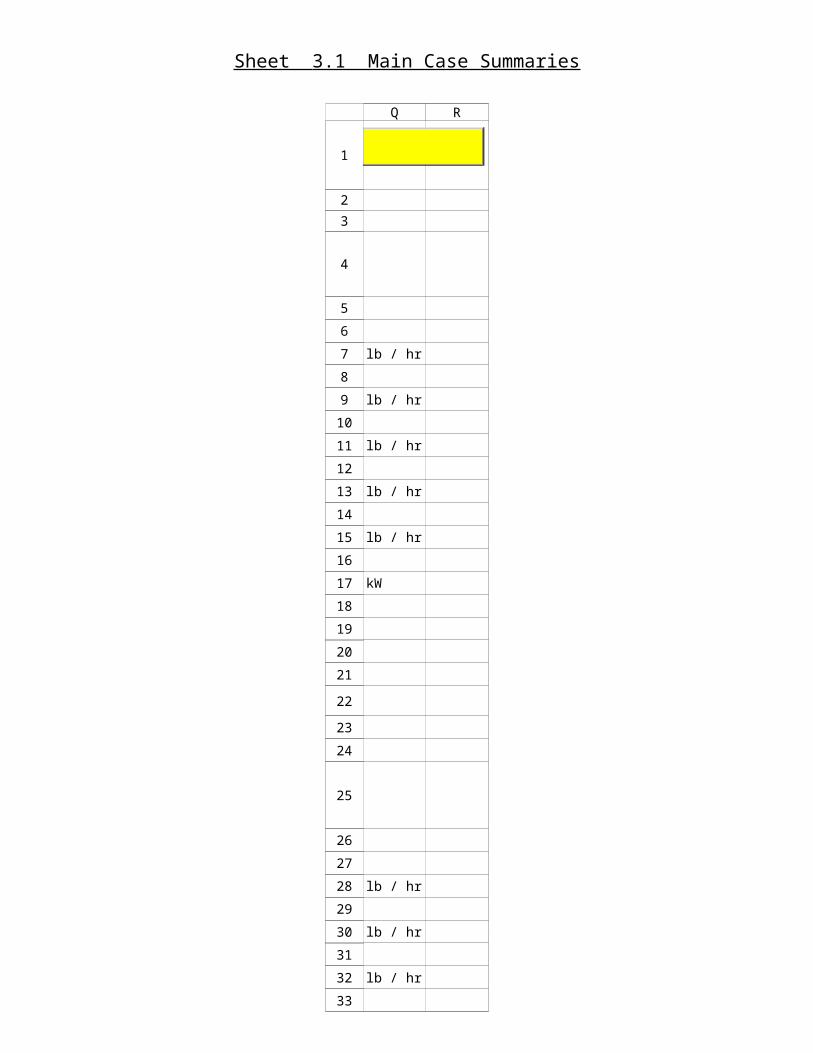
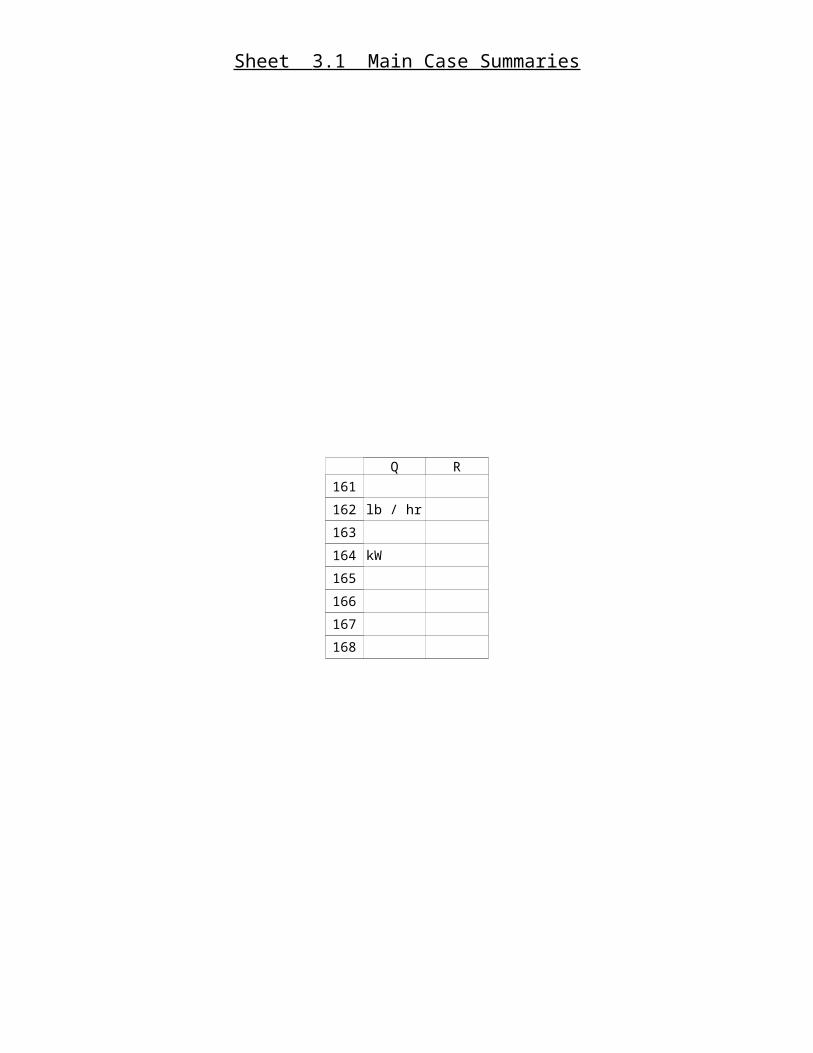
Summary of Reboiler Rates
lb / hr
lb / hr
lb / hr
lb / hr
lb / hr
kW
Summary of Reboiler Rates
lb / hr
lb / hr
lb / hr
lb / hr
lb / hr
RETURN
Q R
1
2
3
4
5
6
7
8
9
10
11
12
13
14
15
16
17
18
19
20
21
22
23
24
25
26
27
28
29
30
31
32
33
34
35
36
Sheet 3.1 Main Case Summaries
AXG-9-29432-01document.xls
Page 3.1.59 10:22:1804/18/2023
kW
Q R
37
38
39
40
41
42

Sheet 3.1 Main Case Summaries
AXG-9-29432-01document.xls
Page 3.1.60 10:22:1804/18/2023
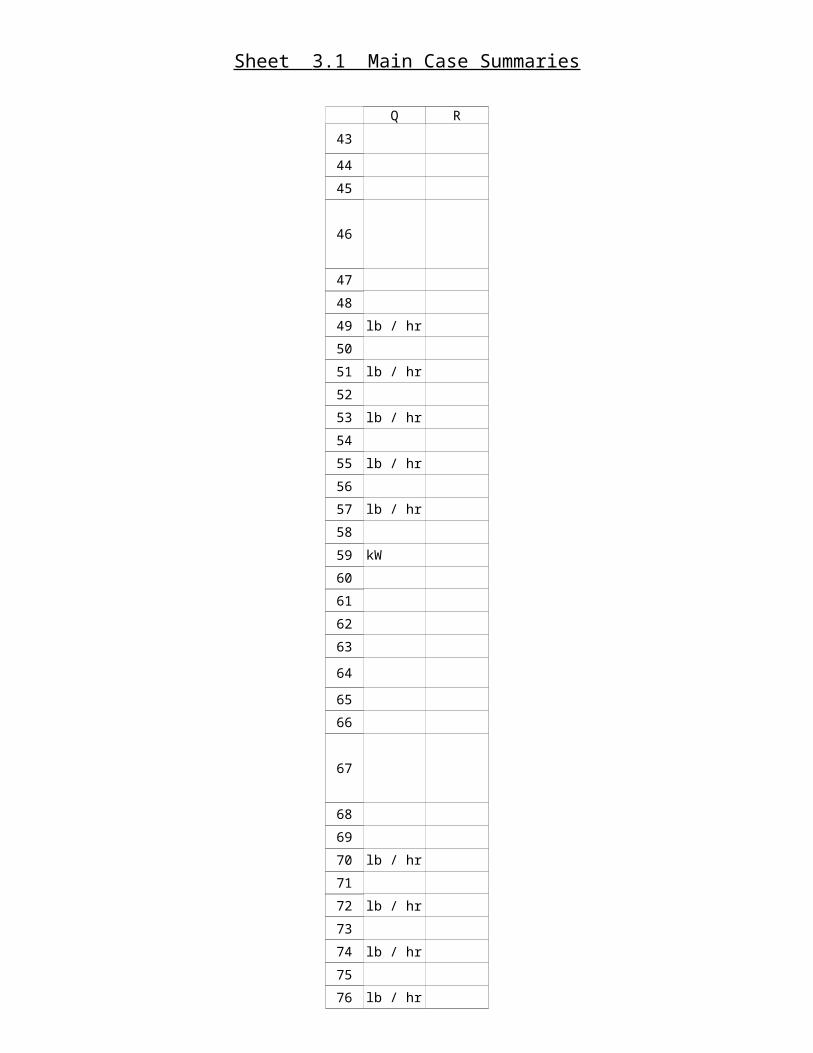
Summary of Reboiler Rates
lb / hr
lb / hr
lb / hr
lb / hr
lb / hr
kW
Summary of Reboiler Rates
lb / hr
lb / hr
lb / hr
lb / hr
lb / hr
Q R
43
44
45
46
47
48
49
50
51
52
53
54
55
56
57
58
59
60
61
62
63
64
65
66
67
68
69
70
71
72
73
74
75
76
77
78
79
Sheet 3.1 Main Case Summaries
AXG-9-29432-01document.xls
Page 3.1.61 10:22:1804/18/2023
kW
Q R
80
81
82
83
84
Sheet 3.1 Main Case Summaries
AXG-9-29432-01document.xls
Page 3.1.62 10:22:1804/18/2023
Summary of Reboiler Rates
lb / hr
lb / hr
lb / hr
lb / hr
lb / hr
kW
Summary of Reboiler Rates
lb / hr
lb / hr
lb / hr
lb / hr
lb / hr
Q R
85
86
87
88
89
90
91
92
93
94
95
96
97
98
99
100
101
102
103
104
105
106
107
108
109
110
111
112
113
114
115
116
117
118
119
120
121
Sheet 3.1 Main Case Summaries
AXG-9-29432-01document.xls
Page 3.1.63 10:22:1804/18/2023
kW
Q R
122
123
124
125
126

Sheet 3.1 Main Case Summaries
AXG-9-29432-01document.xls
Page 3.1.64 10:22:1804/18/2023
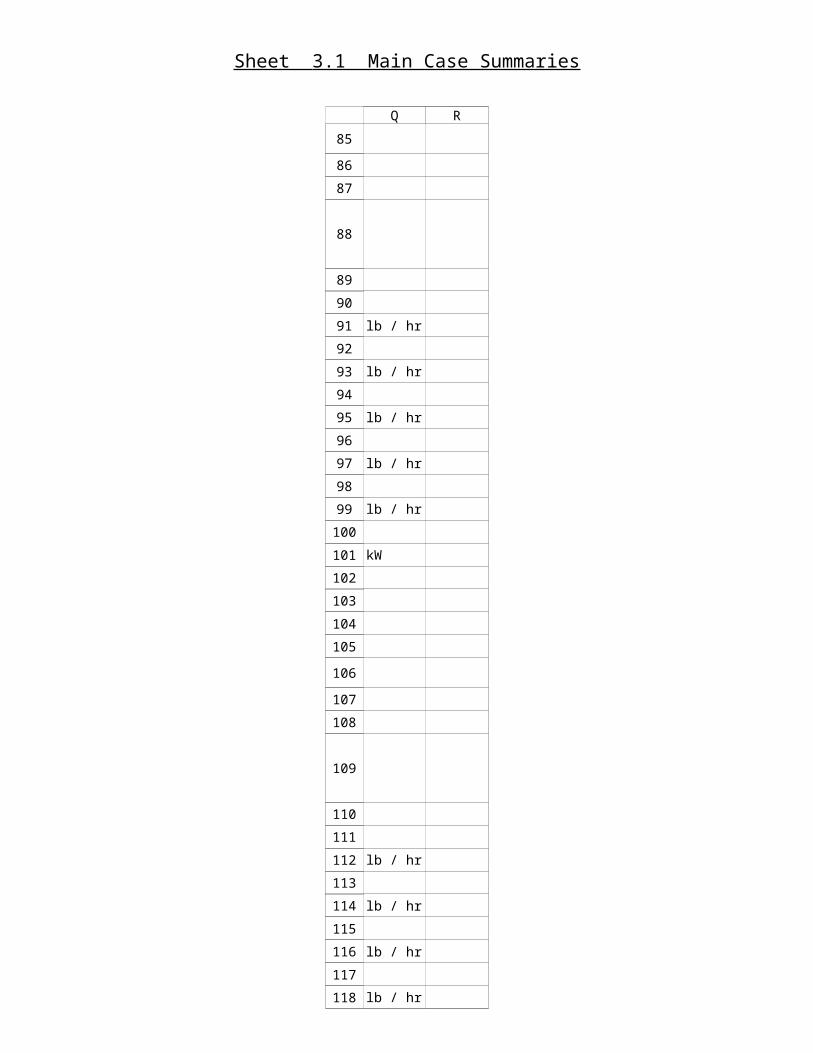
Summary of Reboiler Rates
lb / hr
lb / hr
lb / hr
lb / hr
lb / hr
kW
Summary of Reboiler Rates
lb / hr
lb / hr
lb / hr
lb / hr
lb / hr
Q R
127
128
129
130
131
132
133
134
135
136
137
138
139
140
141
142
143
144
145
146
147
148
149
150
151
152
153
154
155
156
157
158
159
160
161
162
163

Sheet 3.1 Main Case Summaries
AXG-9-29432-01document.xls
Page 3.1.65 10:22:1804/18/2023
kW
Q R
164
165
166
167
168
Sheet 3.2 Sensitivity Case Summaries
AXG-9-29432-01document.xls
Page 3.2.66 10:22:1804/18/2023
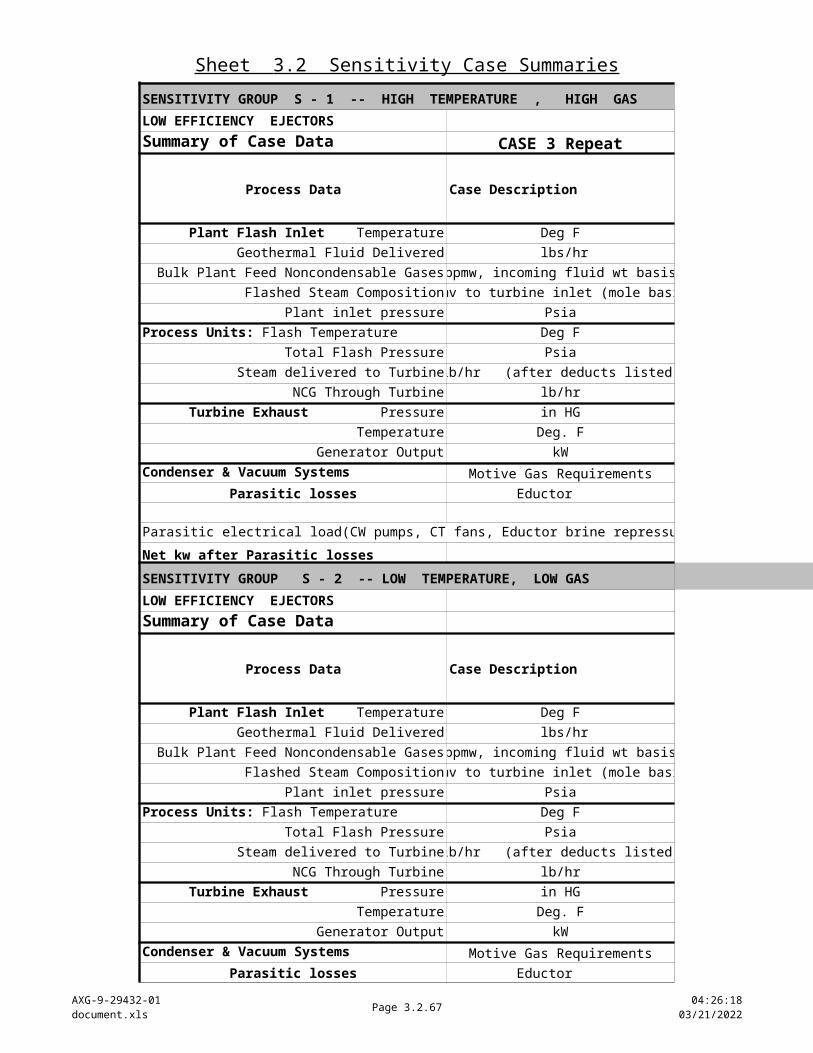
SENSITIVITY GROUP S - 1 -- HIGH TEMPERATURE , HIGH GAS
LOW EFFICIENCY EJECTORS
Summary of Case Data CASE 3 Repeat
Process Data Case Description
Deg F
Geothermal Fluid Delivered lbs/hr
Bulk Plant Feed Noncondensable Gases ppmw, incoming fluid wt basis
Flashed Steam Composition ppmv to turbine inlet (mole basis)
Plant inlet pressure Psia
Deg F
Total Flash Pressure Psia
Steam delivered to Turbine lb/hr (after deducts listed)
NCG Through Turbine lb/hr
in HG
Temperature Deg. F
Generator Output kW
Condenser & Vacuum Systems Motive Gas Requirements Lb/hr Steam and Gas
Parasitic losses Eductor
Parasitic electrical load(CW pumps, CT fans, Eductor brine repressure pumps) kW
Net kw after Parasitic losses
SENSITIVITY GROUP S - 2 -- LOW TEMPERATURE, LOW GAS
LOW EFFICIENCY EJECTORS
Summary of Case Data
Process Data Case Description Case 8 repeat
Deg F
Geothermal Fluid Delivered lbs/hr
Bulk Plant Feed Noncondensable Gases ppmw, incoming fluid wt basis
Flashed Steam Composition ppmv to turbine inlet (mole basis)
Plant inlet pressure Psia
Deg F
Total Flash Pressure Psia
Steam delivered to Turbine lb/hr (after deducts listed)
NCG Through Turbine lb/hr
in HG
Temperature Deg. F
Generator Output kW 2.931E-04
Condenser & Vacuum Systems Motive Gas Requirements
Parasitic losses Eductor
Parasitic electrical load(CW pumps, CT fans, Eductor brine repressure pumps) kW
Net kw after Parasitic losses
Plant Flash Inlet Temperature
Process Units: Flash Temperature
Turbine Exhaust Pressure
Plant Flash Inlet Temperature
Process Units: Flash Temperature
Turbine Exhaust Pressure
See reboiler summary data at far right.
See reboiler summary data at far right.
Sheet 3.2 Sensitivity Case Summaries
AXG-9-29432-01document.xls
Page 3.2.67 10:22:1804/18/2023
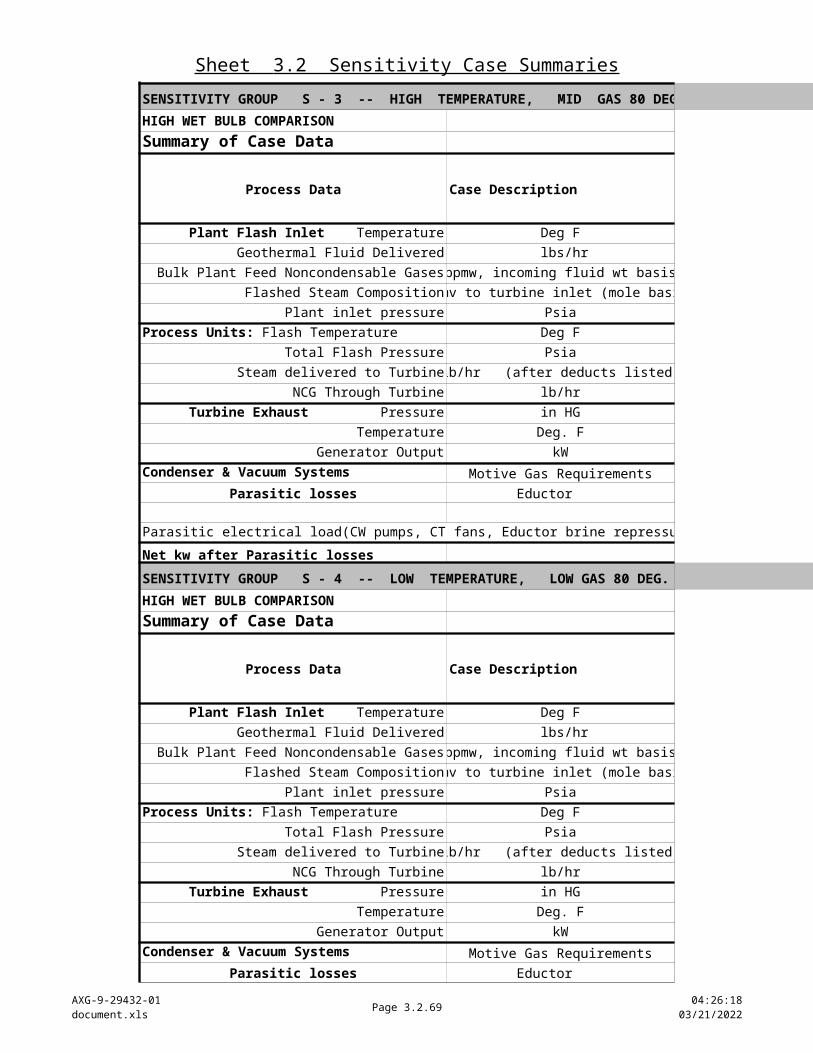
SENSITIVITY GROUP S - 3 -- HIGH TEMPERATURE, MID GAS 80 DEG. WET BULB
HIGH WET BULB COMPARISON
Summary of Case Data
Process Data Case Description CASE 5 b
Deg F
Geothermal Fluid Delivered lbs/hr
Bulk Plant Feed Noncondensable Gases ppmw, incoming fluid wt basis
Flashed Steam Composition ppmv to turbine inlet (mole basis)
Plant inlet pressure Psia
Deg F
Total Flash Pressure Psia
Steam delivered to Turbine lb/hr (after deducts listed)
NCG Through Turbine lb/hr
in HG
Temperature Deg. F
Generator Output kW 2.931E-04
Condenser & Vacuum Systems Motive Gas Requirements
Parasitic losses Eductor
Parasitic electrical load(CW pumps, CT fans, Eductor brine repressure pumps) kW
Net kw after Parasitic losses
SENSITIVITY GROUP S - 4 -- LOW TEMPERATURE, LOW GAS 80 DEG. WET BULB
HIGH WET BULB COMPARISON
Summary of Case Data
Process Data Case Description Case 9 repeat
Deg F
Geothermal Fluid Delivered lbs/hr
Bulk Plant Feed Noncondensable Gases ppmw, incoming fluid wt basis
Flashed Steam Composition ppmv to turbine inlet (mole basis)
Plant inlet pressure Psia
Deg F
Total Flash Pressure Psia
Steam delivered to Turbine lb/hr (after deducts listed)
NCG Through Turbine lb/hr
in HG
Temperature Deg. F
Generator Output kW 2.931E-04
Condenser & Vacuum Systems Motive Gas Requirements
Parasitic losses Eductor
Parasitic electrical load(CW pumps, CT fans, Eductor brine repressure pumps) kW
Net kw after Parasitic losses
Plant Flash Inlet Temperature
Process Units: Flash Temperature
Turbine Exhaust Pressure
Plant Flash Inlet Temperature
Process Units: Flash Temperature
Turbine Exhaust Pressure
See reboiler summary data at far right.
See reboiler summary data at far right.

Sheet 3.2 Sensitivity Case Summaries
AXG-9-29432-01document.xls
Page 3.2.68 10:22:1804/18/2023
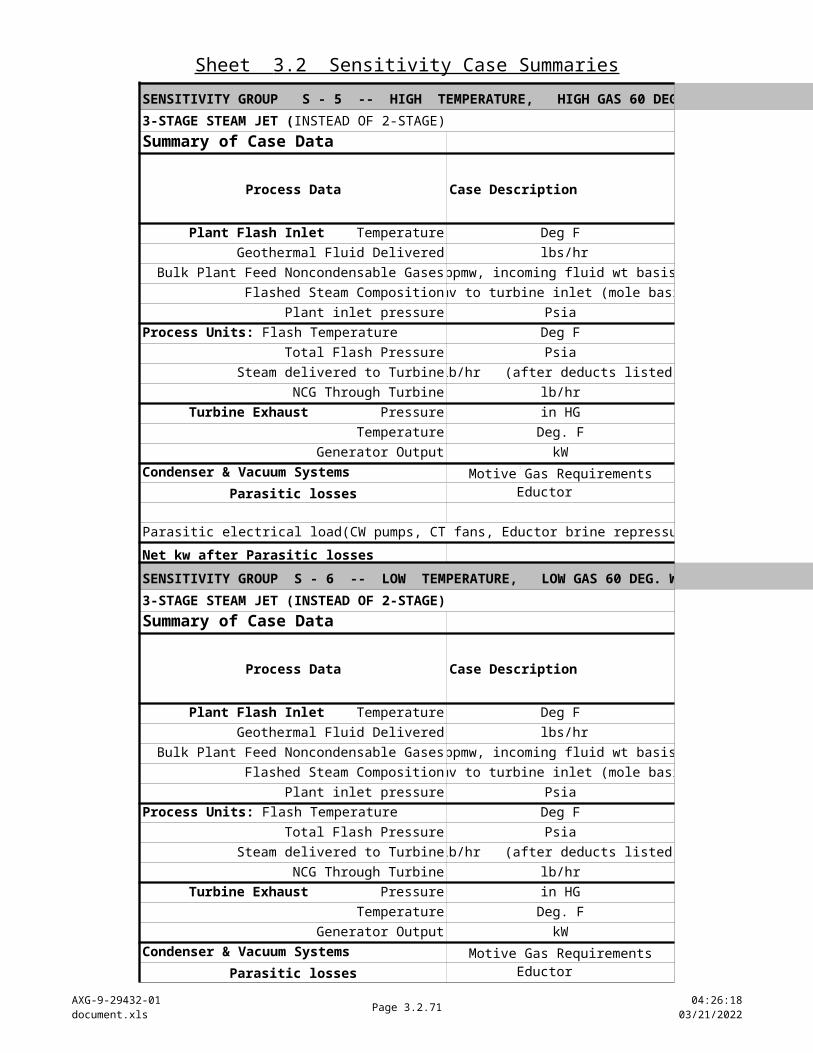
SENSITIVITY GROUP S - 5 -- HIGH TEMPERATURE, HIGH GAS 60 DEG. WET BULB LAST STAGE 23 %
Summary of Case Data
Process Data Case Description Case 1 repeat
Deg F
Geothermal Fluid Delivered lbs/hr
Bulk Plant Feed Noncondensable Gases ppmw, incoming fluid wt basis
Flashed Steam Composition ppmv to turbine inlet (mole basis)
Plant inlet pressure Psia
Deg F
Total Flash Pressure Psia
Steam delivered to Turbine lb/hr (after deducts listed)
NCG Through Turbine lb/hr
in HG
Temperature Deg. F
Generator Output kW 2.931E-04
Condenser & Vacuum Systems Motive Gas Requirements lb/hr
Parasitic losses Eductor
Parasitic electrical load(CW pumps, CT fans, Eductor brine repressure pumps) kW
Net kw after Parasitic losses
SENSITIVITY GROUP S - 6 -- LOW TEMPERATURE, LOW GAS 60 DEG. WET BULB LAST STAGE 23 %
3-STAGE STEAM JET (INSTEAD OF 2-STAGE)
Summary of Case Data
Process Data Case Description Case 7 repeat
Deg F
Geothermal Fluid Delivered lbs/hr
Bulk Plant Feed Noncondensable Gases ppmw, incoming fluid wt basis
Flashed Steam Composition ppmv to turbine inlet (mole basis)
Plant inlet pressure Psia
Deg F
Total Flash Pressure Psia
Steam delivered to Turbine lb/hr (after deducts listed)
NCG Through Turbine lb/hr
in HG
Temperature Deg. F
Generator Output kW 2.931E-04
Condenser & Vacuum Systems Motive Gas Requirements
Parasitic losses Eductor
Parasitic electrical load(CW pumps, CT fans, Eductor brine repressure pumps) kW
Net kw after Parasitic losses
3-STAGE STEAM JET (INSTEAD OF 2-STAGE)
Plant Flash Inlet Temperature
Process Units: Flash Temperature
Turbine Exhaust Pressure
Plant Flash Inlet Temperature
Process Units: Flash Temperature
Turbine Exhaust Pressure
See reboiler summary data at far right.
See reboiler summary data at far right.
Sheet 3.2 Sensitivity Case Summaries
AXG-9-29432-01document.xls
Page 3.2.69 10:22:1804/18/2023
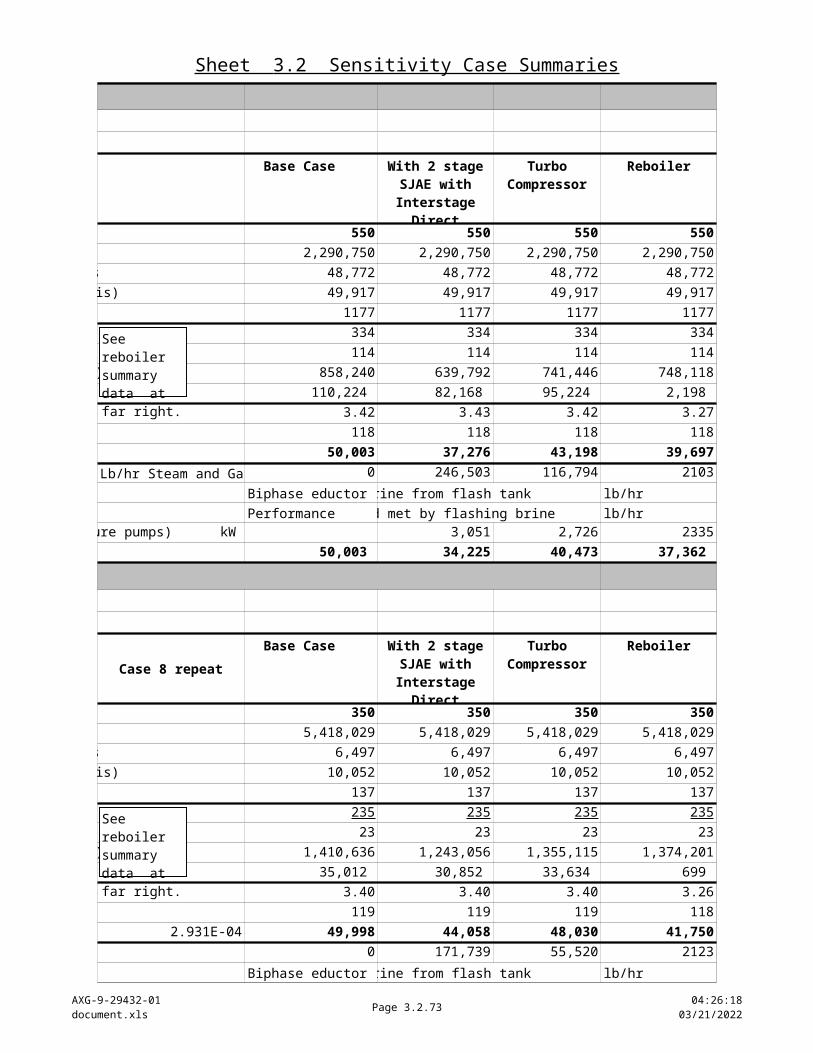
CASE 3 - R Sensitivity 2
Base Case Reboiler
550 550 550 550 550
2,290,750 2,290,750 2,290,750 2,290,750 2,290,750
48,772 48,772 48,772 48,772 48,772
49,917 49,917 49,917 49,917 49,917
1177 1177 1177 1177 1177
334 334 334 334 334
114 114 114 114 114
858,240 639,792 741,446 748,118 661,680
110,224 82,168 95,224 2,198 84,979
3.42 3.43 3.42 3.27 3.42
118 118 118 118 118
50,003 37,276 43,198 39,697 38,551
0 246,503 116,794 2103 196,560
Biphase eductor lb-brine from flash tank lb/hr 1,320,785
Performance ncg load met by flashing brine lb/hr 19,459
3,051 2,726 2335 2,814
50,003 34,225 40,473 37,362 35,737
SENSITIVITY GROUP S - 2 -- LOW TEMPERATURE, LOW GAS CASE 8 R
Base Case Reboiler
350 350 350 350 350
5,418,029 5,418,029 5,418,029 5,418,029 5,418,029
6,497 6,497 6,497 6,497 6,497
10,052 10,052 10,052 10,052 10,052
137 137 137 137 137
235 235 235 235 235
23 23 23 23 23
1,410,636 1,243,056 1,355,115 1,374,201 1,268,218
35,012 30,852 33,634 699 31,477
3.40 3.40 3.40 3.26 3.40
119 119 119 118 119
49,998 44,058 48,030 41,750 44,950
0 171,739 55,520 2123 142,418
Biphase eductor lb-brine from flash tank lb/hr 3,972,192
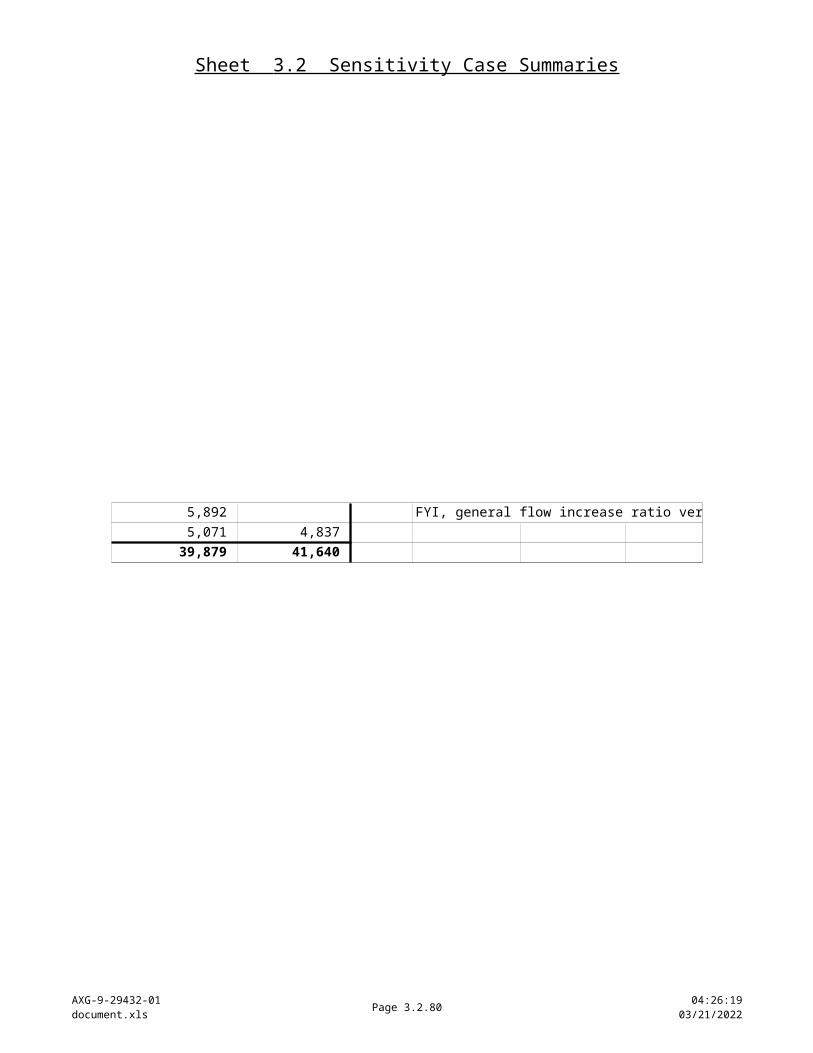
Performance ncg load met by flashing brine lb/hr 5,892
5,332 4,790 4,698 5,071
49,998 38,726 43,240 37,052 39,879
With 2 stage SJAE with Interstage
Direct Contact Condensers
Turbo Compressor
Two Phase Eductor
With 2 stage SJAE with Interstage
Direct Contact Condensers
Turbo Compressor
Two Phase Eductor

Sheet 3.2 Sensitivity Case Summaries
AXG-9-29432-01document.xls
Page 3.2.70 10:22:1804/18/2023
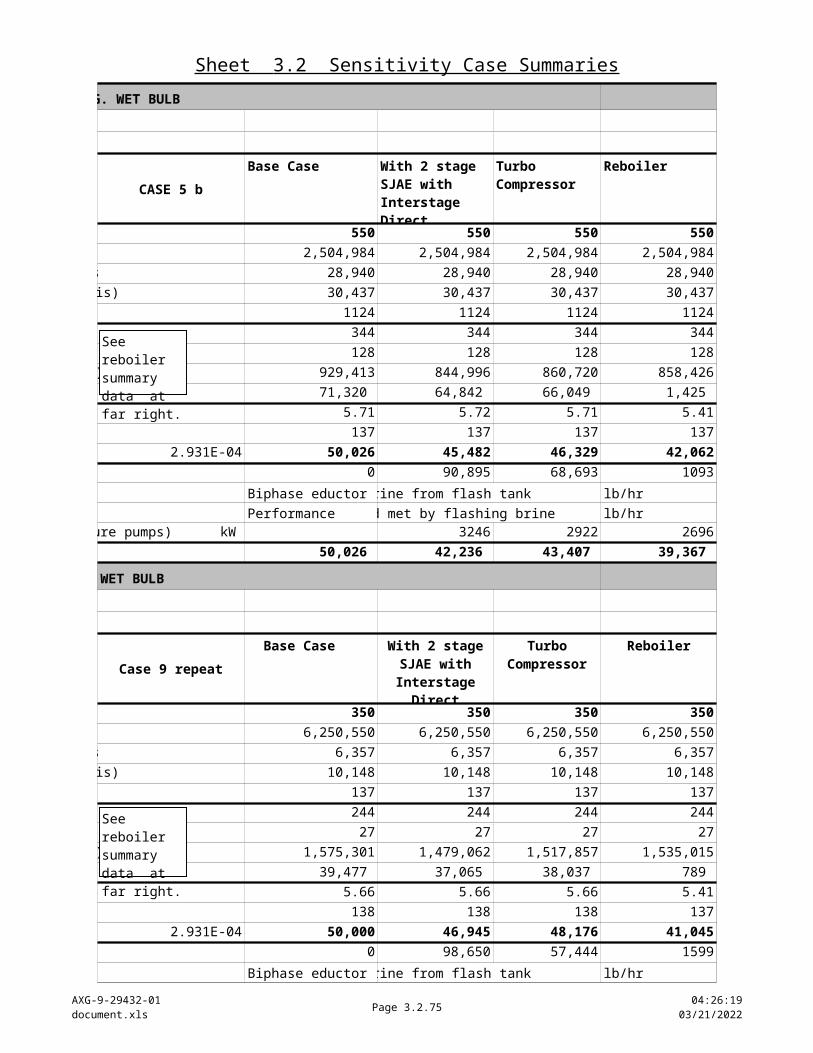
SENSITIVITY GROUP S - 3 -- HIGH TEMPERATURE, MID GAS 80 DEG. WET BULB CASE 5 B
Base Case Reboiler
550 550 550 550 550
2,504,984 2,504,984 2,504,984 2,504,984 2,504,984
28,940 28,940 28,940 28,940 28,940
30,437 30,437 30,437 30,437 30,437
1124 1124 1124 1124 1124
344 344 344 344 344
128 128 128 128 128
929,413 844,996 860,720 858,426 879,194
71,320 64,842 66,049 1,425 67,466
5.71 5.72 5.71 5.41 6
137 137 137 137 137
50,026 45,482 46,329 42,062 47,323
0 90,895 68,693 1093 50,220
Biphase eductor lb-brine from flash tank lb/hr 1,503,076
Performance ncg load met by flashing brine lb/hr 31,641
3246 2922 2696 3799
50,026 42,236 43,407 39,367 43,524
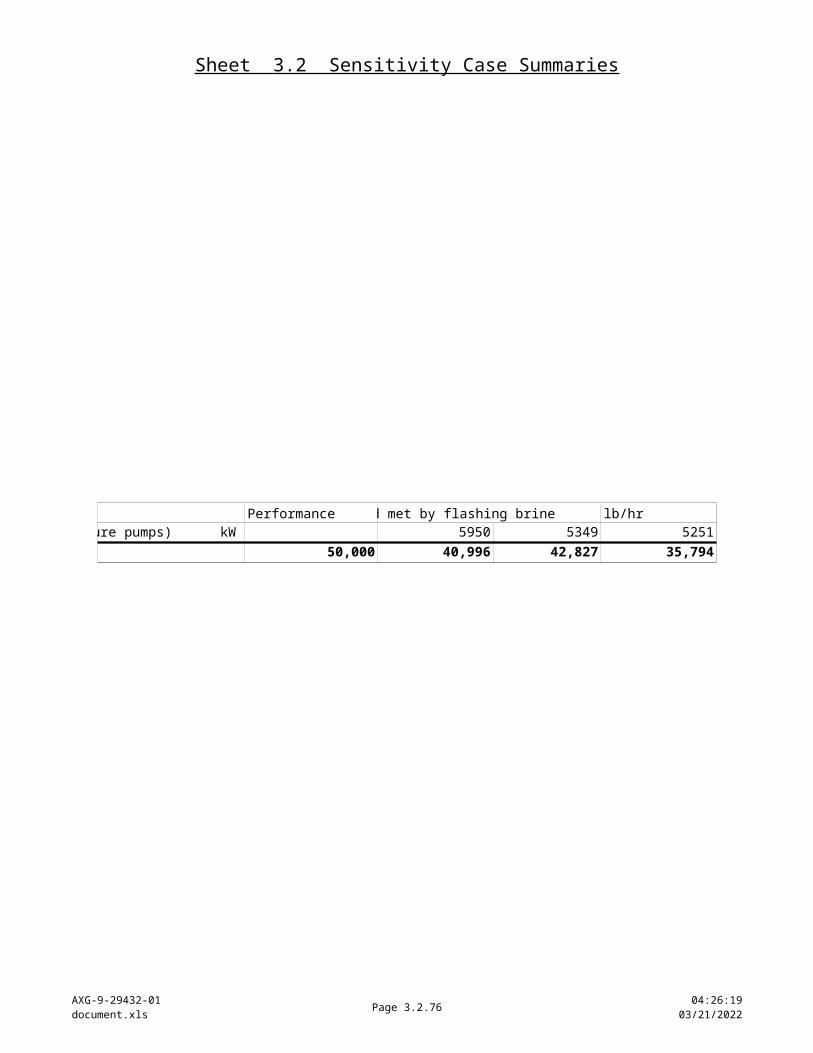
SENSITIVITY GROUP S - 4 -- LOW TEMPERATURE, LOW GAS 80 DEG. WET BULB CASE 9 R
Base Case Reboiler
350 350 350 350 350
6,250,550 6,250,550 6,250,550 6,250,550 6,250,550
6,357 6,357 6,357 6,357 6,357
10,148 10,148 10,148 10,148 10,148
137 137 137 137 137
244 244 244 244 244
27 27 27 27 27
1,575,301 1,479,062 1,517,857 1,535,015 1,506,476
39,477 37,065 38,037 789 37,752
5.66 5.66 5.66 5.41 5.66
138 138 138 137 138
50,000 46,945 48,176 41,045 47,815
0 98,650 57,444 1599 68,825
Biphase eductor lb-brine from flash tank lb/hr 4,635,512
Performance ncg load met by flashing brine lb/hr 11,893
5950 5349 5251 6259
50,000 40,996 42,827 35,794 41,557
With 2 stage SJAE with Interstage Direct Contact Condensers
Turbo Compressor
Two Phase Eductor
With 2 stage SJAE with Interstage
Direct Contact Condensers
Turbo Compressor
Two Phase Eductor
Sheet 3.2 Sensitivity Case Summaries
AXG-9-29432-01document.xls
Page 3.2.71 10:22:1804/18/2023
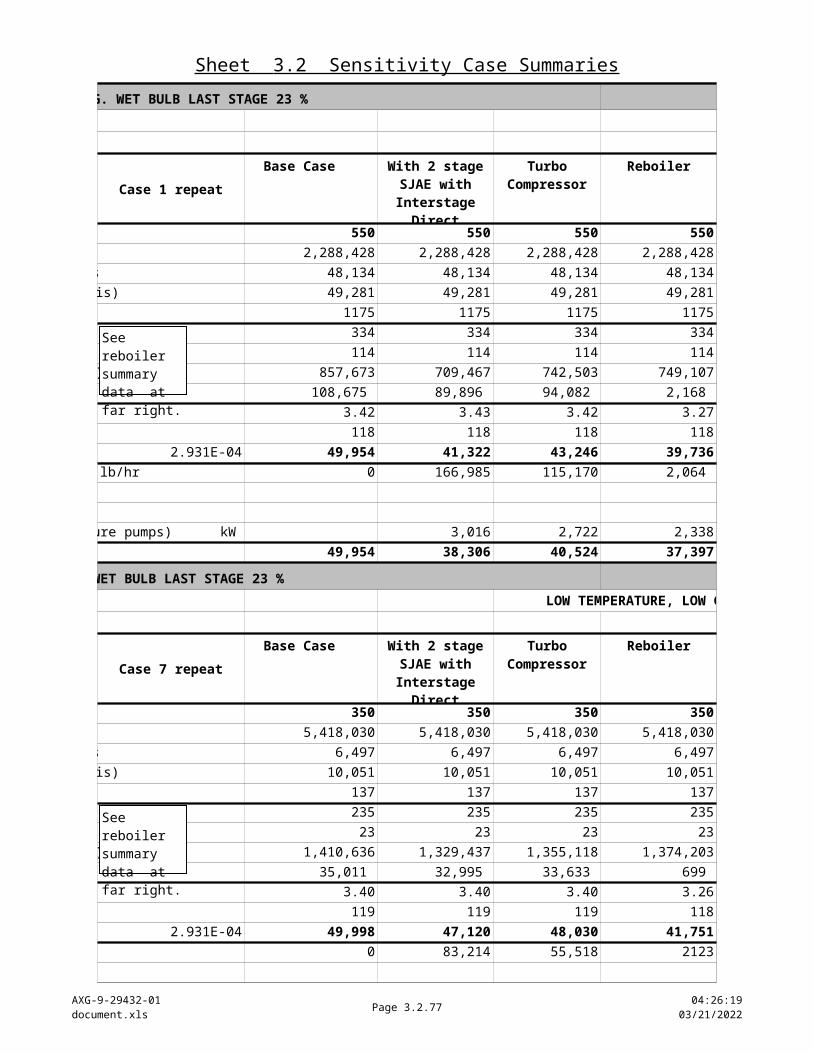
SENSITIVITY GROUP S - 5 -- HIGH TEMPERATURE, HIGH GAS 60 DEG. WET BULB LAST STAGE 23 % CASE 1 R Sensitivity 1
Base Case Reboiler
550 550 550 550 550
2,288,428 2,288,428 2,288,428 2,288,428 2,288,428
48,134 48,134 48,134 48,134 48,134
49,281 49,281 49,281 49,281 49,281
1175 1175 1175 1175 1175
334 334 334 334 334
114 114 114 114 114
857,673 709,467 742,503 749,107 726,536
108,675 89,896 94,082 2,168 92,059
3.42 3.43 3.42 3.27 3.42
118 118 118 118 118
49,954 41,322 43,246 39,736 42,316
0 166,985 115,170 2,064 131,136
1,320,605
21,462
3,016 2,722 2,338 3,010
49,954 38,306 40,524 37,397 39,307
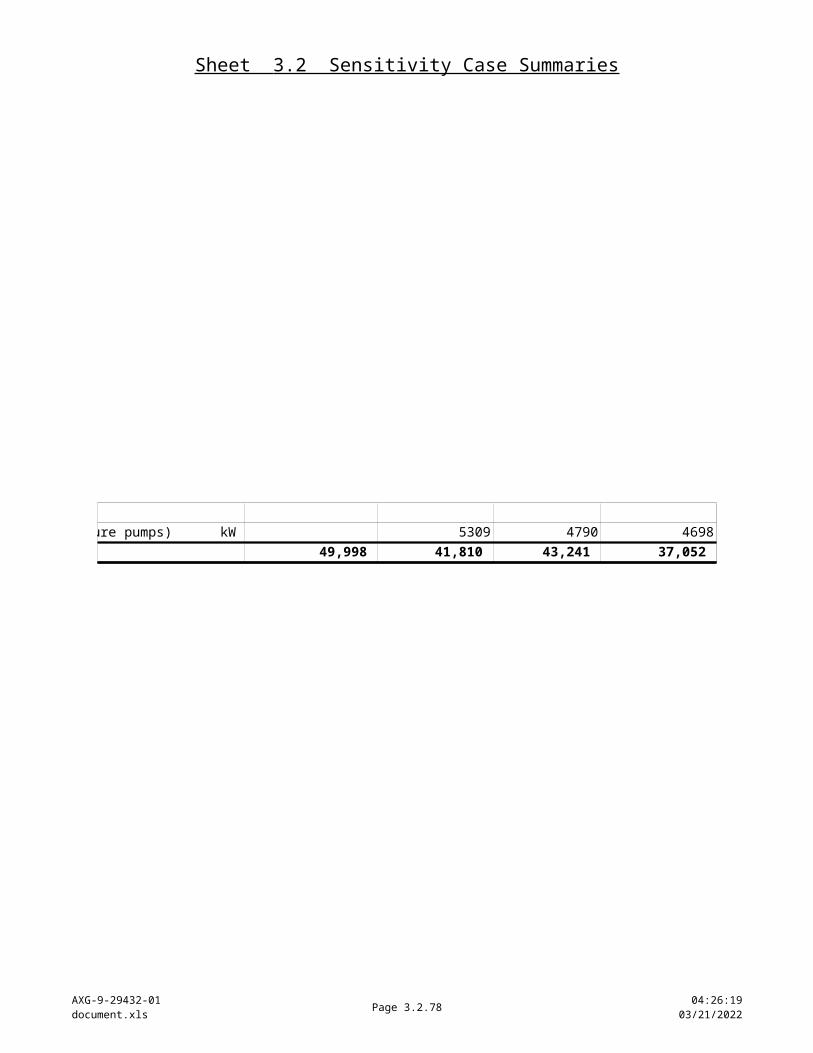
SENSITIVITY GROUP S - 6 -- LOW TEMPERATURE, LOW GAS 60 DEG. WET BULB LAST STAGE 23 % CASE 7 R
LOW TEMPERATURE, LOW GAS, 60 DEG WET BULB 23%23%23%
Base Case Reboiler
350 350 350 350 350
5,418,030 5,418,030 5,418,030 5,418,030 5,418,030
6,497 6,497 6,497 6,497 6,497
10,051 10,051 10,051 10,051 10,051
137 137 137 137 137
235 235 235 235 235
23 23 23 23 23
1,410,636 1,329,437 1,355,118 1,374,203 1,342,419
35,011 32,995 33,633 699 33,318
3.40 3.40 3.40 3.26 3.40
119 119 119 118 119
49,998 47,120 48,030 41,751 47,580
0 83,214 55,518 2123 68,217
3,972,194
6,269
5309 4790 4698 5348
49,998 41,810 43,241 37,052 42,232
With 2 stage SJAE with Interstage
Direct Contact Condensers
Turbo Compressor
Two Phase Eductor
With 2 stage SJAE with Interstage
Direct Contact Condensers
Turbo Compressor
Two Phase Eductor
Sheet 3.2 Sensitivity Case Summaries
AXG-9-29432-01document.xls
Page 3.2.72 10:22:1804/18/2023
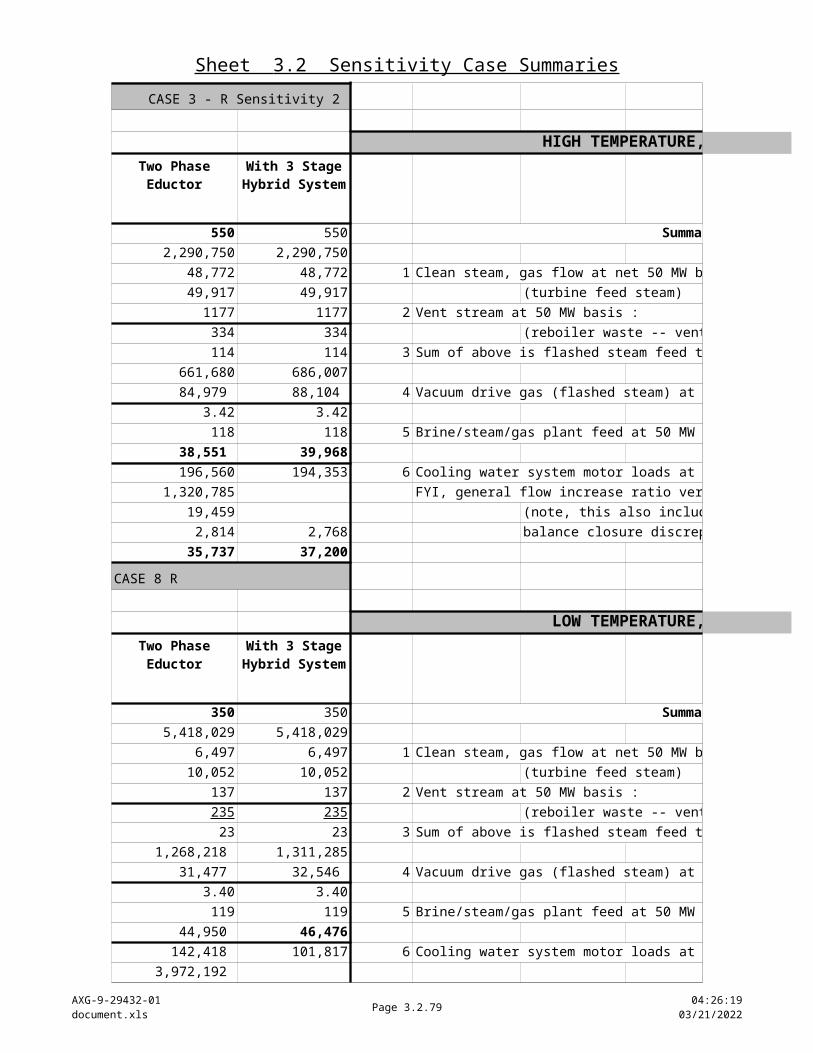
CASE 3 - R Sensitivity 2
HIGH TEMPERATURE, HIGH GAS, 60 DEG WET BULB 15% SJAE EFF
550 Summary of Reboiler Rates
2,290,750
48,772 1 Clean steam, gas flow at net 50 MW basis :
49,917 (turbine feed steam)
1177 2 Vent stream at 50 MW basis :
334 (reboiler waste -- vent to atm., treat or reinject)
114 3 Sum of above is flashed steam feed to reboiler :
686,007
88,104 4 Vacuum drive gas (flashed steam) at 50 MW basis :
3.42
118 5 Brine/steam/gas plant feed at 50 MW basis :
39,968
194,353 6 Cooling water system motor loads at 50 MW basis :
FYI, general flow increase ratio versus base case is :
(note, this also includes slight mass/energy
2,768 balance closure discrepancies)
37,200
CASE 8 R
LOW TEMPERATURE, LOW GAS, 60 DEG WET BULB .15 SJAE EFF
350 Summary of Reboiler Rates
5,418,029
6,497 1 Clean steam, gas flow at net 50 MW basis :
10,052 (turbine feed steam)
137 2 Vent stream at 50 MW basis :
235 (reboiler waste -- vent to atm., treat or reinject)
23 3 Sum of above is flashed steam feed to reboiler :
1,311,285
32,546 4 Vacuum drive gas (flashed steam) at 50 MW basis :
3.40
119 5 Brine/steam/gas plant feed at 50 MW basis :
46,476
101,817 6 Cooling water system motor loads at 50 MW basis :
FYI, general flow increase ratio versus base case is :
4,837
41,640
With 3 Stage Hybrid System
With 3 Stage Hybrid System
Sheet 3.2 Sensitivity Case Summaries
AXG-9-29432-01document.xls
Page 3.2.73 10:22:1804/18/2023
CASE 5 B
HIGH TEMPERATURE, MID GAS, 80 DEG F. WET BULB
550 Summary of Reboiler Rates
2,504,984
28,940 1 Clean steam, gas flow at net 50 MW basis :
30,437 (turbine feed steam)
1124 2 Vent stream at 50 MW basis :
344 (reboiler waste -- vent to atm., treat or reinject)
128 3 Sum of above is flashed steam feed to reboiler :
856,364
65,714 4 Vacuum drive gas (flashed steam) at 50 MW basis :
5.71
137 5 Brine/steam/gas plant feed at 50 MW basis :
46,094
78,655 6 Cooling water system motor loads at 50 MW basis :
FYI, general flow increase ratio versus base case is :
2967
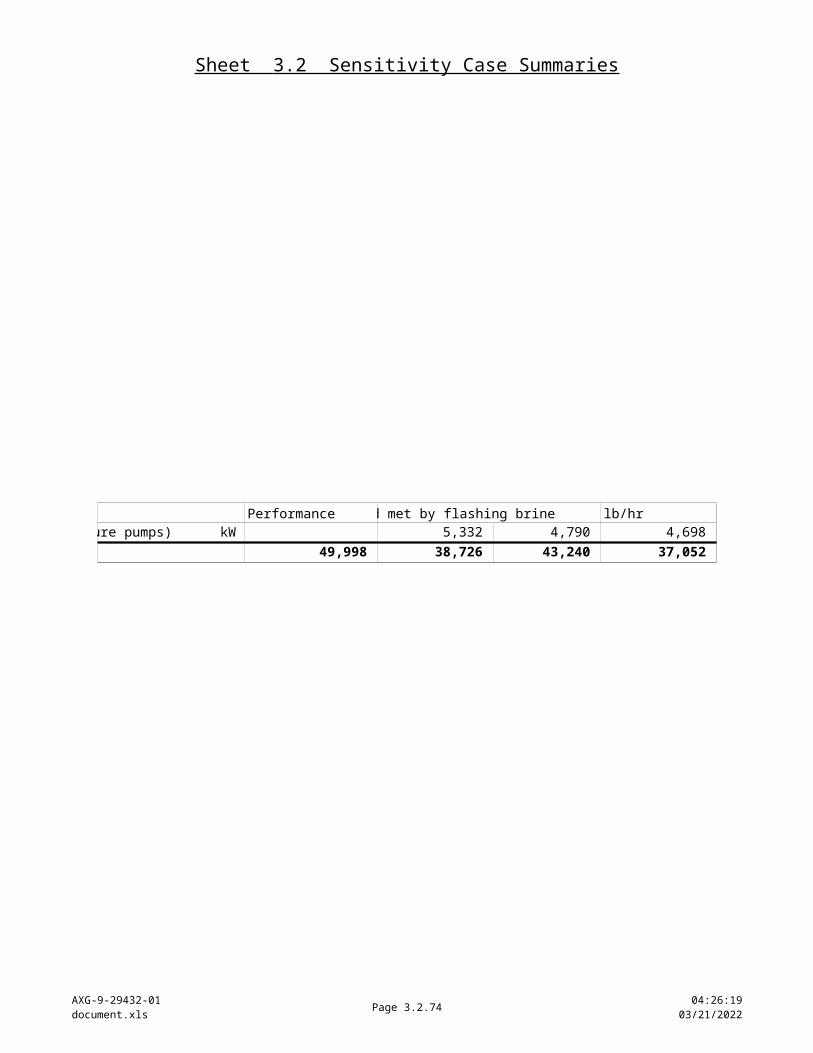
43,128
CASE 9 R
LOW TEMPERATURE, LOW GAS,80 DEG WET BULB 23%23%79%
350 Summary of Reboiler Rates
6,250,550
6,357 1 Clean steam, gas flow at net 50 MW basis :
10,148 (turbine feed steam)
137 2 Vent stream at 50 MW basis :
244 (reboiler waste -- vent to atm., treat or reinject)
27 3 Sum of above is flashed steam feed to reboiler :
1,507,188
37,770 4 Vacuum drive gas (flashed steam) at 50 MW basis :
5.66
138 5 Brine/steam/gas plant feed at 50 MW basis :
47,838
69,820 6 Cooling water system motor loads at 50 MW basis :
FYI, general flow increase ratio versus base case is :
5405
42,433
With 3 Stage Hybrid System
With 3 Stage Hybrid System
Sheet 3.2 Sensitivity Case Summaries
AXG-9-29432-01document.xls
Page 3.2.74 10:22:1804/18/2023
CASE 1 R Sensitivity 1
HIGH TEMPERATURE, HIGH GAS, 60 DEG WET BULB 23%23%23%
550 Summary of Reboiler Rates
2,288,428
48,134 1 Clean steam, gas flow at net 50 MW basis :
49,281 (turbine feed steam)
1175 2 Vent stream at 50 MW basis :
334 (reboiler waste -- vent to atm., treat or reinject)
114 3 Sum of above is flashed steam feed to reboiler :
732,614
92,829 4 Vacuum drive gas (flashed steam) at 50 MW basis :
3.42
118 5 Brine/steam/gas plant feed at 50 MW basis :
42,670
140,905 6 Cooling water system motor loads at 50 MW basis :
FYI, general flow increase ratio versus base case is :
2,756
39,914
CASE 7 R
LOW TEMPERATURE, LOW GAS, 60 DEG WET BULB 23%23%23%
LOW TEMPERATURE, LOW GAS, 60 DEG WET BULB 23%23%23%
350 Summary of Reboiler Rates
5,418,030
6,497 1 Clean steam, gas flow at net 50 MW basis :
10,051 (turbine feed steam)
137 2 Vent stream at 50 MW basis :
235 (reboiler waste -- vent to atm., treat or reinject)
23 3 Sum of above is flashed steam feed to reboiler :
1,340,669
33,274 4 Vacuum drive gas (flashed steam) at 50 MW basis :
3.40
119 5 Brine/steam/gas plant feed at 50 MW basis :
47,518
71,704 6 Cooling water system motor loads at 50 MW basis :
FYI, general flow increase ratio versus base case is :
4830
42,688
With 3 Stage Hybrid System
With 3 Stage Hybrid System
Sheet 3.2 Sensitivity Case Summaries
AXG-9-29432-01document.xls
Page 3.2.75 10:22:1804/18/2023
HIGH TEMPERATURE, HIGH GAS, 60 DEG WET BULB 15% SJAE EFF
Summary of Reboiler Rates
750,316 lb / hr
215,433 lb / hr
965,749 lb / hr
2,103 lb / hr
2,289,303 lb / hr
2,333 kW
0.999
LOW TEMPERATURE, LOW GAS, 60 DEG WET BULB .15 SJAE EFF
Summary of Reboiler Rates
1,374,901 lb / hr
68,517 lb / hr
1,443,418 lb / hr
2,123 lb / hr
5,417,628 lb / hr
4,698 kW
1.000
RETURN
Sheet 3.2 Sensitivity Case Summaries
AXG-9-29432-01document.xls
Page 3.2.76 10:22:1804/18/2023
HIGH TEMPERATURE, MID GAS, 80 DEG F. WET BULB
Summary of Reboiler Rates
859,851 lb / hr
139,609 lb / hr
999,460 lb / hr
1,093 lb / hr
2,504,534 lb / hr
2,695 kW
1.000
LOW TEMPERATURE, LOW GAS,80 DEG WET BULB 23%23%79%
Summary of Reboiler Rates
1,535,803 lb / hr
77,294 lb / hr
1,613,097 lb / hr
1,599 lb / hr
6,250,236 lb / hr
5,251 kW
1.000
RETURN
Sheet 3.2 Sensitivity Case Summaries
AXG-9-29432-01document.xls
Page 3.2.77 10:22:1804/18/2023
HIGH TEMPERATURE, HIGH GAS, 60 DEG WET BULB 23%23%23%
Summary of Reboiler Rates
751,275 lb / hr
212,418 lb / hr
963,692 lb / hr
2,064 lb / hr
2,287,028 lb / hr
2,337 kW
0.999
LOW TEMPERATURE, LOW GAS, 60 DEG WET BULB 23%23%23%
Summary of Reboiler Rates
1,374,902 lb / hr
68,515 lb / hr
1,443,417 lb / hr
2,123 lb / hr
5,417,630 lb / hr
4,698 kW
1.000
RETURN
AXG-9-29432-01document.xls Page 3.3.78 10:22:18
04/18/2023
Plot Data -- Engineering and Economic Figures of Merit versus Noncondensable Gas Levels
Case Group Descriptions Case Discriminators X AXIS Y AXISPlant Feed Temperatures Noncondensable Technical Figure of Merit
Gas Levels inPower Turbine
Feed Steam
Flash Flash Outlet part per millionInlet to Turbine by volume
ppmv
2-StageSteam Jet
SystemRatios of Technology Productivities
High temperature, Very high gas 550 334 99,600 1.00High temperature, High gas 49,900 1.00High temperature, Mid gas 29,900 1.00High temperature, Low gas 10,000 1.00
Low temperature, Low gas 350 234 10,000 1.00Low temperature, Mid gas 30,100 1.00Low temperature, High gas 50,100 1.00Low temperature, Very high gas 149,200 1.00
oF oF
Ratio of net plant power output for each gas removal option, divided by corresponding net power from a base case system employing 2-stage steam jet ejectors for gas removal. Net power derived by deducting power duty for gas removal. All other in-plant utilities assumed equal and outside of this balance.
Values less than 1 indicate technology consumes more power than 2-stage ejector system for gas removal.
Values greater than 1 indicate alternative technology consumes proportionally less power than 2-stage ejector system.
AXG-9-29432-01document.xls Page 3.3.79 10:22:19
04/18/2023
0 20,000 40,000 60,000 80,000 100,000 120,000 140,000 160,0000.00
0.40
0.80
1.20
1.60
2.00
2.40
2.80
3.20
3.60
4.00
4.40
FIGURE 70LOW TEMPERATURE CASES -- TECHNICAL FIGURE OF MERIT
3-Stage TurboLinear (3-Stage Turbo)ReboilerLinear (Reboiler)Biphase EductorLinear (Biphase Eductor)Hybrid -- Ejector & TurboLinear (Hybrid -- Ejector & Turbo)
NCG in Flashed Steam (ppmv)
Net
Pla
nt
Po
wer
Pro
du
ctiv
ity
Ver
sus
a 2-
Sta
ge
Eje
cto
r S
yste
m
Base Case reference at 1.00
AXG-9-29432-01document.xls Page 3.3.80 10:22:19
04/18/2023
10,000 30,100 50,100 149,2000
100
200
300
400
500
600
FIGURE 80LOW TEMPERATURE CASES -- ECONOMIC FIGURE OF MERIT
3-Stage Turbo
Reboiler
Biphase Eductor
Hybrid -- Ejector & Turbo
NCG in Flashed Steam (ppmv)
Sim
ple
Payb
ack P
eri
od
fo
r R
etr
ofi
t G
as R
em
oval In
sta
llati
on
s
2-stage ejector system is basis for comparison for retrofit gas removal system options. Therefore, an ejector system has no payback period.
0 20,000 40,000 60,000 80,000 100,000 120,000
0.95
1.00
1.05
1.10
1.15
1.20
1.25
FIGURE 90HIGH TEMPERATURE CASES -- TECHNICAL FIGURE OF MERIT
2-Stage Ejectors 3-Stage Turbo Reboiler Biphase Eductor
Hybrid -- Ejector & Turbo
NCG in Flashed Steam (ppmv)
Ne
t P
lan
t P
ow
er
Pro
du
cti
vit
y
Ve
rsu
s a
2-S
tag
e E
jec
tor
Sy
ste
m
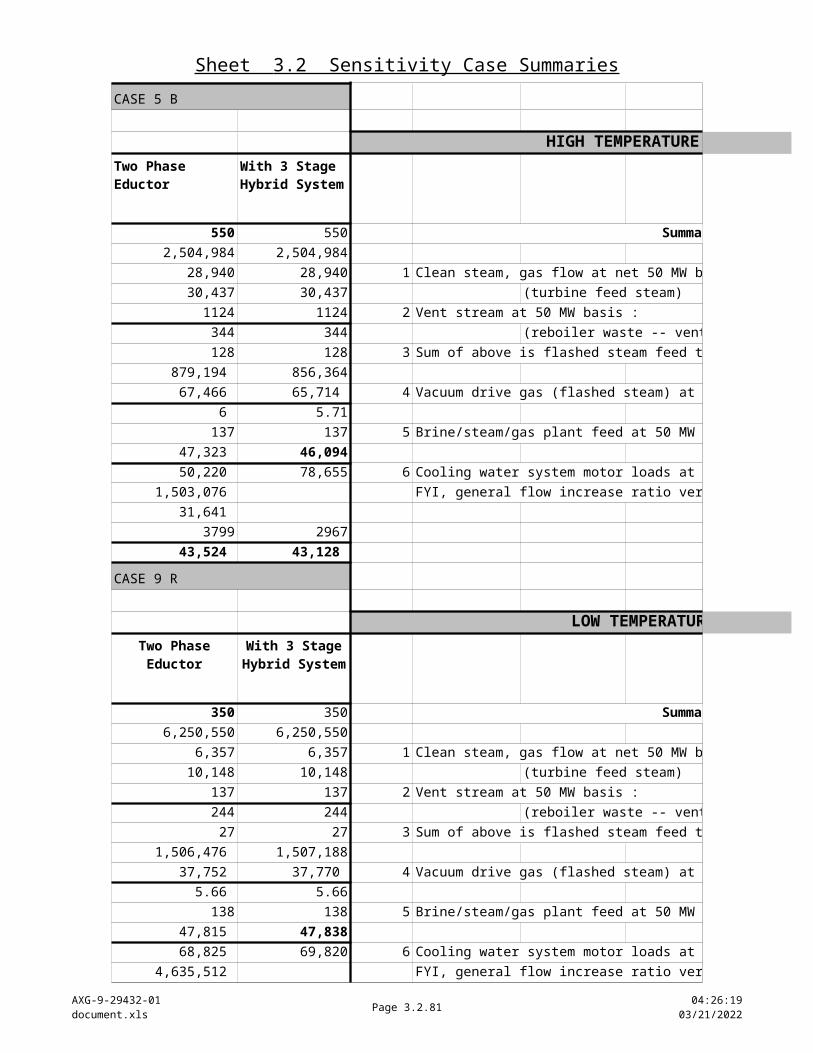
AXG-9-29432-01document.xls Page 3.3.81 10:22:19
04/18/2023
99,600 49,900 29,900 10,000-10
-5
0
5
10
15
20
25
30
35
40
FIGURE 100HIGH TEMPERATURE CASES -- ECONOMIC FIGURE OF MERIT
3-Stage Turbo Reboiler Biphase Eductor Hybrid -- Ejector & Turbo
NCG in Flashed Steam (ppmv)
Sim
ple
Payb
ack
Perio
d fo
r R
etro
fit G
as R
emov
al In
stal
latio
ns
A 2-stage ejector system is the basis for comparison for retrofit gas removal sys-tem options. Therefore, an ejector sys-tem has no payback period.
Negative payback periods indicate the alter-native gas removal technology actually loses money compared to a steam jet ejector sys-tem -- payback is unattainable.
0 20,000 40,000 60,000 80,000 100,000 120,000
0.95
1.00
1.05
1.10
1.15
1.20
1.25
FIGURE 90HIGH TEMPERATURE CASES -- TECHNICAL FIGURE OF MERIT
2-Stage Ejectors 3-Stage Turbo Reboiler Biphase Eductor
Hybrid -- Ejector & Turbo
NCG in Flashed Steam (ppmv)
Ne
t P
lan
t P
ow
er
Pro
du
cti
vit
y
Ve
rsu
s a
2-S
tag
e E
jec
tor
Sy
ste
m
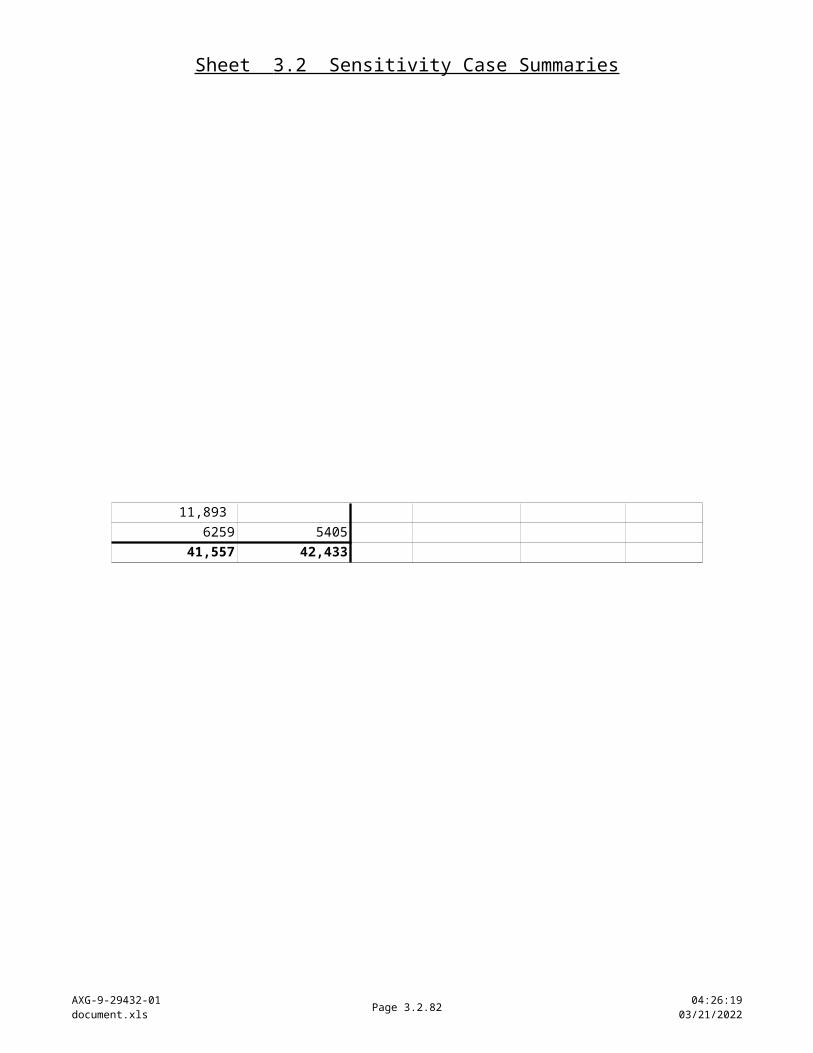
AXG-9-29432-01document.xls Page 3.3.82 10:22:19
04/18/2023
99,600 49,900 29,900 10,000-10
-5
0
5
10
15
20
25
30
35
40
FIGURE 100HIGH TEMPERATURE CASES -- ECONOMIC FIGURE OF MERIT
3-Stage Turbo Reboiler Biphase Eductor Hybrid -- Ejector & Turbo
NCG in Flashed Steam (ppmv)
Sim
ple
Payb
ack
Perio
d fo
r R
etro
fit G
as R
emov
al In
stal
latio
ns
A 2-stage ejector system is the basis for comparison for retrofit gas removal sys-tem options. Therefore, an ejector sys-tem has no payback period.
Negative payback periods indicate the alter-native gas removal technology actually loses money compared to a steam jet ejector sys-tem -- payback is unattainable.
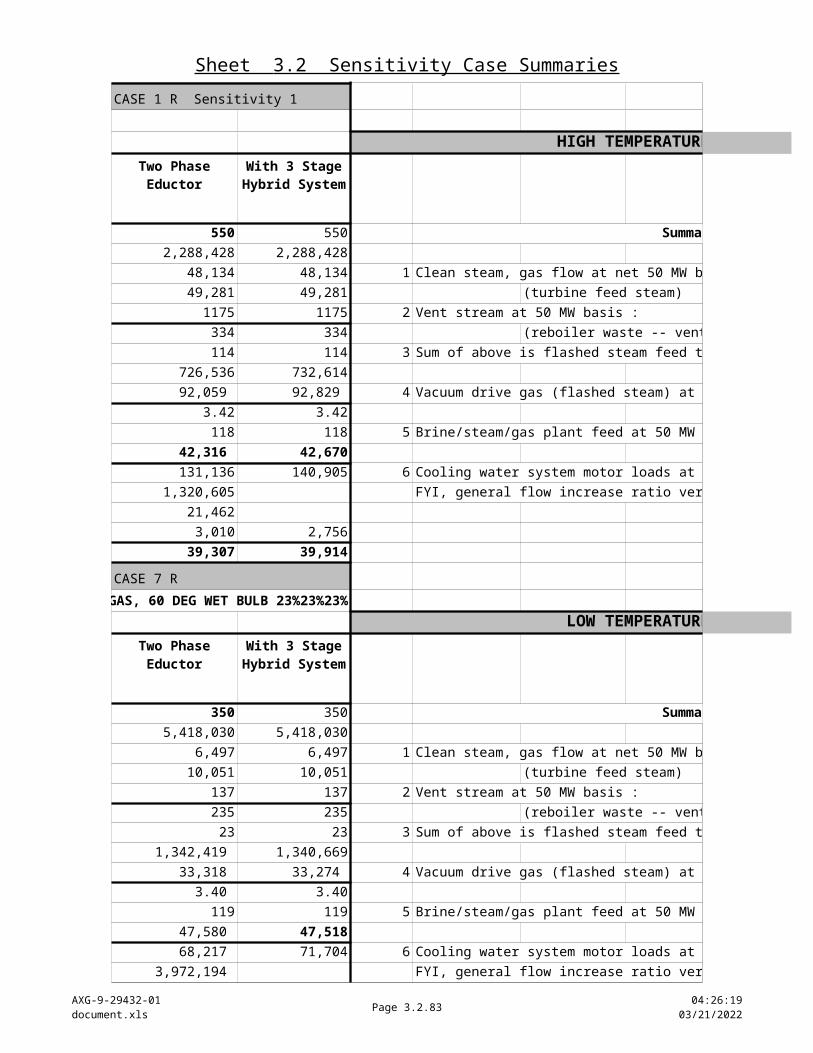
AXG-9-29432-01document.xls Page 3.3.83 10:22:19
04/18/2023
Plot Data -- Engineering and Economic Figures of Merit versus Noncondensable Gas Levels
Y AXIS Y AXISTechnical Figure of Merit Technical Figure of Merit
3-Stage Reboiler Biphase Hybrid -- 2-Stage 3-Stage Reboiler BiphaseTurbocomp. System Eductor 3rd Stage Steam Jet Turbocomp. System Eductor
System System Turbocomp. System System SystemRatios of Technology Productivities Simple Payback Periods (years)
Figure 90 Figure 1001.09 1.01 0.98 1.07 N/A 30.51 86.48 -6.301.06 1.01 1.02 1.05 N/A 8.4 -100.9 13.51.04 1.01 1.03 1.03 N/A 5.4 -38.7 7.61.01 1.00 1.02 1.01 N/A 11.4 -23.3 7.7
Figure 70 Figure 801.07 1.07 1.02 1.05 N/A 2.6 15.3 539.11.22 1.26 1.03 1.16 N/A 2.3 3.3 32.51.38 1.48 1.04 1.25 N/A 3.7 2.1 33.32.04 4.28 1.29 1.59 N/A 107.3 1.0 6.8
Ratio of net plant power output for each gas removal option, divided by corresponding net power from a base case system employing 2-stage steam jet ejectors for gas removal. Net power derived by deducting power duty for gas removal. All other in-plant utilities assumed equal and outside of this balance.
Values less than 1 indicate technology consumes more power than 2-stage ejector system for gas removal.
Values greater than 1 indicate alternative technology consumes proportionally less power than 2-stage ejector system.
Ratio of capital costs of gas removal alternatives to their net savings as the value of avoided gas removal energy. Basis of energy savings is the gas removal duty for the 2-stage steam jet ejector system. This yields a simple payback period value as years to recover capital costs for each gas removal alternative.
Negative values indicate alternative gas removal system costs more to operate than a 2-stage ejector system -- payback will not happen based on energy savings.
RETURN
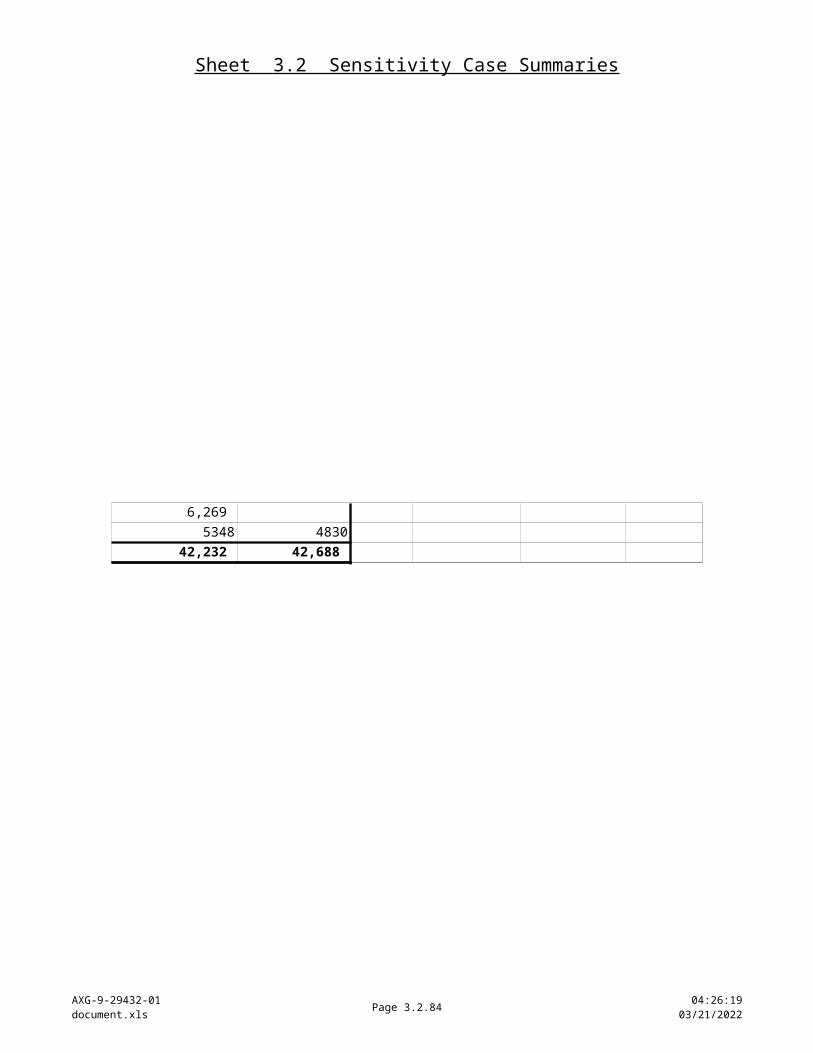
AXG-9-29432-01document.xls Page 3.3.84 10:22:19
04/18/2023
0 20,000 40,000 60,000 80,000 100,000 120,000 140,000 160,0000.00
0.40
0.80
1.20
1.60
2.00
2.40
2.80
3.20
3.60
4.00
4.40
FIGURE 70LOW TEMPERATURE CASES -- TECHNICAL FIGURE OF MERIT
3-Stage TurboLinear (3-Stage Turbo)ReboilerLinear (Reboiler)Biphase EductorLinear (Biphase Eductor)Hybrid -- Ejector & TurboLinear (Hybrid -- Ejector & Turbo)
NCG in Flashed Steam (ppmv)
Net
Pla
nt
Po
wer
Pro
du
ctiv
ity
Ver
sus
a 2-
Sta
ge
Eje
cto
r S
yste
m
Base Case reference at 1.00
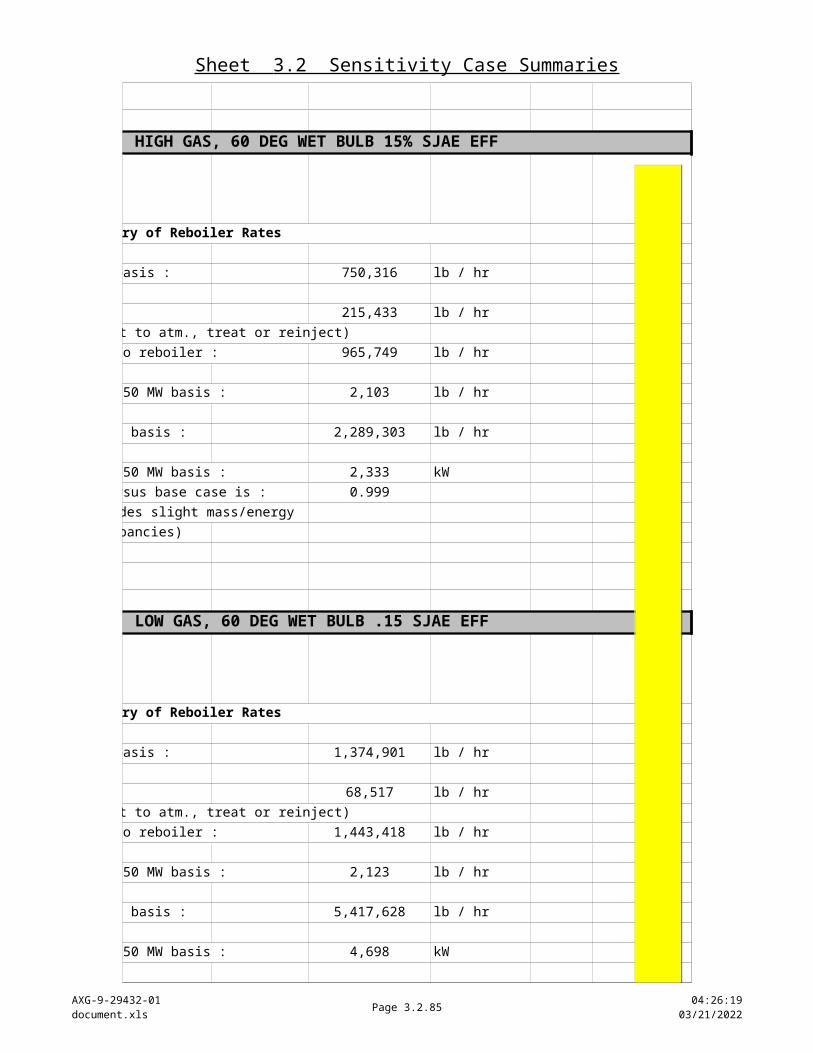
AXG-9-29432-01document.xls Page 3.3.85 10:22:19
04/18/2023
10,000 30,100 50,100 149,2000
100
200
300
400
500
600
FIGURE 80LOW TEMPERATURE CASES -- ECONOMIC FIGURE OF MERIT
3-Stage Turbo
Reboiler
Biphase Eductor
Hybrid -- Ejector & Turbo
NCG in Flashed Steam (ppmv)
Sim
ple
Payb
ack P
eri
od
fo
r R
etr
ofi
t G
as R
em
oval In
sta
llati
on
s
2-stage ejector system is basis for comparison for retrofit gas removal system options. Therefore, an ejector system has no payback period.
0 20,000 40,000 60,000 80,000 100,000 120,000
0.95
1.00
1.05
1.10
1.15
1.20
1.25
FIGURE 90HIGH TEMPERATURE CASES -- TECHNICAL FIGURE OF MERIT
2-Stage Ejectors 3-Stage Turbo Reboiler Biphase Eductor
Hybrid -- Ejector & Turbo
NCG in Flashed Steam (ppmv)
Ne
t P
lan
t P
ow
er
Pro
du
cti
vit
y
Ve
rsu
s a
2-S
tag
e E
jec
tor
Sy
ste
m
AXG-9-29432-01document.xls Page 3.3.86 10:22:19
04/18/2023
99,600 49,900 29,900 10,000-10
-5
0
5
10
15
20
25
30
35
40
FIGURE 100HIGH TEMPERATURE CASES -- ECONOMIC FIGURE OF MERIT
3-Stage Turbo Reboiler Biphase Eductor Hybrid -- Ejector & Turbo
NCG in Flashed Steam (ppmv)
Sim
ple
Payb
ack
Perio
d fo
r R
etro
fit G
as R
emov
al In
stal
latio
ns
A 2-stage ejector system is the basis for comparison for retrofit gas removal sys-tem options. Therefore, an ejector sys-tem has no payback period.
Negative payback periods indicate the alter-native gas removal technology actually loses money compared to a steam jet ejector sys-tem -- payback is unattainable.
0 20,000 40,000 60,000 80,000 100,000 120,000
0.95
1.00
1.05
1.10
1.15
1.20
1.25
FIGURE 90HIGH TEMPERATURE CASES -- TECHNICAL FIGURE OF MERIT
2-Stage Ejectors 3-Stage Turbo Reboiler Biphase Eductor
Hybrid -- Ejector & Turbo
NCG in Flashed Steam (ppmv)
Ne
t P
lan
t P
ow
er
Pro
du
cti
vit
y
Ve
rsu
s a
2-S
tag
e E
jec
tor
Sy
ste
m
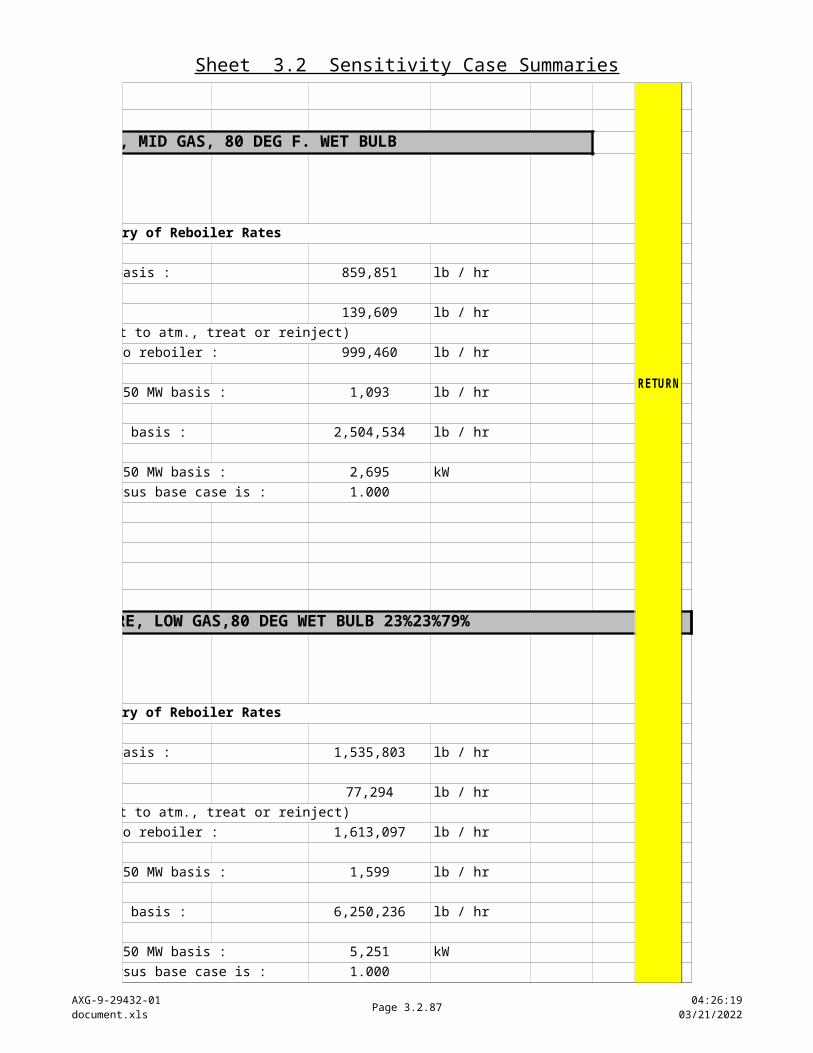
AXG-9-29432-01document.xls Page 3.3.87 10:22:19
04/18/2023
99,600 49,900 29,900 10,000-10
-5
0
5
10
15
20
25
30
35
40
FIGURE 100HIGH TEMPERATURE CASES -- ECONOMIC FIGURE OF MERIT
3-Stage Turbo Reboiler Biphase Eductor Hybrid -- Ejector & Turbo
NCG in Flashed Steam (ppmv)
Sim
ple
Payb
ack
Perio
d fo
r R
etro
fit G
as R
emov
al In
stal
latio
ns
A 2-stage ejector system is the basis for comparison for retrofit gas removal sys-tem options. Therefore, an ejector sys-tem has no payback period.
Negative payback periods indicate the alter-native gas removal technology actually loses money compared to a steam jet ejector sys-tem -- payback is unattainable.
AXG-9-29432-01document.xls Page 3.3.88 10:22:19
04/18/2023
Plot Data -- Engineering and Economic Figures of Merit versus Noncondensable Gas Levels
Y AXISTechnical Figure of Merit
Hybrid -- 3rd Stage
Turbocomp.Simple Payback Periods (years)
4.482.11.51.5
0.90.71.29.9
Ratio of capital costs of gas removal alternatives to their net savings as the value of avoided gas removal energy. Basis of energy savings is the gas removal duty for the 2-stage steam jet ejector system. This yields a simple payback period value as years to recover capital costs for each gas removal alternative.
Negative values indicate alternative gas removal system costs more to operate than a 2-stage ejector system -- payback will not happen based on energy savings.
RETURN
RETURN
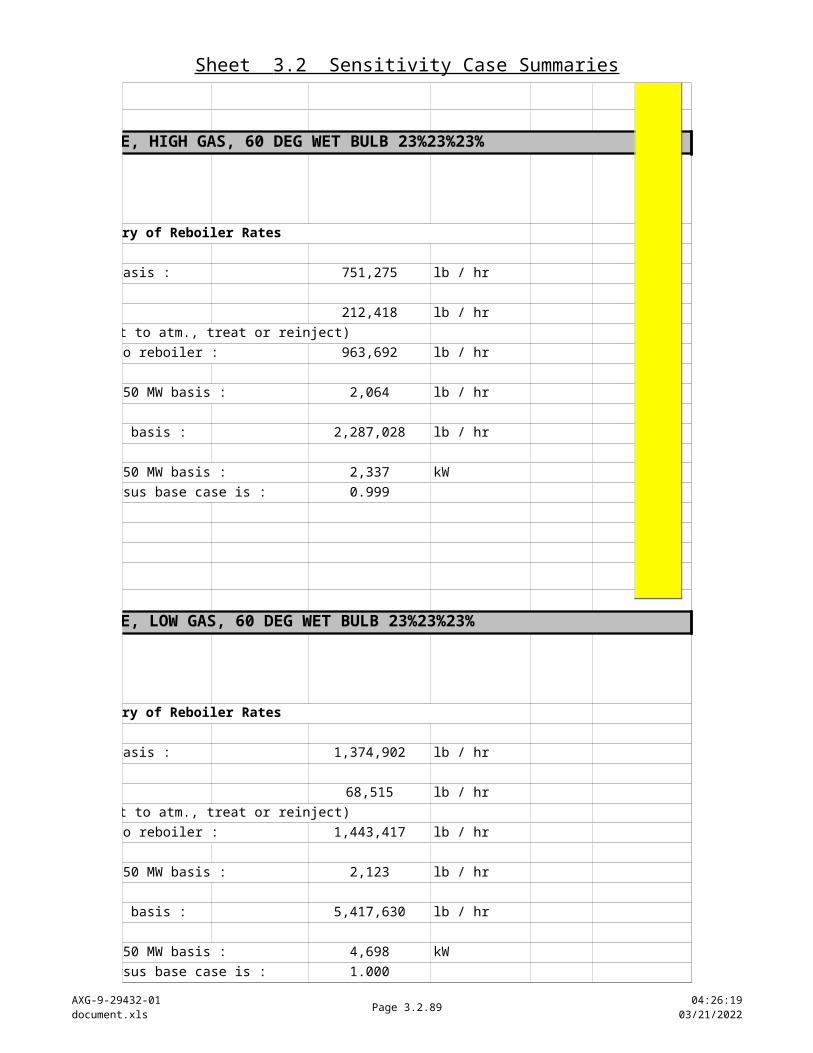
AXG-9-29432-01document.xls Page 3.3.89 10:22:19
04/18/2023
0 20,000 40,000 60,000 80,000 100,000 120,000 140,000 160,0000.00
0.40
0.80
1.20
1.60
2.00
2.40
2.80
3.20
3.60
4.00
4.40
FIGURE 70LOW TEMPERATURE CASES -- TECHNICAL FIGURE OF MERIT
3-Stage TurboLinear (3-Stage Turbo)ReboilerLinear (Reboiler)Biphase EductorLinear (Biphase Eductor)Hybrid -- Ejector & TurboLinear (Hybrid -- Ejector & Turbo)
NCG in Flashed Steam (ppmv)
Net
Pla
nt
Po
wer
Pro
du
ctiv
ity
Ver
sus
a 2-
Sta
ge
Eje
cto
r S
yste
m
Base Case reference at 1.00
RETURN
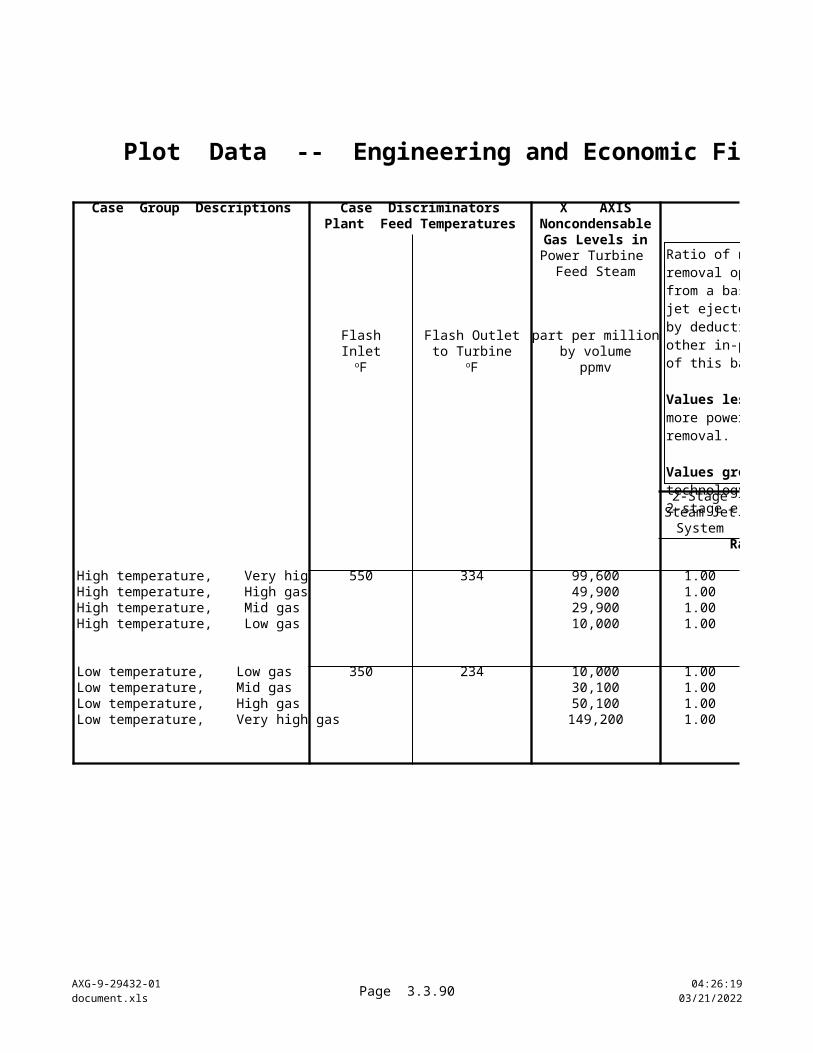
AXG-9-29432-01document.xls Page 3.3.90 10:22:20
04/18/2023
10,000 30,100 50,100 149,2000
100
200
300
400
500
600
FIGURE 80LOW TEMPERATURE CASES -- ECONOMIC FIGURE OF MERIT
3-Stage Turbo
Reboiler
Biphase Eductor
Hybrid -- Ejector & Turbo
NCG in Flashed Steam (ppmv)
Sim
ple
Payb
ack P
eri
od
fo
r R
etr
ofi
t G
as R
em
oval In
sta
llati
on
s
2-stage ejector system is basis for comparison for retrofit gas removal system options. Therefore, an ejector system has no payback period.
0 20,000 40,000 60,000 80,000 100,000 120,000
0.95
1.00
1.05
1.10
1.15
1.20
1.25
FIGURE 90HIGH TEMPERATURE CASES -- TECHNICAL FIGURE OF MERIT
2-Stage Ejectors 3-Stage Turbo Reboiler Biphase Eductor
Hybrid -- Ejector & Turbo
NCG in Flashed Steam (ppmv)
Ne
t P
lan
t P
ow
er
Pro
du
cti
vit
y
Ve
rsu
s a
2-S
tag
e E
jec
tor
Sy
ste
m
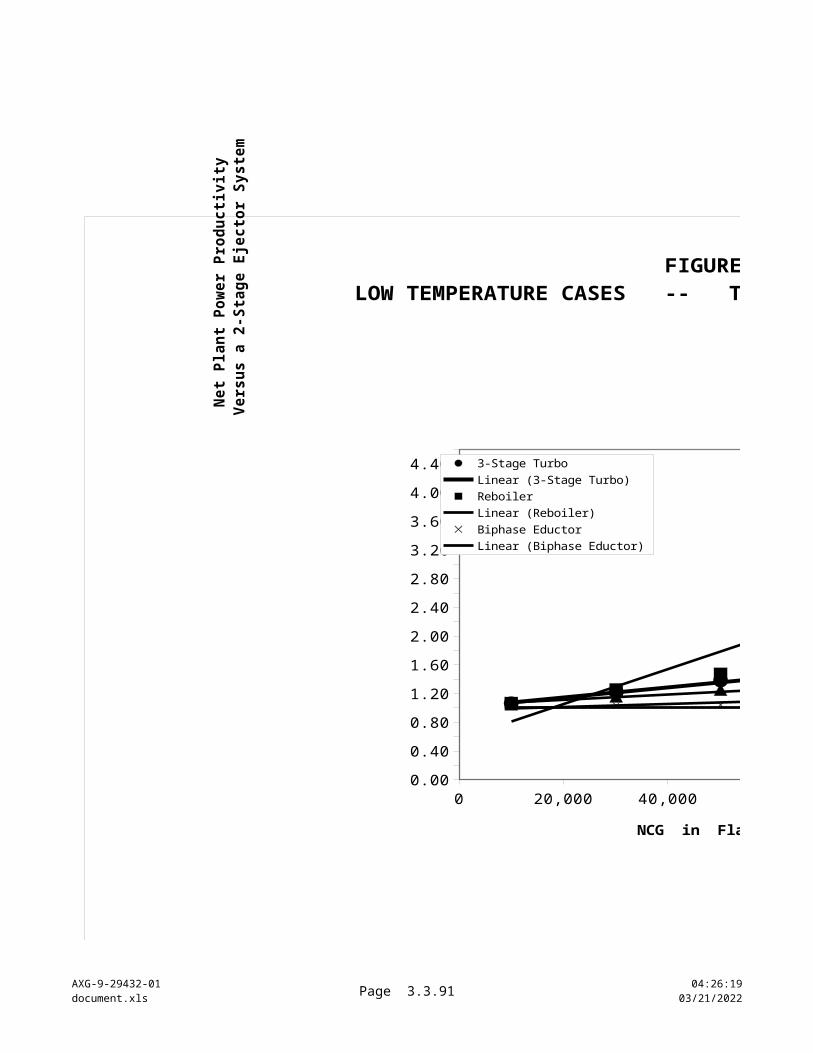
AXG-9-29432-01document.xls Page 3.3.91 10:22:20
04/18/2023
99,600 49,900 29,900 10,000-10
-5
0
5
10
15
20
25
30
35
40
FIGURE 100HIGH TEMPERATURE CASES -- ECONOMIC FIGURE OF MERIT
3-Stage Turbo Reboiler Biphase Eductor Hybrid -- Ejector & Turbo
NCG in Flashed Steam (ppmv)
Sim
ple
Payb
ack
Perio
d fo
r R
etro
fit G
as R
emov
al In
stal
latio
ns
A 2-stage ejector system is the basis for comparison for retrofit gas removal sys-tem options. Therefore, an ejector sys-tem has no payback period.
Negative payback periods indicate the alter-native gas removal technology actually loses money compared to a steam jet ejector sys-tem -- payback is unattainable.
0 20,000 40,000 60,000 80,000 100,000 120,000
0.95
1.00
1.05
1.10
1.15
1.20
1.25
FIGURE 90HIGH TEMPERATURE CASES -- TECHNICAL FIGURE OF MERIT
2-Stage Ejectors 3-Stage Turbo Reboiler Biphase Eductor
Hybrid -- Ejector & Turbo
NCG in Flashed Steam (ppmv)
Ne
t P
lan
t P
ow
er
Pro
du
cti
vit
y
Ve
rsu
s a
2-S
tag
e E
jec
tor
Sy
ste
m
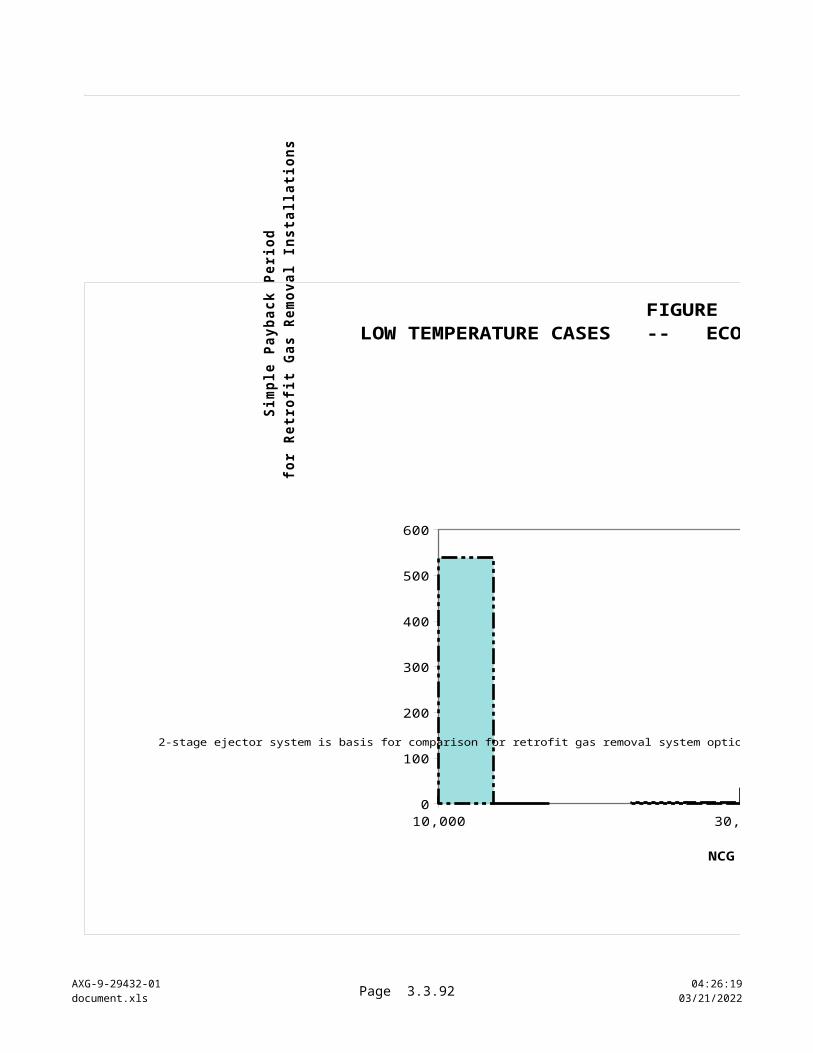
AXG-9-29432-01document.xls Page 3.3.92 10:22:20
04/18/2023
99,600 49,900 29,900 10,000-10
-5
0
5
10
15
20
25
30
35
40
FIGURE 100HIGH TEMPERATURE CASES -- ECONOMIC FIGURE OF MERIT
3-Stage Turbo Reboiler Biphase Eductor Hybrid -- Ejector & Turbo
NCG in Flashed Steam (ppmv)
Sim
ple
Payb
ack
Perio
d fo
r R
etro
fit G
as R
emov
al In
stal
latio
ns
A 2-stage ejector system is the basis for comparison for retrofit gas removal sys-tem options. Therefore, an ejector sys-tem has no payback period.
Negative payback periods indicate the alter-native gas removal technology actually loses money compared to a steam jet ejector sys-tem -- payback is unattainable.
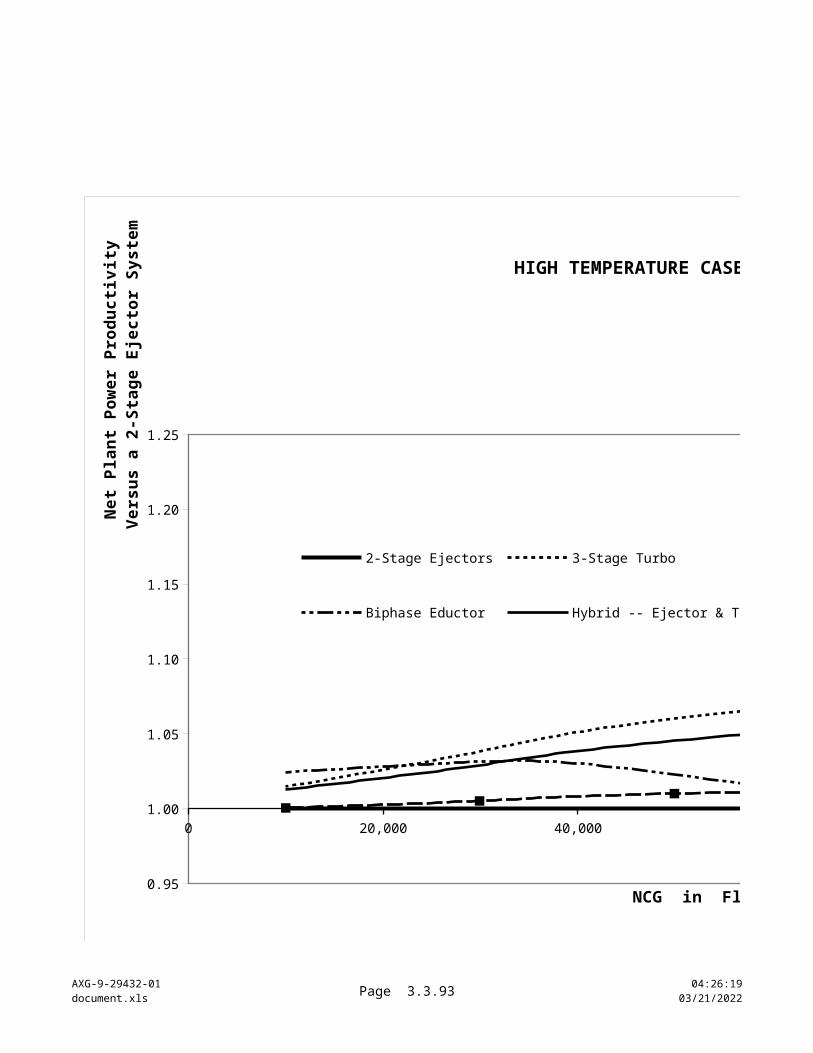
AXG-9-29432-01]document.xls
Page 3.3a.93 10:22:2004/18/2023
Plot Data : Engineering and Economic Figures of Merit versus Noncondensable Gas Levels
Case Group Descriptions Case Discriminators X AXIS Y AXISPlant Feed Temperatures Noncondensable Technical Figure of Merit
Gas Levels inPower Turbine
Feed Steam
Flash Flash Outlet part per millionInlet to Turbine by volume
ppmv
2-StageSteam Jet
SystemRatios of Technology Productivities
High temperature, Very high gas 550 334 99,600 1.00High temperature, High gas 49,900 1.00High temperature, Mid gas 29,900 1.00High temperature, Low gas 10,000 1.00
Low temperature, Low gas 350 235 10,000 1.00Low temperature, Mid gas 30,100 1.00Low temperature, High gas 50,100 1.00Low temperature, Very high gas 149,200 1.00
oF oF
Ratio of net plant power output for each gas removal option, divided by corresponding net power from a base case system employing 2-stage steam jet ejectors for gas removal. Net power derived by deducting power duty for gas removal. All other in-plant utilities assumed equal and outside of this balance.
Values less than 1 indicate technology consumes more power than 2-stage ejector system for gas removal.
Values greater than 1 indicate alternative technology consumes proportionally less power than 2-stage ejector system for gas removal.
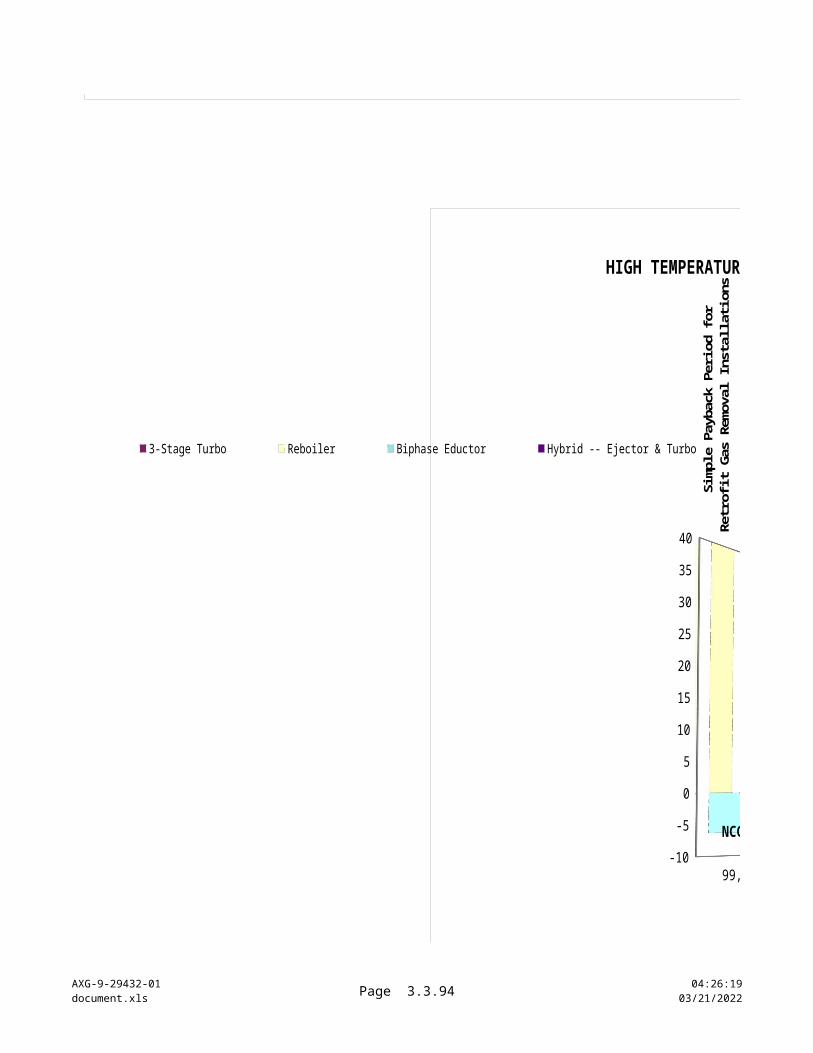
AXG-9-29432-01]document.xls
Page 3.3a.94 10:22:2004/18/2023
0 20,000 40,000 60,000 80,000 100,000 120,000 140,000 160,000
0.50
1.00
1.50
2.00
2.50
3.00
3.50
4.00
4.50
5.00
FIGURE 7LOW TEMPERATURE CASES -- TECHNICAL FIGURE OF MERIT
2-Stage Ejectors
3-Stage Turbo
Reboiler
Biphase Eductor
Hybrid -- Ejector & Turbo
NCG in Flashed Steam (ppmv)
Ne
t P
lan
t P
ow
er
Pro
du
cti
vit
y
Ve
rsu
s a
2-S
tag
e E
jec
tor
Sy
ste
m

AXG-9-29432-01]document.xls
Page 3.3a.95 10:22:2004/18/2023
CALCULATION BASES :Nominal Discount Rate =
Project life at time of estimated NPV :Contract Price of Electricity =
0 20,000 40,000 60,000 80,000 100,000 120,000 140,000 160,000
($ 35,000,000)
($ 30,000,000)
($ 25,000,000)
($ 20,000,000)
($ 15,000,000)
($ 10,000,000)
($ 5,000,000)
$ 0
$ 5,000,000
$ 10,000,000
$ 15,000,000
$ 20,000,000
$ 25,000,000
$ 30,000,000
FIGURE 8LOW TEMPERATURE CASES -- ECONOMIC FIGURE OF MERIT
3-Stage Turbo
Reboiler
Biphase Eductor
Hybrid -- Ejector & Turbo
NCG in Flashed Steam (ppmv)
Ne
t P
res
en
t V
alu
es
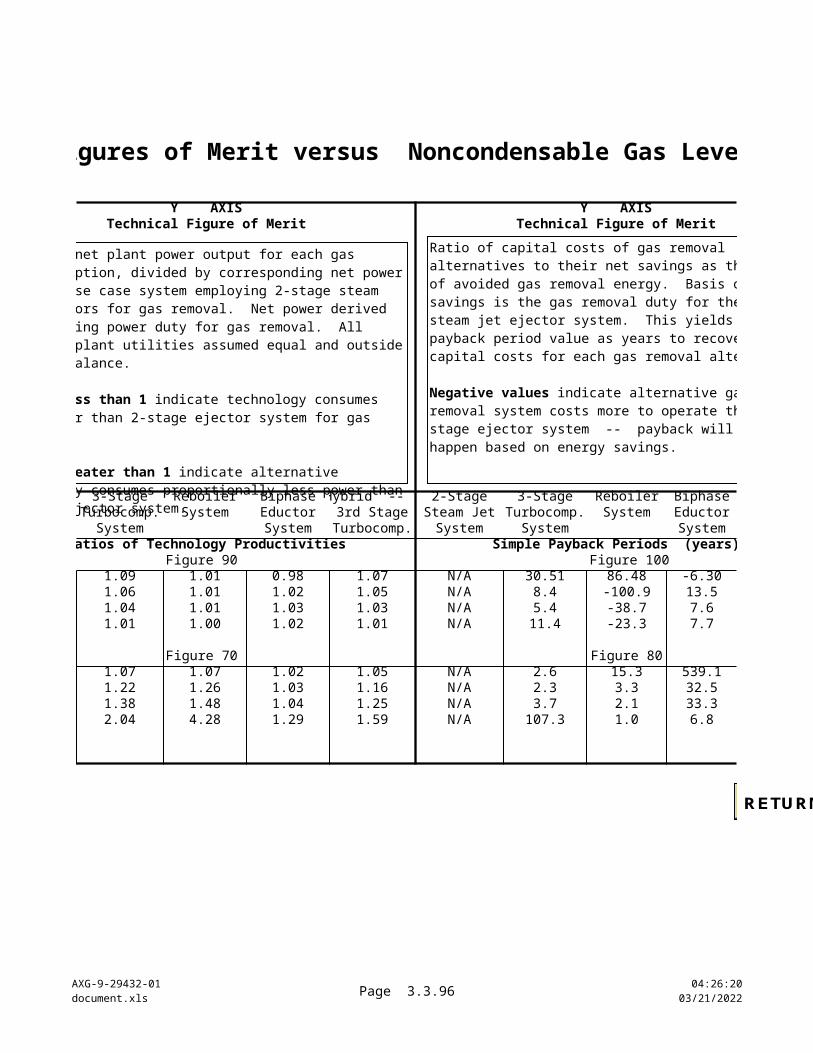
AXG-9-29432-01]document.xls
Page 3.3a.96 10:22:2004/18/2023
0 20,000 40,000 60,000 80,000 100,000 120,000
0.95
1.00
1.05
1.10
1.15
FIGURE 9HIGH TEMPERATURE CASES -- TECHNICAL FIGURE OF MERIT
2-Stage Ejectors
3-Stage Turbo
Reboiler
Biphase Eductor
Hybrid -- Ejector & Turbo
NCG in Flashed Steam (ppmv)
Ne
t P
lan
t P
ow
er
Pro
du
cti
vit
y
Vers
us
a 2
-Sta
ge E
jec
tor
Sys
tem
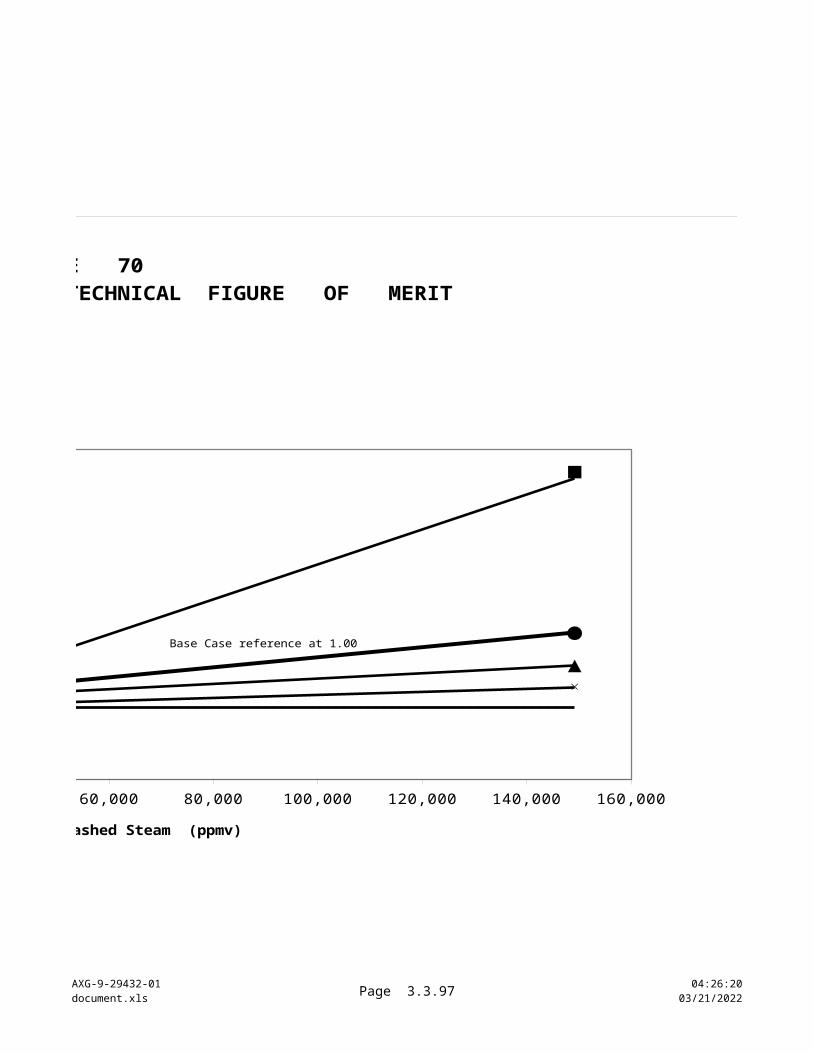
AXG-9-29432-01]document.xls
Page 3.3a.97 10:22:2004/18/2023
CALCULATION BASES :Nominal Discount Rate = 10.0%
Project life at time of estimated NPV : 10
0 20,000 40,000 60,000 80,000 100,000 120,000
-$ 10,000,000
-$ 9,000,000
-$ 8,000,000
-$ 7,000,000
-$ 6,000,000
-$ 5,000,000
-$ 4,000,000
-$ 3,000,000
-$ 2,000,000
-$ 1,000,000
$ 0
$ 1,000,000
$ 2,000,000
$ 3,000,000
FIGURE 10HIGH TEMPERATURE CASES -- ECONOMIC FIGURE OF MERIT
3-Stage Turbo Reboiler
Biphase Eductor Hybrid -- Ejector & Turbo
NCG in Flashed Steam (ppmv)
Net
Pre
sen
t V
alu
es
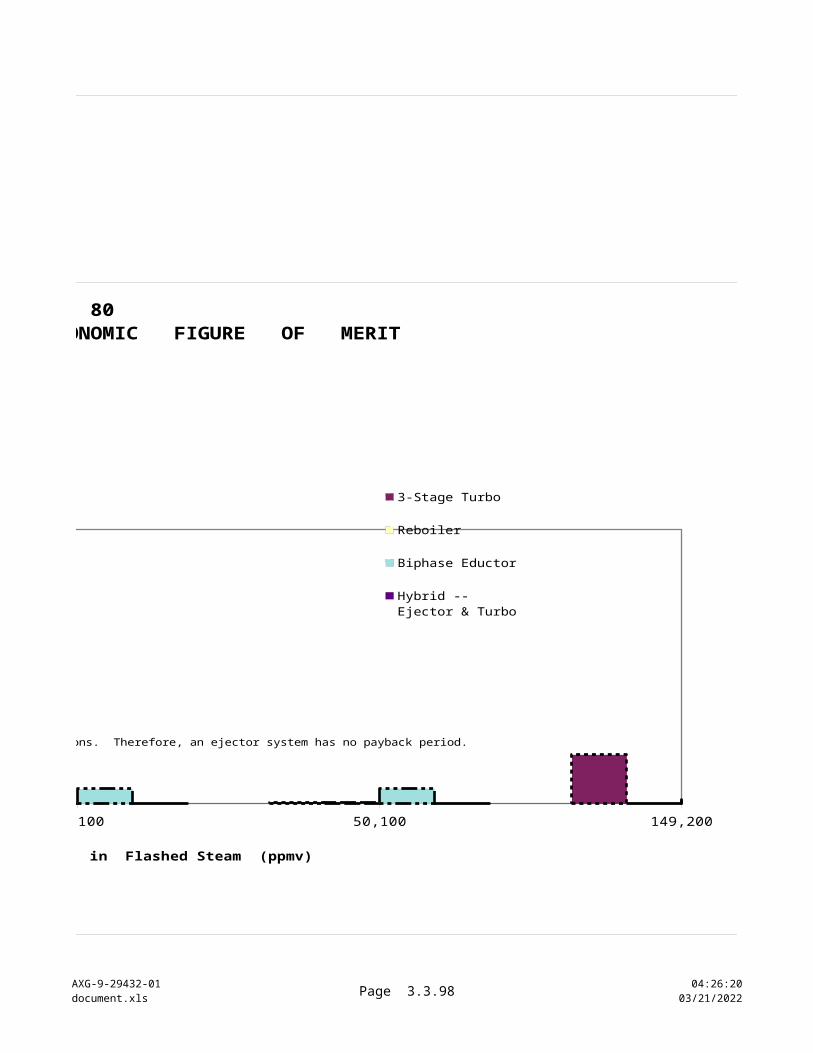
AXG-9-29432-01]document.xls
Page 3.3a.98 10:22:2004/18/2023
Contract Price of Electricity = $ 0.040
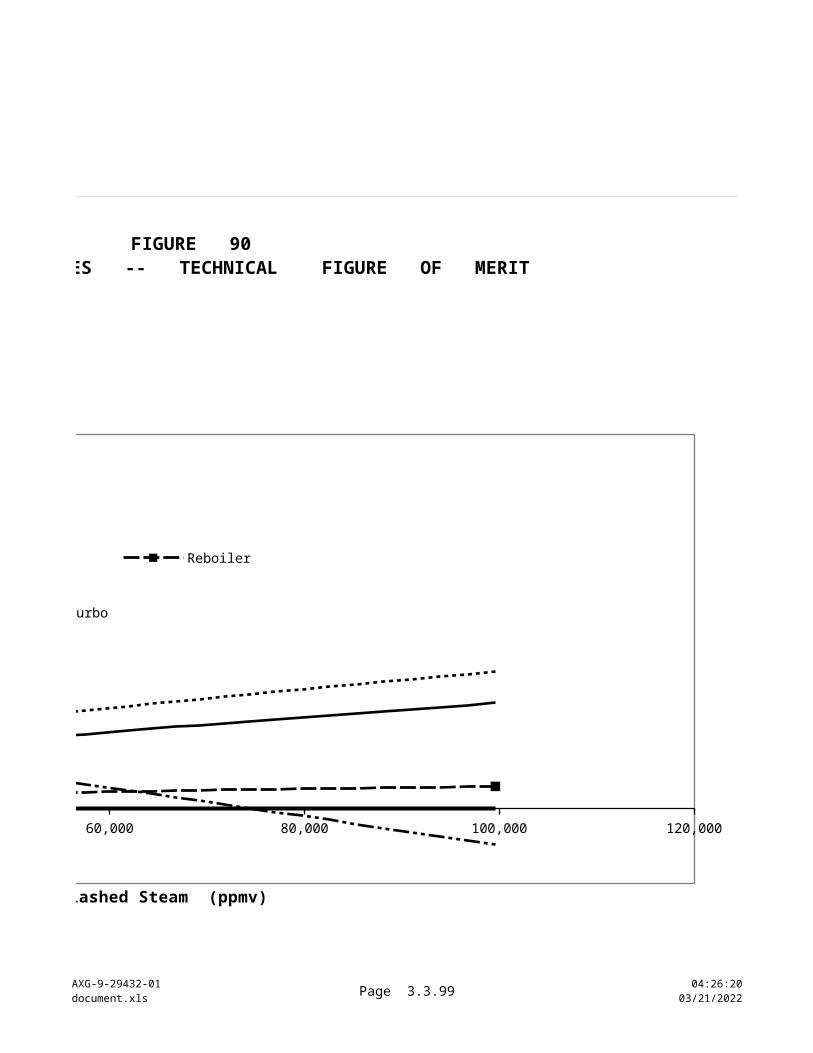
AXG-9-29432-01]document.xls
Page 3.3a.99 10:22:2004/18/2023
Plot Data : Engineering and Economic Figures of Merit versus Noncondensable Gas Levels
Y AXIS Y AXISTechnical Figure of Merit Economic Figure of Merit
3-Stage Reboiler Biphase Hybrid -- 2-Stage 3-Stage Reboiler BiphaseTurbocomp. System Eductor 3rd Stage Steam Jet Turbocomp. System Eductor
System System Turbocomp. System System SystemRatios of Technology Productivities Net Present Value at Time + 10
Applied Price of Electricity = $ 0.0400 1.09 1.01 0.98 1.07 N/A $ (8,310,000) $ (3,910,000) $ (3,150,000)1.06 1.01 1.02 1.05 N/A $ (1,540,000) $ (4,590,000) $ (980,000)1.04 1.01 1.03 1.03 N/A $ (130,000) $ (5,040,000) $ (400,000)1.01 1.00 1.02 1.01 N/A $ (800,000) $ (5,510,000) $ (550,000)High-Temperature Cases High-Temperature Cases
1.07 1.07 1.02 1.05 N/A $ 1,690,000 $ (3,910,000) $ (3,280,000)1.22 1.26 1.03 1.16 N/A $ 5,180,000 $ 4,000,000 $ (2,690,000)1.38 1.48 1.04 1.25 N/A $ 3,740,000 $ 9,440,000 $ (2,660,000)2.04 4.28 1.29 1.59 N/A $ (26,300,000) $ 20,070,000 $ (1,560,000)Low-Temperature Cases Low-Temperature Cases
Ratio of net plant power output for each gas removal option, divided by corresponding net power from a base case system employing 2-stage steam jet ejectors for gas removal. Net power derived by deducting power duty for gas removal. All other in-plant utilities assumed equal and outside of this balance.
Values less than 1 indicate technology consumes more power than 2-stage ejector system for gas removal.
Values greater than 1 indicate alternative technology consumes proportionally less power than 2-stage ejector system for gas removal.
The economic figure of merit for each technology in these charts is the net present value (NPV) of the revenues versus the costs for installation and operation of the alternative. Revenues are attributed based on energy savings, which are estimated as the difference between the utility demand for the alternative gas removal system compared to that of a 2-stage steam jet ejector system for the same power plant.
Positive NPV values indicate the alternative gas removal system will yield a return on investment. Negative values mean the conversion to and operation of the alternative will lose money compared to retaining a steam jet ejector system for gas removal. The values plotted below for NPV are at a fixed point in time listed below the margin of the figures. By changing the year selected, the returns on investments can be shown after varying period of operating time.
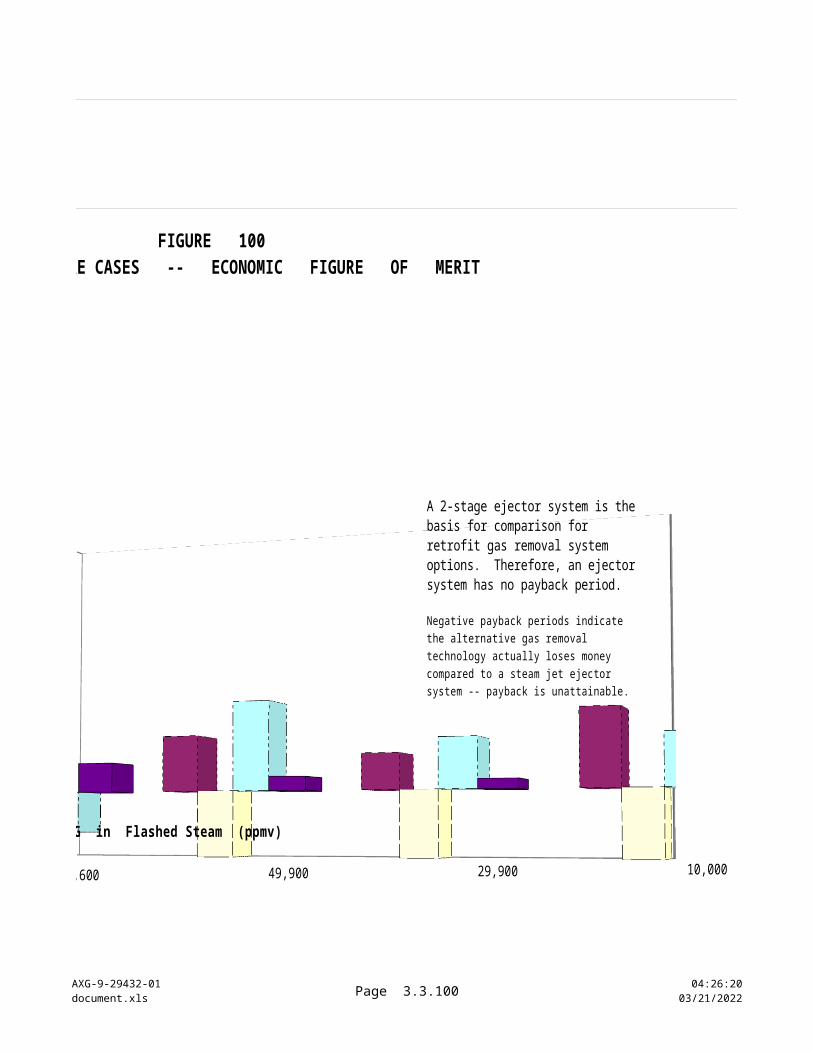
AXG-9-29432-01]document.xls
Page 3.3a.100 10:22:2004/18/2023
0 20,000 40,000 60,000 80,000 100,000 120,000 140,000 160,000
0.50
1.00
1.50
2.00
2.50
3.00
3.50
4.00
4.50
5.00
FIGURE 7LOW TEMPERATURE CASES -- TECHNICAL FIGURE OF MERIT
2-Stage Ejectors
3-Stage Turbo
Reboiler
Biphase Eductor
Hybrid -- Ejector & Turbo
NCG in Flashed Steam (ppmv)
Ne
t P
lan
t P
ow
er
Pro
du
cti
vit
y
Ve
rsu
s a
2-S
tag
e E
jec
tor
Sy
ste
m

AXG-9-29432-01]document.xls
Page 3.3a.101 10:22:2004/18/2023
10.0% General Inflation = 2.0%10 years Electricity price escalation : 2.0%
$ 0.040 per kWh Tax Rate = 34.0%
0 20,000 40,000 60,000 80,000 100,000 120,000 140,000 160,000
($ 35,000,000)
($ 30,000,000)
($ 25,000,000)
($ 20,000,000)
($ 15,000,000)
($ 10,000,000)
($ 5,000,000)
$ 0
$ 5,000,000
$ 10,000,000
$ 15,000,000
$ 20,000,000
$ 25,000,000
$ 30,000,000
FIGURE 8LOW TEMPERATURE CASES -- ECONOMIC FIGURE OF MERIT
3-Stage Turbo
Reboiler
Biphase Eductor
Hybrid -- Ejector & Turbo
NCG in Flashed Steam (ppmv)
Ne
t P
res
en
t V
alu
es
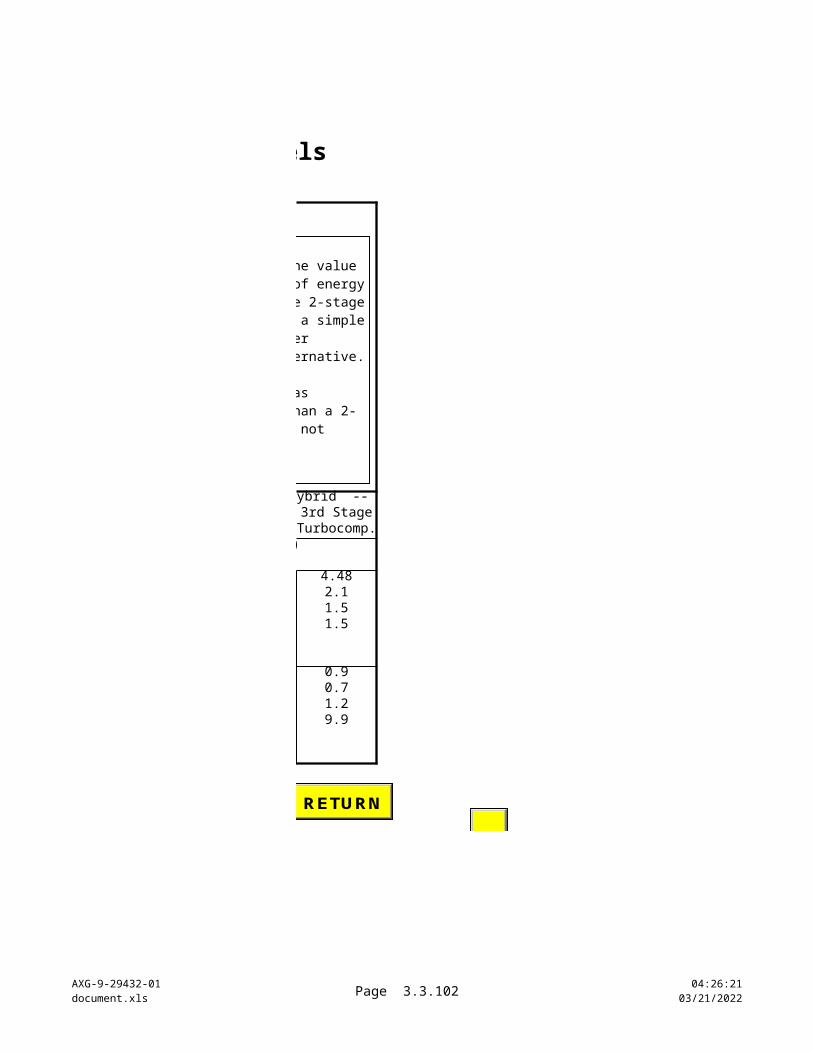
AXG-9-29432-01]document.xls
Page 3.3a.102 10:22:2004/18/2023
0 20,000 40,000 60,000 80,000 100,000 120,000
0.95
1.00
1.05
1.10
1.15
FIGURE 9HIGH TEMPERATURE CASES -- TECHNICAL FIGURE OF MERIT
2-Stage Ejectors
3-Stage Turbo
Reboiler
Biphase Eductor
Hybrid -- Ejector & Turbo
NCG in Flashed Steam (ppmv)
Ne
t P
lan
t P
ow
er
Pro
du
cti
vit
y
Vers
us
a 2
-Sta
ge E
jec
tor
Sys
tem
AXG-9-29432-01]document.xls
Page 3.3a.103 10:22:2004/18/2023
General Inflation = 2.0%years Electricity price escalation : 2.0%
0 20,000 40,000 60,000 80,000 100,000 120,000
-$ 10,000,000
-$ 9,000,000
-$ 8,000,000
-$ 7,000,000
-$ 6,000,000
-$ 5,000,000
-$ 4,000,000
-$ 3,000,000
-$ 2,000,000
-$ 1,000,000
$ 0
$ 1,000,000
$ 2,000,000
$ 3,000,000
FIGURE 10HIGH TEMPERATURE CASES -- ECONOMIC FIGURE OF MERIT
3-Stage Turbo Reboiler
Biphase Eductor Hybrid -- Ejector & Turbo
NCG in Flashed Steam (ppmv)
Net
Pre
sen
t V
alu
es
AXG-9-29432-01]document.xls
Page 3.3a.104 10:22:2004/18/2023
per kWh Tax Rate = 34.0%
AXG-9-29432-01]document.xls
Page 3.3a.105 10:22:2004/18/2023
Plot Data : Engineering and Economic Figures of Merit versus Noncondensable Gas Levels
Y AXISEconomic Figure of Merit
Hybrid -- 3rd Stage
Turbocomp.years per kWh $ 60,000 $ 1,250,000 $ 1,100,000 $ 510,000
$ 2,350,000 $ 6,040,000 $ 6,510,000 $ (3,790,000)
The economic figure of merit for each technology in these charts is the net present value (NPV) of the revenues versus the costs for installation and operation of the alternative. Revenues are attributed based on energy savings, which are estimated as the difference between the utility demand for the alternative gas removal system compared to that of a 2-stage steam jet ejector system for the same power plant.
Positive NPV values indicate the alternative gas removal system will yield a return on investment. Negative values mean the conversion to and operation of the alternative will lose money compared to retaining a steam jet ejector system for gas removal. The values plotted below for NPV are at a fixed point in time listed below the margin of the figures. By changing the year selected, the returns on investments can be shown after varying period of operating time.
AXG-9-29432-01]document.xls
Page 3.3a.106 10:22:2004/18/2023
0 20,000 40,000 60,000 80,000 100,000 120,000 140,000 160,000
0.50
1.00
1.50
2.00
2.50
3.00
3.50
4.00
4.50
5.00
FIGURE 7LOW TEMPERATURE CASES -- TECHNICAL FIGURE OF MERIT
2-Stage Ejectors
3-Stage Turbo
Reboiler
Biphase Eductor
Hybrid -- Ejector & Turbo
NCG in Flashed Steam (ppmv)
Ne
t P
lan
t P
ow
er
Pro
du
cti
vit
y
Ve
rsu
s a
2-S
tag
e E
jec
tor
Sy
ste
m

AXG-9-29432-01]document.xls
Page 3.3a.107 10:22:2004/18/2023
0 20,000 40,000 60,000 80,000 100,000 120,000 140,000 160,000
($ 35,000,000)
($ 30,000,000)
($ 25,000,000)
($ 20,000,000)
($ 15,000,000)
($ 10,000,000)
($ 5,000,000)
$ 0
$ 5,000,000
$ 10,000,000
$ 15,000,000
$ 20,000,000
$ 25,000,000
$ 30,000,000
FIGURE 8LOW TEMPERATURE CASES -- ECONOMIC FIGURE OF MERIT
3-Stage Turbo
Reboiler
Biphase Eductor
Hybrid -- Ejector & Turbo
NCG in Flashed Steam (ppmv)
Ne
t P
res
en
t V
alu
es
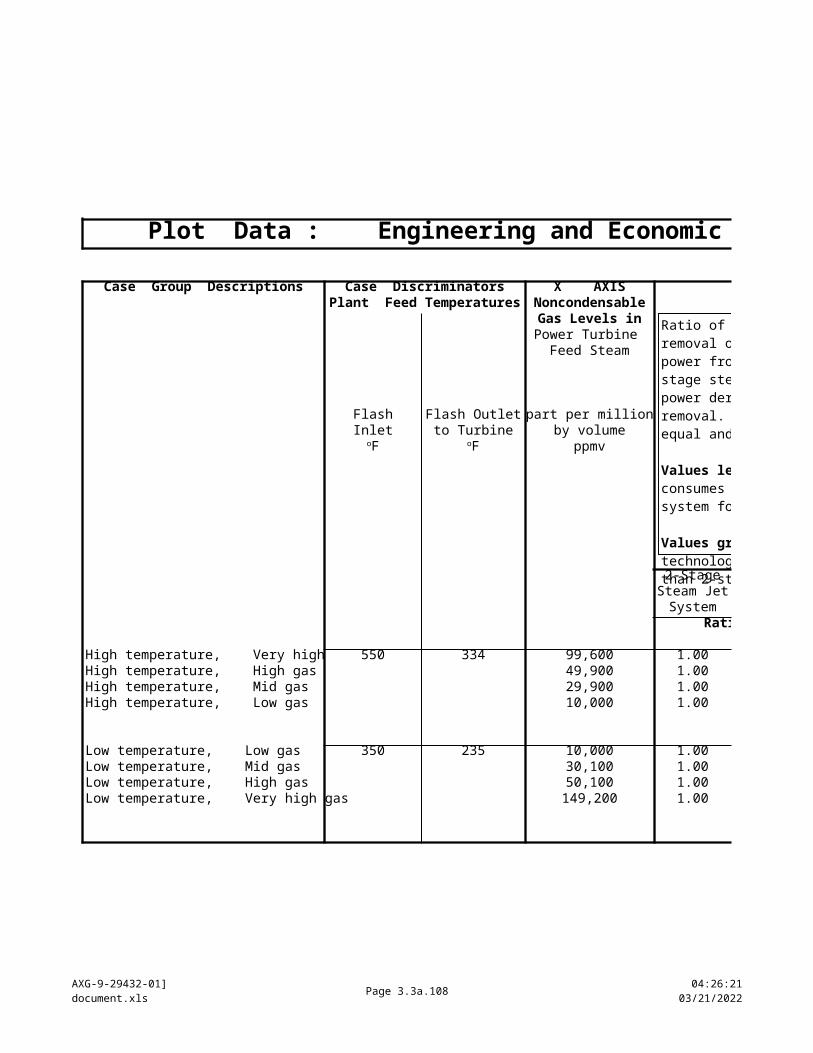
AXG-9-29432-01]document.xls
Page 3.3a.108 10:22:2004/18/2023
0 20,000 40,000 60,000 80,000 100,000 120,000
0.95
1.00
1.05
1.10
1.15
FIGURE 9HIGH TEMPERATURE CASES -- TECHNICAL FIGURE OF MERIT
2-Stage Ejectors
3-Stage Turbo
Reboiler
Biphase Eductor
Hybrid -- Ejector & Turbo
NCG in Flashed Steam (ppmv)
Ne
t P
lan
t P
ow
er
Pro
du
cti
vit
y
Vers
us
a 2
-Sta
ge E
jec
tor
Sys
tem
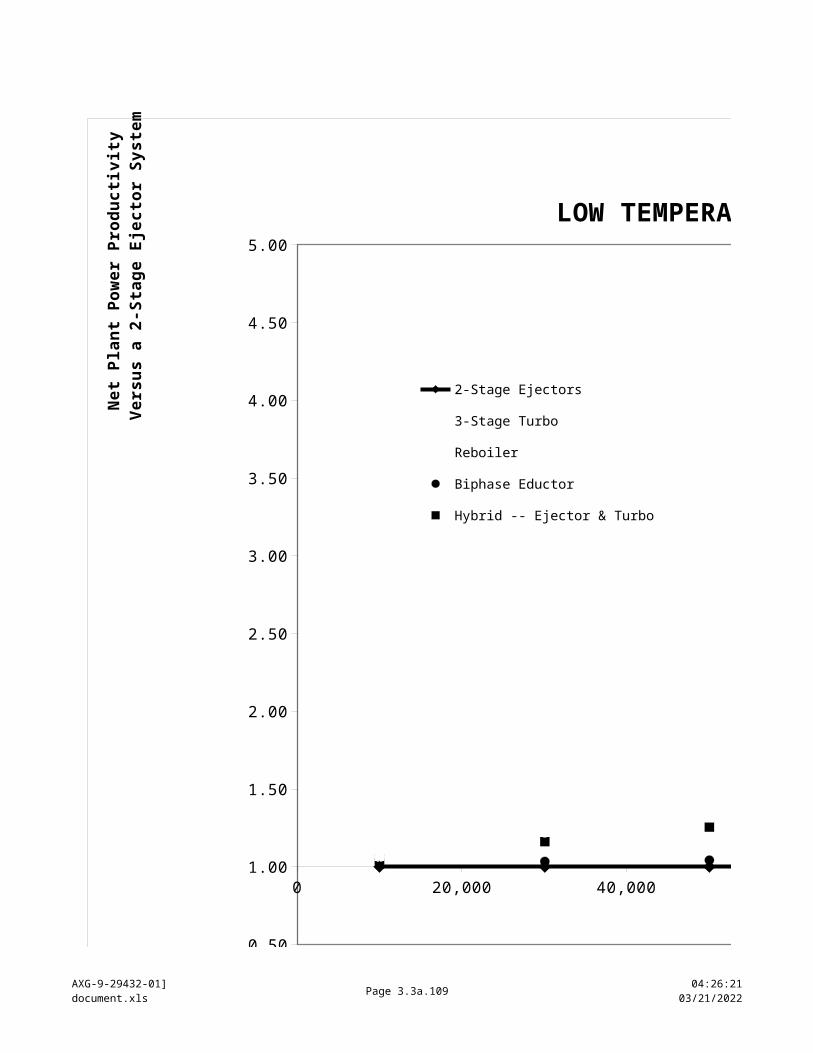
AXG-9-29432-01]document.xls
Page 3.3a.109 10:22:2004/18/2023
0 20,000 40,000 60,000 80,000 100,000 120,000
-$ 10,000,000
-$ 9,000,000
-$ 8,000,000
-$ 7,000,000
-$ 6,000,000
-$ 5,000,000
-$ 4,000,000
-$ 3,000,000
-$ 2,000,000
-$ 1,000,000
$ 0
$ 1,000,000
$ 2,000,000
$ 3,000,000
FIGURE 10HIGH TEMPERATURE CASES -- ECONOMIC FIGURE OF MERIT
3-Stage Turbo Reboiler
Biphase Eductor Hybrid -- Ejector & Turbo
NCG in Flashed Steam (ppmv)
Net
Pre
sen
t V
alu
es

Sheet 3.4a AuxGraphs
AXG-9-29432-01document.xls
Page 3.4.110 10:22:2004/18/2023
PLOT DRIVE STEAM DEMAND NEEDED TO OPERATE NONCONDENSABLE GAS REMOVAL SYSTEMS
Case Discriminators Case No. Gas Levels Drive Steam to Gas Removalppmv Base Case3-St. Turbo Reboiler Biphase Hybrid
high temp x-hi gas 8 99,557 348,709 232,693 5,438 297,090 308,617high gas 1 49,917 170,543 116,794 2,103 134,366 141,998mid gas 2 29,934 98,633 69,073 1,239 62,824 81,100low gas 3 9,980 28,669 21,271 410 0 23,149
low temp low gas 4 10,034 117,936 55,415 2,119 96,584 71,589mid gas 5 30,065 389,825 180,440 6,289 363,385 250,352high gas 6 50,053 620,455 304,875 10,425 576,272 439,068x-hi gas 7 149,180 1,480,018 893,872 20,225 1,099,651 1,372,214
0.0E+00 2.0E+04 4.0E+04 6.0E+04 8.0E+04 1.0E+05 1.2E+05 1.4E+05 1.6E+050E+00
1E+06
2E+06
Demand For Drive Steam For Gas RemovalAll Temperature Cases
Column E
Column F
Column G
Column H
Column I
Column E
Column F
Column G
Column H
Column I
NonCondensable Gas Levels in Flashed Steam (ppmv)
Dri
ve S
team
Req
uir
ed
(lb
/hr)
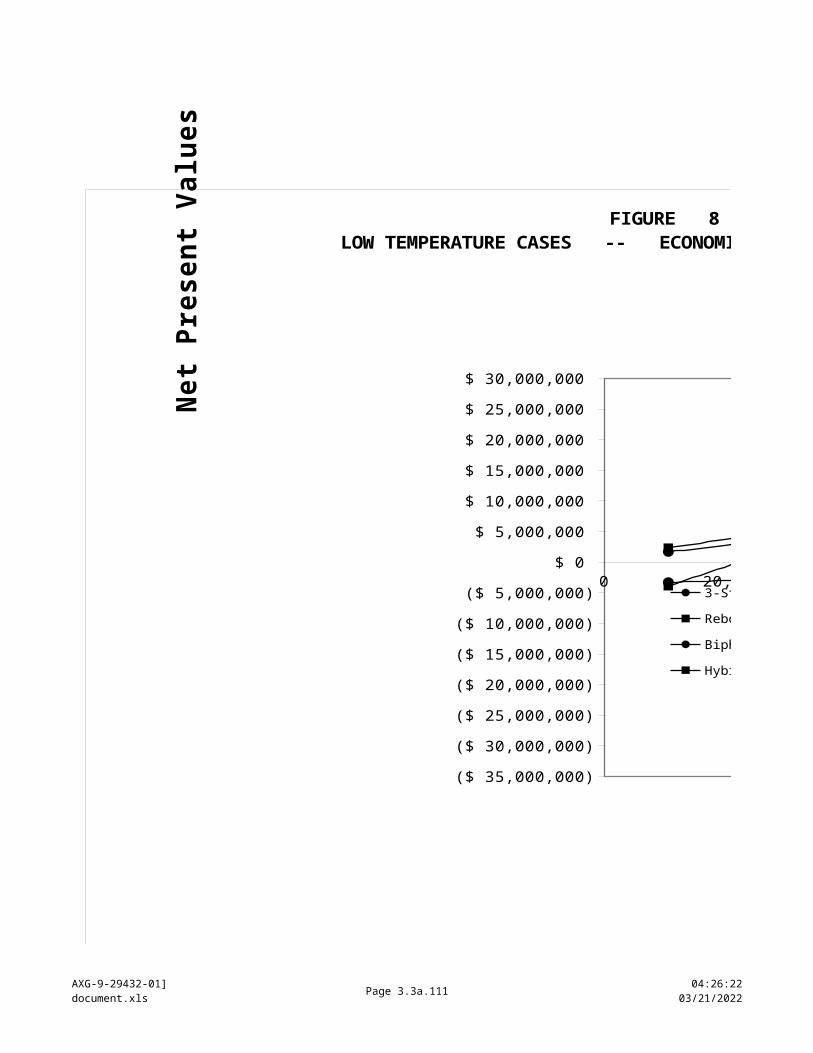
Sheet 3.4a AuxGraphs
AXG-9-29432-01document.xls
Page 3.4.111 10:22:2004/18/2023
0.0E+00 2.0E+04 4.0E+04 6.0E+04 8.0E+04 1.0E+05 1.2E+05
0.0E+00
1.0E+05
2.0E+05
3.0E+05
4.0E+05
Demand For Drive Steam For Gas RemovalHigh Temperature Cases
Column E
Column F
Column G
Column H
Column I
NonCondensable Gas Levels in Flashed Steam (ppmv)
Dri
ve
Ste
am
Re
qu
ire
d (
lb/h
r)
0.0E+00 2.0E+04 4.0E+04 6.0E+04 8.0E+04 1.0E+05 1.2E+05 1.4E+05 1.6E+05
0.0E+00
2.0E+05
4.0E+05
6.0E+05
8.0E+05
1.0E+06
1.2E+06
1.4E+06
1.6E+06
Demand For Drive Steam For Gas RemovalLow Temperature Cases
Column E
Column F
Column G
Column H
Column I
NonCondensable Gas Levels in Flashed Steam (ppmv)
Dri
ve
Ste
am
Re
qu
ire
d (
lb/h
r)
Sheet 3.4a AuxGraphs
AXG-9-29432-01document.xls
Page 3.4.112 10:22:2004/18/2023
PLOT DRIVE STEAM DEMAND NEEDED TO OPERATE NONCONDENSABLE GAS REMOVAL SYSTEMS
0.0E+00 2.0E+04 4.0E+04 6.0E+04 8.0E+04 1.0E+05 1.2E+05 1.4E+05 1.6E+050E+00
1E+06
2E+06
Demand For Drive Steam For Gas RemovalAll Temperature Cases
Column E
Column F
Column G
Column H
Column I
Column E
Column F
Column G
Column H
Column I
NonCondensable Gas Levels in Flashed Steam (ppmv)
Dri
ve S
team
Req
uir
ed
(lb
/hr)
This worksheet plots the mass flowrates of drive steam needed to achieve noncondensable gas removal from the power plant when the power turbine is being fed sufficient flashed steam to produce 50 MW of power. For the reboiler systems, this does not account for the vent gas stream discarded from the power process.
See also the adjacent "% SteamUse" plots of the relative rates of consumption of pure steam. That worksheet does account for reboiler vent stream losses.
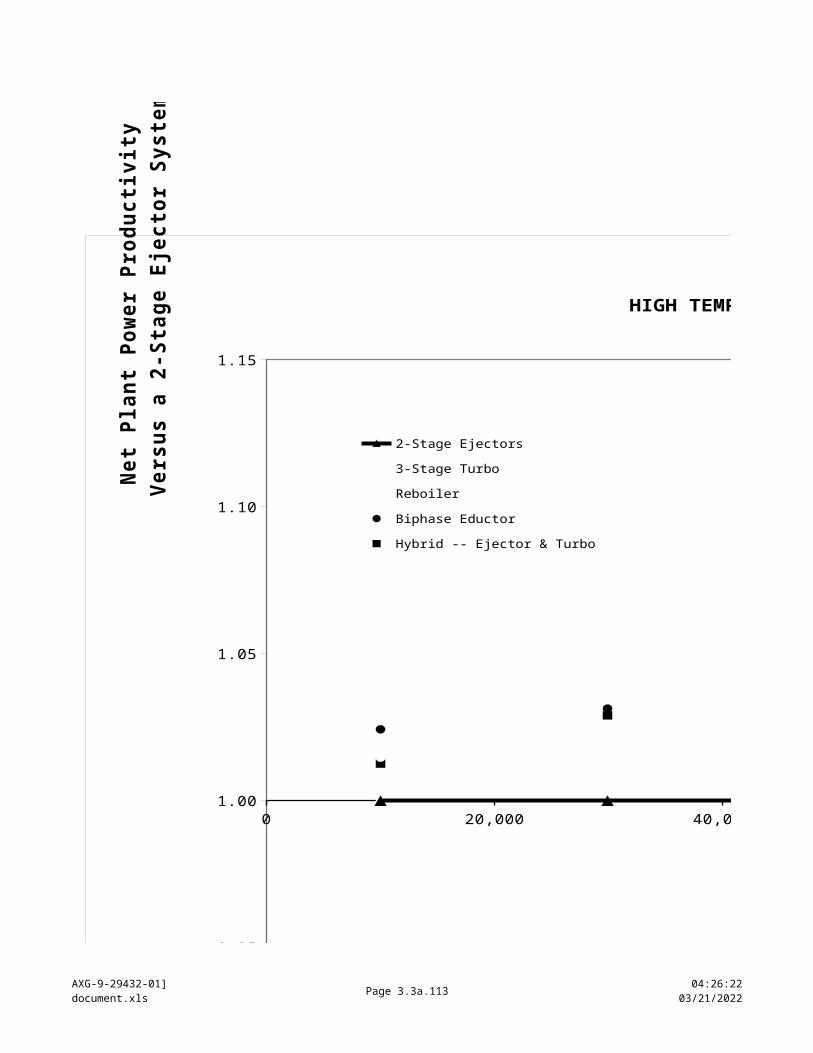
Sheet 3.4a AuxGraphs
AXG-9-29432-01document.xls
Page 3.4.113 10:22:2004/18/2023
0.0E+00 2.0E+04 4.0E+04 6.0E+04 8.0E+04 1.0E+05 1.2E+05
0.0E+00
1.0E+05
2.0E+05
3.0E+05
4.0E+05
Demand For Drive Steam For Gas RemovalHigh Temperature Cases
Column E
Column F
Column G
Column H
Column I
NonCondensable Gas Levels in Flashed Steam (ppmv)
Dri
ve
Ste
am
Re
qu
ire
d (
lb/h
r)
0.0E+00 2.0E+04 4.0E+04 6.0E+04 8.0E+04 1.0E+05 1.2E+05 1.4E+05 1.6E+05
0.0E+00
2.0E+05
4.0E+05
6.0E+05
8.0E+05
1.0E+06
1.2E+06
1.4E+06
1.6E+06
Demand For Drive Steam For Gas RemovalLow Temperature Cases
Column E
Column F
Column G
Column H
Column I
NonCondensable Gas Levels in Flashed Steam (ppmv)
Dri
ve
Ste
am
Re
qu
ire
d (
lb/h
r)
3.4b % SteamUse
AXG-9-29432-01document.xls
3.4b.114 04/18/202310:22:20
flashed steam gas & steam feed rates composition
CASE ppmv gas H2O mass gas mass std. Flashed
ID fraction fraction steam gas
lb/hr lb/hrHIGH TEMPERATURE CASES, HIGH GAS
B-1 base case 49,900 0.886 0.114 858,000 110,000 total = 968,000
B1.1 3-st. turbo 49,900 0.886 0.114 858,000 110,000
B1.2 reboiler 49,900 0.886 0.114 xx xx
B1.3 eductor 49,900 0.886 0.114 858,000 110,000
B1.4 hybrid 49,900 0.886 0.114 858,000 110,000
flashed steam gas & steam feed rates composition
CASE ppmv gas H2O mass gas mass std. Flashed
ID fraction fraction steam gas
lb/hr lb/hr
HIGH TEMPERATURE CASES, MEDIUM GASB-2 base case 29,900 0.930 0.070 867,000 65,000
total = 932,000
B2.1 3-st. turbo 29,900 0.930 0.070 867,000 65,000
B2.2 reboiler 29,900 0.930 0.070 xx xx
B2.3 eductor 29,900 0.930 0.070 867,000 65,000
B2.4 hybrid 29,900 0.930 0.070 867,000 65,000
flashed steam gas & steam feed rates composition
CASE ppmv gas H2O mass gas mass std. FlashedID fraction fraction steam gas
lb/hr lb/hr
HIGH TEMPERATURE CASES, LOW GASB-3 base case 10,000 0.976 0.024 874,000 22,000
total = 896,000
B3.1 3-st. turbo 10,000 0.976 0.024 874,000 22,000
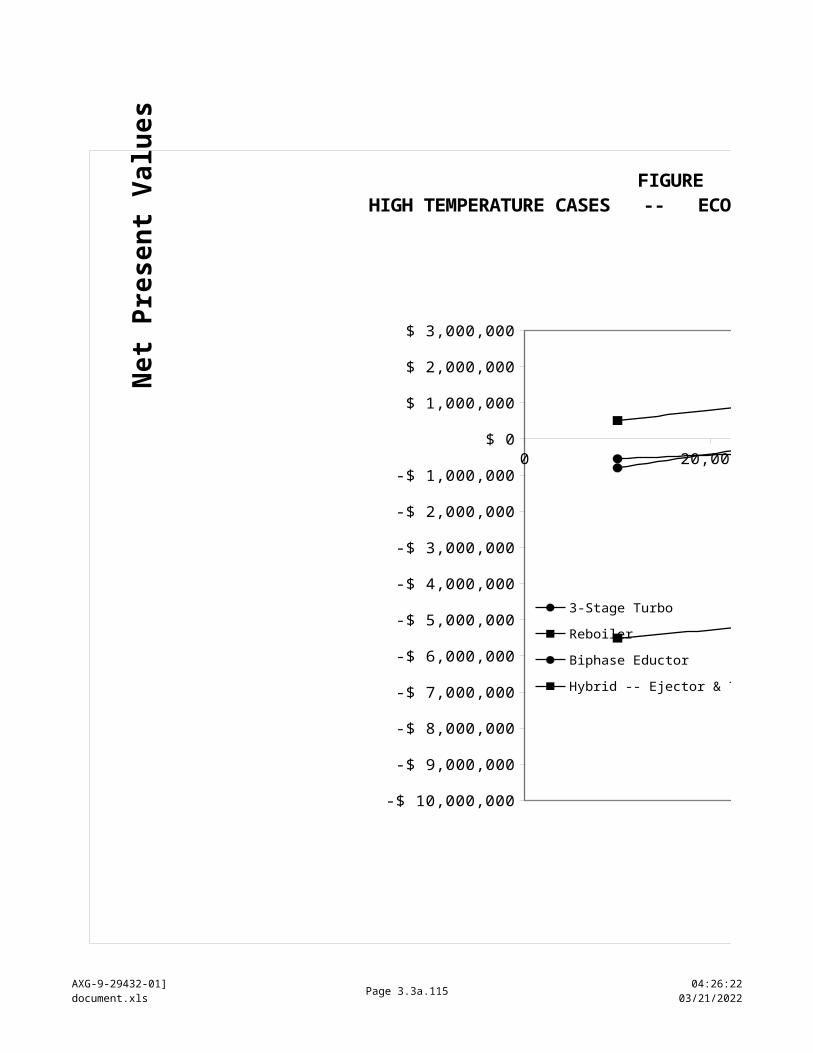
3.4b % SteamUse
AXG-9-29432-01document.xls
3.4b.115 04/18/202310:22:20
B3.2 reboiler 10,000 0.976 0.024 xx xx
B3.3 eductor 10,000 0.976 0.024 874,000 22,000
B3.4 hybrid 10,000 0.976 0.024 874,000 22,000
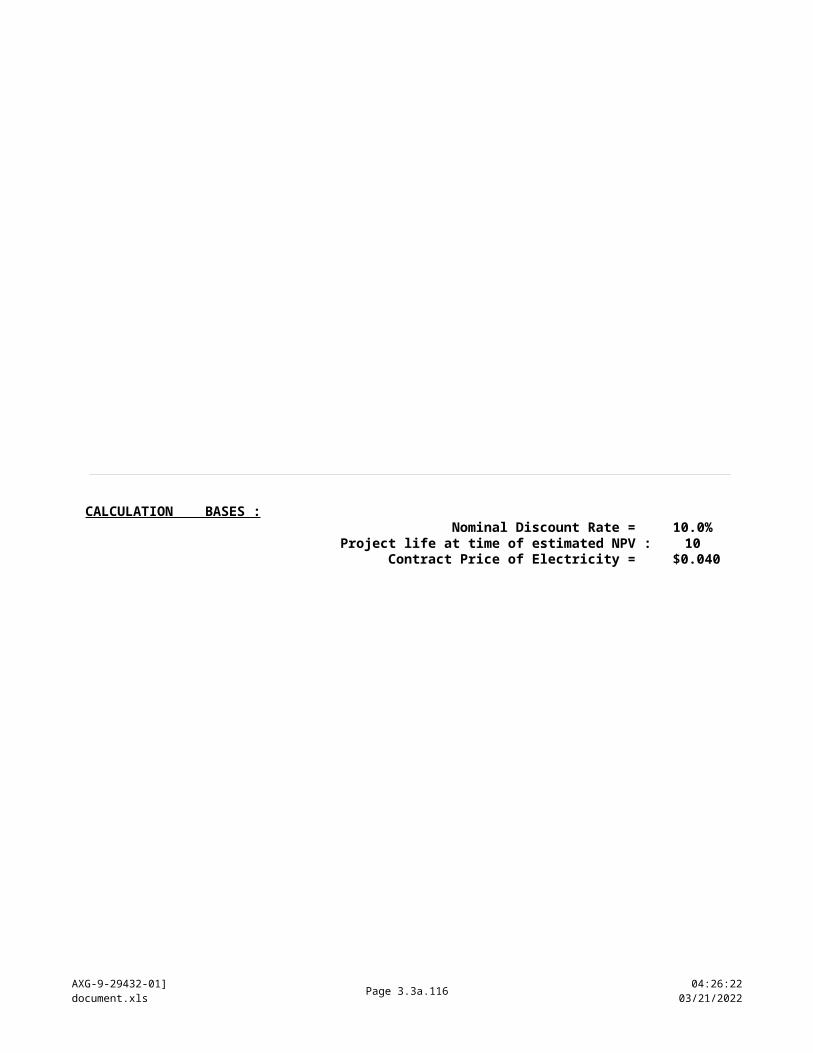
3.4b % SteamUse
AXG-9-29432-01document.xls
3.4b.116 04/18/202310:22:20
flashed steam gas & steam feed rates composition
CASE ppmv gas H2O mass gas mass std. FlashedID fraction fraction steam gas
lb/hr lb/hr
LOW TEMPERATURE CASES, LOW GASB-4 base case 10,000 0.976 0.024 1,411,000 35,000
total = 1,446,000
B4.1 3-st. turbo 10,000 0.976 0.024 1,411,000 35,000
B4.2 reboiler 10,000 0.976 0.024 xx xx
B4.3 eductor 10,000 0.976 0.024 1,411,000 35,000
B4.4 hybrid 10,000 0.976 0.024 1,411,000 35,000 - -
flashed steam gas & steam feed rates composition
CASE ppmv gas H2O mass gas mass std. FlashedID fraction fraction steam gas
lb/hr lb/hr
LOW TEMPERATURE CASES, MEDIUM GASB-5 base case 30,100 0.929 0.071 1,399,000 106,000
total = 1,505,000
B5.1 3-st. turbo 30,100 0.929 0.071 1,399,000 106,000
B5.2 reboiler 30,100 0.929 0.071 xx xx
B5.3 eductor 30,100 0.929 0.071 1,399,000 106,000
B5.4 hybrid 30,100 0.929 0.071 1,399,000 106,000
flashed steam gas & steam feed rates composition
CASE ppmv gas H2O mass gas mass std. FlashedID fraction fraction steam gas
lb/hr lb/hr
LOW TEMPERATURE CASES, HIGH GASB-6 base case 50,100 0.886 0.114 1,385,000 178,000
total = 1,563,000
B6.1 3-st. turbo 50,100 0.886 0.114 1,385,000 178,000
B6.2 reboiler 50,100 0.886 0.114 xx xx
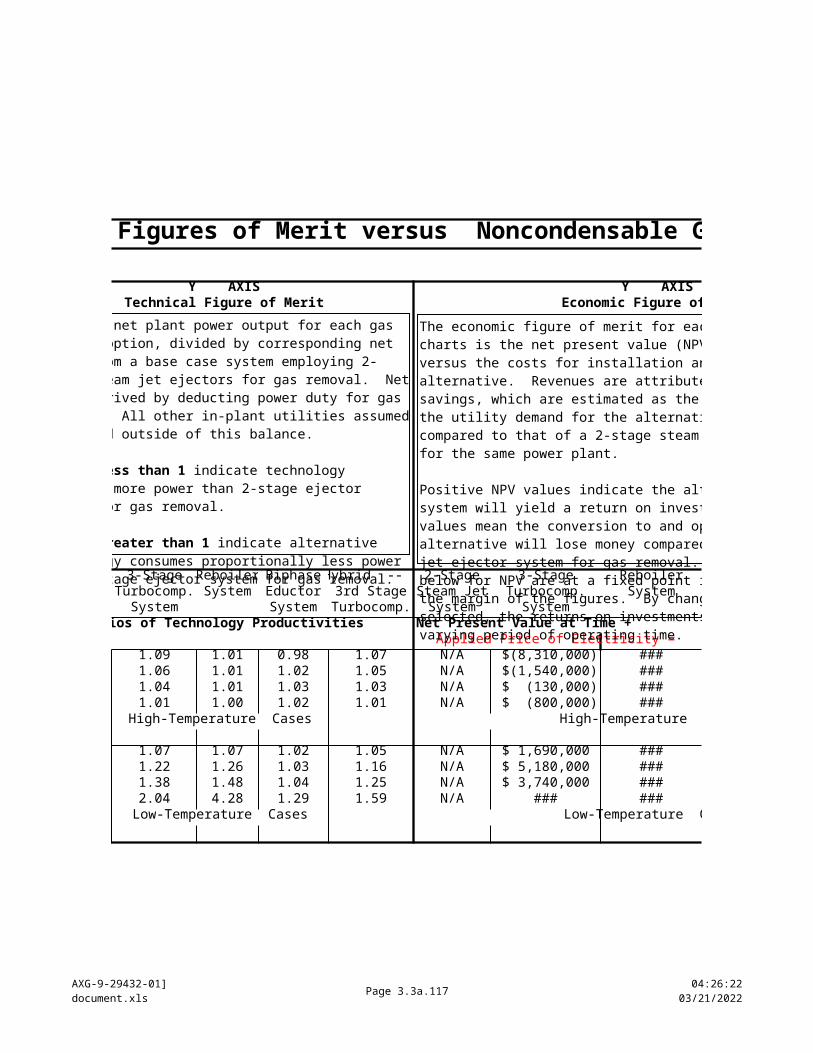
3.4b % SteamUse
AXG-9-29432-01document.xls
3.4b.117 04/18/202310:22:20
B6.3 eductor 50,100 0.886 0.114 1,385,000 178,000
B6.4 hybrid 50,100 0.886 0.114 1,385,000 178,000
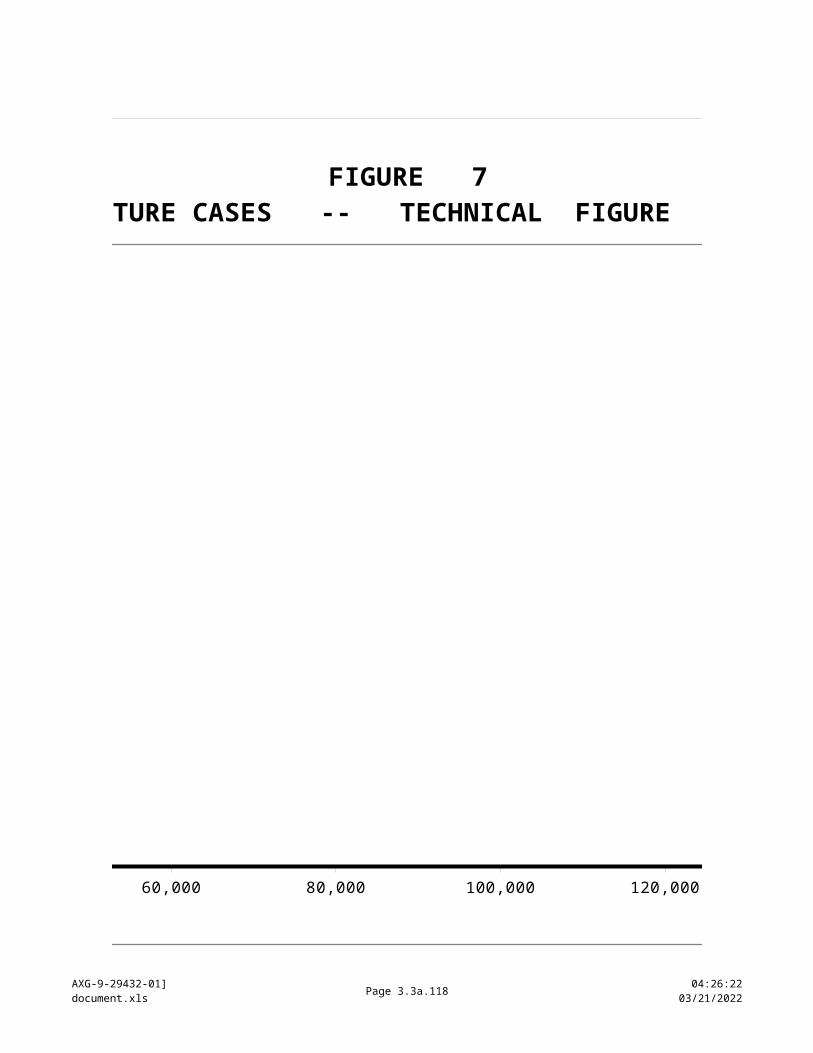
3.4b % SteamUse
AXG-9-29432-01document.xls
3.4b.118 04/18/202310:22:20
flashed steam gas & steam feed rates composition
CASE ppmv gas H2O mass gas mass std. FlashedID fraction fraction steam gas
lb/hr lb/hr
LOW TEMPERATURE CASES, VERY HIGH GASB-7 base case 149,200 0.700 0.300 1,311,000 562,000
total = 1,873,000
B7.1 3-st. turbo 149,200 0.700 0.300 1,311,000 562,000
B7.2 reboiler 149,200 0.700 0.300 xx xx
B7.3 eductor 149,200 0.700 0.300 1,311,000 562,000
B7.4 hybrid 149,200 0.700 0.300 1,311,000 562,000
flashed steam gas & steam feed rates composition
CASE ppmv gas H2O mass gas mass std. FlashedID fraction fraction steam gas
lb/hr lb/hr
HIGH TEMPERATURE CASES, VERY HIGH GASB-8 base case 99,600 0.787 0.213 836,000 226,000
total = 1,062,000
B8.1 3-st. turbo 99,600 0.787 0.213 836,000 226,000
B8.2 reboiler 99,600 0.787 0.213 xx xx
B8.3 eductor 99,600 0.787 0.213 836,000 226,000
B8.4 hybrid 99,600 0.787 0.213 836,000 226,000
PLOT DATAX AXIS Y AXIS
BASE 3-STAGE REBOILER EDUCTORgas CASE TURBOloads Percent Pure Steam to Gas Removal Power
(ppmv) (total steam use for all gas removal duty, including reboiler vent gas)
hi temp 10,000 3.2% 2.4% 2.4% 0.00% 29,900 10.6% 7.4% 7.5% 6.7% 49,900 17.6% 12.1% 12.8% 13.9% 99,600 32.8% 21.9% 27.0% 28.0%
low temp 10,000 8.2% 3.8% 2.6% 6.7%

3.4b % SteamUse
AXG-9-29432-01document.xls
3.4b.119 04/18/202310:22:20
30,100 25.9% 12.0% 7.9% 24.2% 50,100 39.7% 19.5% 13.3% 36.8% 149,200 79.0% 47.7% 43.1% 58.7%
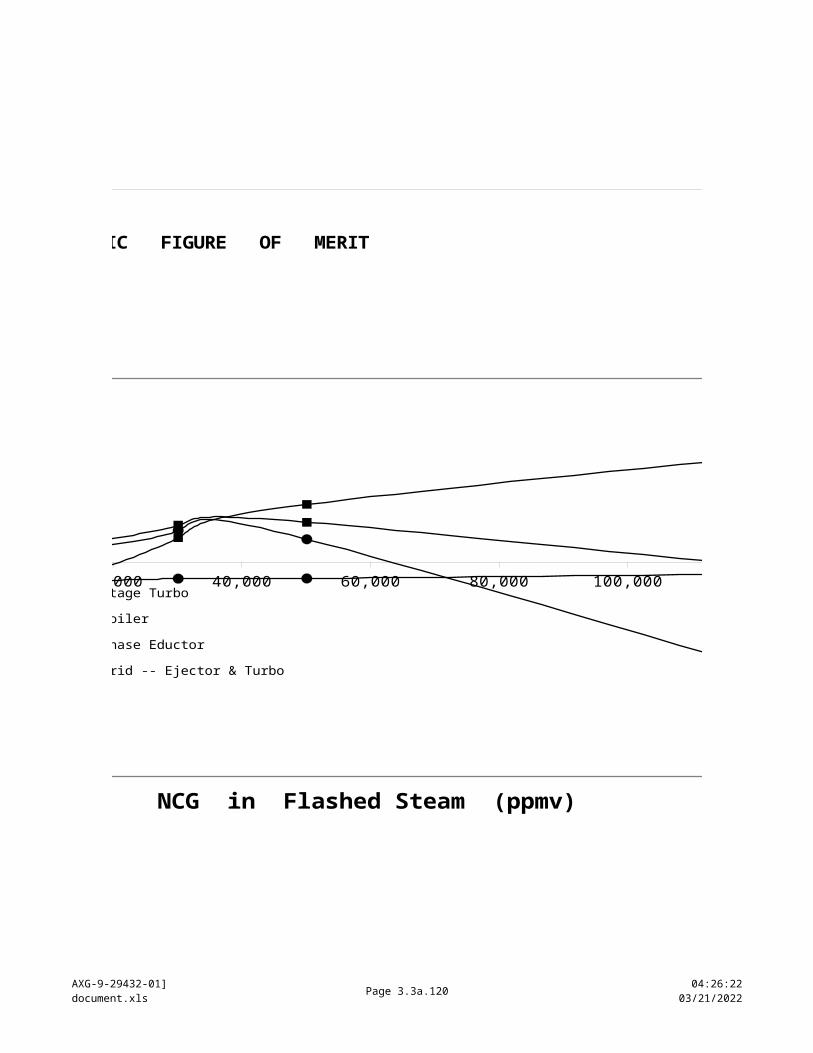
3.4b % SteamUse
AXG-9-29432-01document.xls
3.4b.120 04/18/202310:22:20
- 2 0 ,0 0 0 4 0 ,0 0 0 6 0 ,0 0 0 8 0 ,0 0 0 1 0 0 ,0 0 0 1 2 0 ,0 0 0
0 .0 %
5 .0 %
1 0 .0 %
1 5 .0 %
2 0 .0 %
2 5 .0 %
3 0 .0 %
3 5 .0 %
High Temperature Cases: Steam Used for Gas Removal
base case 2-stage ejector Column E reboiler + 2-st. ejector
3-stage biphase eductor hybrid turbo/2-st. ejector
Ga s Con c e ntra tion s in Ste a m, p pmv
% s
tea
m to
ga
s re
mo
va
l po
we
r(a
s p
ure
ste
am
)
- 20,000 40,000 60,000 80,000 100,000 120,000 140,000 160,000
0.0%
10.0%
20.0%
30.0%
40.0%
50.0%
60.0%
70.0%
80.0%
90.0%
Low Temperature Cases: Steam Used for Gas Removal
base case 2-stage ejector Column E
reboiler + 2-st. ejector 3-stage biphase eductor
hybrid turbo/2-st. ejector
Gas Concentrations in Steam, ppmv
% s
tea
m t
o g
as
re
mo
va
l p
ow
er
(as
pu
re s
tea
m)
3.4b % SteamUse
AXG-9-29432-01document.xls
3.4b.121 04/18/202310:22:20
- 2 0 ,0 0 0 4 0 ,0 0 0 6 0 ,0 0 0 8 0 ,0 0 0 1 0 0 ,0 0 0 1 2 0 ,0 0 0
0 .0 %
5 .0 %
1 0 .0 %
1 5 .0 %
2 0 .0 %
2 5 .0 %
3 0 .0 %
3 5 .0 %
High Temperature Cases: Steam Used for Gas Removal
base case 2-stage ejector Column E reboiler + 2-st. ejector
3-stage biphase eductor hybrid turbo/2-st. ejector
Ga s Con c e ntra tion s in Ste a m, p pmv
% s
tea
m to
ga
s re
mo
va
l po
we
r(a
s p
ure
ste
am
)
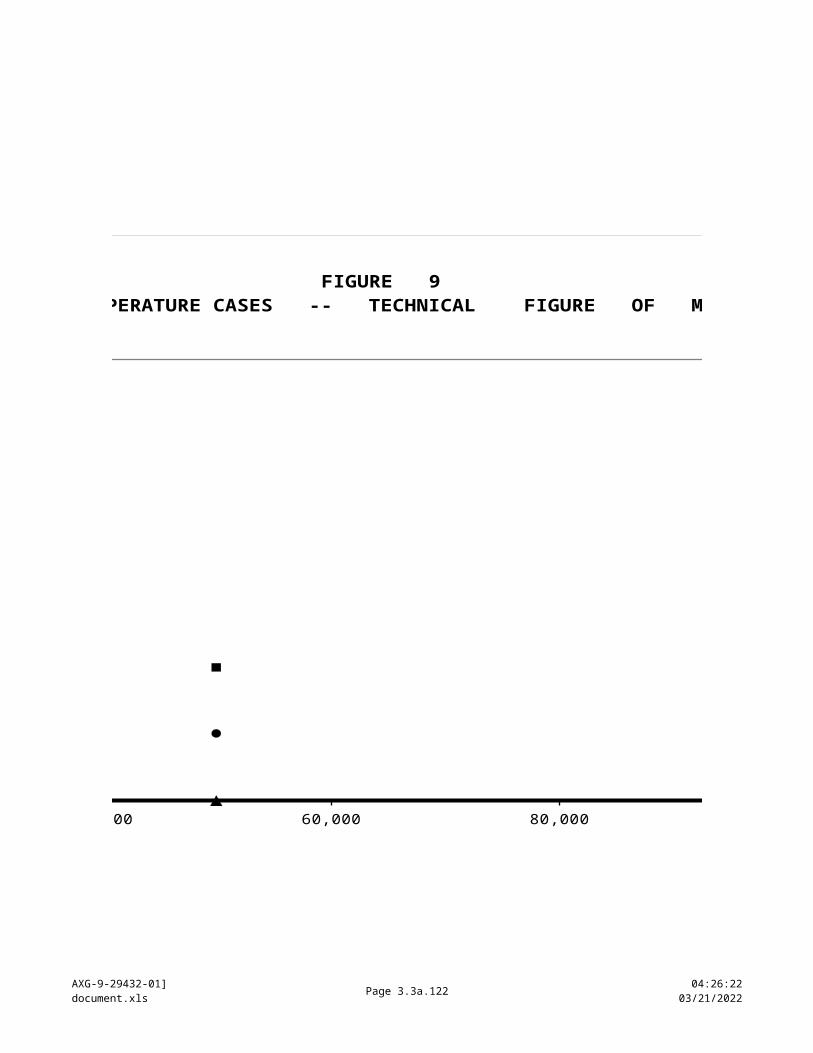
3.4b % SteamUse
AXG-9-29432-01document.xls
3.4b.122 04/18/202310:22:20
gas & steam feed rates steam to vacuum flow to reboiler vent
reboiler feed
steam gas gas steam
lb/hr lb/hr lb/hr % of feed steam lb/hr % of feed lb/hr(pure steam) (pure steam)
xx xx 151,000 17.6% 171,000 = raw gas + steam
xx xx 104,000 12.1% 117,000
858,000 110,000 2,000 0.2% 108,000 98.1% 108,000 total = 968,000 2,000 = raw gas + steam 216,000 = raw steam + gas
xx xx 119,000 13.9% 134,000
xx xx 126,000 14.7% 142,000
gas & steam feed rates steam to vacuum flow to reboiler vent
reboiler feed
steam gas gas steam
lb/hr lb/hr lb/hr % of feed steam lb/hr % of feed lb/hr
xx xx 92,000 10.6% 99,000 = raw gas + steam
xx xx 64,000 7.4% 69,000
867,000 65,000 1,000 0.1% 64,000 98.0% 64,000 total = 932,000 1,000 = raw gas + steam 128,000 = raw steam + gas
xx xx 58,000 6.7% 63,000
xx xx 75,000 8.7% 81,000
gas & steam feed rates steam to vacuum flow to reboiler vent
reboiler feedsteam gas gas steamlb/hr lb/hr lb/hr % of feed steam lb/hr % of feed lb/hr
xx xx 28,000 3.2% 29,000 = raw gas + steam
xx xx 21,000 2.4%

3.4b % SteamUse
AXG-9-29432-01document.xls
3.4b.123 04/18/202310:22:20
21,000
874,000 22,000 - 0.0% 21,000 97.3% 21,000 total = 896,000 - = raw gas + steam 42,000 = raw steam + gas
xx xx - 0.0% -
xx xx 23,000 2.6% 23,000
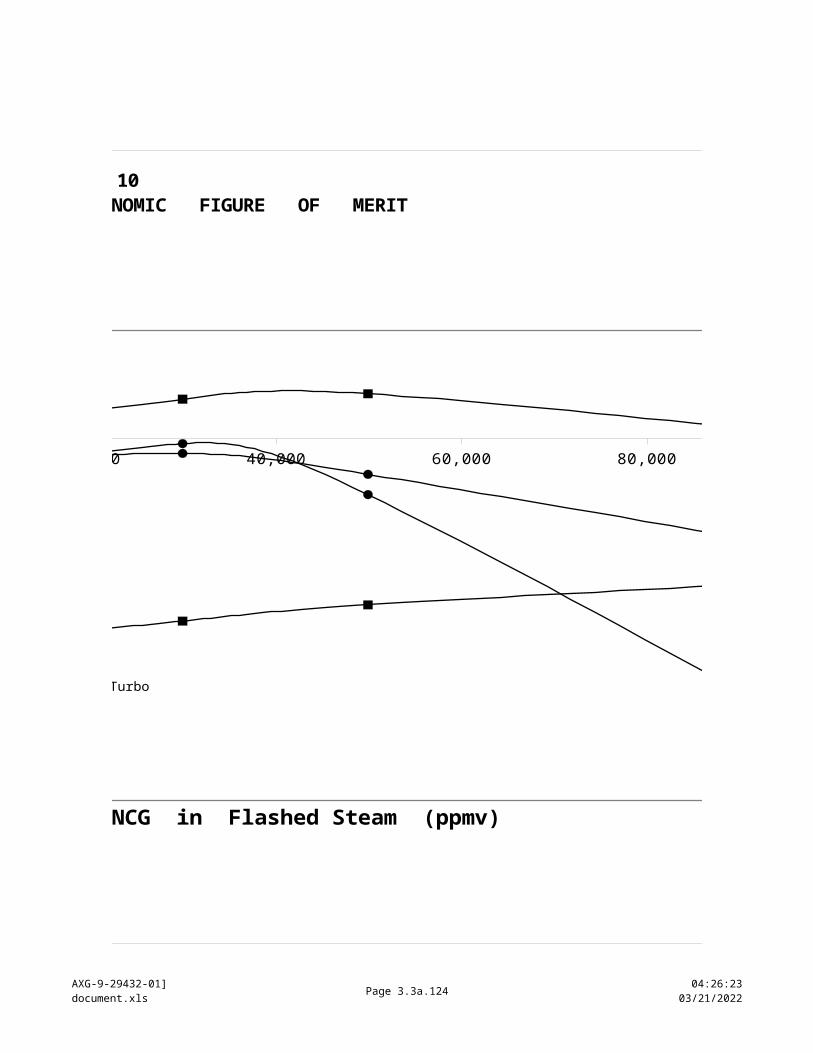
3.4b % SteamUse
AXG-9-29432-01document.xls
3.4b.124 04/18/202310:22:20
gas & steam feed rates steam to vacuum flow to reboiler vent
reboiler feedsteam gas gas steamlb/hr lb/hr lb/hr % of feed steam lb/hr % of feed lb/hr
xx xx 115,000 8.2% 118,000 = raw gas + steam
xx xx 54,000 3.8% 55,000
1,411,000 35,000 2,000 0.1% 34,000 97.6% 34,000 total = 1,446,000 2,000 = raw gas + steam 68,000 = raw steam + gas
xx xx 94,000 6.7% 97,000
xx xx 70,000 5.0%xx xx 72,000
gas & steam feed rates steam to vacuum flow to reboiler vent
reboiler feedsteam gas gas steamlb/hr lb/hr lb/hr % of feed steam lb/hr % of feed lb/hr
xx xx 362,000 25.9% 390,000 = raw gas + steam
xx xx 168,000 12.0% 180,000
1,399,000 106,000 6,000 0.4% 104,000 98.0% 104,000 total = 1,505,000 6,000 = raw gas + steam 208,000 = raw steam + gas
xx xx 338,000 24.2% 363,000
xx xx 233,000 16.7% 250,000
gas & steam feed rates steam to vacuum flow to reboiler vent
reboiler feedsteam gas gas steamlb/hr lb/hr lb/hr % of feed steam lb/hr % of feed lb/hr
xx xx 550,000 39.7% 621,000 = raw gas + steam
xx xx 270,000 19.5% 305,000
1,385,000 178,000 9,000 0.7% 175,000 98.0% 175,000 total = 1,563,000 10,000 = raw gas + steam 350,000 = raw steam + gas
3.4b % SteamUse
AXG-9-29432-01document.xls
3.4b.125 04/18/202310:22:20
xx xx 510,000 36.8% 576,000
xx xx 389,000 28.1% 439,000
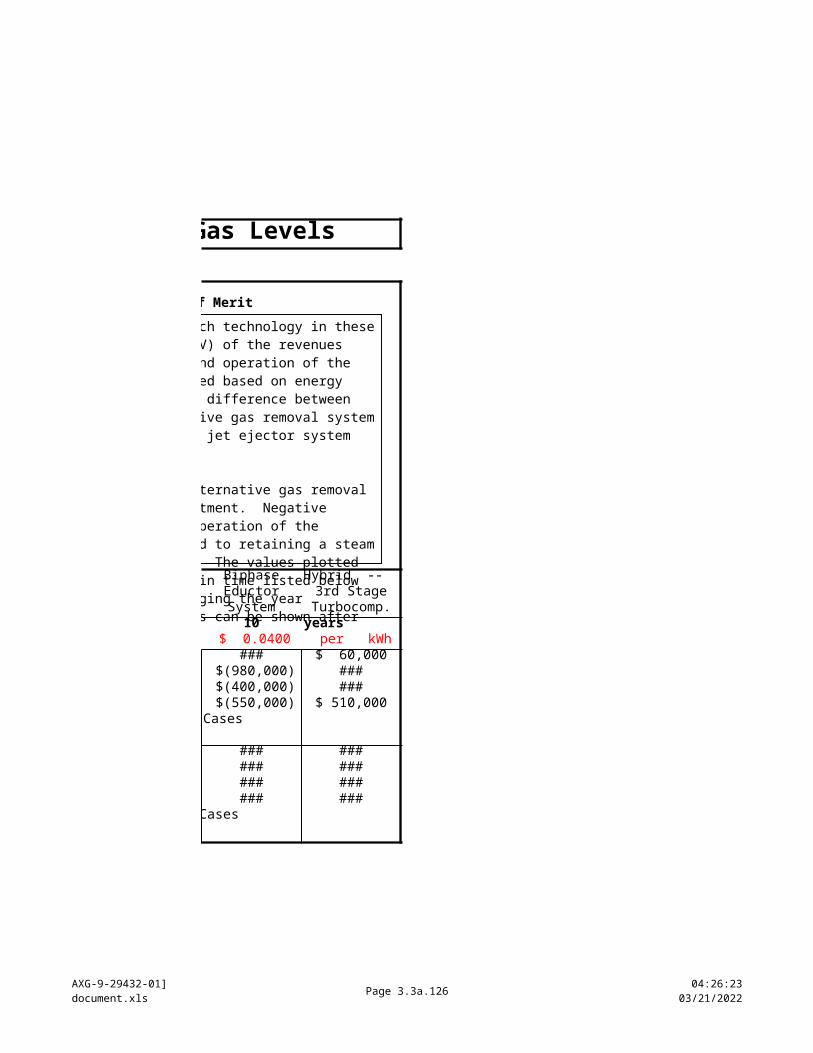
3.4b % SteamUse
AXG-9-29432-01document.xls
3.4b.126 04/18/202310:22:20
gas & steam feed rates steam to vacuum flow to reboiler vent
reboiler feedsteam gas gas steamlb/hr lb/hr lb/hr % of feed steam lb/hr % of feed lb/hr
xx xx 1,036,000 79.0% 1,480,000 = raw gas + steam
xx xx 626,000 47.7% 894,000
1,311,000 562,000 14,000 1.1% 551,000 98.0% 551,000 total = 1,873,000 20,000 = raw gas + steam ### = raw steam + gas
xx xx 770,000 58.7% 1,100,000
xx xx 960,000 73.2% 1,372,000
gas & steam feed rates steam to vacuum flow to reboiler vent
reboiler feedsteam gas gas steamlb/hr lb/hr lb/hr % of feed steam lb/hr % of feed lb/hr
xx xx 274,000 32.8% 349,000 = raw gas + steam
xx xx 183,000 21.9% 233,000 = raw gas + steam
836,000 226,000 4,000 0.5% 222,000 98.2% 222,000 total = 1,062,000 5,000 = raw gas + steam 444,000 = raw steam + gas
xx xx 234,000 28.0% 297,000 = raw gas + steam
xx xx 243,000 29.1% 309,000 = raw gas + steam
PLOT DATAY AXIS
HYBRID
Percent Pure Steam to Gas Removal Power(total steam use for all gas removal duty, including reboiler vent gas)
2.6%8.7%
14.7%29.1%
5.0%
This worksheet plots the percent of pure steam in the plant feed needed to achieve noncondensable gas removal from the power plant, when the power turbine is being fed sufficient flashed steam to produce 50 MW of power. The values and plots below do account for the reboiler losses of steam in the vent gas.
See also the adjacent "AuxGraphs" plots of the mass flowrates of consumption of bulk flashed steam. That worksheet accounts only for vacuum system gas demand for the reboiler cases.
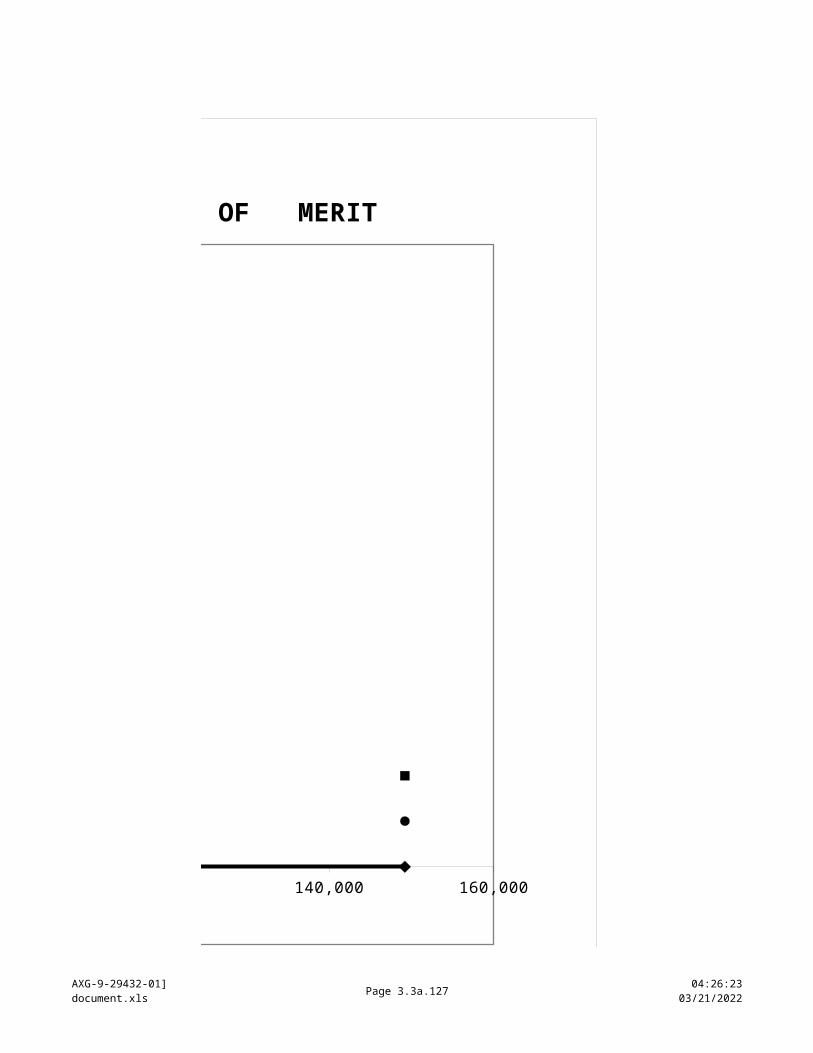
3.4b % SteamUse
AXG-9-29432-01document.xls
3.4b.127 04/18/202310:22:20
16.7%28.1%73.2%
This worksheet plots the percent of pure steam in the plant feed needed to achieve noncondensable gas removal from the power plant, when the power turbine is being fed sufficient flashed steam to produce 50 MW of power. The values and plots below do account for the reboiler losses of steam in the vent gas.
See also the adjacent "AuxGraphs" plots of the mass flowrates of consumption of bulk flashed steam. That worksheet accounts only for vacuum system gas demand for the reboiler cases.

3.4b % SteamUse
AXG-9-29432-01document.xls
3.4b.128 04/18/202310:22:20
- 2 0 ,0 0 0 4 0 ,0 0 0 6 0 ,0 0 0 8 0 ,0 0 0 1 0 0 ,0 0 0 1 2 0 ,0 0 0
0 .0 %
5 .0 %
1 0 .0 %
1 5 .0 %
2 0 .0 %
2 5 .0 %
3 0 .0 %
3 5 .0 %
High Temperature Cases: Steam Used for Gas Removal
base case 2-stage ejector Column E reboiler + 2-st. ejector
3-stage biphase eductor hybrid turbo/2-st. ejector
Ga s Con c e ntra tion s in Ste a m, p pmv
% s
tea
m to
ga
s re
mo
va
l po
we
r(a
s p
ure
ste
am
)
- 20,000 40,000 60,000 80,000 100,000 120,000 140,000 160,000
0.0%
10.0%
20.0%
30.0%
40.0%
50.0%
60.0%
70.0%
80.0%
90.0%
Low Temperature Cases: Steam Used for Gas Removal
base case 2-stage ejector Column E
reboiler + 2-st. ejector 3-stage biphase eductor
hybrid turbo/2-st. ejector
Gas Concentrations in Steam, ppmv
% s
tea
m t
o g
as
re
mo
va
l p
ow
er
(as
pu
re s
tea
m)
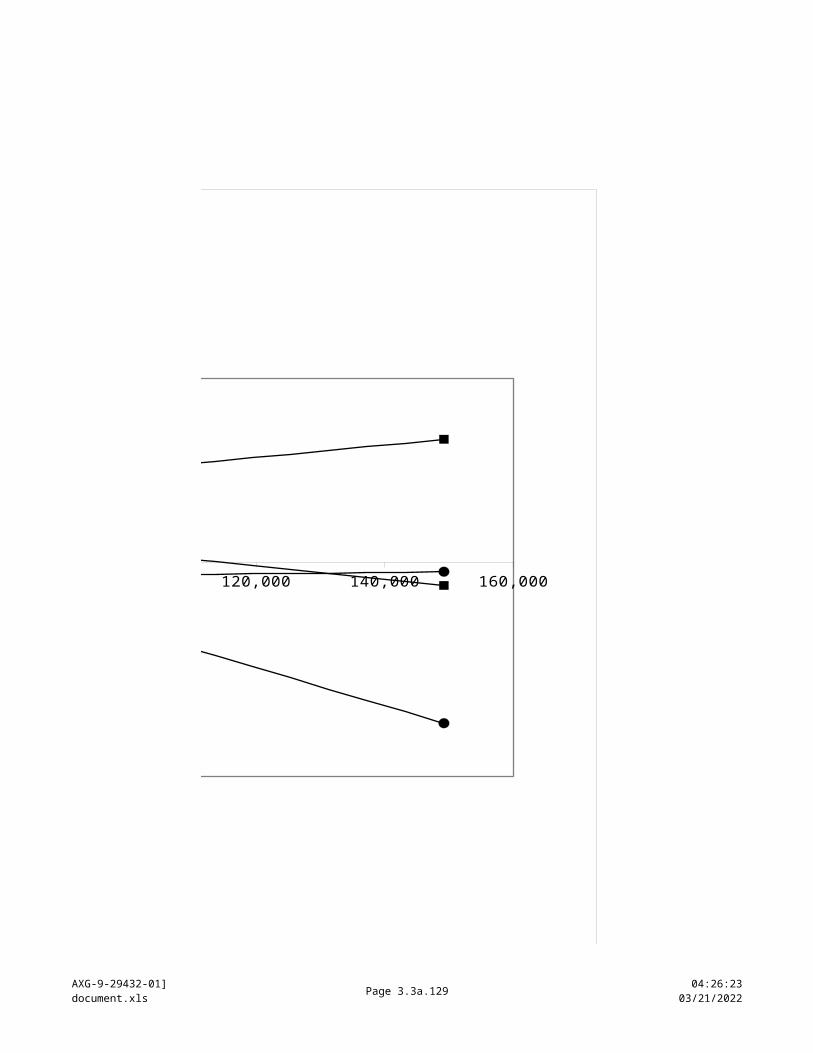
3.4b % SteamUse
AXG-9-29432-01document.xls
3.4b.129 04/18/202310:22:20
- 2 0 ,0 0 0 4 0 ,0 0 0 6 0 ,0 0 0 8 0 ,0 0 0 1 0 0 ,0 0 0 1 2 0 ,0 0 0
0 .0 %
5 .0 %
1 0 .0 %
1 5 .0 %
2 0 .0 %
2 5 .0 %
3 0 .0 %
3 5 .0 %
High Temperature Cases: Steam Used for Gas Removal
base case 2-stage ejector Column E reboiler + 2-st. ejector
3-stage biphase eductor hybrid turbo/2-st. ejector
Ga s Con c e ntra tion s in Ste a m, p pmv
% s
tea
m to
ga
s re
mo
va
l po
we
r(a
s p
ure
ste
am
)
3.4b % SteamUse
AXG-9-29432-01document.xls
3.4b.130 04/18/202310:22:20
flow to reboiler vent
steam
% of feed(pure steam)
normalized to flash
plant feed
12.6% 12.6%
flow to reboiler vent
steam
% of feed
normalized to flash
plant feed
7.4% 7.4%
flow to reboiler vent
steam% of feed
normalized to flash
3.4b % SteamUse
AXG-9-29432-01document.xls
3.4b.131 04/18/202310:22:20
plant feed
2.4% 2.4%

3.4b % SteamUse
AXG-9-29432-01document.xls
3.4b.132 04/18/202310:22:20
flow to reboiler vent
steam% of feed
normalized to flash
plant feed
2.4% 2.4%
flow to reboiler vent
steam% of feed
normalized to flash
plant feed
7.4% 7.4%
flow to reboiler vent
steam% of feed
normalized to flash
plant feed
12.6% 12.6%
3.4b % SteamUse
AXG-9-29432-01document.xls
3.4b.133 04/18/202310:22:20

3.4b % SteamUse
AXG-9-29432-01document.xls
3.4b.134 04/18/202310:22:20
flow to reboiler vent
steam% of feed
normalized to flash
plant feed
42.0% 42.0%
flow to reboiler vent
steam% of feed
normalized to flash
plant feed
26.6% 26.6%
This worksheet plots the percent of pure steam in the plant feed needed to achieve noncondensable gas removal from the power plant, when the power turbine is being fed sufficient flashed steam to produce 50 MW of power. The values and plots below do account for the reboiler losses of steam in the vent gas.
See also the adjacent "AuxGraphs" plots of the mass flowrates of consumption of bulk flashed steam. That worksheet accounts only for vacuum system gas demand for the reboiler cases.
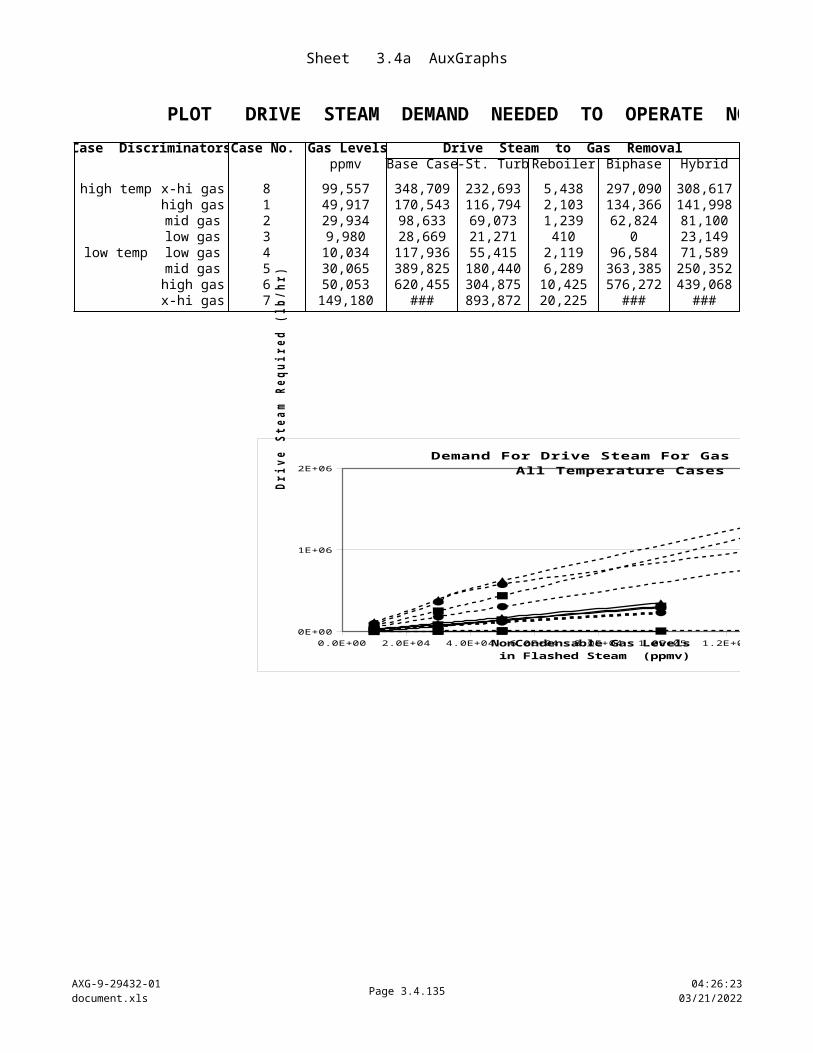
3.4b % SteamUse
AXG-9-29432-01document.xls
3.4b.135 04/18/202310:22:20
This worksheet plots the percent of pure steam in the plant feed needed to achieve noncondensable gas removal from the power plant, when the power turbine is being fed sufficient flashed steam to produce 50 MW of power. The values and plots below do account for the reboiler losses of steam in the vent gas.
See also the adjacent "AuxGraphs" plots of the mass flowrates of consumption of bulk flashed steam. That worksheet accounts only for vacuum system gas demand for the reboiler cases.
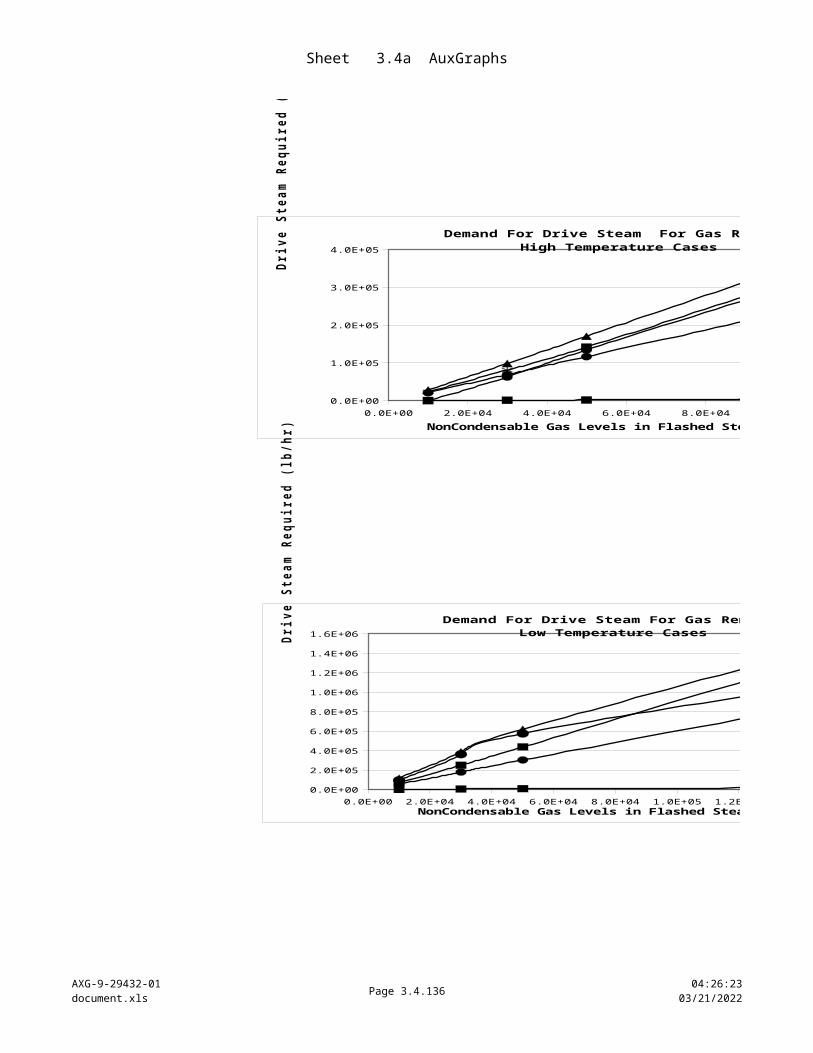
3.4b % SteamUse
AXG-9-29432-01document.xls
3.4b.136 04/18/202310:22:20
- 2 0 ,0 0 0 4 0 ,0 0 0 6 0 ,0 0 0 8 0 ,0 0 0 1 0 0 ,0 0 0 1 2 0 ,0 0 0
0 .0 %
5 .0 %
1 0 .0 %
1 5 .0 %
2 0 .0 %
2 5 .0 %
3 0 .0 %
3 5 .0 %
High Temperature Cases: Steam Used for Gas Removal
base case 2-stage ejector Column E reboiler + 2-st. ejector
3-stage biphase eductor hybrid turbo/2-st. ejector
Ga s Con c e ntra tion s in Ste a m, p pmv
% s
tea
m to
ga
s re
mo
va
l po
we
r(a
s p
ure
ste
am
)
- 20,000 40,000 60,000 80,000 100,000 120,000 140,000 160,000
0.0%
10.0%
20.0%
30.0%
40.0%
50.0%
60.0%
70.0%
80.0%
90.0%
Low Temperature Cases: Steam Used for Gas Removal
base case 2-stage ejector Column E
reboiler + 2-st. ejector 3-stage biphase eductor
hybrid turbo/2-st. ejector
Gas Concentrations in Steam, ppmv
% s
tea
m t
o g
as
re
mo
va
l p
ow
er
(as
pu
re s
tea
m)
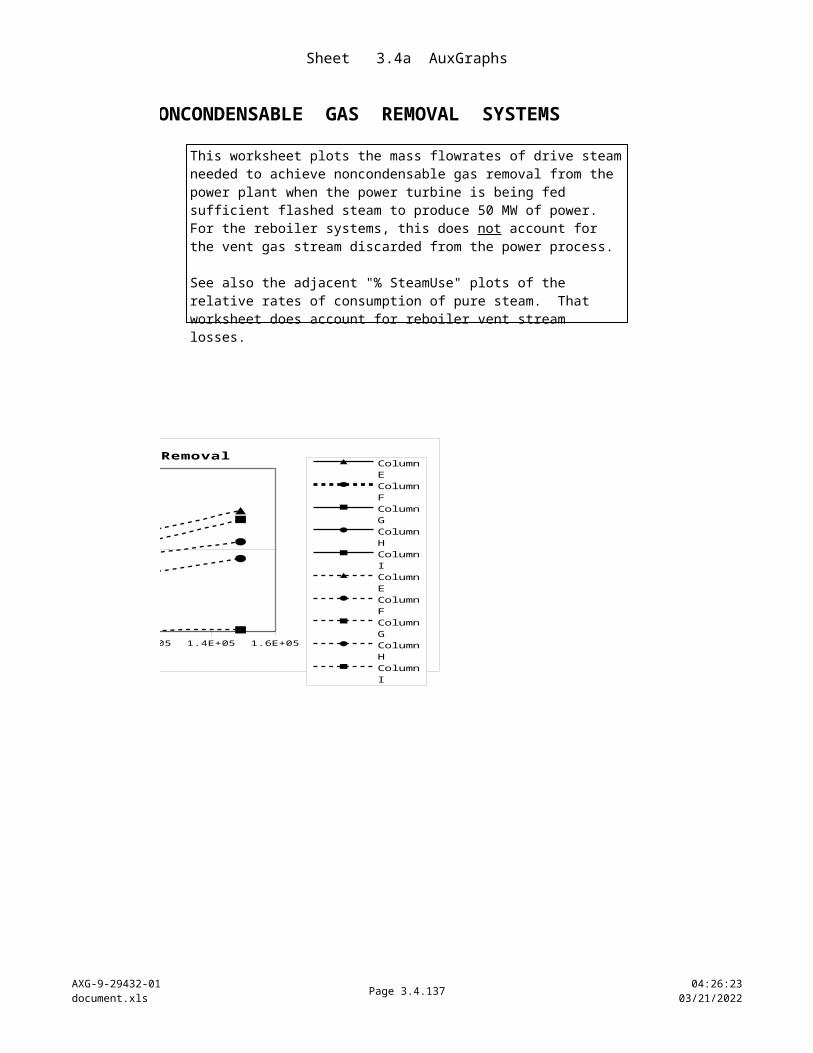
3.4b % SteamUse
AXG-9-29432-01document.xls
3.4b.137 04/18/202310:22:21
- 2 0 ,0 0 0 4 0 ,0 0 0 6 0 ,0 0 0 8 0 ,0 0 0 1 0 0 ,0 0 0 1 2 0 ,0 0 0
0 .0 %
5 .0 %
1 0 .0 %
1 5 .0 %
2 0 .0 %
2 5 .0 %
3 0 .0 %
3 5 .0 %
High Temperature Cases: Steam Used for Gas Removal
base case 2-stage ejector Column E reboiler + 2-st. ejector
3-stage biphase eductor hybrid turbo/2-st. ejector
Ga s Con c e ntra tion s in Ste a m, p pmv
% s
tea
m to
ga
s re
mo
va
l po
we
r(a
s p
ure
ste
am
)
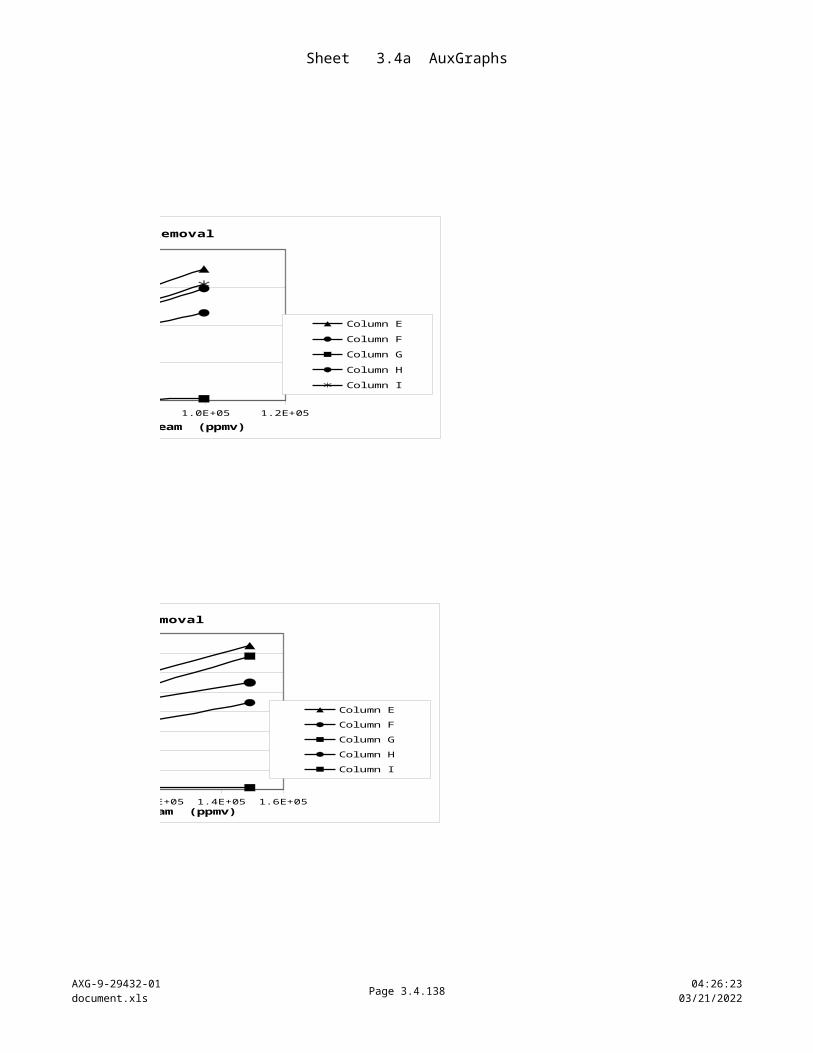
Sheet 3.5 Issues
AXG-9-29432-01document.xls Page 3.5.138 10:22:21
04/18/2023
SUBSYSTEMS COST ISSUES
geothermal source reservoir prolonged productivityproduction wells reduced replacementgathering system growth, durabilityall of above productivity/pressure loss
Power Plantpower turbine materials durability
productivity/efficiencycondensers materials durability
productivity/efficiencycooling towers fan power demand
c.w. pump power demandvacuum system materials durability
productivity/efficiencycapital and O&M costs
net plant electrical sales net revenues
Emissions Control (this is only a factor when required for plant permitting)
gas abatement process size
efficiency
product removal/disposaloperating suppliesmaterials durabilitypotential elimination of abatement process
FACILITY SECTIONS
Production Systems
ISSUES AFFECTING THE ECONOMICS OF GEOTHERMAL POWER SYSTEMS INFRASTRUCTURE
_______________________________________________________________________________
INFLUENCES OF THE CHOICE OF ALTERNATIVE METHODS FOR NONCONDENSABLE GAS REMOVAL
IN COMPARISON TO STEAM JET EJECTOR BASELINE SYSTEMS
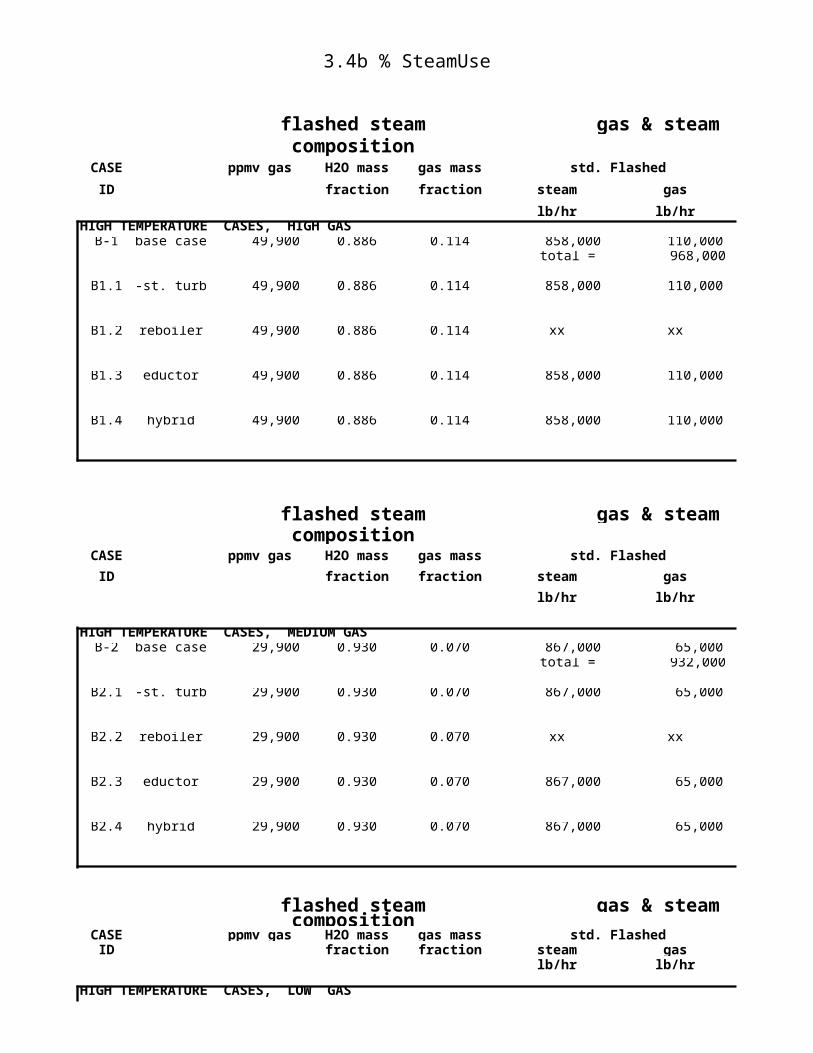
Sheet 3.5 Issues
AXG-9-29432-01document.xls Page 3.5.139 10:22:21
04/18/2023
Legend : clear cell -- no influence light shade -- moderate or indirect influence
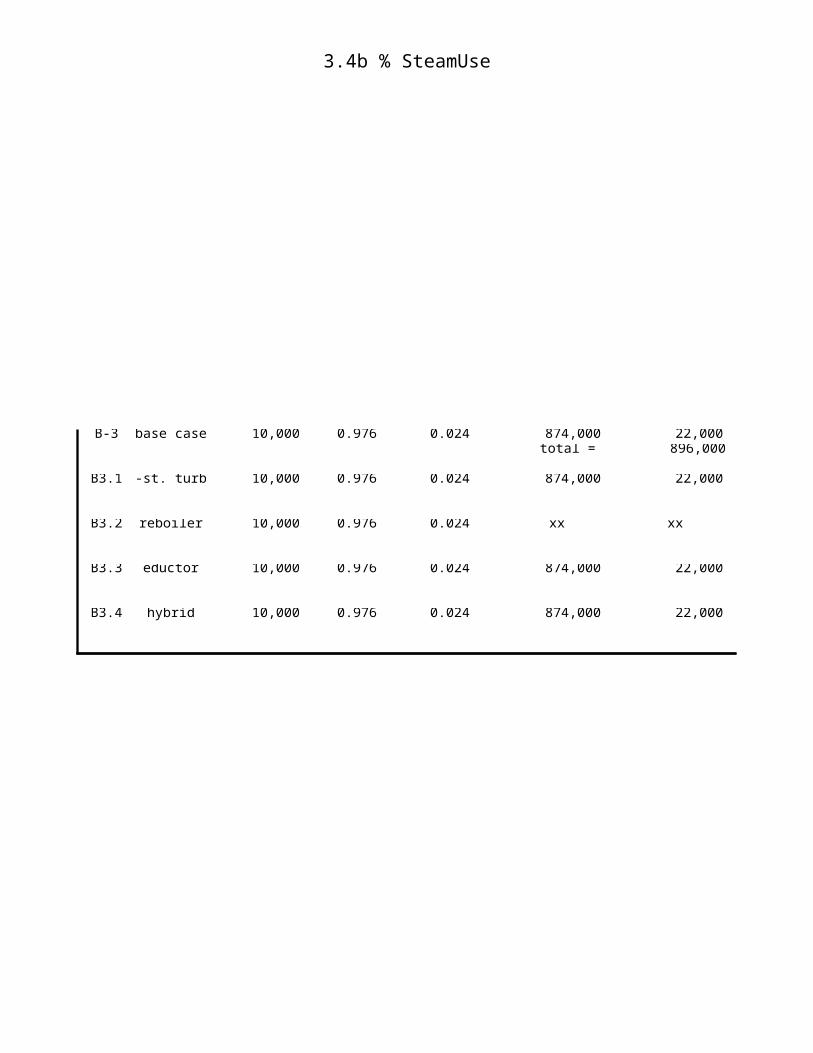
Sheet 3.5 Issues
AXG-9-29432-01document.xls Page 3.5.140 10:22:21
04/18/2023
GAS REMOVAL SYSTEMS
DOWNSTREAM VACUUM
overall facility service life baseline
frequency of new wells baseline
pipelines, controls, vessels baseline
reduced gross flow, pressure drop baseline
housing, rotors/blading baseline
power output baseline
shell and tubes baseline
reduced vapor load, higher heat transfer baseline
less cooling water flow baseline
less cooling water flow baseline
piping, vacuum drivers baseline
reduced steam use baseline
higher first cost, repairs, replacement baseline
increased output and/or reduced costs baseline
units smaller due to decreased throughput baseline
baseline
transport and disposal/sale baseline
lower quantities of makeup reagents baseline
pipelines, controls, vessels baseline
potential elimination of abatement process
AFFECTED COMPONENTS OR OPERATING FACTORS
Steam Jet Ejector
Turbo-Compressor
Biphase Eductor
operations at higher mass transfer, equilibrium driving forces
ISSUES AFFECTING THE ECONOMICS OF GEOTHERMAL POWER SYSTEMS INFRASTRUCTURE
_______________________________________________________________________________
INFLUENCES OF THE CHOICE OF ALTERNATIVE METHODS FOR NONCONDENSABLE GAS REMOVAL
IN COMPARISON TO STEAM JET EJECTOR BASELINE SYSTEMS
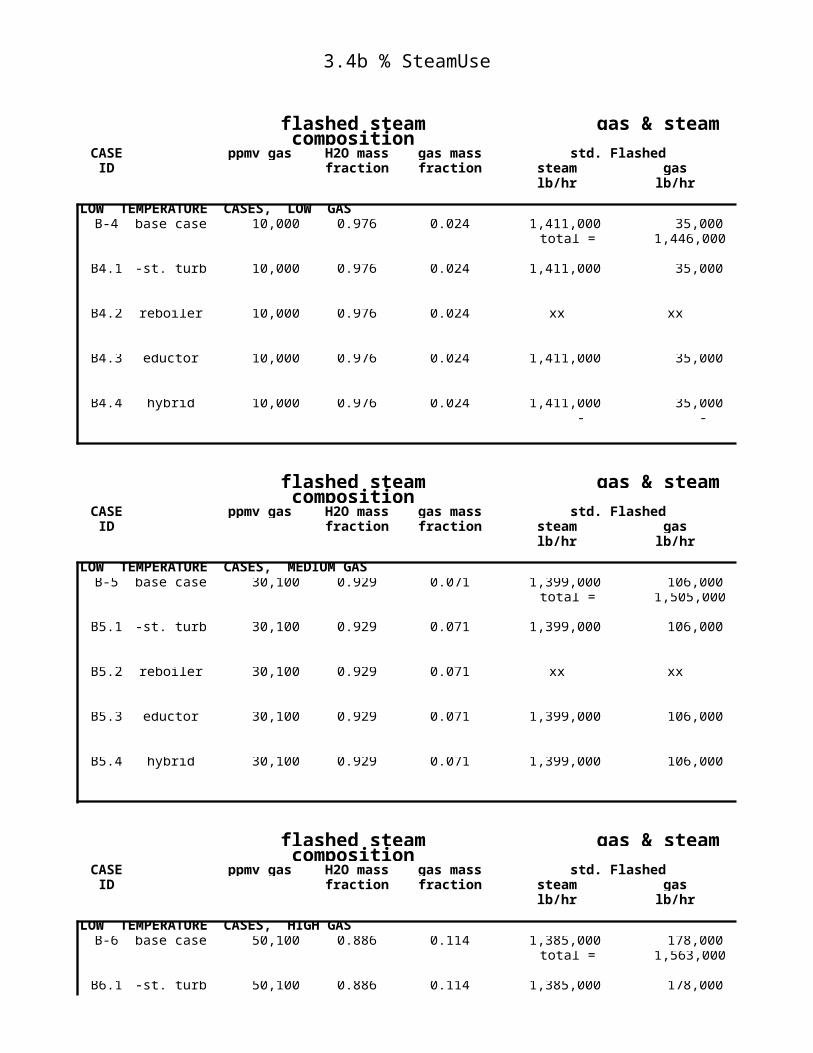
Sheet 3.5 Issues
AXG-9-29432-01document.xls Page 3.5.141 10:22:21
04/18/2023
dark shade -- strong or direct influence

Sheet 3.5 Issues
AXG-9-29432-01document.xls Page 3.5.142 10:22:21
04/18/2023
GAS REMOVAL SYSTEMS
UPSTREAM
Reboiler
ISSUES AFFECTING THE ECONOMICS OF GEOTHERMAL POWER SYSTEMS INFRASTRUCTURE
_______________________________________________________________________________
INFLUENCES OF THE CHOICE OF ALTERNATIVE METHODS FOR NONCONDENSABLE GAS REMOVAL
IN COMPARISON TO STEAM JET EJECTOR BASELINE SYSTEMS
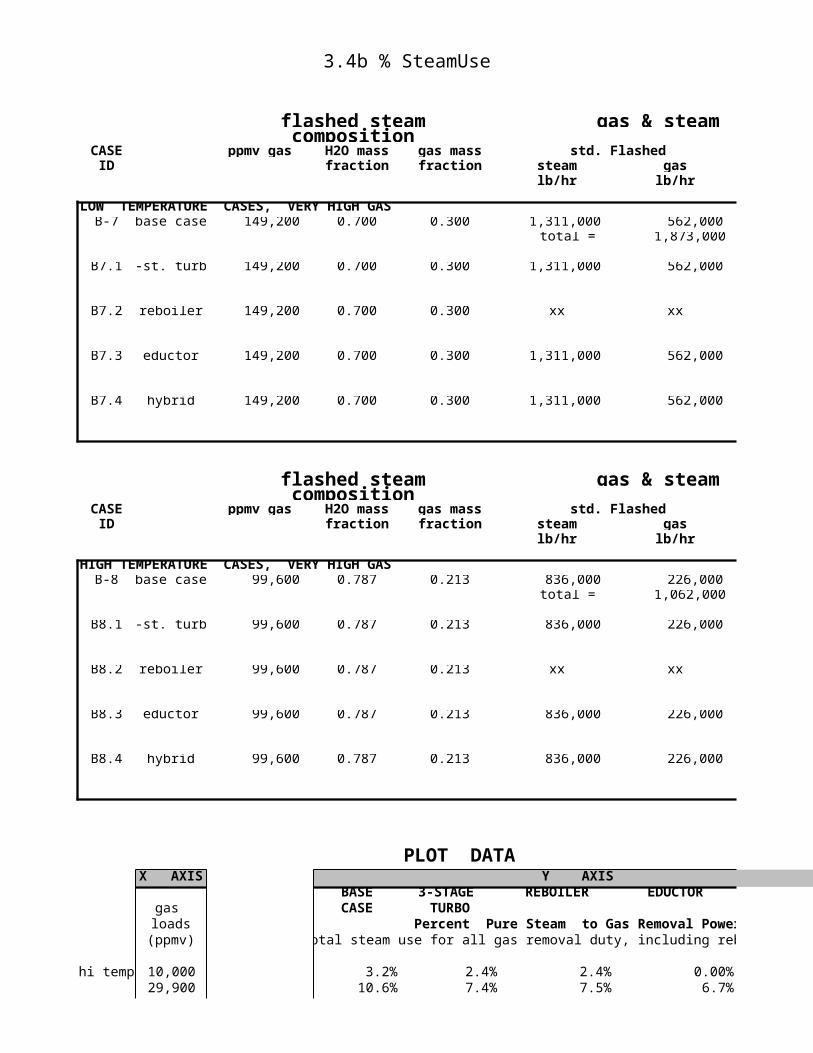
Sheet 4.1 Op'sDetails
AXG-9-29432-01document.xls Page 4.1.143 10:22:21
04/18/2023
OVERALL PLANT DEFINITION
CASE PARAMETERS AND TECHNOLOGY CONFIGURATION
MAIN CASE GROUP 1
B-1
B1.1
B1.2
B1.3
B1.4
Case No.
5 CASES : HIGH TEMPERATURE, HIGH PRESSURE, HIGH GAS
BASE CASE 1 -- single flash, condensing turbine, with 2-stage steam jet ejector vacuum system to remove noncondensable gases from main condenser. Target 50 MW gross power output from turbine/generator. Applied ca. 50,000 parts per million CO2 gas (mole basis, ppmv) in turbine feed steam. Production fluid delivered to flash at 550 oF.
ALTERNATE 1.1 -- replace ejector battery with 3-stage turbocompressor train. For costing, assume redundant ejector train as emergency backup. Other criteria as per Base Case.
ALTERNATE 1.2 -- a vertical-tube, falling film reboiler is installed after the flash separator, processing raw steam before its entry to the power turbine. Conventional steam jet ejectors handle the reduced gas load from the main condenser. Adjust the gross plant feed rate to maintain 50 MW production from the generator. Other criteria as per Base Case.
ALTERNATE 1.3 -- using the base case configuration, replace the steam jet ejectors with eductors for which the motive fluid is flashing, spent brine from the plant inlet flash tank. Other criteria as per Base Case.
ALTERNATE 1.4 -- modify the base case ejector train to a configuration with two stages of steam jet ejectors and a 3rd-stage turbocompressor. The ejectors will be at higher efficiency than in a net 2-stage system. A backup 3rd stage ejector is assumed. Other criteria as per Base Case.
RETURN
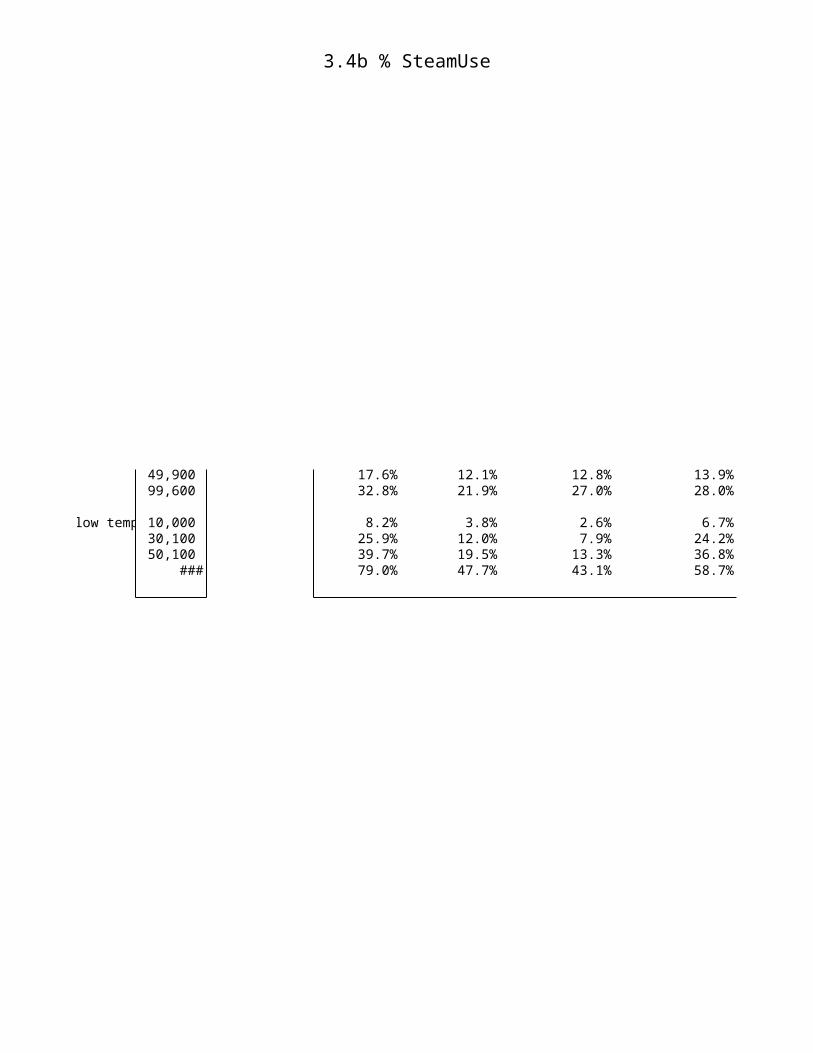
Sheet 4.1 Op'sDetails
AXG-9-29432-01document.xls Page 4.1.144 10:22:21
04/18/2023
OVERALL PLANT DEFINITION
CASE PARAMETERS AND TECHNOLOGY CONFIGURATION
Case No.
RETURN
MAIN CASE GROUP 2
B-2
B2.1 ALTERNATE 2.1 -- replace ejector battery with 3-stage turbocompressor train.
B2.2 ALTERNATE 2.2 -- a vertical-tube, falling film reboiler is installed after the flash separator.
B2.3 ALTERNATE 2.3 -- replace the steam jet ejectors with biphase eductors.
B2.4 ALTERNATE 2.4 -- use two stages of steam jet ejectors and a 3rd-stage turbocompressor.
5 CASES : HIGH TEMPERATURE, HIGH PRESSURE, MEDIUM GAS
BASE CASE 2 -- same as Base Case 1 but designating ca. 20,000 ppmv CO2 in turbine feed steam.
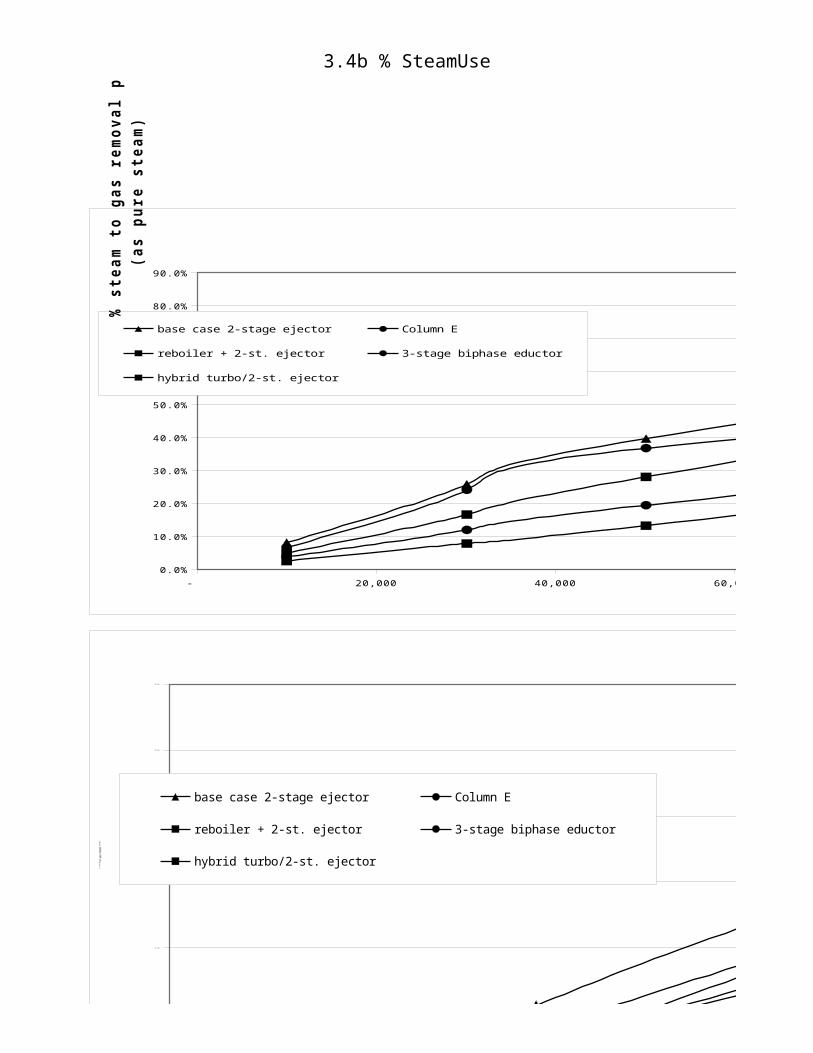
Sheet 4.1 Op'sDetails
AXG-9-29432-01document.xls Page 4.1.145 10:22:21
04/18/2023
OVERALL PLANT DEFINITION
CASE PARAMETERS AND TECHNOLOGY CONFIGURATION
Case No.
RETURN
MAIN CASE GROUP 3
B-3
B3.1 ALTERNATE 3.1 -- replace ejector battery with 3-stage turbocompressor train.
B3.2 ALTERNATE 3.2 -- a vertical-tube, falling film reboiler is installed after the flash separator.
B3.3 ALTERNATE 3.3 -- replace the steam jet ejectors with biphase eductors.
B3.4 ALTERNATE 3.4 -- use two stages of steam jet ejectors and a 3rd-stage turbocompressor.
5 CASES : HIGH TEMPERATURE, HIGH PRESSURE, LOW GAS
BASE CASE 2 -- same as Base Case 1 but designating ca. 10,000 ppmv CO2 in turbine feed steam.
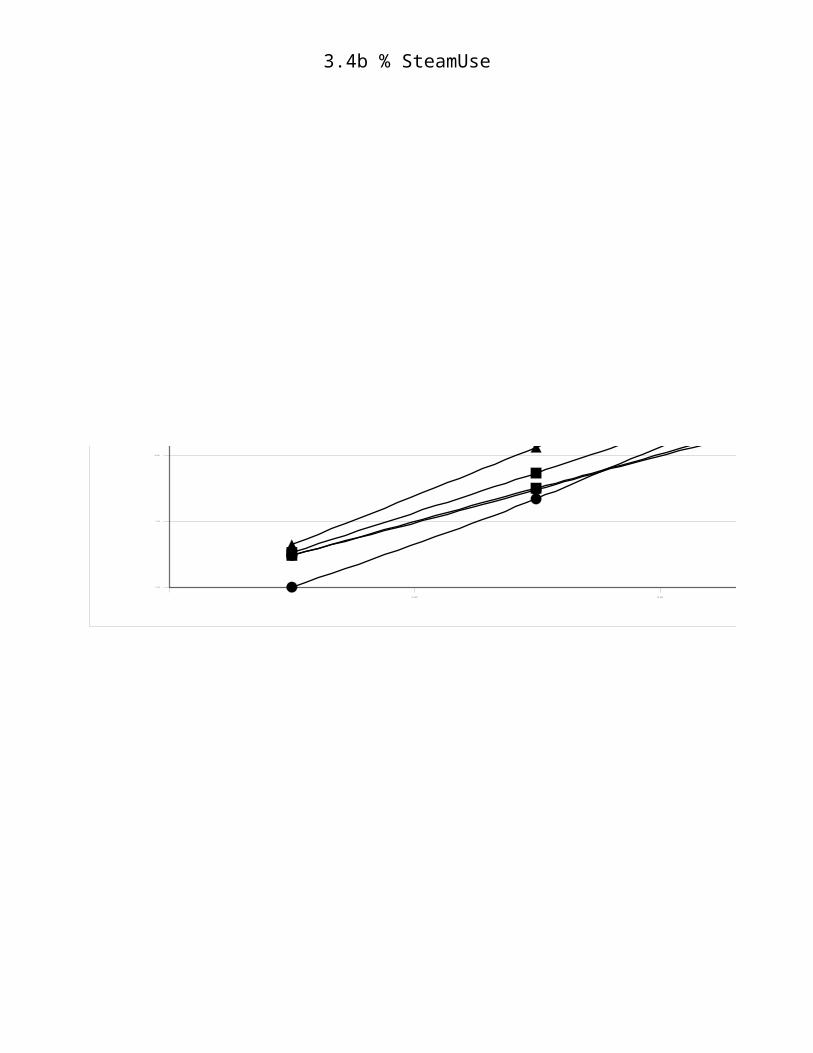
Sheet 4.1 Op'sDetails
AXG-9-29432-01document.xls Page 4.1.146 10:22:21
04/18/2023
OVERALL PLANT DEFINITION
CASE PARAMETERS AND TECHNOLOGY CONFIGURATION
Case No.
RETURN
MAIN CASE GROUP 4
B-4
B4.1 ALTERNATE 4.1 -- replace ejector battery with 3-stage turbocompressor train.
B4.2 ALTERNATE 4.2 -- a vertical-tube, falling film reboiler is installed after the flash separator.
B4.3 ALTERNATE 4.3 -- replace the steam jet ejectors with biphase eductors.
B4.4 ALTERNATE 4.4 -- use two stages of steam jet ejectors and a 3rd-stage turbocompressor.
5 CASES : LOW TEMPERATURE, LOW PRESSURE, LOW GAS
BASE CASE 4 -- same as Base Case 1 but with production fluid delivered to flash at 350 oF.
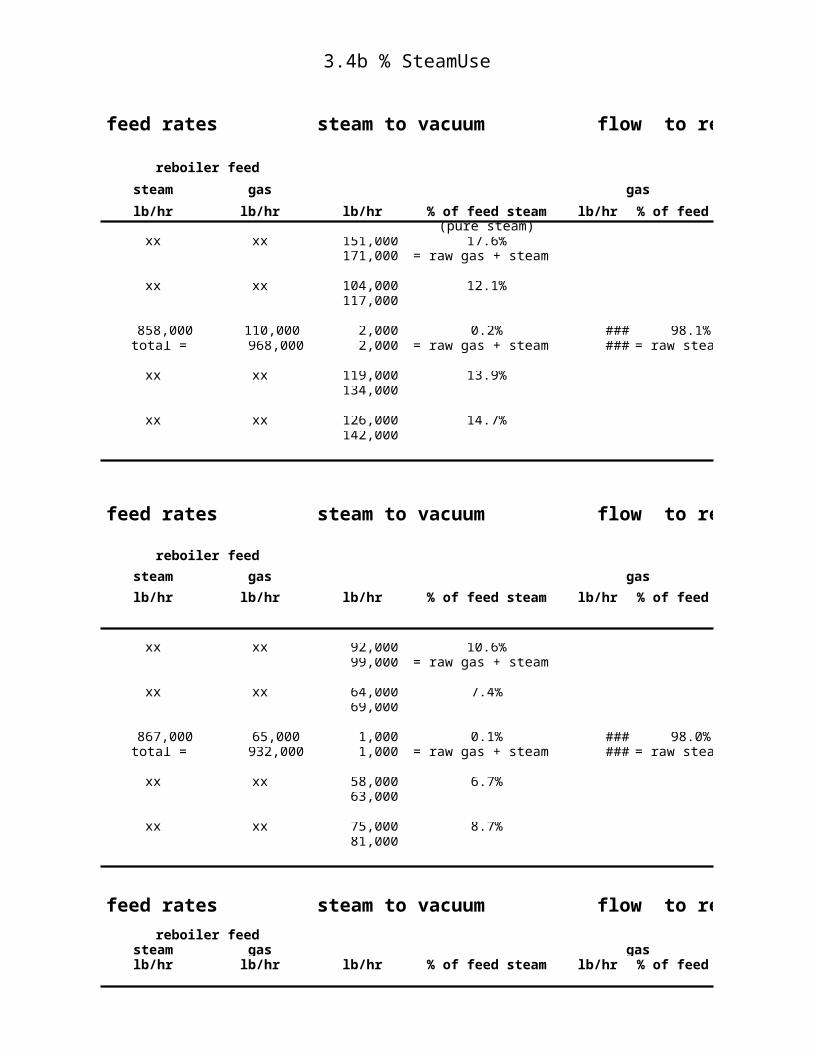
Sheet 4.1 Op'sDetails
AXG-9-29432-01document.xls Page 4.1.147 10:22:21
04/18/2023
OVERALL PLANT DEFINITION
CASE PARAMETERS AND TECHNOLOGY CONFIGURATION
Case No.
RETURN
MAIN CASE GROUP 5
B-5
B5.1 ALTERNATE 5.1 -- replace ejector battery with 3-stage turbocompressor train.
B5.2 ALTERNATE 5.2 -- a vertical-tube, falling film reboiler is installed after the flash separator.
B5.3 ALTERNATE 5.3 -- replace the steam jet ejectors with biphase eductors.
B5.4 ALTERNATE 5.4 -- use two stages of steam jet ejectors and a 3rd-stage turbocompressor.
5 CASES : LOW TEMPERATURE, LOW PRESSURE, MEDIUM GAS
BASE CASE 5 -- same as Base Case 2 but with production fluid delivered to flash at 350 oF.
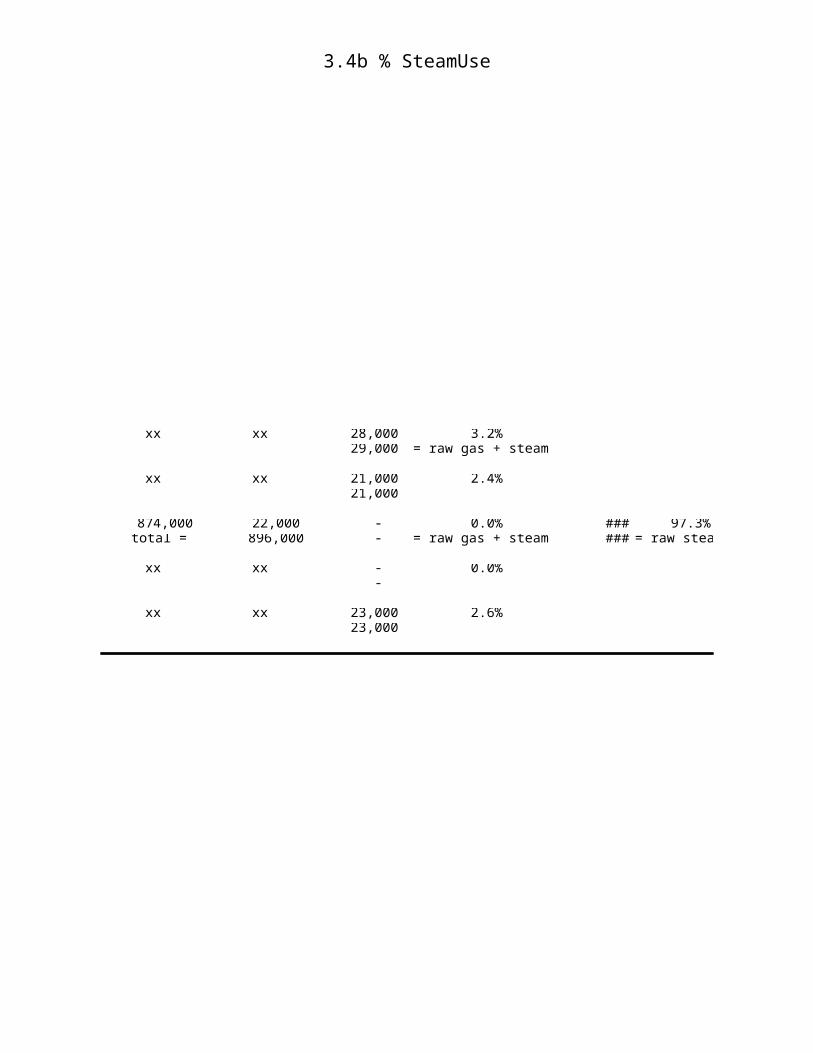
Sheet 4.1 Op'sDetails
AXG-9-29432-01document.xls Page 4.1.148 10:22:21
04/18/2023
OVERALL PLANT DEFINITION
CASE PARAMETERS AND TECHNOLOGY CONFIGURATION
Case No.
RETURN
PLACE HOLDER
MAIN CASE GROUP 6
B-6
B6.1 ALTERNATE 6.1 -- replace ejector battery with 3-stage turbocompressor train.
B6.2 ALTERNATE 6.2 -- a vertical-tube, falling film reboiler is installed after the flash separator.
B6.3 ALTERNATE 6.3 -- replace the steam jet ejectors with biphase eductors.
B6.4 ALTERNATE 6.4 -- use two stages of steam jet ejectors and a 3rd-stage turbocompressor.
5 CASES : LOW TEMPERATURE, LOW PRESSURE, HIGH GAS
BASE CASE 6 -- same as Base Case 3 but with production fluid delivered to flash at 350 oF.
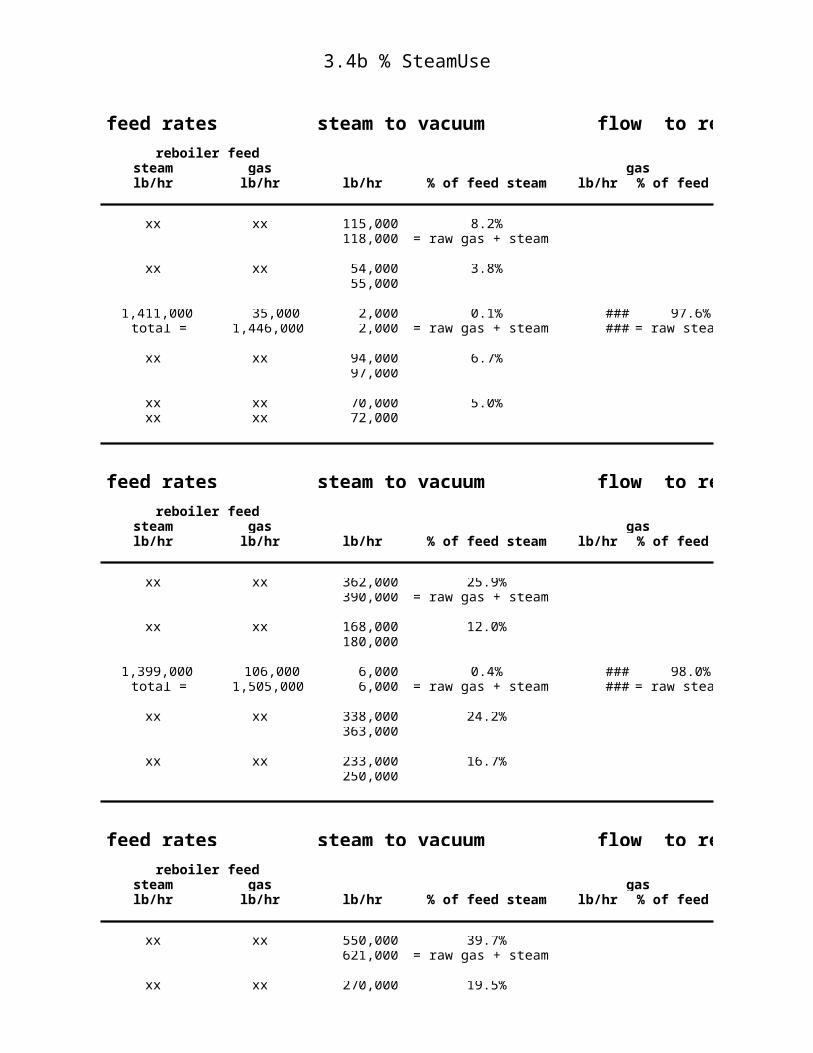
Sheet 4.1 Op'sDetails
AXG-9-29432-01document.xls Page 4.1.149 10:22:21
04/18/2023
OVERALL PLANT DEFINITION
CASE PARAMETERS AND TECHNOLOGY CONFIGURATION
Case No.
RETURN
PLACE HOLDER
MAIN CASE GROUP 7
B-7
B7.1 ALTERNATE 7.1 -- replace ejector battery with 3-stage turbocompressor train.
B7.2 ALTERNATE 7.2 -- a vertical-tube, falling film reboiler is installed after the flash separator.
B7.3 ALTERNATE 7.3 -- replace the steam jet ejectors with biphase eductors.
B7.4 ALTERNATE 7.4 -- use two stages of steam jet ejectors and a 3rd-stage turbocompressor.
5 CASES : LOW TEMPERATURE, LOW PRESSURE, VERY HIGH GAS
BASE CASE 7 -- same as Base Case 2 but with production fluid delivered to flash at 350 oF.
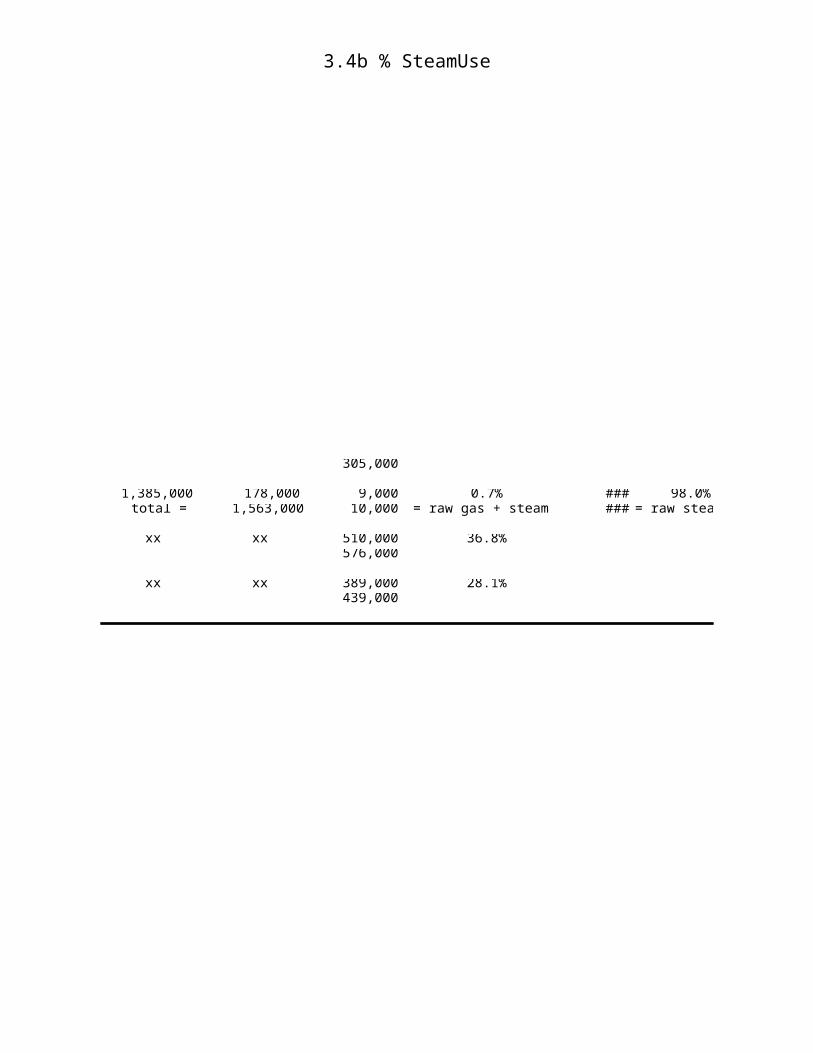
Sheet 4.1 Op'sDetails
AXG-9-29432-01document.xls Page 4.1.150 10:22:21
04/18/2023
OVERALL PLANT DEFINITION
CASE PARAMETERS AND TECHNOLOGY CONFIGURATION
Case No.
RETURN
PLACE HOLDER
MAIN CASE GROUP 8
B-8
B8.1 ALTERNATE 8.1 -- replace ejector battery with 3-stage turbocompressor train.
B8.2 ALTERNATE 8.2 -- a vertical-tube, falling film reboiler is installed after the flash separator.
B8.3 ALTERNATE 8.3 -- replace the steam jet ejectors with biphase eductors.
B8.4 ALTERNATE 8.4 -- use two stages of steam jet ejectors and a 3rd-stage turbocompressor.
5 CASES : HIGH TEMPERATURE, HIGH PRESSURE, VERY HIGH GAS
BASE CASE 6 -- same as Base Case 3 but with production fluid delivered to flash at 350 oF.
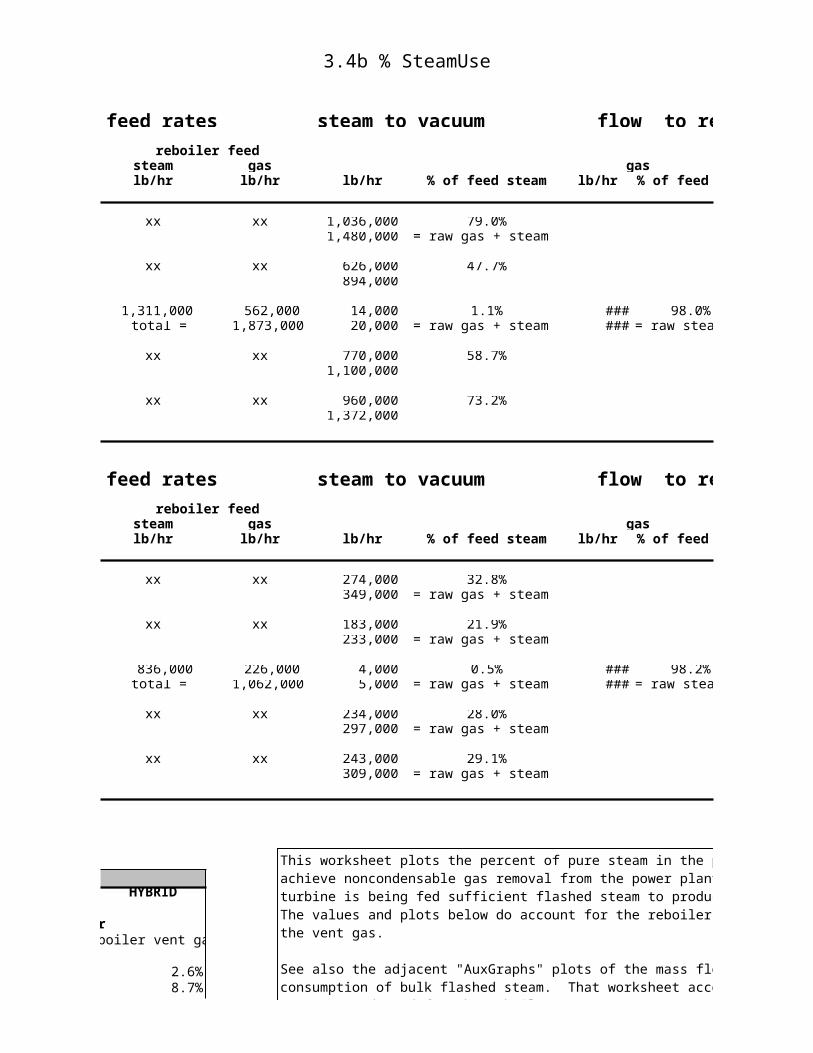
Sheet 4.1 Op'sDetails
AXG-9-29432-01document.xls Page 4.1.151 10:22:21
04/18/2023
OVERALL PLANT DEFINITION
CASE PARAMETERS AND TECHNOLOGY CONFIGURATION
Case No.
RETURN
PLACE HOLDER
SENSITIVITY GROUP S-1 -- LOW EJECTOR EFFICIENCY
S-1
S1.1 ALTERNATE S1.1 -- replace ejector battery with 3-stage turbocompressor train.
S1.2 ALTERNATE S1.2 -- a vertical-tube, falling film reboiler is installed after the flash separator.
S1.3 ALTERNATE S1.3 -- replace the steam jet ejectors with biphase eductors.
S1.4 ALTERNATE S1.4 -- use two stages of steam jet ejectors and a 3rd-stage turbocompressor.
PLACE HOLDER
5 CASES : HIGH TEMPERATURE, HIGH PRESSURE, HIGH GAS
BASE CASE S1 -- same as Base Case 1 but with a 3-stage steam jet ejector system in place of the two stage system. Expect alternative technologies' prior advantages to be lessened.
Sheet 4.1 Op'sDetails
AXG-9-29432-01document.xls Page 4.1.152 10:22:21
04/18/2023
OVERALL PLANT DEFINITION
CASE PARAMETERS AND TECHNOLOGY CONFIGURATION
Case No.
RETURN
SENSITIVITY GROUP S-2 -- LOW EJECTOR EFFICIENCY
S-2
S2.1 ALTERNATE S2.1 -- replace ejector battery with 3-stage turbocompressor train.
S2.2 ALTERNATE S2.2 -- a vertical-tube, falling film reboiler is installed after the flash separator.
S2.3 ALTERNATE S2.3 -- replace the steam jet ejectors with biphase eductors.
S2.4 ALTERNATE S2.4 -- use two stages of steam jet ejectors and a 3rd-stage turbocompressor.
PLACE HOLDER
5 CASES : LOW TEMPERATURE, LOW PRESSURE, LOW GAS
BASE CASE S2 -- same as Base Case 1 but with steam jet ejector efficiencies reduced from 23 % to 15 %. Expect alternative technologies" advantages to increase.
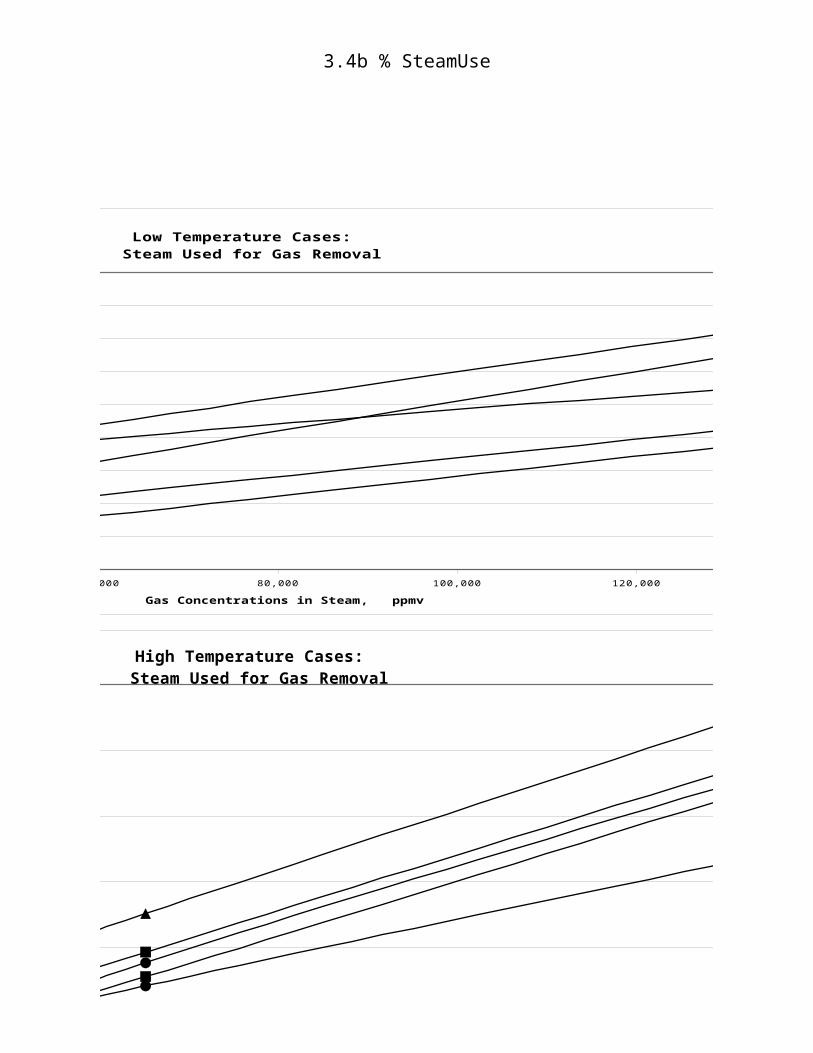
Sheet 4.1 Op'sDetails
AXG-9-29432-01document.xls Page 4.1.153 10:22:21
04/18/2023
OVERALL PLANT DEFINITION
CASE PARAMETERS AND TECHNOLOGY CONFIGURATION
Case No.
RETURN
S-3
S3.1 ALTERNATE S3.1 -- replace ejector battery with 3-stage turbocompressor train.
S3.2 ALTERNATE S3.2 -- a vertical-tube, falling film reboiler is installed after the flash separator.
S3.3 ALTERNATE S3.3 -- replace the steam jet ejectors with biphase eductors.
S3.4 ALTERNATE S3.4 -- use two stages of steam jet ejectors and a 3rd-stage turbocompressor.
PLACE HOLDER
SENSITIVITY GROUP S-3 -- 80 oF WET BULB TEMPERATURE
5 CASES : HIGH TEMPERATURE, HIGH PRESSURE, MID GAS
BASE CASE S3 -- same as Base Case1 but with a wet bulb temperature of 70 oF. Expect all parasitic steam loads to increase.

Sheet 4.1 Op'sDetails
AXG-9-29432-01document.xls Page 4.1.154 10:22:21
04/18/2023
OVERALL PLANT DEFINITION
CASE PARAMETERS AND TECHNOLOGY CONFIGURATION
Case No.
RETURN
S-4
S4.1 ALTERNATE S4.1 -- replace ejector battery with 3-stage turbocompressor train.
S4.2 ALTERNATE S4.2 -- a vertical-tube, falling film reboiler is installed after the flash separator.
S4.3 ALTERNATE S4.3 -- replace the steam jet ejectors with biphase eductors.
S4.4 ALTERNATE S4.4 -- use two stages of steam jet ejectors and a 3rd-stage turbocompressor.
PLACE HOLDER
SENSITIVITY GROUP S-4 -- 80 oF WET BULB TEMPERATURE
5 CASES : LOW TEMPERATURE, LOW PRESSURE, LOW GAS
BASE CASE S4 -- same as Base Case 1 and Base Case S3, but with a wet bulb temperature of 80 oF. Expect all parasitic steam loads to increase.
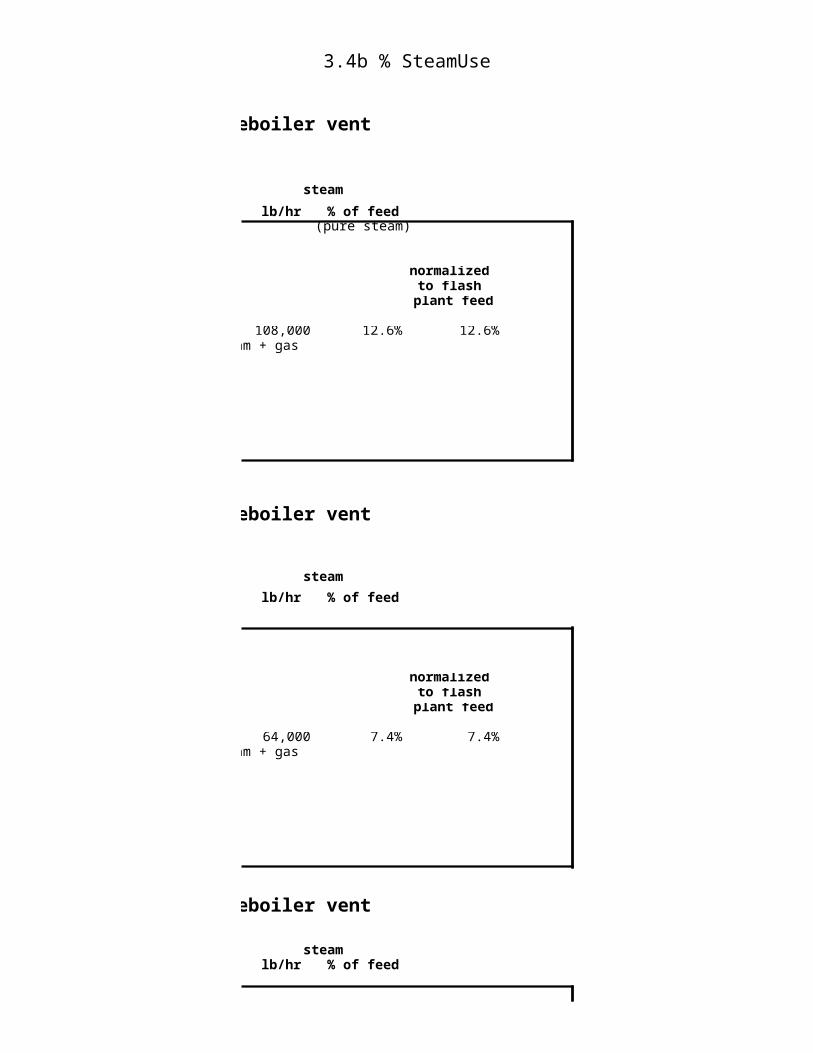
Sheet 4.1 Op'sDetails
AXG-9-29432-01document.xls Page 4.1.155 10:22:21
04/18/2023
OVERALL PLANT DEFINITION
CASE PARAMETERS AND TECHNOLOGY CONFIGURATION
Case No.
RETURN
SENSITIVITY GROUP S-5 --
S-5
S5.1 ALTERNATE S5.1 -- replace ejector battery with 3-stage turbocompressor train.
S5.2 ALTERNATE S5.2 -- a vertical-tube, falling film reboiler is installed after the flash separator.
S5.3 ALTERNATE S5.3 -- replace the steam jet ejectors with biphase eductors.
S5.4 ALTERNATE S5.4 -- use two stages of steam jet ejectors and a 3rd-stage turbocompressor.
PLACE HOLDER
5 CASES : LOW TEMPERATURE, LOW PRESSURE, LOW GAS
BASE CASE S5 -- same as Base Case 4 but with 3-stage steam jet ejector system in place of 2-stage system.
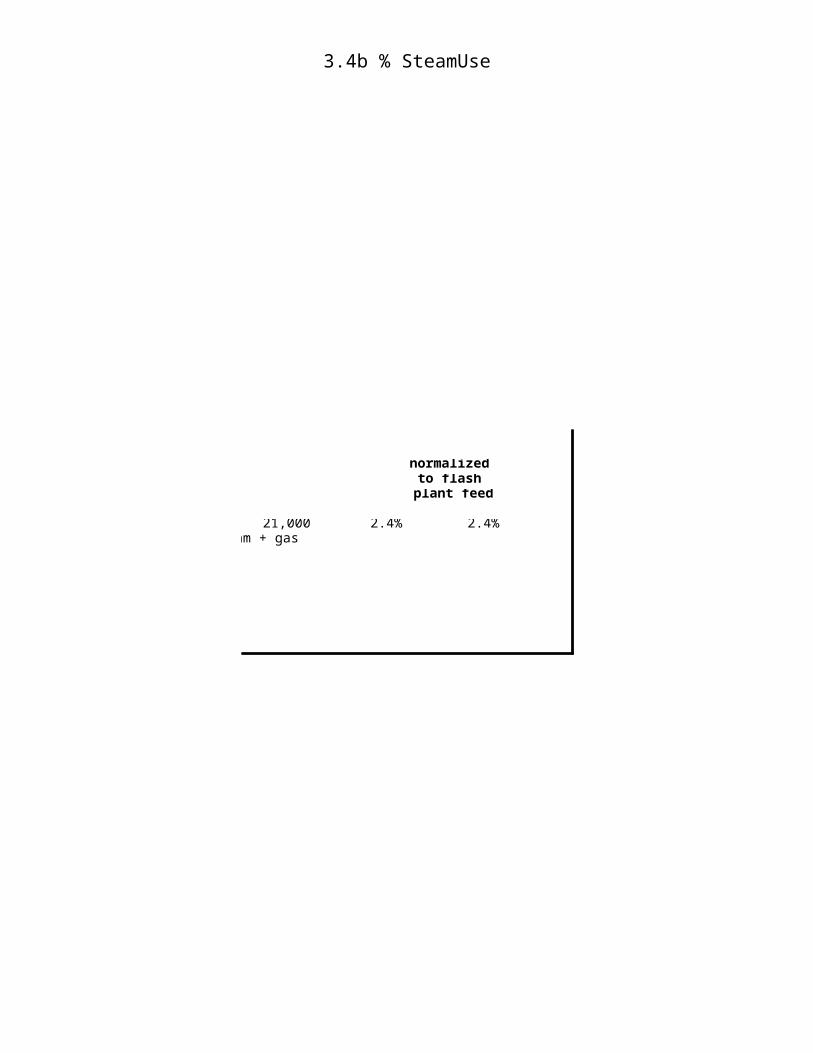
Sheet 4.1 Op'sDetails
AXG-9-29432-01document.xls Page 4.1.156 10:22:21
04/18/2023
OVERALL PLANT DEFINITION
CASE PARAMETERS AND TECHNOLOGY CONFIGURATION
Case No.
RETURN
SENSITIVITY GROUP S-6 --
S-6
S6.1 ALTERNATE S6.1 -- replace ejector battery with 3-stage turbocompressor train.
S6.2 ALTERNATE S6.2 -- a vertical-tube, falling film reboiler is installed after the flash separator.
S6.3 ALTERNATE S6.3 -- replace the steam jet ejectors with biphase eductors.
S6.4 ALTERNATE S6.4 -- use two stages of steam jet ejectors and a 3rd-stage turbocompressor.
PLACE HOLDER
5 CASES : LOW TEMPERATURE, LOW PRESSURE, LOW GAS
BASE CASE S6 -- same as Base Case 4 but with steam jet ejector efficiencies reduced from 23 % to 15 %. Expect alternative technologies' advantages to increase.
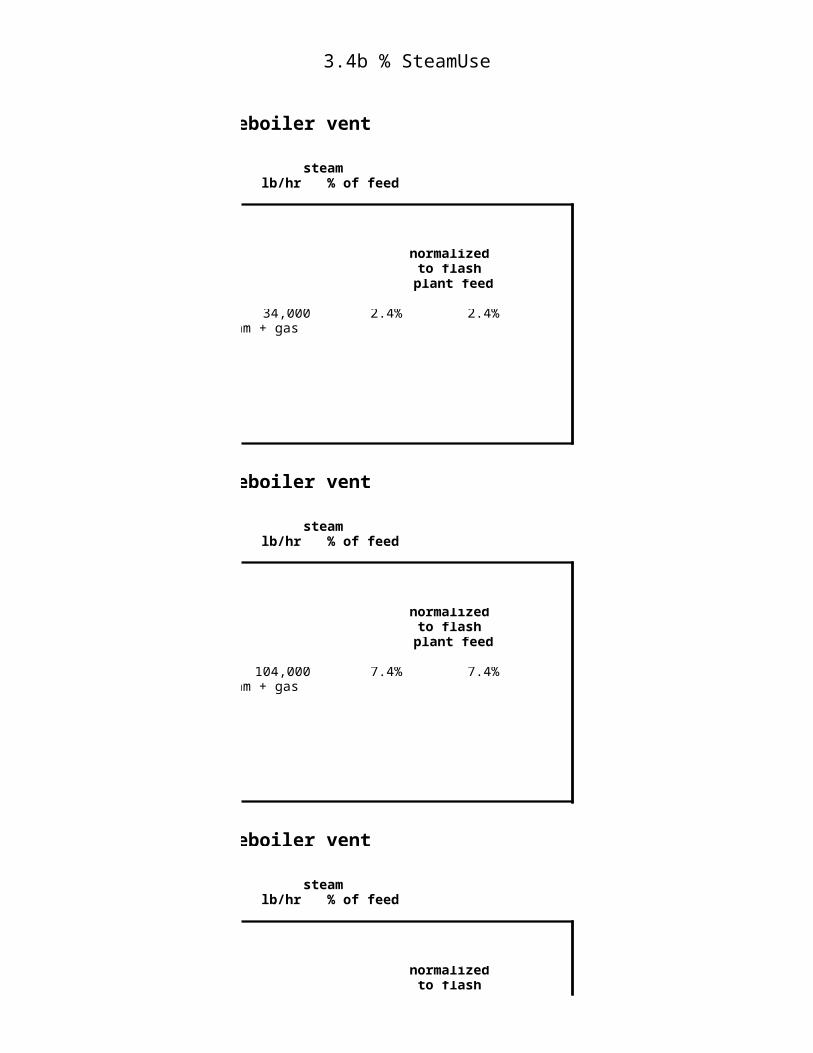
Sheet 4.1 Op'sDetails
AXG-9-29432-01document.xls Page 4.1.157 10:22:21
04/18/2023
OVERALL PLANT DEFINITION
CASE PARAMETERS AND TECHNOLOGY CONFIGURATION
Case No.
RETURN
SENSITIVITY GROUP S-7 --
S-7
S7.1 ALTERNATE S7.1 -- replace ejector battery with 3-stage turbocompressor train.
S7.2 ALTERNATE S7.2 -- a vertical-tube, falling film reboiler is installed after the flash separator.
S7.3 ALTERNATE S7.3 -- replace the steam jet ejectors with biphase eductors.
S7.4 ALTERNATE S7.4 -- use two stages of steam jet ejectors and a 3rd-stage turbocompressor.
PLACE HOLDER
5 CASES : LOW TEMPERATURE, LOW PRESSURE, LOW GAS
BASE CASE S7 -- same as Base Case 4 but with wet bulb temperature of 80 oF. Expect all parasitic steam loads to increase.
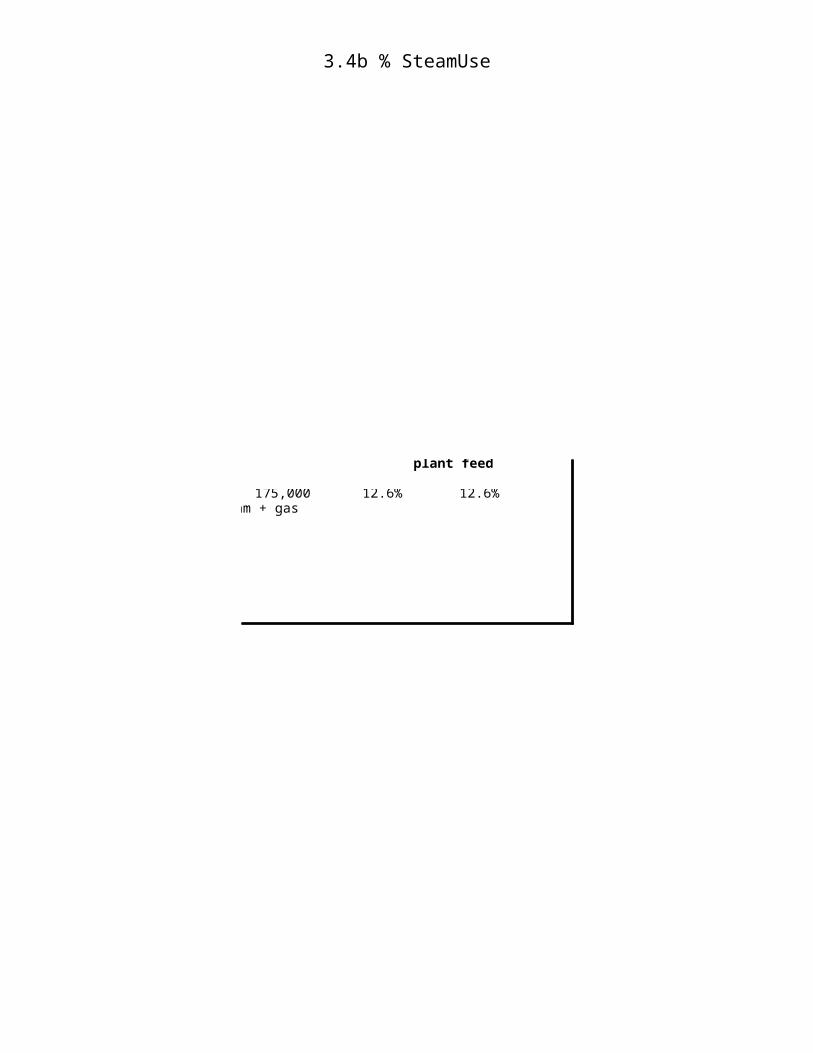
Sheet 4.1 Op'sDetails
AXG-9-29432-01document.xls Page 4.1.158 10:22:21
04/18/2023
OVERALL PLANT DEFINITION
CASE PARAMETERS AND TECHNOLOGY CONFIGURATION
Case No.
RETURN
SENSITIVITY GROUP S-8 --
S-8
S8.1 ALTERNATE S8.1 -- replace ejector battery with 3-stage turbocompressor train.
S8.2 ALTERNATE S8.2 -- a vertical-tube, falling film reboiler is installed after the flash separator.
S8.3 ALTERNATE S8.3 -- replace the steam jet ejectors with biphase eductors.
S8.4 ALTERNATE S8.4 -- use two stages of steam jet ejectors and a 3rd-stage turbocompressor.
PLACE HOLDER
5 CASES : HIGH TEMPERATURE, HIGH PRESSURE, HIGH GAS
BASE CASE S8 -- same as Base Case
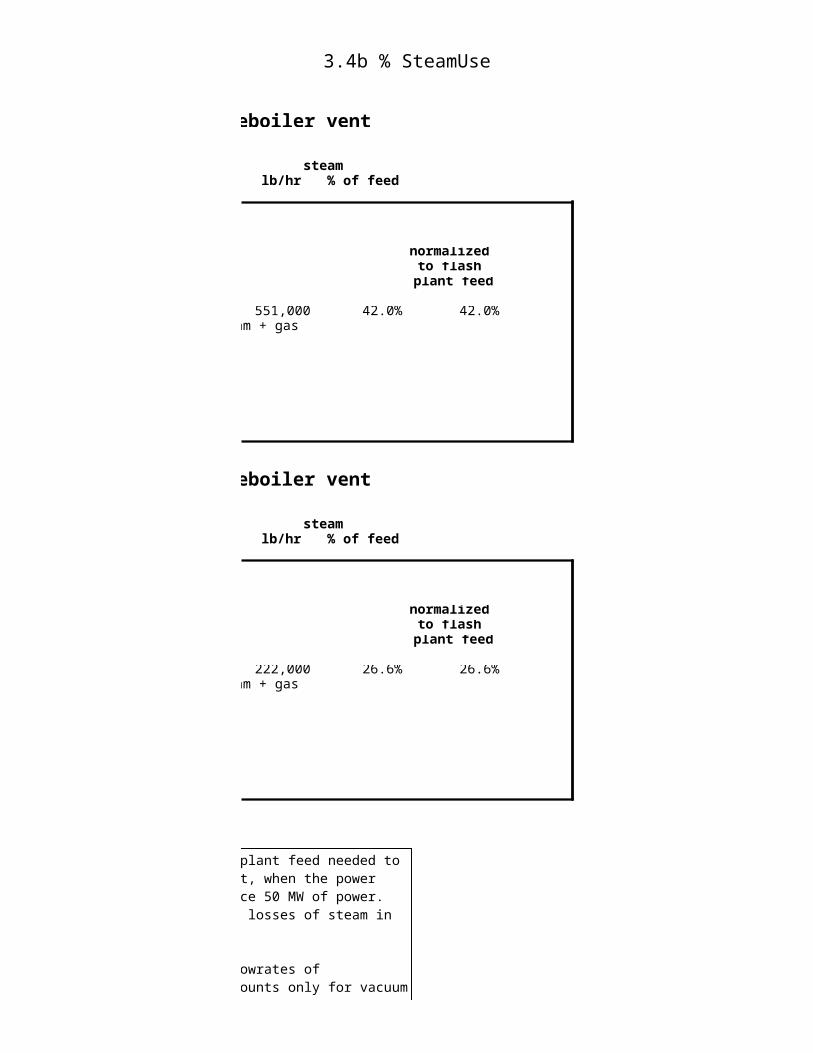
Sheet 4.1 Op'sDetails
AXG-9-29432-01document.xls Page 4.1.159 10:22:21
04/18/2023
OVERALL PLANT DEFINITION
CASE PARAMETERS AND TECHNOLOGY CONFIGURATION
Case No.
RETURN
SENSITIVITY GROUP S-9 --
S-9
S9.1 ALTERNATE S9.1 -- replace ejector battery with 3-stage turbocompressor train.
S9.2 ALTERNATE S9.2 -- a vertical-tube, falling film reboiler is installed after the flash separator.
S9.3 ALTERNATE S9.3 -- replace the steam jet ejectors with biphase eductors.
S9.4 ALTERNATE S9.4 -- use two stages of steam jet ejectors and a 3rd-stage turbocompressor.
5 CASES : HIGH TEMPERATURE, HIGH PRESSURE, HIGH GAS
BASE CASE S9 -- same as Base Case, substituting a
Sheet 4.1 Op'sDetails
AXG-9-29432-01document.xls Page 4.1.160 10:22:21
04/18/2023
B-1
B1.1
B1.2
B1.3
B1.4
Case No.
OVERALL PLANT DEFINITION
P = PSIA
2,291,000 T = 550 48,800
P = 1,177
2,291,000 T = 550 48,800
P = 1176.8
2,289,000 T = 550 48,800
P = 1177
2,291,000 T = 550 48,800
P = 1177
2,291,000 T = 550 48,800
P = 1177
GROSS PLANT FEED (combined well flow to flash)
Combined Brine & Steam Flow
T = oF Combined Brine
& Steam Gas Conc'n.
lbs / hour (at 15% steam
quality)
parts per million by weight
(ppmw) as CO2
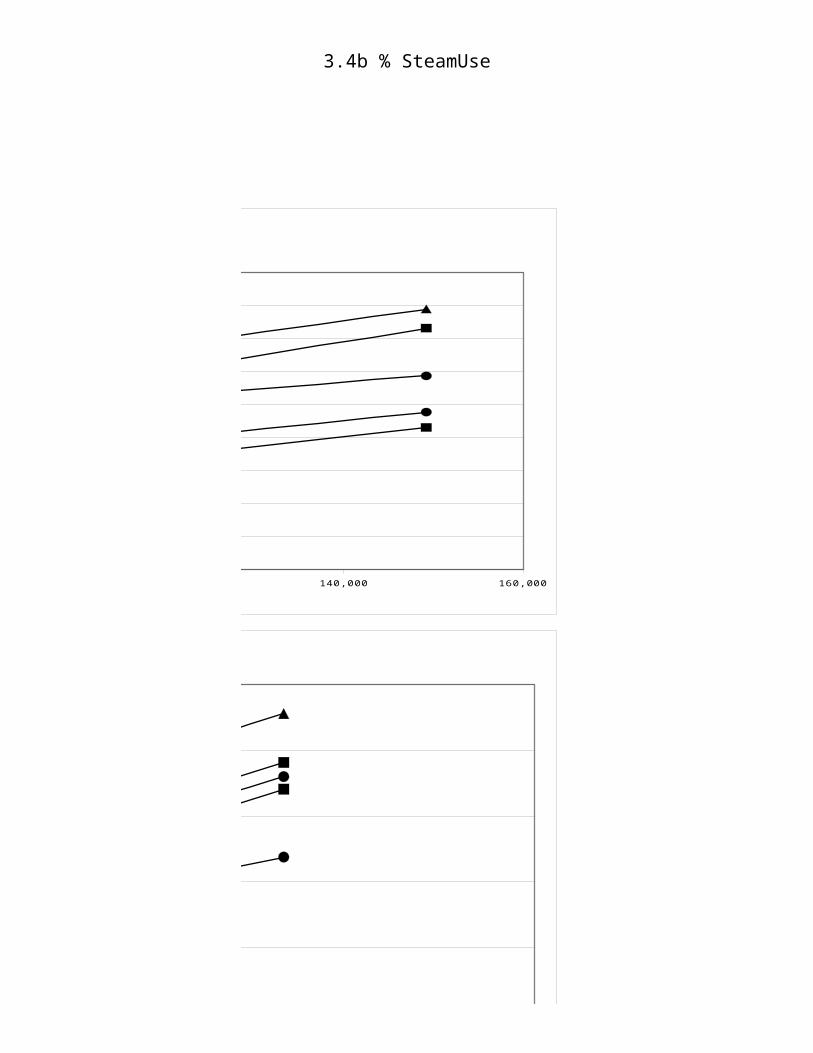
Sheet 4.1 Op'sDetails
AXG-9-29432-01document.xls Page 4.1.161 10:22:21
04/18/2023
Case No.
B-2
B2.1
B2.2
B2.3
B2.4
OVERALL PLANT DEFINITION
P = PSIA
GROSS PLANT FEED (combined well flow to flash)
Combined Brine & Steam Flow
T = oF Combined Brine
& Steam Gas Conc'n.
lbs / hour (at 15% steam
quality)
parts per million by weight
(ppmw) as CO2
2,288,000 T = 550 29,000
P = 1,124
2,288,000 T = 550 29,000
P = 1124
2,287,000 T = 550 29,000
P = 1124
2,288,000 T = 550 29,000
P = 1124
2,288,000 T = 550 29,000
P = 1124

Sheet 4.1 Op'sDetails
AXG-9-29432-01document.xls Page 4.1.162 10:22:21
04/18/2023
Case No.
B-3
B3.1
B3.2
B3.3
B3.4
OVERALL PLANT DEFINITION
P = PSIA
GROSS PLANT FEED (combined well flow to flash)
Combined Brine & Steam Flow
T = oF Combined Brine
& Steam Gas Conc'n.
lbs / hour (at 15% steam
quality)
parts per million by weight
(ppmw) as CO2
2,284,000 T = 550 9,600
P = 1,072
2,284,000 T = 550 9,600
P = 1072
2,284,000 T = 550 9,600
P = 1072
2,284,000 T = 550 9,600
P = 1072
2,284,000 T = 550 9,600
P = 1072
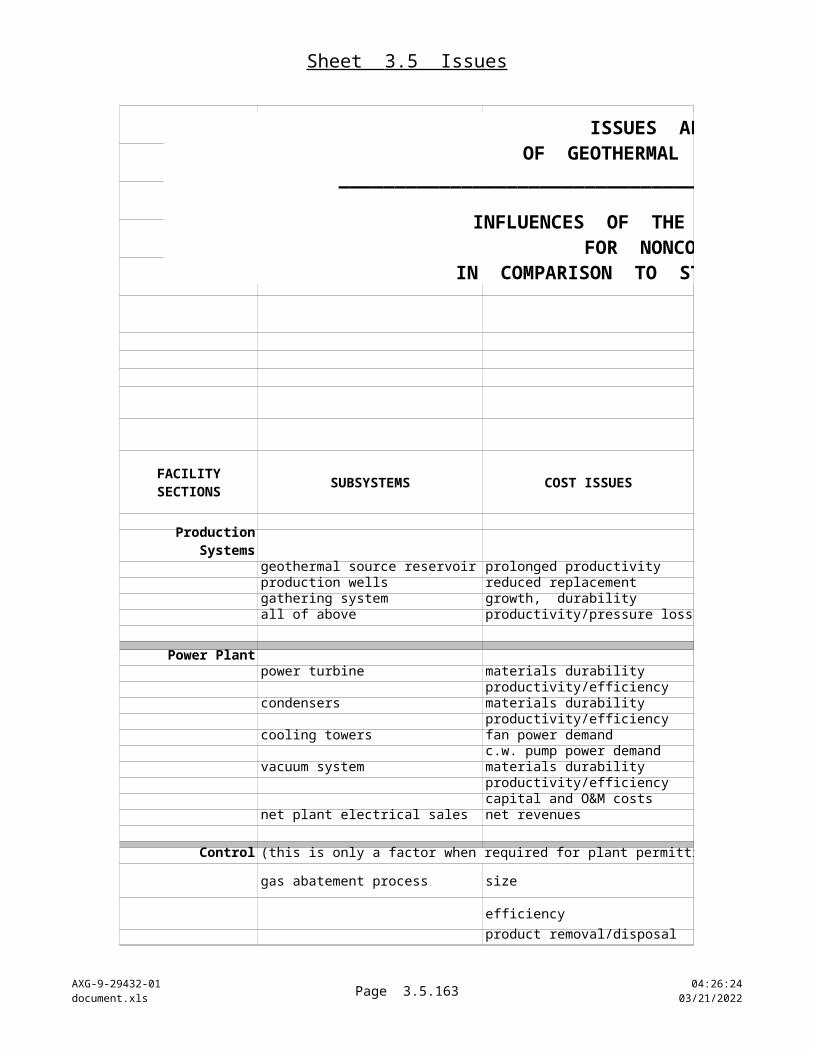
Sheet 4.1 Op'sDetails
AXG-9-29432-01document.xls Page 4.1.163 10:22:21
04/18/2023
Case No.
B-4
B4.1
B4.2
B4.3
B4.4
OVERALL PLANT DEFINITION
P = PSIA
GROSS PLANT FEED (combined well flow to flash)
Combined Brine & Steam Flow
T = oF Combined Brine
& Steam Gas Conc'n.
lbs / hour (at 15% steam
quality)
parts per million by weight
(ppmw) as CO2
5,418,000 T = 350 6,500
P = 137
5,418,000 T = 350 6,500
P = 137
5,418,000 T = 350 6,500
P = 137
5,418,000 T = 350 6,500
P = 137
5,418,000 T = 350 6,500
P = 137
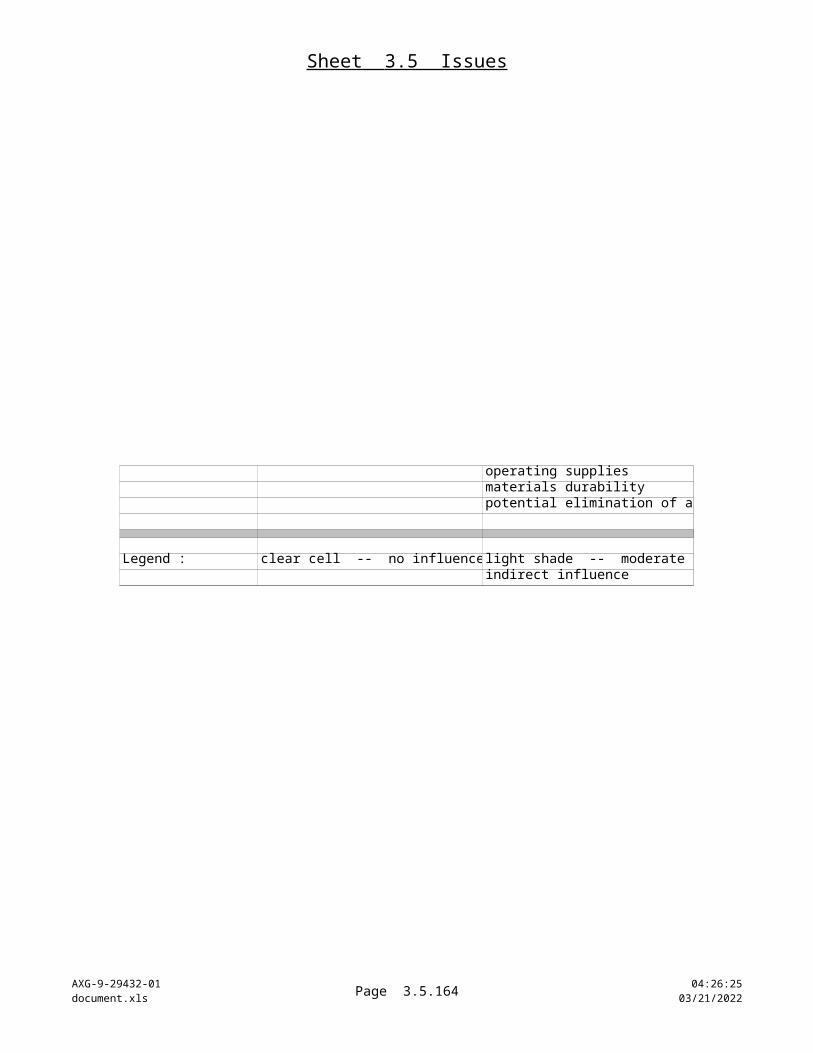
Sheet 4.1 Op'sDetails
AXG-9-29432-01document.xls Page 4.1.164 10:22:21
04/18/2023
Case No.
B-5
B5.1
B5.2
B5.3
B5.4
OVERALL PLANT DEFINITION
P = PSIA
GROSS PLANT FEED (combined well flow to flash)
Combined Brine & Steam Flow
T = oF Combined Brine
& Steam Gas Conc'n.
lbs / hour (at 15% steam
quality)
parts per million by weight
(ppmw) as CO2
5,395,000 T = 350 19,700
P = 142
5,395,000 T = 350 19,700
P = 142
5,391,000 T = 350 19,700
P = 142
5,395,000 T = 350 19,700
P = 142
5,395,000 T = 350 19,700
P = 142
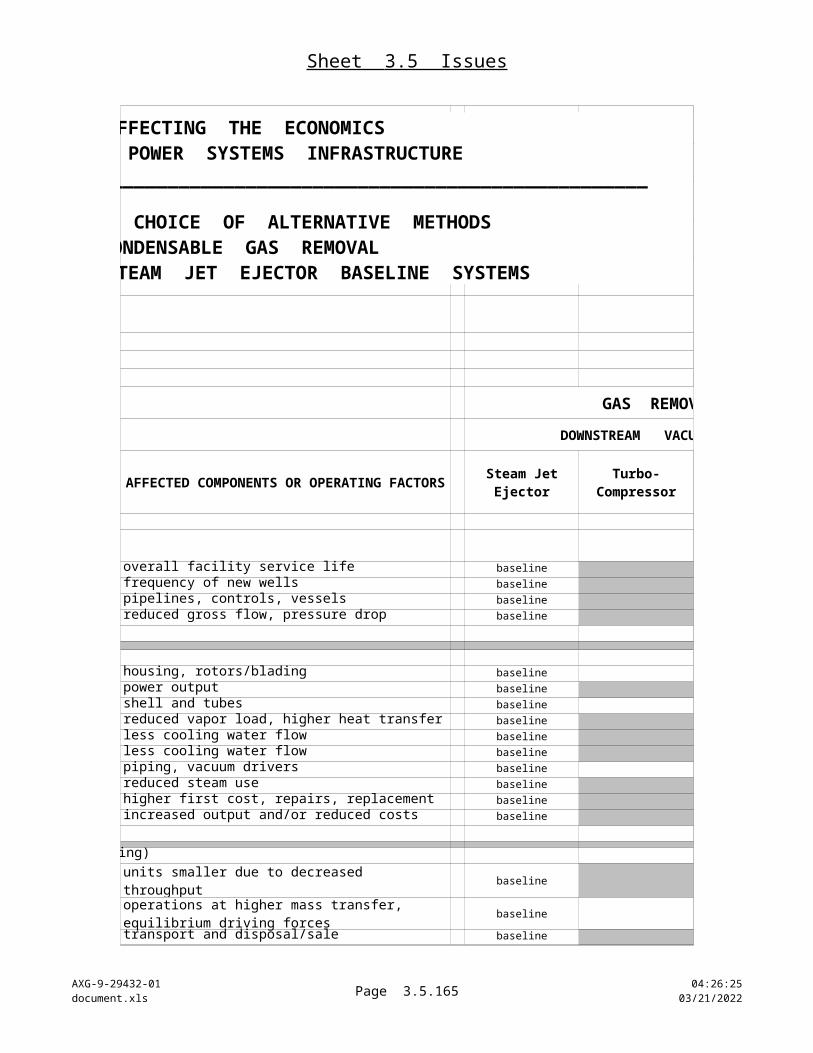
Sheet 4.1 Op'sDetails
AXG-9-29432-01document.xls Page 4.1.165 10:22:21
04/18/2023
Case No.
B-6
B6.1
B6.2
B6.3
B6.4
OVERALL PLANT DEFINITION
P = PSIA
GROSS PLANT FEED (combined well flow to flash)
Combined Brine & Steam Flow
T = oF Combined Brine
& Steam Gas Conc'n.
lbs / hour (at 15% steam
quality)
parts per million by weight
(ppmw) as CO2
PLACE HOLDER PLACE HOLDER
5,365,000 T = 350 33,400
P = 146
5,365,000 T = 350 33,400
P = 146
5,354,000 T = 350 33,400
P = 146
5,365,000 T = 350 33,400
P = 146
5,365,000 T = 350 33,400
P = 146
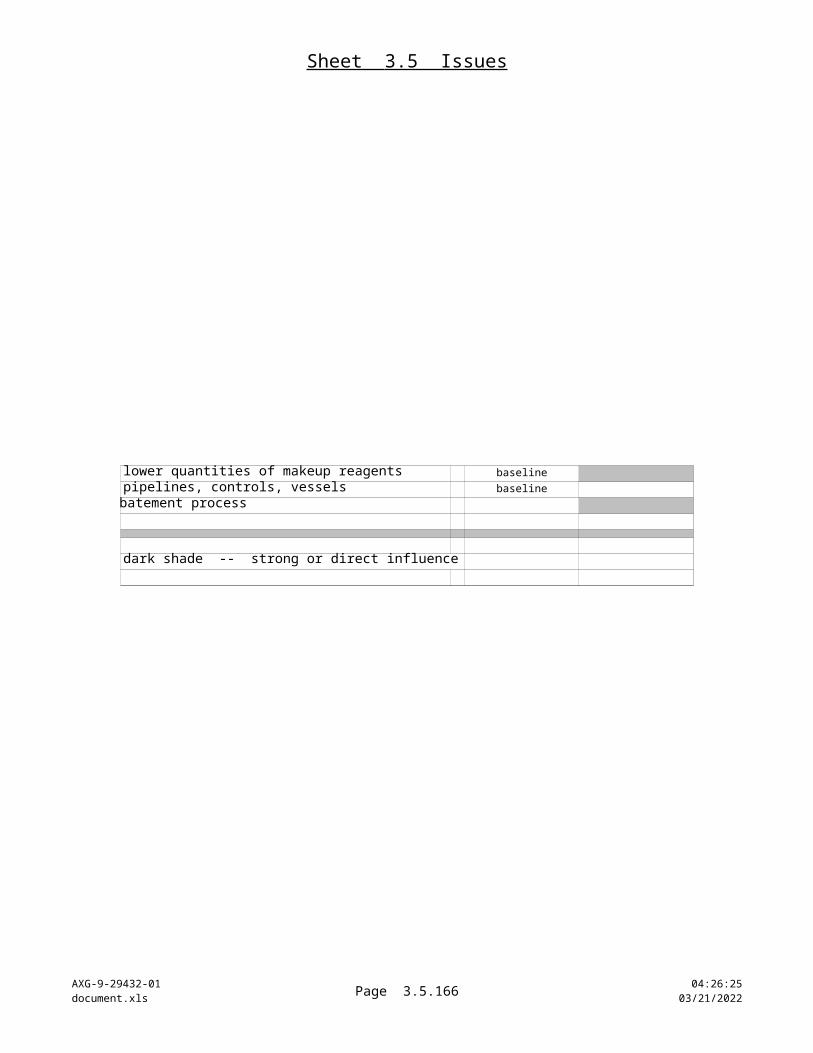
Sheet 4.1 Op'sDetails
AXG-9-29432-01document.xls Page 4.1.166 10:22:21
04/18/2023
Case No.
B-7
B7.1
B7.2
B7.3
B7.4
OVERALL PLANT DEFINITION
P = PSIA
GROSS PLANT FEED (combined well flow to flash)
Combined Brine & Steam Flow
T = oF Combined Brine
& Steam Gas Conc'n.
lbs / hour (at 15% steam
quality)
parts per million by weight
(ppmw) as CO2PLACE HOLDER PLACE HOLDER
5,201,000 T = 350 108,500
P = 170
5,201,000 T = 350 108,500
P = 170
5,119,000 T = 350 108,500
P = 170
5,201,000 T = 350 108,500
P = 170
5,201,000 T = 350 108,500
P = 170
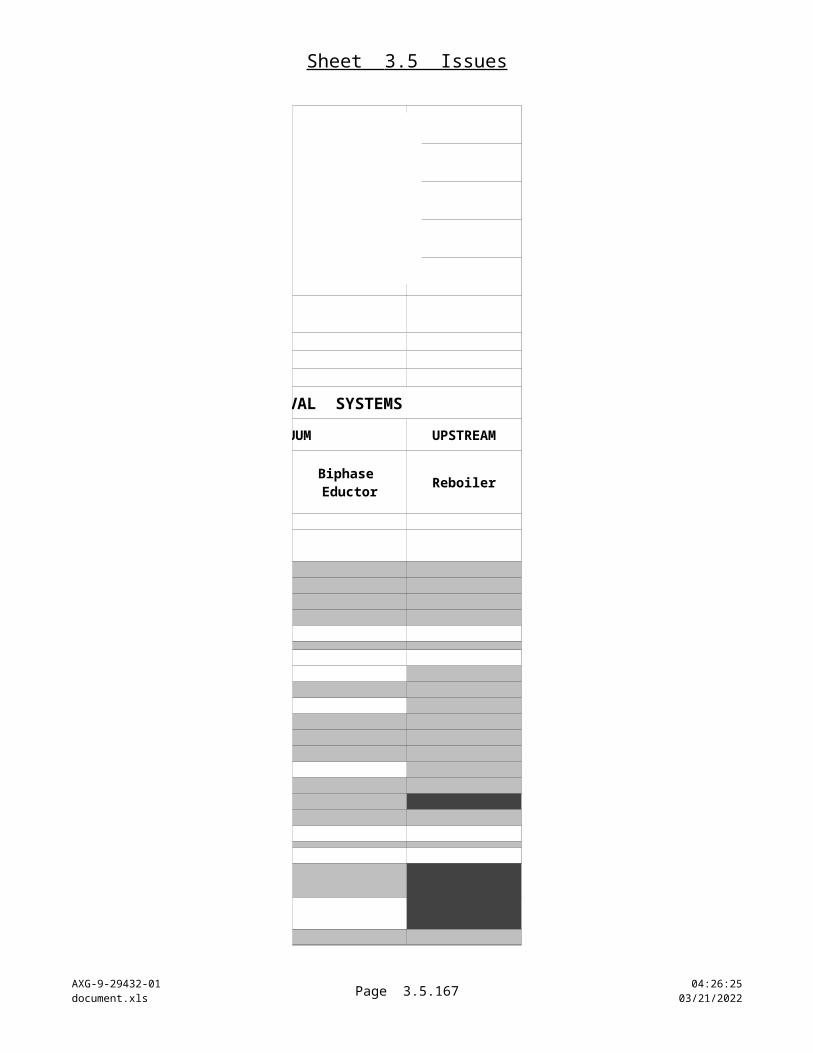
Sheet 4.1 Op'sDetails
AXG-9-29432-01document.xls Page 4.1.167 10:22:21
04/18/2023
Case No.
B-8
B8.1
B8.2
B8.3
B8.4
OVERALL PLANT DEFINITION
P = PSIA
GROSS PLANT FEED (combined well flow to flash)
Combined Brine & Steam Flow
T = oF Combined Brine
& Steam Gas Conc'n.
lbs / hour (at 15% steam
quality)
parts per million by weight
(ppmw) as CO2PLACE HOLDER PLACE HOLDER
2,297,000 T = 550 99,700
P = 1,316
2,297,000 T = 550 99,700
P = 1316
2,289,000 T = 550 99,700
P = 1316
2,297,000 T = 550 99,700
P = 1316
2,297,000 T = 550 99,700
P = 1316
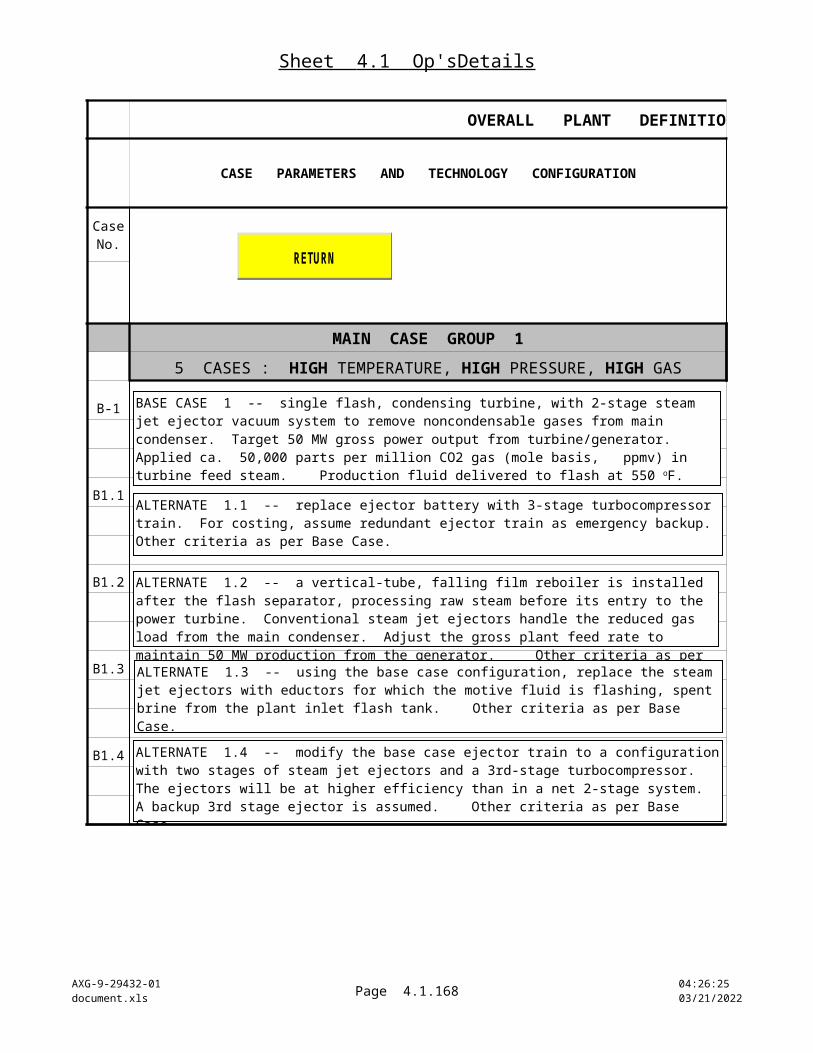
Sheet 4.1 Op'sDetails
AXG-9-29432-01document.xls Page 4.1.168 10:22:21
04/18/2023
Case No.
S-1
S1.1
S1.2
S1.3
S1.4
OVERALL PLANT DEFINITION
P = PSIA
GROSS PLANT FEED (combined well flow to flash)
Combined Brine & Steam Flow
T = oF Combined Brine
& Steam Gas Conc'n.
lbs / hour (at 15% steam
quality)
parts per million by weight
(ppmw) as CO2
PLACE HOLDER PLACE HOLDER
2,291,000 T = 550 48,800
P = 1,177
2,291,000 T = 550 48,800
P = 1177
2,289,000 T = 550 48,800
P = 1177
2,291,000 T = 550 48,800
P = 1177
2,291,000 T = 550 48,800
P = 1177
PLACE HOLDER PLACE HOLDER
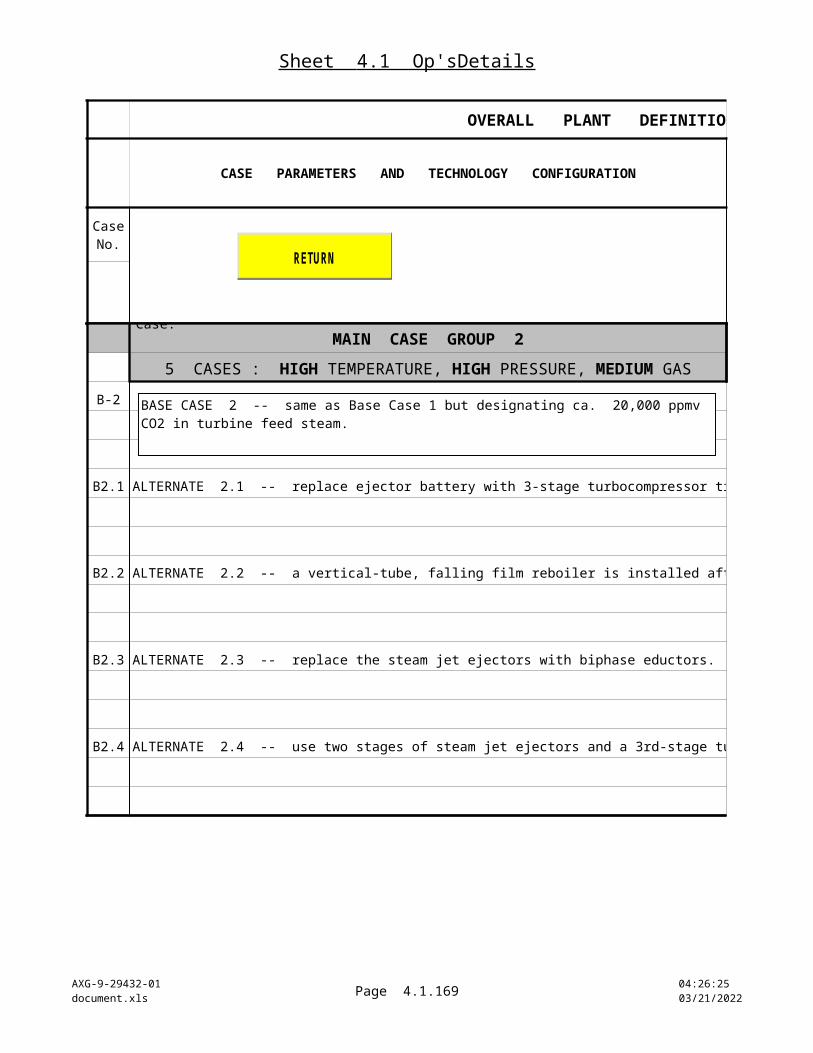
Sheet 4.1 Op'sDetails
AXG-9-29432-01document.xls Page 4.1.169 10:22:22
04/18/2023
Case No.
S-2
S2.1
S2.2
S2.3
S2.4
OVERALL PLANT DEFINITION
P = PSIA
GROSS PLANT FEED (combined well flow to flash)
Combined Brine & Steam Flow
T = oF Combined Brine
& Steam Gas Conc'n.
lbs / hour (at 15% steam
quality)
parts per million by weight
(ppmw) as CO2
5,418,000 T = 350 6,500
P = 137
5,418,000 T = 350 6,500
P = 137
5,418,000 T = 350 6,500
P = 137
5,418,000 T = 350 6,500
P = 137
5,418,000 T = 350 6,500
P = 137
PLACE HOLDER PLACE HOLDER
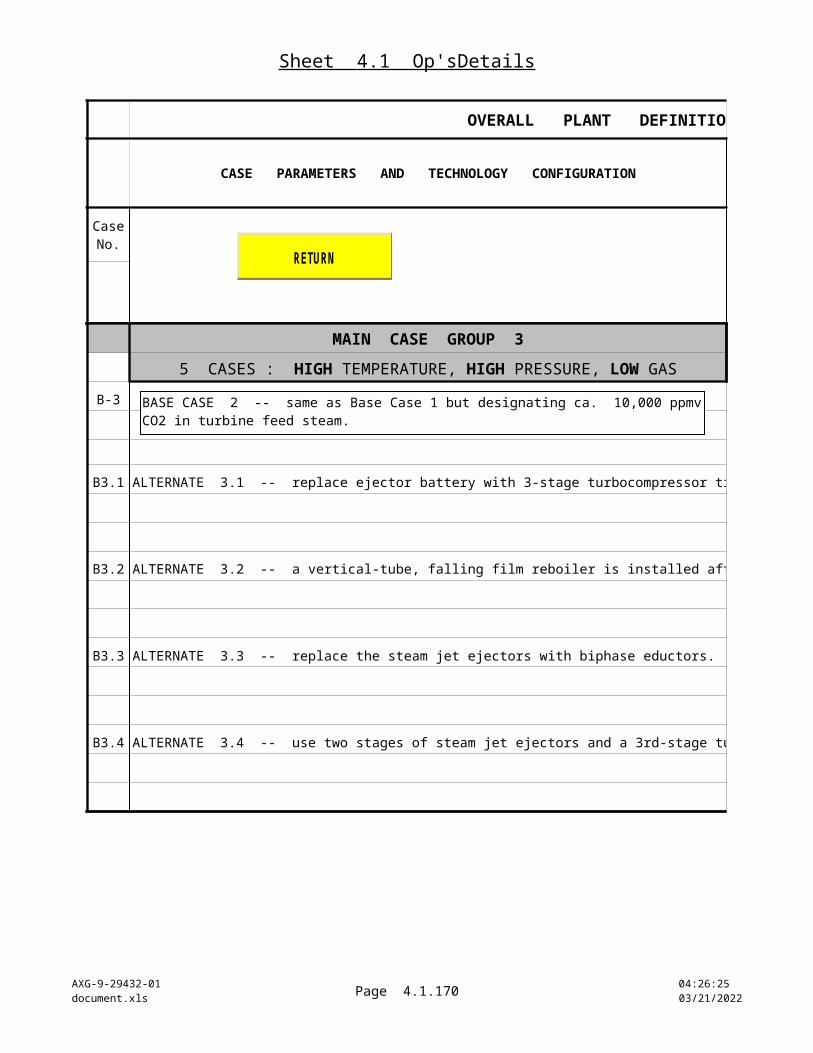
Sheet 4.1 Op'sDetails
AXG-9-29432-01document.xls Page 4.1.170 10:22:22
04/18/2023
Case No.
S-3
S3.1
S3.2
S3.3
S3.4
OVERALL PLANT DEFINITION
P = PSIA
GROSS PLANT FEED (combined well flow to flash)
Combined Brine & Steam Flow
T = oF Combined Brine
& Steam Gas Conc'n.
lbs / hour (at 15% steam
quality)
parts per million by weight
(ppmw) as CO2
2,505,000 T = 550 28,900
P = 1,124
2,505,000 T = 550 28,900
P = 1124
2,505,000 T = 550 28,900
P = 1124
2,505,000 T = 550 28,900
P = 1124
2,505,000 T = 550 28,900
P = 1124
PLACE HOLDER PLACE HOLDER
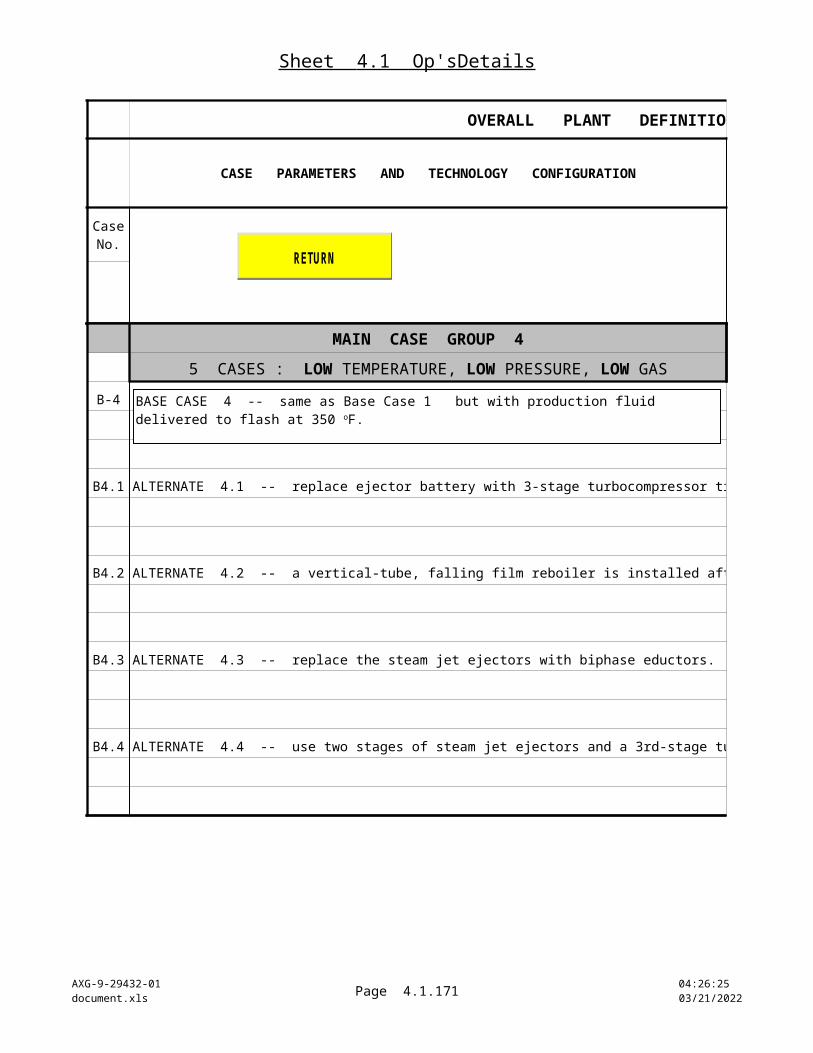
Sheet 4.1 Op'sDetails
AXG-9-29432-01document.xls Page 4.1.171 10:22:22
04/18/2023
Case No.
S-4
S4.1
S4.2
S4.3
S4.4
OVERALL PLANT DEFINITION
P = PSIA
GROSS PLANT FEED (combined well flow to flash)
Combined Brine & Steam Flow
T = oF Combined Brine
& Steam Gas Conc'n.
lbs / hour (at 15% steam
quality)
parts per million by weight
(ppmw) as CO2
6,251,000 T = 350 6,400
P = 137
6,251,000 T = 350 6,400
P = 137
6,250,000 T = 350 6,400
P = 137
6,251,000 T = 350 6,400
P = 137
6,251,000 T = 350 6,400
P = 137
PLACE HOLDER PLACE HOLDER
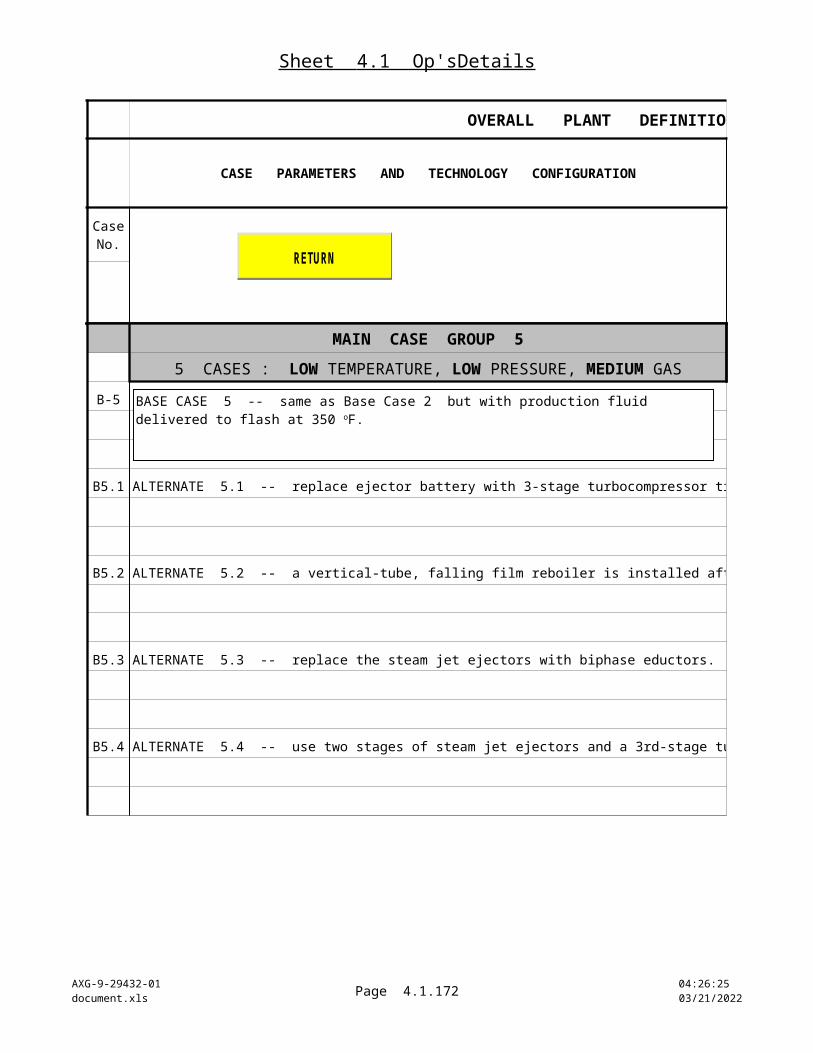
Sheet 4.1 Op'sDetails
AXG-9-29432-01document.xls Page 4.1.172 10:22:22
04/18/2023
Case No.
S-5
S5.1
S5.2
S5.3
S5.4
OVERALL PLANT DEFINITION
P = PSIA
GROSS PLANT FEED (combined well flow to flash)
Combined Brine & Steam Flow
T = oF Combined Brine
& Steam Gas Conc'n.
lbs / hour (at 15% steam
quality)
parts per million by weight
(ppmw) as CO2
ALTERNATE S5.2 -- a vertical-tube, falling film reboiler is installed after the flash separator.
ALTERNATE S5.4 -- use two stages of steam jet ejectors and a 3rd-stage turbocompressor.
PLACE HOLDER PLACE HOLDER
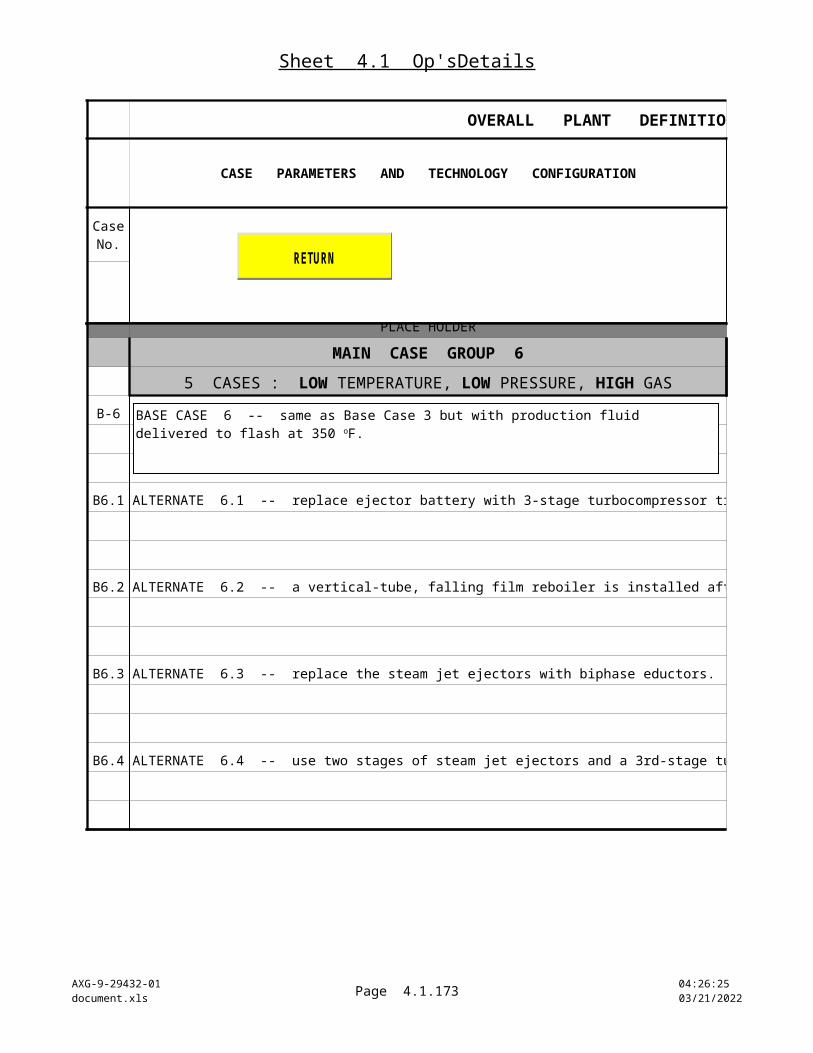
Sheet 4.1 Op'sDetails
AXG-9-29432-01document.xls Page 4.1.173 10:22:22
04/18/2023
Case No.
S-6
S6.1
S6.2
S6.3
S6.4
OVERALL PLANT DEFINITION
P = PSIA
GROSS PLANT FEED (combined well flow to flash)
Combined Brine & Steam Flow
T = oF Combined Brine
& Steam Gas Conc'n.
lbs / hour (at 15% steam
quality)
parts per million by weight
(ppmw) as CO2
ALTERNATE S6.2 -- a vertical-tube, falling film reboiler is installed after the flash separator.
ALTERNATE S6.4 -- use two stages of steam jet ejectors and a 3rd-stage turbocompressor.
PLACE HOLDER PLACE HOLDER
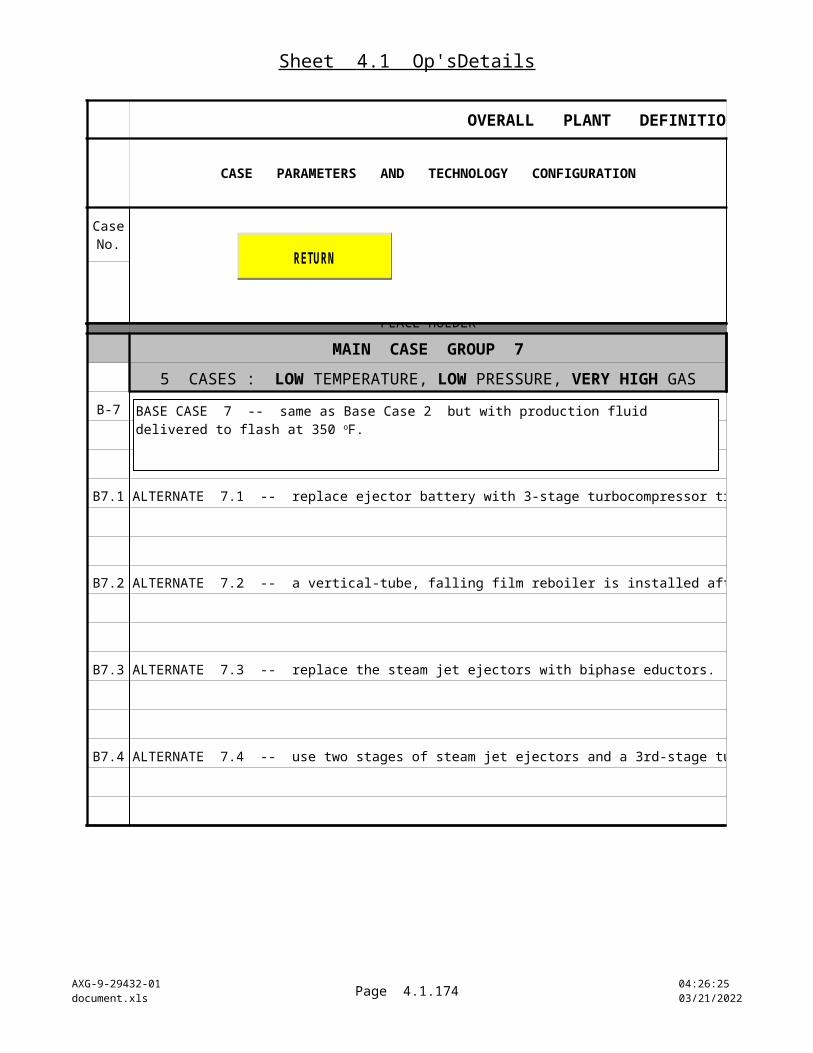
Sheet 4.1 Op'sDetails
AXG-9-29432-01document.xls Page 4.1.174 10:22:22
04/18/2023
Case No.
S-7
S7.1
S7.2
S7.3
S7.4
OVERALL PLANT DEFINITION
P = PSIA
GROSS PLANT FEED (combined well flow to flash)
Combined Brine & Steam Flow
T = oF Combined Brine
& Steam Gas Conc'n.
lbs / hour (at 15% steam
quality)
parts per million by weight
(ppmw) as CO2
ALTERNATE S7.2 -- a vertical-tube, falling film reboiler is installed after the flash separator.
ALTERNATE S7.4 -- use two stages of steam jet ejectors and a 3rd-stage turbocompressor.
PLACE HOLDER PLACE HOLDER
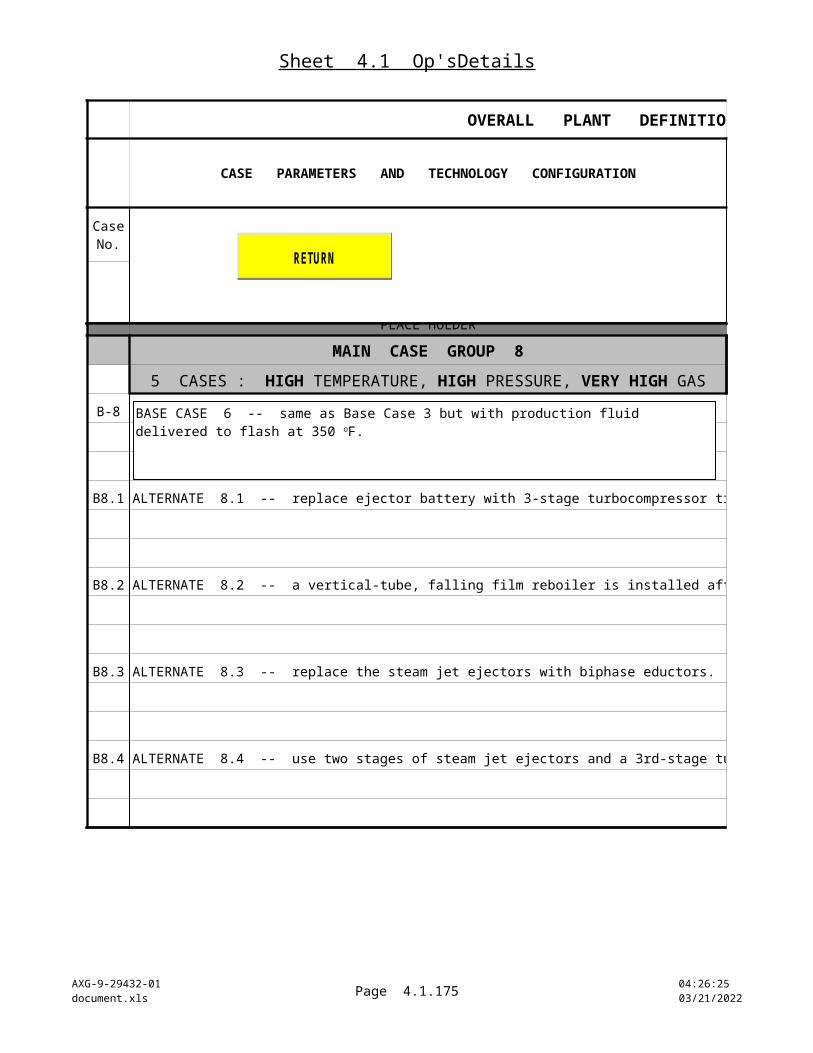
Sheet 4.1 Op'sDetails
AXG-9-29432-01document.xls Page 4.1.175 10:22:22
04/18/2023
Case No.
S-8
S8.1
S8.2
S8.3
S8.4
OVERALL PLANT DEFINITION
P = PSIA
GROSS PLANT FEED (combined well flow to flash)
Combined Brine & Steam Flow
T = oF Combined Brine
& Steam Gas Conc'n.
lbs / hour (at 15% steam
quality)
parts per million by weight
(ppmw) as CO2
ALTERNATE S8.2 -- a vertical-tube, falling film reboiler is installed after the flash separator.
ALTERNATE S8.4 -- use two stages of steam jet ejectors and a 3rd-stage turbocompressor.
PLACE HOLDER PLACE HOLDER
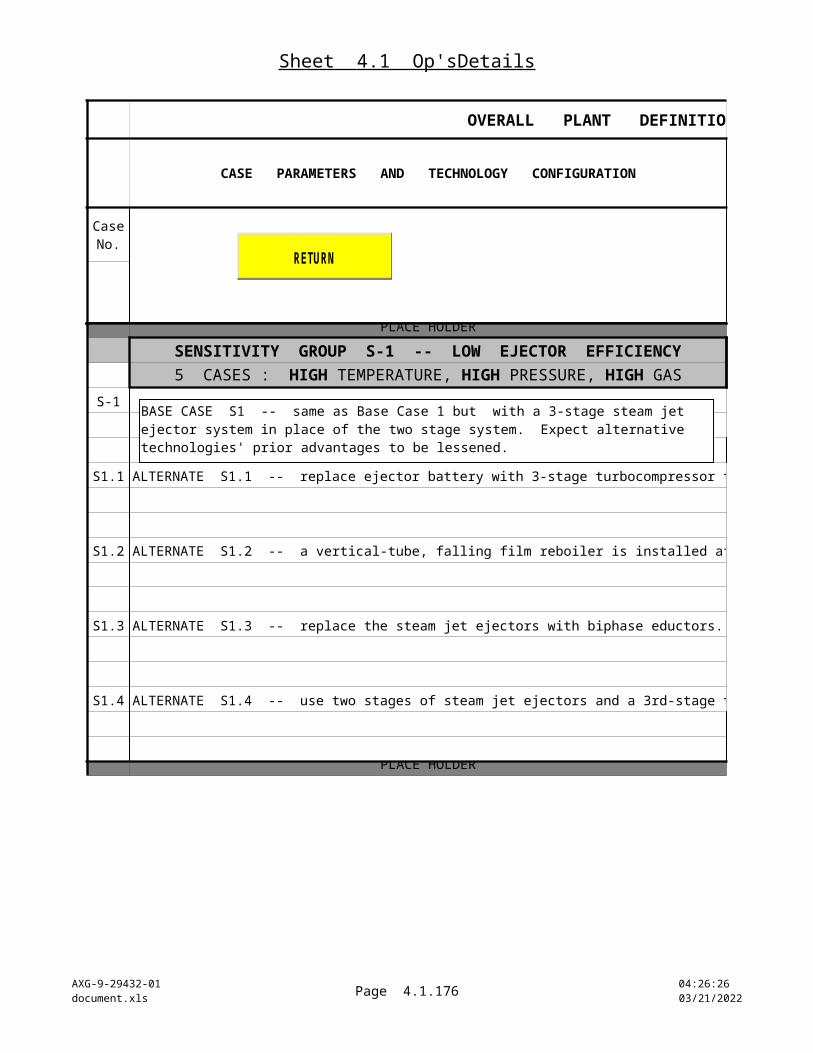
Sheet 4.1 Op'sDetails
AXG-9-29432-01document.xls Page 4.1.176 10:22:22
04/18/2023
Case No.
S-9
S9.1
S9.2
S9.3
S9.4
OVERALL PLANT DEFINITION
P = PSIA
GROSS PLANT FEED (combined well flow to flash)
Combined Brine & Steam Flow
T = oF Combined Brine
& Steam Gas Conc'n.
lbs / hour (at 15% steam
quality)
parts per million by weight
(ppmw) as CO2
ALTERNATE S9.2 -- a vertical-tube, falling film reboiler is installed after the flash separator.
ALTERNATE S9.4 -- use two stages of steam jet ejectors and a 3rd-stage turbocompressor.
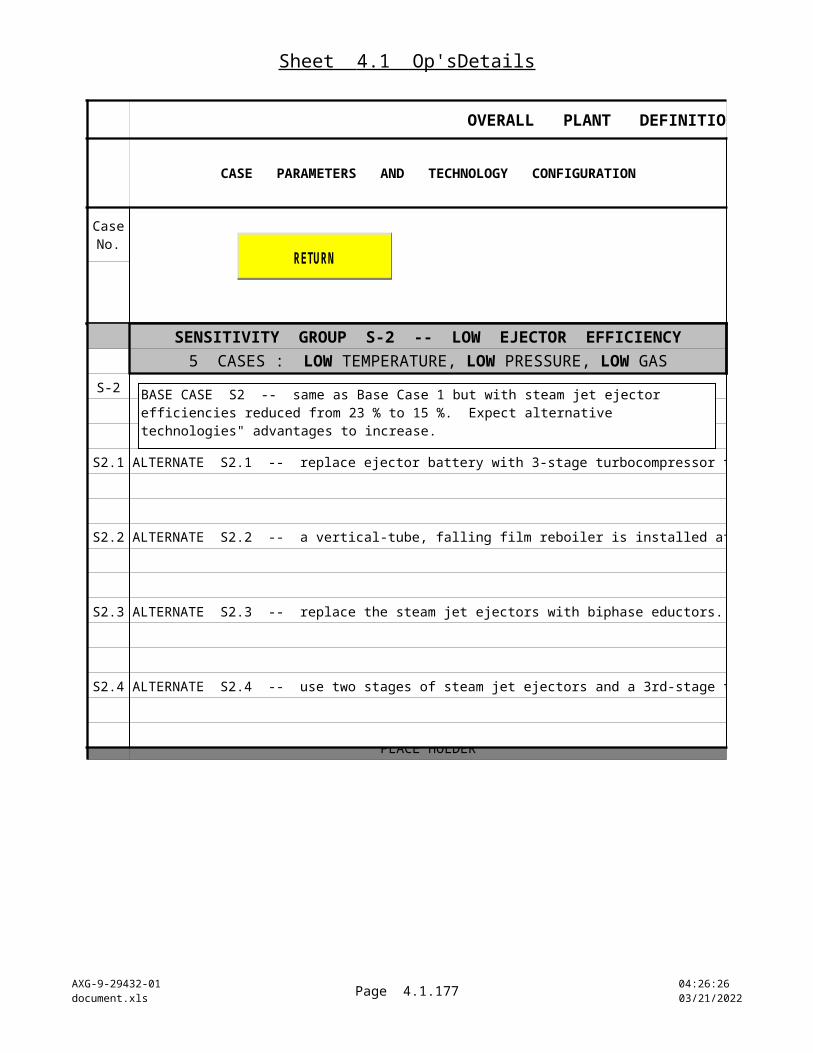
Sheet 4.1 Op'sDetails
AXG-9-29432-01document.xls Page 4.1.177 10:22:22
04/18/2023
B-1
B1.1
B1.2
B1.3
B1.4
Case No.
FLASHED STEAM AND GROSS POWER AUXILIARY STEAM & ELECTRICITY DEMAND
Total Flow
lbs / hour lbs / hour lbs / hour
T 334 49,900 968,000 3.424 50.0 170,500 0
P 114
T 334 49,900 968,000 3.424 50.0 116,800 15,000
P 114 closure
T 334 49,900 968,000 3.265 50.0 2,100 215,433
P 114 750,000 = clean steam turbine feed reboiler vent
T 334 49,900 968,000 3.424 50.0 134,400 17,257
P 114 closure
T 334 49,900 968,000 3.424 50.0 142,000 0
P 114
STEAM TEMPERATURE,
PRESSURE, and GAS CONCENTRATION
TOTAL FLOW
TURBINE BACK-
PRESSURE
UNIT CAPACIT
Y
STEAM TO
VACUUM DRIVERS
STEAM TO OTHER
SYSTEMS
Flash Conditions CO2 ppm
by volume (ppmv) in
vapor phase
Steam + Gases
Gross Generator
Output
Total Flow (with gas)
oF, PSIAinches Hg
abs.Megawatt
s
In all cases, the "Net Sales Electricity" reflects only the reduction from gross unit capacity caused by deducting the "Auxiliary" demands. No other utilities are counted in the "Net."
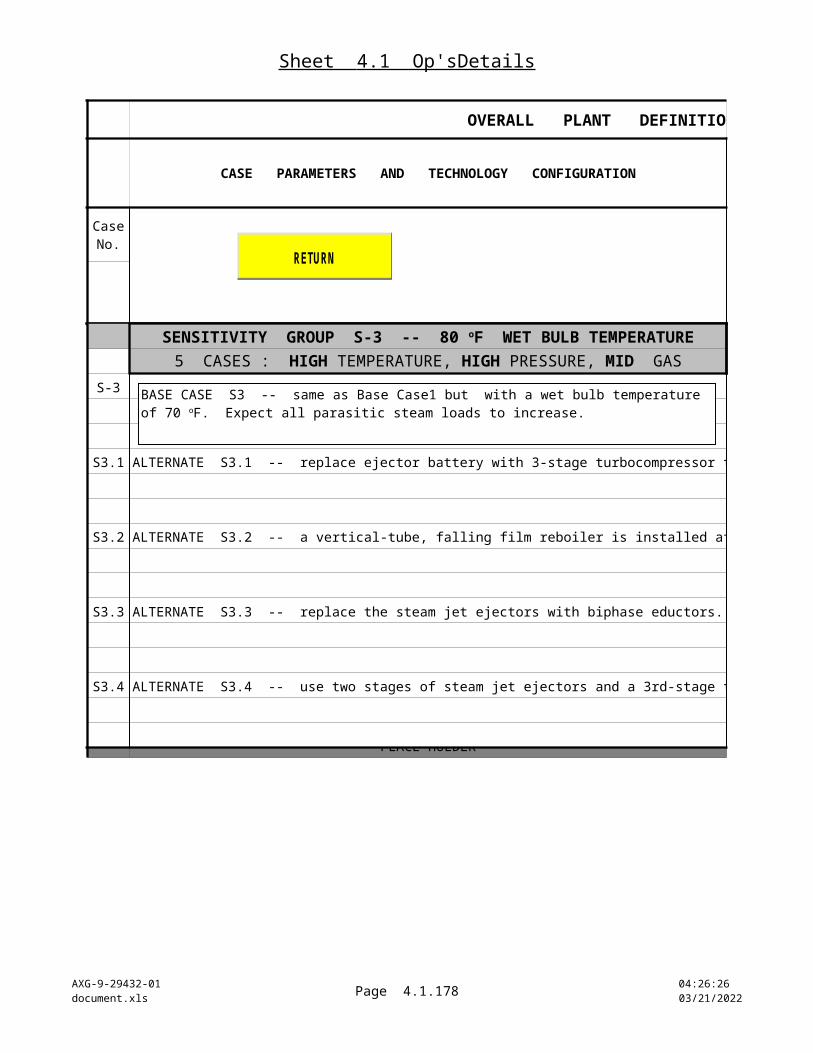
Sheet 4.1 Op'sDetails
AXG-9-29432-01document.xls Page 4.1.178 10:22:22
04/18/2023
Case No.
B-2
B2.1
B2.2
B2.3
B2.4
FLASHED STEAM AND GROSS POWER AUXILIARY STEAM & ELECTRICITY DEMAND
Total Flow
lbs / hour lbs / hour lbs / hour
STEAM TEMPERATURE,
PRESSURE, and GAS CONCENTRATION
TOTAL FLOW
TURBINE BACK-
PRESSURE
UNIT CAPACIT
Y
STEAM TO
VACUUM DRIVERS
STEAM TO OTHER
SYSTEMS
Flash Conditions CO2 ppm
by volume (ppmv) in
vapor phase
Steam + Gases
Gross Generator
Output
Total Flow (with gas)
oF, PSIAinches Hg
abs.Megawatt
s
T 334 29,900 932,000 3.419 50.0 98,600 0
P 113
T 334 29,900 932,000 3.419 50.0 69,100 5,210
P 113 closure
T 334 29,900 932,000 3.264 50.0 1,200 127,917
P 113 803,000 = clean steam turbine feed reboiler vent
T 334 29,900 932,000 3.419 50.0 62,800 4,739
P 113 closure
T 334 29,900 932,000 3.419 50.0 81,100 0
P 113
In all cases, the "Net Sales Electricity" reflects only the reduction from gross unit capacity caused by deducting the "Auxiliary" demands. No other utilities are counted in the "Net."

Sheet 4.1 Op'sDetails
AXG-9-29432-01document.xls Page 4.1.179 10:22:22
04/18/2023
Case No.
B-3
B3.1
B3.2
B3.3
B3.4
FLASHED STEAM AND GROSS POWER AUXILIARY STEAM & ELECTRICITY DEMAND
Total Flow
lbs / hour lbs / hour lbs / hour
STEAM TEMPERATURE,
PRESSURE, and GAS CONCENTRATION
TOTAL FLOW
TURBINE BACK-
PRESSURE
UNIT CAPACIT
Y
STEAM TO
VACUUM DRIVERS
STEAM TO OTHER
SYSTEMS
Flash Conditions CO2 ppm
by volume (ppmv) in
vapor phase
Steam + Gases
Gross Generator
Output
Total Flow (with gas)
oF, PSIAinches Hg
abs.Megawatt
s
T 335 10,000 896,000 3.398 50.0 28,700 0
P 111
T 335 10,000 896,000 3.398 50.0 21,300 524
P 111 closure
T 335 10,000 896,000 3.265 50.0 400 42,201
P 111 853,000 = clean steam turbine feed reboiler vent
T 335 10,000 896,000 3.398 50.0 0 0
P 111 closure
T 335 10,000 896,000 3.398 50.0 23,100 0
P 111
In all cases, the "Net Sales Electricity" reflects only the reduction from gross unit capacity caused by deducting the "Auxiliary" demands. No other utilities are counted in the "Net."
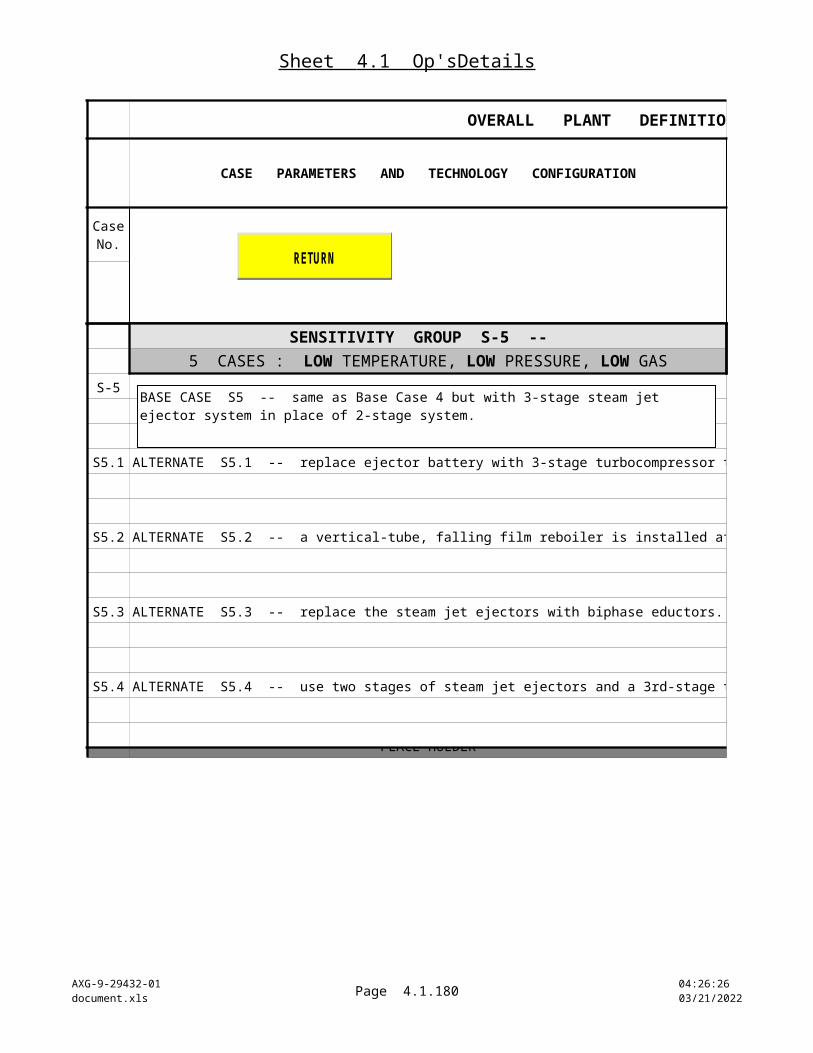
Sheet 4.1 Op'sDetails
AXG-9-29432-01document.xls Page 4.1.180 10:22:22
04/18/2023
Case No.
B-4
B4.1
B4.2
B4.3
B4.4
FLASHED STEAM AND GROSS POWER AUXILIARY STEAM & ELECTRICITY DEMAND
Total Flow
lbs / hour lbs / hour lbs / hour
STEAM TEMPERATURE,
PRESSURE, and GAS CONCENTRATION
TOTAL FLOW
TURBINE BACK-
PRESSURE
UNIT CAPACIT
Y
STEAM TO
VACUUM DRIVERS
STEAM TO OTHER
SYSTEMS
Flash Conditions CO2 ppm
by volume (ppmv) in
vapor phase
Steam + Gases
Gross Generator
Output
Total Flow (with gas)
oF, PSIAinches Hg
abs.Megawatt
s
T 235 10,000 1,446,000 3.397 50.0 117,900 0
P 23
T 235 10,000 1,446,000 3.397 50.0 55,400 1,373
P 23 closure
T 235 10,000 1,446,000 3.265 50.0 2,100 68,400
P 23 1,375,000 = clean steam turbine feed reboiler vent
T 235 10,000 1,446,000 3.397 50.0 96,600 2,393
P 23 closure
T 235 10,000 1,446,000 3.397 50.0 71,600 0
P 23
In all cases, the "Net Sales Electricity" reflects only the reduction from gross unit capacity caused by deducting the "Auxiliary" demands. No other utilities are counted in the "Net."
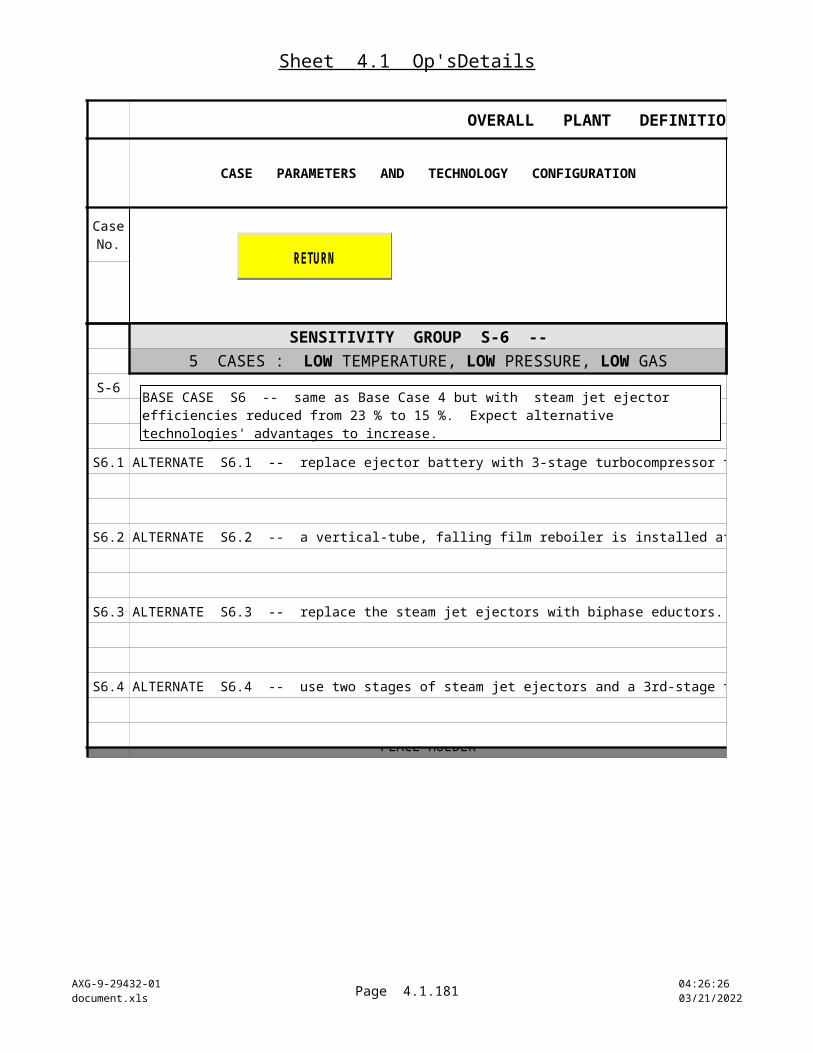
Sheet 4.1 Op'sDetails
AXG-9-29432-01document.xls Page 4.1.181 10:22:22
04/18/2023
Case No.
B-5
B5.1
B5.2
B5.3
B5.4
FLASHED STEAM AND GROSS POWER AUXILIARY STEAM & ELECTRICITY DEMAND
Total Flow
lbs / hour lbs / hour lbs / hour
STEAM TEMPERATURE,
PRESSURE, and GAS CONCENTRATION
TOTAL FLOW
TURBINE BACK-
PRESSURE
UNIT CAPACIT
Y
STEAM TO
VACUUM DRIVERS
STEAM TO OTHER
SYSTEMS
Flash Conditions CO2 ppm
by volume (ppmv) in
vapor phase
Steam + Gases
Gross Generator
Output
Total Flow (with gas)
oF, PSIAinches Hg
abs.Megawatt
s
T 234 30,100 1,505,000 3.419 50.0 389,800 0
P 23
T 234 30,100 1,505,000 3.419 50.0 180,400 13,672
P 23 closure
T 234 30,100 1,505,000 3.265 50.0 6,300 206,704
P 23 1,291,000 = clean steam turbine feed reboiler vent
T 234 30,100 1,505,000 3.419 50.0 363,380 27,534
P 23 closure
T 234 30,100 1,505,000 3.419 50.0 250,400 0
P 23
In all cases, the "Net Sales Electricity" reflects only the reduction from gross unit capacity caused by deducting the "Auxiliary" demands. No other utilities are counted in the "Net."

Sheet 4.1 Op'sDetails
AXG-9-29432-01document.xls Page 4.1.182 10:22:22
04/18/2023
Case No.
B-6
B6.1
B6.2
B6.3
B6.4
FLASHED STEAM AND GROSS POWER AUXILIARY STEAM & ELECTRICITY DEMAND
Total Flow
lbs / hour lbs / hour lbs / hour
STEAM TEMPERATURE,
PRESSURE, and GAS CONCENTRATION
TOTAL FLOW
TURBINE BACK-
PRESSURE
UNIT CAPACIT
Y
STEAM TO
VACUUM DRIVERS
STEAM TO OTHER
SYSTEMS
Flash Conditions CO2 ppm
by volume (ppmv) in
vapor phase
Steam + Gases
Gross Generator
Output
Total Flow (with gas)
oF, PSIAinches Hg
abs.Megawatt
s
PLACE HOLDER PLACE HOLDER
T 234 50,100 1,563,000 3.424 50.0 620,500 0
P 24
T 234 50,100 1,563,000 3.424 50.0 304,900 39,267
P 24 closure
T 234 50,100 1,563,000 3.265 50.0 10,400 346,618
P 24 1,203,000 = clean steam turbine feed reboiler vent
T 234 50,100 1,563,000 3.424 50.0 576,300 74,223
P 24 closure
T 234 50,100 1,563,000 3.424 50.0 439,100 0
P 24
In all cases, the "Net Sales Electricity" reflects only the reduction from gross unit capacity caused by deducting the "Auxiliary" demands. No other utilities are counted in the "Net."
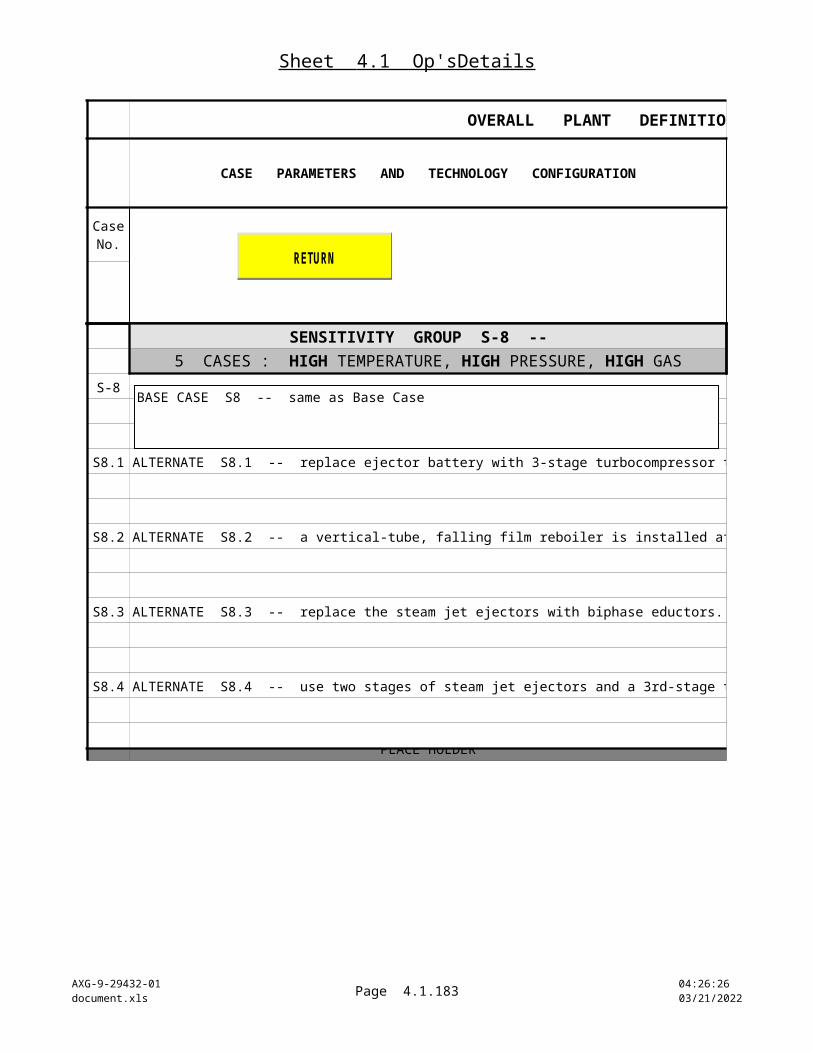
Sheet 4.1 Op'sDetails
AXG-9-29432-01document.xls Page 4.1.183 10:22:22
04/18/2023
Case No.
B-7
B7.1
B7.2
B7.3
B7.4
FLASHED STEAM AND GROSS POWER AUXILIARY STEAM & ELECTRICITY DEMAND
Total Flow
lbs / hour lbs / hour lbs / hour
STEAM TEMPERATURE,
PRESSURE, and GAS CONCENTRATION
TOTAL FLOW
TURBINE BACK-
PRESSURE
UNIT CAPACIT
Y
STEAM TO
VACUUM DRIVERS
STEAM TO OTHER
SYSTEMS
Flash Conditions CO2 ppm
by volume (ppmv) in
vapor phase
Steam + Gases
Gross Generator
Output
Total Flow (with gas)
oF, PSIAinches Hg
abs.Megawatt
s
PLACE HOLDER PLACE HOLDER
T 232 149,200 1,873,000 3.429 49.9 1,480,000 -8,310
P 25
T 232 149,200 1,873,000 3.429 49.9 893,900 383,113
P 25 closure
T 232 149,200 1,873,000 3.354 49.9 20,200 1,072,009
P 25 751,000 = clean steam turbine feed reboiler vent
T 232 149,200 1,873,000 3.429 49.9 1,099,700 471,015
P 25 closure
T 232 149,200 1,873,000 3.429 49.9 1,372,200 -2,730
P 25
In all cases, the "Net Sales Electricity" reflects only the reduction from gross unit capacity caused by deducting the "Auxiliary" demands. No other utilities are counted in the "Net."
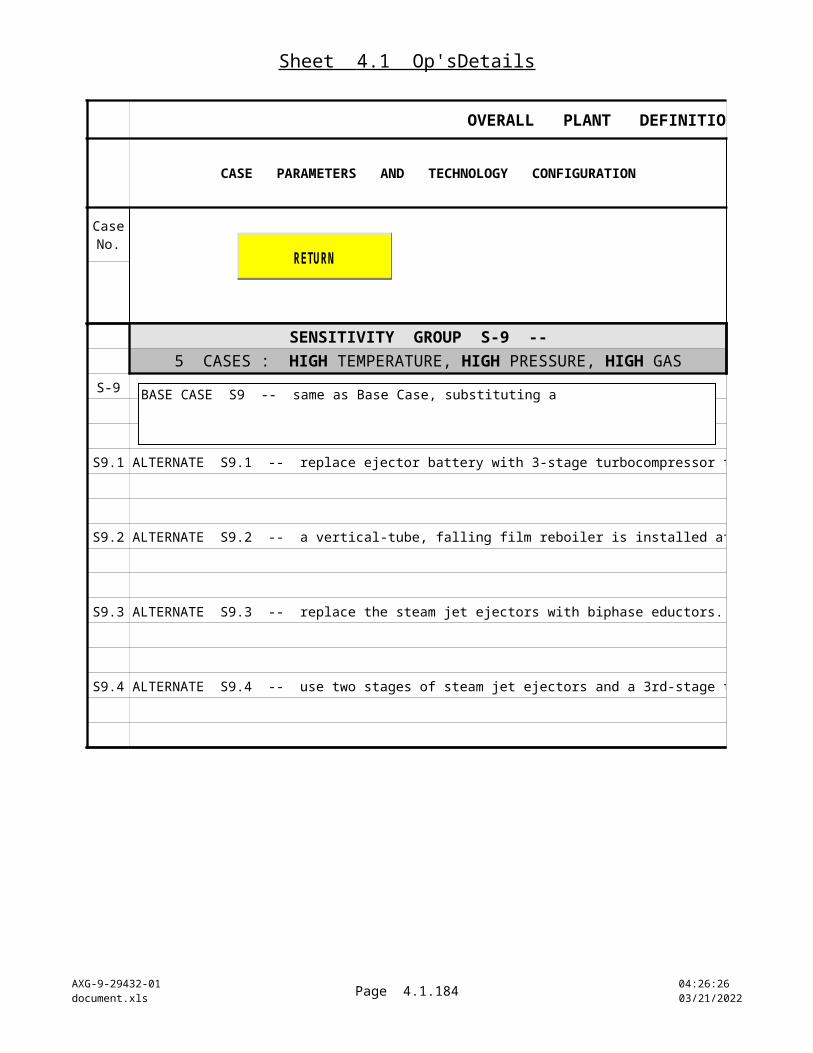
Sheet 4.1 Op'sDetails
AXG-9-29432-01document.xls Page 4.1.184 10:22:22
04/18/2023
Case No.
B-8
B8.1
B8.2
B8.3
B8.4
FLASHED STEAM AND GROSS POWER AUXILIARY STEAM & ELECTRICITY DEMAND
Total Flow
lbs / hour lbs / hour lbs / hour
STEAM TEMPERATURE,
PRESSURE, and GAS CONCENTRATION
TOTAL FLOW
TURBINE BACK-
PRESSURE
UNIT CAPACIT
Y
STEAM TO
VACUUM DRIVERS
STEAM TO OTHER
SYSTEMS
Flash Conditions CO2 ppm
by volume (ppmv) in
vapor phase
Steam + Gases
Gross Generator
Output
Total Flow (with gas)
oF, PSIAinches Hg
abs.Megawatt
s
PLACE HOLDER PLACE HOLDER
T 333 99,600 1,062,000 3.428 50.0 348,700 0
P 119
T 333 99,600 1,062,000 3.428 50.0 232,700 62,890
P 119 closure
T 333 99,600 1,062,000 3.315 50.0 5,400 439,112
P 119 614,000 = clean steam turbine feed reboiler vent
T 333 99,600 1,062,000 3.428 50.0 297,100 80,294
P 119 closure
T 333 99,600 1,062,000 3.428 50.0 308,600 0
P 119
In all cases, the "Net Sales Electricity" reflects only the reduction from gross unit capacity caused by deducting the "Auxiliary" demands. No other utilities are counted in the "Net."
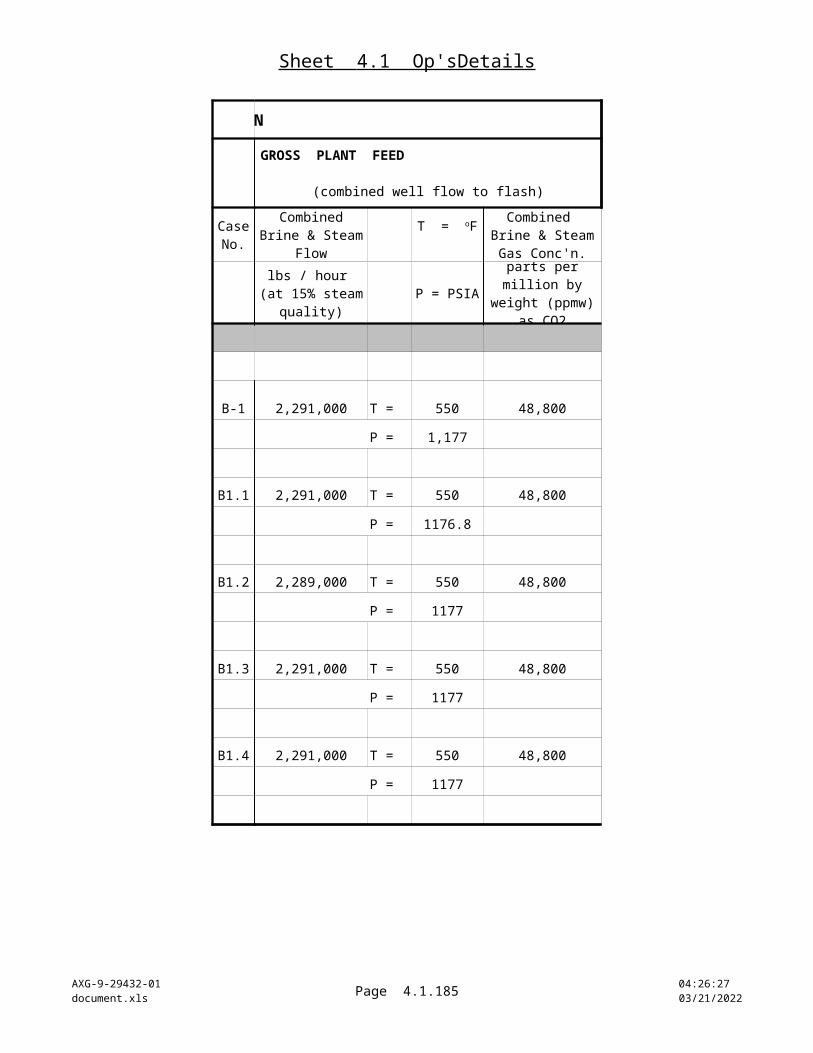
Sheet 4.1 Op'sDetails
AXG-9-29432-01document.xls Page 4.1.185 10:22:22
04/18/2023
Case No.
S-1
S1.1
S1.2
S1.3
S1.4
FLASHED STEAM AND GROSS POWER AUXILIARY STEAM & ELECTRICITY DEMAND
Total Flow
lbs / hour lbs / hour lbs / hour
STEAM TEMPERATURE,
PRESSURE, and GAS CONCENTRATION
TOTAL FLOW
TURBINE BACK-
PRESSURE
UNIT CAPACIT
Y
STEAM TO
VACUUM DRIVERS
STEAM TO OTHER
SYSTEMS
Flash Conditions CO2 ppm
by volume (ppmv) in
vapor phase
Steam + Gases
Gross Generator
Output
Total Flow (with gas)
oF, PSIAinches Hg
abs.Megawatt
s
PLACE HOLDER PLACE HOLDER
T 334 49,900 968,000.00 3.42 50.0 246,503 -464
P 114
T 334 49,900 968,000.00 3.42 50.0 116,794 14,536
P 114
T 334 49,900 968,000 3.27 50.0 2,103 215,433
P 114 750,000 = clean steam turbine feed reboiler vent
T 334 49,900 968,000.00 3.42 50.0 196,560 24,781
P 114
T 334 49,900 968,000.00 3.42 50.0 194,353 -464
P 114
PLACE HOLDER PLACE HOLDER
In all cases, the "Net Sales Electricity" reflects only the reduction from gross unit capacity caused by deducting the "Auxiliary" demands. No other utilities are counted in the "Net."
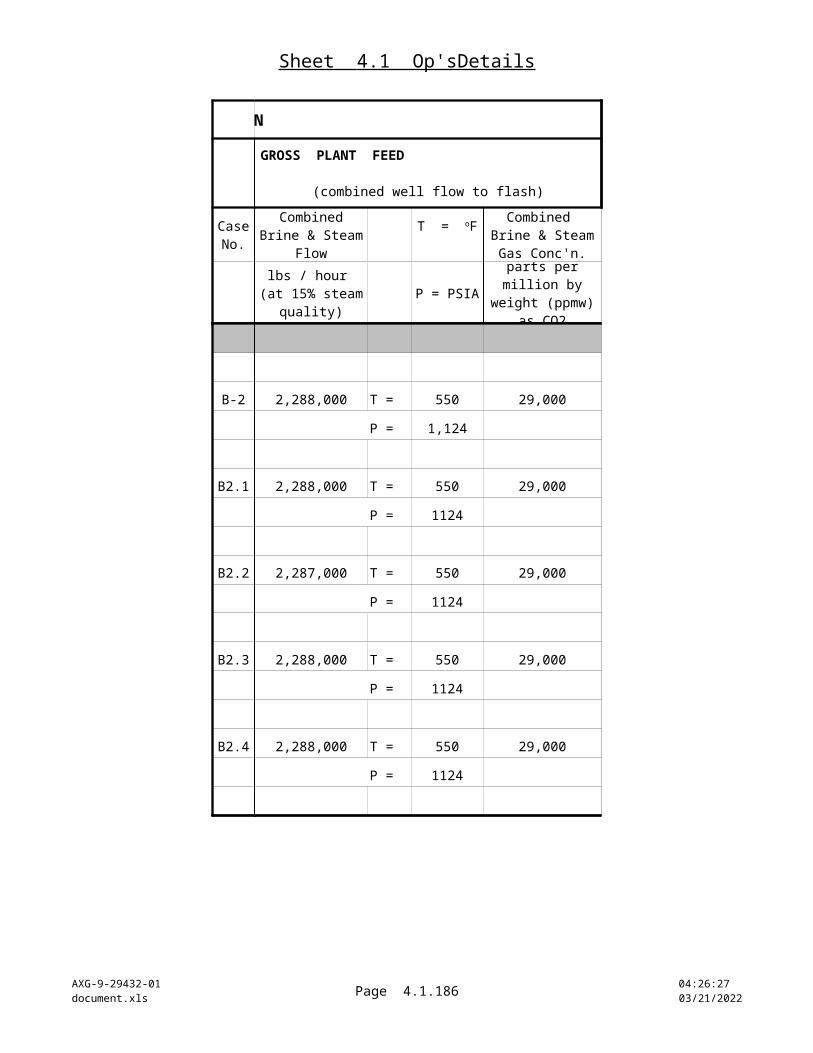
Sheet 4.1 Op'sDetails
AXG-9-29432-01document.xls Page 4.1.186 10:22:22
04/18/2023
Case No.
S-2
S2.1
S2.2
S2.3
S2.4
FLASHED STEAM AND GROSS POWER AUXILIARY STEAM & ELECTRICITY DEMAND
Total Flow
lbs / hour lbs / hour lbs / hour
STEAM TEMPERATURE,
PRESSURE, and GAS CONCENTRATION
TOTAL FLOW
TURBINE BACK-
PRESSURE
UNIT CAPACIT
Y
STEAM TO
VACUUM DRIVERS
STEAM TO OTHER
SYSTEMS
Flash Conditions CO2 ppm
by volume (ppmv) in
vapor phase
Steam + Gases
Gross Generator
Output
Total Flow (with gas)
oF, PSIAinches Hg
abs.Megawatt
s
T 235 10,100 1,446,000 3.40 50.0 171,739 353
P 23
T 235 10,100 1,446,000 3.40 50.0 55,520 1,731
P 23
T 235 10,100 1,446,000 3.26 50.0 2,123 68,517
P 23 1,375,000 = clean steam turbine feed reboiler vent
T 235 10,100 1,446,000 3.40 50.0 142,418 3,887
P 23
T 235 10,100 1,446,000 3.40 50.0 101,817 353
P 23
PLACE HOLDER PLACE HOLDER
In all cases, the "Net Sales Electricity" reflects only the reduction from gross unit capacity caused by deducting the "Auxiliary" demands. No other utilities are counted in the "Net."
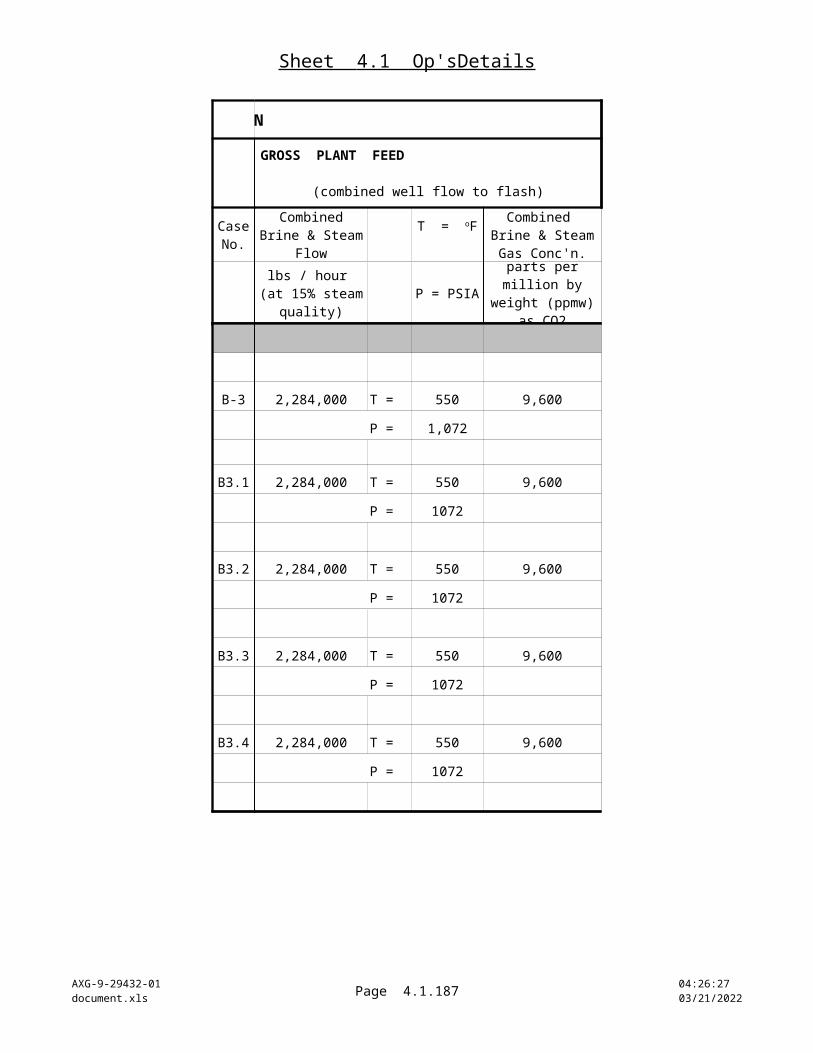
Sheet 4.1 Op'sDetails
AXG-9-29432-01document.xls Page 4.1.187 10:22:22
04/18/2023
Case No.
S-3
S3.1
S3.2
S3.3
S3.4
FLASHED STEAM AND GROSS POWER AUXILIARY STEAM & ELECTRICITY DEMAND
Total Flow
lbs / hour lbs / hour lbs / hour
STEAM TEMPERATURE,
PRESSURE, and GAS CONCENTRATION
TOTAL FLOW
TURBINE BACK-
PRESSURE
UNIT CAPACIT
Y
STEAM TO
VACUUM DRIVERS
STEAM TO OTHER
SYSTEMS
Flash Conditions CO2 ppm
by volume (ppmv) in
vapor phase
Steam + Gases
Gross Generator
Output
Total Flow (with gas)
oF, PSIAinches Hg
abs.Megawatt
s
T 344 30,400 1,001,000 5.71 50.0 90,895 267
P 128
T 344 30,400 1,001,000 5.71 50.0 68,693 5,538
P 128
T 344 30,400 1,001,000 5.41 50.0 1,093 139,609
P 128 860,000 = clean steam turbine feed reboiler vent
T 344 30,400 1,001,000 5.71 50.0 50,220 4,120
P 128
T 344 30,400 1,001,000 5.71 50.0 78,655 267
P 128
PLACE HOLDER PLACE HOLDER
In all cases, the "Net Sales Electricity" reflects only the reduction from gross unit capacity caused by deducting the "Auxiliary" demands. No other utilities are counted in the "Net."

Sheet 4.1 Op'sDetails
AXG-9-29432-01document.xls Page 4.1.188 10:22:22
04/18/2023
Case No.
S-4
S4.1
S4.2
S4.3
S4.4
FLASHED STEAM AND GROSS POWER AUXILIARY STEAM & ELECTRICITY DEMAND
Total Flow
lbs / hour lbs / hour lbs / hour
STEAM TEMPERATURE,
PRESSURE, and GAS CONCENTRATION
TOTAL FLOW
TURBINE BACK-
PRESSURE
UNIT CAPACIT
Y
STEAM TO
VACUUM DRIVERS
STEAM TO OTHER
SYSTEMS
Flash Conditions CO2 ppm
by volume (ppmv) in
vapor phase
Steam + Gases
Gross Generator
Output
Total Flow (with gas)
oF, PSIAinches Hg
abs.Megawatt
s
T 244 10,100 1,615,000 5.66 50.0 98,650 223
P 27
T 244 10,100 1,615,000 5.66 50.0 57,444 1,662
P 27
T 244 10,100 1,615,000 5.41 50.0 1,599 77,294
P 27 1,536,000 = clean steam turbine feed reboiler vent
T 244 10,100 1,615,000 5.66 50.0 68,825 1,947
P 27
T 244 10,100 1,615,000 5.66 50.0 69,820 223
P 27
PLACE HOLDER PLACE HOLDER
In all cases, the "Net Sales Electricity" reflects only the reduction from gross unit capacity caused by deducting the "Auxiliary" demands. No other utilities are counted in the "Net."

Sheet 4.1 Op'sDetails
AXG-9-29432-01document.xls Page 4.1.189 10:22:22
04/18/2023
Case No.
S-5
S5.1
S5.2
S5.3
S5.4
FLASHED STEAM AND GROSS POWER AUXILIARY STEAM & ELECTRICITY DEMAND
Total Flow
lbs / hour lbs / hour lbs / hour
STEAM TEMPERATURE,
PRESSURE, and GAS CONCENTRATION
TOTAL FLOW
TURBINE BACK-
PRESSURE
UNIT CAPACIT
Y
STEAM TO
VACUUM DRIVERS
STEAM TO OTHER
SYSTEMS
Flash Conditions CO2 ppm
by volume (ppmv) in
vapor phase
Steam + Gases
Gross Generator
Output
Total Flow (with gas)
oF, PSIAinches Hg
abs.Megawatt
s
PLACE HOLDER PLACE HOLDER
In all cases, the "Net Sales Electricity" reflects only the reduction from gross unit capacity caused by deducting the "Auxiliary" demands. No other utilities are counted in the "Net."
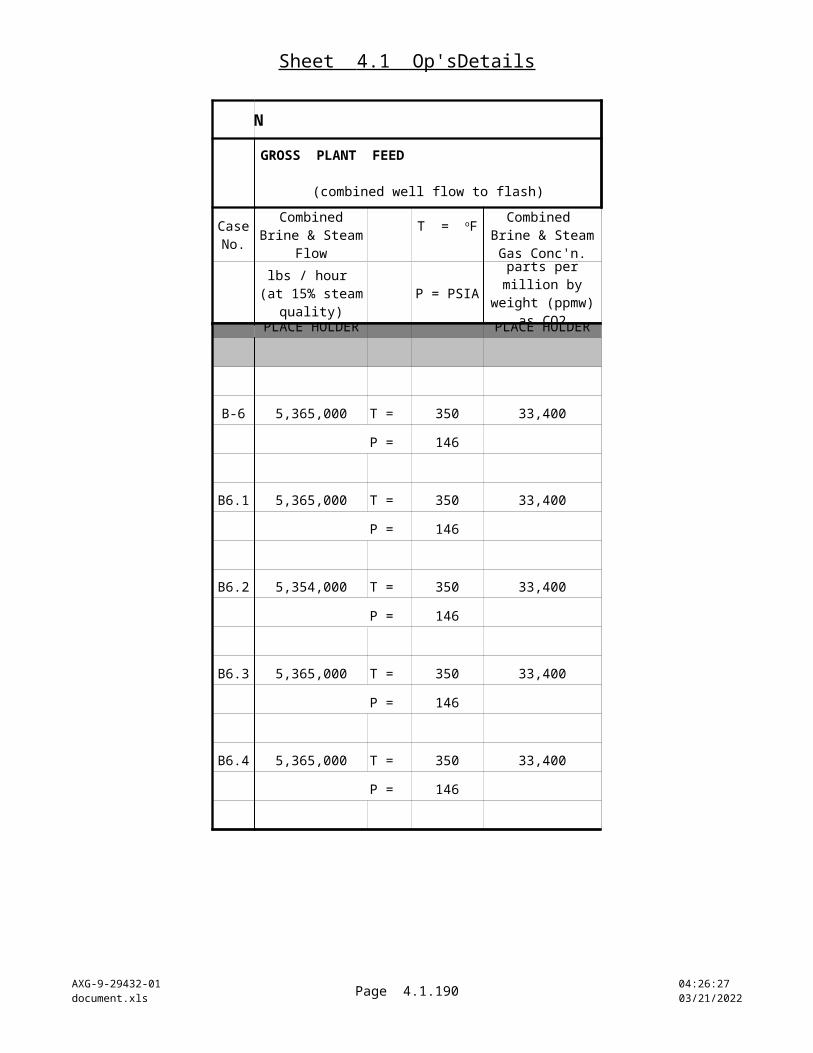
Sheet 4.1 Op'sDetails
AXG-9-29432-01document.xls Page 4.1.190 10:22:22
04/18/2023
Case No.
S-6
S6.1
S6.2
S6.3
S6.4
FLASHED STEAM AND GROSS POWER AUXILIARY STEAM & ELECTRICITY DEMAND
Total Flow
lbs / hour lbs / hour lbs / hour
STEAM TEMPERATURE,
PRESSURE, and GAS CONCENTRATION
TOTAL FLOW
TURBINE BACK-
PRESSURE
UNIT CAPACIT
Y
STEAM TO
VACUUM DRIVERS
STEAM TO OTHER
SYSTEMS
Flash Conditions CO2 ppm
by volume (ppmv) in
vapor phase
Steam + Gases
Gross Generator
Output
Total Flow (with gas)
oF, PSIAinches Hg
abs.Megawatt
s
PLACE HOLDER PLACE HOLDER
In all cases, the "Net Sales Electricity" reflects only the reduction from gross unit capacity caused by deducting the "Auxiliary" demands. No other utilities are counted in the "Net."

Sheet 4.1 Op'sDetails
AXG-9-29432-01document.xls Page 4.1.191 10:22:22
04/18/2023
Case No.
S-7
S7.1
S7.2
S7.3
S7.4
FLASHED STEAM AND GROSS POWER AUXILIARY STEAM & ELECTRICITY DEMAND
Total Flow
lbs / hour lbs / hour lbs / hour
STEAM TEMPERATURE,
PRESSURE, and GAS CONCENTRATION
TOTAL FLOW
TURBINE BACK-
PRESSURE
UNIT CAPACIT
Y
STEAM TO
VACUUM DRIVERS
STEAM TO OTHER
SYSTEMS
Flash Conditions CO2 ppm
by volume (ppmv) in
vapor phase
Steam + Gases
Gross Generator
Output
Total Flow (with gas)
oF, PSIAinches Hg
abs.Megawatt
s
PLACE HOLDER PLACE HOLDER
In all cases, the "Net Sales Electricity" reflects only the reduction from gross unit capacity caused by deducting the "Auxiliary" demands. No other utilities are counted in the "Net."

Sheet 4.1 Op'sDetails
AXG-9-29432-01document.xls Page 4.1.192 10:22:22
04/18/2023
Case No.
S-8
S8.1
S8.2
S8.3
S8.4
FLASHED STEAM AND GROSS POWER AUXILIARY STEAM & ELECTRICITY DEMAND
Total Flow
lbs / hour lbs / hour lbs / hour
STEAM TEMPERATURE,
PRESSURE, and GAS CONCENTRATION
TOTAL FLOW
TURBINE BACK-
PRESSURE
UNIT CAPACIT
Y
STEAM TO
VACUUM DRIVERS
STEAM TO OTHER
SYSTEMS
Flash Conditions CO2 ppm
by volume (ppmv) in
vapor phase
Steam + Gases
Gross Generator
Output
Total Flow (with gas)
oF, PSIAinches Hg
abs.Megawatt
s
PLACE HOLDER PLACE HOLDER
In all cases, the "Net Sales Electricity" reflects only the reduction from gross unit capacity caused by deducting the "Auxiliary" demands. No other utilities are counted in the "Net."
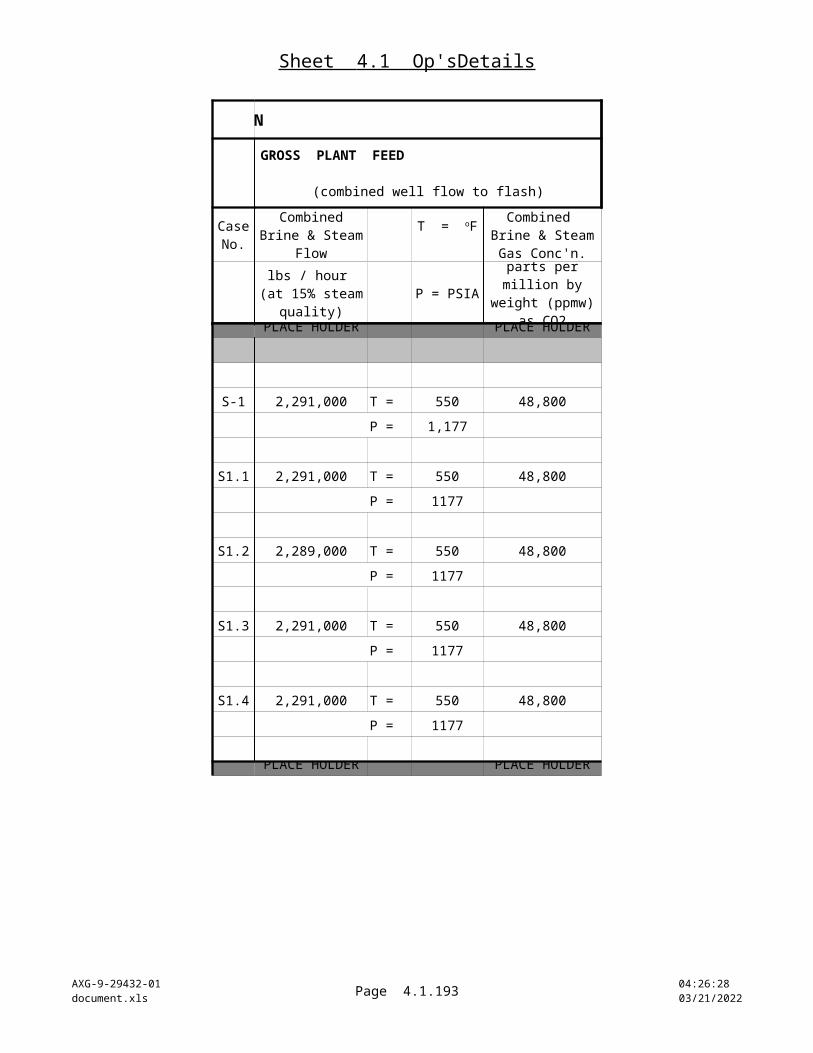
Sheet 4.1 Op'sDetails
AXG-9-29432-01document.xls Page 4.1.193 10:22:22
04/18/2023
Case No.
S-9
S9.1
S9.2
S9.3
S9.4
FLASHED STEAM AND GROSS POWER AUXILIARY STEAM & ELECTRICITY DEMAND
Total Flow
lbs / hour lbs / hour lbs / hour
STEAM TEMPERATURE,
PRESSURE, and GAS CONCENTRATION
TOTAL FLOW
TURBINE BACK-
PRESSURE
UNIT CAPACIT
Y
STEAM TO
VACUUM DRIVERS
STEAM TO OTHER
SYSTEMS
Flash Conditions CO2 ppm
by volume (ppmv) in
vapor phase
Steam + Gases
Gross Generator
Output
Total Flow (with gas)
oF, PSIAinches Hg
abs.Megawatt
s
In all cases, the "Net Sales Electricity" reflects only the reduction from gross unit capacity caused by deducting the "Auxiliary" demands. No other utilities are counted in the "Net."
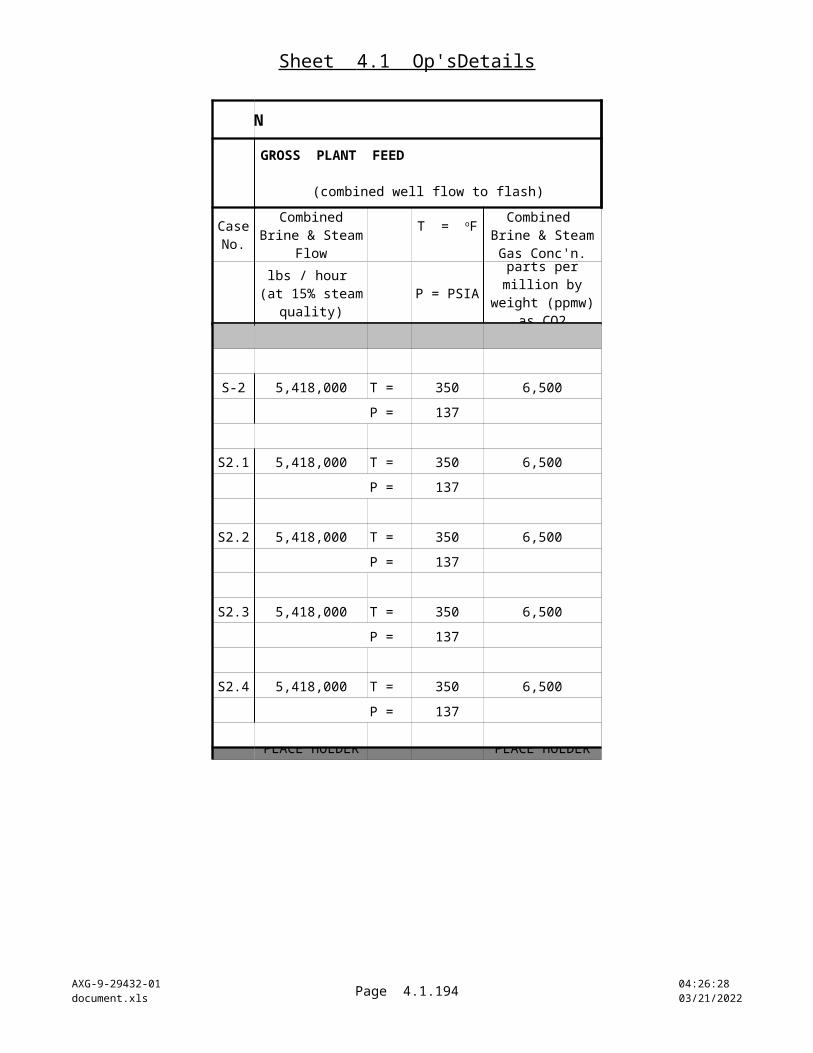
Sheet 4.1 Op'sDetails
AXG-9-29432-01document.xls Page 4.1.194 10:22:22
04/18/2023
Case No.
FLASHED STEAM AND GROSS POWER AUXILIARY STEAM & ELECTRICITY DEMAND
Total Flow
lbs / hour lbs / hour lbs / hour
STEAM TEMPERATURE,
PRESSURE, and GAS CONCENTRATION
TOTAL FLOW
TURBINE BACK-
PRESSURE
UNIT CAPACIT
Y
STEAM TO
VACUUM DRIVERS
STEAM TO OTHER
SYSTEMS
Flash Conditions CO2 ppm
by volume (ppmv) in
vapor phase
Steam + Gases
Gross Generator
Output
Total Flow (with gas)
oF, PSIAinches Hg
abs.Megawatt
s
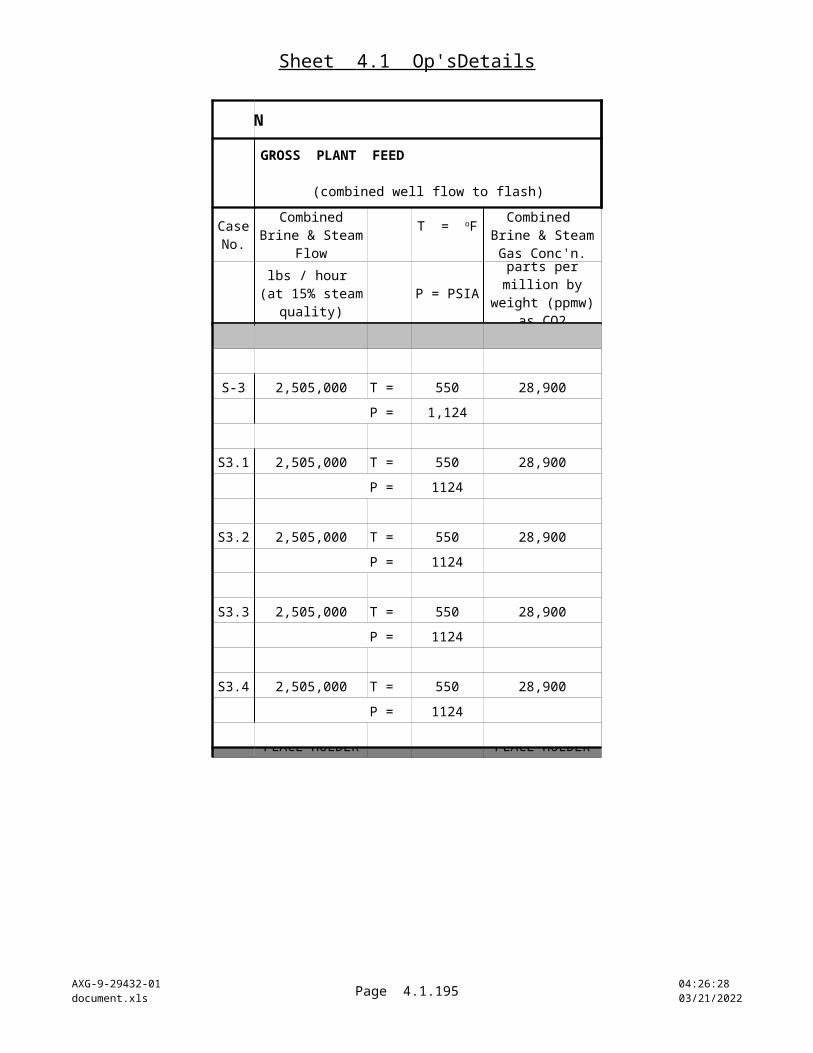
Sheet 4.1 Op'sDetails
AXG-9-29432-01document.xls Page 4.1.195 10:22:22
04/18/2023
B-1
B1.1
B1.2
B1.3
B1.4
Case No.
AUXILIARY STEAM & ELECTRICITY DEMANDNET SALES
ELECTRICITY
Kilowatts Megawatts %
MAIN CASE
GROUP 1
3,020 38.2 23.7% base case
s-st. ejector
2,730 40.5 19.1% 3-st. turbo
2,330 38.6 22.9% reboiler
3,120 39.0 21.9% biphase
eductor
2,760 39.9 20.2% hybrid 2-st
ejector/3rd
stage turbo
POWER LOSS TO
GAS REMOVAL
AUXILIARY ELECTRICITY
CW pumps, CT fans, brine
repressurization
deducting only auxiliaries at
left
Percent of "Unit Capacity"
(at left)
In all cases, the "Net Sales Electricity" reflects only the reduction from gross unit capacity caused by deducting the "Auxiliary" demands. No other utilities are counted in the "Net."

Sheet 4.1 Op'sDetails
AXG-9-29432-01document.xls Page 4.1.196 10:22:23
04/18/2023
Case No.
B-2
B2.1
B2.2
B2.3
B2.4
AUXILIARY STEAM & ELECTRICITY DEMANDNET SALES
ELECTRICITY
Kilowatts Megawatts %
POWER LOSS TO
GAS REMOVAL
AUXILIARY ELECTRICITY
CW pumps, CT fans, brine
repressurization
deducting only auxiliaries at
left
Percent of "Unit Capacity"
(at left)
MAIN CASE
GROUP 2
3,030 41.7 16.6% base case
s-st. ejector
2,740 43.3 13.5% 3-st. turbo
2,510 41.9 16.2% reboiler
3,390 43.0 14.0% biphase
eductor
2,760 42.9 14.2% hybrid 2-st
ejector/3rd
stage turbo
In all cases, the "Net Sales Electricity" reflects only the reduction from gross unit capacity caused by deducting the "Auxiliary" demands. No other utilities are counted in the "Net."

Sheet 4.1 Op'sDetails
AXG-9-29432-01document.xls Page 4.1.197 10:22:23
04/18/2023
Case No.
B-3
B3.1
B3.2
B3.3
B3.4
AUXILIARY STEAM & ELECTRICITY DEMANDNET SALES
ELECTRICITY
Kilowatts Megawatts %
POWER LOSS TO
GAS REMOVAL
AUXILIARY ELECTRICITY
CW pumps, CT fans, brine
repressurization
deducting only auxiliaries at
left
Percent of "Unit Capacity"
(at left)
MAIN CASE
GROUP 3
3,020 45.4 9.2% base case
s-st. ejector
2,740 46.0 7.9% 3-st. turbo
2,690 45.4 9.2% reboiler
3,520 46.5 7.0% biphase
eductor
2,760 45.9 8.1% hybrid 2-st
ejector/3rd
stage turbo
In all cases, the "Net Sales Electricity" reflects only the reduction from gross unit capacity caused by deducting the "Auxiliary" demands. No other utilities are counted in the "Net."
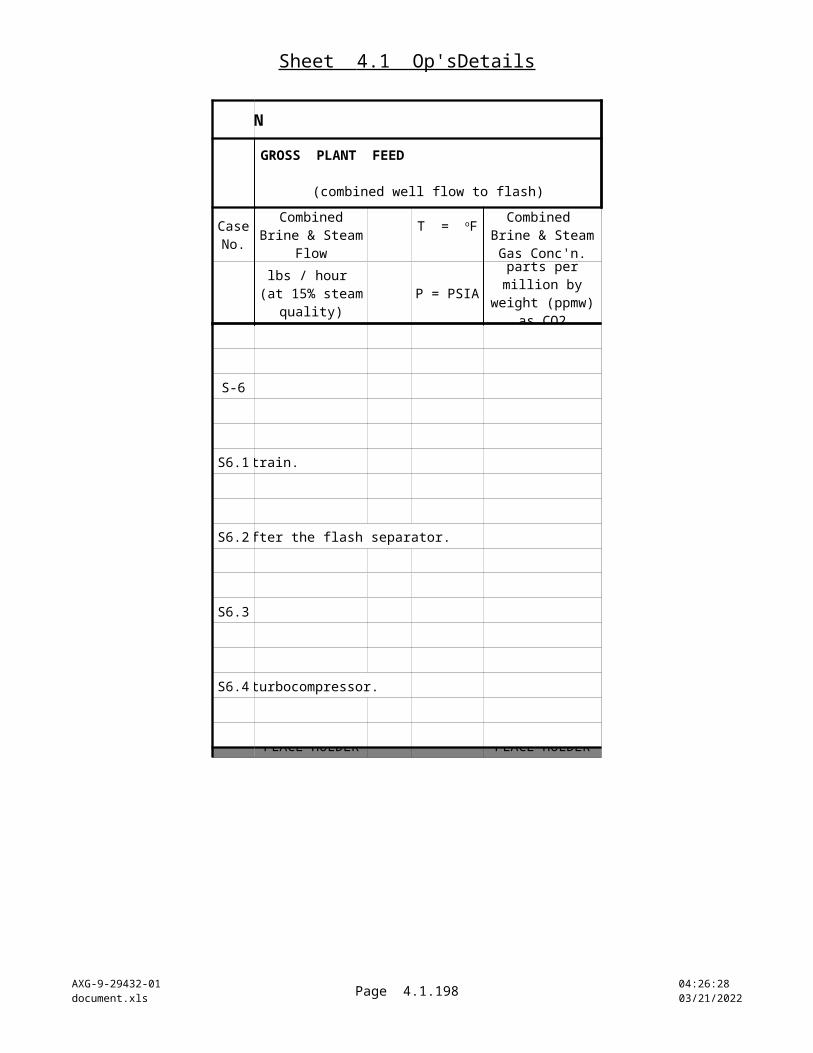
Sheet 4.1 Op'sDetails
AXG-9-29432-01document.xls Page 4.1.198 10:22:23
04/18/2023
Case No.
B-4
B4.1
B4.2
B4.3
B4.4
AUXILIARY STEAM & ELECTRICITY DEMANDNET SALES
ELECTRICITY
Kilowatts Megawatts %
POWER LOSS TO
GAS REMOVAL
AUXILIARY ELECTRICITY
CW pumps, CT fans, brine
repressurization
deducting only auxiliaries at
left
Percent of "Unit Capacity"
(at left)
MAIN CASE
GROUP 4
5,320 40.6 18.8% base case
s-st. ejector
4,790 43.2 13.5% 3-st. turbo
4,700 43.3 13.3% reboiler
5,260 41.3 17.4% biphase
eductor
4,830 42.7 14.6% hybrid 2-st
ejector/3rd
stage turbo
In all cases, the "Net Sales Electricity" reflects only the reduction from gross unit capacity caused by deducting the "Auxiliary" demands. No other utilities are counted in the "Net."
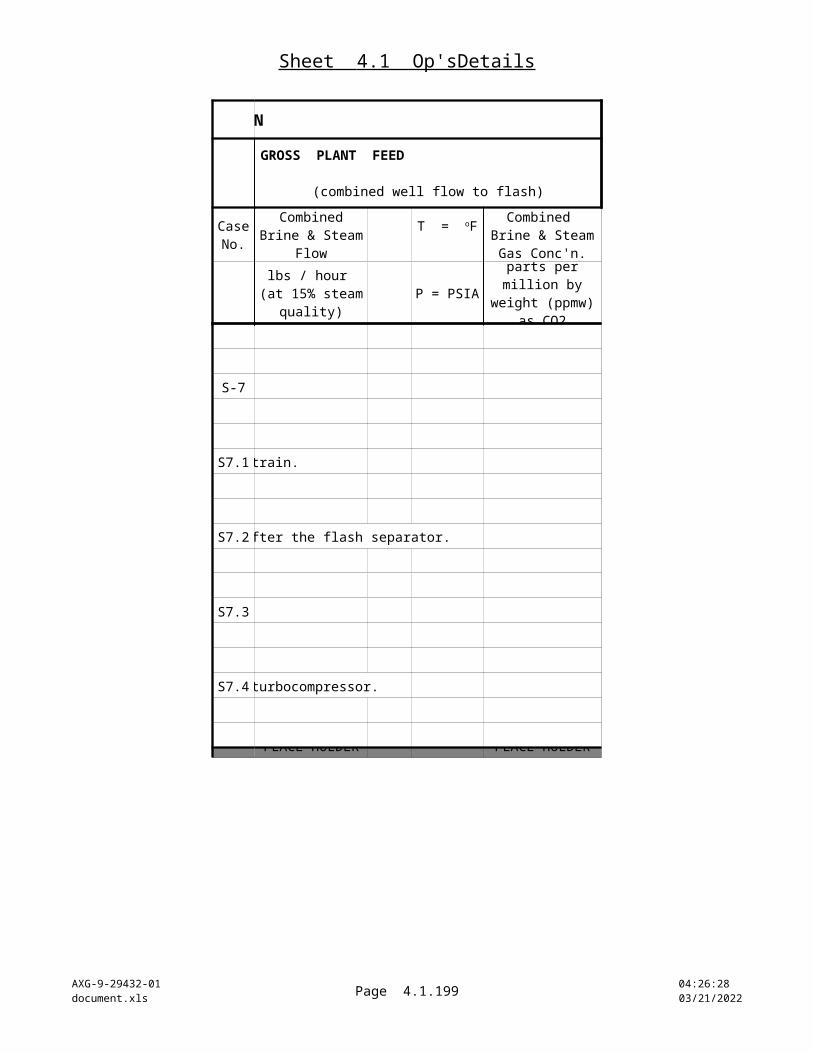
Sheet 4.1 Op'sDetails
AXG-9-29432-01document.xls Page 4.1.199 10:22:23
04/18/2023
Case No.
B-5
B5.1
B5.2
B5.3
B5.4
AUXILIARY STEAM & ELECTRICITY DEMANDNET SALES
ELECTRICITY
Kilowatts Megawatts %
POWER LOSS TO
GAS REMOVAL
AUXILIARY ELECTRICITY
CW pumps, CT fans, brine
repressurization
deducting only auxiliaries at
left
Percent of "Unit Capacity"
(at left)
MAIN CASE
GROUP 5
5,340 31.7 36.6% base case
s-st. ejector
4,780 38.8 22.5% 3-st. turbo
4,400 39.9 20.3% reboiler
4,210 32.8 34.4% biphase
eductor
4,830 36.8 26.3% hybrid 2-st
ejector/3rd
stage turbo
In all cases, the "Net Sales Electricity" reflects only the reduction from gross unit capacity caused by deducting the "Auxiliary" demands. No other utilities are counted in the "Net."
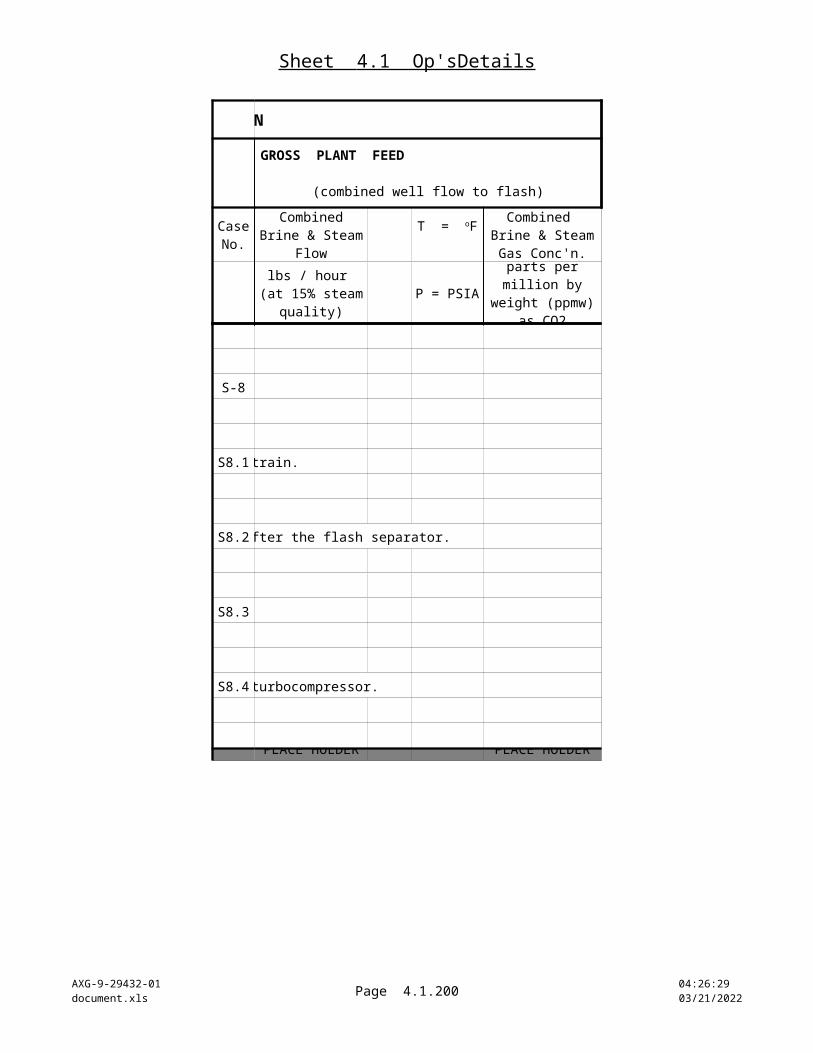
Sheet 4.1 Op'sDetails
AXG-9-29432-01document.xls Page 4.1.200 10:22:23
04/18/2023
Case No.
B-6
B6.1
B6.2
B6.3
B6.4
AUXILIARY STEAM & ELECTRICITY DEMANDNET SALES
ELECTRICITY
Kilowatts Megawatts %
POWER LOSS TO
GAS REMOVAL
AUXILIARY ELECTRICITY
CW pumps, CT fans, brine
repressurization
deducting only auxiliaries at
left
Percent of "Unit Capacity"
(at left)
PLACE HOLDER
MAIN CASE
GROUP 6
5,350 24.8 50.4% base case
s-st. ejector
4,760 34.2 31.5% 3-st. turbo
4,100 36.6 26.8% reboiler
3,330 25.9 48.3% biphase
eductor
4,830 31.1 37.8% hybrid 2-st
ejector/3rd
stage turbo
In all cases, the "Net Sales Electricity" reflects only the reduction from gross unit capacity caused by deducting the "Auxiliary" demands. No other utilities are counted in the "Net."
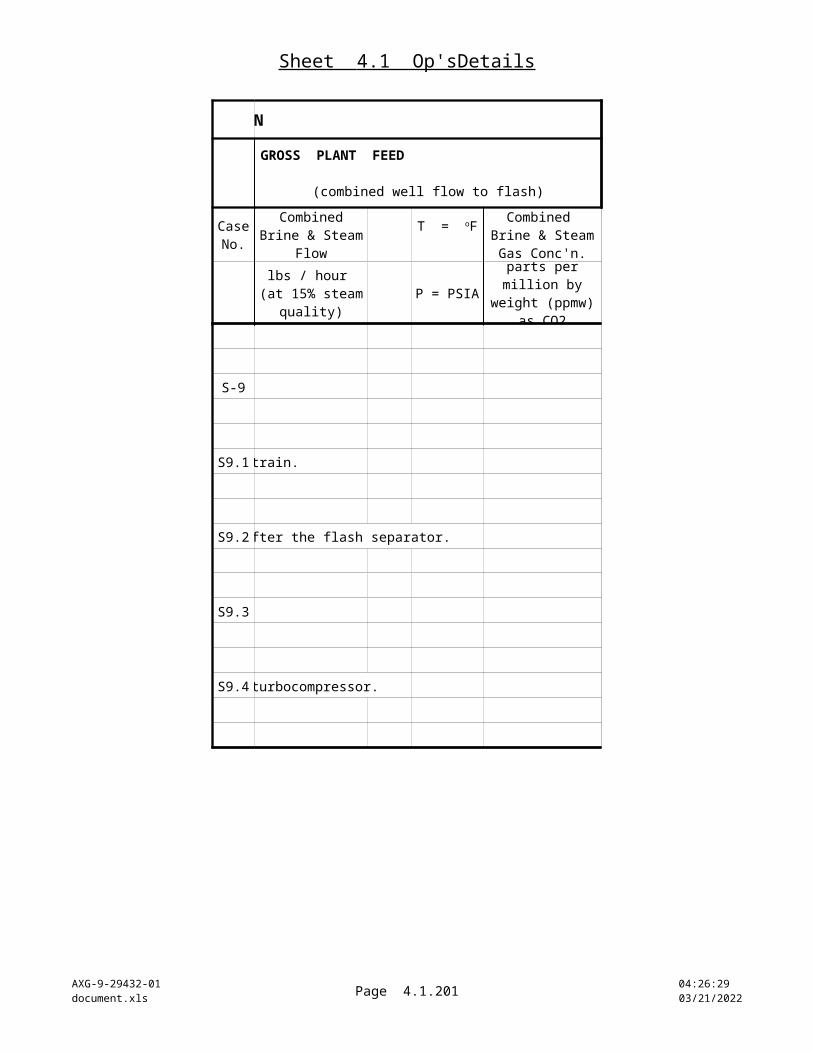
Sheet 4.1 Op'sDetails
AXG-9-29432-01document.xls Page 4.1.201 10:22:23
04/18/2023
Case No.
B-7
B7.1
B7.2
B7.3
B7.4
AUXILIARY STEAM & ELECTRICITY DEMANDNET SALES
ELECTRICITY
Kilowatts Megawatts %
POWER LOSS TO
GAS REMOVAL
AUXILIARY ELECTRICITY
CW pumps, CT fans, brine
repressurization
deducting only auxiliaries at
left
Percent of "Unit Capacity"
(at left)
PLACE HOLDER
MAIN CASE
GROUP 7
5,190 5.5 89.0% base case
s-st. ejector
4,650 11.2 77.5% 3-st. turbo
2,440 23.6 52.7% reboiler
930 7.1 85.7% biphase
eductor
4,690 8.7 82.5% hybrid 2-st
ejector/3rd
stage turbo
In all cases, the "Net Sales Electricity" reflects only the reduction from gross unit capacity caused by deducting the "Auxiliary" demands. No other utilities are counted in the "Net."
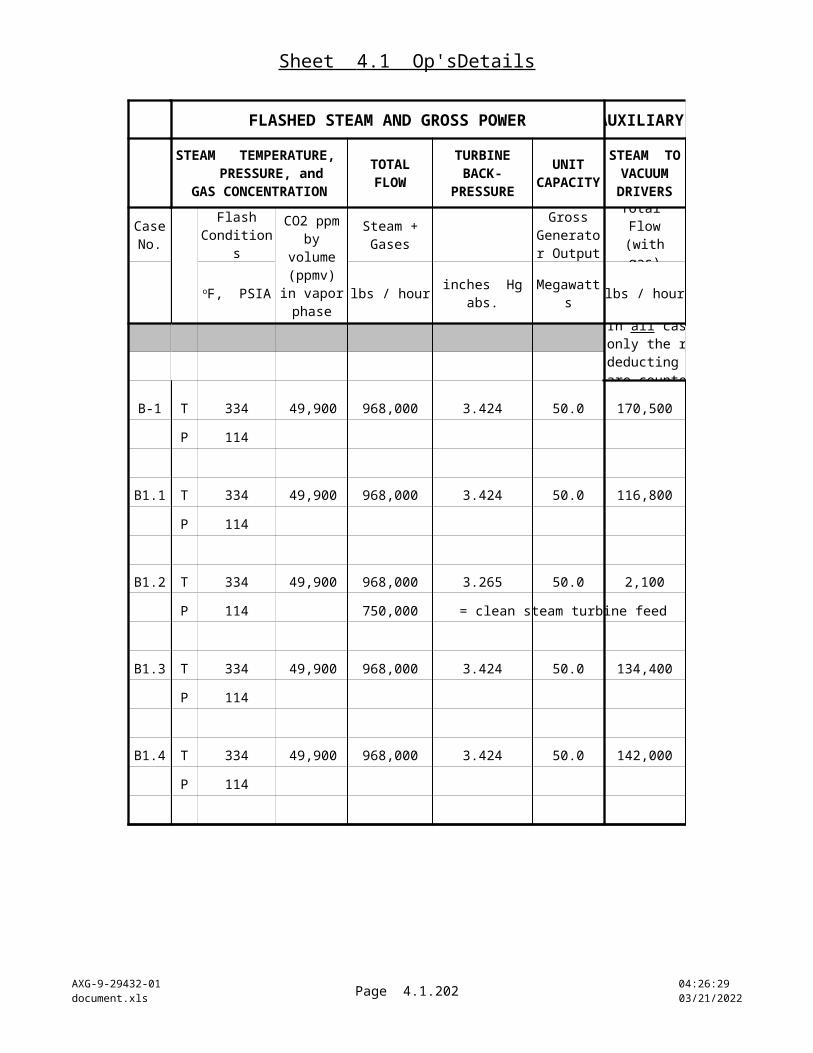
Sheet 4.1 Op'sDetails
AXG-9-29432-01document.xls Page 4.1.202 10:22:23
04/18/2023
Case No.
B-8
B8.1
B8.2
B8.3
B8.4
AUXILIARY STEAM & ELECTRICITY DEMANDNET SALES
ELECTRICITY
Kilowatts Megawatts %
POWER LOSS TO
GAS REMOVAL
AUXILIARY ELECTRICITY
CW pumps, CT fans, brine
repressurization
deducting only auxiliaries at
left
Percent of "Unit Capacity"
(at left)
PLACE HOLDER
MAIN CASE
GROUP 8
3,000 30.6 38.8% base case
s-st. ejector
2,700 33.4 33.2% 3-st. turbo
1,860 31.0 37.9% reboiler
2,390 29.8 40.3% biphase
eductor
2,730 32.7 34.5% hybrid 2-st
ejector/3rd
stage turbo
In all cases, the "Net Sales Electricity" reflects only the reduction from gross unit capacity caused by deducting the "Auxiliary" demands. No other utilities are counted in the "Net."
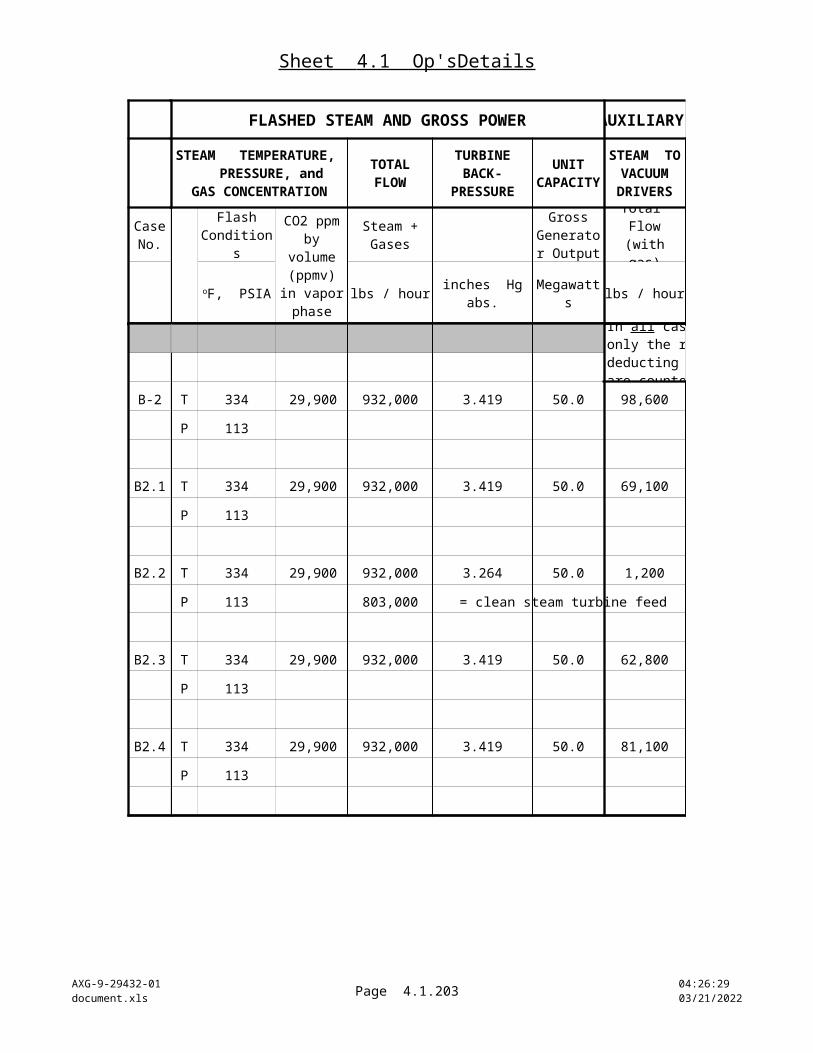
Sheet 4.1 Op'sDetails
AXG-9-29432-01document.xls Page 4.1.203 10:22:23
04/18/2023
Case No.
S-1
S1.1
S1.2
S1.3
S1.4
AUXILIARY STEAM & ELECTRICITY DEMANDNET SALES
ELECTRICITY
Kilowatts Megawatts %
POWER LOSS TO
GAS REMOVAL
AUXILIARY ELECTRICITY
CW pumps, CT fans, brine
repressurization
deducting only auxiliaries at
left
Percent of "Unit Capacity"
(at left)
PLACE HOLDER
SENSITIVITY
GROUP S-1
3,051 34.2 31.5% base case
s-st. ejector
2,726 40.5 19.0% 3-st. turbo
2,333 38.6 22.9% reboiler
2,814 35.8 28.5% biphase
eductor
2,768 37.2 25.6% hybrid 2-st
ejector/3rd
stage turboPLACE HOLDER
In all cases, the "Net Sales Electricity" reflects only the reduction from gross unit capacity caused by deducting the "Auxiliary" demands. No other utilities are counted in the "Net."
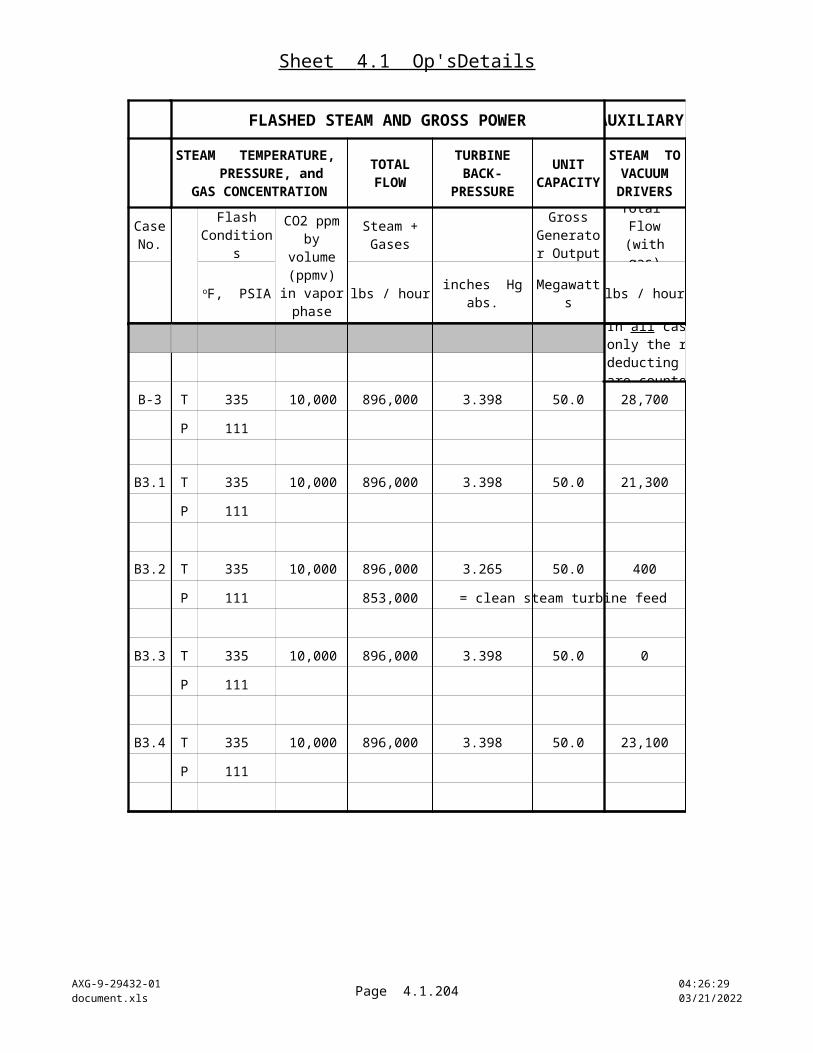
Sheet 4.1 Op'sDetails
AXG-9-29432-01document.xls Page 4.1.204 10:22:23
04/18/2023
Case No.
S-2
S2.1
S2.2
S2.3
S2.4
AUXILIARY STEAM & ELECTRICITY DEMANDNET SALES
ELECTRICITY
Kilowatts Megawatts %
POWER LOSS TO
GAS REMOVAL
AUXILIARY ELECTRICITY
CW pumps, CT fans, brine
repressurization
deducting only auxiliaries at
left
Percent of "Unit Capacity"
(at left)
SENSITIVITY
GROUP S-2
5,332 38.7 22.6% base case
s-st. ejector
4,790 43.2 13.5% 3-st. turbo
4,698 43.3 13.3% reboiler
5,071 39.9 20.3% biphase
eductor
4,837 41.6 16.7% hybrid 2-st
ejector/3rd
stage turboPLACE HOLDER
In all cases, the "Net Sales Electricity" reflects only the reduction from gross unit capacity caused by deducting the "Auxiliary" demands. No other utilities are counted in the "Net."
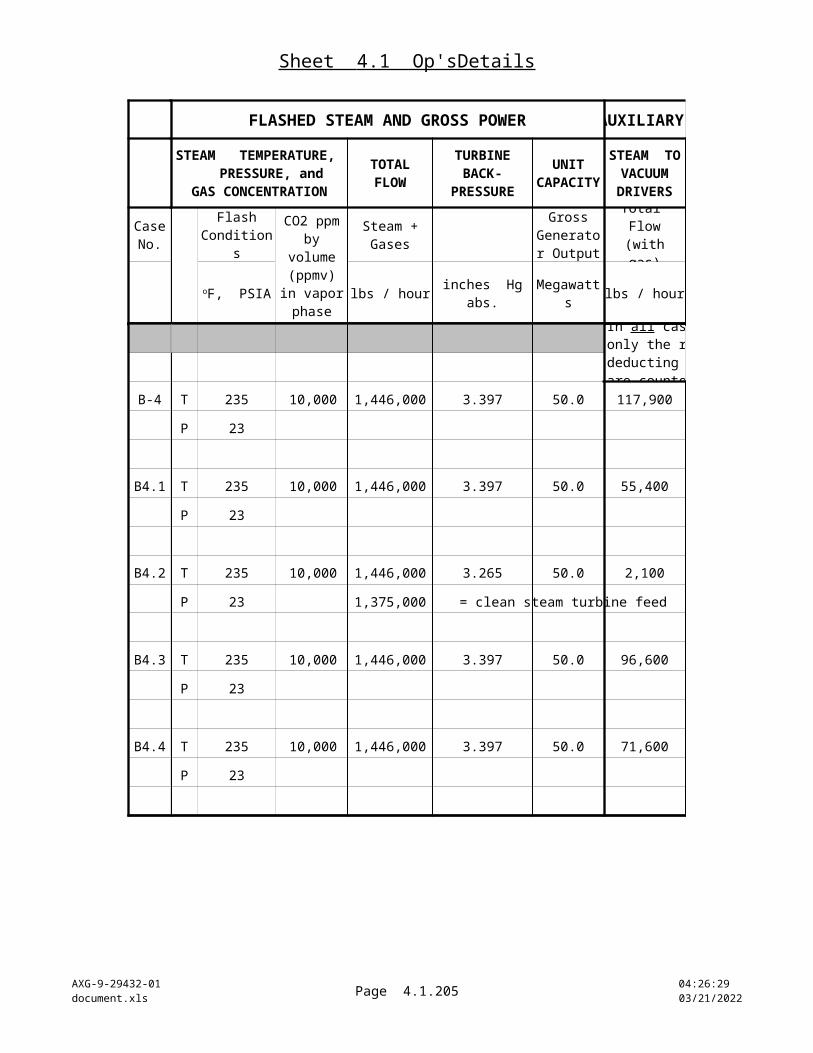
Sheet 4.1 Op'sDetails
AXG-9-29432-01document.xls Page 4.1.205 10:22:23
04/18/2023
Case No.
S-3
S3.1
S3.2
S3.3
S3.4
AUXILIARY STEAM & ELECTRICITY DEMANDNET SALES
ELECTRICITY
Kilowatts Megawatts %
POWER LOSS TO
GAS REMOVAL
AUXILIARY ELECTRICITY
CW pumps, CT fans, brine
repressurization
deducting only auxiliaries at
left
Percent of "Unit Capacity"
(at left)
SENSITIVITY
GROUP S-3
3,246 42.2 15.6% base case
s-st. ejector
2,922 43.4 13.3% 3-st. turbo
2,695 41.7 16.7% reboiler
3,799 43.5 13.0% biphase
eductor
2,967 43.1 13.8% hybrid 2-st
ejector/3rd
stage turboPLACE HOLDER
In all cases, the "Net Sales Electricity" reflects only the reduction from gross unit capacity caused by deducting the "Auxiliary" demands. No other utilities are counted in the "Net."

Sheet 4.1 Op'sDetails
AXG-9-29432-01document.xls Page 4.1.206 10:22:23
04/18/2023
Case No.
S-4
S4.1
S4.2
S4.3
S4.4
AUXILIARY STEAM & ELECTRICITY DEMANDNET SALES
ELECTRICITY
Kilowatts Megawatts %
POWER LOSS TO
GAS REMOVAL
AUXILIARY ELECTRICITY
CW pumps, CT fans, brine
repressurization
deducting only auxiliaries at
left
Percent of "Unit Capacity"
(at left)
SENSITIVITY
GROUP S-4
5,950 41.0 18.0% base case
s-st. ejector
5,349 42.8 14.4% 3-st. turbo
5,251 42.8 14.4% reboiler
6,259 41.5 16.9% biphase
eductor
5,405 42.4 15.1% hybrid 2-st
ejector/3rd
stage turboPLACE HOLDER
In all cases, the "Net Sales Electricity" reflects only the reduction from gross unit capacity caused by deducting the "Auxiliary" demands. No other utilities are counted in the "Net."
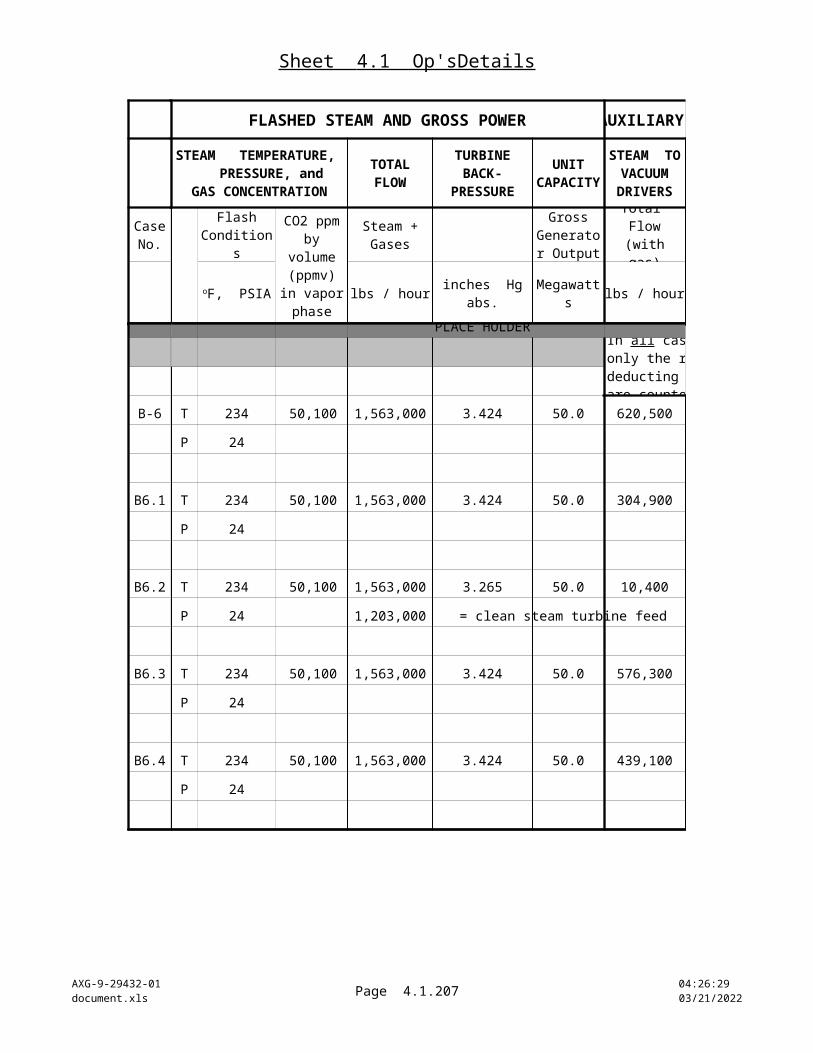
Sheet 4.1 Op'sDetails
AXG-9-29432-01document.xls Page 4.1.207 10:22:23
04/18/2023
Case No.
S-5
S5.1
S5.2
S5.3
S5.4
AUXILIARY STEAM & ELECTRICITY DEMANDNET SALES
ELECTRICITY
Kilowatts Megawatts %
POWER LOSS TO
GAS REMOVAL
AUXILIARY ELECTRICITY
CW pumps, CT fans, brine
repressurization
deducting only auxiliaries at
left
Percent of "Unit Capacity"
(at left)
PLACE HOLDER
In all cases, the "Net Sales Electricity" reflects only the reduction from gross unit capacity caused by deducting the "Auxiliary" demands. No other utilities are counted in the "Net."
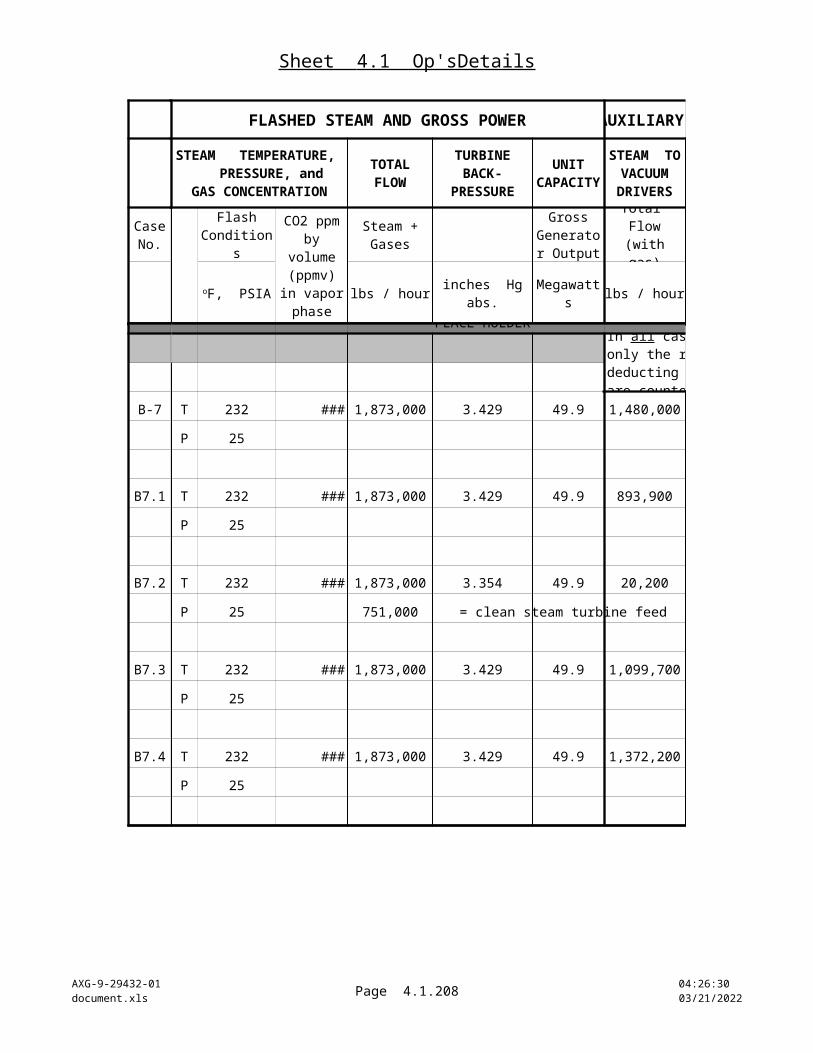
Sheet 4.1 Op'sDetails
AXG-9-29432-01document.xls Page 4.1.208 10:22:23
04/18/2023
Case No.
S-6
S6.1
S6.2
S6.3
S6.4
AUXILIARY STEAM & ELECTRICITY DEMANDNET SALES
ELECTRICITY
Kilowatts Megawatts %
POWER LOSS TO
GAS REMOVAL
AUXILIARY ELECTRICITY
CW pumps, CT fans, brine
repressurization
deducting only auxiliaries at
left
Percent of "Unit Capacity"
(at left)
PLACE HOLDER
In all cases, the "Net Sales Electricity" reflects only the reduction from gross unit capacity caused by deducting the "Auxiliary" demands. No other utilities are counted in the "Net."
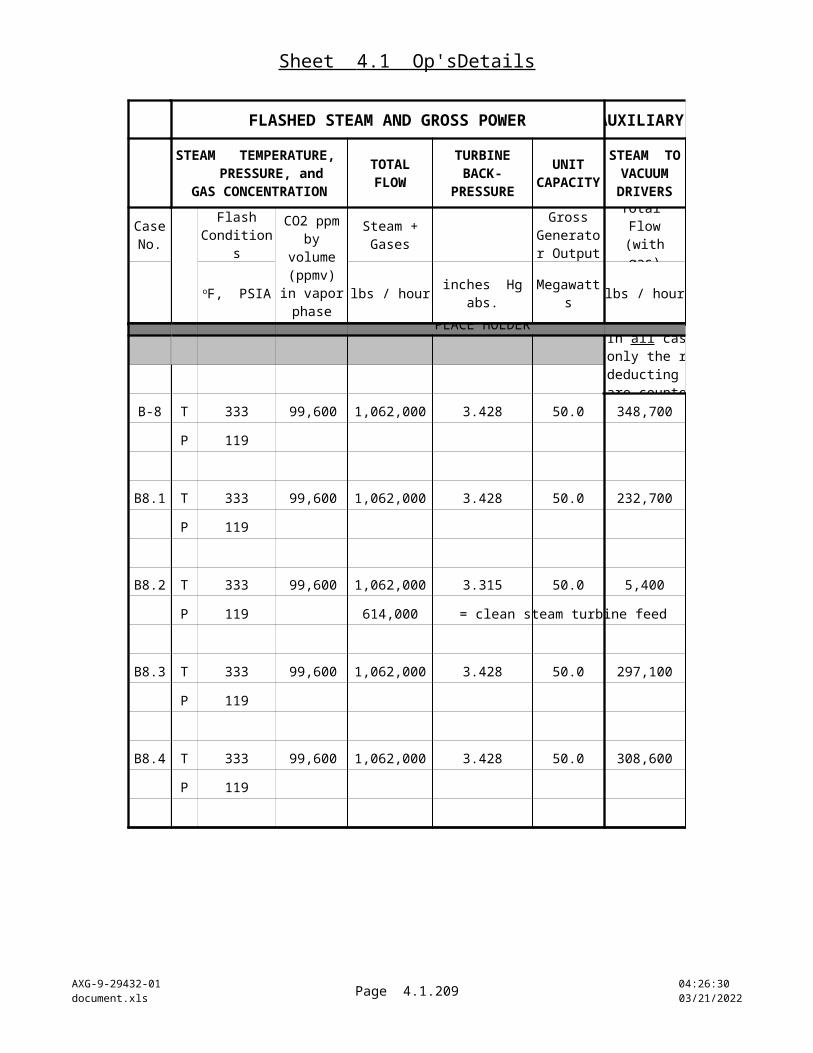
Sheet 4.1 Op'sDetails
AXG-9-29432-01document.xls Page 4.1.209 10:22:23
04/18/2023
Case No.
S-7
S7.1
S7.2
S7.3
S7.4
AUXILIARY STEAM & ELECTRICITY DEMANDNET SALES
ELECTRICITY
Kilowatts Megawatts %
POWER LOSS TO
GAS REMOVAL
AUXILIARY ELECTRICITY
CW pumps, CT fans, brine
repressurization
deducting only auxiliaries at
left
Percent of "Unit Capacity"
(at left)
PLACE HOLDER
In all cases, the "Net Sales Electricity" reflects only the reduction from gross unit capacity caused by deducting the "Auxiliary" demands. No other utilities are counted in the "Net."
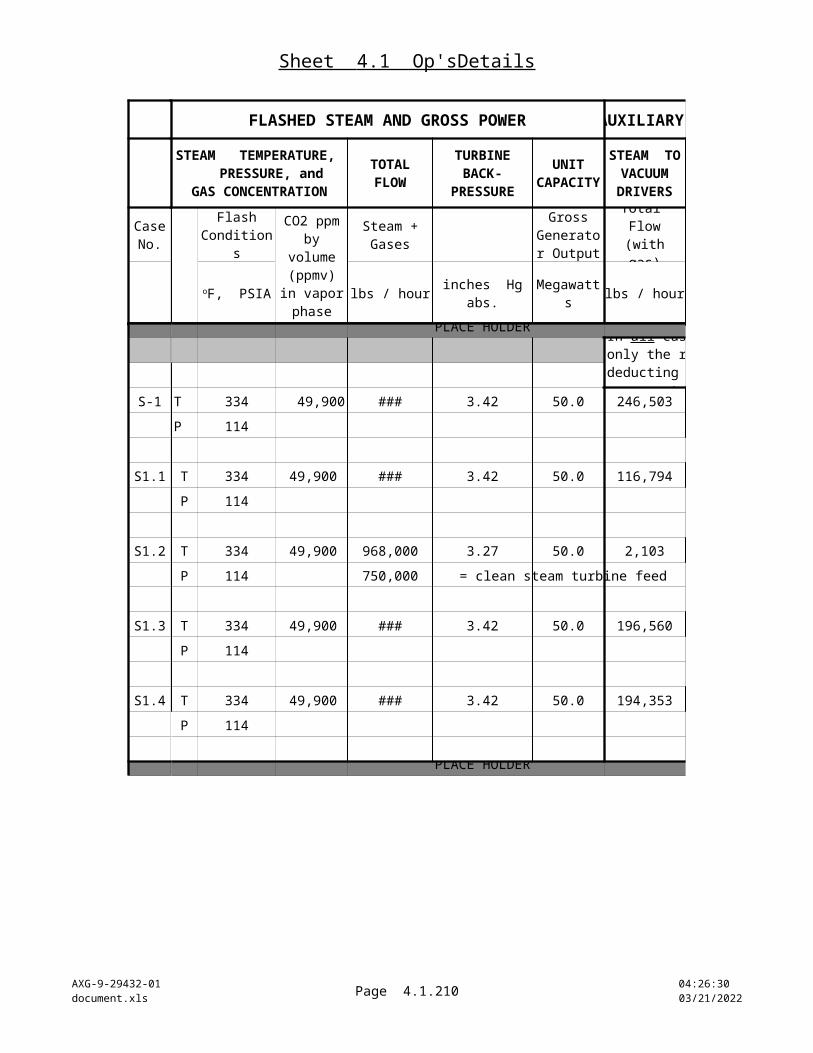
Sheet 4.1 Op'sDetails
AXG-9-29432-01document.xls Page 4.1.210 10:22:23
04/18/2023
Case No.
S-8
S8.1
S8.2
S8.3
S8.4
AUXILIARY STEAM & ELECTRICITY DEMANDNET SALES
ELECTRICITY
Kilowatts Megawatts %
POWER LOSS TO
GAS REMOVAL
AUXILIARY ELECTRICITY
CW pumps, CT fans, brine
repressurization
deducting only auxiliaries at
left
Percent of "Unit Capacity"
(at left)
PLACE HOLDER
In all cases, the "Net Sales Electricity" reflects only the reduction from gross unit capacity caused by deducting the "Auxiliary" demands. No other utilities are counted in the "Net."
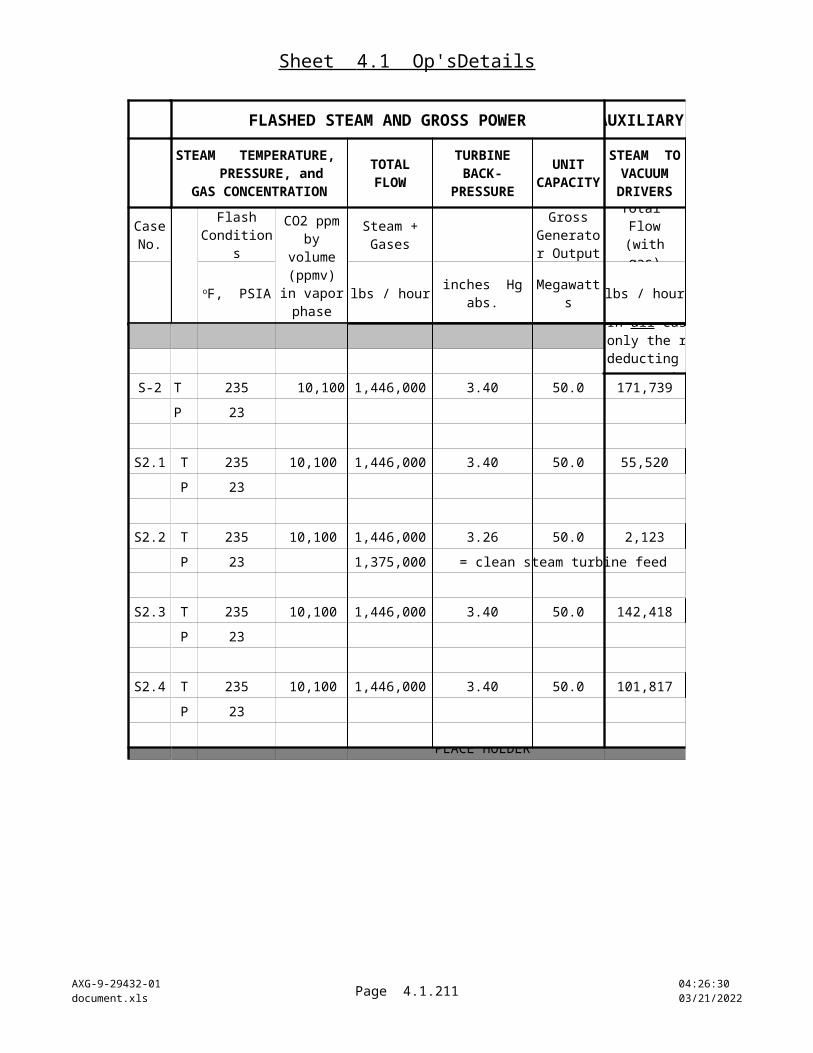
Sheet 4.1 Op'sDetails
AXG-9-29432-01document.xls Page 4.1.211 10:22:23
04/18/2023
Case No.
S-9
S9.1
S9.2
S9.3
S9.4
AUXILIARY STEAM & ELECTRICITY DEMANDNET SALES
ELECTRICITY
Kilowatts Megawatts %
POWER LOSS TO
GAS REMOVAL
AUXILIARY ELECTRICITY
CW pumps, CT fans, brine
repressurization
deducting only auxiliaries at
left
Percent of "Unit Capacity"
(at left)
In all cases, the "Net Sales Electricity" reflects only the reduction from gross unit capacity caused by deducting the "Auxiliary" demands. No other utilities are counted in the "Net."

Sheet 4.1 Op'sDetails
AXG-9-29432-01document.xls Page 4.1.212 10:22:23
04/18/2023
Case No.
AUXILIARY STEAM & ELECTRICITY DEMANDNET SALES
ELECTRICITY
Kilowatts Megawatts %
POWER LOSS TO
GAS REMOVAL
AUXILIARY ELECTRICITY
CW pumps, CT fans, brine
repressurization
deducting only auxiliaries at
left
Percent of "Unit Capacity"
(at left)
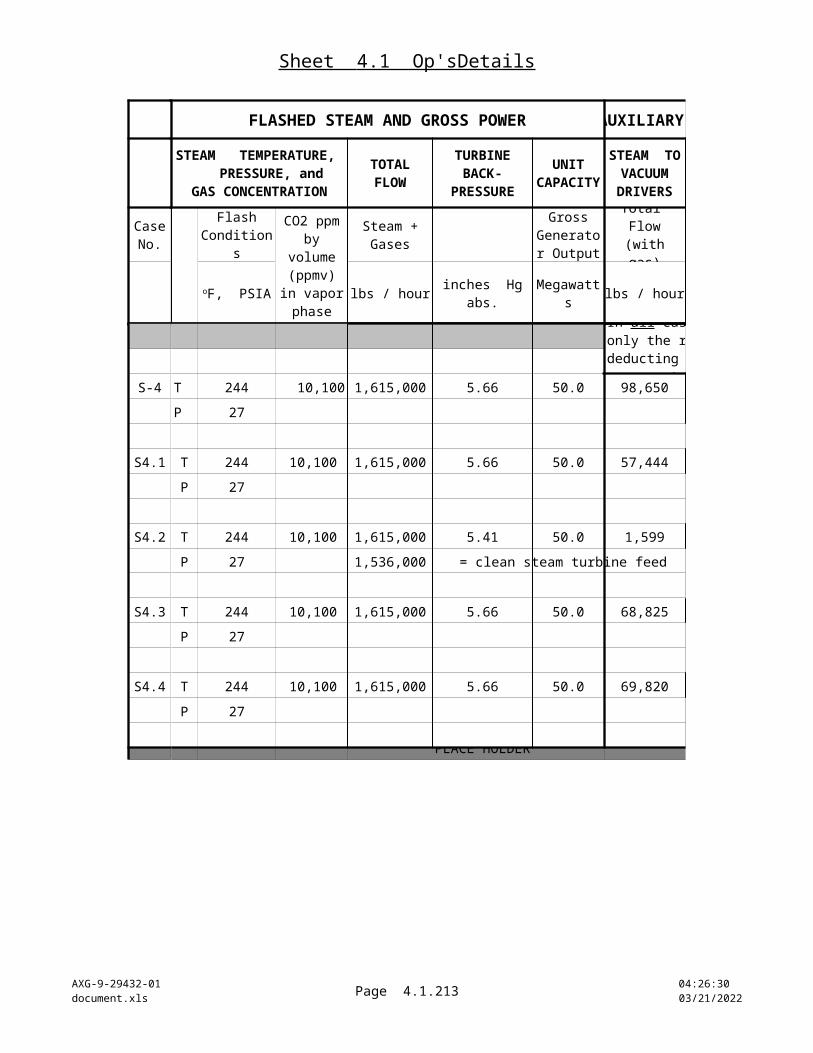
Sheet 4.2 EnFigMerit
AXG-9-29432-01document.xls Page 4.2.213 10:22:23
04/18/2023
ENGINEERING FIGURES OF MERIT
OVERALL PLANT DEFINITION FLASHED STEAM AND GROSS POWER
ppmv
MAIN CASE GROUP 1 HIGH TEMP/HIGH PRESSURE/HI GASB-1 2,291,000 T = 550 48,800 T 334 49,900
2-stage ejector P = 1177 P 114
B1.1 2,291,000 T = 550 48,800 T 334 49,9003-stage turbo P = 1177 P 114
B1.2 2,289,000 T = 550 48,800 T 334 49,900reboiler P = 1177 P 114
B1.3 2,291,000 T = 550 48,800 T 334 49,900biphase P = 1177 P 114eductor
B1.4 2,291,000 T = 550 48,800 T 334 49,900hybrid P = 1177 P 114
GROSS PLANT FEED
(combined well flow to flash)
STEAM TEMPERATURE, PRESSURE & GAS CONTENT
Case No.
Combined Brine & Steam Flow
T = oF
Combined Brine & Steam Gas Conc'n.
Flash Conditions
Gas Loading in Steam
lbs / hour (at 15% steam quality)
P = PSIA
parts per million by weight (ppmw) as CO2
oF, PSIA
Define a technical "figure of merit" as a ratio of net power plant productivities, comparing the respective productivity value for each alternative plant configuration to the productivity of their common "Base Case." The common bases include overall process conditions and design assumptions outlined in worksheets 2.1, 2.2, and 4.1. Define productivity as the balance of plant
generating capacity (as megawatts) remaining after deducting power losses consumed specifically by the noncondensable gas removal system and that system's dedicated share of the cooling system power demand; for the biphase eductor option, also include the power needed to repressurize flashed brine for transfer out of the system. Express this productivity as "Net Sales"
megawatts or as percent of gross plant capacity -- i.e. the "residual plant capacity." This assumes any other in-plant utility power demands are essentially constant, and are therefore considered separately from gas removal power demands.
The value of the figure of merit for the Base Case design is 1.00 by this definition. Figure of merit values greater than 1 show that an alternative technology outperforms the Base Case in proportion to the value. Figure-of-merit values less than 1 indicate the Base Case performs better than the alternative.

Sheet 4.2 EnFigMerit
AXG-9-29432-01document.xls Page 4.2.214 10:22:23
04/18/2023
OVERALL PLANT DEFINITION FLASHED STEAM AND GROSS POWER
ppmv
GROSS PLANT FEED
(combined well flow to flash)
STEAM TEMPERATURE, PRESSURE & GAS CONTENT
Case No.
Combined Brine & Steam Flow
T = oF
Combined Brine & Steam Gas Conc'n.
Flash Conditions
Gas Loading in Steam
lbs / hour (at 15% steam quality)
P = PSIA
parts per million by weight (ppmw) as CO2
oF, PSIA
MAIN CASE GROUP 2 HIGH TEMP/HIGH PRESSURE/MID GASB-2 2,288,000 T = 550 29,000 T 334 29,900
2-stage ejector P = 1124 P 113
B2.1 2,288,000 T = 550 29,000 T 334 29,9003-stage turbo P = 1124 P 113
B2.2 2,287,000 T = 550 29,000 T 334 29,900reboiler P = 1124 P 113
B2.3 2,288,000 T = 550 29,000 T 334 29,900biphase P = 1124 P 113eductor
B2.4 2,288,000 T = 550 29,000 T 334 29,900hybrid P = 1124 P 113
MAIN CASE GROUP 3 HIGH TEMP/HIGH PRESSURE/LOW GASB-3 2,284,000 T = 550 9,600 T 335 10,000
2-stage ejector P = 1072 P 111
B3.1 2,284,000 T = 550 9,600 T 335 10,0003-stage turbo P = 1072 P 111
B3.2 2,284,000 T = 550 9,600 T 335 10,000reboiler P = 1072 P 111
B3.3 2,284,000 T = 550 9,600 T 335 10,000biphase P = 1072 P 111eductor
B3.4 2,284,000 T = 550 9,600 T 335 10,000hybrid P = 1072 P 111

Sheet 4.2 EnFigMerit
AXG-9-29432-01document.xls Page 4.2.215 10:22:23
04/18/2023
OVERALL PLANT DEFINITION FLASHED STEAM AND GROSS POWER
ppmv
GROSS PLANT FEED
(combined well flow to flash)
STEAM TEMPERATURE, PRESSURE & GAS CONTENT
Case No.
Combined Brine & Steam Flow
T = oF
Combined Brine & Steam Gas Conc'n.
Flash Conditions
Gas Loading in Steam
lbs / hour (at 15% steam quality)
P = PSIA
parts per million by weight (ppmw) as CO2
oF, PSIA
MAIN CASE GROUP 4 LOW TEMP/LOW PRESSURE/LOW GASB-4 5,418,000 T = 350 6,500 T 235 10,000
2-stage ejector P = 137 P 23
B4.1 5,418,000 T = 350 6,500 T 235 10,0003-stage turbo P = 137 P 23
B4.2 5,418,000 T = 350 6,500 T 235 10,000reboiler P = 137 P 23
B4.3 5,418,000 T = 350 6,500 T 235 10,000biphase P = 137 P 23eductor
B4.4 5,418,000 T = 350 6,500 T 235 10,000hybrid P = 137 P 23
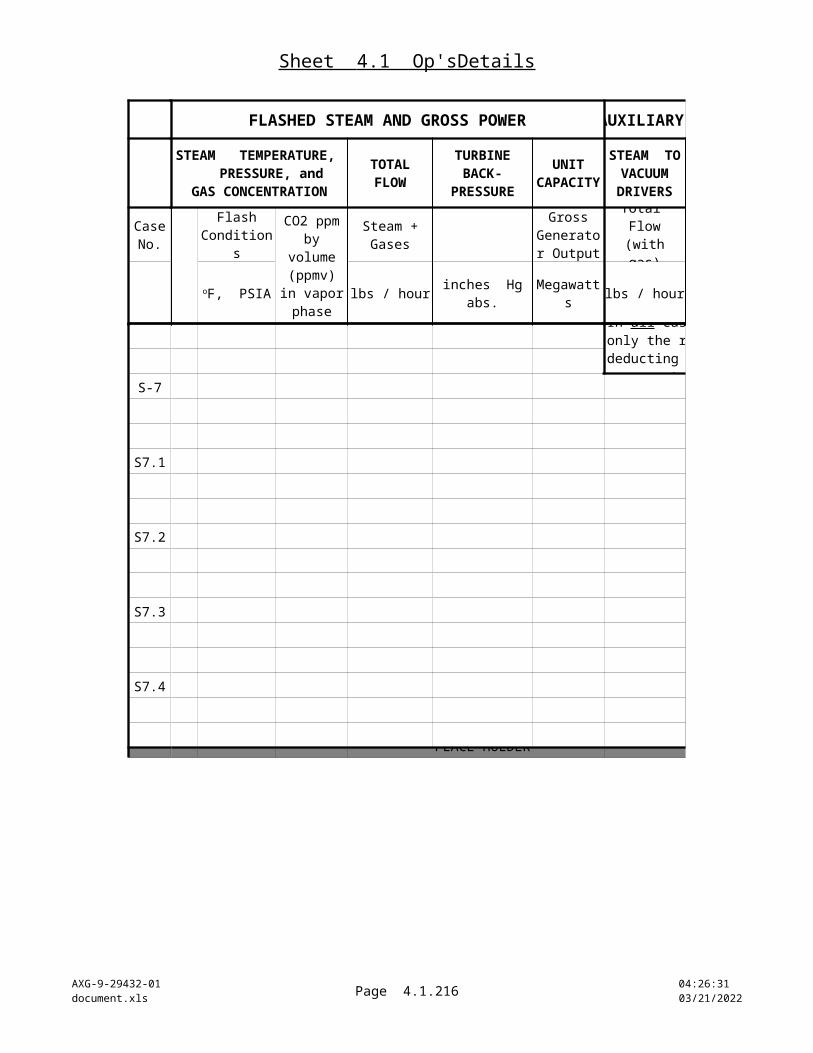
Sheet 4.2 EnFigMerit
AXG-9-29432-01document.xls Page 4.2.216 10:22:23
04/18/2023
OVERALL PLANT DEFINITION FLASHED STEAM AND GROSS POWER
ppmv
GROSS PLANT FEED
(combined well flow to flash)
STEAM TEMPERATURE, PRESSURE & GAS CONTENT
Case No.
Combined Brine & Steam Flow
T = oF
Combined Brine & Steam Gas Conc'n.
Flash Conditions
Gas Loading in Steam
lbs / hour (at 15% steam quality)
P = PSIA
parts per million by weight (ppmw) as CO2
oF, PSIA
PLACE HOLDER PLACE HOLDER PLACE HOLDER
MAIN CASE GROUP 5 LOW TEMP/LOW PRESSURE/MID GAS
B-5 5,395,000 T = 350 19,700 T 234 30,100
2-stage ejector P = 142 P 23
B5.1 5,395,000 T = 350 19,700 T 234 30,100
3-stage turbo P = 142 P 23
B5.2 5,391,000 T = 350 19,700 T 234 30,100
reboiler P = 142 P 23
B5.3 5,395,000 T = 350 19,700 T 234 30,100
biphase P = 142 P 23
eductor
B5.4 5,395,000 T = 350 19,700 T 234 30,100
hybrid P = 142 P 23
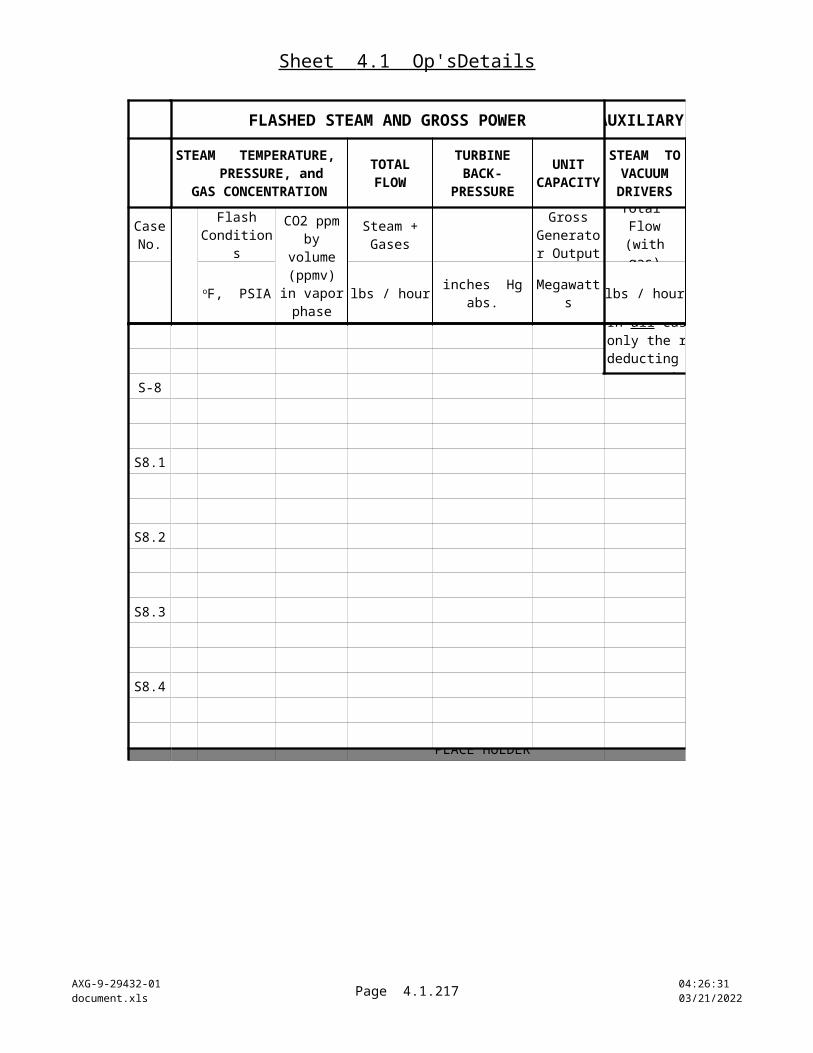
Sheet 4.2 EnFigMerit
AXG-9-29432-01document.xls Page 4.2.217 10:22:23
04/18/2023
OVERALL PLANT DEFINITION FLASHED STEAM AND GROSS POWER
ppmv
GROSS PLANT FEED
(combined well flow to flash)
STEAM TEMPERATURE, PRESSURE & GAS CONTENT
Case No.
Combined Brine & Steam Flow
T = oF
Combined Brine & Steam Gas Conc'n.
Flash Conditions
Gas Loading in Steam
lbs / hour (at 15% steam quality)
P = PSIA
parts per million by weight (ppmw) as CO2
oF, PSIA
PLACE HOLDER PLACE HOLDER PLACE HOLDER
MAIN CASE GROUP 6 LOW TEMP/LOW PRESSURE/HI GAS
B-6 5,365,000 T = 350 33,400 T 234 50,100
2-stage ejector P = 146 P 24
B6.1 5,365,000 T = 350 33,400 T 234 50,100
3-stage turbo P = 146 P 24
B6.2 5,354,000 T = 350 33,400 T 234 50,100
reboiler P = 146 P 24
B6.3 5,365,000 T = 350 33,400 T 234 50,100
biphase P = 146 P 24
eductor
B6.4 5,365,000 T = 350 33,400 T 234 50,100
hybrid P = 146 P 24
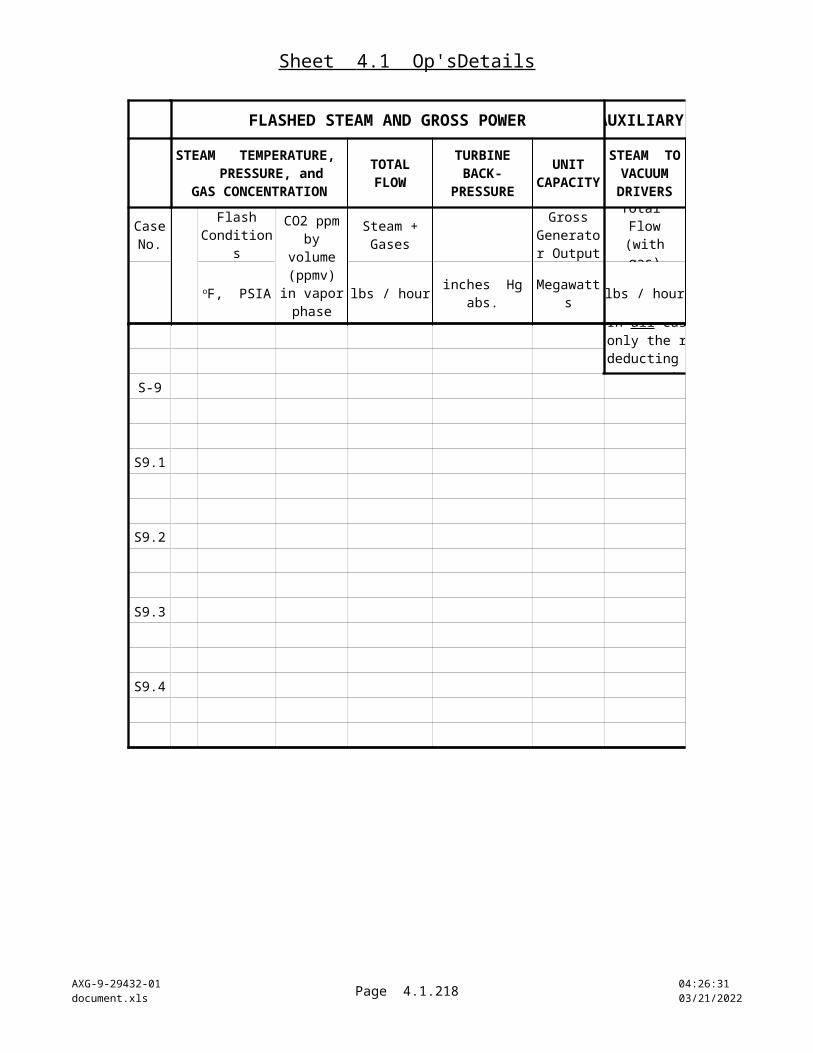
Sheet 4.2 EnFigMerit
AXG-9-29432-01document.xls Page 4.2.218 10:22:23
04/18/2023
OVERALL PLANT DEFINITION FLASHED STEAM AND GROSS POWER
ppmv
GROSS PLANT FEED
(combined well flow to flash)
STEAM TEMPERATURE, PRESSURE & GAS CONTENT
Case No.
Combined Brine & Steam Flow
T = oF
Combined Brine & Steam Gas Conc'n.
Flash Conditions
Gas Loading in Steam
lbs / hour (at 15% steam quality)
P = PSIA
parts per million by weight (ppmw) as CO2
oF, PSIA
PLACE HOLDER PLACE HOLDER PLACE HOLDER
MAIN CASE GROUP 7 LOW TEMP/LOW PRESSURE/VERY HIGH GAS
B-7 5,201,000 T = 350 108,500 T 232 149,200
2-stage ejector P = 170 P 25
B7.1 5,201,000 T = 350 108,500 T 232 149,200
3-stage turbo P = 170 P 25
B7.2 5,119,000 T = 350 108,500 T 232 149,200
reboiler P = 170 P 25
B7.3 5,201,000 T = 350 108,500 T 232 149,200
biphase P = 170 P 25
eductor
B7.4 5,201,000 T = 350 108,500 T 232 149,200
hybrid P = 170 P 25
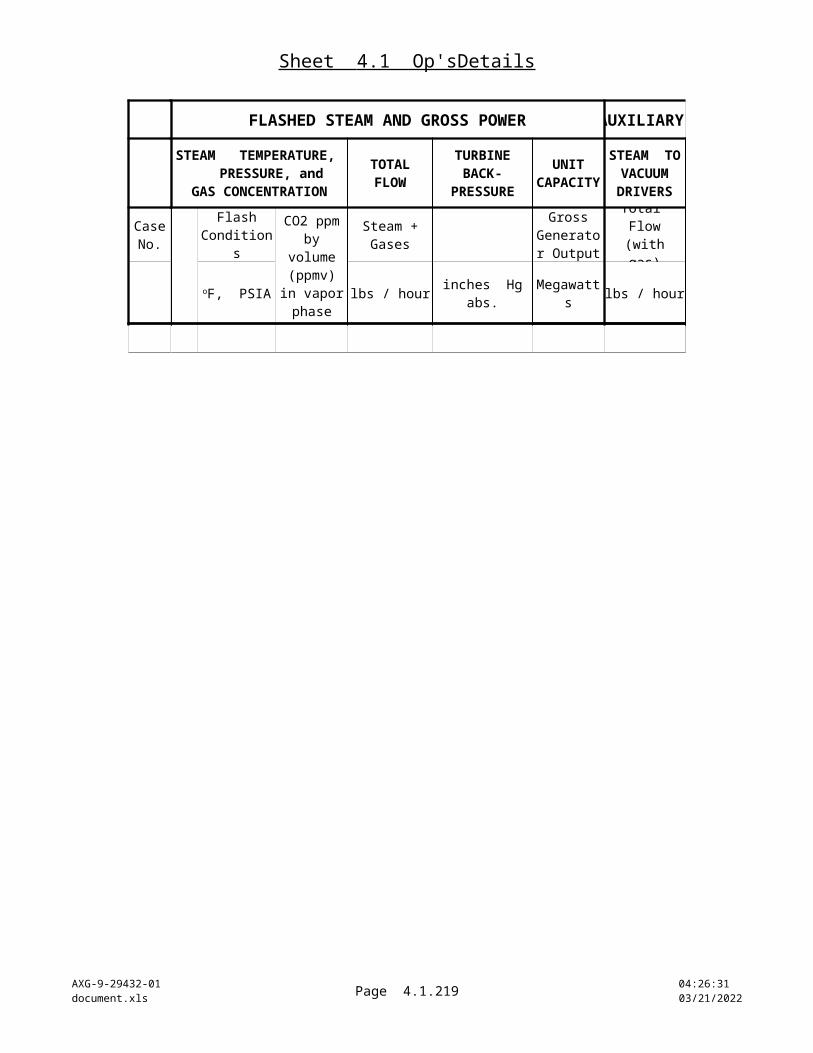
Sheet 4.2 EnFigMerit
AXG-9-29432-01document.xls Page 4.2.219 10:22:23
04/18/2023
OVERALL PLANT DEFINITION FLASHED STEAM AND GROSS POWER
ppmv
GROSS PLANT FEED
(combined well flow to flash)
STEAM TEMPERATURE, PRESSURE & GAS CONTENT
Case No.
Combined Brine & Steam Flow
T = oF
Combined Brine & Steam Gas Conc'n.
Flash Conditions
Gas Loading in Steam
lbs / hour (at 15% steam quality)
P = PSIA
parts per million by weight (ppmw) as CO2
oF, PSIA
PLACE HOLDER PLACE HOLDER PLACE HOLDER
MAIN CASE GROUP 8 HIGH TEMP/HIGH PRESSURE/VERY HIGH GAS
B-8 2,297,000 T = 550 99,700 T 333 99,600
2-stage ejector P = 1316 P 119
B8.1 2,297,000 T = 550 99,700 T 333 99,600
3-stage turbo P = 1316 P 119
B8.2 2,289,000 T = 550 99,700 T 333 99,600
reboiler P = 1316 P 119
B8.3 2,297,000 T = 550 99,700 T 333 99,600
biphase P = 1316 P 119
eductor
B8.4 2,297,000 T = 550 99,700 T 333 99,600
hybrid P = 1316 P 119
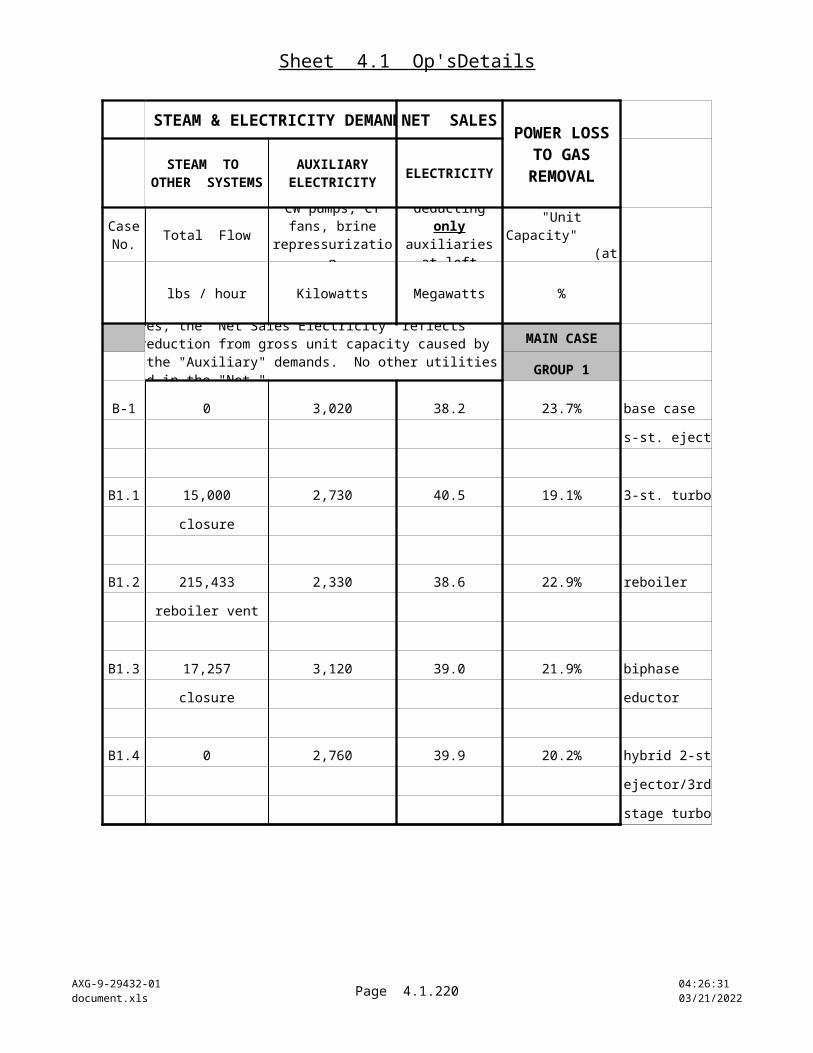
Sheet 4.2 EnFigMerit
AXG-9-29432-01document.xls Page 4.2.220 10:22:23
04/18/2023
OVERALL PLANT DEFINITION FLASHED STEAM AND GROSS POWER
ppmv
GROSS PLANT FEED
(combined well flow to flash)
STEAM TEMPERATURE, PRESSURE & GAS CONTENT
Case No.
Combined Brine & Steam Flow
T = oF
Combined Brine & Steam Gas Conc'n.
Flash Conditions
Gas Loading in Steam
lbs / hour (at 15% steam quality)
P = PSIA
parts per million by weight (ppmw) as CO2
oF, PSIA
PLACE HOLDER PLACE HOLDER PLACE HOLDER
LOW EJECTOR EFFICIENCY
SENSITIVITY CASE GROUP 1 -- HIGH TEMP / HIGH GAS
S-1 2,291,000 T = 550 48,800 T 334 49,900
2-stage ejector P = 1177 P 114
S1.1 2,291,000 T = 550 48,800 T 334 49,900
3-stage turbo P = 1177 P 114
S1.2 2,289,000 T = 550 48,800 T 334 49,900
reboiler P = 1177 P 114
S1.3 2,291,000 T = 550 48,800 T 334 49,900
biphase P = 1177 P 114
eductor
S1.4 2,291,000 T = 550 48,800 T 334 49,900
hybrid P = 1177 P 114
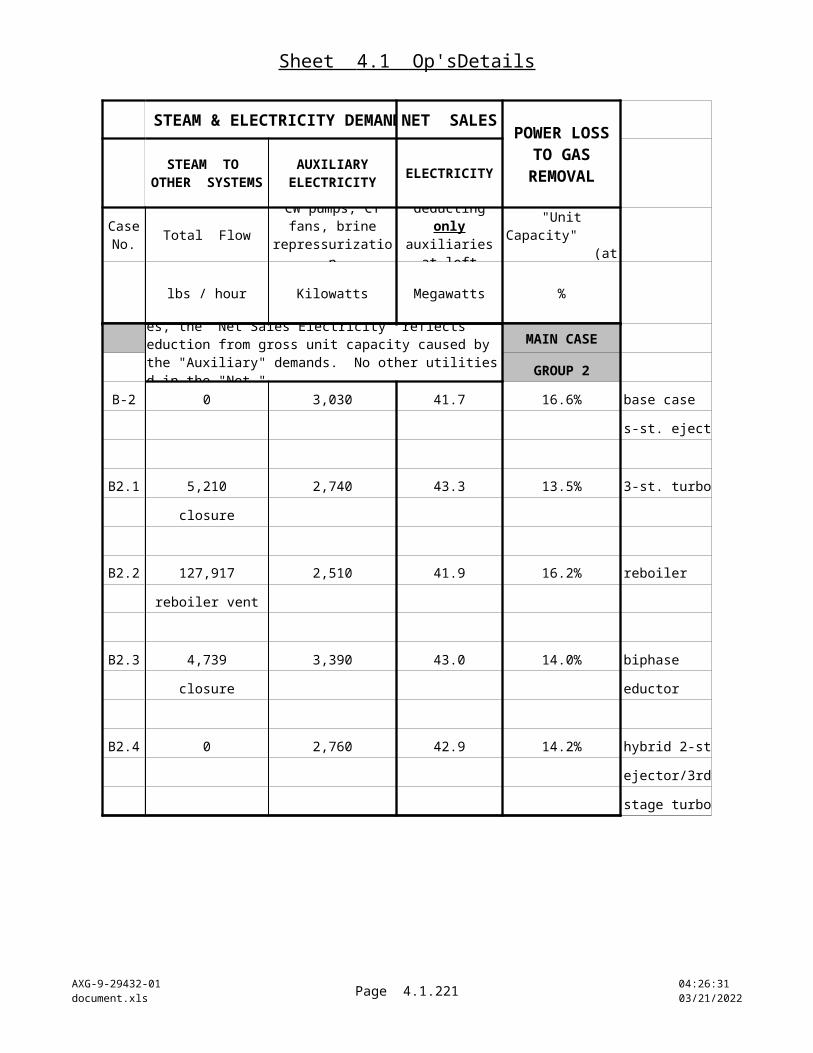
Sheet 4.2 EnFigMerit
AXG-9-29432-01document.xls Page 4.2.221 10:22:23
04/18/2023
OVERALL PLANT DEFINITION FLASHED STEAM AND GROSS POWER
ppmv
GROSS PLANT FEED
(combined well flow to flash)
STEAM TEMPERATURE, PRESSURE & GAS CONTENT
Case No.
Combined Brine & Steam Flow
T = oF
Combined Brine & Steam Gas Conc'n.
Flash Conditions
Gas Loading in Steam
lbs / hour (at 15% steam quality)
P = PSIA
parts per million by weight (ppmw) as CO2
oF, PSIA
PLACE HOLDER PLACE HOLDER PLACE HOLDER
LOW EJECTOR EFFICIENCY
SENSITIVITY CASE GROUP 2 -- LOW TEMP / LOW GAS
S-2 5,418,000 T = 350 6,500 T 235 10,100
2-stage ejector P = 137 P 23
S2.1 5,418,000 T = 350 6,500 T 235 10,100
3-stage turbo P = 137 P 23
S2.2 5,418,000 T = 350 6,500 T 235 10,100
reboiler P = 137 P 23
S2.3 5,418,000 T = 350 6,500 T 235 10,100
biphase P = 137 P 23
eductor
S2.4 5,418,000 T = 350 6,500 T 235 10,100
hybrid P = 137 P 23

Sheet 4.2 EnFigMerit
AXG-9-29432-01document.xls Page 4.2.222 10:22:23
04/18/2023
OVERALL PLANT DEFINITION FLASHED STEAM AND GROSS POWER
ppmv
GROSS PLANT FEED
(combined well flow to flash)
STEAM TEMPERATURE, PRESSURE & GAS CONTENT
Case No.
Combined Brine & Steam Flow
T = oF
Combined Brine & Steam Gas Conc'n.
Flash Conditions
Gas Loading in Steam
lbs / hour (at 15% steam quality)
P = PSIA
parts per million by weight (ppmw) as CO2
oF, PSIA
PLACE HOLDER PLACE HOLDER PLACE HOLDER
SENSITIVITY CASE GROUP 3 -- HIGH TEMP / MID GAS
S-3 2,505,000 T = 550 28,900 T 344 30,400
2-stage ejector P = 1124 P 128
S3.1 2,505,000 T = 550 28,900 T 344 30,400
3-stage turbo P = 1124 P 128
S3.2 2,505,000 T = 550 28,900 T 344 30,400
reboiler P = 1124 P 128
S3.3 2,505,000 T = 550 28,900 T 344 30,400
biphase P = 1124 P 128
eductor
S3.4 2,505,000 T = 550 28,900 T 344 30,400
hybrid P = 1124 P 128
WET BULB TEMPERATURE 80 oF

Sheet 4.2 EnFigMerit
AXG-9-29432-01document.xls Page 4.2.223 10:22:23
04/18/2023
OVERALL PLANT DEFINITION FLASHED STEAM AND GROSS POWER
ppmv
GROSS PLANT FEED
(combined well flow to flash)
STEAM TEMPERATURE, PRESSURE & GAS CONTENT
Case No.
Combined Brine & Steam Flow
T = oF
Combined Brine & Steam Gas Conc'n.
Flash Conditions
Gas Loading in Steam
lbs / hour (at 15% steam quality)
P = PSIA
parts per million by weight (ppmw) as CO2
oF, PSIA
PLACE HOLDER PLACE HOLDER PLACE HOLDER
SENSITIVITY CASE GROUP 4 -- LOW TEMP / LOW GAS
S-4 6,251,000 T = 350 6,400 T 244 10,100
2-stage ejector P = 137 P 27
S4.1 6,251,000 T = 350 6,400 T 244 10,100
3-stage turbo P = 137 P 27
S4.2 6,250,000 T = 350 6,400 T 244 10,100
reboiler P = 137 P 27
S4.3 6,251,000 T = 350 6,400 T 244 10,100
biphase P = 137 P 27
eductor
S4.4 6,251,000 T = 350 6,400 T 244 10,100
hybrid P = 137 P 27
WET BULB TEMPERATURE 80 oF
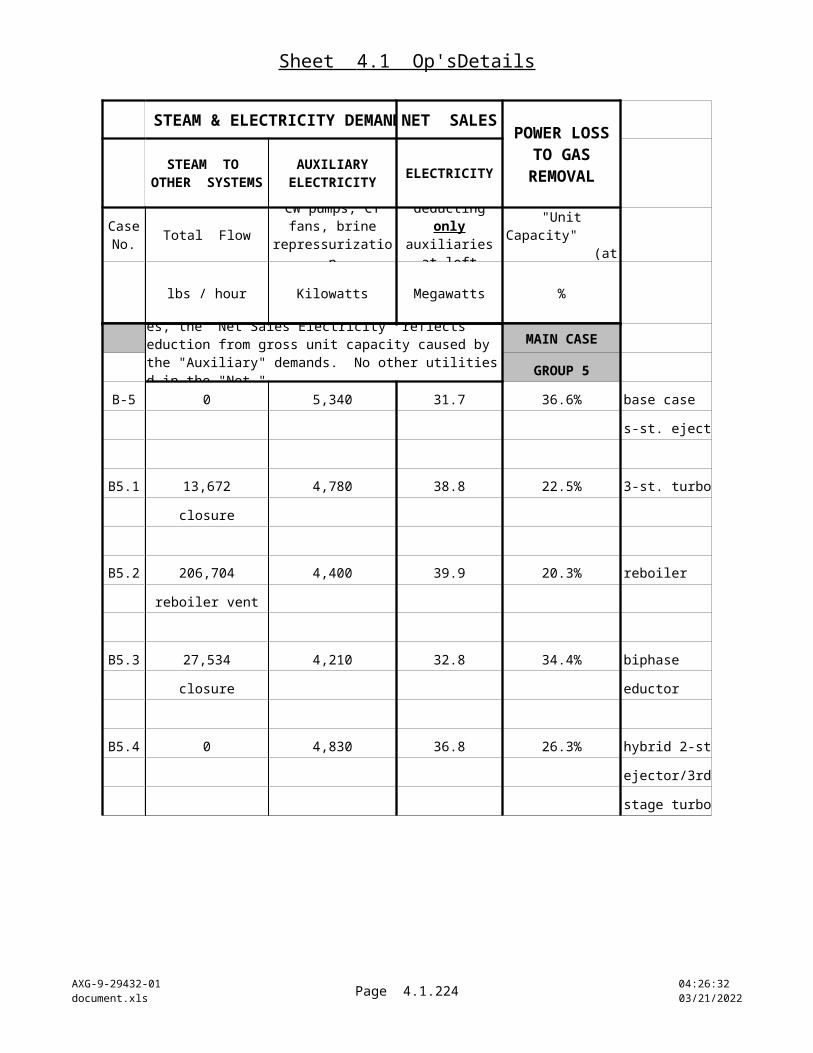
Sheet 4.2 EnFigMerit
AXG-9-29432-01document.xls Page 4.2.224 10:22:23
04/18/2023
ENGINEERING FIGURES OF MERIT
OVERALL PLANT DEFINITION
MAIN CASE GROUP 1B-1
B1.1
B1.2
B1.3
B1.4
Case No.
Define a technical "figure of merit" as a ratio of net power plant productivities, comparing the respective productivity value for each alternative plant configuration to the productivity of their common "Base Case." The common bases include overall process conditions and design assumptions outlined in worksheets 2.1, 2.2, and 4.1. Define productivity as the balance of plant
generating capacity (as megawatts) remaining after deducting power losses consumed specifically by the noncondensable gas removal system and that system's dedicated share of the cooling system power demand; for the biphase eductor option, also include the power needed to repressurize flashed brine for transfer out of the system. Express this productivity as "Net Sales"
megawatts or as percent of gross plant capacity -- i.e. the "residual plant capacity." This assumes any other in-plant utility power demands are essentially constant, and are therefore considered separately from gas removal power demands.
The value of the figure of merit for the Base Case design is 1.00 by this definition. Figure of merit values greater than 1 show that an alternative technology outperforms the Base Case in proportion to the value. Figure-of-merit values less than 1 indicate the Base Case performs better than the alternative.
ENGINEERING FIGURES OF MERIT
FLASHED STEAM AND GROSS POWER NET SALES
ELECTRICITY ( A ) ( B ) ( C )
B = 1 - ( A )
lbs / hour Megawatts Megawatts % %
MAIN GROUP 1968,000 50.0 38.2 23.7% 76.3% 1.00
968,000 50.0 40.5 19.1% 80.9% 1.06
968,000 50.0 38.6 22.9% 77.1% 1.01750,000 = clean steam turbine feed
968,000 50.0 39.0 21.9% 78.1% 1.02
968,000 50.0 39.9 20.2% 79.8% 1.05
POWER LOSS TO GAS
REMOVAL
RESIDUAL PLANT
CAPACITY
TECHNICAL FIGURE OF MERIT
TOTAL FLOW
UNIT CAPACITY
Steam + Gases
Gross Generator
Output
Percent of Gross "Unit Capacity" ratio of alternate case
resid. capacity to "base case" resid.
capacity
Define a technical "figure of merit" as a ratio of net power plant productivities, comparing the respective productivity value for each alternative plant configuration to the productivity of their common "Base Case." The common bases include overall process conditions and design assumptions outlined in worksheets 2.1, 2.2, and 4.1. Define productivity as the balance of plant
generating capacity (as megawatts) remaining after deducting power losses consumed specifically by the noncondensable gas removal system and that system's dedicated share of the cooling system power demand; for the biphase eductor option, also include the power needed to repressurize flashed brine for transfer out of the system. Express this productivity as "Net Sales"
megawatts or as percent of gross plant capacity -- i.e. the "residual plant capacity." This assumes any other in-plant utility power demands are essentially constant, and are therefore considered separately from gas removal power demands.
The value of the figure of merit for the Base Case design is 1.00 by this definition. Figure of merit values greater than 1 show that an alternative technology outperforms the Base Case in proportion to the value. Figure-of-merit values less than 1 indicate the Base Case performs better than the alternative.
RETURN
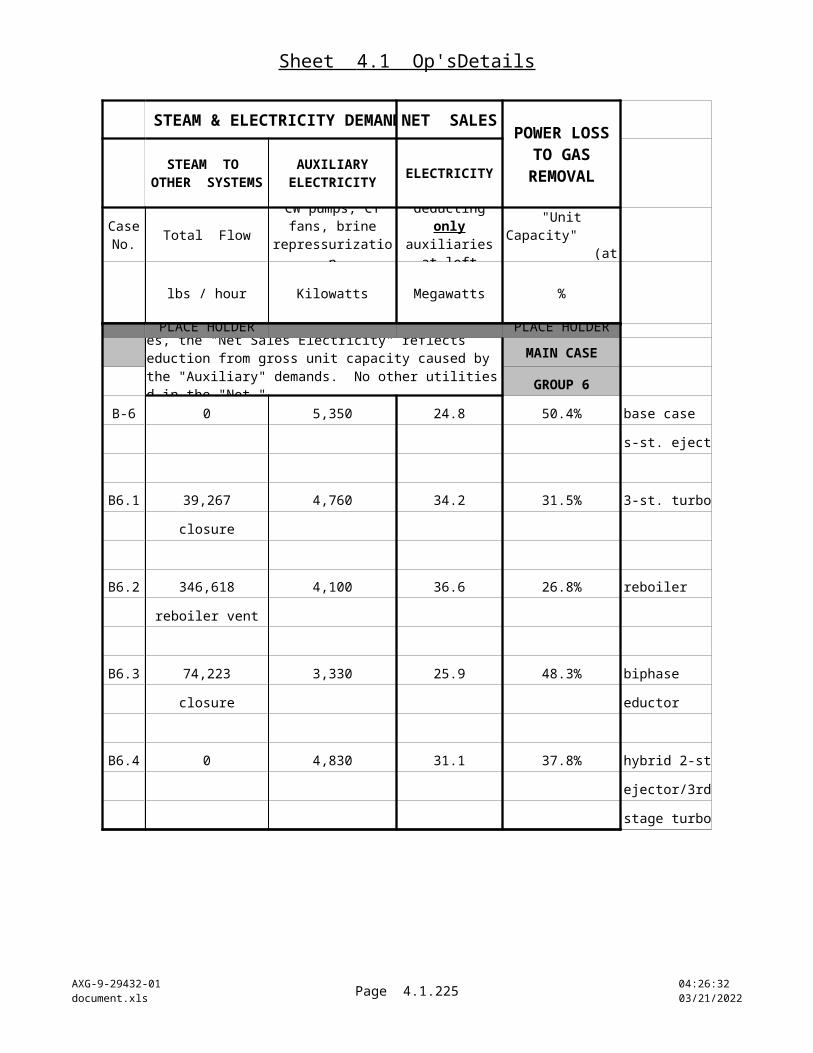
Sheet 4.2 EnFigMerit
AXG-9-29432-01document.xls Page 4.2.225 10:22:23
04/18/2023
OVERALL PLANT DEFINITION
Case No.
MAIN CASE GROUP 2B-2
B2.1
B2.2
B2.3
B2.4
MAIN CASE GROUP 3B-3
B3.1
B3.2
B3.3
B3.4
FLASHED STEAM AND GROSS POWER NET SALES
ELECTRICITY ( A ) ( B ) ( C )
B = 1 - ( A )
lbs / hour Megawatts Megawatts % %
POWER LOSS TO GAS
REMOVAL
RESIDUAL PLANT
CAPACITY
TECHNICAL FIGURE OF MERIT
TOTAL FLOW
UNIT CAPACITY
Steam + Gases
Gross Generator
Output
Percent of Gross "Unit Capacity" ratio of alternate case
resid. capacity to "base case" resid.
capacity
RETURN
MAIN GROUP 2932,000 50.0 41.7 16.6% 83.4% 1.00
932,000 50.0 43.3 13.5% 86.5% 1.04
932,000 50.0 41.9 16.2% 83.8% 1.01803,000 = clean steam turbine feed
932,000 50.0 43.0 14.0% 86.0% 1.03
932,000 50.0 42.9 14.2% 85.8% 1.03
MAIN GROUP 3896,000 50.0 45.4 9.2% 90.8% 1.00
896,000 50.0 46.0 7.9% 92.1% 1.01
896,000 50.0 45.4 9.2% 90.8% 1.00853,000 = clean steam turbine feed
896,000 50.0 46.5 7.0% 93.0% 1.02
896,000 50.0 45.9 8.1% 91.9% 1.01
RETURN
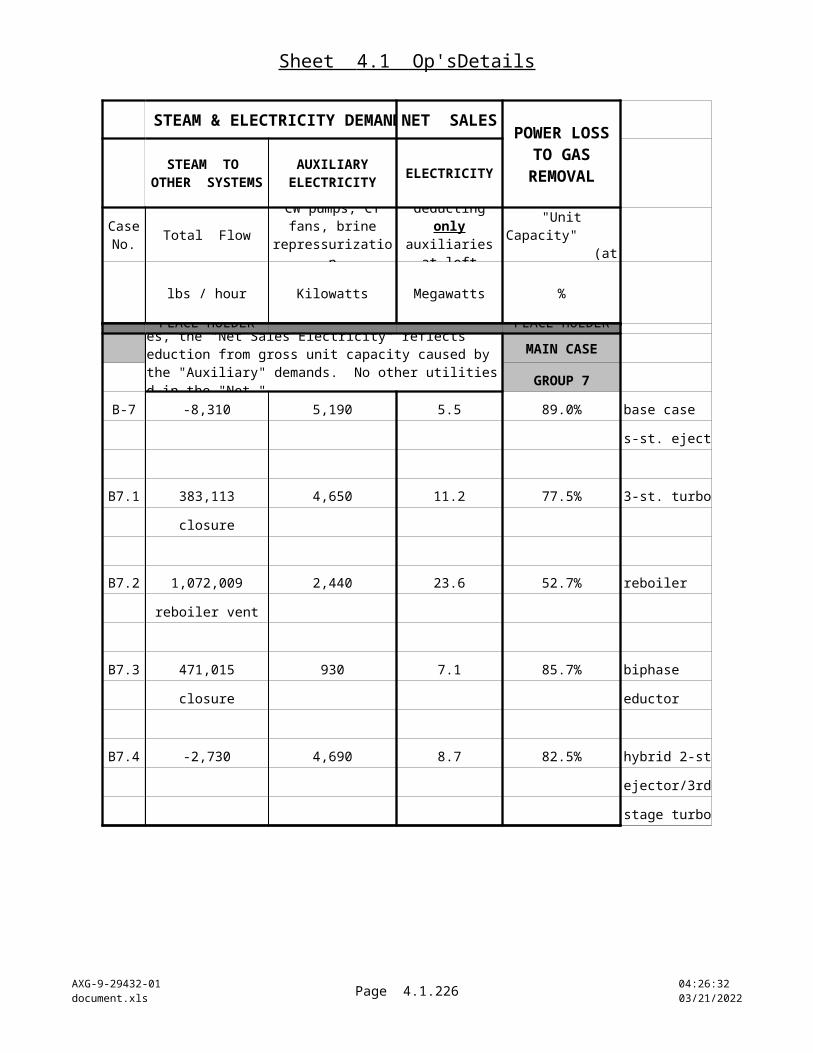
Sheet 4.2 EnFigMerit
AXG-9-29432-01document.xls Page 4.2.226 10:22:24
04/18/2023
OVERALL PLANT DEFINITION
Case No.
MAIN CASE GROUP 4B-4
B4.1
B4.2
B4.3
B4.4
FLASHED STEAM AND GROSS POWER NET SALES
ELECTRICITY ( A ) ( B ) ( C )
B = 1 - ( A )
lbs / hour Megawatts Megawatts % %
POWER LOSS TO GAS
REMOVAL
RESIDUAL PLANT
CAPACITY
TECHNICAL FIGURE OF MERIT
TOTAL FLOW
UNIT CAPACITY
Steam + Gases
Gross Generator
Output
Percent of Gross "Unit Capacity" ratio of alternate case
resid. capacity to "base case" resid.
capacity
RETURN
MAIN GROUP 41,446,000 50.0 40.6 18.8% 81.2% 1.00
1,446,000 50.0 43.2 13.5% 86.5% 1.07
1,446,000 50.0 43.3 13.3% 86.7% 1.071,375,000 = clean steam turbine feed
1,446,000 50.0 41.3 17.4% 82.6% 1.02
1,446,000 50.0 42.7 14.6% 85.4% 1.05
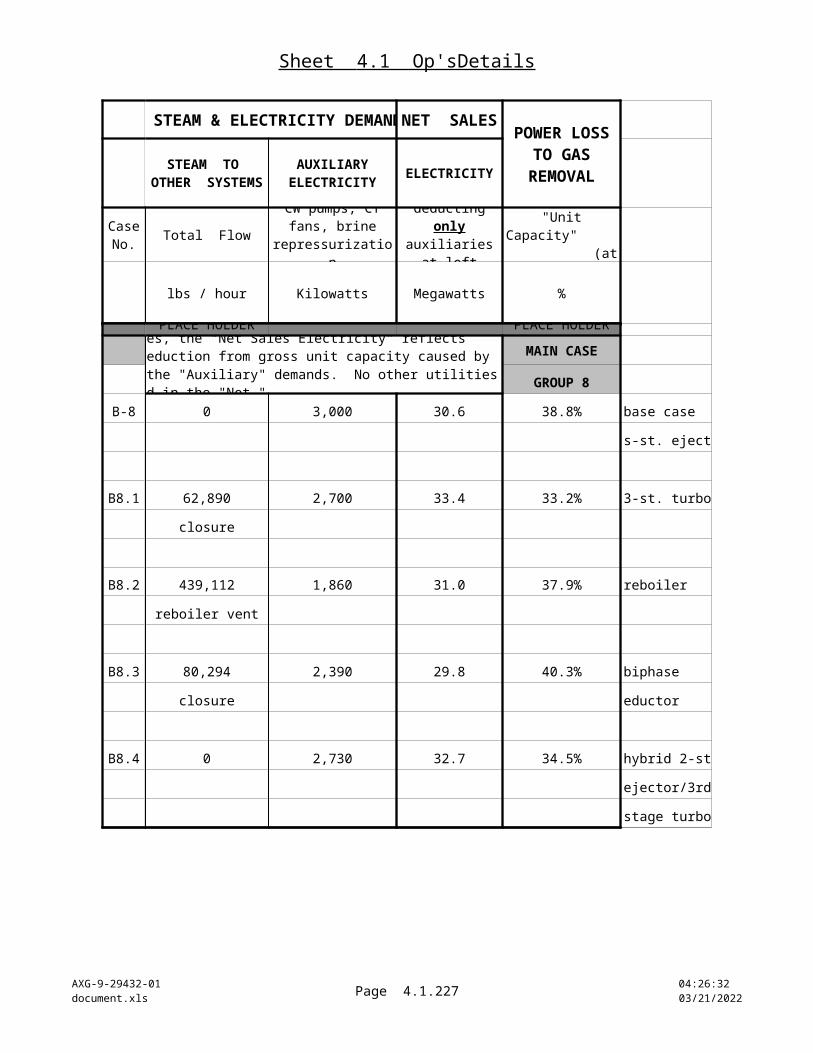
Sheet 4.2 EnFigMerit
AXG-9-29432-01document.xls Page 4.2.227 10:22:24
04/18/2023
OVERALL PLANT DEFINITION
Case No.
MAIN CASE GROUP 5
B-5
B5.1
B5.2
B5.3
B5.4
FLASHED STEAM AND GROSS POWER NET SALES
ELECTRICITY ( A ) ( B ) ( C )
B = 1 - ( A )
lbs / hour Megawatts Megawatts % %
POWER LOSS TO GAS
REMOVAL
RESIDUAL PLANT
CAPACITY
TECHNICAL FIGURE OF MERIT
TOTAL FLOW
UNIT CAPACITY
Steam + Gases
Gross Generator
Output
Percent of Gross "Unit Capacity" ratio of alternate case
resid. capacity to "base case" resid.
capacity
RETURN
PLACE HOLDER PLACE HOLDER PLACE HOLDER
MAIN GROUP 5
1,505,000 50.0 31.7 36.6% 63.4% 1.00
1,505,000 50.0 38.8 22.5% 77.5% 1.22
1,505,000 50.0 39.9 20.3% 79.7% 1.26
1,291,000 = clean steam turbine feed
1,505,000 50.0 32.8 34.4% 65.6% 1.03
1,505,000 50.0 36.8 26.3% 73.7% 1.16
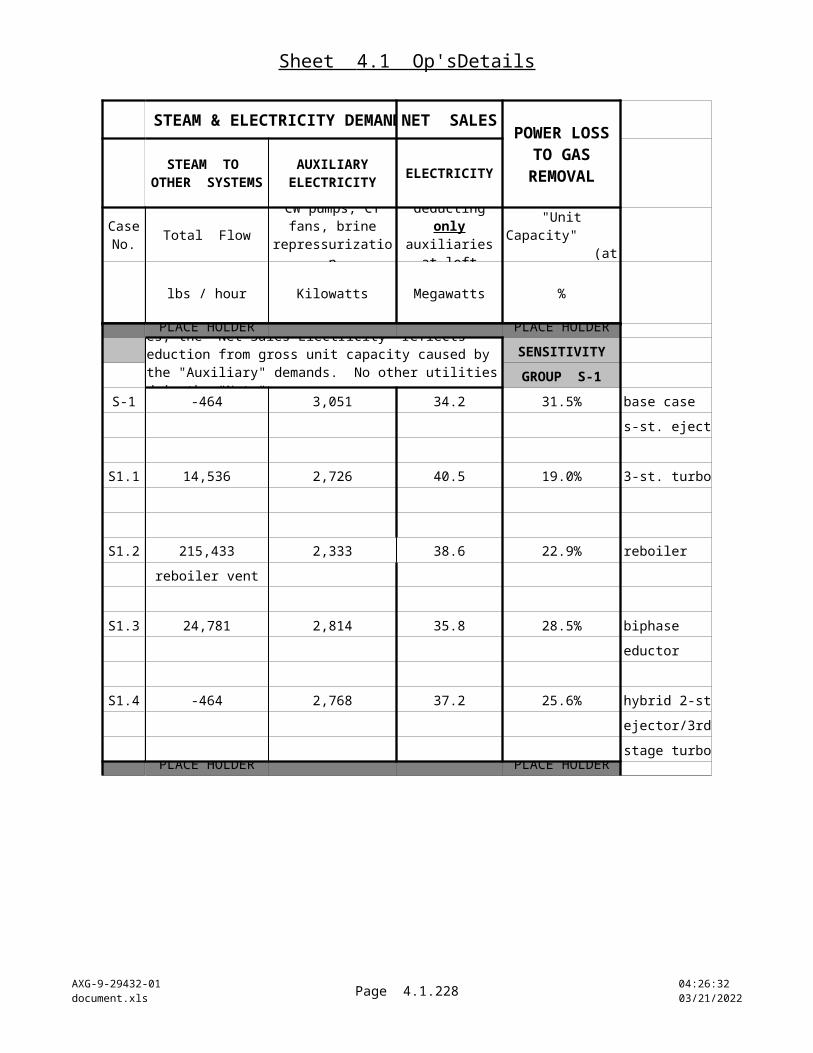
Sheet 4.2 EnFigMerit
AXG-9-29432-01document.xls Page 4.2.228 10:22:24
04/18/2023
OVERALL PLANT DEFINITION
Case No.
MAIN CASE GROUP 6
B-6
B6.1
B6.2
B6.3
B6.4
FLASHED STEAM AND GROSS POWER NET SALES
ELECTRICITY ( A ) ( B ) ( C )
B = 1 - ( A )
lbs / hour Megawatts Megawatts % %
POWER LOSS TO GAS
REMOVAL
RESIDUAL PLANT
CAPACITY
TECHNICAL FIGURE OF MERIT
TOTAL FLOW
UNIT CAPACITY
Steam + Gases
Gross Generator
Output
Percent of Gross "Unit Capacity" ratio of alternate case
resid. capacity to "base case" resid.
capacity
RETURN
PLACE HOLDER PLACE HOLDER PLACE HOLDER
MAIN GROUP 6
1,563,000 50.0 24.8 50.4% 49.6% 1.00
1,563,000 50.0 34.2 31.5% 68.5% 1.38
1,563,000 50.0 36.6 26.8% 73.2% 1.48
1,203,000 = clean steam turbine feed
1,563,000 50.0 25.9 48.3% 51.7% 1.04
1,563,000 50.0 31.1 37.8% 62.2% 1.25
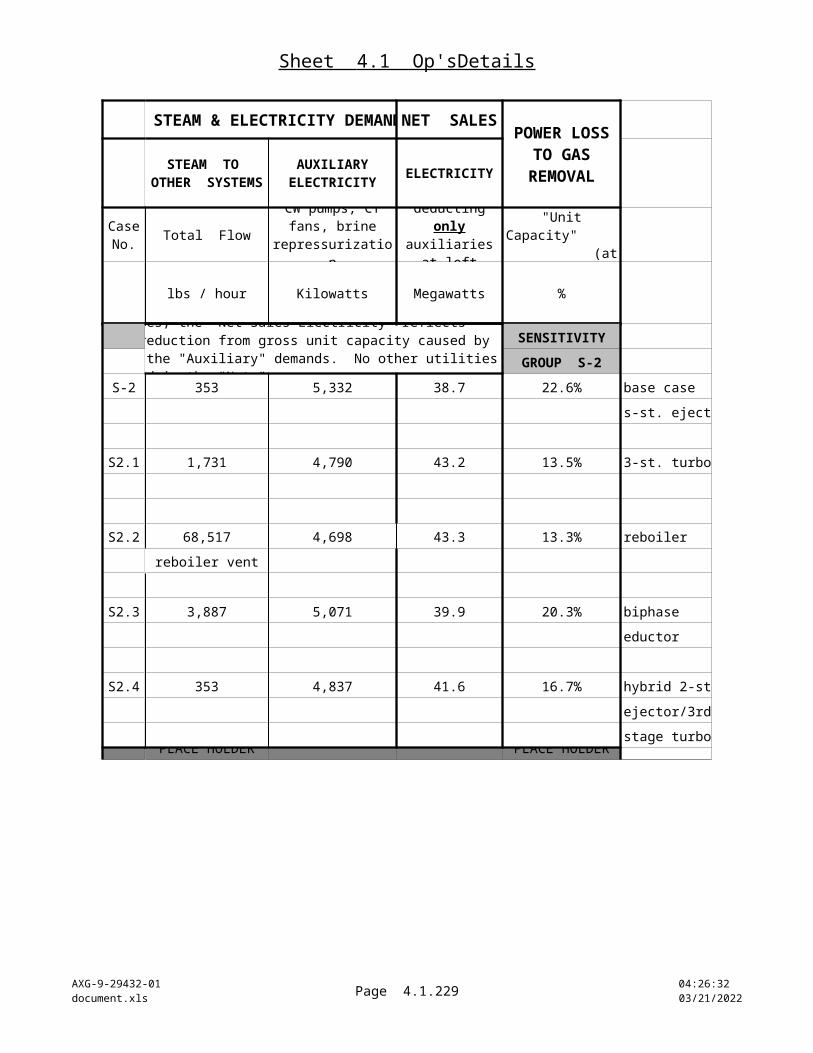
Sheet 4.2 EnFigMerit
AXG-9-29432-01document.xls Page 4.2.229 10:22:24
04/18/2023
OVERALL PLANT DEFINITION
Case No.
MAIN CASE GROUP 7
B-7
B7.1
B7.2
B7.3
B7.4
FLASHED STEAM AND GROSS POWER NET SALES
ELECTRICITY ( A ) ( B ) ( C )
B = 1 - ( A )
lbs / hour Megawatts Megawatts % %
POWER LOSS TO GAS
REMOVAL
RESIDUAL PLANT
CAPACITY
TECHNICAL FIGURE OF MERIT
TOTAL FLOW
UNIT CAPACITY
Steam + Gases
Gross Generator
Output
Percent of Gross "Unit Capacity" ratio of alternate case
resid. capacity to "base case" resid.
capacity
RETURN
PLACE HOLDER PLACE HOLDER PLACE HOLDER
MAIN GROUP 7
1,873,000 49.9 5.5 89.0% 11.0% 1.00
1,873,000 49.9 11.2 77.5% 22.5% 2.04
1,873,000 49.9 23.6 52.7% 47.3% 4.28
751,000 = clean steam turbine feed
1,873,000 49.9 7.1 85.7% 14.3% 1.29
1,873,000 49.9 8.7 82.5% 17.5% 1.59
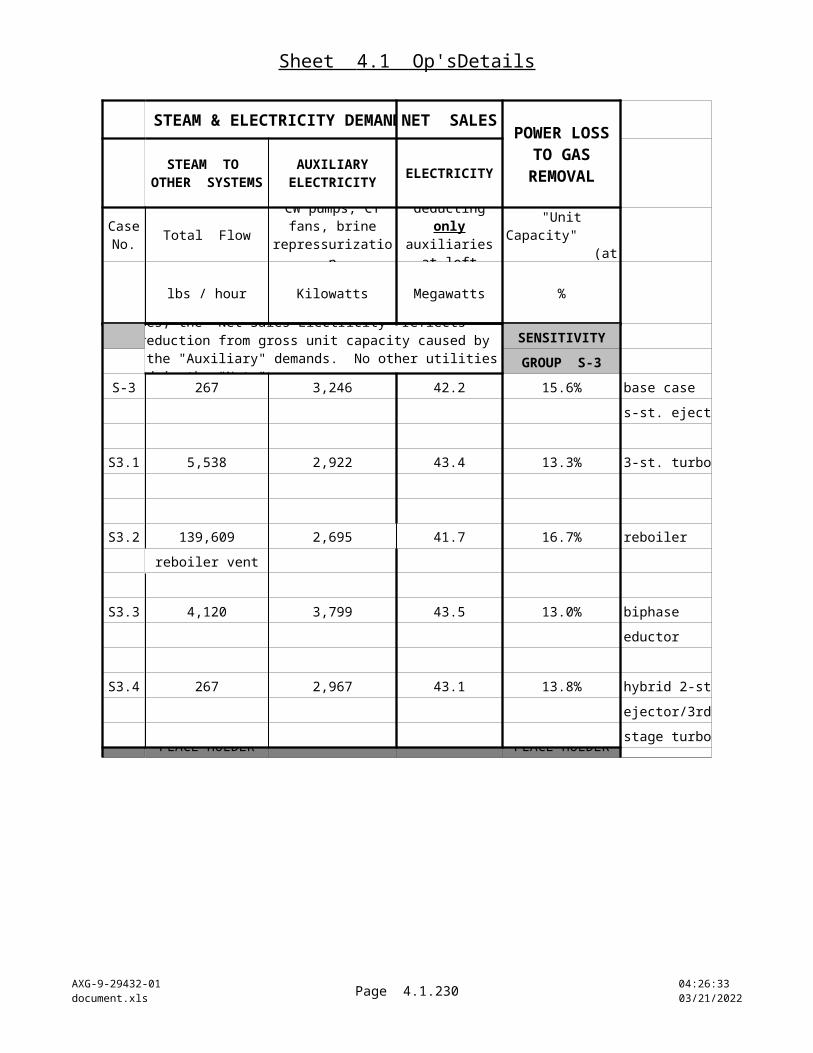
Sheet 4.2 EnFigMerit
AXG-9-29432-01document.xls Page 4.2.230 10:22:24
04/18/2023
OVERALL PLANT DEFINITION
Case No.
MAIN CASE GROUP 8
B-8
B8.1
B8.2
B8.3
B8.4
FLASHED STEAM AND GROSS POWER NET SALES
ELECTRICITY ( A ) ( B ) ( C )
B = 1 - ( A )
lbs / hour Megawatts Megawatts % %
POWER LOSS TO GAS
REMOVAL
RESIDUAL PLANT
CAPACITY
TECHNICAL FIGURE OF MERIT
TOTAL FLOW
UNIT CAPACITY
Steam + Gases
Gross Generator
Output
Percent of Gross "Unit Capacity" ratio of alternate case
resid. capacity to "base case" resid.
capacity
RETURN
PLACE HOLDER PLACE HOLDER PLACE HOLDER
MAIN GROUP 8
1,062,000 50.0 30.6 38.8% 61.2% 1.00
1,062,000 50.0 33.4 33.2% 66.8% 1.09
1,062,000 50.0 31.0 37.9% 62.1% 1.01
614,000 = clean steam turbine feed
1,062,000 50.0 29.8 40.3% 59.7% 0.98
1,062,000 50.0 32.7 34.5% 65.5% 1.07

Sheet 4.2 EnFigMerit
AXG-9-29432-01document.xls Page 4.2.231 10:22:24
04/18/2023
OVERALL PLANT DEFINITION
Case No.
S-1
S1.1
S1.2
S1.3
S1.4
FLASHED STEAM AND GROSS POWER NET SALES
ELECTRICITY ( A ) ( B ) ( C )
B = 1 - ( A )
lbs / hour Megawatts Megawatts % %
POWER LOSS TO GAS
REMOVAL
RESIDUAL PLANT
CAPACITY
TECHNICAL FIGURE OF MERIT
TOTAL FLOW
UNIT CAPACITY
Steam + Gases
Gross Generator
Output
Percent of Gross "Unit Capacity" ratio of alternate case
resid. capacity to "base case" resid.
capacity
RETURN
PLACE HOLDER PLACE HOLDER PLACE HOLDER
LOW EJECTOR EFFICIENCY
SENGROUP 1
968,000 50.0 34.2 31.5% 68.5% 1.00
968,000 50.0 40.5 19.0% 81.0% 1.18
968,000 50.0 38.6 22.9% 77.1% 1.13
750,000 = clean steam turbine feed
968,000 50.0 35.8 28.5% 71.5% 1.04
968,000 50.0 37.2 25.6% 74.4% 1.09

Sheet 4.2 EnFigMerit
AXG-9-29432-01document.xls Page 4.2.232 10:22:24
04/18/2023
OVERALL PLANT DEFINITION
Case No.
S-2
S2.1
S2.2
S2.3
S2.4
FLASHED STEAM AND GROSS POWER NET SALES
ELECTRICITY ( A ) ( B ) ( C )
B = 1 - ( A )
lbs / hour Megawatts Megawatts % %
POWER LOSS TO GAS
REMOVAL
RESIDUAL PLANT
CAPACITY
TECHNICAL FIGURE OF MERIT
TOTAL FLOW
UNIT CAPACITY
Steam + Gases
Gross Generator
Output
Percent of Gross "Unit Capacity" ratio of alternate case
resid. capacity to "base case" resid.
capacity
RETURN
PLACE HOLDER PLACE HOLDER PLACE HOLDER
LOW EJECTOR EFFICIENCY
SENGROUP 2
1,446,000 50.0 38.7 22.6% 77.4% 1.00
1,446,000 50.0 43.2 13.5% 86.5% 1.12
1,446,000 50.0 43.3 13.3% 86.7% 1.12
1,375,000 = clean steam turbine feed
1,446,000 50.0 39.9 20.3% 79.7% 1.03
1,446,000 50.0 41.6 16.7% 83.3% 1.08
Sheet 4.2 EnFigMerit
AXG-9-29432-01document.xls Page 4.2.233 10:22:24
04/18/2023
OVERALL PLANT DEFINITION
Case No.
S-3
S3.1
S3.2
S3.3
S3.4
FLASHED STEAM AND GROSS POWER NET SALES
ELECTRICITY ( A ) ( B ) ( C )
B = 1 - ( A )
lbs / hour Megawatts Megawatts % %
POWER LOSS TO GAS
REMOVAL
RESIDUAL PLANT
CAPACITY
TECHNICAL FIGURE OF MERIT
TOTAL FLOW
UNIT CAPACITY
Steam + Gases
Gross Generator
Output
Percent of Gross "Unit Capacity" ratio of alternate case
resid. capacity to "base case" resid.
capacity
RETURN
PLACE HOLDER PLACE HOLDER PLACE HOLDER
SENGROUP 3
1,001,000 50.0 42.2 15.6% 84.4% 1.00
1,001,000 50.0 43.4 13.3% 86.7% 1.03
1,001,000 50.0 41.7 16.7% 83.3% 0.99
860,000 = clean steam turbine feed
1,001,000 50.0 43.5 13.0% 87.0% 1.03
1,001,000 50.0 43.1 13.8% 86.2% 1.02
WET BULB TEMPERATURE 80 oF

Sheet 4.2 EnFigMerit
AXG-9-29432-01document.xls Page 4.2.234 10:22:24
04/18/2023
OVERALL PLANT DEFINITION
Case No.
S-4
S4.1
S4.2
S4.3
S4.4
FLASHED STEAM AND GROSS POWER NET SALES
ELECTRICITY ( A ) ( B ) ( C )
B = 1 - ( A )
lbs / hour Megawatts Megawatts % %
POWER LOSS TO GAS
REMOVAL
RESIDUAL PLANT
CAPACITY
TECHNICAL FIGURE OF MERIT
TOTAL FLOW
UNIT CAPACITY
Steam + Gases
Gross Generator
Output
Percent of Gross "Unit Capacity" ratio of alternate case
resid. capacity to "base case" resid.
capacity
RETURN
PLACE HOLDER PLACE HOLDER PLACE HOLDER
SENGROUP 4
1,615,000 50.0 41.0 18.0% 82.0% 1.00
1,615,000 50.0 42.8 14.4% 85.6% 1.04
1,615,000 50.0 42.8 14.4% 85.6% 1.04
1,536,000 = clean steam turbine feed
1,615,000 50.0 41.5 16.9% 83.1% 1.01
1,615,000 50.0 42.4 15.1% 84.9% 1.04
WET BULB TEMPERATURE 80 oF
Sheet 4.3 $ FigMerit
AXG-9-29432-01document.xls Page 4.3.235 10:22:24
04/18/2023
ECONOMIC FIGURE OF MERIT
OVERALL PLANT DEFINITION FLASHED STEAM AND GROSS POWER
TOTAL FLOW
Configuration
P = PSIA ppmv lbs / hour
60
MAIN CASE GROUP 1
HIGH TEMPERATURE/PRESSURE AND HIGH GAS CONTENTB-1 BASE CASE 2,291,000 T = 550 48,800 T 334 49,900 968,000
2-stage ejectors P = 1177 P 114
B1.1 ALTERNATIVE A 2,291,000 T = 550 48,800 T 334 49,900 968,000 3-stage turbo- P = 1177 P 114compressor
B1.2 ALTERNATIVE B 2,289,000 T = 550 48,800 T 334 49,900 968,000 reboiler P = 1177 P 114 750,000
B1.3 ALTERNATIVE C 2,291,000 T = 550 48,800 T 334 49,900 968,000 biphase eductor P = 1177 P 114
B1.4 ALTERNATIVE D 2,291,000 T = 550 48,800 T 334 49,900 968,000 hybrid turbo- P = 1177 P 114compressor
MAIN CASE GROUP 2
HIGH TEMPERATURE/PRESSURE AND MID GAS CONTENTB-2 BASE CASE 2,288,000 T 550 29,000 T 334 29,900 932,000
2-stage ejectors P 1,124 P 113
B2.1 ALTERNATIVE A 2,288,000 T 550 29,000 T 334 29,900 932,000 3-stage turbo- P 1,124 P 113
GROSS PLANT FEED (combined well flows entering flash to produce steam for a 50 MW turbine/generator)
STEAM PRESSURE AND TEMPERATURE
Case No.
Combined Brine &
Steam FlowT = oF
Combined Brine &
Steam Gas Conc'n.
Flash Conditio
ns
Gas Content
Steam + Gases
lbs / hour (at 15% steam quality)
parts per million by
weight (ppmw) as
CO2
oF, PSIA
Define an economic "figure of merit" that allocates dollars as credit for savings in parasitic power losses. Evaluate the credits by calculating the equivalent electrical generating output of the steam and electricity used to run the noncondensable gas removal systems. Assign the "found" generating power a unit value (see worksheet tab 2.2 -- "Bases&Input").
Then calculate the figure of merit value as the payback period for the cost of investing in conversion to an alternative gas removal system: Divide the investment cost by the "found power" revenue value ($ per year), yielding a value of years to recover the alternate technology investment costs. The shorter the payback period, the better the option is as a recoverable cost.
Sheet 4.3 $ FigMerit
AXG-9-29432-01document.xls Page 4.3.236 10:22:24
04/18/2023
OVERALL PLANT DEFINITION FLASHED STEAM AND GROSS POWER
TOTAL FLOW
Configuration
P = PSIA ppmv lbs / hour
GROSS PLANT FEED (combined well flows entering flash to produce steam for a 50 MW turbine/generator)
STEAM PRESSURE AND TEMPERATURE
Case No.
Combined Brine &
Steam FlowT = oF
Combined Brine &
Steam Gas Conc'n.
Flash Conditio
ns
Gas Content
Steam + Gases
lbs / hour (at 15% steam quality)
parts per million by
weight (ppmw) as
CO2
oF, PSIA
compressorB2.2 ALTERNATIVE B 2,287,000 T 550 29,000 T 334 29,900 932,000
reboiler P 1,124 P 113 803,000
B2.3 ALTERNATIVE C 2,288,000 T 550 29,000 T 334 29,900 932,000 biphase eductor P 1,124 P 113
B2.4 ALTERNATIVE D 2,288,000 T 550 29,000 T 334 29,900 932,000 hybrid turbo- P 1,124 P 113compressor
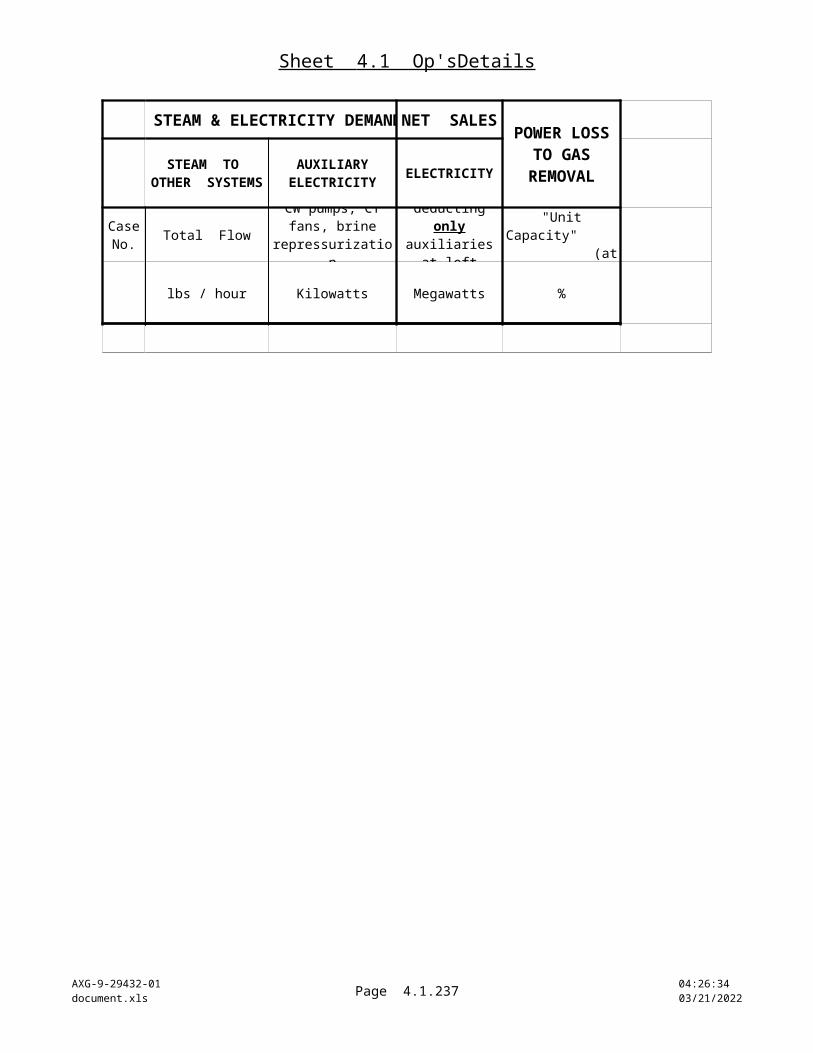
Sheet 4.3 $ FigMerit
AXG-9-29432-01document.xls Page 4.3.237 10:22:24
04/18/2023
OVERALL PLANT DEFINITION FLASHED STEAM AND GROSS POWER
TOTAL FLOW
Configuration
P = PSIA ppmv lbs / hour
GROSS PLANT FEED (combined well flows entering flash to produce steam for a 50 MW turbine/generator)
STEAM PRESSURE AND TEMPERATURE
Case No.
Combined Brine &
Steam FlowT = oF
Combined Brine &
Steam Gas Conc'n.
Flash Conditio
ns
Gas Content
Steam + Gases
lbs / hour (at 15% steam quality)
parts per million by
weight (ppmw) as
CO2
oF, PSIA
MAIN CASE GROUP 3
HIGH TEMPERATURE/PRESSURE AND LOW GAS CONTENTB-3 BASE CASE 2,284,000 T = 550 9,600 T 335 10,000 896,000
2-stage ejectors P = 1072 P 111
B3.1 ALTERNATIVE A 2,284,000 T = 550 9,600 T 335 10,000 896,000 3-stage turbo- P = 1072 P 111compressor
B3.2 ALTERNATIVE B 2,284,000 T = 550 9,600 T 335 10,000 896,000 reboiler P = 1072 P 111 853,000
B3.3 ALTERNATIVE C 2,284,000 T = 550 9,600 T 335 10,000 896,000 biphase eductor P = 1072 P 111
B3.4 ALTERNATIVE D 2,284,000 T = 550 9,600 T 335 10,000 896,000 hybrid turbo- P = 1072 P 111compressor
MAIN CASE GROUP 4
LOW TEMPERATURE/PRESSURE AND LOW GAS CONTENTB-4 BASE CASE 5,418,000 T 350 6,500 T 235 10,000 1,446,000
2-stage ejectors P 137 P 23
B4.1 ALTERNATIVE A 5,418,000 T 350 6,500 T 235 10,000 1,446,000 3-stage turbo- P 137 P 23compressor
B4.2 ALTERNATIVE B 5,418,000 T 350 6,500 T 235 10,000 1,446,000 reboiler P 137 P 23 1,375,000
B4.3 ALTERNATIVE C 5,418,000 T 350 6,500 T 235 10,000 1,446,000 biphase eductor P 137 P 23
B4.4 ALTERNATIVE D 5,418,000 T 350 6,500 T 235 10,000 1,446,000 hybrid turbo- P 137 P 23compressor
PLACE HOLDER PLACE HOLDER PLACE HOLDER
Sheet 4.3 $ FigMerit
AXG-9-29432-01document.xls Page 4.3.238 10:22:24
04/18/2023
OVERALL PLANT DEFINITION FLASHED STEAM AND GROSS POWER
TOTAL FLOW
Configuration
P = PSIA ppmv lbs / hour
GROSS PLANT FEED (combined well flows entering flash to produce steam for a 50 MW turbine/generator)
STEAM PRESSURE AND TEMPERATURE
Case No.
Combined Brine &
Steam FlowT = oF
Combined Brine &
Steam Gas Conc'n.
Flash Conditio
ns
Gas Content
Steam + Gases
lbs / hour (at 15% steam quality)
parts per million by
weight (ppmw) as
CO2
oF, PSIA
MAIN CASE GROUP 5
LOW TEMPERATURE/PRESSURE AND MID GAS CONTENT
B-5 BASE CASE 5,395,000 T = 350 19,700 T 234 30,100 1,505,000
2-stage ejectors P = 142 P 23
B5.1 ALTERNATIVE A 5,395,000 T = 350 19,700 T 234 30,100 1,505,000
3-stage turbo- P = 142 P 23
compressor
B5.2 ALTERNATIVE B 5,391,000 T = 350 19,700 T 234 30,100 1,505,000
reboiler P = 142 P 23 1,291,000
B5.3 ALTERNATIVE C 5,395,000 T = 350 19,700 T 234 30,100 1,505,000
biphase eductor P = 142 P 23
B5.4 ALTERNATIVE D 5,395,000 T = 350 19,700 T 234 30,100 1,505,000
hybrid turbo- P = 142 P 23
compressorPLACE HOLDER PLACE HOLDER PLACE HOLDER
MAIN CASE GROUP 6
LOW TEMPERATURE/PRESSURE AND HIGH GAS CONTENT
B-6 BASE CASE 5,365,000 T 350 33,400 T 234 50,100 1,563,000
2-stage ejectors P 146 P 24
B6.1 ALTERNATIVE A 5,365,000 T 350 33,400 T 234 50,100 1,563,000
3-stage turbo- P 146 P 24
compressor
B6.2 ALTERNATIVE B 5,354,000 T 350 33,400 T 234 50,100 1,563,000
reboiler P 146 P 24 1,203,000
Sheet 4.3 $ FigMerit
AXG-9-29432-01document.xls Page 4.3.239 10:22:24
04/18/2023
OVERALL PLANT DEFINITION FLASHED STEAM AND GROSS POWER
TOTAL FLOW
Configuration
P = PSIA ppmv lbs / hour
GROSS PLANT FEED (combined well flows entering flash to produce steam for a 50 MW turbine/generator)
STEAM PRESSURE AND TEMPERATURE
Case No.
Combined Brine &
Steam FlowT = oF
Combined Brine &
Steam Gas Conc'n.
Flash Conditio
ns
Gas Content
Steam + Gases
lbs / hour (at 15% steam quality)
parts per million by
weight (ppmw) as
CO2
oF, PSIA
B6.3 ALTERNATIVE C 5,365,000 T 350 33,400 T 234 50,100 1,563,000
biphase eductor P 146 P 24
B6.4 ALTERNATIVE D 5,365,000 T 350 33,400 T 234 50,100 1,563,000
hybrid turbo- P 146 P 24
compressorPLACE HOLDER PLACE HOLDER PLACE HOLDER
Sheet 4.3 $ FigMerit
AXG-9-29432-01document.xls Page 4.3.240 10:22:24
04/18/2023
OVERALL PLANT DEFINITION FLASHED STEAM AND GROSS POWER
TOTAL FLOW
Configuration
P = PSIA ppmv lbs / hour
GROSS PLANT FEED (combined well flows entering flash to produce steam for a 50 MW turbine/generator)
STEAM PRESSURE AND TEMPERATURE
Case No.
Combined Brine &
Steam FlowT = oF
Combined Brine &
Steam Gas Conc'n.
Flash Conditio
ns
Gas Content
Steam + Gases
lbs / hour (at 15% steam quality)
parts per million by
weight (ppmw) as
CO2
oF, PSIA
MAIN CASE GROUP 7
LOW TEMPERATURE/PRESSURE AND VERY HIGH GAS CONTENT
B-7 BASE CASE 5,201,000 T = 350 108,500 T 232 149,200 1,873,000
2-stage ejectors P = 170 P 25
B7.1 ALTERNATIVE A 5,201,000 T = 350 108,500 T 232 149,200 1,873,000
3-stage turbo- P = 170 P 25
compressor
B7.2 ALTERNATIVE B 5,119,000 T = 350 108,500 T 232 149,200 1,873,000
reboiler P = 170 P 25 751,000
B7.3 ALTERNATIVE C 5,201,000 T = 350 108,500 T 232 149,200 1,873,000
biphase eductor P = 170 P 25
B7.4 ALTERNATIVE D 5,201,000 T = 350 108,500 T 232 149,200 1,873,000
hybrid turbo- P = 170 P 25
compressorPLACE HOLDER PLACE HOLDER PLACE HOLDER
MAIN CASE GROUP 8
HIGH TEMPERATURE/PRESSURE AND VERY HIGH GAS CONTENT
B-8 BASE CASE 2,297,000 T 550 99,700 T 333 99,600 1,062,000
2-stage ejectors P 1,316 P 119
B8.1 ALTERNATIVE A 2,297,000 T 550 99,700 T 333 99,600 1,062,000
3-stage turbo- P 1,316 P 119
compressor
B8.2 ALTERNATIVE B 2,289,000 T 550 99,700 T 333 99,600 1,062,000
reboiler P 1,316 P 119 614,000
B8.3 ALTERNATIVE C 2,297,000 T 550 99,700 T 333 99,600 1,062,000
biphase eductor P 1,316 P 119

Sheet 4.3 $ FigMerit
AXG-9-29432-01document.xls Page 4.3.241 10:22:24
04/18/2023
OVERALL PLANT DEFINITION FLASHED STEAM AND GROSS POWER
TOTAL FLOW
Configuration
P = PSIA ppmv lbs / hour
GROSS PLANT FEED (combined well flows entering flash to produce steam for a 50 MW turbine/generator)
STEAM PRESSURE AND TEMPERATURE
Case No.
Combined Brine &
Steam FlowT = oF
Combined Brine &
Steam Gas Conc'n.
Flash Conditio
ns
Gas Content
Steam + Gases
lbs / hour (at 15% steam quality)
parts per million by
weight (ppmw) as
CO2
oF, PSIA
B8.4 ALTERNATIVE D 2,297,000 T 550 99,700 T 333 99,600 1,062,000
hybrid turbo- P 1,316 P 119
compressor
PLACE HOLDER PLACE HOLDER PLACE HOLDER

Sheet 4.3 $ FigMerit
AXG-9-29432-01document.xls Page 4.3.242 10:22:24
04/18/2023
OVERALL PLANT DEFINITION FLASHED STEAM AND GROSS POWER
TOTAL FLOW
Configuration
P = PSIA ppmv lbs / hour
GROSS PLANT FEED (combined well flows entering flash to produce steam for a 50 MW turbine/generator)
STEAM PRESSURE AND TEMPERATURE
Case No.
Combined Brine &
Steam FlowT = oF
Combined Brine &
Steam Gas Conc'n.
Flash Conditio
ns
Gas Content
Steam + Gases
lbs / hour (at 15% steam quality)
parts per million by
weight (ppmw) as
CO2
oF, PSIA
SENSITIVITY CASE GROUP S - 1 LOW STEAM JET EJECTOR EFFICIENCY
HIGH TEMPERATURE / HIGH GAS CONTENT
S-1 BASE CASE 2,291,000 T 550 48,800 T 334 49,900 968,000
2-stage ejectors P 1,177 P 114
S1.1 ALTERNATIVE A 2,291,000 T 550 48,800 T 334 49,900 968,000
3-stage turbo- P 1,177 P 114
compressor
S1.2 ALTERNATIVE B 2,289,000 T 550 48,800 T 334 49,900 968,000
reboiler P 1,177 P 114 750,000
S1.3 ALTERNATIVE C 2,291,000 T 550 48,800 T 334 49,900 968,000
biphase eductor P 1,177 P 114
S1.4 ALTERNATIVE D 2,291,000 T 550 48,800 T 334 49,900 968,000
hybrid turbo- P 1,177 P 114
compressorPLACE HOLDER PLACE HOLDER PLACE HOLDER
SENSITIVITY CASE GROUP S - 2 LOW STEAM JET EJECTOR EFFICIENCY
LOW TEMPERATURE / LOW GAS CONTENT
S-2 BASE CASE 5,418,000 T 350 6,500 T 235 10,100 1,446,000
2-stage ejectors P 137 P 23
S2.1 ALTERNATIVE A 5,418,000 T 350 6,500 T 235 10,100 1,446,000
3-stage turbo- P 137 P 23
compressor
S2.2 ALTERNATIVE B 5,418,000 T 350 6,500 T 235 10,100 1,446,000
reboiler P 137 P 23 1,375,000
S2.3 ALTERNATIVE C 5,418,000 T 350 6,500 T 235 10,100 1,446,000
Sheet 4.3 $ FigMerit
AXG-9-29432-01document.xls Page 4.3.243 10:22:24
04/18/2023
OVERALL PLANT DEFINITION FLASHED STEAM AND GROSS POWER
TOTAL FLOW
Configuration
P = PSIA ppmv lbs / hour
GROSS PLANT FEED (combined well flows entering flash to produce steam for a 50 MW turbine/generator)
STEAM PRESSURE AND TEMPERATURE
Case No.
Combined Brine &
Steam FlowT = oF
Combined Brine &
Steam Gas Conc'n.
Flash Conditio
ns
Gas Content
Steam + Gases
lbs / hour (at 15% steam quality)
parts per million by
weight (ppmw) as
CO2
oF, PSIA
biphase eductor P 137 P 23
S2.4 ALTERNATIVE D 5,418,000 T 350 6,500 T 235 10,100 1,446,000
hybrid turbo- P 137 P 23
compressorPLACE HOLDER PLACE HOLDER PLACE HOLDER
Sheet 4.3 $ FigMerit
AXG-9-29432-01document.xls Page 4.3.244 10:22:24
04/18/2023
OVERALL PLANT DEFINITION FLASHED STEAM AND GROSS POWER
TOTAL FLOW
Configuration
P = PSIA ppmv lbs / hour
GROSS PLANT FEED (combined well flows entering flash to produce steam for a 50 MW turbine/generator)
STEAM PRESSURE AND TEMPERATURE
Case No.
Combined Brine &
Steam FlowT = oF
Combined Brine &
Steam Gas Conc'n.
Flash Conditio
ns
Gas Content
Steam + Gases
lbs / hour (at 15% steam quality)
parts per million by
weight (ppmw) as
CO2
oF, PSIA
SENSITIVITY CASE GROUP S - 3
HIGH TEMPERATURE / MID GAS CONTENT
S-3 BASE CASE 2,505,000 T 550 28,900 T 344 30,400 1,001,000
2-stage ejectors P 1,124 P 128
S3.1 ALTERNATIVE A 2,505,000 T 550 28,900 T 344 30,400 1,001,000
3-stage turbo- P 1,124 P 128
compressor
S3.2 ALTERNATIVE B 2,505,000 T 550 28,900 T 344 30,400 1,001,000
reboiler P 1,124 P 128 860,000
S3.3 ALTERNATIVE C 2,505,000 T 550 28,900 T 344 30,400 1,001,000
biphase eductor P 1,124 P 128
S3.4 ALTERNATIVE D 2,505,000 T 550 28,900 T 344 30,400 1,001,000
hybrid turbo- P 1,124 P 128
compressorPLACE HOLDER PLACE HOLDER PLACE HOLDER
SENSITIVITY CASE GROUP S - 4
LOW TEMPERATURE / LOW GAS CONTENT
S-4 BASE CASE 6,251,000 T 350 6,400 T 244 10,100 1,615,000
2-stage ejectors P 137 P 27
S4.1 ALTERNATIVE A 6,251,000 T 350 6,400 T 244 10,100 1,615,000
3-stage turbo- P 137 P 27
compressor
S4.2 ALTERNATIVE B 6,250,000 T 350 6,400 T 244 10,100 1,615,000
reboiler P 137 P 27 1,536,000
S4.3 ALTERNATIVE C 6,251,000 T 350 6,400 T 244 10,100 1,615,000
biphase eductor P 137 P 27
S4.4 ALTERNATIVE D 6,251,000 T 350 6,400 T 244 10,100 1,615,000
80 oF WET BULB TEMPERATURE
80 oF WET BULB TEMPERATURE
Sheet 4.3 $ FigMerit
AXG-9-29432-01document.xls Page 4.3.245 10:22:24
04/18/2023
OVERALL PLANT DEFINITION FLASHED STEAM AND GROSS POWER
TOTAL FLOW
Configuration
P = PSIA ppmv lbs / hour
GROSS PLANT FEED (combined well flows entering flash to produce steam for a 50 MW turbine/generator)
STEAM PRESSURE AND TEMPERATURE
Case No.
Combined Brine &
Steam FlowT = oF
Combined Brine &
Steam Gas Conc'n.
Flash Conditio
ns
Gas Content
Steam + Gases
lbs / hour (at 15% steam quality)
parts per million by
weight (ppmw) as
CO2
oF, PSIA
hybrid turbo- P 137 P 27
compressor

Sheet 4.3 $ FigMerit
AXG-9-29432-01document.xls Page 4.3.246 10:22:24
04/18/2023
ECONOMIC FIGURE OF MERIT
FLASHED STEAM AND GROSS POWER
ELECTRICITY ( A ) ( B )
B = 1 - ( A )
Megawatts Megawatts % $ $ / year
Use an annual on-line "streamfactor" of :
Annual ops. hours=Recovered power valued at :
( $ / kWh ) =
MAIN CASE GROUP 150.0 38.2 23.7% 76.3% N/A $ 86,900 N/A
50.0 40.5 19.1% 80.9% $ 4,800,000 $ 240,000 18,050,000
50.0 38.6 22.9% 77.1% $ 5,177,000 $ 259,000 3,020,000 = clean steam turbine feed
50.0 39.0 21.9% 78.1% $ 2,228,000 $ 111,000 6,890,000
50.0 39.9 20.2% 79.8% $ 1,200,000 $ 60,000 13,660,000
MAIN CASE GROUP 250.0 41.7 16.6% 83.4% N/A $ 62,500 N/A
50.0 43.3 13.5% 86.5% $ 2,400,000 $ 120,000 12,600,000
NET SALES POWER
AVAILABLE
POWER LOSS TO
GAS REMOVAL
NET PLANT PRODUCTIVITY AFTER "GAS
LOSS"
COSTS OF DESIGN ALTERNATIVES
VALUE OF UNEXPENDED PARASITIC POWER AS A
SALABLE PRODUCT
UNIT CAPACITY
CAPITAL (installed)
ANNUAL O & M
Net Unexpended Power Available
for SaleGross Generator
Output
Percent of gross "Unit Capacity"
Kilowatt-hours per year
Define an economic "figure of merit" that allocates dollars as credit for savings in parasitic power losses. Evaluate the credits by calculating the equivalent electrical generating output of the steam and electricity used to run the noncondensable gas removal systems. Assign the "found" generating power a unit value (see worksheet tab 2.2 -- "Bases&Input").
Then calculate the figure of merit value as the payback period for the cost of investing in conversion to an alternative gas removal system: Divide the investment cost by the "found power" revenue value ($ per year), yielding a value of years to recover the alternate technology investment costs. The shorter the payback period, the better the option is as a recoverable cost.
Sheet 4.3 $ FigMerit
AXG-9-29432-01document.xls Page 4.3.247 10:22:24
04/18/2023
FLASHED STEAM AND GROSS POWER
ELECTRICITY ( A ) ( B )
B = 1 - ( A )
Megawatts Megawatts % $ $ / year
NET SALES POWER
AVAILABLE
POWER LOSS TO
GAS REMOVAL
NET PLANT PRODUCTIVITY AFTER "GAS
LOSS"
COSTS OF DESIGN ALTERNATIVES
VALUE OF UNEXPENDED PARASITIC POWER AS A
SALABLE PRODUCT
UNIT CAPACITY
CAPITAL (installed)
ANNUAL O & M
Net Unexpended Power Available
for SaleGross Generator
Output
Percent of gross "Unit Capacity"
Kilowatt-hours per year
50.0 41.9 16.2% 83.8% $ 5,394,000 $ 270,000 1,700,000 = clean steam turbine feed
50.0 43.0 14.0% 86.0% $ 2,262,000 $ 113,000 10,300,000
50.0 42.9 14.2% 85.8% $ 600,000 $ 30,000 9,500,000

Sheet 4.3 $ FigMerit
AXG-9-29432-01document.xls Page 4.3.248 10:22:24
04/18/2023
FLASHED STEAM AND GROSS POWER
ELECTRICITY ( A ) ( B )
B = 1 - ( A )
Megawatts Megawatts % $ $ / year
NET SALES POWER
AVAILABLE
POWER LOSS TO
GAS REMOVAL
NET PLANT PRODUCTIVITY AFTER "GAS
LOSS"
COSTS OF DESIGN ALTERNATIVES
VALUE OF UNEXPENDED PARASITIC POWER AS A
SALABLE PRODUCT
UNIT CAPACITY
CAPITAL (installed)
ANNUAL O & M
Net Unexpended Power Available
for SaleGross Generator
Output
Percent of gross "Unit Capacity"
Kilowatt-hours per year
MAIN CASE GROUP 350.0 45.4 9.2% 90.8% N/A $ 31,600 N/A
50.0 46.0 7.9% 92.1% $ 1,740,000 $ 87,000 5,200,000
50.0 45.4 9.2% 90.8% $ 5,593,000 $ 280,000 200,000 = clean steam turbine feed
50.0 46.5 7.0% 93.0% $ 2,119,000 $ 106,000 8,700,000
50.0 45.9 8.1% 91.9% $ 300,000 $ 15,000 4,500,000
MAIN CASE GROUP 450.0 40.6 18.8% 81.2% N/A $ 42,200 N/A
50.0 43.2 13.5% 86.5% $ 2,040,000 $ 102,000 20,800,000
50.0 43.3 13.3% 86.7% $ 7,812,000 $ 391,000 21,500,000 = clean steam turbine feed
50.0 41.3 17.4% 82.6% $ 4,313,000 $ 216,000 5,600,000
50.0 42.7 14.6% 85.4% $ 600,000 $ 30,000 16,500,000
PLACE HOLDER PLACE HOLDER PLACE HOLDER

Sheet 4.3 $ FigMerit
AXG-9-29432-01document.xls Page 4.3.249 10:22:24
04/18/2023
FLASHED STEAM AND GROSS POWER
ELECTRICITY ( A ) ( B )
B = 1 - ( A )
Megawatts Megawatts % $ $ / year
NET SALES POWER
AVAILABLE
POWER LOSS TO
GAS REMOVAL
NET PLANT PRODUCTIVITY AFTER "GAS
LOSS"
COSTS OF DESIGN ALTERNATIVES
VALUE OF UNEXPENDED PARASITIC POWER AS A
SALABLE PRODUCT
UNIT CAPACITY
CAPITAL (installed)
ANNUAL O & M
Net Unexpended Power Available
for SaleGross Generator
Output
Percent of gross "Unit Capacity"
Kilowatt-hours per year
MAIN CASE GROUP 5
50.0 31.7 36.6% 63.4% N/A $ 83,700 N/A
50.0 38.8 22.5% 77.5% $ 4,800,000 $ 240,000 55,700,000
50.0 39.9 20.3% 79.7% $ 7,522,000 $ 376,000 64,200,000
= clean steam turbine feed
50.0 32.8 34.4% 65.6% $ 4,259,000 $ 213,000 8,600,000
50.0 36.8 26.3% 73.7% $ 1,200,000 $ 60,000 40,500,000
PLACE HOLDER PLACE HOLDER PLACE HOLDER
MAIN CASE GROUP 6
50.0 24.8 50.4% 49.6% N/A $ 116,200 N/A
50.0 34.2 31.5% 68.5% $ 9,600,000 $ 480,000 74,300,000
50.0 36.6 26.8% 73.2% $ 7,210,000 $ 361,000 93,000,000
= clean steam turbine feed
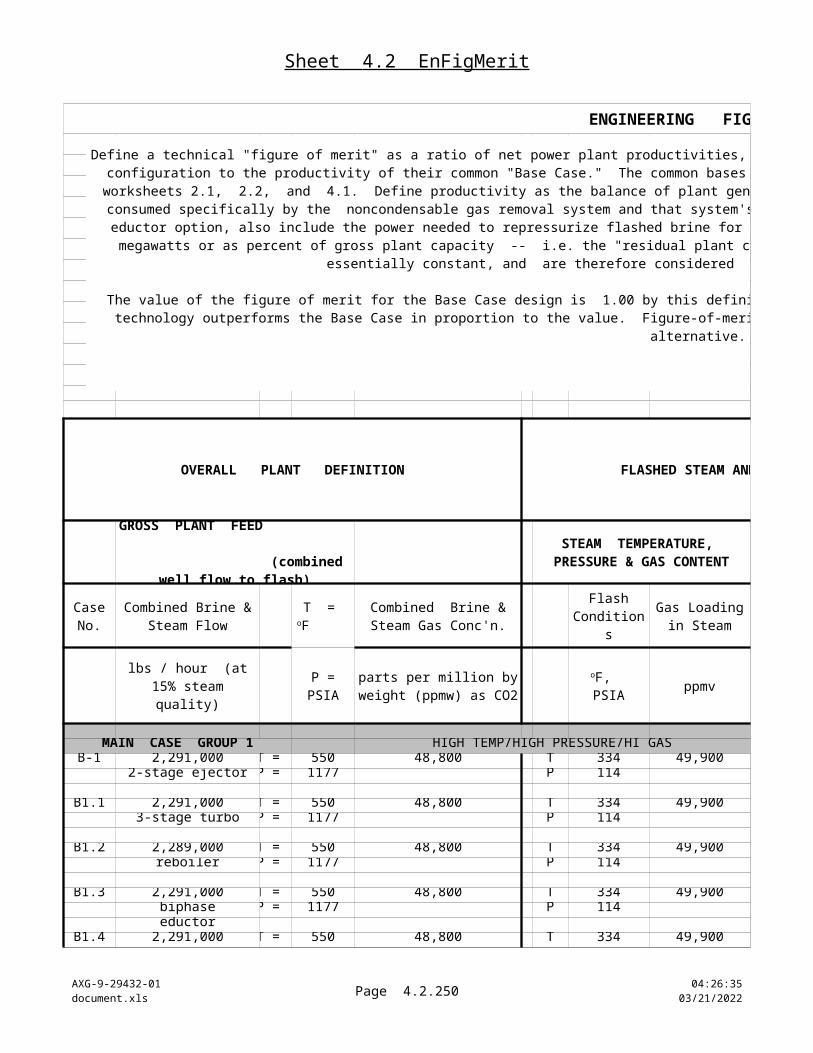
Sheet 4.3 $ FigMerit
AXG-9-29432-01document.xls Page 4.3.250 10:22:24
04/18/2023
FLASHED STEAM AND GROSS POWER
ELECTRICITY ( A ) ( B )
B = 1 - ( A )
Megawatts Megawatts % $ $ / year
NET SALES POWER
AVAILABLE
POWER LOSS TO
GAS REMOVAL
NET PLANT PRODUCTIVITY AFTER "GAS
LOSS"
COSTS OF DESIGN ALTERNATIVES
VALUE OF UNEXPENDED PARASITIC POWER AS A
SALABLE PRODUCT
UNIT CAPACITY
CAPITAL (installed)
ANNUAL O & M
Net Unexpended Power Available
for SaleGross Generator
Output
Percent of gross "Unit Capacity"
Kilowatt-hours per year
50.0 25.9 48.3% 51.7% $ 4,200,000 $ 210,000 8,400,000
50.0 31.1 37.8% 62.2% $ 2,400,000 $ 120,000 49,800,000
PLACE HOLDER PLACE HOLDER PLACE HOLDER
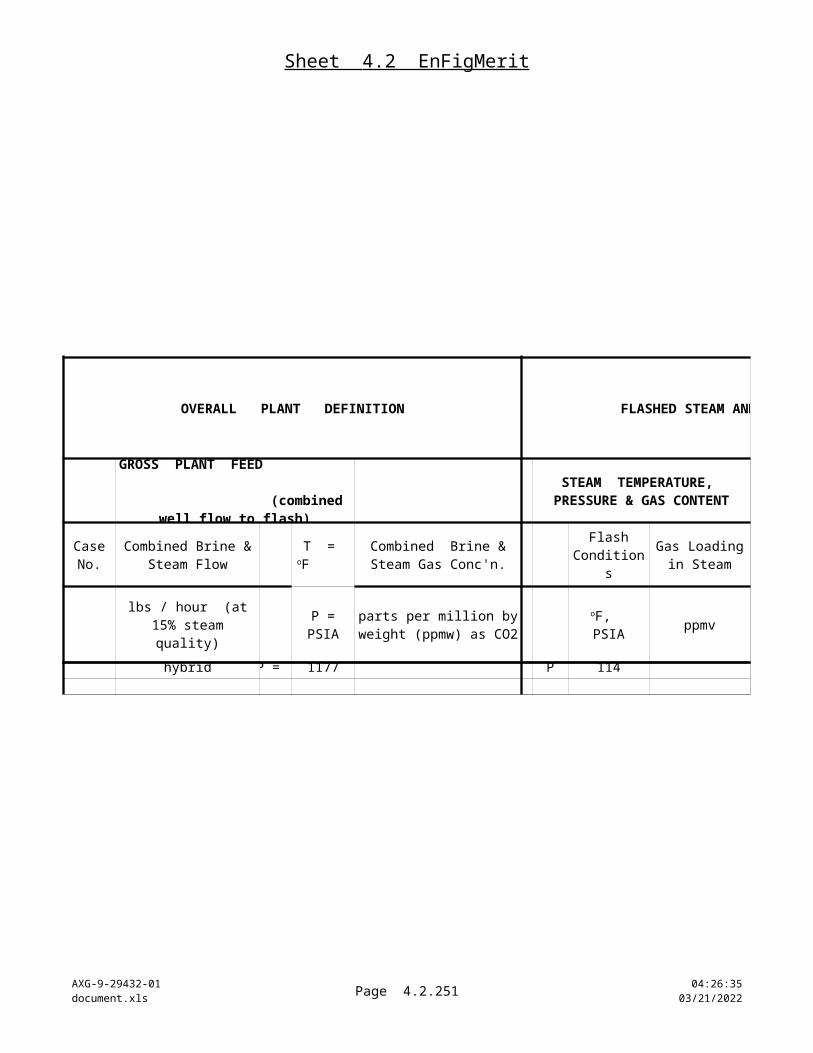
Sheet 4.3 $ FigMerit
AXG-9-29432-01document.xls Page 4.3.251 10:22:24
04/18/2023
FLASHED STEAM AND GROSS POWER
ELECTRICITY ( A ) ( B )
B = 1 - ( A )
Megawatts Megawatts % $ $ / year
NET SALES POWER
AVAILABLE
POWER LOSS TO
GAS REMOVAL
NET PLANT PRODUCTIVITY AFTER "GAS
LOSS"
COSTS OF DESIGN ALTERNATIVES
VALUE OF UNEXPENDED PARASITIC POWER AS A
SALABLE PRODUCT
UNIT CAPACITY
CAPITAL (installed)
ANNUAL O & M
Net Unexpended Power Available
for SaleGross Generator
Output
Percent of gross "Unit Capacity"
Kilowatt-hours per year
MAIN CASE GROUP 7
49.9 5.5 89.0% 11.0% N/A $ 249,200 N/A
49.9 11.2 77.5% 22.5% $ 34,680,000 $ 1,734,000 45,200,000
49.9 23.6 52.7% 47.3% $ 5,434,000 $ 272,000 142,700,000
= clean steam turbine feed
49.9 7.1 85.7% 14.3% $ 3,877,000 $ 194,000 12,800,000
49.9 8.7 82.5% 17.5% $ 8,400,000 $ 420,000 25,400,000
PLACE HOLDER PLACE HOLDER PLACE HOLDER
MAIN CASE GROUP 8
50.0 30.6 38.8% 61.2% N/A $ 139,100 N/A
50.0 33.4 33.2% 66.8% $ 12,360,000 $ 618,000 22,100,000
50.0 31.0 37.9% 62.1% $ 4,592,000 $ 230,000 3,600,000
= clean steam turbine feed
50.0 29.8 40.3% 59.7% $ 2,137,000 $ 107,000 -5,800,000
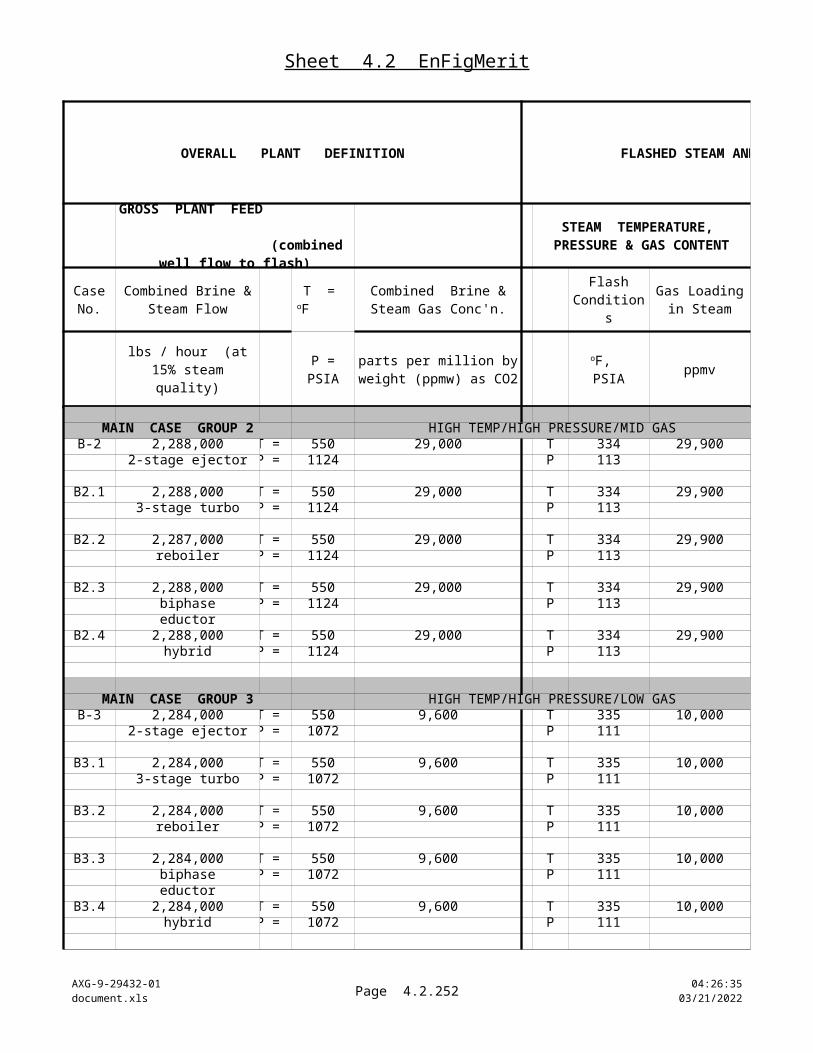
Sheet 4.3 $ FigMerit
AXG-9-29432-01document.xls Page 4.3.252 10:22:24
04/18/2023
FLASHED STEAM AND GROSS POWER
ELECTRICITY ( A ) ( B )
B = 1 - ( A )
Megawatts Megawatts % $ $ / year
NET SALES POWER
AVAILABLE
POWER LOSS TO
GAS REMOVAL
NET PLANT PRODUCTIVITY AFTER "GAS
LOSS"
COSTS OF DESIGN ALTERNATIVES
VALUE OF UNEXPENDED PARASITIC POWER AS A
SALABLE PRODUCT
UNIT CAPACITY
CAPITAL (installed)
ANNUAL O & M
Net Unexpended Power Available
for SaleGross Generator
Output
Percent of gross "Unit Capacity"
Kilowatt-hours per year
50.0 32.7 34.5% 65.5% $ 3,000,000 $ 150,000 17,000,000
PLACE HOLDER PLACE HOLDER PLACE HOLDER
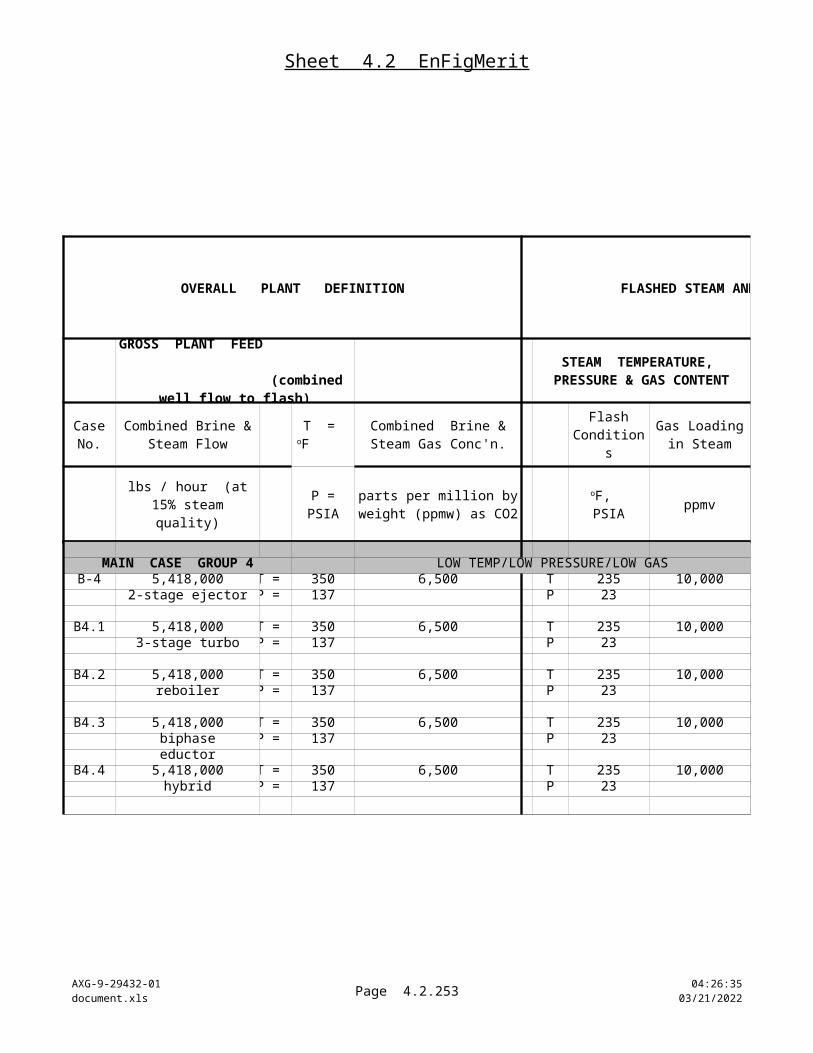
Sheet 4.3 $ FigMerit
AXG-9-29432-01document.xls Page 4.3.253 10:22:24
04/18/2023
FLASHED STEAM AND GROSS POWER
ELECTRICITY ( A ) ( B )
B = 1 - ( A )
Megawatts Megawatts % $ $ / year
NET SALES POWER
AVAILABLE
POWER LOSS TO
GAS REMOVAL
NET PLANT PRODUCTIVITY AFTER "GAS
LOSS"
COSTS OF DESIGN ALTERNATIVES
VALUE OF UNEXPENDED PARASITIC POWER AS A
SALABLE PRODUCT
UNIT CAPACITY
CAPITAL (installed)
ANNUAL O & M
Net Unexpended Power Available
for SaleGross Generator
Output
Percent of gross "Unit Capacity"
Kilowatt-hours per year
LOW STEAM JET EJECTOR EFFICIENCY LOW EJECTOR EFFICIENCY
SENSITIVITY CASE GROUP S - 1
50.0 34.2 31.5% 68.5% N/A $ 86,900 N/A
50.0 40.5 19.0% 81.0% $ 4,800,000 $ 240,000 49,300,000
50.0 38.6 22.9% 77.1% $ 5,177,000 $ 259,000 34,000,000
= clean steam turbine feed
50.0 35.8 28.5% 71.5% $ 2,228,000 $ 111,000 11,900,000
50.0 37.2 25.6% 74.4% $ 1,200,000 $ 60,000 23,500,000
PLACE HOLDER PLACE HOLDER PLACE HOLDER
LOW STEAM JET EJECTOR EFFICIENCY LOW EJECTOR EFFICIENCY
SENSITIVITY CASE GROUP S - 2
50.0 38.7 22.6% 77.4% N/A $ 42,400 N/A
50.0 43.2 13.5% 86.5% $ 2,040,000 $ 102,000 35,600,000
50.0 43.3 13.3% 86.7% $ 7,812,000 $ 391,000 36,400,000
= clean steam turbine feed
50.0 39.9 20.3% 79.7% $ 4,313,000 $ 216,000 9,100,000
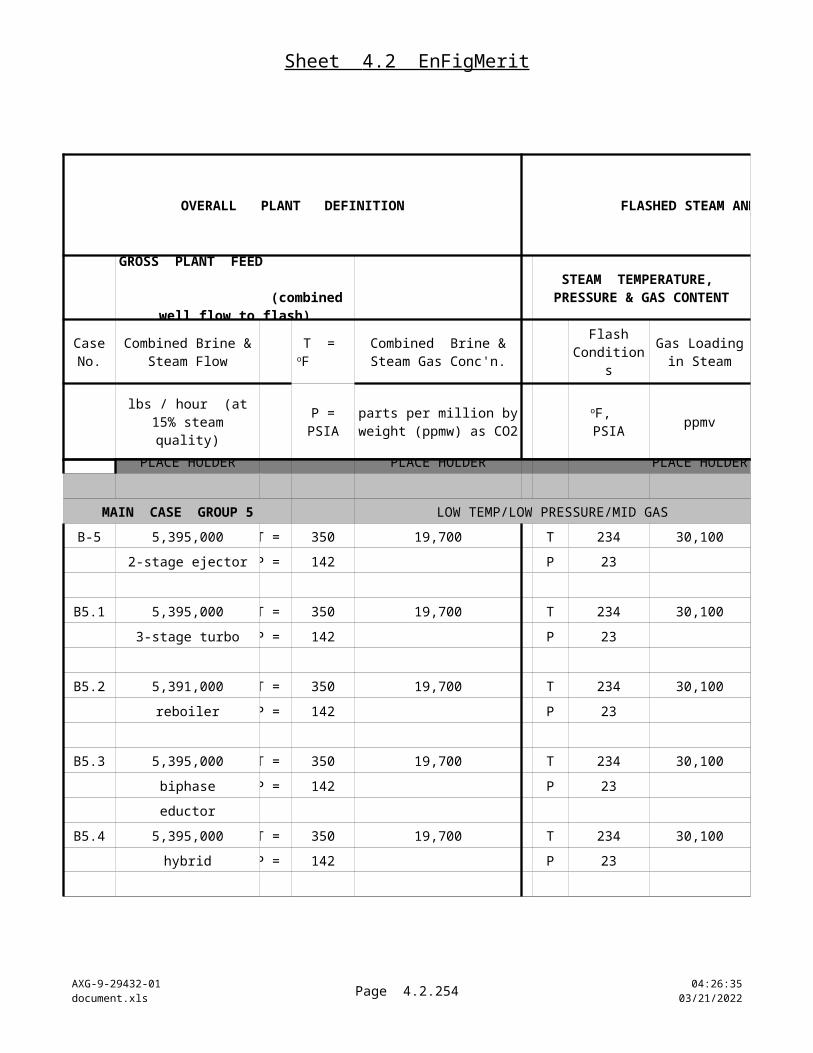
Sheet 4.3 $ FigMerit
AXG-9-29432-01document.xls Page 4.3.254 10:22:24
04/18/2023
FLASHED STEAM AND GROSS POWER
ELECTRICITY ( A ) ( B )
B = 1 - ( A )
Megawatts Megawatts % $ $ / year
NET SALES POWER
AVAILABLE
POWER LOSS TO
GAS REMOVAL
NET PLANT PRODUCTIVITY AFTER "GAS
LOSS"
COSTS OF DESIGN ALTERNATIVES
VALUE OF UNEXPENDED PARASITIC POWER AS A
SALABLE PRODUCT
UNIT CAPACITY
CAPITAL (installed)
ANNUAL O & M
Net Unexpended Power Available
for SaleGross Generator
Output
Percent of gross "Unit Capacity"
Kilowatt-hours per year
50.0 41.6 16.7% 83.3% $ 600,000 $ 30,000 23,000,000
PLACE HOLDER PLACE HOLDER PLACE HOLDER

Sheet 4.3 $ FigMerit
AXG-9-29432-01document.xls Page 4.3.255 10:22:24
04/18/2023
FLASHED STEAM AND GROSS POWER
ELECTRICITY ( A ) ( B )
B = 1 - ( A )
Megawatts Megawatts % $ $ / year
NET SALES POWER
AVAILABLE
POWER LOSS TO
GAS REMOVAL
NET PLANT PRODUCTIVITY AFTER "GAS
LOSS"
COSTS OF DESIGN ALTERNATIVES
VALUE OF UNEXPENDED PARASITIC POWER AS A
SALABLE PRODUCT
UNIT CAPACITY
CAPITAL (installed)
ANNUAL O & M
Net Unexpended Power Available
for SaleGross Generator
Output
Percent of gross "Unit Capacity"
Kilowatt-hours per year
SENSITIVITY CASE GROUP S - 3
50.0 42.2 15.6% 84.4% N/A $ 65,900 N/A
50.0 43.4 13.3% 86.7% $ 3,120,000 $ 156,000 9,200,000
50.0 41.7 16.7% 83.3% $ 5,620,000 $ 281,000 -4,500,000
= clean steam turbine feed
50.0 43.5 13.0% 87.0% $ 2,407,000 $ 120,000 10,100,000
50.0 43.1 13.8% 86.2% $ 600,000 $ 30,000 7,000,000
PLACE HOLDER PLACE HOLDER PLACE HOLDER
SENSITIVITY CASE GROUP S - 4
50.0 41.0 18.0% 82.0% N/A $ 45,300 N/A
50.0 42.8 14.4% 85.6% $ 2,400,000 $ 120,000 14,400,000
50.0 42.8 14.4% 85.6% $ 8,348,000 $ 417,000 14,100,000
= clean steam turbine feed
50.0 41.5 16.9% 83.1% $ 4,732,000 $ 237,000 4,400,000
50.0 42.4 15.1% 84.9% $ 600,000 $ 30,000 11,300,000
F WET BULB TEMPERATURE 80 oF WET BULB TEMPERATURE
F WET BULB TEMPERATURE 80 oF WET BULB TEMPERATURE
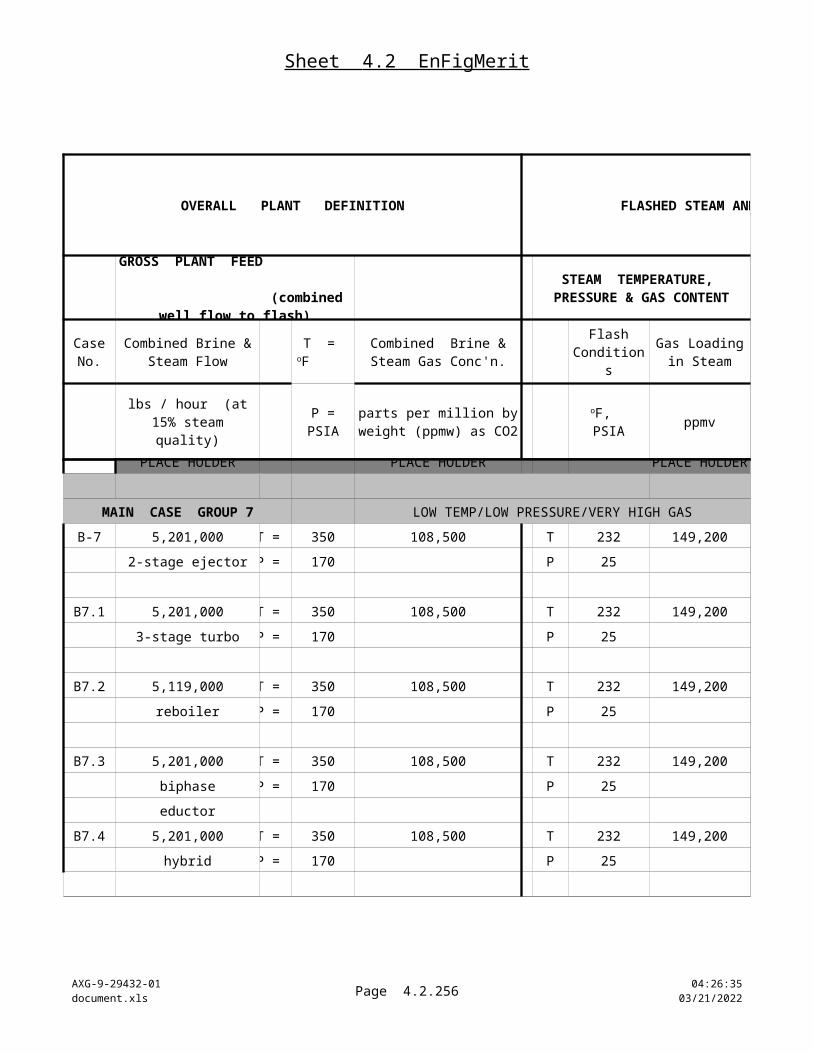
Sheet 4.3 $ FigMerit
AXG-9-29432-01document.xls Page 4.3.256 10:22:24
04/18/2023
FLASHED STEAM AND GROSS POWER
ELECTRICITY ( A ) ( B )
B = 1 - ( A )
Megawatts Megawatts % $ $ / year
NET SALES POWER
AVAILABLE
POWER LOSS TO
GAS REMOVAL
NET PLANT PRODUCTIVITY AFTER "GAS
LOSS"
COSTS OF DESIGN ALTERNATIVES
VALUE OF UNEXPENDED PARASITIC POWER AS A
SALABLE PRODUCT
UNIT CAPACITY
CAPITAL (installed)
ANNUAL O & M
Net Unexpended Power Available
for SaleGross Generator
Output
Percent of gross "Unit Capacity"
Kilowatt-hours per year
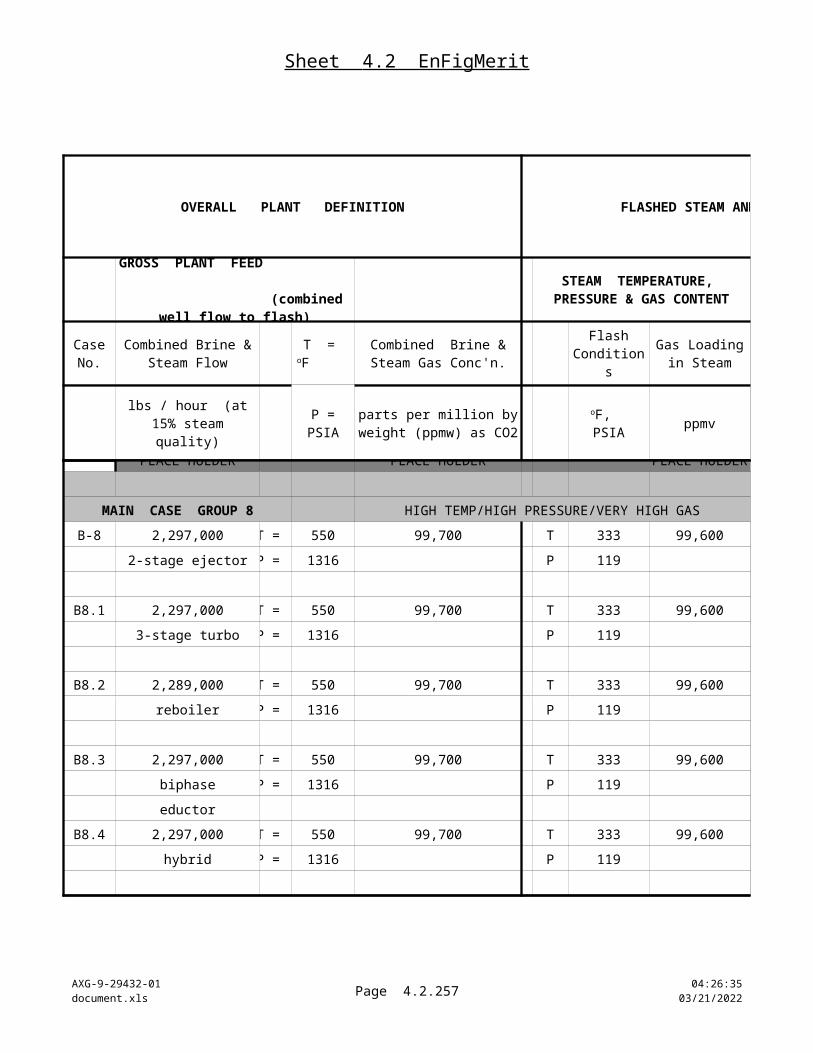
Sheet 4.3 $ FigMerit
AXG-9-29432-01document.xls Page 4.3.257 10:22:24
04/18/2023
ECONOMIC FIGURE OF MERIT
$ / year
Use an annual on-line "stream90%7884
Recovered power valued at : $ 0.040
MAIN CASE GROUP 1N/A N/A
$ 722,000 8.4
$ 120,800 -100.9
$ 275,600 13.5
$ 546,400 2.1
MAIN CASE GROUP 2N/A N/A
$ 504,000 5.4
VALUE OF UNEXPENDED PARASITIC POWER AS A
SALABLE PRODUCT
FIGURE OF
MERIT
Sales value of unexpended
power
PAYOUT PERIOD
"simple payback" (years)
Define an economic "figure of merit" that allocates dollars as credit for savings in parasitic power losses. Evaluate the credits by calculating the equivalent electrical generating output of the steam and electricity used to run the noncondensable gas removal systems. Assign the "found" generating power a unit value (see worksheet tab 2.2 -- "Bases&Input").
Then calculate the figure of merit value as the payback period for the cost of investing in conversion to an alternative gas removal system: Divide the investment cost by the "found power" revenue value ($ per year), yielding a value of years to recover the alternate technology investment costs. The shorter the payback period, the better the option is as a recoverable cost.
RETURN
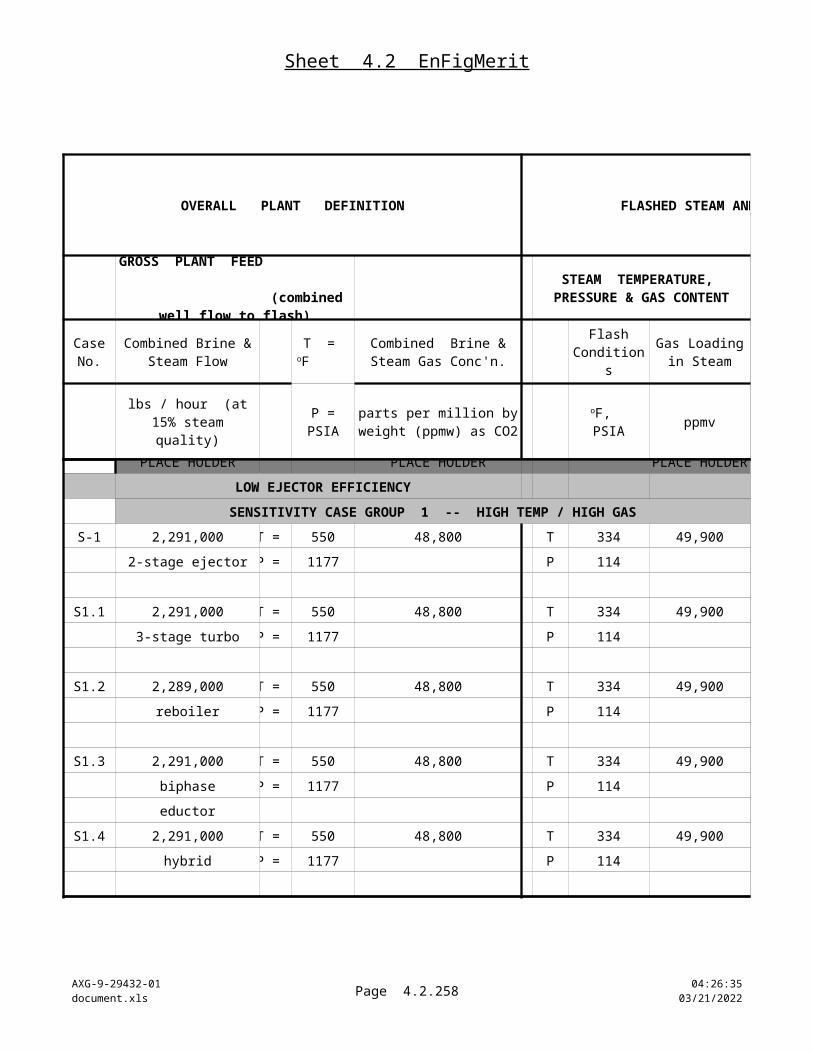
Sheet 4.3 $ FigMerit
AXG-9-29432-01document.xls Page 4.3.258 10:22:24
04/18/2023
$ / year
VALUE OF UNEXPENDED PARASITIC POWER AS A
SALABLE PRODUCT
FIGURE OF
MERIT
Sales value of unexpended
power
PAYOUT PERIOD
"simple payback" (years)
RETURN
$ 68,000 -38.7
$ 412,000 7.6
$ 380,000 1.5
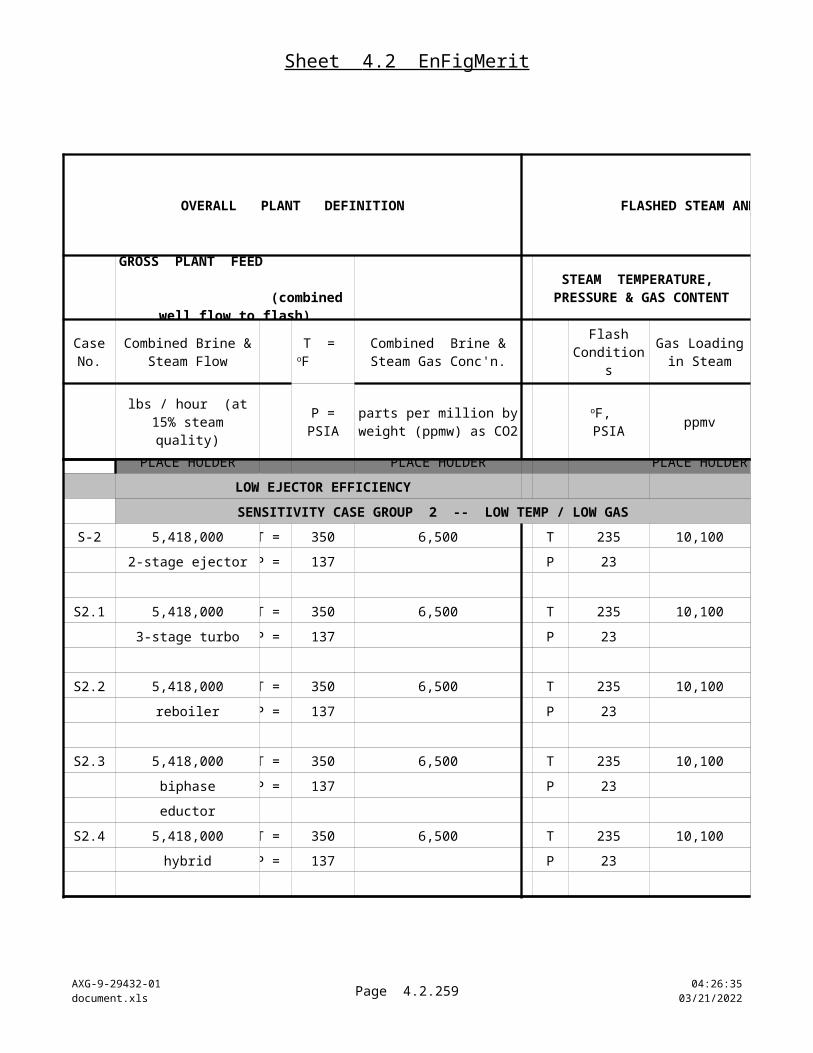
Sheet 4.3 $ FigMerit
AXG-9-29432-01document.xls Page 4.3.259 10:22:24
04/18/2023
$ / year
VALUE OF UNEXPENDED PARASITIC POWER AS A
SALABLE PRODUCT
FIGURE OF
MERIT
Sales value of unexpended
power
PAYOUT PERIOD
"simple payback" (years)
RETURN
MAIN CASE GROUP 3N/A N/A
$ 208,000 11.4
$ 8,000 -23.3
$ 348,000 7.7
$ 180,000 1.5
MAIN CASE GROUP 4N/A N/A
$ 832,000 2.6
$ 860,000 15.3
$ 224,000 539.1
$ 660,000 0.9
PLACE HOLDER
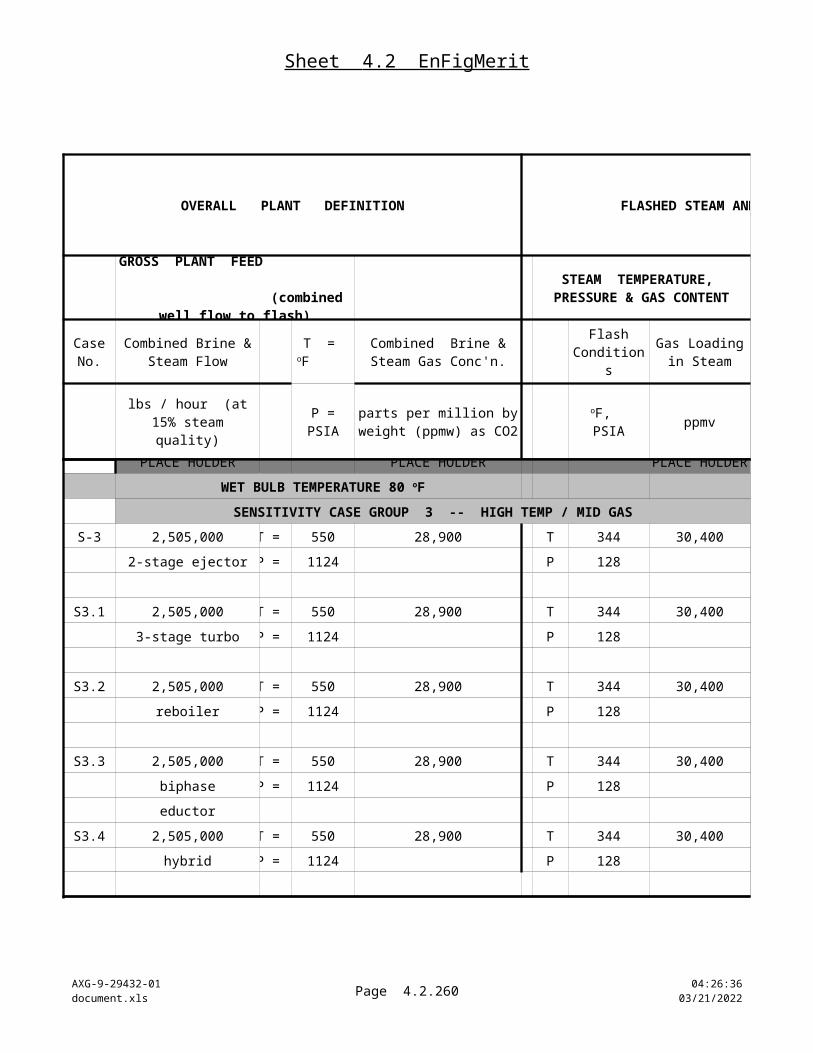
Sheet 4.3 $ FigMerit
AXG-9-29432-01document.xls Page 4.3.260 10:22:24
04/18/2023
$ / year
VALUE OF UNEXPENDED PARASITIC POWER AS A
SALABLE PRODUCT
FIGURE OF
MERIT
Sales value of unexpended
power
PAYOUT PERIOD
"simple payback" (years)
RETURN
MAIN CASE GROUP 5
N/A N/A
$ 2,228,000 2.3
$ 2,568,000 3.3
$ 344,000 32.5
$ 1,620,000 0.7
PLACE HOLDER
MAIN CASE GROUP 6
N/A N/A
$ 2,972,000 3.7
$ 3,720,000 2.1

Sheet 4.3 $ FigMerit
AXG-9-29432-01document.xls Page 4.3.261 10:22:24
04/18/2023
$ / year
VALUE OF UNEXPENDED PARASITIC POWER AS A
SALABLE PRODUCT
FIGURE OF
MERIT
Sales value of unexpended
power
PAYOUT PERIOD
"simple payback" (years)
RETURN
$ 336,000 33.3
$ 1,992,000 1.2
PLACE HOLDER
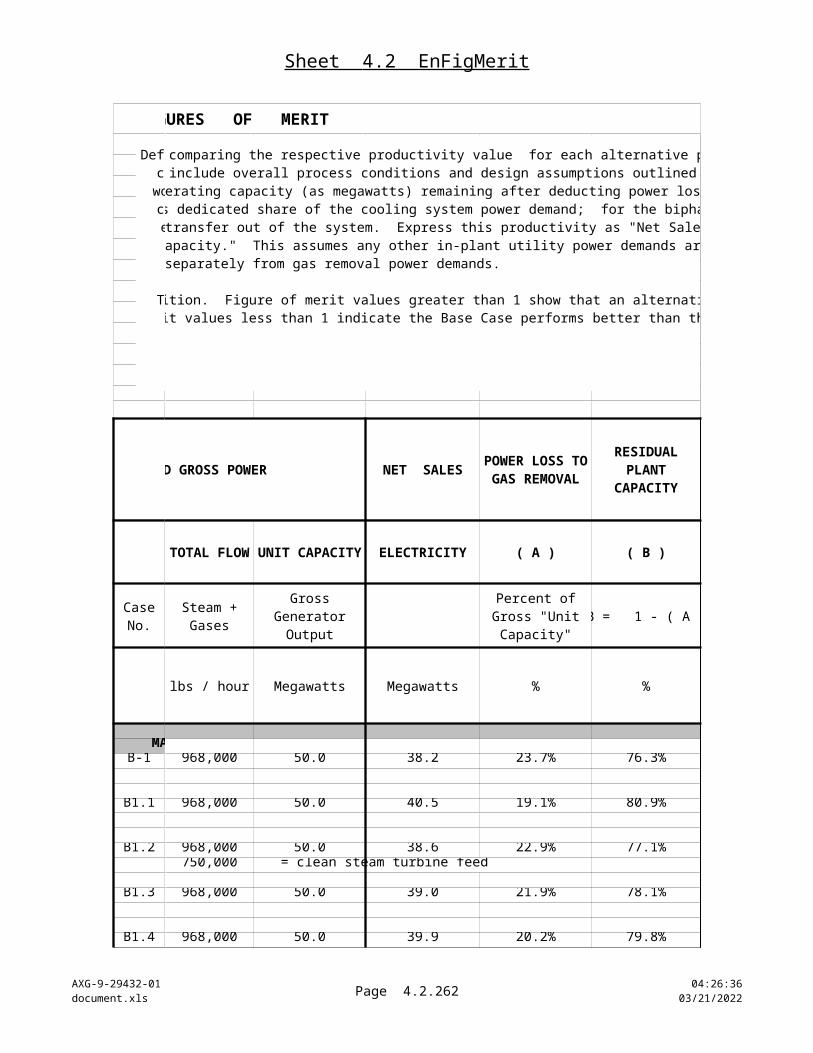
Sheet 4.3 $ FigMerit
AXG-9-29432-01document.xls Page 4.3.262 10:22:25
04/18/2023
$ / year
VALUE OF UNEXPENDED PARASITIC POWER AS A
SALABLE PRODUCT
FIGURE OF
MERIT
Sales value of unexpended
power
PAYOUT PERIOD
"simple payback" (years)
RETURN
MAIN CASE GROUP 7
N/A N/A
$ 1,808,000 107.3
$ 5,708,000 1.0
$ 512,000 6.8
$ 1,016,000 9.9
PLACE HOLDER
MAIN CASE GROUP 8
N/A N/A
$ 884,000 30.5
$ 144,000 86.5
$ (232,000) -6.3
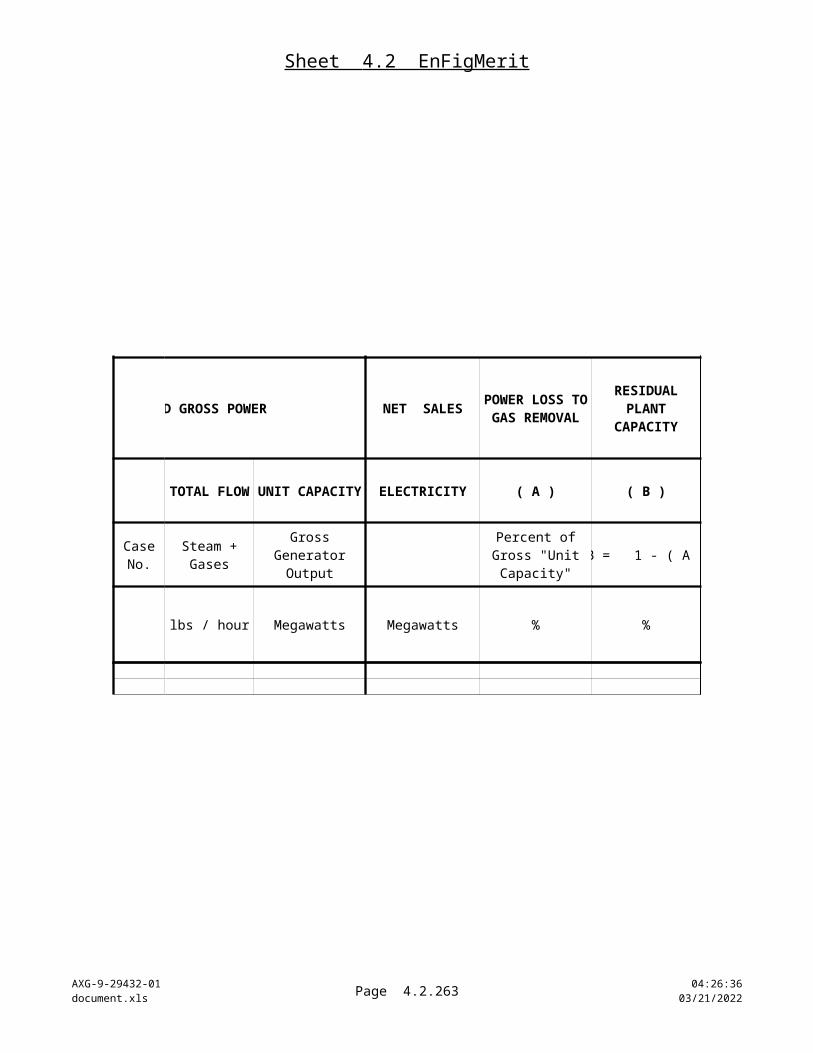
Sheet 4.3 $ FigMerit
AXG-9-29432-01document.xls Page 4.3.263 10:22:25
04/18/2023
$ / year
VALUE OF UNEXPENDED PARASITIC POWER AS A
SALABLE PRODUCT
FIGURE OF
MERIT
Sales value of unexpended
power
PAYOUT PERIOD
"simple payback" (years)
RETURN
$ 680,000 4.5
PLACE HOLDER
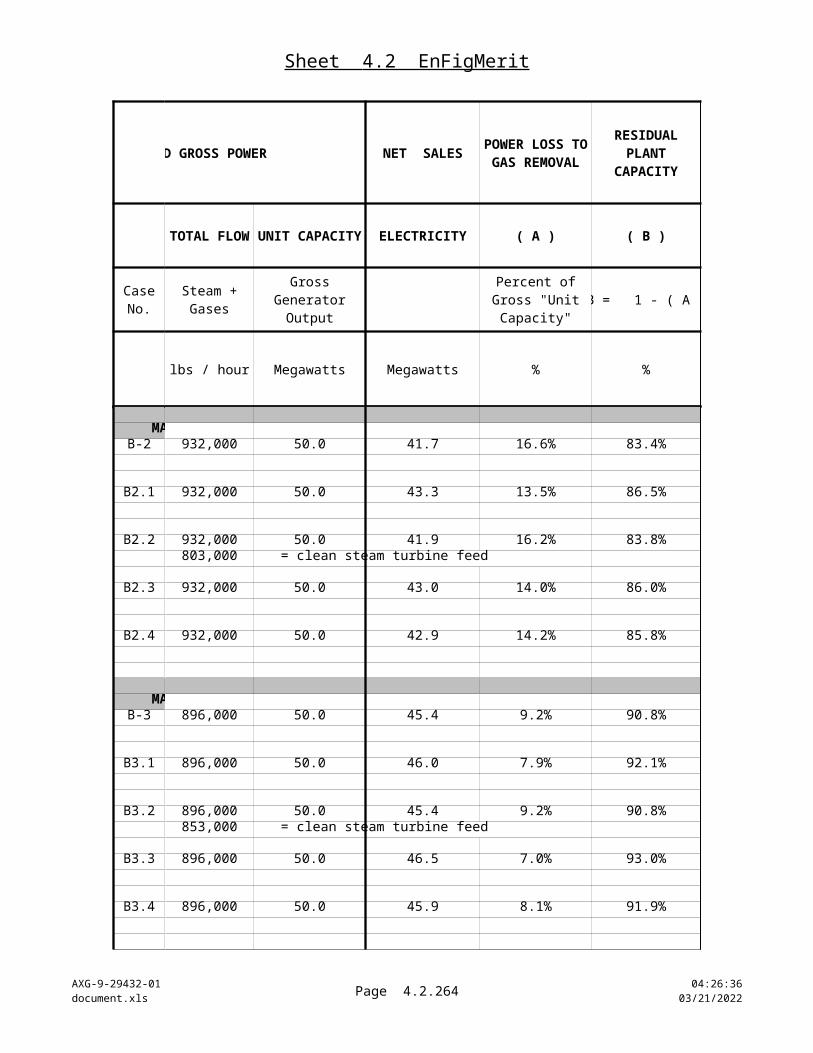
Sheet 4.3 $ FigMerit
AXG-9-29432-01document.xls Page 4.3.264 10:22:25
04/18/2023
$ / year
VALUE OF UNEXPENDED PARASITIC POWER AS A
SALABLE PRODUCT
FIGURE OF
MERIT
Sales value of unexpended
power
PAYOUT PERIOD
"simple payback" (years)
RETURN
LOW EJECTOR EFFICIENCY
SENSITIVITY CASE GROUP S - 1
N/A N/A
$ 1,972,000 2.6
$ 1,360,000 4.4
$ 476,000 6.1
$ 940,000 1.2
PLACE HOLDER
LOW EJECTOR EFFICIENCY
SENSITIVITY CASE GROUP S - 2
N/A N/A
$ 1,424,000 1.5
$ 1,456,000 7.1
$ 364,000 29.1
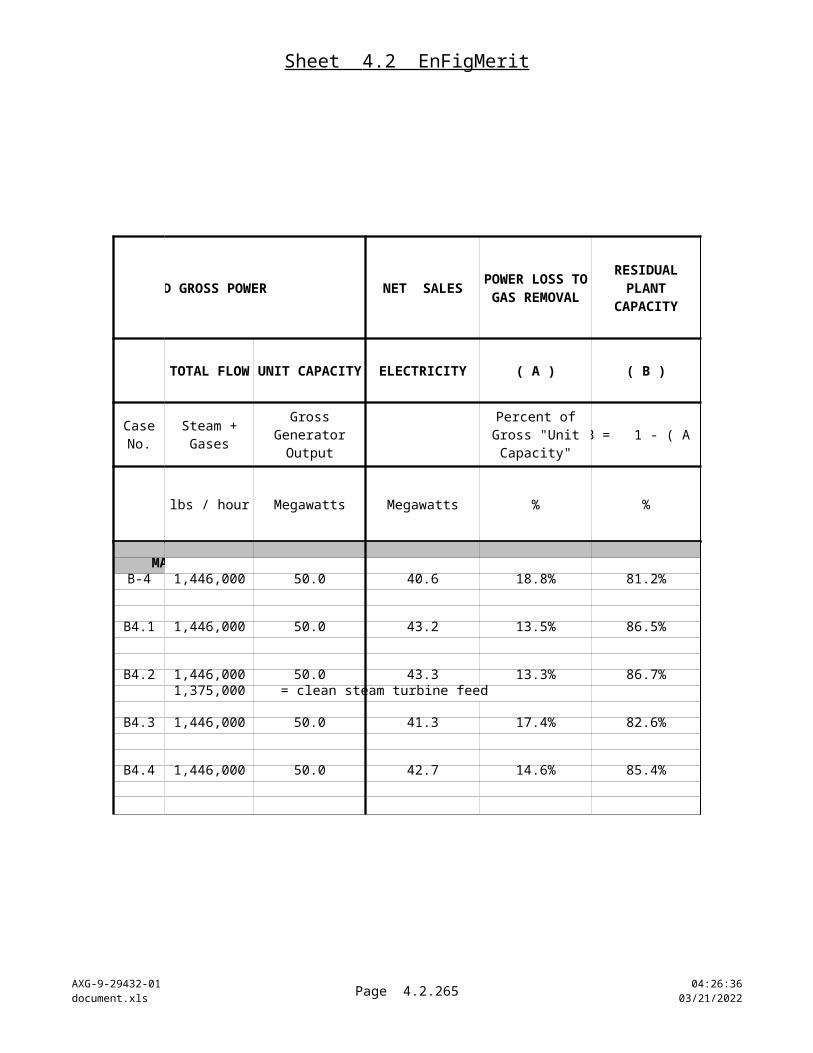
Sheet 4.3 $ FigMerit
AXG-9-29432-01document.xls Page 4.3.265 10:22:25
04/18/2023
$ / year
VALUE OF UNEXPENDED PARASITIC POWER AS A
SALABLE PRODUCT
FIGURE OF
MERIT
Sales value of unexpended
power
PAYOUT PERIOD
"simple payback" (years)
RETURN
$ 920,000 0.6
PLACE HOLDER

Sheet 4.3 $ FigMerit
AXG-9-29432-01document.xls Page 4.3.266 10:22:25
04/18/2023
$ / year
VALUE OF UNEXPENDED PARASITIC POWER AS A
SALABLE PRODUCT
FIGURE OF
MERIT
Sales value of unexpended
power
PAYOUT PERIOD
"simple payback" (years)
RETURN
SENSITIVITY CASE GROUP S - 3
N/A N/A
$ 368,000 11.2
$ (180,000) -14.2
$ 404,000 8.5
$ 280,000 1.9
PLACE HOLDER
SENSITIVITY CASE GROUP S - 4
N/A N/A
$ 576,000 4.8
$ 564,000 43.4
$ 176,000 -77.6
$ 452,000 1.3
80 oF WET BULB TEMPERATURE
80 oF WET BULB TEMPERATURE
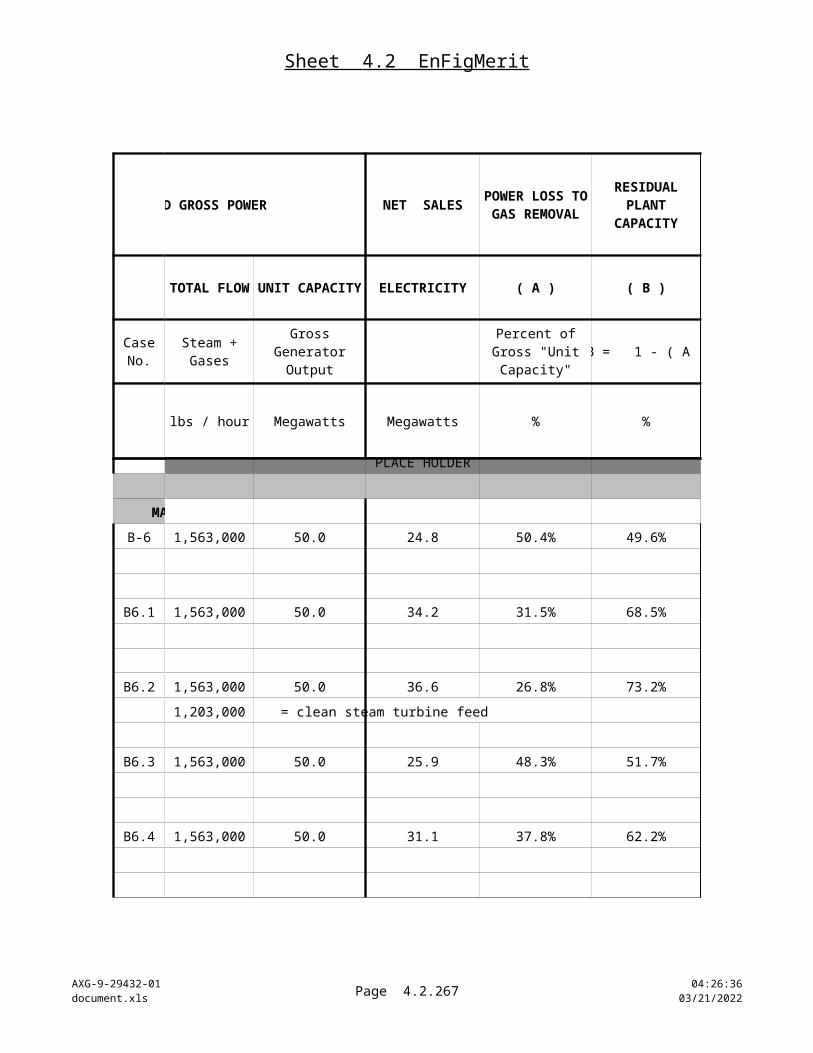
Sheet 4.3 $ FigMerit
AXG-9-29432-01document.xls Page 4.3.267 10:22:25
04/18/2023
$ / year
VALUE OF UNEXPENDED PARASITIC POWER AS A
SALABLE PRODUCT
FIGURE OF
MERIT
Sales value of unexpended
power
PAYOUT PERIOD
"simple payback" (years)
RETURN

4.3a Alt $ FigMerit
AXG-9-29432-01document.xls
Page 4.3a.268 10:22:2504/18/2023
ECONOMIC FIGURE OF MERIT ---- NET PRESENT VALUES
OVERALL PLANT DEFINITION FLASHED STEAM AND GROSS POWER
Case No. Configuration
P = PSIA ppmv
MAIN CASE GROUP 1HIGH TEMPERATURE/PRESSURE AND HIGH GAS CONTENT
B-1 BASE CASE 2,291,000 T = 550 48,800 T 334 49,900 2-stage ejectors P = 1177 P 114
B1.1 ALTERNATIVE A 2,291,000 T = 550 48,800 T 334 49,900 3-stage turbo- P = 1177 P 114compressor
B1.2 ALTERNATIVE B 2,289,000 T = 550 48,800 T 334 49,900 reboiler P = 1177 P 114
B1.3 ALTERNATIVE C 2,291,000 T = 550 48,800 T 334 49,900 biphase eductor P = 1177 P 114
B1.4 ALTERNATIVE D 2,291,000 T = 550 48,800 T 334 49,900 hybrid turbo- P = 1177 P 114compressor
MAIN CASE GROUP 2HIGH TEMPERATURE/PRESSURE AND MID GAS CONTENT
B-2 BASE CASE 2,288,000 T 550 29,000 T 334 29,900 2-stage ejectors P 1,124 P 113
B2.1 ALTERNATIVE A 2,288,000 T 550 29,000 T 334 29,900 3-stage turbo- P 1,124 P 113compressor
B2.2 ALTERNATIVE B 2,287,000 T 550 29,000 T 334 29,900 reboiler P 1,124 P 113
B2.3 ALTERNATIVE C 2,288,000 T 550 29,000 T 334 29,900
GROSS PLANT FEED (combined well flows entering flash to produce steam for a 50 MW turbine/generator)
STEAM PRESSURE AND TEMPERATURE
Combined Brine & Steam Flow
T = oF Combined
Brine & Steam Gas Conc'n.
Flash Condition
s
Gas Content
lbs / hour (at 15% steam
quality)
parts per million by
weight (ppmw) as CO2
oF, PSIA
Define an economic "figure of merit" that allocates dollars as credit for savings in parasitic power losses. Evaluate the credits by calculating the equivalent electrical generating output of the steam and electricity used to run the noncondensable gas removal systems. Assign the "found" generating power a unit value (see worksheet tab 2.2 -- "Bases&Input").
Then calculate the figure of merit value as the net present value for the cost of investing in conversion to an alternative gas removal system. See worksheet 4.3b, Present Values, for the detailed calculation of net present value cash flows. Input defining the financial variables is made in worksheet 2.2, Bases&Input.
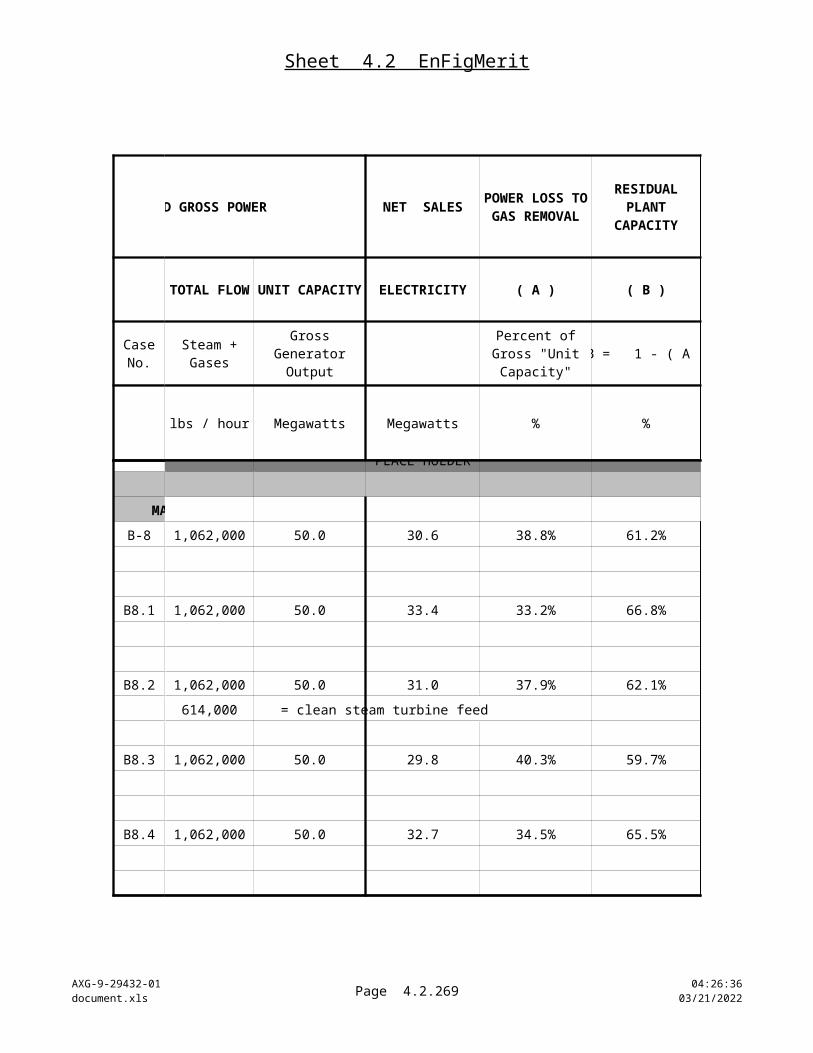
4.3a Alt $ FigMerit
AXG-9-29432-01document.xls
Page 4.3a.269 10:22:2504/18/2023
OVERALL PLANT DEFINITION FLASHED STEAM AND GROSS POWER
Case No. Configuration
P = PSIA ppmv
GROSS PLANT FEED (combined well flows entering flash to produce steam for a 50 MW turbine/generator)
STEAM PRESSURE AND TEMPERATURE
Combined Brine & Steam Flow
T = oF Combined
Brine & Steam Gas Conc'n.
Flash Condition
s
Gas Content
lbs / hour (at 15% steam
quality)
parts per million by
weight (ppmw) as CO2
oF, PSIA
biphase eductor P 1,124 P 113
B2.4 ALTERNATIVE D 2,288,000 T 550 29,000 T 334 29,900 hybrid turbo- P 1,124 P 113compressor
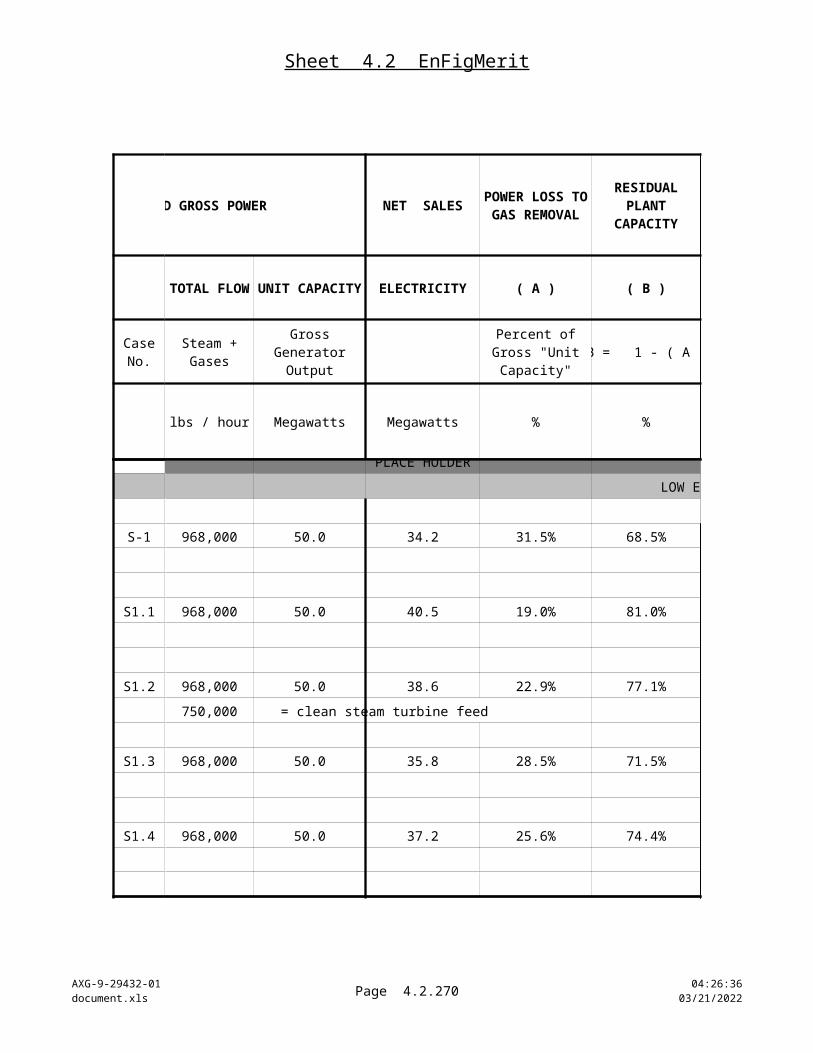
4.3a Alt $ FigMerit
AXG-9-29432-01document.xls
Page 4.3a.270 10:22:2504/18/2023
OVERALL PLANT DEFINITION FLASHED STEAM AND GROSS POWER
Case No. Configuration
P = PSIA ppmv
GROSS PLANT FEED (combined well flows entering flash to produce steam for a 50 MW turbine/generator)
STEAM PRESSURE AND TEMPERATURE
Combined Brine & Steam Flow
T = oF Combined
Brine & Steam Gas Conc'n.
Flash Condition
s
Gas Content
lbs / hour (at 15% steam
quality)
parts per million by
weight (ppmw) as CO2
oF, PSIA
MAIN CASE GROUP 3HIGH TEMPERATURE/PRESSURE AND LOW GAS CONTENT
B-3 BASE CASE 2,284,000 T = 550 9,600 T 335 10,000 2-stage ejectors P = 1072 P 111
B3.1 ALTERNATIVE A 2,284,000 T = 550 9,600 T 335 10,000 3-stage turbo- P = 1072 P 111compressor
B3.2 ALTERNATIVE B 2,284,000 T = 550 9,600 T 335 10,000 reboiler P = 1072 P 111
B3.3 ALTERNATIVE C 2,284,000 T = 550 9,600 T 335 10,000 biphase eductor P = 1072 P 111
B3.4 ALTERNATIVE D 2,284,000 T = 550 9,600 T 335 10,000 hybrid turbo- P = 1072 P 111compressor
MAIN CASE GROUP 4LOW TEMPERATURE/PRESSURE AND LOW GAS CONTENT
B-4 BASE CASE 5,418,000 T 350 6,500 T 235 10,000 2-stage ejectors P 137 P 23
B4.1 ALTERNATIVE A 5,418,000 T 350 6,500 T 235 10,000 3-stage turbo- P 137 P 23compressor
B4.2 ALTERNATIVE B 5,418,000 T 350 6,500 T 235 10,000 reboiler P 137 P 23
B4.3 ALTERNATIVE C 5,418,000 T 350 6,500 T 235 10,000 biphase eductor P 137 P 23
B4.4 ALTERNATIVE D 5,418,000 T 350 6,500 T 235 10,000 hybrid turbo- P 137 P 23compressor
PLACE HOLDER PLACE HOLDER

4.3a Alt $ FigMerit
AXG-9-29432-01document.xls
Page 4.3a.271 10:22:2504/18/2023
OVERALL PLANT DEFINITION FLASHED STEAM AND GROSS POWER
Case No. Configuration
P = PSIA ppmv
GROSS PLANT FEED (combined well flows entering flash to produce steam for a 50 MW turbine/generator)
STEAM PRESSURE AND TEMPERATURE
Combined Brine & Steam Flow
T = oF Combined
Brine & Steam Gas Conc'n.
Flash Condition
s
Gas Content
lbs / hour (at 15% steam
quality)
parts per million by
weight (ppmw) as CO2
oF, PSIA
MAIN CASE GROUP 5LOW TEMPERATURE/PRESSURE AND MID GAS CONTENT
B-5 BASE CASE 5,395,000 T = 350 19,700 T 234 30,100 2-stage ejectors P = 142 P 23
B5.1 ALTERNATIVE A 5,395,000 T = 350 19,700 T 234 30,100 3-stage turbo- P = 142 P 23compressor
B5.2 ALTERNATIVE B 5,391,000 T = 350 19,700 T 234 30,100 reboiler P = 142 P 23
B5.3 ALTERNATIVE C 5,395,000 T = 350 19,700 T 234 30,100 biphase eductor P = 142 P 23
B5.4 ALTERNATIVE D 5,395,000 T = 350 19,700 T 234 30,100 hybrid turbo- P = 142 P 23compressor
PLACE HOLDER PLACE HOLDER
MAIN CASE GROUP 6LOW TEMPERATURE/PRESSURE AND HIGH GAS CONTENT
B-6 BASE CASE 5,365,000 T 350 33,400 T 234 50,100 2-stage ejectors P 146 P 24
B6.1 ALTERNATIVE A 5,365,000 T 350 33,400 T 234 50,100 3-stage turbo- P 146 P 24compressor
B6.2 ALTERNATIVE B 5,354,000 T 350 33,400 T 234 50,100 reboiler P 146 P 24
B6.3 ALTERNATIVE C 5,365,000 T 350 33,400 T 234 50,100 biphase eductor P 146 P 24
B6.4 ALTERNATIVE D 5,365,000 T 350 33,400 T 234 50,100 hybrid turbo- P 146 P 24compressor
PLACE HOLDER PLACE HOLDER

4.3a Alt $ FigMerit
AXG-9-29432-01document.xls
Page 4.3a.272 10:22:2504/18/2023
OVERALL PLANT DEFINITION FLASHED STEAM AND GROSS POWER
Case No. Configuration
P = PSIA ppmv
GROSS PLANT FEED (combined well flows entering flash to produce steam for a 50 MW turbine/generator)
STEAM PRESSURE AND TEMPERATURE
Combined Brine & Steam Flow
T = oF Combined
Brine & Steam Gas Conc'n.
Flash Condition
s
Gas Content
lbs / hour (at 15% steam
quality)
parts per million by
weight (ppmw) as CO2
oF, PSIA
MAIN CASE GROUP 7LOW TEMPERATURE/PRESSURE AND VERY HIGH GAS CONTENT
B-7 BASE CASE 5,201,000 T = 350 108,500 T 232 149,200 2-stage ejectors P = 170 P 25
B7.1 ALTERNATIVE A 5,201,000 T = 350 108,500 T 232 149,200 3-stage turbo- P = 170 P 25compressor
B7.2 ALTERNATIVE B 5,119,000 T = 350 108,500 T 232 149,200 reboiler P = 170 P 25
B7.3 ALTERNATIVE C 5,201,000 T = 350 108,500 T 232 149,200 biphase eductor P = 170 P 25
B7.4 ALTERNATIVE D 5,201,000 T = 350 108,500 T 232 149,200 hybrid turbo- P = 170 P 25compressor
PLACE HOLDER PLACE HOLDER
MAIN CASE GROUP 8HIGH TEMPERATURE/PRESSURE AND VERY HIGH GAS CONTENT
B-8 BASE CASE 2,297,000 T 550 99,700 T 333 99,600 2-stage ejectors P 1,316 P 119
B8.1 ALTERNATIVE A 2,297,000 T 550 99,700 T 333 99,600 3-stage turbo- P 1,316 P 119compressor
B8.2 ALTERNATIVE B 2,289,000 T 550 99,700 T 333 99,600 reboiler P 1,316 P 119
B8.3 ALTERNATIVE C 2,297,000 T 550 99,700 T 333 99,600 biphase eductor P 1,316 P 119
B8.4 ALTERNATIVE D 2,297,000 T 550 99,700 T 333 99,600 hybrid turbo- P 1,316 P 119compressor
PLACE HOLDER PLACE HOLDER

4.3a Alt $ FigMerit
AXG-9-29432-01document.xls
Page 4.3a.273 10:22:2504/18/2023
OVERALL PLANT DEFINITION FLASHED STEAM AND GROSS POWER
Case No. Configuration
P = PSIA ppmv
GROSS PLANT FEED (combined well flows entering flash to produce steam for a 50 MW turbine/generator)
STEAM PRESSURE AND TEMPERATURE
Combined Brine & Steam Flow
T = oF Combined
Brine & Steam Gas Conc'n.
Flash Condition
s
Gas Content
lbs / hour (at 15% steam
quality)
parts per million by
weight (ppmw) as CO2
oF, PSIA
SENSITIVITY CASE GROUP S - 1 LOW STEAM JET EJECTOR EFFICIENCYHIGH TEMPERATURE / HIGH GAS CONTENT
S-1 BASE CASE 2,291,000 T 550 48,800 T 334 49,900 2-stage ejectors P 1,177 P 114
S1.1 ALTERNATIVE A 2,291,000 T 550 48,800 T 334 49,900 3-stage turbo- P 1,177 P 114compressor
S1.2 ALTERNATIVE B 2,289,000 T 550 48,800 T 334 49,900 reboiler P 1,177 P 114
S1.3 ALTERNATIVE C 2,291,000 T 550 48,800 T 334 49,900 biphase eductor P 1,177 P 114
S1.4 ALTERNATIVE D 2,291,000 T 550 48,800 T 334 49,900 hybrid turbo- P 1,177 P 114compressor
PLACE HOLDER PLACE HOLDER
SENSITIVITY CASE GROUP S - 2 LOW STEAM JET EJECTOR EFFICIENCYLOW TEMPERATURE / LOW GAS CONTENT
S-2 BASE CASE 5,418,000 T 350 6,500 T 235 10,100 2-stage ejectors P 137 P 23
S2.1 ALTERNATIVE A 5,418,000 T 350 6,500 T 235 10,100 3-stage turbo- P 137 P 23compressor
S2.2 ALTERNATIVE B 5,418,000 T 350 6,500 T 235 10,100 reboiler P 137 P 23
S2.3 ALTERNATIVE C 5,418,000 T 350 6,500 T 235 10,100 biphase eductor P 137 P 23
S2.4 ALTERNATIVE D 5,418,000 T 350 6,500 T 235 10,100 hybrid turbo- P 137 P 23compressor
PLACE HOLDER PLACE HOLDER
4.3a Alt $ FigMerit
AXG-9-29432-01document.xls
Page 4.3a.274 10:22:2504/18/2023
OVERALL PLANT DEFINITION FLASHED STEAM AND GROSS POWER
Case No. Configuration
P = PSIA ppmv
GROSS PLANT FEED (combined well flows entering flash to produce steam for a 50 MW turbine/generator)
STEAM PRESSURE AND TEMPERATURE
Combined Brine & Steam Flow
T = oF Combined
Brine & Steam Gas Conc'n.
Flash Condition
s
Gas Content
lbs / hour (at 15% steam
quality)
parts per million by
weight (ppmw) as CO2
oF, PSIA
SENSITIVITY CASE GROUP S - 3HIGH TEMPERATURE / MID GAS CONTENT
S-3 BASE CASE 2,505,000 T 550 28,900 T 344 30,400 2-stage ejectors P 1,124 P 128
S3.1 ALTERNATIVE A 2,505,000 T 550 28,900 T 344 30,400 3-stage turbo- P 1,124 P 128compressor
S3.2 ALTERNATIVE B 2,505,000 T 550 28,900 T 344 30,400 reboiler P 1,124 P 128
S3.3 ALTERNATIVE C 2,505,000 T 550 28,900 T 344 30,400 biphase eductor P 1,124 P 128
S3.4 ALTERNATIVE D 2,505,000 T 550 28,900 T 344 30,400 hybrid turbo- P 1,124 P 128compressor
PLACE HOLDER PLACE HOLDER
SENSITIVITY CASE GROUP S - 4LOW TEMPERATURE / LOW GAS CONTENT
S-4 BASE CASE 6,251,000 T 350 6,400 T 244 10,100 2-stage ejectors P 137 P 27
S4.1 ALTERNATIVE A 6,251,000 T 350 6,400 T 244 10,100 3-stage turbo- P 137 P 27compressor
S4.2 ALTERNATIVE B 6,250,000 T 350 6,400 T 244 10,100 reboiler P 137 P 27
S4.3 ALTERNATIVE C 6,251,000 T 350 6,400 T 244 10,100 biphase eductor P 137 P 27
S4.4 ALTERNATIVE D 6,251,000 T 350 6,400 T 244 10,100 hybrid turbo- P 137 P 27compressor
80 oF WET BULB TEMPERATURE
80 oF WET BULB TEMPERATURE
4.3a Alt $ FigMerit
AXG-9-29432-01document.xls
Page 4.3a.275 10:22:2504/18/2023
ECONOMIC FIGURE OF MERIT ---- NET PRESENT VALUES
FLASHED STEAM AND GROSS POWER
TOTAL FLOW ELECTRICITY ( A ) ( B )
ANNUAL O & M
B = 1 - ( A )
lbs / hour Megawatts Megawatts % $ $ / year
Annual ops. hours=
968,000 50.0 38.2 23.7% 76.3% N/A $ 86,900
968,000 50.0 40.5 19.1% 80.9% $ 4,800,000 $ 240,000
968,000 50.0 38.6 22.9% 77.1% $ 5,177,000 $ 259,000 750,000 = clean steam turbine feed
968,000 50.0 39.0 21.9% 78.1% $ 2,228,000 $ 111,000
968,000 50.0 39.9 20.2% 79.8% $ 1,200,000 $ 60,000
932,000 50.0 41.7 16.6% 83.4% N/A $ 62,500
932,000 50.0 43.3 13.5% 86.5% $ 2,400,000 $ 120,000
932,000 50.0 41.9 16.2% 83.8% $ 5,394,000 $ 270,000 803,000 = clean steam turbine feed
932,000 50.0 43.0 14.0% 86.0% $ 2,262,000 $ 113,000
NET SALES POWER
AVAILABLE
POWER LOSS
TO GAS REMOV
AL
NET PLANT PRODUCTIVITY AFTER
"GAS LOSS"
COSTS OF DESIGN ALTERNATIVES
UNIT CAPACIT
YCAPITAL (installed)Steam +
Gases
Gross Generator
Output
Percent of gross
"Unit Capacity"
Define an economic "figure of merit" that allocates dollars as credit for savings in parasitic power losses. Evaluate the credits by calculating the equivalent electrical generating output of the steam and electricity used to run the noncondensable gas removal systems. Assign the "found" generating power a unit value (see worksheet tab 2.2 -- "Bases&Input").
Then calculate the figure of merit value as the net present value for the cost of investing in conversion to an alternative gas removal system. See worksheet 4.3b, Present Values, for the detailed calculation of net present value cash flows. Input defining the financial variables is made in worksheet 2.2, Bases&Input.
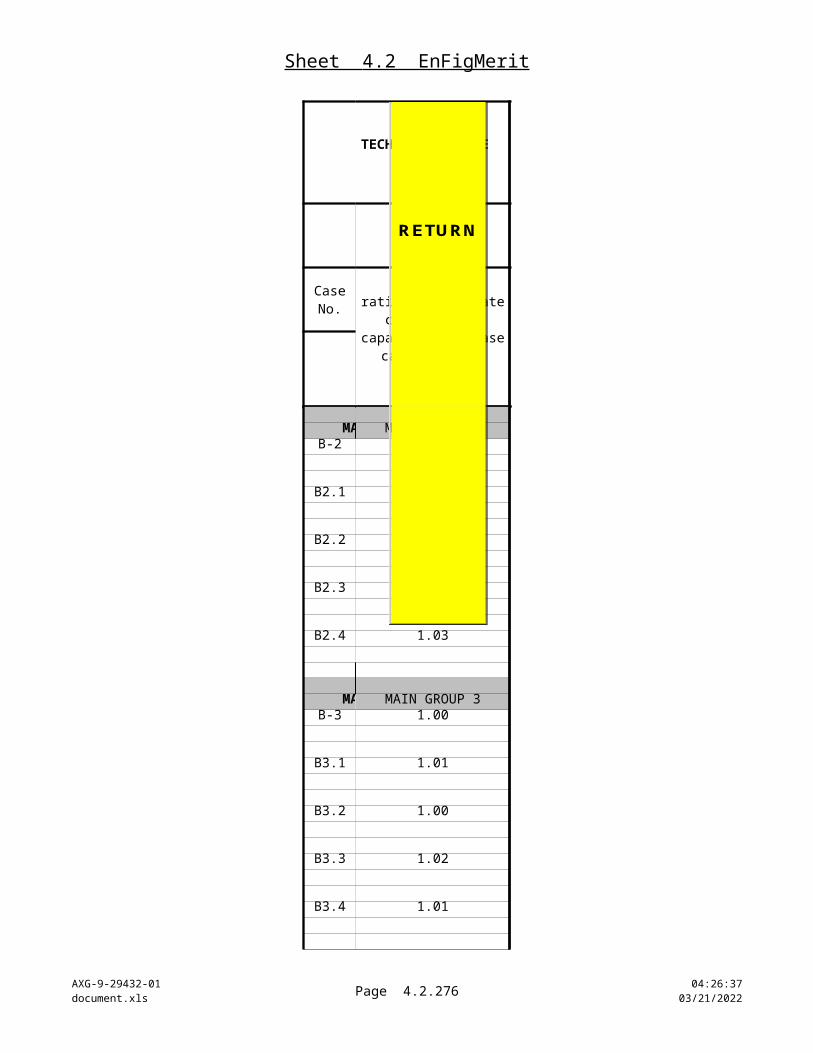
4.3a Alt $ FigMerit
AXG-9-29432-01document.xls
Page 4.3a.276 10:22:2504/18/2023
FLASHED STEAM AND GROSS POWER
TOTAL FLOW ELECTRICITY ( A ) ( B )
ANNUAL O & M
B = 1 - ( A )
lbs / hour Megawatts Megawatts % $ $ / year
Annual ops. hours=
NET SALES POWER
AVAILABLE
POWER LOSS
TO GAS REMOV
AL
NET PLANT PRODUCTIVITY AFTER
"GAS LOSS"
COSTS OF DESIGN ALTERNATIVES
UNIT CAPACIT
YCAPITAL (installed)Steam +
Gases
Gross Generator
Output
Percent of gross
"Unit Capacity"
932,000 50.0 42.9 14.2% 85.8% $ 600,000 $ 30,000
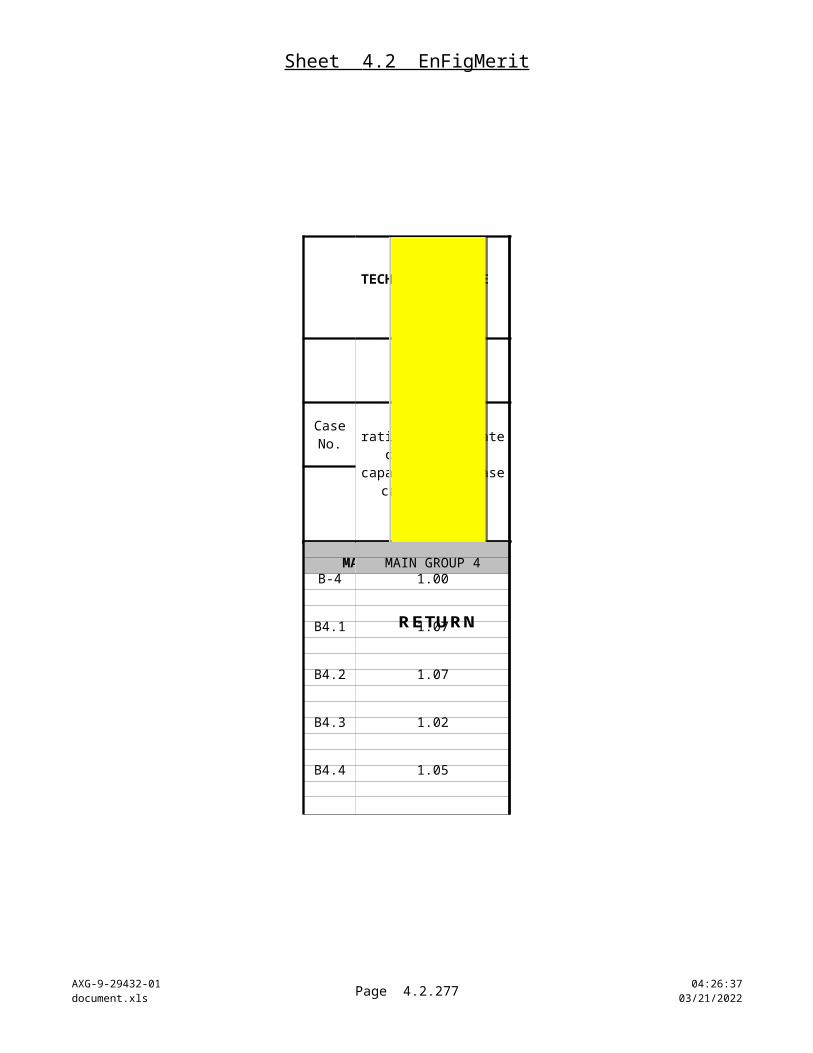
4.3a Alt $ FigMerit
AXG-9-29432-01document.xls
Page 4.3a.277 10:22:2504/18/2023
FLASHED STEAM AND GROSS POWER
TOTAL FLOW ELECTRICITY ( A ) ( B )
ANNUAL O & M
B = 1 - ( A )
lbs / hour Megawatts Megawatts % $ $ / year
Annual ops. hours=
NET SALES POWER
AVAILABLE
POWER LOSS
TO GAS REMOV
AL
NET PLANT PRODUCTIVITY AFTER
"GAS LOSS"
COSTS OF DESIGN ALTERNATIVES
UNIT CAPACIT
YCAPITAL (installed)Steam +
Gases
Gross Generator
Output
Percent of gross
"Unit Capacity"
896,000 50.0 45.4 9.2% 90.8% N/A $ 31,600
896,000 50.0 46.0 7.9% 92.1% $ 1,740,000 $ 87,000
896,000 50.0 45.4 9.2% 90.8% $ 5,593,000 $ 280,000 853,000 = clean steam turbine feed
896,000 50.0 46.5 7.0% 93.0% $ 2,119,000 $ 106,000
896,000 50.0 45.9 8.1% 91.9% $ 300,000 $ 15,000
1,446,000 50.0 40.6 18.8% 81.2% N/A $ 42,200
1,446,000 50.0 43.2 13.5% 86.5% $ 2,040,000 $ 102,000
1,446,000 50.0 43.3 13.3% 86.7% $ 7,812,000 $ 391,000 1,375,000 = clean steam turbine feed
1,446,000 50.0 41.3 17.4% 82.6% $ 4,313,000 $ 216,000
1,446,000 50.0 42.7 14.6% 85.4% $ 600,000 $ 30,000
PLACE HOLDER PLACE HOLDER

4.3a Alt $ FigMerit
AXG-9-29432-01document.xls
Page 4.3a.278 10:22:2504/18/2023
FLASHED STEAM AND GROSS POWER
TOTAL FLOW ELECTRICITY ( A ) ( B )
ANNUAL O & M
B = 1 - ( A )
lbs / hour Megawatts Megawatts % $ $ / year
Annual ops. hours=
NET SALES POWER
AVAILABLE
POWER LOSS
TO GAS REMOV
AL
NET PLANT PRODUCTIVITY AFTER
"GAS LOSS"
COSTS OF DESIGN ALTERNATIVES
UNIT CAPACIT
YCAPITAL (installed)Steam +
Gases
Gross Generator
Output
Percent of gross
"Unit Capacity"
1,505,000 50.0 31.7 36.6% 63.4% N/A $ 83,700
1,505,000 50.0 38.8 22.5% 77.5% $ 4,800,000 $ 240,000
1,505,000 50.0 39.9 20.3% 79.7% $ 7,522,000 $ 376,000 1,291,000 = clean steam turbine feed
1,505,000 50.0 32.8 34.4% 65.6% $ 4,259,000 $ 213,000
1,505,000 50.0 36.8 26.3% 73.7% $ 1,200,000 $ 60,000
PLACE HOLDER PLACE HOLDER
1,563,000 50.0 24.8 50.4% 49.6% N/A $ 116,200
1,563,000 50.0 34.2 31.5% 68.5% $ 9,600,000 $ 480,000
1,563,000 50.0 36.6 26.8% 73.2% $ 7,210,000 $ 361,000 1,203,000 = clean steam turbine feed
1,563,000 50.0 25.9 48.3% 51.7% $ 4,200,000 $ 210,000
1,563,000 50.0 31.1 37.8% 62.2% $ 2,400,000 $ 120,000
PLACE HOLDER PLACE HOLDER

4.3a Alt $ FigMerit
AXG-9-29432-01document.xls
Page 4.3a.279 10:22:2504/18/2023
FLASHED STEAM AND GROSS POWER
TOTAL FLOW ELECTRICITY ( A ) ( B )
ANNUAL O & M
B = 1 - ( A )
lbs / hour Megawatts Megawatts % $ $ / year
Annual ops. hours=
NET SALES POWER
AVAILABLE
POWER LOSS
TO GAS REMOV
AL
NET PLANT PRODUCTIVITY AFTER
"GAS LOSS"
COSTS OF DESIGN ALTERNATIVES
UNIT CAPACIT
YCAPITAL (installed)Steam +
Gases
Gross Generator
Output
Percent of gross
"Unit Capacity"
1,873,000 49.9 5.5 89.0% 11.0% N/A $ 249,200
1,873,000 49.9 11.2 77.5% 22.5% $ 34,680,000 $ 1,734,000
1,873,000 49.9 23.6 52.7% 47.3% $ 5,434,000 $ 272,000 751,000 = clean steam turbine feed
1,873,000 49.9 7.1 85.7% 14.3% $ 3,877,000 $ 194,000
1,873,000 49.9 8.7 82.5% 17.5% $ 8,400,000 $ 420,000
PLACE HOLDER PLACE HOLDER
1,062,000 50.0 30.6 38.8% 61.2% N/A $ 139,100
1,062,000 50.0 33.4 33.2% 66.8% $ 12,360,000 $ 618,000
1,062,000 50.0 31.0 37.9% 62.1% $ 4,592,000 $ 230,000 614,000 = clean steam turbine feed
1,062,000 50.0 29.8 40.3% 59.7% $ 2,137,000 $ 107,000
1,062,000 50.0 32.7 34.5% 65.5% $ 3,000,000 $ 150,000
PLACE HOLDER PLACE HOLDER
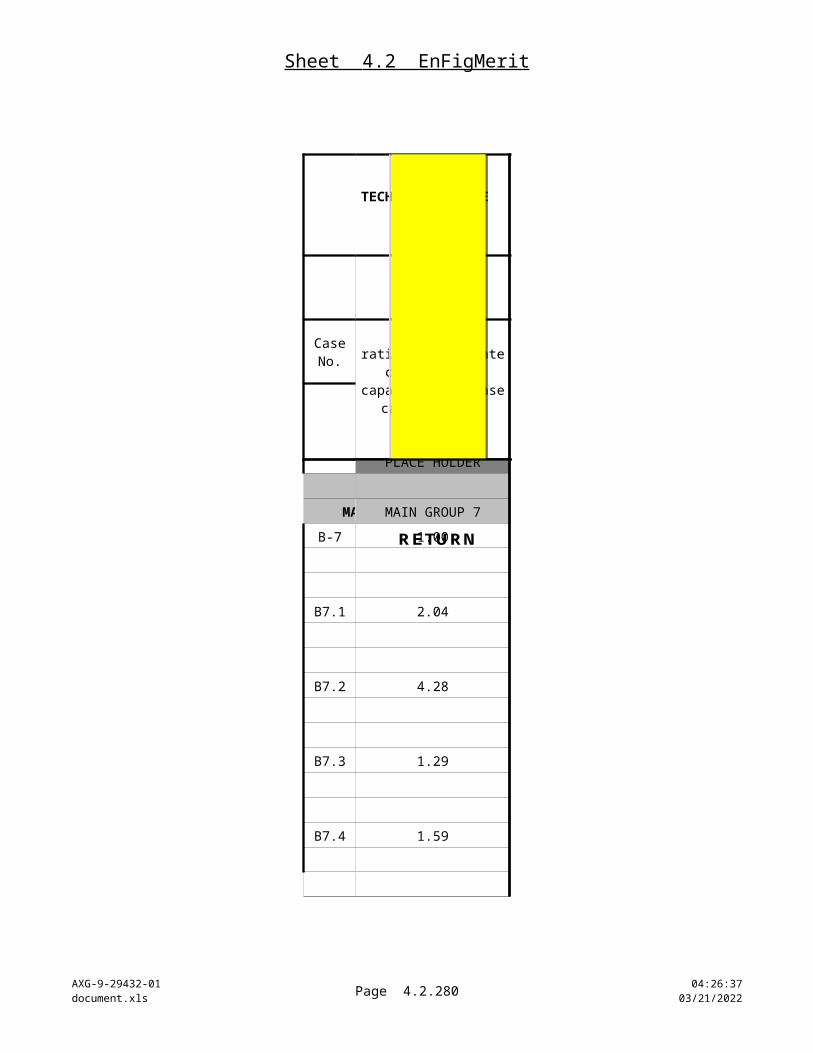
4.3a Alt $ FigMerit
AXG-9-29432-01document.xls
Page 4.3a.280 10:22:2504/18/2023
FLASHED STEAM AND GROSS POWER
TOTAL FLOW ELECTRICITY ( A ) ( B )
ANNUAL O & M
B = 1 - ( A )
lbs / hour Megawatts Megawatts % $ $ / year
Annual ops. hours=
NET SALES POWER
AVAILABLE
POWER LOSS
TO GAS REMOV
AL
NET PLANT PRODUCTIVITY AFTER
"GAS LOSS"
COSTS OF DESIGN ALTERNATIVES
UNIT CAPACIT
YCAPITAL (installed)Steam +
Gases
Gross Generator
Output
Percent of gross
"Unit Capacity"
LOW STEAM JET EJECTOR EFFICIENCY
968,000 50.0 34.2 31.5% 68.5% N/A $ 86,900
968,000 50.0 40.5 19.0% 81.0% $ 4,800,000 $ 240,000
968,000 50.0 38.6 22.9% 77.1% $ 5,177,000 $ 259,000 750,000 = clean steam turbine feed
968,000 50.0 35.8 28.5% 71.5% $ 2,228,000 $ 111,000
968,000 50.0 37.2 25.6% 74.4% $ 1,200,000 $ 60,000
PLACE HOLDER PLACE HOLDER
LOW STEAM JET EJECTOR EFFICIENCY
1,446,000 50.0 38.7 22.6% 77.4% N/A $ 42,400
1,446,000 50.0 43.2 13.5% 86.5% $ 2,040,000 $ 102,000
1,446,000 50.0 43.3 13.3% 86.7% $ 7,812,000 $ 391,000 1,375,000 = clean steam turbine feed
1,446,000 50.0 39.9 20.3% 79.7% $ 4,313,000 $ 216,000
1,446,000 50.0 41.6 16.7% 83.3% $ 600,000 $ 30,000
PLACE HOLDER PLACE HOLDER
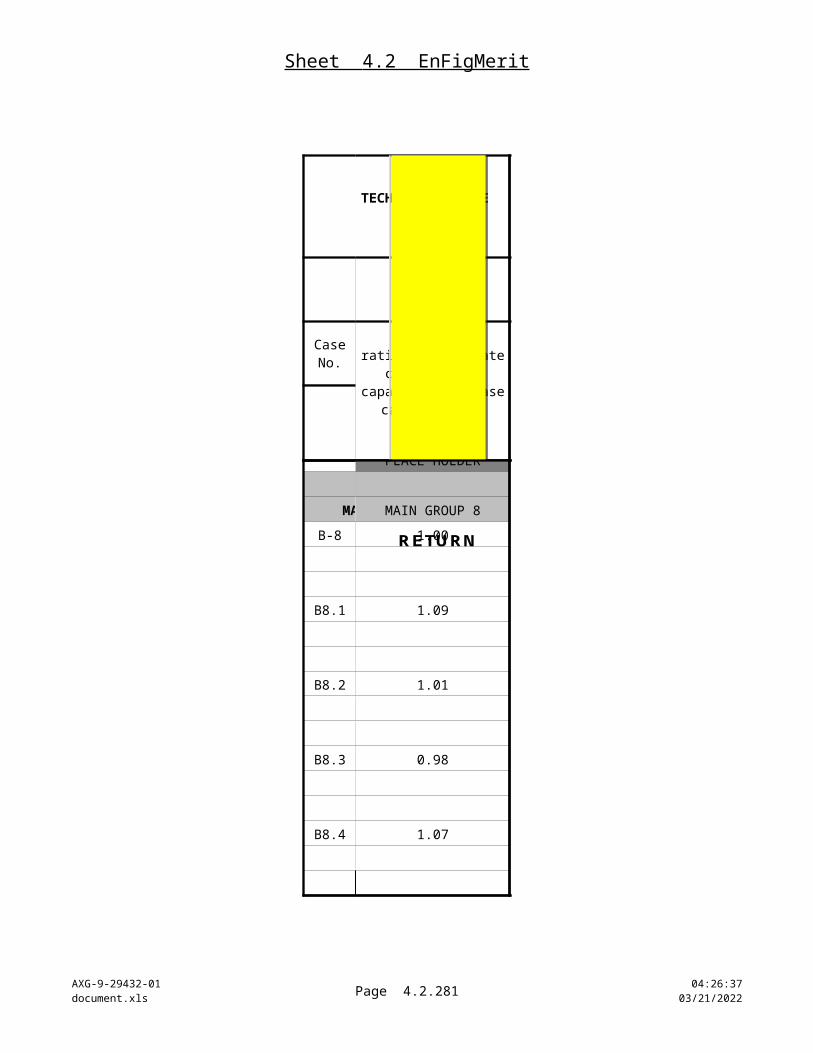
4.3a Alt $ FigMerit
AXG-9-29432-01document.xls
Page 4.3a.281 10:22:2504/18/2023
FLASHED STEAM AND GROSS POWER
TOTAL FLOW ELECTRICITY ( A ) ( B )
ANNUAL O & M
B = 1 - ( A )
lbs / hour Megawatts Megawatts % $ $ / year
Annual ops. hours=
NET SALES POWER
AVAILABLE
POWER LOSS
TO GAS REMOV
AL
NET PLANT PRODUCTIVITY AFTER
"GAS LOSS"
COSTS OF DESIGN ALTERNATIVES
UNIT CAPACIT
YCAPITAL (installed)Steam +
Gases
Gross Generator
Output
Percent of gross
"Unit Capacity"
1,001,000 50.0 42.2 15.6% 84.4% N/A $ 65,900
1,001,000 50.0 43.4 13.3% 86.7% $ 3,120,000 $ 156,000
1,001,000 50.0 41.7 16.7% 83.3% $ 5,620,000 $ 281,000 860,000 = clean steam turbine feed
1,001,000 50.0 43.5 13.0% 87.0% $ 2,407,000 $ 120,000
1,001,000 50.0 43.1 13.8% 86.2% $ 600,000 $ 30,000
PLACE HOLDER PLACE HOLDER
1,615,000 50.0 41.0 18.0% 82.0% N/A $ 45,300
1,615,000 50.0 42.8 14.4% 85.6% $ 2,400,000 $ 120,000
1,615,000 50.0 42.8 14.4% 85.6% $ 8,348,000 $ 417,000 1,536,000 = clean steam turbine feed
1,615,000 50.0 41.5 16.9% 83.1% $ 4,732,000 $ 237,000
1,615,000 50.0 42.4 15.1% 84.9% $ 600,000 $ 30,000
80 oF WET BULB TEMPERATURE
80 oF WET BULB TEMPERATURE

4.3a Alt $ FigMerit
AXG-9-29432-01document.xls
Page 4.3a.282 10:22:2504/18/2023
ECONOMIC FIGURE OF MERIT ---- NET PRESENT VALUES
$ / year
Use an annual on-line "stream Seefactor" of : 90% Worksheet
Annual ops. hours= 7884 4.3bRecovered power valued at : "Present( $ / kWh ) = $ 0.040 Values"
MAIN CASE GROUP 1N/A N/A N/A
18,050,000 $ 722,000 $ (1,540,000)
3,020,000 $ 120,800 $ (4,590,000)
6,890,000 $ 275,600 $ (980,000)
13,660,000 $ 546,400 $ 1,250,000
MAIN CASE GROUP 2N/A N/A N/A
12,600,000 $ 504,000 $ (130,000)
1,700,000 $ 68,000 $ (5,040,000)
10,300,000 $ 412,000 $ (400,000)
VALUE OF UNEXPENDED PARASITIC POWER AS A
SALABLE PRODUCT
ECONOMIC FIGURE OF
MERIT
Net Unexpended Power Available
for Sale
Sales value of unexpended
power
NET PRESENT VALUE
Kilowatt-hours per year
NPV at end of term
Define an economic "figure of merit" that allocates dollars as credit for savings in parasitic power losses. Evaluate the credits by calculating the equivalent electrical generating output of the steam and electricity used to run the noncondensable gas removal systems. Assign the "found" generating power a unit value (see worksheet tab 2.2 -- "Bases&Input").
Then calculate the figure of merit value as the net present value for the cost of investing in conversion to an alternative gas removal system. See worksheet 4.3b, Present Values, for the detailed calculation of net present value cash flows. Input defining the financial variables is made in worksheet 2.2, Bases&Input.
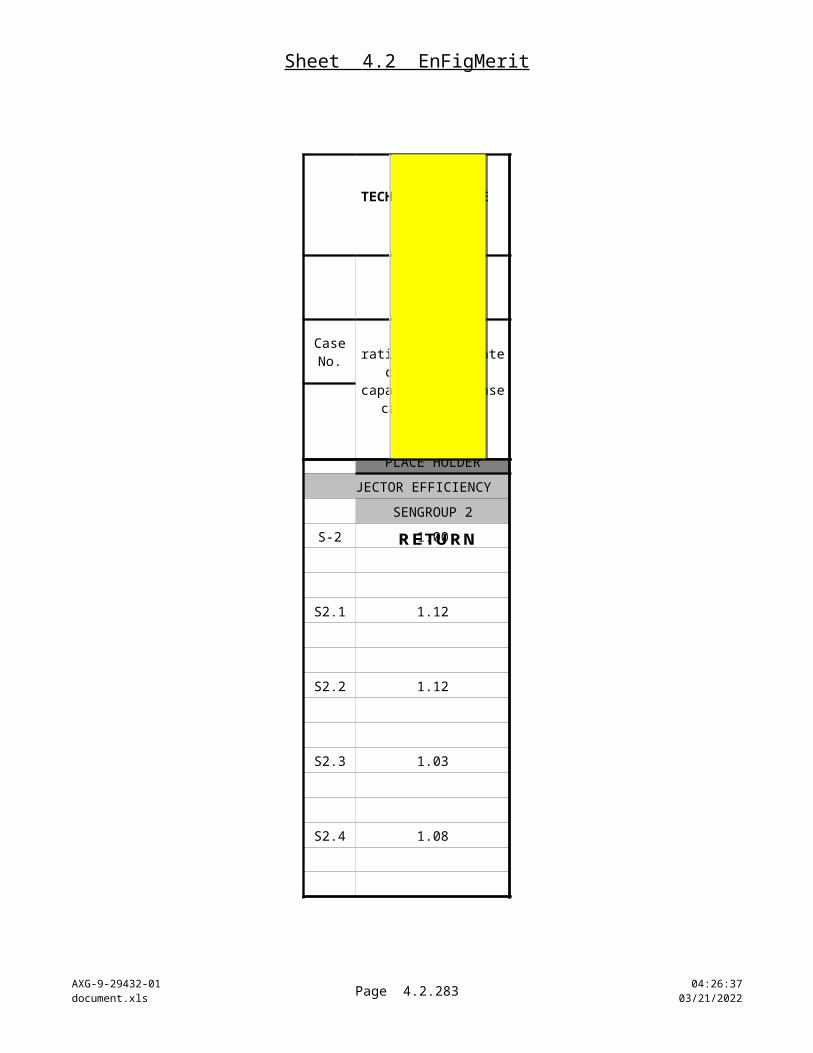
4.3a Alt $ FigMerit
AXG-9-29432-01document.xls
Page 4.3a.283 10:22:2504/18/2023
$ / year
Use an annual on-line "stream Seefactor" of : 90% Worksheet
Annual ops. hours= 7884 4.3bRecovered power valued at : "Present( $ / kWh ) = $ 0.040 Values"
VALUE OF UNEXPENDED PARASITIC POWER AS A
SALABLE PRODUCT
ECONOMIC FIGURE OF
MERIT
Net Unexpended Power Available
for Sale
Sales value of unexpended
power
NET PRESENT VALUE
Kilowatt-hours per year
NPV at end of term
9,500,000 $ 380,000 $ 1,100,000

4.3a Alt $ FigMerit
AXG-9-29432-01document.xls
Page 4.3a.284 10:22:2504/18/2023
$ / year
Use an annual on-line "stream Seefactor" of : 90% Worksheet
Annual ops. hours= 7884 4.3bRecovered power valued at : "Present( $ / kWh ) = $ 0.040 Values"
VALUE OF UNEXPENDED PARASITIC POWER AS A
SALABLE PRODUCT
ECONOMIC FIGURE OF
MERIT
Net Unexpended Power Available
for Sale
Sales value of unexpended
power
NET PRESENT VALUE
Kilowatt-hours per year
NPV at end of term
MAIN CASE GROUP 3N/A N/A N/A
5,200,000 $ 208,000 $ (800,000)
200,000 $ 8,000 $ (5,510,000)
8,700,000 $ 348,000 $ (550,000)
4,500,000 $ 180,000 $ 510,000
MAIN CASE GROUP 4N/A N/A N/A
20,800,000 $ 832,000 $ 1,690,000
21,500,000 $ 860,000 $ (3,910,000)
5,600,000 $ 224,000 $ (3,280,000)
16,500,000 $ 660,000 $ 2,350,000
PLACE HOLDER PLACE HOLDER

4.3a Alt $ FigMerit
AXG-9-29432-01document.xls
Page 4.3a.285 10:22:2504/18/2023
$ / year
Use an annual on-line "stream Seefactor" of : 90% Worksheet
Annual ops. hours= 7884 4.3bRecovered power valued at : "Present( $ / kWh ) = $ 0.040 Values"
VALUE OF UNEXPENDED PARASITIC POWER AS A
SALABLE PRODUCT
ECONOMIC FIGURE OF
MERIT
Net Unexpended Power Available
for Sale
Sales value of unexpended
power
NET PRESENT VALUE
Kilowatt-hours per year
NPV at end of term
MAIN CASE GROUP 5N/A N/A N/A
55,700,000 $ 2,228,000 $ 5,180,000
64,200,000 $ 2,568,000 $ 4,000,000
8,600,000 $ 344,000 $ (2,690,000)
40,500,000 $ 1,620,000 $ 6,040,000
PLACE HOLDER PLACE HOLDER
MAIN CASE GROUP 6N/A N/A N/A
74,300,000 $ 2,972,000 $ 3,740,000
93,000,000 $ 3,720,000 $ 9,440,000
8,400,000 $ 336,000 $ (2,660,000)
49,800,000 $ 1,992,000 $ 6,510,000
PLACE HOLDER PLACE HOLDER
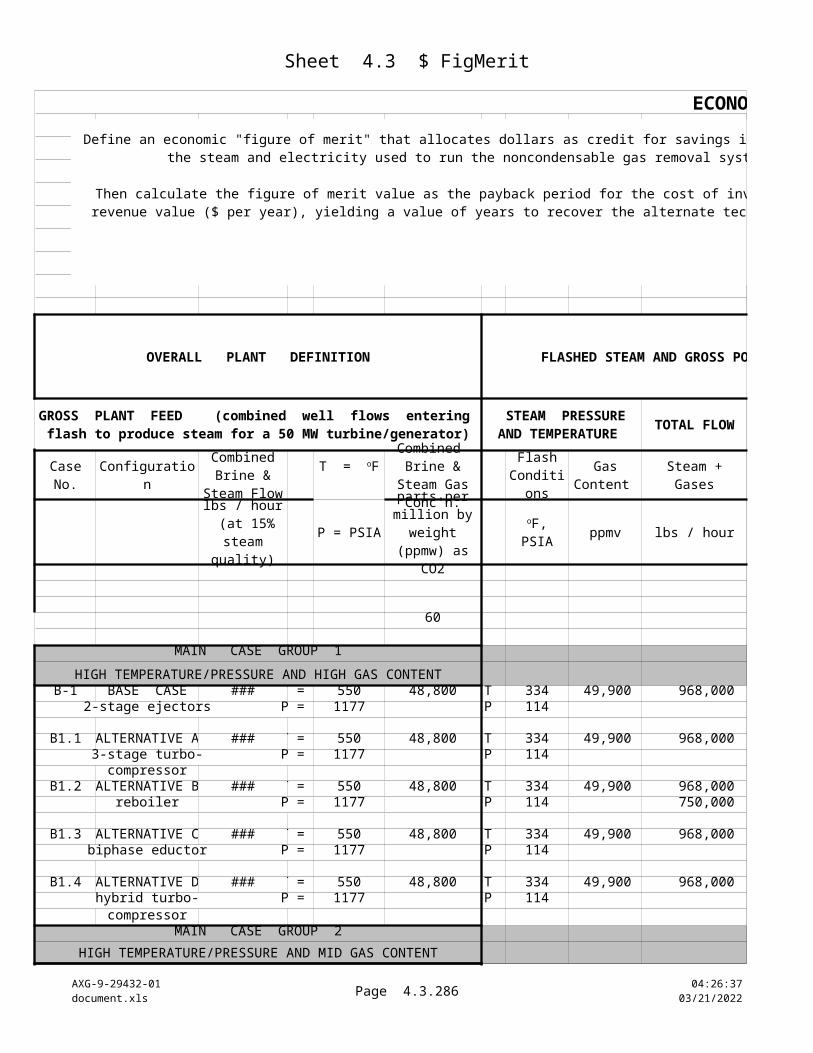
4.3a Alt $ FigMerit
AXG-9-29432-01document.xls
Page 4.3a.286 10:22:2504/18/2023
$ / year
Use an annual on-line "stream Seefactor" of : 90% Worksheet
Annual ops. hours= 7884 4.3bRecovered power valued at : "Present( $ / kWh ) = $ 0.040 Values"
VALUE OF UNEXPENDED PARASITIC POWER AS A
SALABLE PRODUCT
ECONOMIC FIGURE OF
MERIT
Net Unexpended Power Available
for Sale
Sales value of unexpended
power
NET PRESENT VALUE
Kilowatt-hours per year
NPV at end of term
MAIN CASE GROUP 7N/A N/A N/A
45,200,000 $ 1,808,000 $ (26,300,000)
142,700,000 $ 5,708,000 $ 20,070,000
12,800,000 $ 512,000 $ (1,560,000)
25,400,000 $ 1,016,000 $ (3,790,000)
PLACE HOLDER PLACE HOLDER
MAIN CASE GROUP 8N/A N/A N/A
22,100,000 $ 884,000 $ (8,310,000)
3,600,000 $ 144,000 $ (3,910,000)
-5,800,000 $ (232,000) $ (3,150,000)
17,000,000 $ 680,000 $ 60,000
PLACE HOLDER PLACE HOLDER
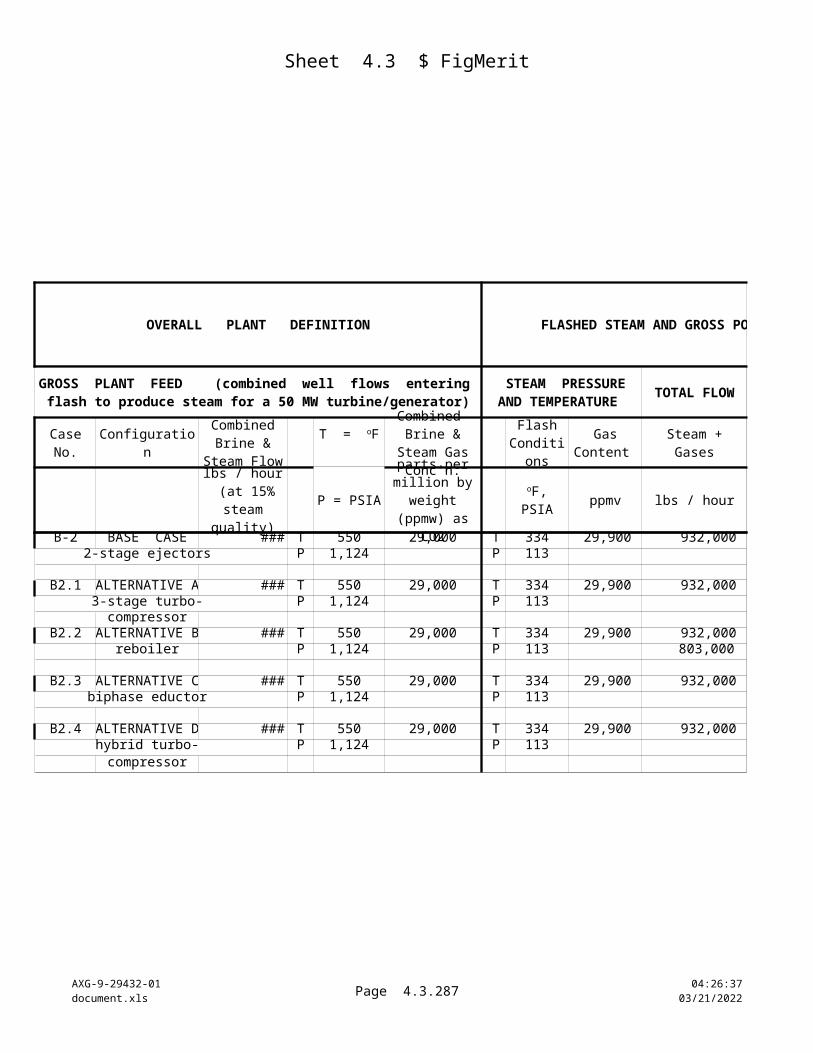
4.3a Alt $ FigMerit
AXG-9-29432-01document.xls
Page 4.3a.287 10:22:2504/18/2023
$ / year
Use an annual on-line "stream Seefactor" of : 90% Worksheet
Annual ops. hours= 7884 4.3bRecovered power valued at : "Present( $ / kWh ) = $ 0.040 Values"
VALUE OF UNEXPENDED PARASITIC POWER AS A
SALABLE PRODUCT
ECONOMIC FIGURE OF
MERIT
Net Unexpended Power Available
for Sale
Sales value of unexpended
power
NET PRESENT VALUE
Kilowatt-hours per year
NPV at end of term
LOW EJECTOR EFFICIENCYSENSITIVITY CASE GROUP S - 1
N/A N/A N/APAYBACKPERIODS
49,300,000 $ 1,972,000 2.6
34,000,000 $ 1,360,000 4.4
11,900,000 $ 476,000 6.1
23,500,000 $ 940,000 1.2
PLACE HOLDER PLACE HOLDER
LOW EJECTOR EFFICIENCYSENSITIVITY CASE GROUP S - 2
N/A N/A N/APAYBACKPERIODS
35,600,000 $ 1,424,000 1.5
36,400,000 $ 1,456,000 7.1
9,100,000 $ 364,000 29.1
23,000,000 $ 920,000 0.6
PLACE HOLDER PLACE HOLDER
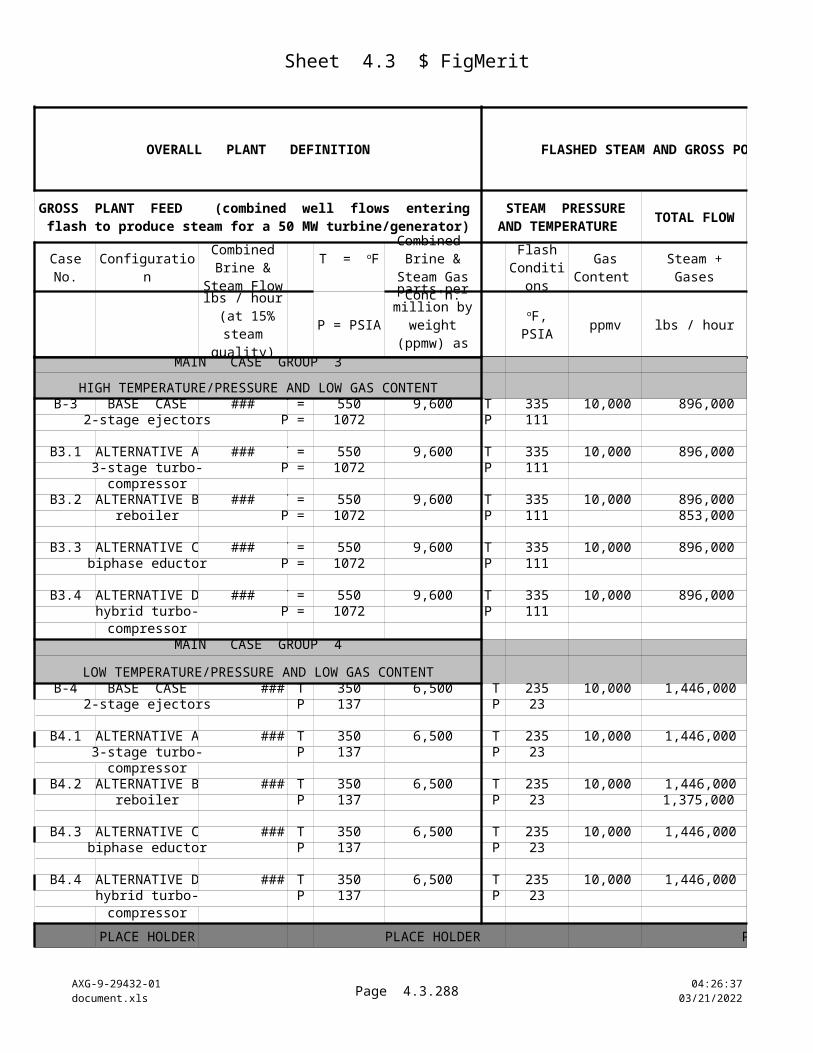
4.3a Alt $ FigMerit
AXG-9-29432-01document.xls
Page 4.3a.288 10:22:2504/18/2023
$ / year
Use an annual on-line "stream Seefactor" of : 90% Worksheet
Annual ops. hours= 7884 4.3bRecovered power valued at : "Present( $ / kWh ) = $ 0.040 Values"
VALUE OF UNEXPENDED PARASITIC POWER AS A
SALABLE PRODUCT
ECONOMIC FIGURE OF
MERIT
Net Unexpended Power Available
for Sale
Sales value of unexpended
power
NET PRESENT VALUE
Kilowatt-hours per year
NPV at end of term
SENSITIVITY CASE GROUP S - 3N/A N/A N/A
PAYBACKPERIODS
9,200,000 $ 368,000 11.2
-4,500,000 $ (180,000) -14.2
10,100,000 $ 404,000 8.5
7,000,000 $ 280,000 1.9
PLACE HOLDER PLACE HOLDER
SENSITIVITY CASE GROUP S - 4N/A N/A N/A
PAYBACKPERIODS
14,400,000 $ 576,000 4.8
14,100,000 $ 564,000 43.4
4,400,000 $ 176,000 -77.6
11,300,000 $ 452,000 1.3
80 oF WET BULB TEMPERATURE
80 oF WET BULB TEMPERATURE
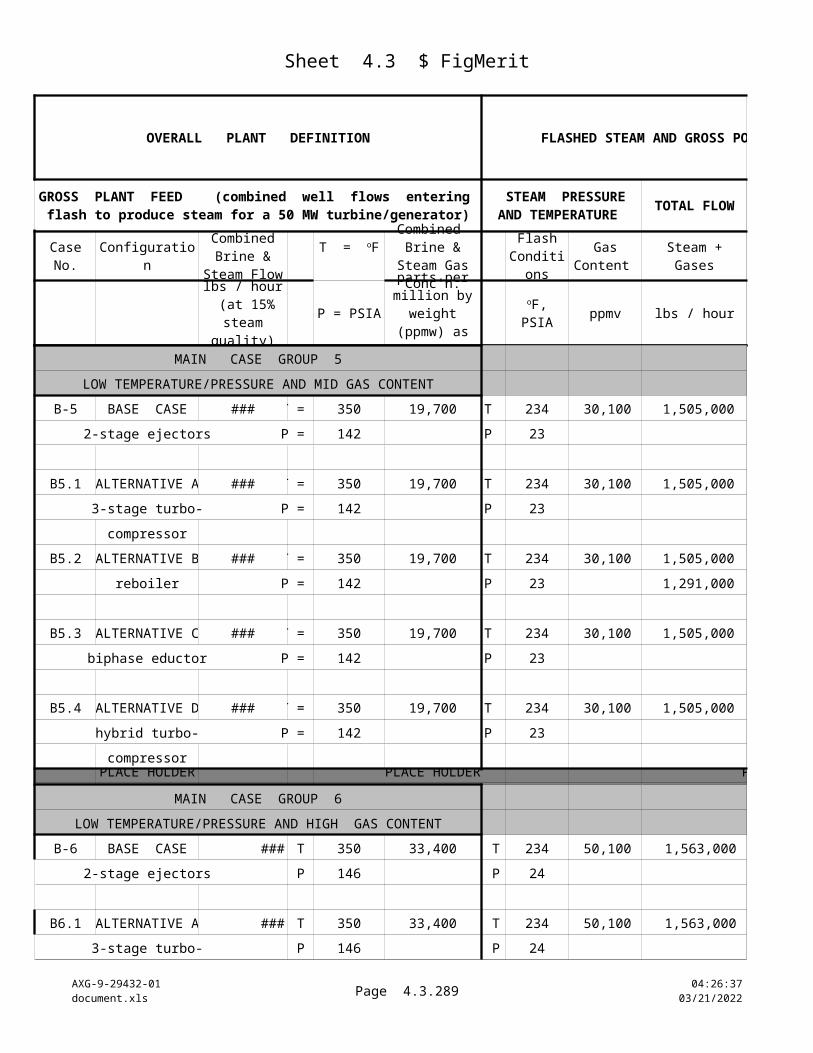
4.3b Present Values
AXG-9-20432-01document.xls
Page 4.3b.289 10:22:2504/18/2023
CALCULATIONS OF NET PRESENT VALUES OF THE ALTERNATIVE GAS REMOVAL SYSTEMS
NOTE : DEFINING VALUES OF THESE DATA ARE SET IN WORKSHEET 2.2, "INPUT&BASES"Valuation Periods : Analysis Term = 10 years (15 max.) Depreciation Term =
Annual Rates : Nominal Discount Rate = 10.00% en.Inflation Rate = 2.00%Real Discount Rate (Nom. Discount Rate / Gen. Inflation Rate) = 7.84% To correct Depreciation apply: 1 + Inflation =
For NPV factors apply (1+Real Discount Rate) = 1.0784 lvage Values = (see sheet 2.2 -- specific to each technology)
Electricity Price Inflation : 2.0% Electricity Price Inflation Compensation :
This worksheet calculates the present worth values of the gas removal system alternatives, using the performance data calculated in the engineering and economic figure of merit worksheets. The values of the controlling bases for these calculations are entered in worksheet 2.2, Bases&Input. These calculations use constant-dollar values, correcting the depreciation values and nominal interest (capital discount) rates for general market inflation. This adjusts the future years' net revenue values for the assigned capital discount rate. This spreadsheet allows the user to specify a separate inflation (deflation) rate for the contract price of electricity, which is realistic in today's markets. The difference between general and price-of-electricity inflation rates is compensated in the net present value (NPV) calculations.
Based on guidelines listed in the NREL publication, "A Manual for the Economic Evaluation of Energy Efficiency and Renewable Energy Technologies," (Short, Packey, Holt, 1995), this evaluation accommodates:
- user-selected values of annual capital discount rate, general inflation rate, standalone inflation rates on electricity prices, and tax rates.- taxes as a percent of net revenue after expenses are deducted.- cash flow analysis terms up to 15 years.- depreciation terms up to 12 years.- only straight-line depreciation.
The following operating cost variables can be assigned discretely for each gas removal technology:
- variable "O&M" costs as a percent of fixed capital costs for the alternative gas removal systems.- variable pre-tax expenses for salvage value and other general expenses as percents of capital costs or revenues.- pre-tax labor charges (which would usually be applied in lieu of a labor component in O&M charges).
The net present value of each gas removal option is calculated by balancing the values of installation capital costs and various operating costs versus the revenues attributable to that option. These calculations are based on each technology's specific performance at the plant conditions cited in worksheet 4.1, "Ops Details." The revenues for each option result from the energy savings (or deficit) that a gas removal option achieves compared to the Base Case plant configuration (in the original spreadsheet format the Base Case configuration is a two-stage steam jet ejector system -- the use can change that configuration). These revenues must pay for the installation and operating costs -- if not, the NPV results remain negative indefinitely.
The user can substitute different values of the controlling financial variables shown in Worksheet 2.2 (Bases&Input), such that the economic analyses can approximate a wide range of world electrical power market circumstances. This methodology is general but realistic in its form, and the uniform application of the method gives a good comparison of the relative economic merits of the gas removal alternatives.
As the calculations below are configured at delivery to the National Renewable Energy Laboratory, the economics account for retrofit conversions from a conventional steam jet ejector gas removal systems to one of the alternatives. The conversion is based on supporting a defined power plant capacity of 50 Megawatts. This worksheet can be modified easily to evaluate the alternative technologies as original construction options in lieu of steam jets. This may be done by reducing the capital costs of the alternatives by the cost of installation of a steam jet ejector configuration for the defined power plant capacity.
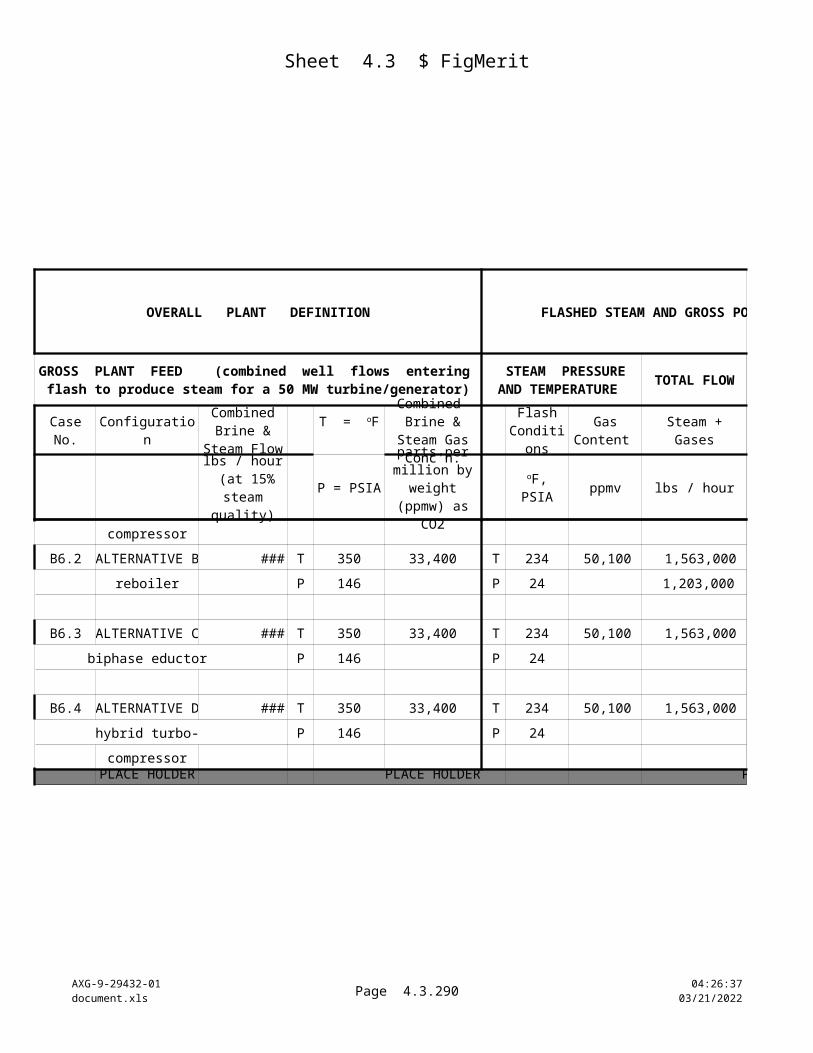
4.3b Present Values
AXG-9-20432-01document.xls
Page 4.3b.290 10:22:2504/18/2023
ONE - TIME RECURRING ANNUAL COSTSCOST
CASE LABEL & ID YEAR 0 CONSTANT-DOLLAR VALUES
Revenues O & M Costs
$ / year $ / year $ / year
(a) (b) (c) (d) = b + c + dincome cost cost cost cost worksheet 2.2)
MAIN CASE GROUP 1HIGH TEMPERATURE/PRESSURE AND HIGH GAS CONTENT
B1.1 ALTERNATIVE A $ 4,800,000 $ 722,000 $ 240,000 - $ - $ - $ 240,000 3-stage turbo-compressor
B1.2 ALTERNATIVE B $ 5,177,000 $ 120,800 $ 259,000 - $ - $ - $ 259,000 reboiler
B1.3 ALTERNATIVE C $ 2,228,000 $ 275,600 $ 111,000 - $ - $ - $ 111,000 biphase eductor
B1.4 ALTERNATIVE D $ 1,200,000 $ 546,400 $ 60,000 - $ - $ - $ 60,000 hybrid turbo-compressor
MAIN CASE GROUP 2HIGH TEMPERATURE/PRESSURE AND MID GAS CONTENT
B2.1 ALTERNATIVE A $ 2,400,000 $ 504,000 $ 120,000 - $ - $ - $ 120,000 3-stage turbo-compressor
B2.2 ALTERNATIVE B $ 5,394,000 $ 68,000 $ 270,000 - $ - $ - $ 270,000 reboiler
B2.3 ALTERNATIVE C $ 2,262,000 $ 412,000 $ 113,000 - $ - $ - $ 113,000 biphase eductor
B2.4 ALTERNATIVE D $ 600,000 $ 380,000 $ 30,000 - $ - $ - $ 30,000 hybrid turbo-compressor
Installation Capital Costs
Labor Allocatio
n
Labor Costs
General Expense
s Net Costs Before
Depreciation
Equivalent
Personnel per
System
$ / year
Estimated Fixed Price
value of saved energy
% of fixed capital
% of revenue
s
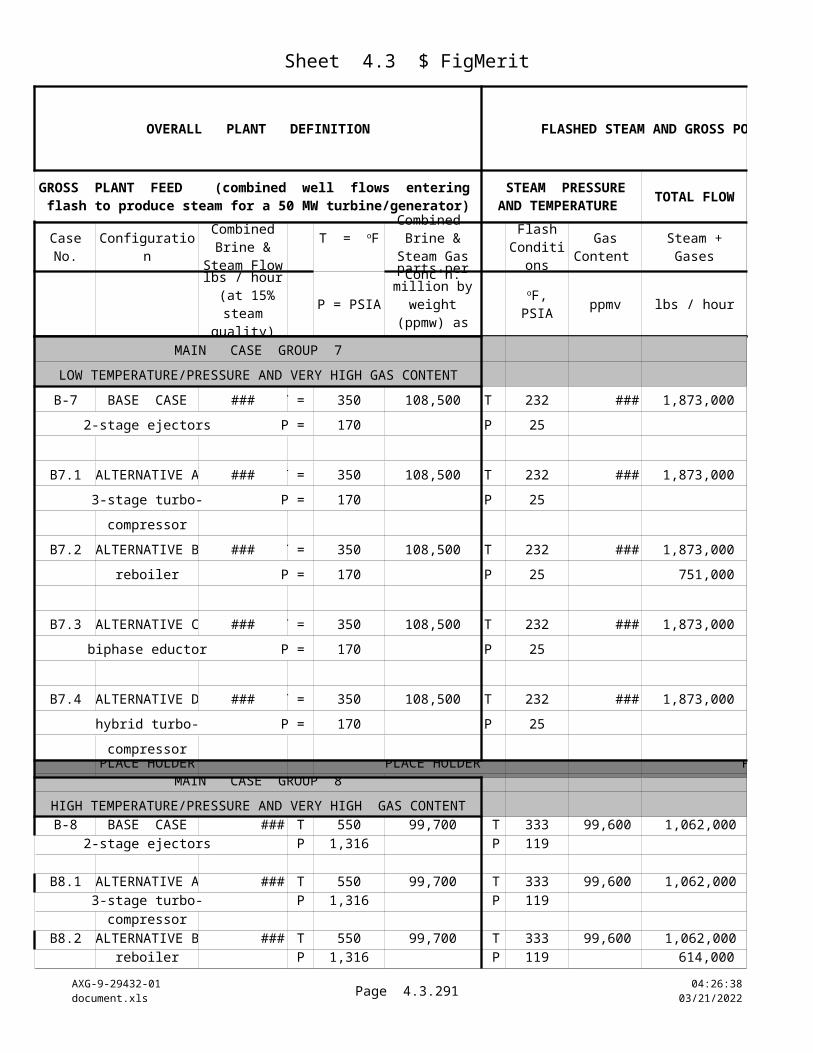
4.3b Present Values
AXG-9-20432-01document.xls
Page 4.3b.291 10:22:2504/18/2023
ONE - TIME RECURRING ANNUAL COSTSCOST
CASE LABEL & ID YEAR 0 CONSTANT-DOLLAR VALUES
Revenues O & M Costs
$ / year $ / year $ / year
(a) (b) (c) (d) = b + c + dincome cost cost cost cost worksheet 2.2)
Installation Capital Costs
Labor Allocatio
n
Labor Costs
General Expense
s Net Costs Before
Depreciation
Equivalent
Personnel per
System
$ / year
Estimated Fixed Price
value of saved energy
% of fixed capital
% of revenue
s
MAIN CASE GROUP 3HIGH TEMPERATURE/PRESSURE AND LOW GAS CONTENT
B3.1 ALTERNATIVE A $ 1,740,000 $ 208,000 $ 87,000 - $ - $ - $ 87,000 3-stage turbo-compressor
B3.2 ALTERNATIVE B $ 5,593,000 $ 8,000 $ 280,000 - $ - $ - $ 280,000 reboiler
B3.3 ALTERNATIVE C $ 2,119,000 $ 348,000 $ 106,000 - $ - $ - $ 106,000 biphase eductor
B3.4 ALTERNATIVE D $ 300,000 $ 180,000 $ 15,000 - $ - $ - $ 15,000 hybrid turbo-compressor
MAIN CASE GROUP 4LOW TEMPERATURE/PRESSURE AND LOW GAS CONTENT
B4.1 ALTERNATIVE A $ 2,040,000 $ 832,000 $ 102,000 - $ - $ - $ 102,000 3-stage turbo-compressor
B4.2 ALTERNATIVE B $ 7,812,000 $ 860,000 $ 391,000 - $ - $ - $ 391,000 reboiler
B4.3 ALTERNATIVE C $ 4,313,000 $ 224,000 $ 216,000 - $ - $ - $ 216,000 biphase eductor
B4.4 ALTERNATIVE D $ 600,000 $ 660,000 $ 30,000 - $ - $ - $ 30,000 hybrid turbo-compressor
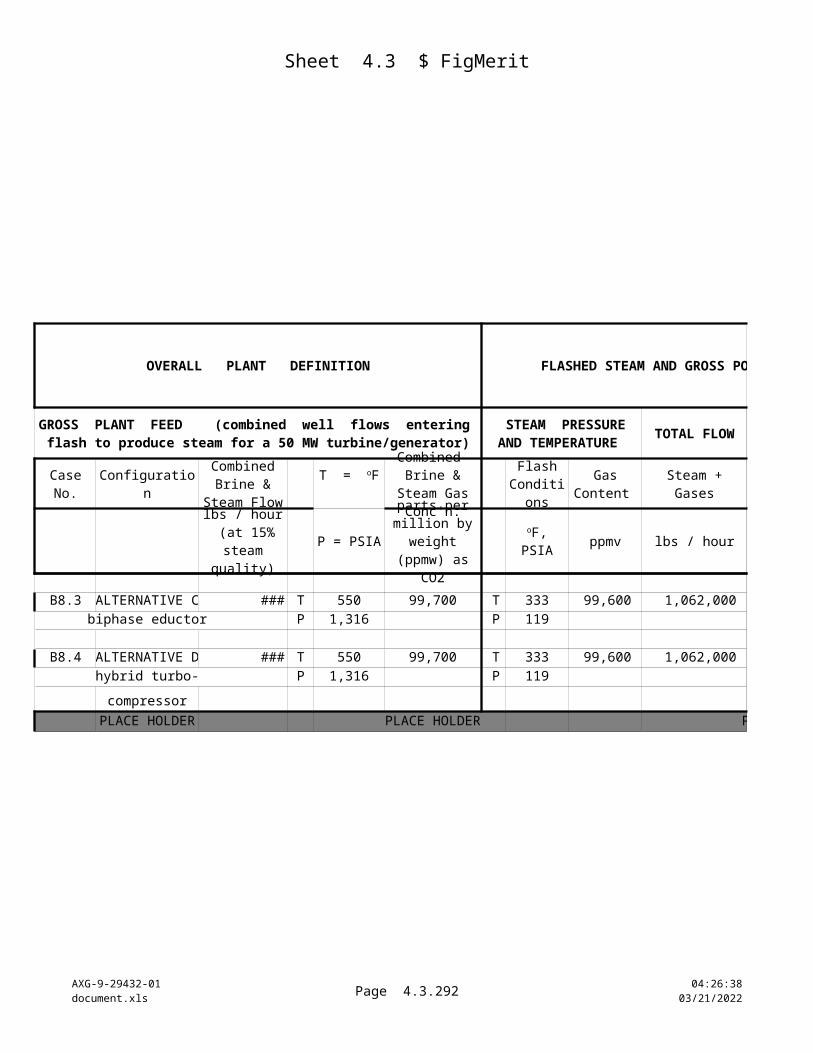
4.3b Present Values
AXG-9-20432-01document.xls
Page 4.3b.292 10:22:2504/18/2023
ONE - TIME RECURRING ANNUAL COSTSCOST
CASE LABEL & ID YEAR 0 CONSTANT-DOLLAR VALUES
Revenues O & M Costs
$ / year $ / year $ / year
(a) (b) (c) (d) = b + c + dincome cost cost cost cost worksheet 2.2)
Installation Capital Costs
Labor Allocatio
n
Labor Costs
General Expense
s Net Costs Before
Depreciation
Equivalent
Personnel per
System
$ / year
Estimated Fixed Price
value of saved energy
% of fixed capital
% of revenue
s
MAIN CASE GROUP 5LOW TEMPERATURE/PRESSURE AND MID GAS CONTENT
B5.1 ALTERNATIVE A $ 4,800,000 $ 2,228,000 $ 240,000 - $ - $ - $ 240,000 3-stage turbo-compressor
B5.2 ALTERNATIVE B $ 7,522,000 $ 2,568,000 $ 376,000 - $ - $ - $ 376,000 reboiler
B5.3 ALTERNATIVE C $ 4,259,000 $ 344,000 $ 213,000 - $ - $ - $ 213,000 biphase eductor
B5.4 ALTERNATIVE D $ 1,200,000 $ 1,620,000 $ 60,000 - $ - $ - $ 60,000 hybrid turbo-compressor
MAIN CASE GROUP 6LOW TEMPERATURE/PRESSURE AND HIGH GAS CONTENT
B6.1 ALTERNATIVE A $ 9,600,000 $ 2,972,000 $ 480,000 - $ - $ - $ 480,000 3-stage turbo-compressor
B6.2 ALTERNATIVE B $ 7,210,000 $ 3,720,000 $ 361,000 - $ - $ - $ 361,000 reboiler
B6.3 ALTERNATIVE C $ 4,200,000 $ 336,000 $ 210,000 - $ - $ - $ 210,000 biphase eductor
B6.4 ALTERNATIVE D $ 2,400,000 $ 1,992,000 $ 120,000 - $ - $ - $ 120,000 hybrid turbo-compressor
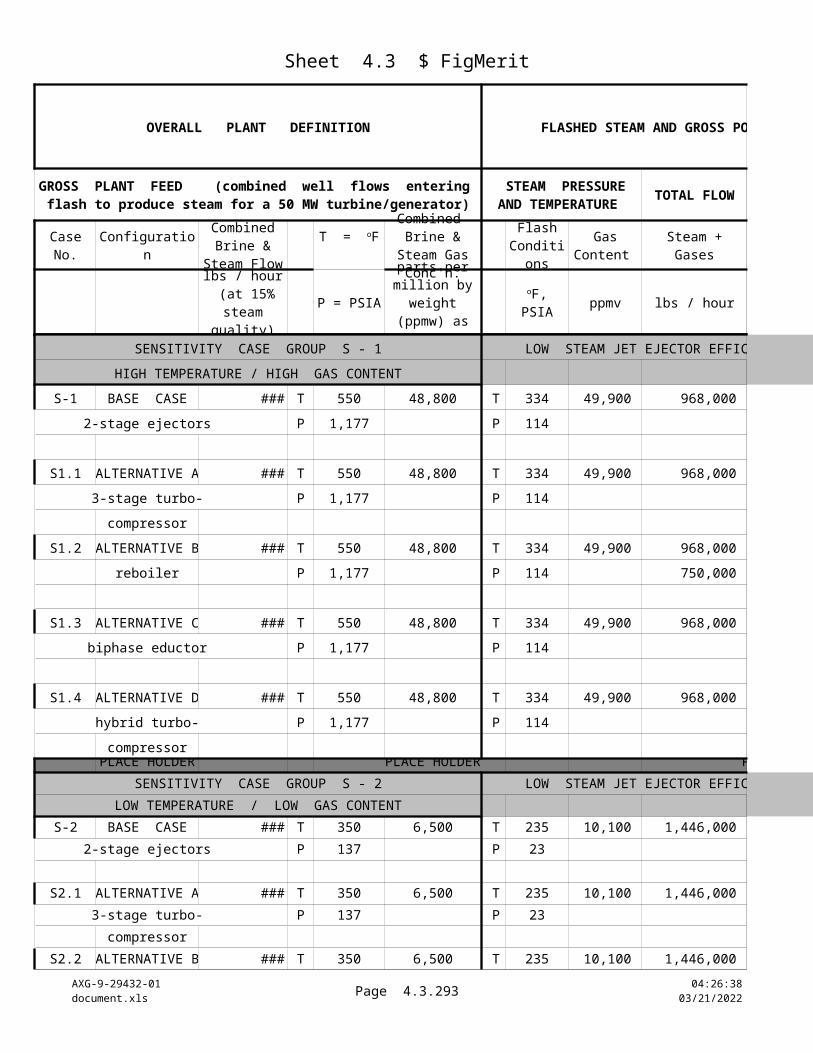
4.3b Present Values
AXG-9-20432-01document.xls
Page 4.3b.293 10:22:2504/18/2023
ONE - TIME RECURRING ANNUAL COSTSCOST
CASE LABEL & ID YEAR 0 CONSTANT-DOLLAR VALUES
Revenues O & M Costs
$ / year $ / year $ / year
(a) (b) (c) (d) = b + c + dincome cost cost cost cost worksheet 2.2)
Installation Capital Costs
Labor Allocatio
n
Labor Costs
General Expense
s Net Costs Before
Depreciation
Equivalent
Personnel per
System
$ / year
Estimated Fixed Price
value of saved energy
% of fixed capital
% of revenue
s
MAIN CASE GROUP 7LOW TEMPERATURE/PRESSURE AND VERY HIGH GAS CONTENT
B7.1 ALTERNATIVE A $ 34,680,000 $ 1,808,000 $ 1,734,000 - $ - $ - $1,734,000 3-stage turbo-compressor
B7.2 ALTERNATIVE B $ 5,434,000 $ 5,708,000 $ 272,000 - $ - $ - $ 272,000 reboiler
B7.3 ALTERNATIVE C $ 3,877,000 $ 512,000 $ 194,000 - $ - $ - $ 194,000 biphase eductor
B7.4 ALTERNATIVE D $ 8,400,000 $ 1,016,000 $ 420,000 - $ - $ - $ 420,000 hybrid turbo-compressor
MAIN CASE GROUP 8HIGH TEMPERATURE/PRESSURE AND VERY HIGH GAS CONTENT
B8.1 ALTERNATIVE A $ 12,360,000 $ 884,000 $ 618,000 - $ - $ - $ 618,000 3-stage turbo-compressor
B8.2 ALTERNATIVE B $ 4,592,000 $ 144,000 $ 230,000 - $ - $ - $ 230,000 reboiler
B8.3 ALTERNATIVE C $ 2,137,000 $ (232,000) $ 107,000 - $ - $ - $ 107,000 biphase eductor
B8.4 ALTERNATIVE D $ 3,000,000 $ 680,000 $ 150,000 - $ - $ - $ 150,000 hybrid turbo-compressor
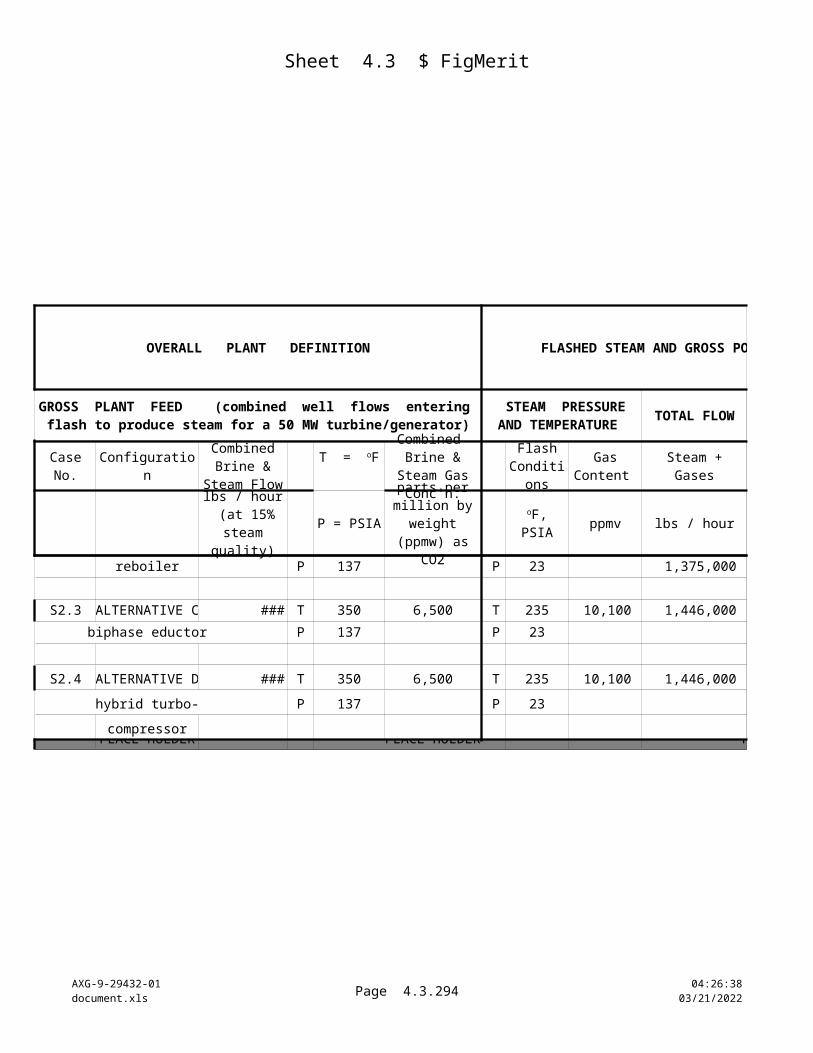
4.3b Present Values
AXG-9-20432-01document.xls
Page 4.3b.294 10:22:2504/18/2023
CALCULATIONS OF NET PRESENT VALUES OF THE ALTERNATIVE GAS REMOVAL SYSTEMS
NOTE : DEFINING VALUES OF THESE DATA ARE SET IN WORKSHEET 2.2, "INPUT&BASES"5 years (12 max.)
(labor, etc.) Tax Rate = 34%1 + Inflation = 1.02
(see sheet 2.2 -- specific to each technology)
1.00
This worksheet calculates the present worth values of the gas removal system alternatives, using the performance data calculated in the engineering and economic figure of merit worksheets. The values of the controlling bases for these calculations are entered in worksheet 2.2, Bases&Input. These calculations use constant-dollar values, correcting the depreciation values and nominal interest (capital discount) rates for general market inflation. This adjusts the future years' net revenue values for the assigned capital discount rate. This spreadsheet allows the user to specify a separate inflation (deflation) rate for the contract price of electricity, which is realistic in today's markets. The difference between general and price-of-electricity inflation rates is compensated in the net present value (NPV) calculations.
Based on guidelines listed in the NREL publication, "A Manual for the Economic Evaluation of Energy Efficiency and Renewable Energy Technologies," (Short, Packey, Holt, 1995), this evaluation accommodates:
- user-selected values of annual capital discount rate, general inflation rate, standalone inflation rates on electricity prices, and tax rates.- taxes as a percent of net revenue after expenses are deducted.- cash flow analysis terms up to 15 years.- depreciation terms up to 12 years.- only straight-line depreciation.
The following operating cost variables can be assigned discretely for each gas removal technology:
- variable "O&M" costs as a percent of fixed capital costs for the alternative gas removal systems.- variable pre-tax expenses for salvage value and other general expenses as percents of capital costs or revenues.- pre-tax labor charges (which would usually be applied in lieu of a labor component in O&M charges).
The net present value of each gas removal option is calculated by balancing the values of installation capital costs and various operating costs versus the revenues attributable to that option. These calculations are based on each technology's specific performance at the plant conditions cited in worksheet 4.1, "Ops Details." The revenues for each option result from the energy savings (or deficit) that a gas removal option achieves compared to the Base Case plant configuration (in the original spreadsheet format the Base Case configuration is a two-stage steam jet ejector system -- the use can change that configuration). These revenues must pay for the installation and operating costs -- if not, the NPV results remain negative indefinitely.
The user can substitute different values of the controlling financial variables shown in Worksheet 2.2 (Bases&Input), such that the economic analyses can approximate a wide range of world electrical power market circumstances. This methodology is general but realistic in its form, and the uniform application of the method gives a good comparison of the relative economic merits of the gas removal alternatives.
As the calculations below are configured at delivery to the National Renewable Energy Laboratory, the economics account for retrofit conversions from a conventional steam jet ejector gas removal systems to one of the alternatives. The conversion is based on supporting a defined power plant capacity of 50 Megawatts. This worksheet can be modified easily to evaluate the alternative technologies as original construction options in lieu of steam jets. This may be done by reducing the capital costs of the alternatives by the cost of installation of a steam jet ejector configuration for the defined power plant capacity.
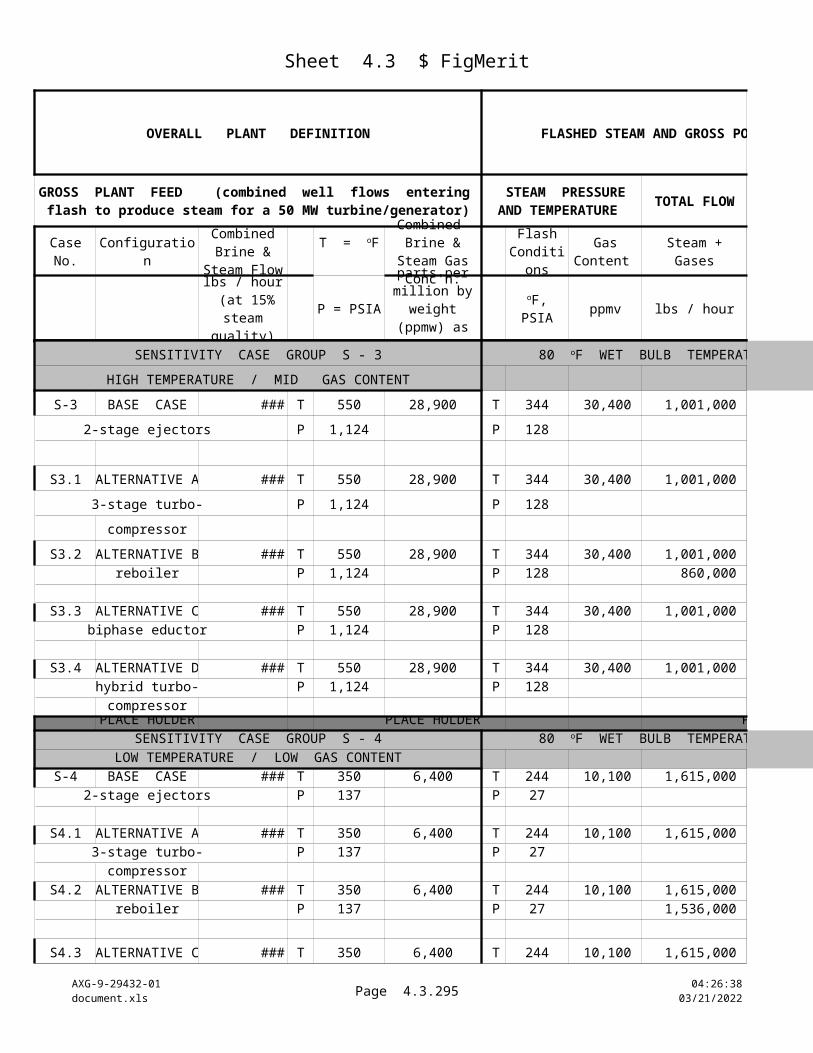
4.3b Present Values
AXG-9-20432-01document.xls
Page 4.3b.295 10:22:2504/18/2023
RECURRING ANNUAL COSTS CASH FLOW RESULTS -- CONSTANT-DOLLAR ANNUAL AND DISCOUNTED CUMULATIVE NET PRESENT VALUES
CONSTANT-DOLLAR VALUES YEAR NO. = 0 1 2 3
Depreciation 1 1 1
1 1 1
0.9273 0.8598 0.7973
Depreciation Inflation Factors = 0.9804 0.9612 0.9423 worksheet 2.2) Electr. Price Compensation = 1.0000 1.0000 1.0000
MAIN CASE GROUP 1HIGH TEMPERATURE/PRESSURE AND HIGH GAS CONTENT
TOP ROW OF EACH PAIR : CONSTANT-DOLLAR ANNUAL NET REVENUES AFTER TAXESBOTTOM ROW OF EACH PAIR : CUMULATIVE NET PRESENT VALUE OF CASH FLOWS THROUGH LAST YEAR OF ANALYSIS TERM
$ 864,000 Constant $/yr $ (4,800,000) $ 606,120 $ 600,473 $ 594,937 Cum. NPV $ (4,800,000) $ (4,237,961) $ (3,721,654) $ (3,247,310)
$ 931,860 Constant $/yr $ (5,177,000) $ 219,408 $ 213,317 $ 207,346 Cum. NPV $ (5,177,000) $ (4,973,549) $ (4,790,131) $ (4,624,814)
$ 401,040 Constant $/yr $ (2,228,000) $ 242,316 $ 239,695 $ 237,125 Cum. NPV $ (2,228,000) $ (2,003,307) $ (1,797,209) $ (1,608,149)
$ 216,000 Constant $/yr $ (1,200,000) $ 393,024 $ 391,612 $ 390,228 Cum. NPV $ (1,200,000) $ (835,560) $ (498,838) $ (187,708)
MAIN CASE GROUP 2HIGH TEMPERATURE/PRESSURE AND MID GAS CONTENT
TOP ROW OF EACH PAIR : CONSTANT-DOLLAR ANNUAL NET REVENUES AFTER TAXESBOTTOM ROW OF EACH PAIR : CUMULATIVE NET PRESENT VALUE OF CASH FLOWS THROUGH LAST YEAR OF ANALYSIS TERM
$ 432,000 Constant $/yr $ (2,400,000) $ 397,440 $ 394,616 $ 391,848 Cum. NPV $ (2,400,000) $ (2,031,465) $ (1,692,160) $ (1,379,739)
$ 970,920 Constant $/yr $ (5,394,000) $ 190,320 $ 183,974 $ 177,753 Cum. NPV $ (5,394,000) $ (5,217,521) $ (5,059,334) $ (4,917,612)
$ 407,160 Constant $/yr $ (2,262,000) $ 333,060 $ 330,399 $ 327,790 Cum. NPV $ (2,262,000) $ (1,953,163) $ (1,669,074) $ (1,407,727)
$ 108,000 Constant $/yr $ (600,000) $ 267,000 $ 266,294 $ 265,602 Cum. NPV $ (600,000) $ (352,418) $ (123,449) $ 88,316
Analysis Switch
1 = on 0 = off
current dollar values $ / year
Depreciation Switch
1 = on 0 = off
Fixed price / Depr'n Term
Annual NPV Factors (with discount rate & inflation) =
(salvage % on
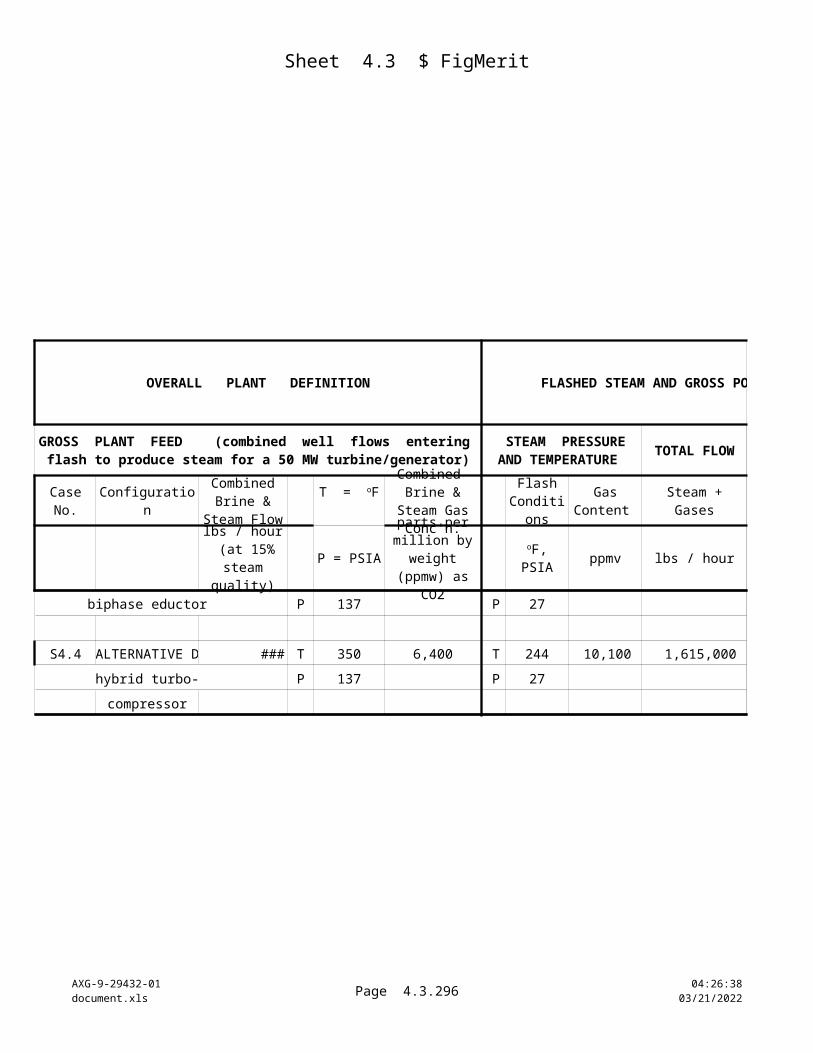
4.3b Present Values
AXG-9-20432-01document.xls
Page 4.3b.296 10:22:2504/18/2023
RECURRING ANNUAL COSTS CASH FLOW RESULTS -- CONSTANT-DOLLAR ANNUAL AND DISCOUNTED CUMULATIVE NET PRESENT VALUES
CONSTANT-DOLLAR VALUES YEAR NO. = 0 1 2 3
Depreciation 1 1 1
1 1 1
0.9273 0.8598 0.7973
Depreciation Inflation Factors = 0.9804 0.9612 0.9423 worksheet 2.2) Electr. Price Compensation = 1.0000 1.0000 1.0000
Analysis Switch
1 = on 0 = off
current dollar values $ / year
Depreciation Switch
1 = on 0 = off
Fixed price / Depr'n Term
Annual NPV Factors (with discount rate & inflation) =
(salvage % on
MAIN CASE GROUP 3HIGH TEMPERATURE/PRESSURE AND LOW GAS CONTENT
TOP ROW OF EACH PAIR : CONSTANT-DOLLAR ANNUAL NET REVENUES AFTER TAXESBOTTOM ROW OF EACH PAIR : CUMULATIVE NET PRESENT VALUE OF CASH FLOWS THROUGH LAST YEAR OF ANALYSIS TERM
$ 313,200 Constant $/yr $ (1,740,000) $ 184,260 $ 182,213 $ 180,206 Cum. NPV $ (1,740,000) $ (1,569,141) $ (1,412,468) $ (1,268,789)
$ 1,006,740 Constant $/yr $ (5,593,000) $ 156,060 $ 149,480 $ 143,029 Cum. NPV $ (5,593,000) $ (5,448,290) $ (5,319,762) $ (5,205,725)
$ 381,420 Constant $/yr $ (2,119,000) $ 286,860 $ 284,367 $ 281,923 Cum. NPV $ (2,119,000) $ (1,853,003) $ (1,608,494) $ (1,383,716)
$ 54,000 Constant $/yr $ (300,000) $ 126,900 $ 126,547 $ 126,201 Cum. NPV $ (300,000) $ (182,329) $ (73,520) $ 27,101
MAIN CASE GROUP 4LOW TEMPERATURE/PRESSURE AND LOW GAS CONTENT
TOP ROW OF EACH PAIR : CONSTANT-DOLLAR ANNUAL NET REVENUES AFTER TAXESBOTTOM ROW OF EACH PAIR : CUMULATIVE NET PRESENT VALUE OF CASH FLOWS THROUGH LAST YEAR OF ANALYSIS TERM
$ 367,200 Constant $/yr $ (2,040,000) $ 604,200 $ 601,800 $ 599,447 Cum. NPV $ (2,040,000) $ (1,479,742) $ (962,293) $ (484,353)
$ 1,406,160 Constant $/yr $ (7,812,000) $ 778,260 $ 769,069 $ 760,059 Cum. NPV $ (7,812,000) $ (7,090,341) $ (6,429,068) $ (5,823,072)
$ 776,340 Constant $/yr $ (4,313,000) $ 264,060 $ 258,986 $ 254,011 Cum. NPV $ (4,313,000) $ (4,068,144) $ (3,845,459) $ (3,642,936)
$ 108,000 Constant $/yr $ (600,000) $ 451,800 $ 451,094 $ 450,402 Cum. NPV $ (600,000) $ (181,058) $ 206,808 $ 565,914
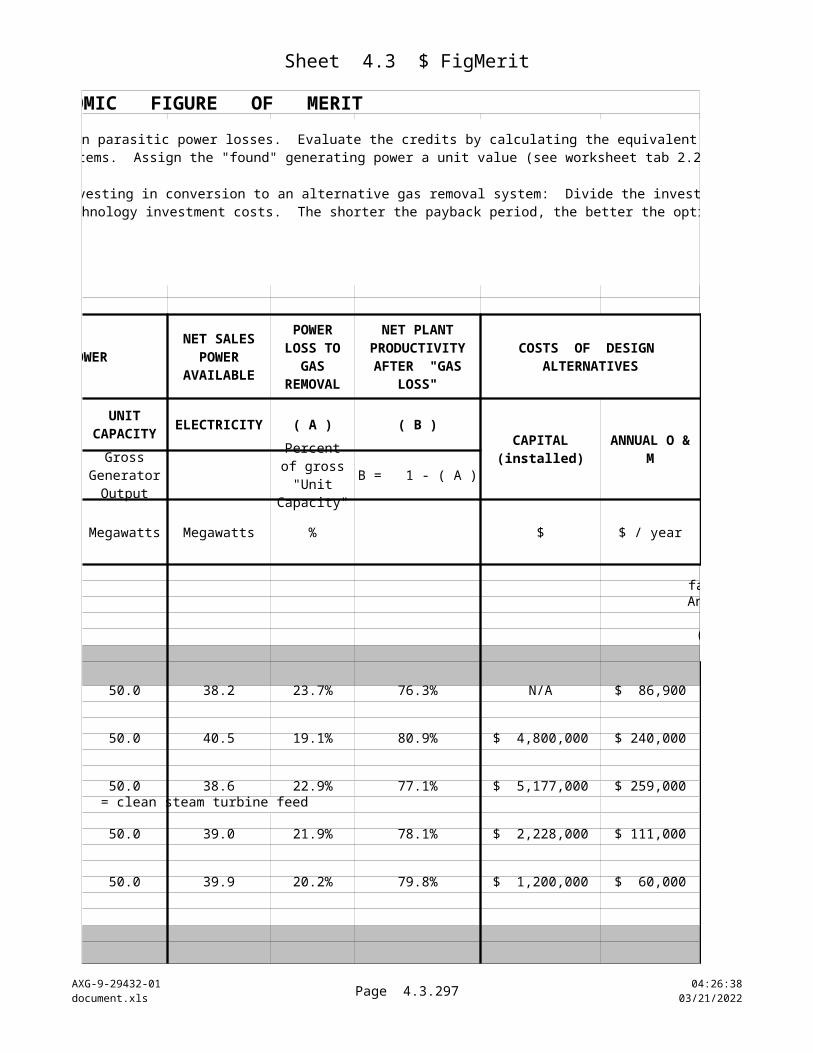
4.3b Present Values
AXG-9-20432-01document.xls
Page 4.3b.297 10:22:2504/18/2023
RECURRING ANNUAL COSTS CASH FLOW RESULTS -- CONSTANT-DOLLAR ANNUAL AND DISCOUNTED CUMULATIVE NET PRESENT VALUES
CONSTANT-DOLLAR VALUES YEAR NO. = 0 1 2 3
Depreciation 1 1 1
1 1 1
0.9273 0.8598 0.7973
Depreciation Inflation Factors = 0.9804 0.9612 0.9423 worksheet 2.2) Electr. Price Compensation = 1.0000 1.0000 1.0000
Analysis Switch
1 = on 0 = off
current dollar values $ / year
Depreciation Switch
1 = on 0 = off
Fixed price / Depr'n Term
Annual NPV Factors (with discount rate & inflation) =
(salvage % on
MAIN CASE GROUP 5LOW TEMPERATURE/PRESSURE AND MID GAS CONTENT
TOP ROW OF EACH PAIR : CONSTANT-DOLLAR ANNUAL NET REVENUES AFTER TAXESBOTTOM ROW OF EACH PAIR : CUMULATIVE NET PRESENT VALUE OF CASH FLOWS THROUGH LAST YEAR OF ANALYSIS TERM
$ 864,000 Constant $/yr $ (4,800,000) $ 1,600,080 $ 1,594,433 $ 1,588,897 Cum. NPV $ (4,800,000) $ (3,316,289) $ (1,945,341) $ (678,511)
$ 1,353,960 Constant $/yr $ (7,522,000) $ 1,898,040 $ 1,889,191 $ 1,880,515 Cum. NPV $ (7,522,000) $ (5,761,999) $ (4,137,608) $ (2,638,271)
$ 766,620 Constant $/yr $ (4,259,000) $ 342,000 $ 336,989 $ 332,077 Cum. NPV $ (4,259,000) $ (3,941,873) $ (3,652,118) $ (3,387,352)
$ 216,000 Constant $/yr $ (1,200,000) $ 1,101,600 $ 1,100,188 $ 1,098,804 Cum. NPV $ (1,200,000) $ (178,516) $ 767,464 $ 1,643,542
MAIN CASE GROUP 6LOW TEMPERATURE/PRESSURE AND HIGH GAS CONTENT
TOP ROW OF EACH PAIR : CONSTANT-DOLLAR ANNUAL NET REVENUES AFTER TAXESBOTTOM ROW OF EACH PAIR : CUMULATIVE NET PRESENT VALUE OF CASH FLOWS THROUGH LAST YEAR OF ANALYSIS TERM
$ 1,728,000 Constant $/yr $ (9,600,000) $ 2,220,720 $ 2,209,426 $ 2,198,353 Cum. NPV $ (9,600,000) $ (7,540,787) $ (5,641,046) $ (3,888,296)
$ 1,297,800 Constant $/yr $ (7,210,000) $ 2,649,540 $ 2,641,058 $ 2,632,742 Cum. NPV $ (7,210,000) $ (4,753,154) $ (2,482,281) $ (383,193)
$ 756,000 Constant $/yr $ (4,200,000) $ 335,160 $ 330,219 $ 325,375 Cum. NPV $ (4,200,000) $ (3,889,215) $ (3,605,282) $ (3,345,860)
$ 432,000 Constant $/yr $ (2,400,000) $ 1,379,520 $ 1,376,696 $ 1,373,928 Cum. NPV $ (2,400,000) $ (1,120,809) $ 62,923 $ 1,158,357
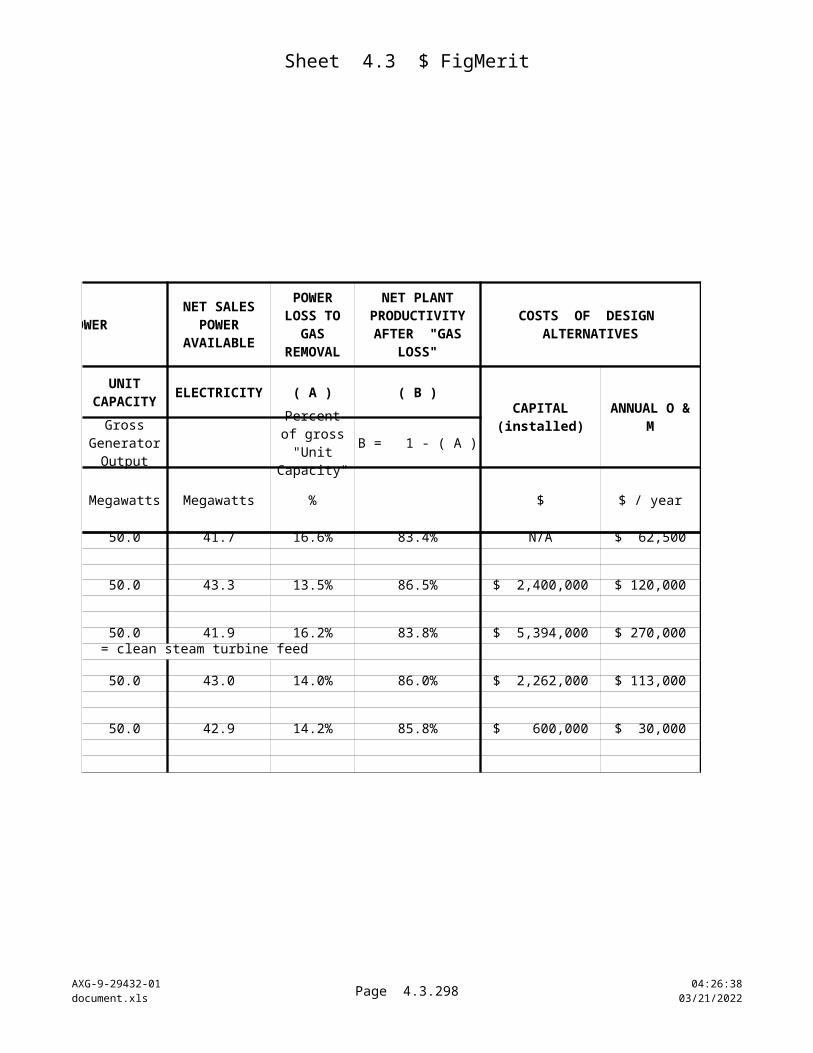
4.3b Present Values
AXG-9-20432-01document.xls
Page 4.3b.298 10:22:2504/18/2023
RECURRING ANNUAL COSTS CASH FLOW RESULTS -- CONSTANT-DOLLAR ANNUAL AND DISCOUNTED CUMULATIVE NET PRESENT VALUES
CONSTANT-DOLLAR VALUES YEAR NO. = 0 1 2 3
Depreciation 1 1 1
1 1 1
0.9273 0.8598 0.7973
Depreciation Inflation Factors = 0.9804 0.9612 0.9423 worksheet 2.2) Electr. Price Compensation = 1.0000 1.0000 1.0000
Analysis Switch
1 = on 0 = off
current dollar values $ / year
Depreciation Switch
1 = on 0 = off
Fixed price / Depr'n Term
Annual NPV Factors (with discount rate & inflation) =
(salvage % on
MAIN CASE GROUP 7LOW TEMPERATURE/PRESSURE AND VERY HIGH GAS CONTENT
TOP ROW OF EACH PAIR : CONSTANT-DOLLAR ANNUAL NET REVENUES AFTER TAXESBOTTOM ROW OF EACH PAIR : CUMULATIVE NET PRESENT VALUE OF CASH FLOWS THROUGH LAST YEAR OF ANALYSIS TERM
$ 6,242,400 Constant $/yr $ (34,680,000) $ 2,129,640 $ 2,088,840 $ 2,048,840 Cum. NPV $ (34,680,000) $ (32,705,243) $ (30,909,186) $ (29,275,643)
$ 978,120 Constant $/yr $ (5,434,000) $ 3,913,800 $ 3,907,407 $ 3,901,139 Cum. NPV $ (5,434,000) $ (1,804,840) $ 1,554,884 $ 4,665,268
$ 697,860 Constant $/yr $ (3,877,000) $ 442,500 $ 437,939 $ 433,467 Cum. NPV $ (3,877,000) $ (3,466,682) $ (3,090,127) $ (2,744,523)
$ 1,512,000 Constant $/yr $ (8,400,000) $ 897,360 $ 887,478 $ 877,789 Cum. NPV $ (8,400,000) $ (7,567,903) $ (6,804,818) $ (6,104,956)
MAIN CASE GROUP 8HIGH TEMPERATURE/PRESSURE AND VERY HIGH GAS CONTENT
TOP ROW OF EACH PAIR : CONSTANT-DOLLAR ANNUAL NET REVENUES AFTER TAXESBOTTOM ROW OF EACH PAIR : CUMULATIVE NET PRESENT VALUE OF CASH FLOWS THROUGH LAST YEAR OF ANALYSIS TERM
$ 2,224,800 Constant $/yr $ (12,360,000) $ 917,160 $ 902,619 $ 888,363 Cum. NPV $ (12,360,000) $ (11,509,543) $ (10,733,440) $ (10,025,147)
$ 826,560 Constant $/yr $ (4,592,000) $ 218,760 $ 213,358 $ 208,061 Cum. NPV $ (4,592,000) $ (4,389,150) $ (4,205,698) $ (4,039,810)
$ 384,660 Constant $/yr $ (2,137,000) $ (95,520) $ (98,034) $ (100,499)Cum. NPV $ (2,137,000) $ (2,225,573) $ (2,309,866) $ (2,389,994)
$ 540,000 Constant $/yr $ (3,000,000) $ 529,800 $ 526,271 $ 522,810 Cum. NPV $ (3,000,000) $ (2,508,731) $ (2,056,225) $ (1,639,388)
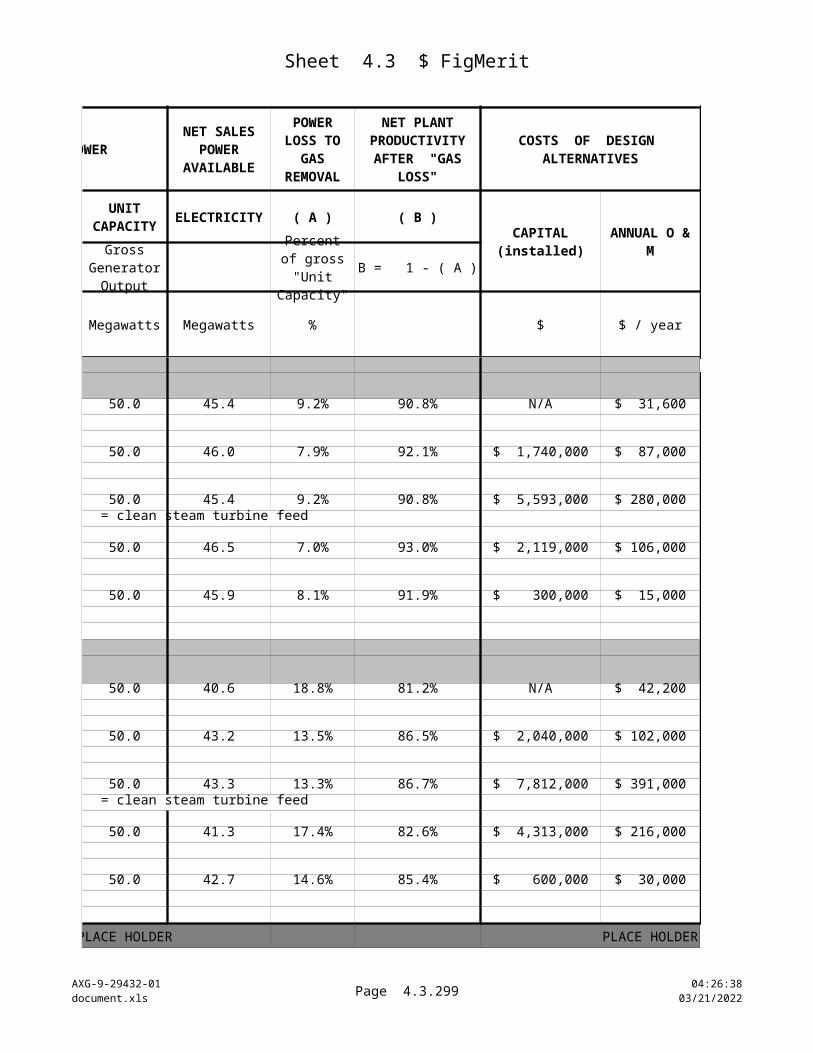
4.3b Present Values
AXG-9-20432-01document.xls
Page 4.3b.299 10:22:2504/18/2023
NOTES:
1. The "Analysis Term" is the total time period for which NPV calculations are requested, to a maximum duration of 15 years. The Figure of Merit plots indicate the cumulative NPV for the end of the specified term. The user may examine successive years' results graphically by changing the analysis term value. By selecting a value of 15 years, the table below gives the NPV history for all years.
2. The "Depreciation Term" is the period over which depreciation is deducted for tax purposes. Only straight-line depreciation is considered in this screening model.
3. The "Nominal Discount Rate" is the target time-value-of-money compounding rate required for return on investment by a prospective owner or investor.
4. The "General Inflation Rate" is a general economic term for costs of labor, supplies, materials, etc. This inflation rate is also used to correct the depreciation value (a non-inflating current-year value) to cancel the application of inflation in the NPV factors (see 5, following).
5. The "Real Discount Rate" is the effective rate of compounding of net revenues after compensating for inflation. This ratio is used to calculate NPV factors.
6. The price of electricity is assigned a separate inflation rate. The "Electricity Price Inflation Compensation" factor compensates for the differential price inflation compared to the general inflation factor built into the NPV factors.
7. The tax rate is the overall value of taxation on net revenues, including the deduction for depreciation.
8, The Recurring Annual Costs below are referred from other worksheets and calculated as listed.
9. The general formulae for the net annual revenues and the cumulative net present values of revenues and costs are as follows:
Annual Net Revenues = (electricity revenue) * (price inflation factor) - (net costs before depreciation) - (tax rate) * [ (electricity revenue) * (price inflation factor) - (net costs before depreciation) - (depreciation) * (depreciation factor) ]
Current-Year Cumulative NPV = (prior year cumulative NPV) + (current-year Annual Net Revenues) * (NPV factor based on net discount rate after inflation)
The Analysis Switch and the Depreciation Switch activate the calculation of annual net revenues and of depreciation, respectively, for only the years specified by the Analysis Term and Depreciation Term values. The Cumulative NPV remains constant in all years after the last year of the Analysis Term.
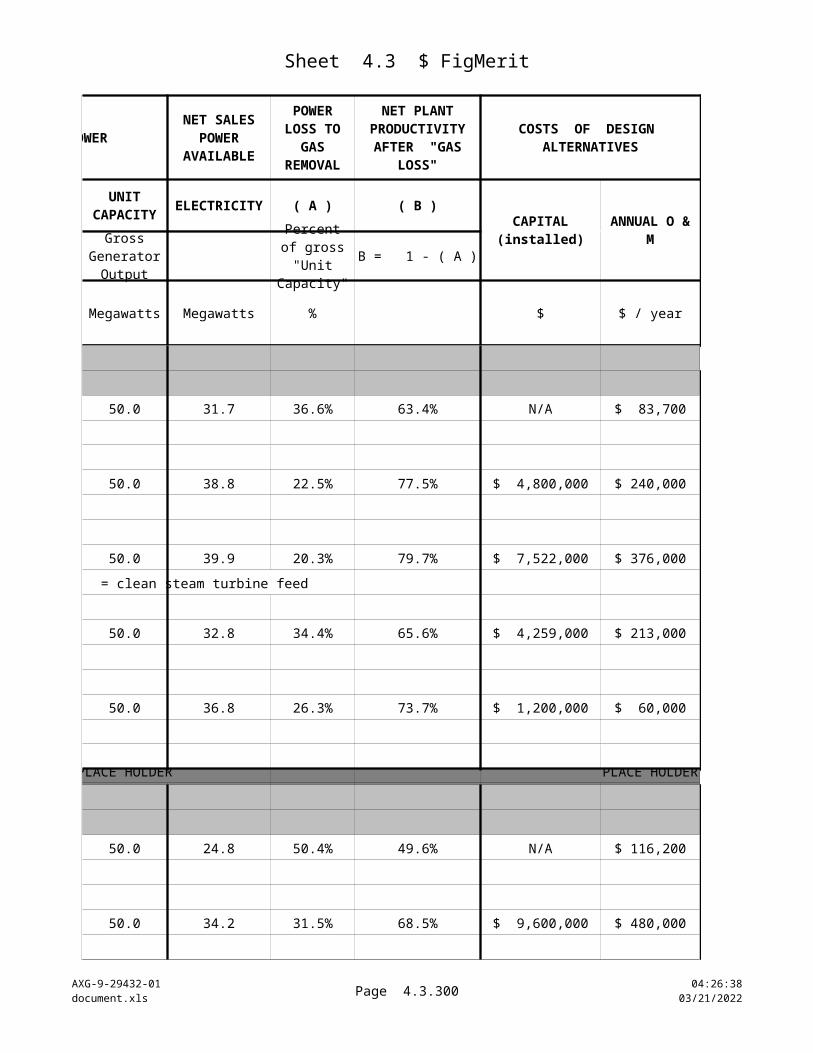
4.3b Present Values
AXG-9-20432-01document.xls
Page 4.3b.300 10:22:2504/18/2023
CASH FLOW RESULTS -- CONSTANT-DOLLAR ANNUAL AND DISCOUNTED CUMULATIVE NET PRESENT VALUES
4 5 6 7 8 9
1 1 1 1 1 1
1 1 0 0 0 0
0.7393 0.6855 0.6357 0.5895 0.5466 0.5068
0.9238 0.9057 0.0000 0.0000 0.0000 0.0000 1.0000 1.0000 1.0000 1.0000 1.0000 1.0000
MAIN CASE GROUP 1HIGH TEMPERATURE/PRESSURE AND HIGH GAS CONTENT
TOP ROW OF EACH PAIR : CONSTANT-DOLLAR ANNUAL NET REVENUES AFTER TAXESBOTTOM ROW OF EACH PAIR : CUMULATIVE NET PRESENT VALUE OF CASH FLOWS THROUGH LAST YEAR OF ANALYSIS TERM
$ 589,509 $ 584,187 $ 318,120 $ 318,120 $ 318,120 $ 318,120 $ (2,811,477) $ (2,410,989) $ (2,208,763) $ (2,021,245) $ (1,847,365) $ (1,686,130)
$ 201,492 $ 195,753 $ (91,212) $ (91,212) $ (91,212) $ (91,212) $ (4,475,847) $ (4,341,650) $ (4,399,632) $ (4,453,398) $ (4,503,253) $ (4,549,483)
$ 234,606 $ 232,136 $ 108,636 $ 108,636 $ 108,636 $ 108,636 $ (1,434,701) $ (1,275,561) $ (1,206,503) $ (1,142,466) $ (1,083,087) $ (1,028,027)
$ 388,871 $ 387,541 $ 321,024 $ 321,024 $ 321,024 $ 321,024 $ 99,790 $ 365,468 $ 569,539 $ 758,769 $ 934,237 $ 1,096,944
MAIN CASE GROUP 2HIGH TEMPERATURE/PRESSURE AND MID GAS CONTENT
TOP ROW OF EACH PAIR : CONSTANT-DOLLAR ANNUAL NET REVENUES AFTER TAXESBOTTOM ROW OF EACH PAIR : CUMULATIVE NET PRESENT VALUE OF CASH FLOWS THROUGH LAST YEAR OF ANALYSIS TERM
$ 389,134 $ 386,474 $ 253,440 $ 253,440 $ 253,440 $ 253,440 $ (1,092,045) $ (827,099) $ (665,990) $ (516,598) $ (378,071) $ (249,619)
$ 171,653 $ 165,673 $ (133,320) $ (133,320) $ (133,320) $ (133,320) $ (4,790,706) $ (4,677,129) $ (4,761,879) $ (4,840,465) $ (4,913,337) $ (4,980,908)
$ 325,232 $ 322,724 $ 197,340 $ 197,340 $ 197,340 $ 197,340 $ (1,167,278) $ (946,035) $ (820,588) $ (704,265) $ (596,401) $ (496,382)
$ 264,924 $ 264,258 $ 231,000 $ 231,000 $ 231,000 $ 231,000 $ 284,178 $ 465,339 $ 612,184 $ 748,348 $ 874,610 $ 991,689
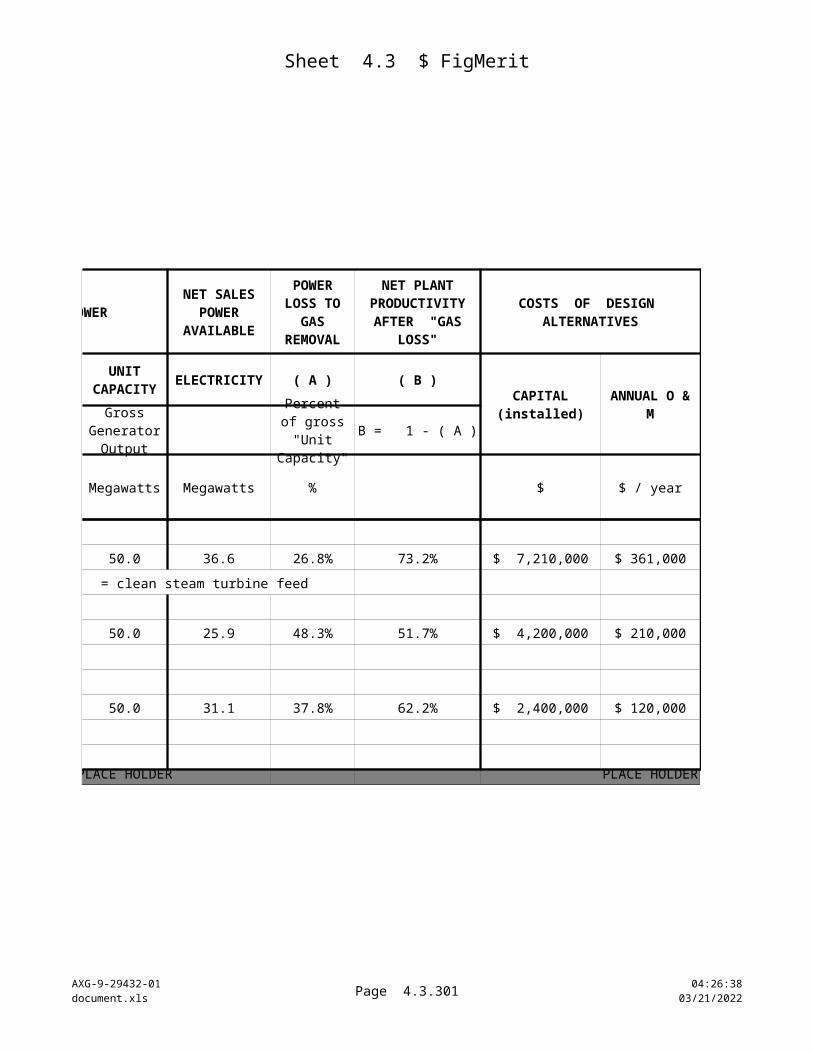
4.3b Present Values
AXG-9-20432-01document.xls
Page 4.3b.301 10:22:2604/18/2023
CASH FLOW RESULTS -- CONSTANT-DOLLAR ANNUAL AND DISCOUNTED CUMULATIVE NET PRESENT VALUES
4 5 6 7 8 9
1 1 1 1 1 1
1 1 0 0 0 0
0.7393 0.6855 0.6357 0.5895 0.5466 0.5068
0.9238 0.9057 0.0000 0.0000 0.0000 0.0000 1.0000 1.0000 1.0000 1.0000 1.0000 1.0000
MAIN CASE GROUP 3HIGH TEMPERATURE/PRESSURE AND LOW GAS CONTENT
TOP ROW OF EACH PAIR : CONSTANT-DOLLAR ANNUAL NET REVENUES AFTER TAXESBOTTOM ROW OF EACH PAIR : CUMULATIVE NET PRESENT VALUE OF CASH FLOWS THROUGH LAST YEAR OF ANALYSIS TERM
$ 178,238 $ 176,309 $ 79,860 $ 79,860 $ 79,860 $ 79,860 $ (1,137,015) $ (1,016,146) $ (965,380) $ (918,306) $ (874,656) $ (834,180)
$ 136,705 $ 130,504 $ (179,520) $ (179,520) $ (179,520) $ (179,520) $ (5,104,657) $ (5,015,190) $ (5,129,309) $ (5,235,128) $ (5,333,252) $ (5,424,239)
$ 279,527 $ 277,178 $ 159,720 $ 159,720 $ 159,720 $ 159,720 $ (1,177,058) $ (987,039) $ (885,507) $ (791,359) $ (704,058) $ (623,106)
$ 125,862 $ 125,529 $ 108,900 $ 108,900 $ 108,900 $ 108,900 $ 120,152 $ 206,209 $ 275,435 $ 339,627 $ 399,150 $ 454,345
MAIN CASE GROUP 4LOW TEMPERATURE/PRESSURE AND LOW GAS CONTENT
TOP ROW OF EACH PAIR : CONSTANT-DOLLAR ANNUAL NET REVENUES AFTER TAXESBOTTOM ROW OF EACH PAIR : CUMULATIVE NET PRESENT VALUE OF CASH FLOWS THROUGH LAST YEAR OF ANALYSIS TERM
$ 597,140 $ 594,879 $ 481,800 $ 481,800 $ 481,800 $ 481,800 $ (42,878) $ 364,939 $ 671,214 $ 955,215 $ 1,218,561 $ 1,462,754
$ 751,225 $ 742,565 $ 309,540 $ 309,540 $ 309,540 $ 309,540 $ (5,267,679) $ (4,758,616) $ (4,561,845) $ (4,379,384) $ (4,210,193) $ (4,053,307)
$ 249,134 $ 244,353 $ 5,280 $ 5,280 $ 5,280 $ 5,280 $ (3,458,747) $ (3,291,232) $ (3,287,875) $ (3,284,763) $ (3,281,877) $ (3,279,201)
$ 449,724 $ 449,058 $ 415,800 $ 415,800 $ 415,800 $ 415,800 $ 898,402 $ 1,206,253 $ 1,470,573 $ 1,715,669 $ 1,942,940 $ 2,153,682
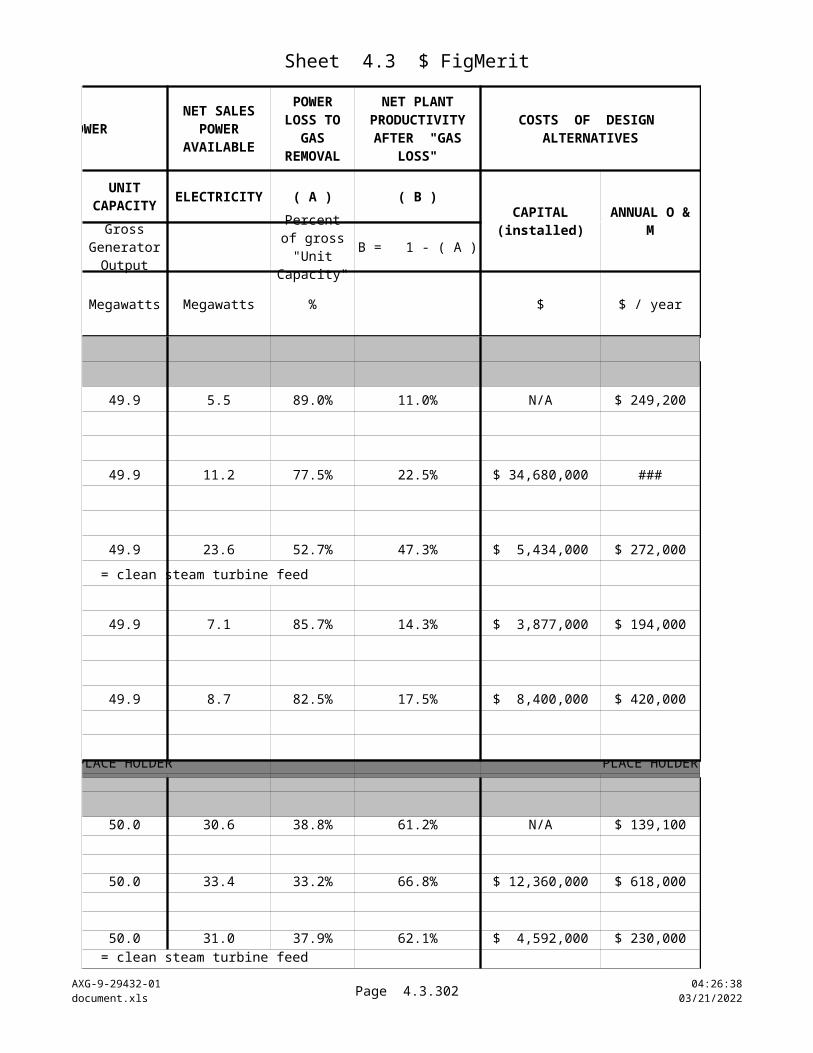
4.3b Present Values
AXG-9-20432-01document.xls
Page 4.3b.302 10:22:2604/18/2023
CASH FLOW RESULTS -- CONSTANT-DOLLAR ANNUAL AND DISCOUNTED CUMULATIVE NET PRESENT VALUES
4 5 6 7 8 9
1 1 1 1 1 1
1 1 0 0 0 0
0.7393 0.6855 0.6357 0.5895 0.5466 0.5068
0.9238 0.9057 0.0000 0.0000 0.0000 0.0000 1.0000 1.0000 1.0000 1.0000 1.0000 1.0000
MAIN CASE GROUP 5LOW TEMPERATURE/PRESSURE AND MID GAS CONTENT
TOP ROW OF EACH PAIR : CONSTANT-DOLLAR ANNUAL NET REVENUES AFTER TAXESBOTTOM ROW OF EACH PAIR : CUMULATIVE NET PRESENT VALUE OF CASH FLOWS THROUGH LAST YEAR OF ANALYSIS TERM
$ 1,583,469 $ 1,578,147 $ 1,312,080 $ 1,312,080 $ 1,312,080 $ 1,312,080 $ 492,172 $ 1,574,067 $ 2,408,142 $ 3,181,557 $ 3,898,724 $ 4,563,733
$ 1,872,009 $ 1,863,670 $ 1,446,720 $ 1,446,720 $ 1,446,720 $ 1,446,720 $ (1,254,265) $ 23,369 $ 943,033 $ 1,795,813 $ 2,586,572 $ 3,319,822
$ 327,261 $ 322,539 $ 86,460 $ 86,460 $ 86,460 $ 86,460 $ (3,145,403) $ (2,924,287) $ (2,869,325) $ (2,818,361) $ (2,771,103) $ (2,727,282)
$ 1,097,447 $ 1,096,117 $ 1,029,600 $ 1,029,600 $ 1,029,600 $ 1,029,600 $ 2,454,902 $ 3,206,342 $ 3,860,847 $ 4,467,753 $ 5,030,519 $ 5,552,358
MAIN CASE GROUP 6LOW TEMPERATURE/PRESSURE AND HIGH GAS CONTENT
TOP ROW OF EACH PAIR : CONSTANT-DOLLAR ANNUAL NET REVENUES AFTER TAXESBOTTOM ROW OF EACH PAIR : CUMULATIVE NET PRESENT VALUE OF CASH FLOWS THROUGH LAST YEAR OF ANALYSIS TERM
$ 2,187,498 $ 2,176,855 $ 1,644,720 $ 1,644,720 $ 1,644,720 $ 1,644,720 $ (2,271,045) $ (778,708) $ 266,823 $ 1,236,316 $ 2,135,300 $ 2,968,903
$ 2,624,589 $ 2,616,596 $ 2,216,940 $ 2,216,940 $ 2,216,940 $ 2,216,940 $ 1,557,207 $ 3,351,007 $ 4,760,292 $ 6,067,084 $ 7,278,836 $ 8,402,461
$ 320,625 $ 315,969 $ 83,160 $ 83,160 $ 83,160 $ 83,160 $ (3,108,817) $ (2,892,205) $ (2,839,341) $ (2,790,322) $ (2,744,868) $ (2,702,719)
$ 1,371,214 $ 1,368,554 $ 1,235,520 $ 1,235,520 $ 1,235,520 $ 1,235,520 $ 2,172,118 $ 3,110,326 $ 3,895,733 $ 4,624,019 $ 5,299,340 $ 5,925,545
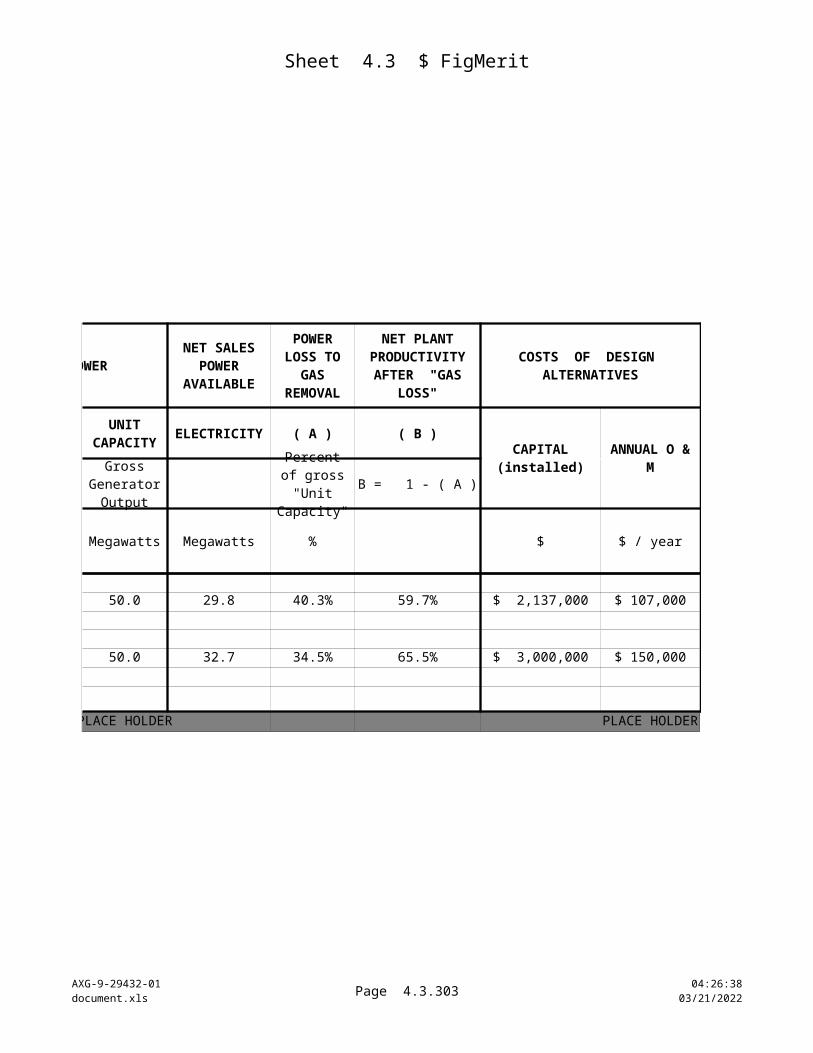
4.3b Present Values
AXG-9-20432-01document.xls
Page 4.3b.303 10:22:2604/18/2023
CASH FLOW RESULTS -- CONSTANT-DOLLAR ANNUAL AND DISCOUNTED CUMULATIVE NET PRESENT VALUES
4 5 6 7 8 9
1 1 1 1 1 1
1 1 0 0 0 0
0.7393 0.6855 0.6357 0.5895 0.5466 0.5068
0.9238 0.9057 0.0000 0.0000 0.0000 0.0000 1.0000 1.0000 1.0000 1.0000 1.0000 1.0000
MAIN CASE GROUP 7LOW TEMPERATURE/PRESSURE AND VERY HIGH GAS CONTENT
TOP ROW OF EACH PAIR : CONSTANT-DOLLAR ANNUAL NET REVENUES AFTER TAXESBOTTOM ROW OF EACH PAIR : CUMULATIVE NET PRESENT VALUE OF CASH FLOWS THROUGH LAST YEAR OF ANALYSIS TERM
$ 2,009,624 $ 1,971,178 $ 48,840 $ 48,840 $ 48,840 $ 48,840 $ (27,789,896) $ (26,438,561) $ (26,407,514) $ (26,378,725) $ (26,352,029) $ (26,327,275)
$ 3,894,995 $ 3,888,971 $ 3,587,760 $ 3,587,760 $ 3,587,760 $ 3,587,760 $ 7,544,899 $ 10,210,972 $ 12,491,673 $ 14,606,504 $ 16,567,530 $ 18,385,936
$ 429,083 $ 424,785 $ 209,880 $ 209,880 $ 209,880 $ 209,880 $ (2,427,295) $ (2,136,085) $ (2,002,666) $ (1,878,951) $ (1,764,233) $ (1,657,859)
$ 868,290 $ 858,978 $ 393,360 $ 393,360 $ 393,360 $ 393,360 $ (5,463,015) $ (4,874,145) $ (4,624,090) $ (4,392,221) $ (4,177,216) $ (3,977,847)
MAIN CASE GROUP 8HIGH TEMPERATURE/PRESSURE AND VERY HIGH GAS CONTENT
TOP ROW OF EACH PAIR : CONSTANT-DOLLAR ANNUAL NET REVENUES AFTER TAXESBOTTOM ROW OF EACH PAIR : CUMULATIVE NET PRESENT VALUE OF CASH FLOWS THROUGH LAST YEAR OF ANALYSIS TERM
$ 874,386 $ 860,684 $ 175,560 $ 175,560 $ 175,560 $ 175,560 $ (9,378,699) $ (8,788,660) $ (8,677,058) $ (8,573,573) $ (8,477,614) $ (8,388,634)
$ 202,869 $ 197,778 $ (56,760) $ (56,760) $ (56,760) $ (56,760) $ (3,889,826) $ (3,754,240) $ (3,790,322) $ (3,823,779) $ (3,854,804) $ (3,883,572)
$ (102,915) $ (105,285) $ (223,740) $ (223,740) $ (223,740) $ (223,740) $ (2,466,081) $ (2,538,259) $ (2,680,488) $ (2,812,373) $ (2,934,667) $ (3,048,066)
$ 519,418 $ 516,092 $ 349,800 $ 349,800 $ 349,800 $ 349,800 $ (1,255,374) $ (901,568) $ (679,204) $ (473,012) $ (281,816) $ (104,524)
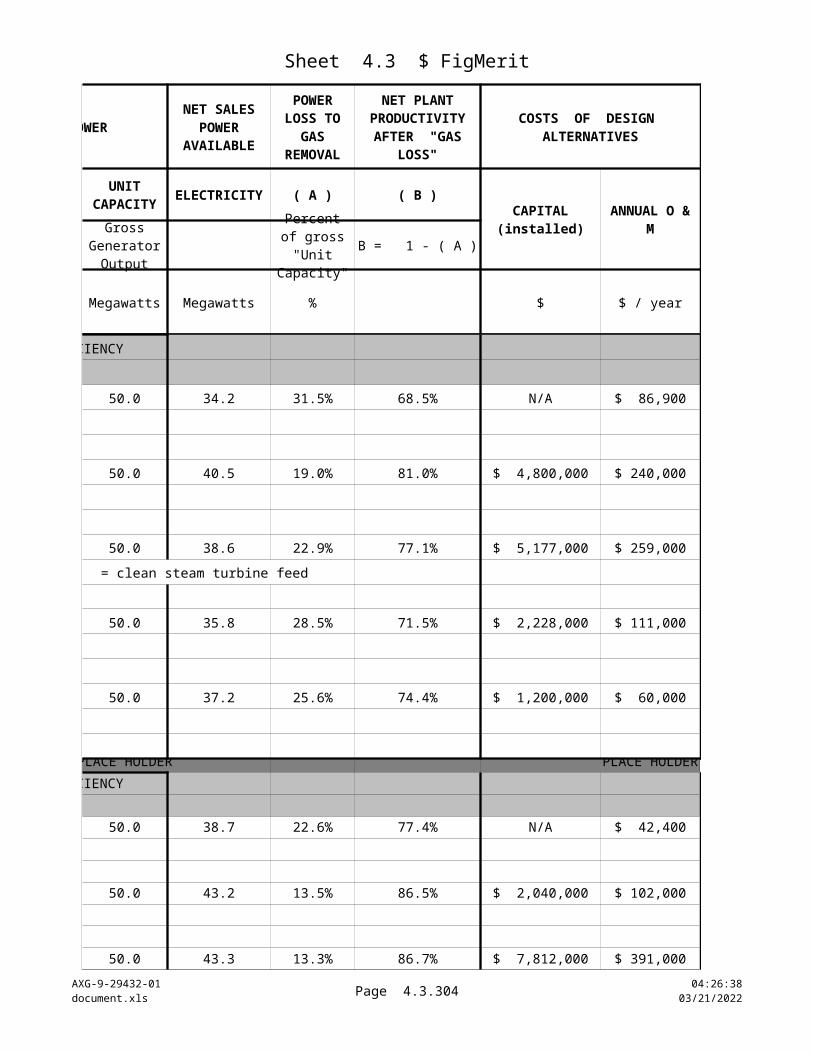
4.3b Present Values
AXG-9-20432-01document.xls
Page 4.3b.304 10:22:2604/18/2023
NOTES:
1. The "Analysis Term" is the total time period for which NPV calculations are requested, to a maximum duration of 15 years. The Figure of Merit plots indicate the cumulative NPV for the end of the specified term. The user may examine successive years' results graphically by changing the analysis term value. By selecting a value of 15 years, the table below gives the NPV history for all years.
2. The "Depreciation Term" is the period over which depreciation is deducted for tax purposes. Only straight-line depreciation is considered in this screening model.
3. The "Nominal Discount Rate" is the target time-value-of-money compounding rate required for return on investment by a prospective owner or investor.
4. The "General Inflation Rate" is a general economic term for costs of labor, supplies, materials, etc. This inflation rate is also used to correct the depreciation value (a non-inflating current-year value) to cancel the application of inflation in the NPV factors (see 5, following).
5. The "Real Discount Rate" is the effective rate of compounding of net revenues after compensating for inflation. This ratio is used to calculate NPV factors.
6. The price of electricity is assigned a separate inflation rate. The "Electricity Price Inflation Compensation" factor compensates for the differential price inflation compared to the general inflation factor built into the NPV factors.
7. The tax rate is the overall value of taxation on net revenues, including the deduction for depreciation.
8, The Recurring Annual Costs below are referred from other worksheets and calculated as listed.
9. The general formulae for the net annual revenues and the cumulative net present values of revenues and costs are as follows:
Annual Net Revenues = (electricity revenue) * (price inflation factor) - (net costs before depreciation) - (tax rate) * [ (electricity revenue) * (price inflation factor) - (net costs before depreciation) - (depreciation) * (depreciation factor) ]
Current-Year Cumulative NPV = (prior year cumulative NPV) + (current-year Annual Net Revenues) * (NPV factor based on net discount rate after inflation)
The Analysis Switch and the Depreciation Switch activate the calculation of annual net revenues and of depreciation, respectively, for only the years specified by the Analysis Term and Depreciation Term values. The Cumulative NPV remains constant in all years after the last year of the Analysis Term.
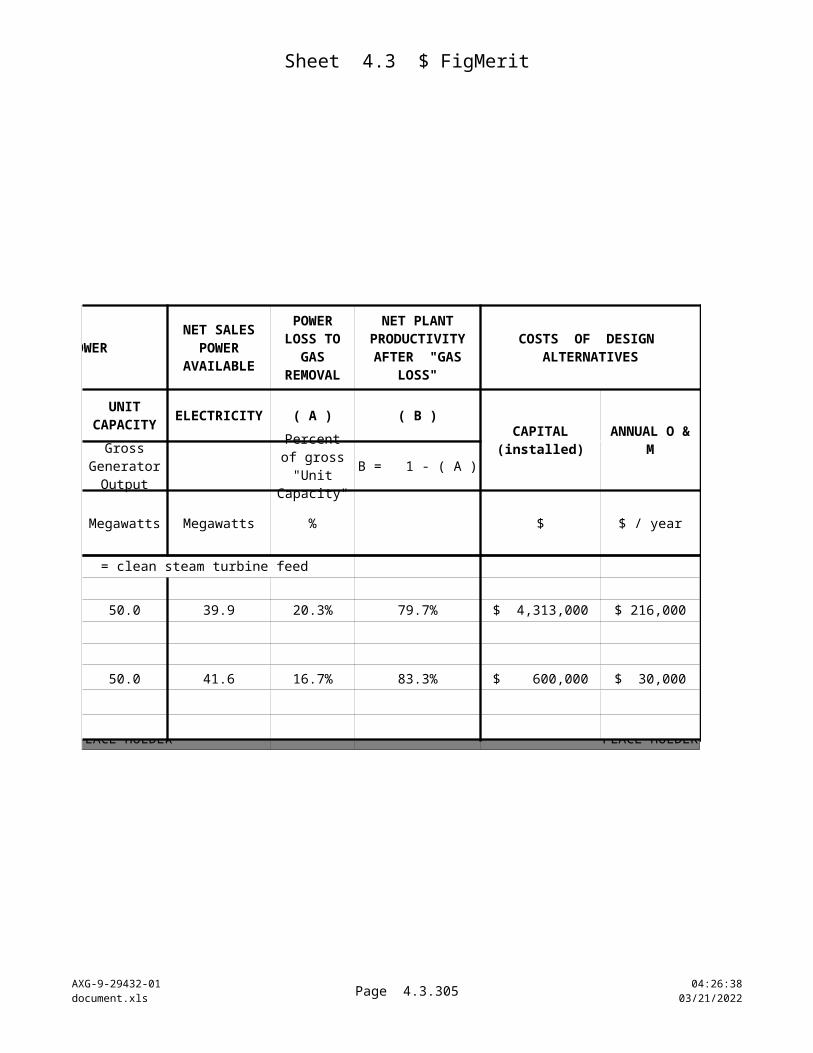
4.3b Present Values
AXG-9-20432-01document.xls
Page 4.3b.305 10:22:2604/18/2023
CASH FLOW RESULTS -- CONSTANT-DOLLAR ANNUAL AND DISCOUNTED CUMULATIVE NET PRESENT VALUES
10 11 12 13 14 15
1 0 0 0 0 0
0 0 0 0 0 0
0.4700 0.0000 0.0000 0.0000 0.0000 0.0000
0.0000 0.0000 0.0000 0.0000 0.0000 0.0000 1.0000 1.0000 1.0000 1.0000 1.0000 1.0000
MAIN CASE GROUP 1HIGH TEMPERATURE/PRESSURE AND HIGH GAS CONTENT
TOP ROW OF EACH PAIR : CONSTANT-DOLLAR ANNUAL NET REVENUES AFTER TAXESBOTTOM ROW OF EACH PAIR : CUMULATIVE NET PRESENT VALUE OF CASH FLOWS THROUGH LAST YEAR OF ANALYSIS TERM
$ 318,120 $ - $ - $ - $ - $ - $ (1,536,622) $ (1,536,622) $ (1,536,622) $ (1,536,622) $ (1,536,622) $ (1,536,622)
$ (91,212) $ - $ - $ - $ - $ - $ (4,592,350) $ (4,592,350) $ (4,592,350) $ (4,592,350) $ (4,592,350) $ (4,592,350)
$ 108,636 $ - $ - $ - $ - $ - $ (976,970) $ (976,970) $ (976,970) $ (976,970) $ (976,970) $ (976,970)
$ 321,024 $ - $ - $ - $ - $ - $ 1,247,817 $ 1,247,817 $ 1,247,817 $ 1,247,817 $ 1,247,817 $ 1,247,817
MAIN CASE GROUP 2HIGH TEMPERATURE/PRESSURE AND MID GAS CONTENT
TOP ROW OF EACH PAIR : CONSTANT-DOLLAR ANNUAL NET REVENUES AFTER TAXESBOTTOM ROW OF EACH PAIR : CUMULATIVE NET PRESENT VALUE OF CASH FLOWS THROUGH LAST YEAR OF ANALYSIS TERM
$ 253,440 $ - $ - $ - $ - $ - $ (130,508) $ (130,508) $ (130,508) $ (130,508) $ (130,508) $ (130,508)
$ (133,320) $ - $ - $ - $ - $ - $ (5,043,565) $ (5,043,565) $ (5,043,565) $ (5,043,565) $ (5,043,565) $ (5,043,565)
$ 197,340 $ - $ - $ - $ - $ - $ (403,637) $ (403,637) $ (403,637) $ (403,637) $ (403,637) $ (403,637)
$ 231,000 $ - $ - $ - $ - $ - $ 1,100,253 $ 1,100,253 $ 1,100,253 $ 1,100,253 $ 1,100,253 $ 1,100,253
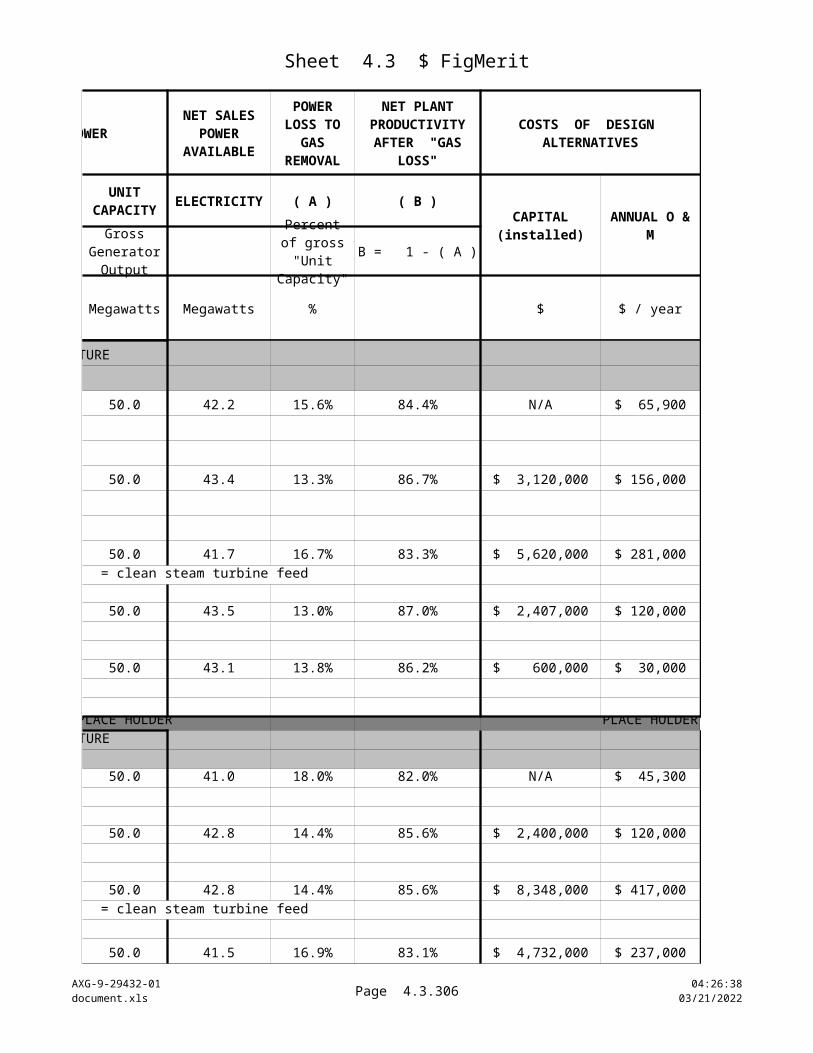
4.3b Present Values
AXG-9-20432-01document.xls
Page 4.3b.306 10:22:2604/18/2023
CASH FLOW RESULTS -- CONSTANT-DOLLAR ANNUAL AND DISCOUNTED CUMULATIVE NET PRESENT VALUES
10 11 12 13 14 15
1 0 0 0 0 0
0 0 0 0 0 0
0.4700 0.0000 0.0000 0.0000 0.0000 0.0000
0.0000 0.0000 0.0000 0.0000 0.0000 0.0000 1.0000 1.0000 1.0000 1.0000 1.0000 1.0000
MAIN CASE GROUP 3HIGH TEMPERATURE/PRESSURE AND LOW GAS CONTENT
TOP ROW OF EACH PAIR : CONSTANT-DOLLAR ANNUAL NET REVENUES AFTER TAXESBOTTOM ROW OF EACH PAIR : CUMULATIVE NET PRESENT VALUE OF CASH FLOWS THROUGH LAST YEAR OF ANALYSIS TERM
$ 79,860 $ - $ - $ - $ - $ - $ (796,647) $ (796,647) $ (796,647) $ (796,647) $ (796,647) $ (796,647)
$ (179,520) $ - $ - $ - $ - $ - $ (5,508,609) $ (5,508,609) $ (5,508,609) $ (5,508,609) $ (5,508,609) $ (5,508,609)
$ 159,720 $ - $ - $ - $ - $ - $ (548,042) $ (548,042) $ (548,042) $ (548,042) $ (548,042) $ (548,042)
$ 108,900 $ - $ - $ - $ - $ - $ 505,525 $ 505,525 $ 505,525 $ 505,525 $ 505,525 $ 505,525
MAIN CASE GROUP 4LOW TEMPERATURE/PRESSURE AND LOW GAS CONTENT
TOP ROW OF EACH PAIR : CONSTANT-DOLLAR ANNUAL NET REVENUES AFTER TAXESBOTTOM ROW OF EACH PAIR : CUMULATIVE NET PRESENT VALUE OF CASH FLOWS THROUGH LAST YEAR OF ANALYSIS TERM
$ 481,800 $ - $ - $ - $ - $ - $ 1,689,188 $ 1,689,188 $ 1,689,188 $ 1,689,188 $ 1,689,188 $ 1,689,188
$ 309,540 $ - $ - $ - $ - $ - $ (3,907,831) $ (3,907,831) $ (3,907,831) $ (3,907,831) $ (3,907,831) $ (3,907,831)
$ 5,280 $ - $ - $ - $ - $ - $ (3,276,719) $ (3,276,719) $ (3,276,719) $ (3,276,719) $ (3,276,719) $ (3,276,719)
$ 415,800 $ - $ - $ - $ - $ - $ 2,349,098 $ 2,349,098 $ 2,349,098 $ 2,349,098 $ 2,349,098 $ 2,349,098
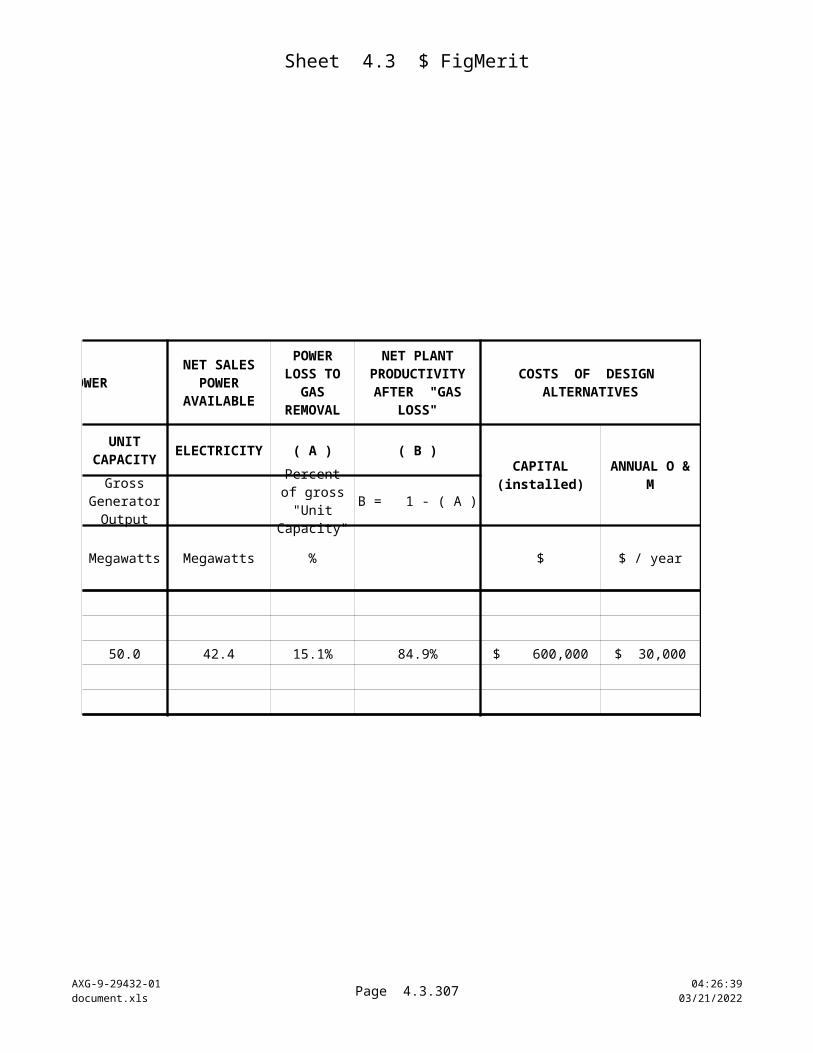
4.3b Present Values
AXG-9-20432-01document.xls
Page 4.3b.307 10:22:2604/18/2023
CASH FLOW RESULTS -- CONSTANT-DOLLAR ANNUAL AND DISCOUNTED CUMULATIVE NET PRESENT VALUES
10 11 12 13 14 15
1 0 0 0 0 0
0 0 0 0 0 0
0.4700 0.0000 0.0000 0.0000 0.0000 0.0000
0.0000 0.0000 0.0000 0.0000 0.0000 0.0000 1.0000 1.0000 1.0000 1.0000 1.0000 1.0000
MAIN CASE GROUP 5LOW TEMPERATURE/PRESSURE AND MID GAS CONTENT
TOP ROW OF EACH PAIR : CONSTANT-DOLLAR ANNUAL NET REVENUES AFTER TAXESBOTTOM ROW OF EACH PAIR : CUMULATIVE NET PRESENT VALUE OF CASH FLOWS THROUGH LAST YEAR OF ANALYSIS TERM
$ 1,312,080 $ - $ - $ - $ - $ - $ 5,180,378 $ 5,180,378 $ 5,180,378 $ 5,180,378 $ 5,180,378 $ 5,180,378
$ 1,446,720 $ - $ - $ - $ - $ - $ 3,999,744 $ 3,999,744 $ 3,999,744 $ 3,999,744 $ 3,999,744 $ 3,999,744
$ 86,460 $ - $ - $ - $ - $ - $ (2,686,648) $ (2,686,648) $ (2,686,648) $ (2,686,648) $ (2,686,648) $ (2,686,648)
$ 1,029,600 $ - $ - $ - $ - $ - $ 6,036,244 $ 6,036,244 $ 6,036,244 $ 6,036,244 $ 6,036,244 $ 6,036,244
MAIN CASE GROUP 6LOW TEMPERATURE/PRESSURE AND HIGH GAS CONTENT
TOP ROW OF EACH PAIR : CONSTANT-DOLLAR ANNUAL NET REVENUES AFTER TAXESBOTTOM ROW OF EACH PAIR : CUMULATIVE NET PRESENT VALUE OF CASH FLOWS THROUGH LAST YEAR OF ANALYSIS TERM
$ 1,644,720 $ - $ - $ - $ - $ - $ 3,741,880 $ 3,741,880 $ 3,741,880 $ 3,741,880 $ 3,741,880 $ 3,741,880
$ 2,216,940 $ - $ - $ - $ - $ - $ 9,444,368 $ 9,444,368 $ 9,444,368 $ 9,444,368 $ 9,444,368 $ 9,444,368
$ 83,160 $ - $ - $ - $ - $ - $ (2,663,636) $ (2,663,636) $ (2,663,636) $ (2,663,636) $ (2,663,636) $ (2,663,636)
$ 1,235,520 $ - $ - $ - $ - $ - $ 6,506,209 $ 6,506,209 $ 6,506,209 $ 6,506,209 $ 6,506,209 $ 6,506,209
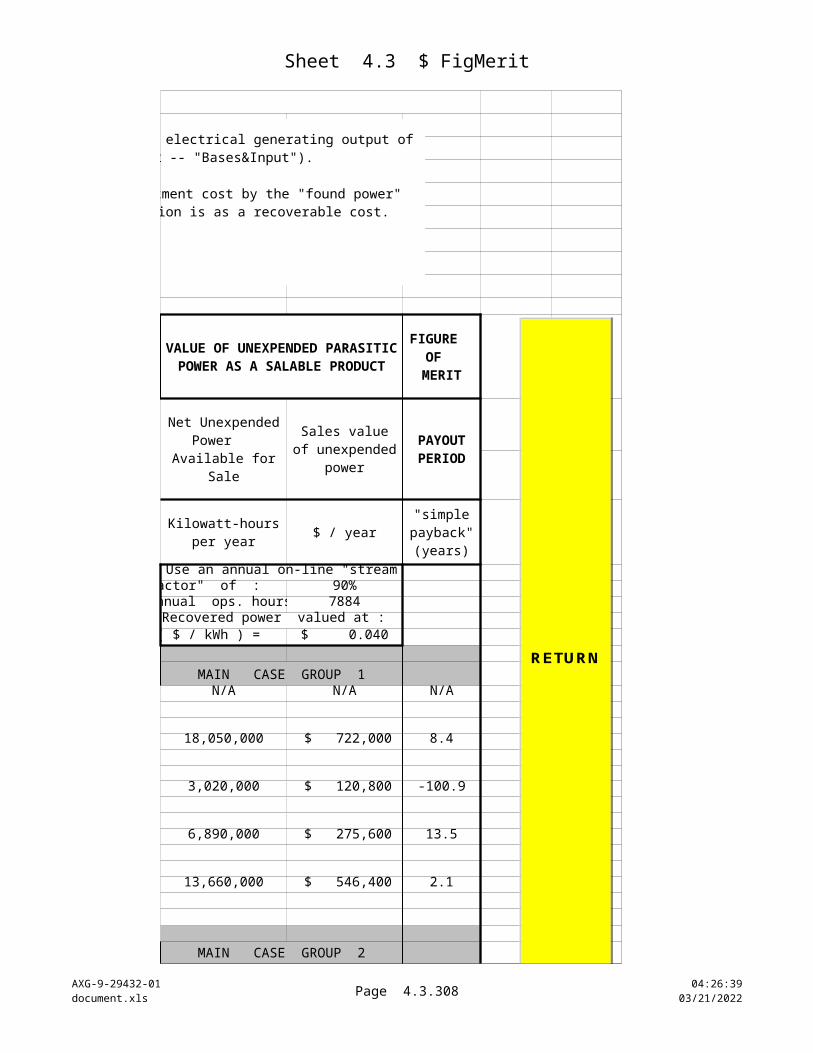
4.3b Present Values
AXG-9-20432-01document.xls
Page 4.3b.308 10:22:2604/18/2023
CASH FLOW RESULTS -- CONSTANT-DOLLAR ANNUAL AND DISCOUNTED CUMULATIVE NET PRESENT VALUES
10 11 12 13 14 15
1 0 0 0 0 0
0 0 0 0 0 0
0.4700 0.0000 0.0000 0.0000 0.0000 0.0000
0.0000 0.0000 0.0000 0.0000 0.0000 0.0000 1.0000 1.0000 1.0000 1.0000 1.0000 1.0000
MAIN CASE GROUP 7LOW TEMPERATURE/PRESSURE AND VERY HIGH GAS CONTENT
TOP ROW OF EACH PAIR : CONSTANT-DOLLAR ANNUAL NET REVENUES AFTER TAXESBOTTOM ROW OF EACH PAIR : CUMULATIVE NET PRESENT VALUE OF CASH FLOWS THROUGH LAST YEAR OF ANALYSIS TERM
$ 48,840 $ - $ - $ - $ - $ - $ (26,304,322) $ (26,304,322) $ (26,304,322) $ (26,304,322) $ (26,304,322) $ (26,304,322)
$ 3,587,760 $ - $ - $ - $ - $ - $ 20,072,093 $ 20,072,093 $ 20,072,093 $ 20,072,093 $ 20,072,093 $ 20,072,093
$ 209,880 $ - $ - $ - $ - $ - $ (1,559,220) $ (1,559,220) $ (1,559,220) $ (1,559,220) $ (1,559,220) $ (1,559,220)
$ 393,360 $ - $ - $ - $ - $ - $ (3,792,977) $ (3,792,977) $ (3,792,977) $ (3,792,977) $ (3,792,977) $ (3,792,977)
MAIN CASE GROUP 8HIGH TEMPERATURE/PRESSURE AND VERY HIGH GAS CONTENT
TOP ROW OF EACH PAIR : CONSTANT-DOLLAR ANNUAL NET REVENUES AFTER TAXESBOTTOM ROW OF EACH PAIR : CUMULATIVE NET PRESENT VALUE OF CASH FLOWS THROUGH LAST YEAR OF ANALYSIS TERM
$ 175,560 $ - $ - $ - $ - $ - $ (8,306,125) $ (8,306,125) $ (8,306,125) $ (8,306,125) $ (8,306,125) $ (8,306,125)
$ (56,760) $ - $ - $ - $ - $ - $ (3,910,247) $ (3,910,247) $ (3,910,247) $ (3,910,247) $ (3,910,247) $ (3,910,247)
$ (223,740) $ - $ - $ - $ - $ - $ (3,153,218) $ (3,153,218) $ (3,153,218) $ (3,153,218) $ (3,153,218) $ (3,153,218)
$ 349,800 $ - $ - $ - $ - $ - $ 59,873 $ 59,873 $ 59,873 $ 59,873 $ 59,873 $ 59,873
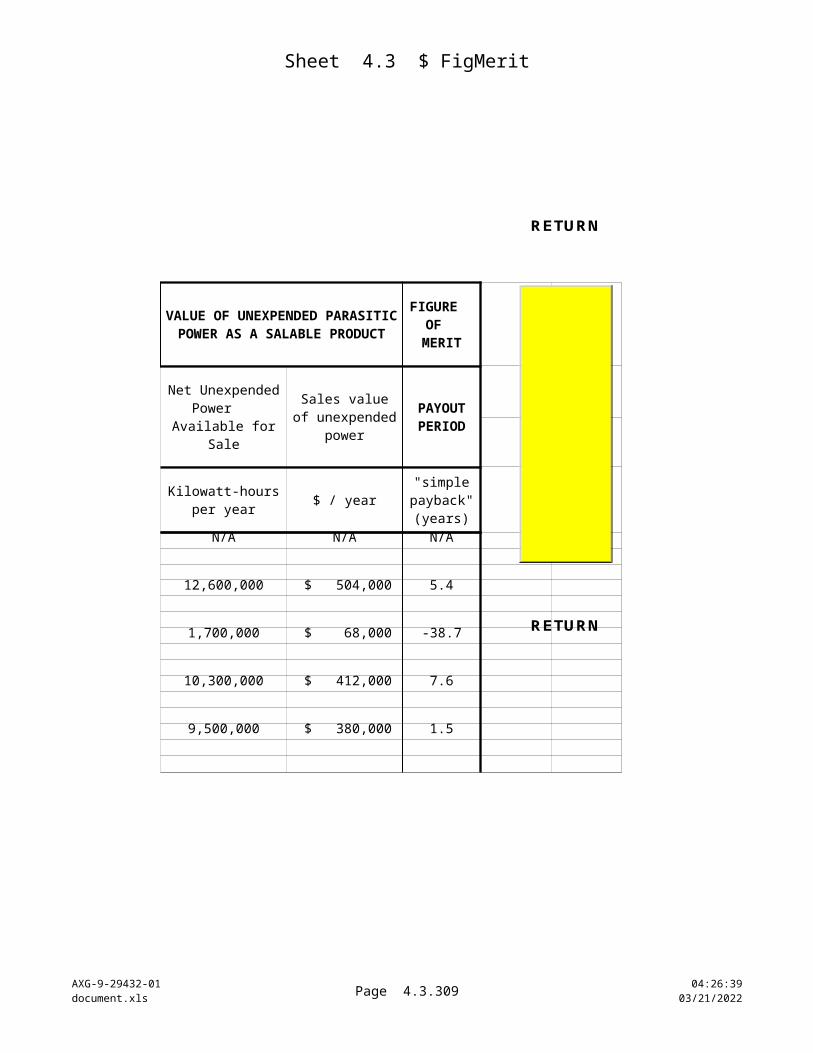
Sheet 4.4 CostData
AXG-9-29432-01document.xls
Page 4.4.309 10:22:2604/18/2023
CAPACITY CAPACITY
VALUE UNITS COST VALUE
Plant Bases for Ejector Design Case:(high temperature/pressure, mid gas case)
2-Stage System Ejectors, condensers motive 224,000 $ 500,000 EJECTOR DESIGN BASES (hi temp, mid gas Base Case)Installation factor steam lb / hr 2.5 Stage
data Installed system cost 110 psia $ 1,250,000
motive 13-Stage System Ejectors, condensers steam 175,000 $ 700,000
Installation factor data lb / hr 2.5 2
Installed system cost 110 psia $ 1,750,000
Assume steam jet expansion nozzle velocity reaches a maximum of :Assume eductor with flashing brine is only allowed a max. velocity of :The flashing brine or flashed steam temperature is :The flashing brine or flashed steam pressure is :
(use the high temperature case -- more optimistic for brine, allowing higher energy recovery) Steam density is (approximately, not solving for gas effects) :Water density (not solving for dissolved solids) : Estimate flash of brine yields weight percent vapor quality as :Average bulk density of flashing brine is :Estimated brine flow rate from main flash tank :
eductor drive fluid, as flashing 2-phase mixture : Steam volumetric flow rate :
(refer to above ejector quote data for mass flow)Plant Bases for Eductor Design Case: Gas loading in plant flashed steam(high temperature/pressure, mid gas case)
932,000 lb / hr flashed steam an eductor system as the ratio of areas for the estimated flowrates 29,900 ppmv CO2 NCG and assumed velocity limits :
Power-law exponent for ejector systems : This size ratio is now used to apply the power law for roughly estimating theinstalled cost of a brine-driven eductor system :
COST = (Ejector System Price) x (area ratio) exp. (Cost factor) =
HARDWARE COMPONENTS & SYSTEM PACKAGES
at 334 oF
at 334 oF
AREA = volumetric flow / velocity -- so solve for the
CAPITAL AND OPERATING COST DATA FOR GEOTHERMAL POWER PLANTS AND EQUIPMENT SYSTEMS AND COMPONENTS
STEAM JET EJECTOR SYSTEM - ejectors with barometric after-stage condensers
BIPHASE EDUCTOR SYSTEM - - eductors with barometric after-stage condensers. Overall eductor system sizing will be roughly proportional to the estimated brine leaving the plant feed flash system. See Main Case Summaries, Sensitivity Case Summaries.
Design bases are steam and brine flows from the high temperature/pressure and medium gas Base Case.
NOTE : Shaded entries may be adjusted by the user.
RETURN
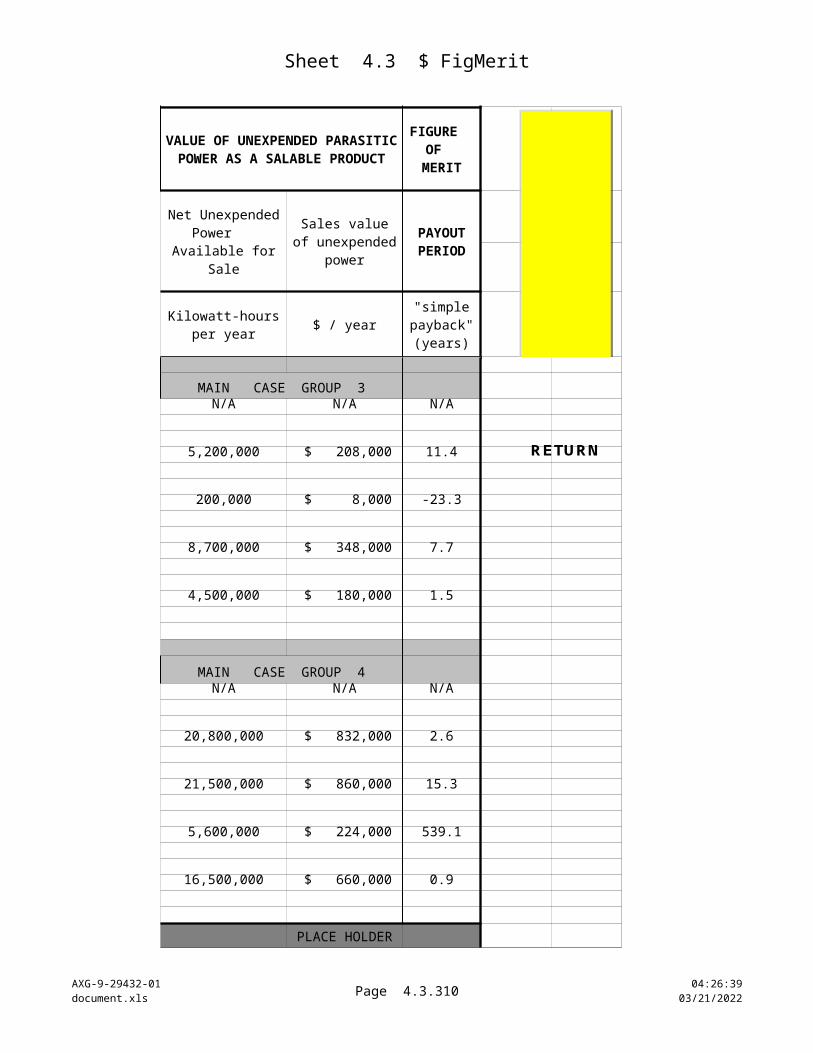
Sheet 4.4 CostData
AXG-9-29432-01document.xls
Page 4.4.310 10:22:2604/18/2023
TURBOCOMPRESSOR UNITS installed costs -- single unitsInstallation Factor : 1.50 Installation Factor :
16 - inch compressor $ 300,000 24 - inch compressor
CASE NONCONDENSABLE GAS3-STAGE COMPRESSOR SYSTEM INSTALLED HYBRIDGROUP RATES (*) lb / hour 1 2 3 SYSTEM 3rd STAGE
load gas drive gas 24 - inch 24 - inch 16 - inch COSTS 16 - inchBase B-1 110,224 13,293 6 4 4 $ 4,800,000 4
Cases B-2 65,365 4,845 3 2 2 $ 2,400,000 2B-3 21,541 524 2 2 1 $ 1,740,000 1B-4 34,952 1,340 2 2 2 $ 2,040,000 2B-5 105,976 12,709 6 4 4 $ 4,800,000 4B-6 178,383 34,787 12 8 8 $ 9,600,000 8B-7 561,889 268,174 45 28 28 $ 34,680,000 28B-8 226,036 49,509 16 10 10 $ 12,360,000 10
Sensitivity S-1 110,224 13,293 6 4 4 $ 4,800,000 4Cases S-2 35,012 1,345 2 2 2 $ 2,040,000 2
S-3 71,320 4,896 4 3 2 $ 3,120,000 2S-4 39,477 1,404 3 2 2 $ 2,400,000 2S-5S-6S-7
(*) Gas rates also carry matching steam loads at equilibrium conditions.
STEAM REBOILER -- Put 2 plant estimates on common capacity basis :
6- year escalation : As Estimated Sizing exponent :
Estimate for an Installed Plant 20 megawatts $ 2,782,000 53.7Bases :Flashed Steam (lb/hr) : 4.16E+05 for 20 MW capacity
324 - 346 approx.Pressure (psia) 95 - 128Gas Conc. (ppmv) 25,400
Installation Factor : Quotation Estimate for Bare Equipment : 53.7
Quotation Bases : Equivalent CapacityFlashed Steam (lb/hr) : 1.00E+06
335Pressure (psia) 110Gas Conc. (ppmv) 30,000 Equivalent Capacity : 53.7 MW Gross Output
Installed Costs -- integrated vacuum systems
Temperature (oF)
Temperature (oF)
Above from 1993 Parsons Main, Inc. report to PNOC; "conservative values," per personal communication, Dr. G.E. Coury
Bare eqp. and install. factor from Swenson Process Equipment, Inc., Seattle, WA, 9/99 : 316L S/S vertical tube evaporator, flash tank, recirc. piping, and recirc. pump. C/S support structure.
This case basis is effectively the high-temperature, mid-gas case for the present study.
Above is escalated from basis at left and scaled up to capacity equiva,lent to basis below quoted from Swenson.
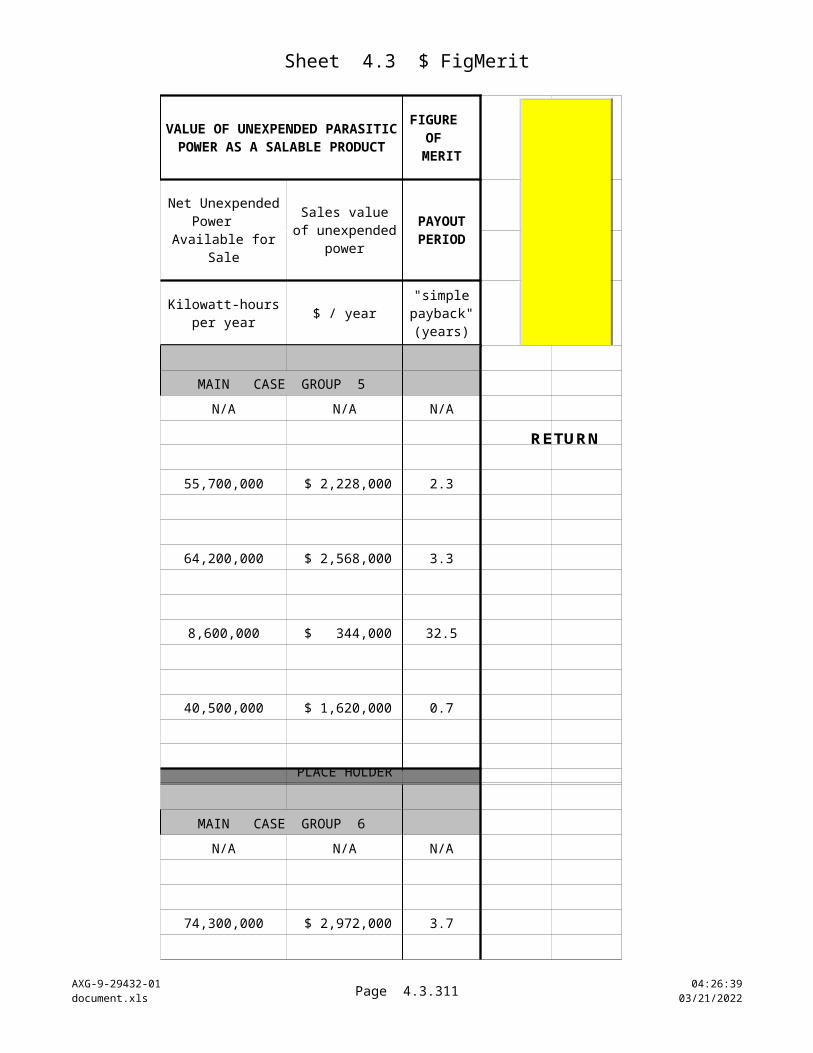
Sheet 4.4 CostData
AXG-9-29432-01document.xls
Page 4.4.311 10:22:2604/18/2023
Sizing basis, (MW)
883
H2S GAS TREATMENT SYSTEMBasis Units
(plant flashed steam feed )1.00E+06 lb/hr steam 3.00E+04 ppmv CO2
1000 ppmv H2S
UNECO Treating Systems, Inc. Caustic H2S Scrubbing Installed System Cost $ 3,000,000 install incl.
Operating Cost $ 13,809 per day (maint. incl.)
US Filter / LO-CAT II Chelation/Reduction H2S Scrubbing
System Cost $ 5,250,000 skid systems Operating Cost $ 3,334 per day
(w/o maint.) Installation factor 1.5
Installed cost $ 7,875,000
Now take the average of the above two cases and scale up : AVG. REBOILER INSTALLED COST
Steam latent heat at 335 oF (Btu/lb) = Steam latent heat at 234 oF (Btu/lb) =
For estimating reboiler size and cost changes for differing cases, the primary basis of this study is the 50 MW plant power capacity. Costs at different generating capacities and the same steam conditions are based on the gross power ratio raised to a power factor. (see "Bases & Input" worksheet).To calculate reboiler system price changes with differing steam conditions, the capacity factor includes ratios of the values of the clean steam flow to the power turbine, and latent heats of evaporation of steam at the two conditions being considered. This applies to capital cost calculations for the low-temperature case studies. For the high-temperature case studies, the latent heat values drop out of the power factor ratios. The clean steam flowrate is theappropriate heat exchanger sizing basis, because for wide-ranging values of gas concentrations, using the flashed-steam mass flow ratios would distort the sizing adjustments to the heat transfer area in the reboiler.
This is the nominal basis for a 50 MW power plant using the steam feed from the high temperature, medium gas case of this study.
This study neglects potential changes in H2S levels from those given here. Such a change would presumably drive the operating costs in rough proportion to the H2S levels.
This study assumes the sulfur treatment system capital costs for the low-temperature bases will be roughly equal to the values stated at right.
These values are not currently included in the economic figure of merit valuations. These values are for reference regarding the consideration of potentially eliminating gas treatment in favor of reinjecting untreated noncondensable gases.
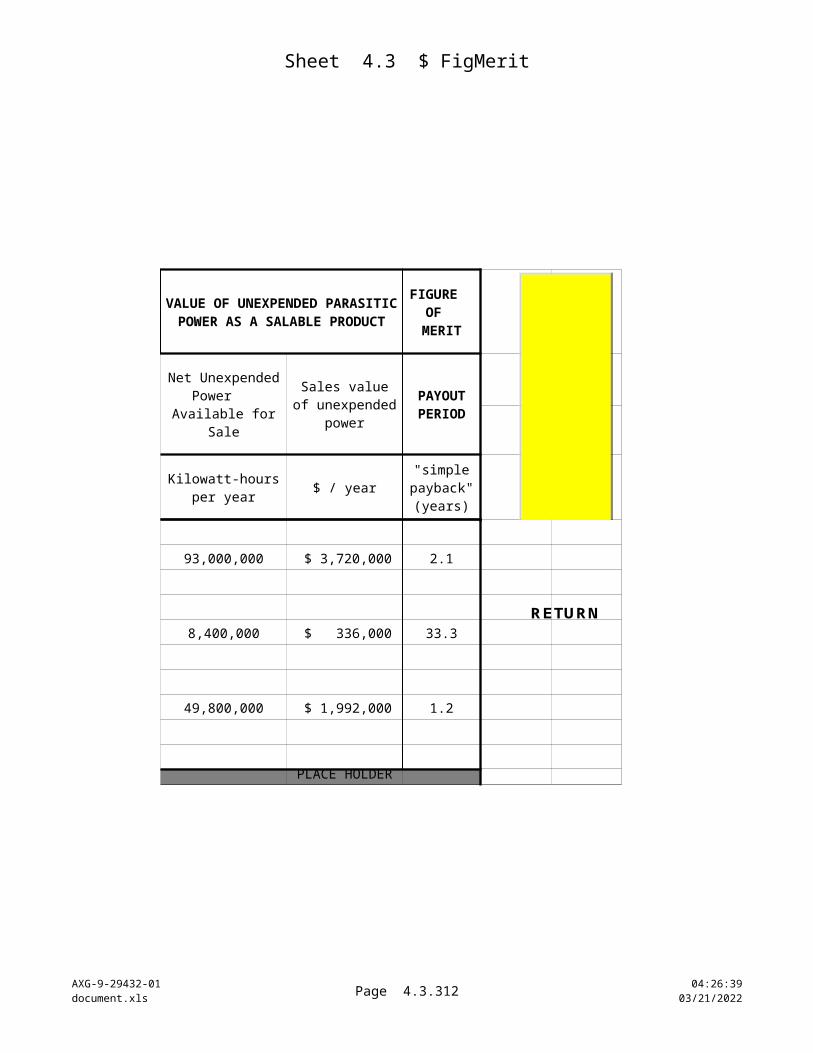
Sheet 4.4 CostData
AXG-9-29432-01document.xls
Page 4.4.312 10:22:2604/18/2023
CAPACITY CAPACITY
UNITS COST VALUE UNITS COST
Plant Bases for Ejector Design Case: 932,000 lb / hr flashed steam(high temperature/pressure, mid gas case) 29,900 ppmv CO2 NCG
EJECTOR DESIGN BASES (hi temp, mid gas Base Case) Load Gases Stage Pressure Ratio
Steam CO2 lb / hr lb / hr59,300 52,400 3.4
5,700 44,000 2.9
Assume steam jet expansion nozzle velocity reaches a maximum of : 3,000 ft / secAssume eductor with flashing brine is only allowed a max. velocity of : 500 ft / secThe flashing brine or flashed steam temperature is : 334The flashing brine or flashed steam pressure is : 110 psia
(use the high temperature case -- more optimistic for brine, allowing higher energy recovery) Steam density is (approximately, not solving for gas effects) : 0.244 lb / cu.ft.Water density (not solving for dissolved solids) : 56.1 lb / cu.ft.Estimate flash of brine yields weight percent vapor quality as : 7%Average bulk density of flashing brine is : 3.30 lb / cu.ft.Estimated brine flow rate from main flash tank : 1,356,000 lb / hr
as saturated liquid : 3,011 gal / min.eductor drive fluid, as flashing 2-phase mixture : 114 cu. ft. / sec.
ejector drive gas : 254 cu. ft. / sec.(refer to above ejector quote data for mass flow)
29,900 ppmv
an eductor system as the ratio of areas for the estimated flowrates
A(educt) / A (eject) = 2.7
Power-law exponent for ejector systems : 0.6This size ratio is now used to apply the power law for roughly estimating theinstalled cost of a brine-driven eductor system :
COST = (Ejector System Price) x (area ratio) exp. (Cost factor) = $ 2,263,194 installed cost
oF
AREA = volumetric flow / velocity -- so solve for the relative size of
CAPITAL AND OPERATING COST DATA FOR GEOTHERMAL POWER PLANTS AND EQUIPMENT SYSTEMS AND COMPONENTS
NOTE : Shaded entries may be adjusted by the user.
NOTE: overall ejector system sizing will be roughly proportional to plant power turbine feed steam flow rates and gas loading.
RETURN
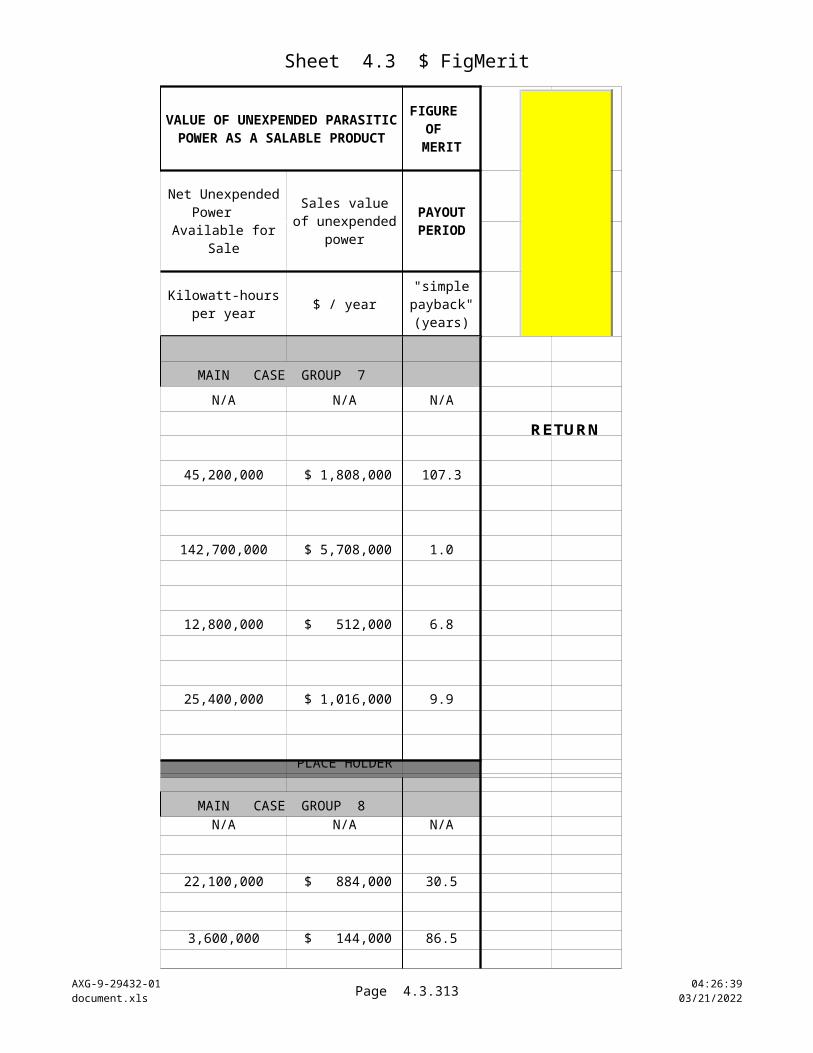
Sheet 4.4 CostData
AXG-9-29432-01document.xls
Page 4.4.313 10:22:2604/18/2023
Installation Factor : 1.50 24 - inch compressor $ 360,000
INSTALLED 3rd STAGE
COST $ 1,200,000 $ 600,000 $ 300,000 $ 600,000 $ 1,200,000 $ 2,400,000 $ 8,400,000 $ 3,000,000 $ 1,200,000 $ 600,000 $ 600,000 $ 600,000
6- year escalation : 1.19 Sizing exponent : 0.6
megawatts $ 6,010,549 installed cost
Installation Factor : 1.50 MW $ 3,500,000 bare eqp. cost
Equivalent Capacity 5,250,000 installed cost
Bare eqp. and install. factor from Swenson Process Equipment, Inc., Seattle, WA, 9/99 : 316L S/S vertical tube evaporator, flash tank, recirc. piping, and recirc. pump. C/S support structure.
This case basis is effectively the high-temperature, mid-gas case for the present study.
NOTE: overall turbo-compressor system sizing will be roughly proportional to plant power turbine feed steam flow rates and NCG loading, accounting also for drive gas loading.
The turbocompressor units are staged and combined in parallel for the economic figure of merit cases, according to the capacities needed to evacuate case-specific gas and steam flow rates from the condenser train. The matching of specific unit counts for each case is based on examples from Barber-Nichols. Price data obtained 7/99.
Above is escalated from basis at left and scaled up to capacity equiva,lent to basis below quoted from Swenson.
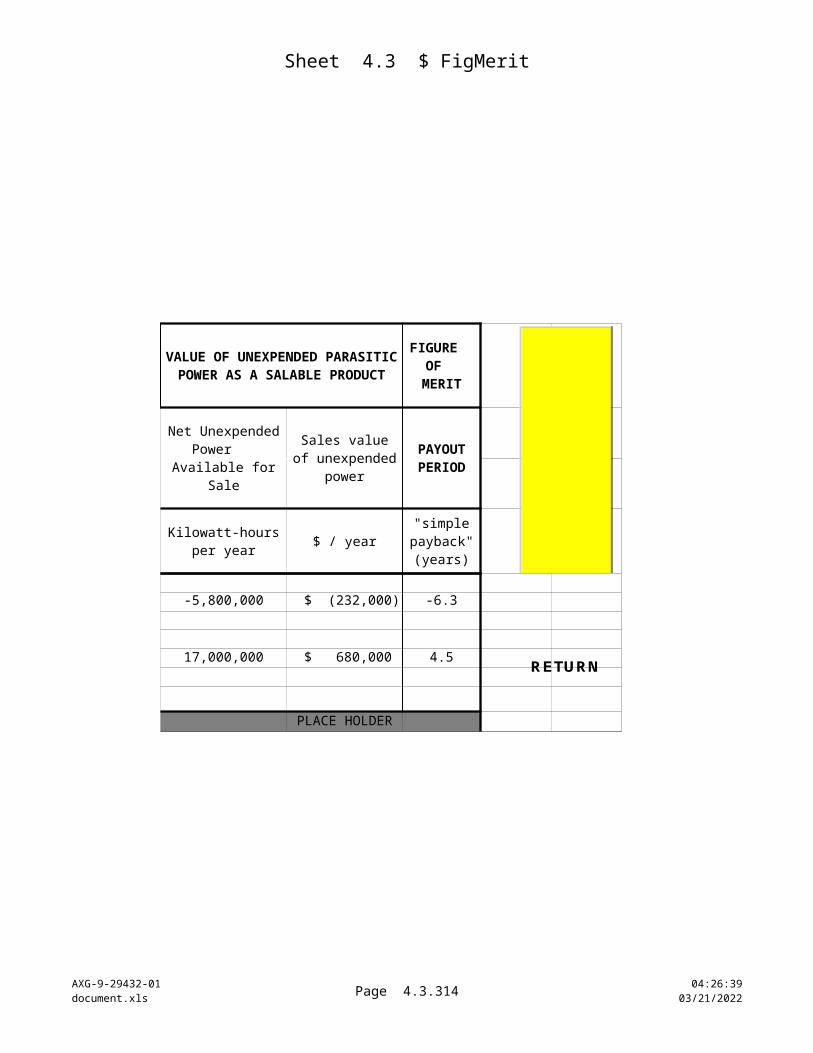
Sheet 4.4 CostData
AXG-9-29432-01document.xls
Page 4.4.314 10:22:2604/18/2023
$ 5,392,000 Reference conditions are the high- Sizing basis, (MW) 50.0 temperature, mid-gas Main Case Group No. 2
956
AVG. REBOILER INSTALLED COST =
Steam latent heat at 234 oF (Btu/lb) =
For estimating reboiler size and cost changes for differing cases, the primary basis of this study is the 50 MW plant power capacity. Costs at different generating capacities and the same steam conditions are based on the gross power ratio raised to a power factor. (see "Bases & Input" worksheet).To calculate reboiler system price changes with differing steam conditions, the capacity factor includes ratios of the values of the clean steam flow to the power turbine, and latent heats of evaporation of steam at the two conditions being considered. This applies to capital cost calculations for the low-temperature case studies. For the high-temperature case studies, the latent heat values drop out of the power factor ratios. The clean steam flowrate is theappropriate heat exchanger sizing basis, because for wide-ranging values of gas concentrations, using the flashed-steam mass flow ratios would distort the sizing adjustments to the heat transfer area in the reboiler.
This is the nominal basis for a 50 MW power plant using the steam feed from the high temperature, medium gas case of this study.
This study neglects potential changes in H2S levels from those given here. Such a change would presumably drive the operating costs in rough proportion to the H2S levels.
This study assumes the sulfur treatment system capital costs for the low-temperature bases will be roughly equal to the values stated at right.
These values are not currently included in the economic figure of merit valuations. These values are for reference regarding the consideration of potentially eliminating gas treatment in favor of reinjecting untreated noncondensable gases.

Sheet 5. SensiComp
AXG-9-29432-01document.xls
Page 5.315 10:22:2604/18/2023
EFFECTS OF DESIGN AND SITE OPERATING PARAMETERS
This worksheet compares the performance of the gas removal technologies at discrete data points for changed assumptions about (1) the prevailing wet bulb temperature at a plant site, and (2) a reduced value of the net efficiency of conventional steam jet ejectors. The comparisons show the change in the technical and economic figures of merit for each noncondensable gas removal technology for alternative assumptions.
The first comparison tests the differences resulting from changing the assumed steam jet ejector efficiency from 23 percent to 15 percent. The 23 percent value is the basis for the main cases in this study. This parameter does not directly change the various alternative technologies' performance abilities. Instead, since the figures of merit are relative values that compare the performance of gas removal alternatives to conventional steam jet ejector systems, the change in ejector efficiency shows up ultimately as changes in the technical figure of merit and payback periods needed to recover the costs of conversion to the alternative gas removal systems.
The second change of conditions looks at a site ambient wet bulb temperature of 80 oF, compared to the value of 60 oF used in the main cases of this study. Raising the wet bulb temperature hinders the heat rejection system. It also imposes a higher backpressure on the power turbine, leading to increased brine and steam flows through the power system. There is not much evident change in vacuum system drive gas demand, but cooling system electrical loads tend to increase slightly.
The "Relative Change" parameter under the "Economic" heading below indicates the economic impact of changes in system operation at the alternative conditions. For the cases looking at ejector efficiencies, the changes are rated as percent change in the payback period at the reduced ejector efficiency compared to that of the main case results. A positive percent values represents a reduction in the payback period, which is good. But beware of anomolous cases, e.g. comparing positive and negative payback estimates. A negative payback indicates the conversion case could never pay for itself, so any positive payback looks good by comparison. Also, a reduction in the payback period may be essentially meaningless when comparing two very large numbers or two negative numbers, for example -- neither option in such cases would be attractive for capital investment.
If actual steam jet ejector efficiencies do turn out to be about 15 percent, instead of the main-case basis of 23 percent, the economic argument for the alternative gas removal technologies would be better, showing modest to strong reductions in the payback periods to recoup capital costs. This occurs because at lower steam jet efficiencies, the gas removal options would realize higher reductions in the parasitic steam demand, yielding higher cost savings in operation.
The Relative Change parameter for the cases looking at the effects of different wet bulb temperatures is a simple ratio of payback periods. A fractional value would indicate that the alternative conditions result in shorter payback periods. A whole number or negative value of the Relative Change parameter indicates that the alternative technology loses ground compared to the same case at lower wet bulb temperature.
Raising the ambient wet bulb temperature always extends the payback periods for converting to alternative gas removal processes. Comparing negative payback values gives anomalous results.
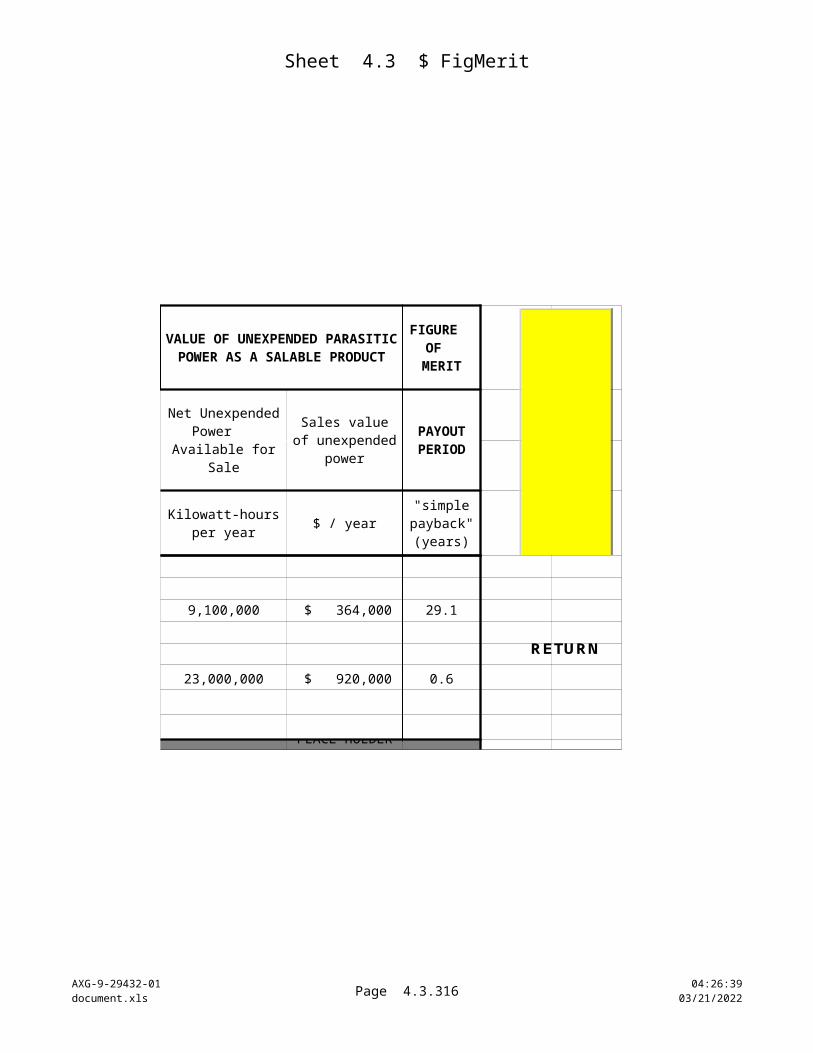
Sheet 5. SensiComp
AXG-9-29432-01document.xls
Page 5.316 10:22:2604/18/2023
TECHNOLOGY Produced Flashed Wet Steam JetFluid Steam Bulb Ejector
Temperature Gas Level Temperature Efficiencyppmv Percent
3-Stage Turbocompressor 550 49,900 60 1523
Reboiler 1523
Biphase Eductor 1523
Hybrid Ejector / Turbo. 1523
3-Stage Turbocompressor 350 10,100 60 1523
Reboiler 1523
Biphase Eductor 1523
Hybrid Ejector / Turbo. 1523
3-Stage Turbocompressor 550 30,400 60 2380
Reboiler 6080
Biphase Eductor 6080
Hybrid Ejector / Turbo. 6080
3-Stage Turbocompressor 350 10,100 60 2380
Reboiler 6080
Biphase Eductor 6080
Hybrid Ejector / Turbo. 6080
oF oF
High-temperature cases at 50,000 ppmv gas loads in flashed geothermal steam, compar-ing 15 % versus 23 % steam jet ejector efficiencies.
Low-temperature cases at 10,000 ppmv gas loads in flashed geothermal steam, compar-ing 15 % versus 23 % steam jet ejector efficiencies.
Low-temperature cases at 10,000 ppmv gas loads in flashed geothermal steam, comparing different wet bulb temperatures.
High-temperature cases at 50,000 ppmv gas loads in flashed geothermal steam, comparing different wet bulb temperatures.
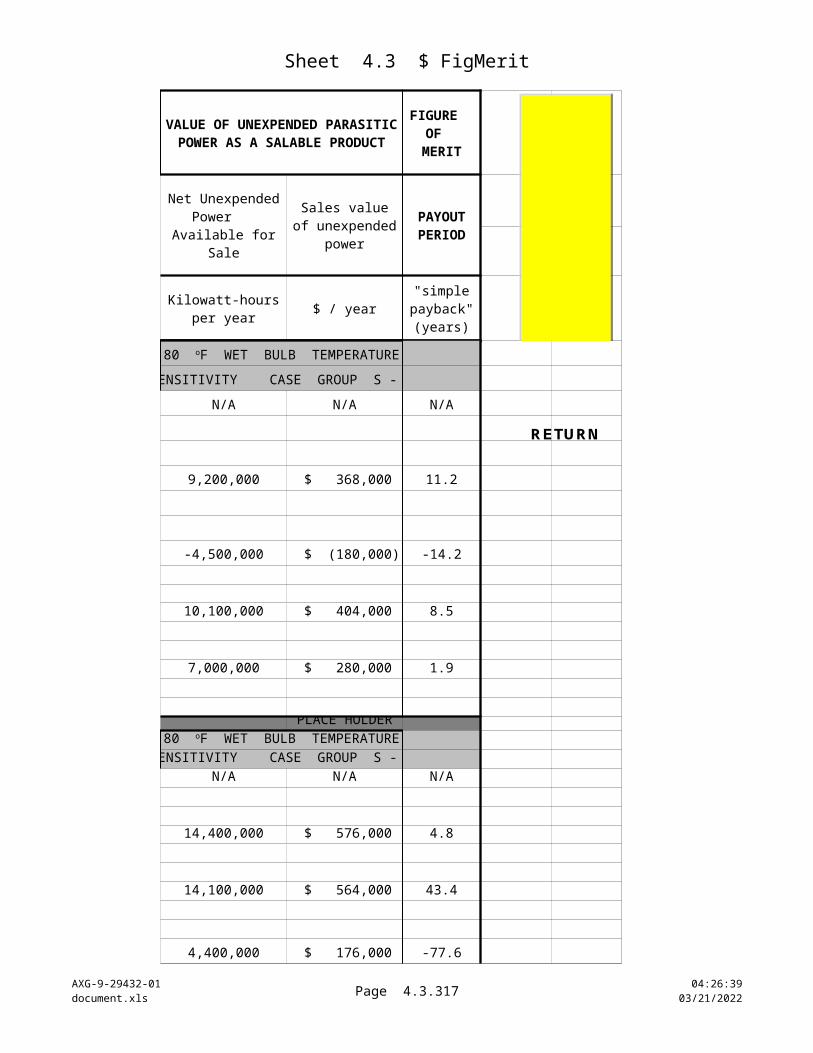
Sheet 5. SensiComp
AXG-9-29432-01document.xls
Page 5.317 10:22:2604/18/2023
EFFECTS OF DESIGN AND SITE OPERATING PARAMETERS
This worksheet compares the performance of the gas removal technologies at discrete data points for changed assumptions about (1) the prevailing wet bulb temperature at a plant site, and (2) a reduced value of the net efficiency of conventional steam jet ejectors. The comparisons show the change in the technical and economic figures of merit for each noncondensable gas removal technology for alternative assumptions.
The first comparison tests the differences resulting from changing the assumed steam jet ejector efficiency from 23 percent to 15 percent. The 23 percent value is the basis for the main cases in this study. This parameter does not directly change the various alternative technologies' performance abilities. Instead, since the figures of merit are relative values that compare the performance of gas removal alternatives to conventional steam jet ejector systems, the change in ejector efficiency shows up ultimately as changes in the technical figure of merit and payback periods needed to recover the costs of conversion to the alternative gas removal systems.
The second change of conditions looks at a site ambient wet bulb temperature of 80 oF, compared to the value of 60 oF used in the main cases of this study. Raising the wet bulb temperature hinders the heat rejection system. It also imposes a higher backpressure on the power turbine, leading to increased brine and steam flows through the power system. There is not much evident change in vacuum system drive gas demand, but cooling system electrical loads tend to increase slightly.
The "Relative Change" parameter under the "Economic" heading below indicates the economic impact of changes in system operation at the alternative conditions. For the cases looking at ejector efficiencies, the changes are rated as percent change in the payback period at the reduced ejector efficiency compared to that of the main case results. A positive percent values represents a reduction in the payback period, which is good. But beware of anomolous cases, e.g. comparing positive and negative payback estimates. A negative payback indicates the conversion case could never pay for itself, so any positive payback looks good by comparison. Also, a reduction in the payback period may be essentially meaningless when comparing two very large numbers or two negative numbers, for example -- neither option in such cases would be attractive for capital investment.
If actual steam jet ejector efficiencies do turn out to be about 15 percent, instead of the main-case basis of 23 percent, the economic argument for the alternative gas removal technologies would be better, showing modest to strong reductions in the payback periods to recoup capital costs. This occurs because at lower steam jet efficiencies, the gas removal options would realize higher reductions in the parasitic steam demand, yielding higher cost savings in operation.
The Relative Change parameter for the cases looking at the effects of different wet bulb temperatures is a simple ratio of payback periods. A fractional value would indicate that the alternative conditions result in shorter payback periods. A whole number or negative value of the Relative Change parameter indicates that the alternative technology loses ground compared to the same case at lower wet bulb temperature.
Raising the ambient wet bulb temperature always extends the payback periods for converting to alternative gas removal processes. Comparing negative payback values gives anomalous results.
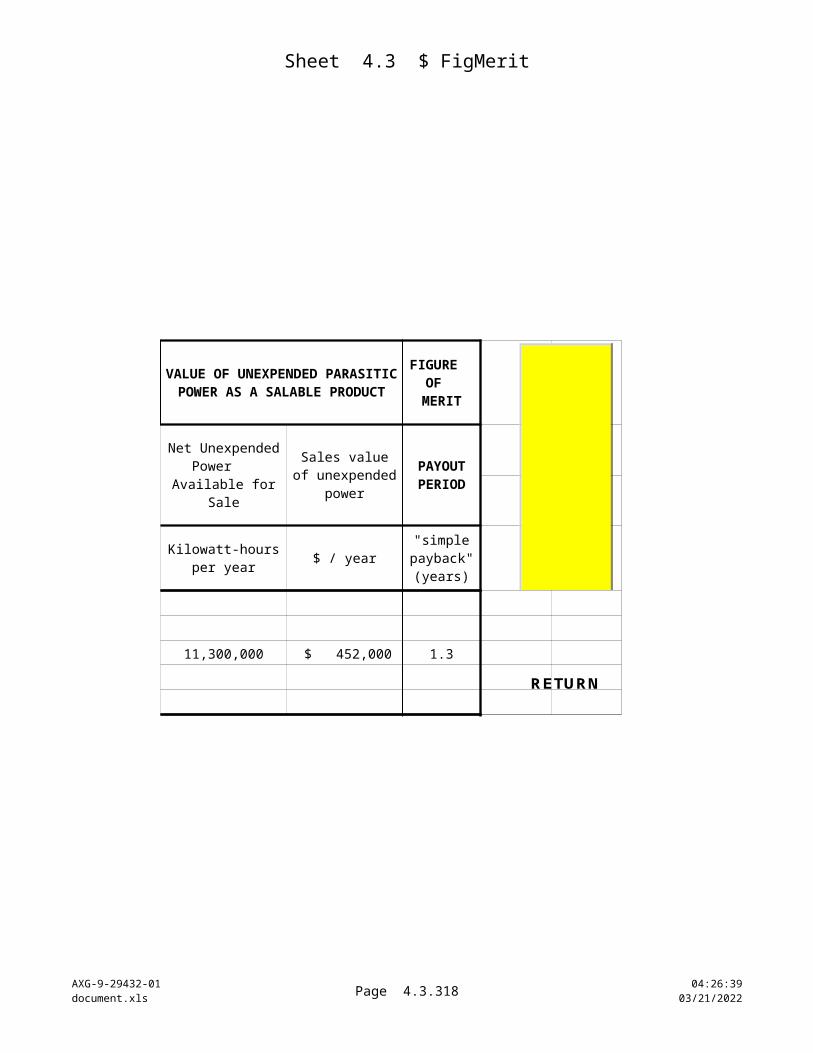
Sheet 5. SensiComp
AXG-9-29432-01document.xls
Page 5.318 10:22:2604/18/2023
Figures of MeritTechnical Economic
Payback Relative Years Change
1.18 2.6 69%1.06 8.4 xx1.13 4.4 104%1.01 -100.9 xx1.04 6.1 55%1.02 13.5 xx1.09 1.2 41%1.05 2.1 xx
1.12 1.5 43%1.07 2.6 xx1.12 7.1 54%1.07 15.3 xx1.03 29.1 95%1.02 539.1 xx1.08 0.644 27.91%1.05 0.893 xx
1.03 5.4 xx1.04 11.2 2.10.99 -38.7 xx1.01 -14.2 0.41.03 7.6 xx1.03 8.5 1.11.02 1.5 xx1.03 1.9 1.3
1.04 2.6 xx1.07 4.8 1.81.04 15.3 xx1.07 43.4 2.81.01 539.1 xx1.02 -77.6 -0.11.04 0.89 xx1.05 1.28 1.4