Embed Size (px)
Citation preview

29 - 31 March 2004 1
“Experience Gained from the Mexican Nuclear Regulatory Authority in the
Probabilistic Safety Assessment Level 2 Development for Laguna Verde NPP”
Cologne, GermanyCologne, Germany
INTERNATIONAL WORKSHOP ON LEVEL 2 PSA AND SEVERE ACCIDENT MANAGEMENT
OECD/NEA

29 - 31 March 2004 2
PSA for Laguna Verde NPP
Individual Plant ExaminationIndividual Plant Examination
Mexican Regulatory Authority developed Mexican Regulatory Authority developed an independent PSA level 2 model.an independent PSA level 2 model.
Review ProcessReview Process

29 - 31 March 2004 3
Level 2 PSA Methodologies
Utility used the methodology of small event Utility used the methodology of small event tree-large fault tree developed by the tree-large fault tree developed by the Electrical Power Research Institute (EPRI) Electrical Power Research Institute (EPRI) of the USAof the USA
CNSNS used:CNSNS used: NUREG-1150 (Accident Progression NUREG-1150 (Accident Progression
Event Tree, APET)Event Tree, APET)

29 - 31 March 2004 4
Laguna Verde Plant / Containment Characteristics
Two BWR/5, 2027 MWtTwo BWR/5, 2027 MWt Unit 1 began its commercial operation in 1990 and Unit Unit 1 began its commercial operation in 1990 and Unit
2 in 1995.2 in 1995.
Fuel mass: 92 041 kg Fuel mass: 92 041 kg
Zirconium mass: 34908 kgZirconium mass: 34908 kg
MARK II ContainmentMARK II Containment

29 - 31 March 2004 5
Laguna Verde Nuclear Power Plant
Mark II Containment

29 - 31 March 2004 6
Laguna Verde. Plant / Containment Characteristics
Containment volume 10907 mContainment volume 10907 m33
Power / Containment volume: 0.18 MWt/mPower / Containment volume: 0.18 MWt/m33
Power / Suppression pool volume: 0.63 Power / Suppression pool volume: 0.63 MWt/mMWt/m33
Several systems to supply coolant injection Several systems to supply coolant injection to the core.to the core.
Depressurization of the vesselDepressurization of the vessel

29 - 31 March 2004 7
Laguna Verde. Plant / Containment Characteristics
Internal design pressure 3.16 kg/cmInternal design pressure 3.16 kg/cm22
Estimated containment failure pressure: Estimated containment failure pressure:
11.6 kg/cm11.6 kg/cm22
Venting pressure 4.2 kg/cmVenting pressure 4.2 kg/cm22 3 Diesel Generators3 Diesel Generators

29 - 31 March 2004 8
Regulatory Authority PSA level 1
PSA LEVEL 1PSA LEVEL 1 CDF: 5.65E-5 reactor / yearCDF: 5.65E-5 reactor / year Station Black Out (43%)Station Black Out (43%)
LEVEL 1 / 2 INTERFACELEVEL 1 / 2 INTERFACE 25 Plant Damage States, which resume the 25 Plant Damage States, which resume the
possible plant states at the moment of core possible plant states at the moment of core damage.damage.

29 - 31 March 2004 9
CNSNS, PSA level 2 Methodology
Accident Progression Event TreeAccident Progression Event Tree 131 Questions about possible events 131 Questions about possible events
Phenomenological aspectsPhenomenological aspectsSystems availabilitySystems availabilityOperator interactionsOperator interactionsConditions before core damageConditions before core damageContainment conditions before and after Containment conditions before and after
vessel breachvessel breachContainment failure modesContainment failure modes
MELCOR code was used to support the APET.MELCOR code was used to support the APET.
29 - 31 March 2004 10
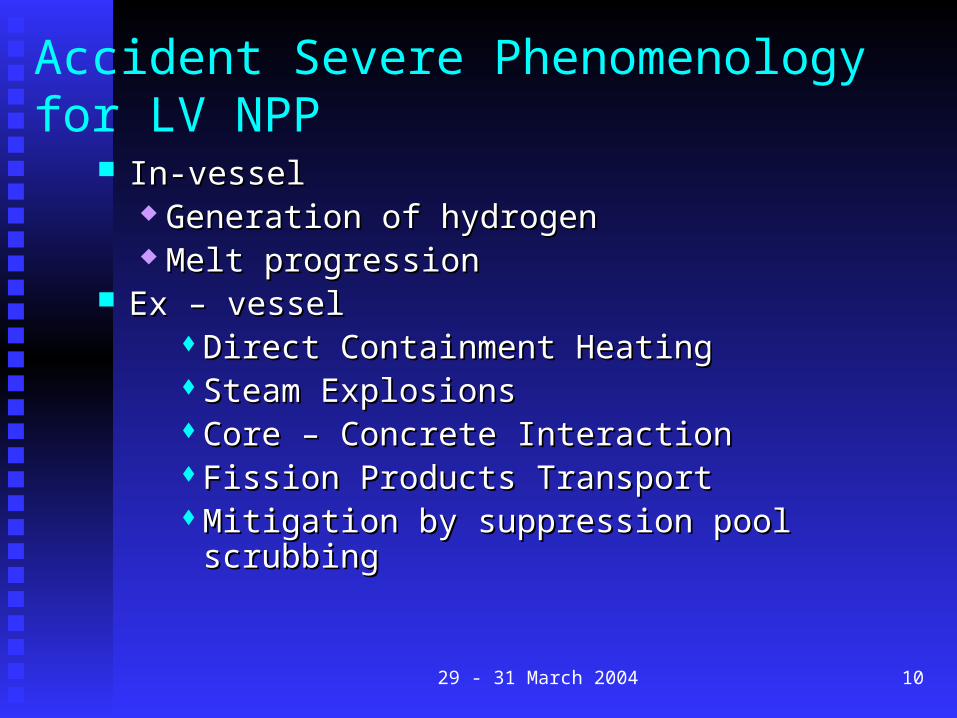
Accident Severe Phenomenology for LV NPP
In-vessel In-vessel Generation of hydrogenGeneration of hydrogen Melt progressionMelt progression
Ex – vesselEx – vesselDirect Containment HeatingDirect Containment HeatingSteam ExplosionsSteam ExplosionsCore – Concrete InteractionCore – Concrete InteractionFission Products TransportFission Products TransportMitigation by suppression pool scrubbingMitigation by suppression pool scrubbing

29 - 31 March 2004 11
Structural Containment Analysis
Containment Failure ModesContainment Failure Modes LeakLeak
Depressurization of the Depressurization of the containment after 2 containment after 2 hrs. (A=92.9 cmhrs. (A=92.9 cm22))
Rupture Rupture Depressurization of the Depressurization of the
containment before or containment before or at 2 hrs. (A=929 cmat 2 hrs. (A=929 cm22))
TemperatureTemperature
((ooK)K)
Pressure Pressure
(Kg/cm(Kg/cm22))
303303 11.611.6
403403 11.111.1
489489 11.111.1
573573 6.86.8
Ultimate Capacity of the Containment

29 - 31 March 2004 12
Accident Progression Event Tree
The quantification process was performed The quantification process was performed by means of the EVNTRE computer codeby means of the EVNTRE computer code Event Progression Analysis Code, Event Progression Analysis Code,
NUREG/CR-5174, Sandia National NUREG/CR-5174, Sandia National Laboratories.Laboratories.
More than 1000 accident progression paths More than 1000 accident progression paths
29 - 31 March 2004 13
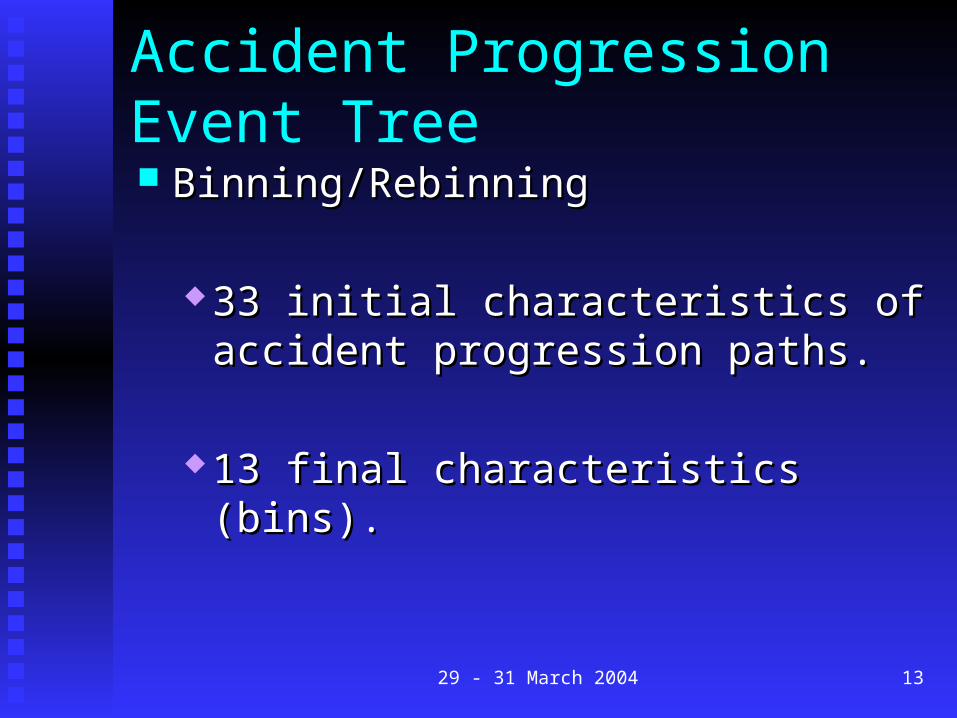
Accident Progression Event Tree
Binning/RebinningBinning/Rebinning
33 initial characteristics of accident 33 initial characteristics of accident progression paths.progression paths.
13 final characteristics (bins).13 final characteristics (bins).

29 - 31 March 2004 14
Source Term Analysis
LVSOR (series XSOR)LVSOR (series XSOR)Parametric equation based on mass Parametric equation based on mass
conservationconservation
• Phenomenon Phenomenon
• Events related with the accident Events related with the accident progressionprogression

29 - 31 March 2004 15
Releases Categories TimingTiming
Early (before 6 hours)Early (before 6 hours) Intermediate (6 to 24 hours)Intermediate (6 to 24 hours) Late (after 24 hours)Late (after 24 hours)
A mount of fission product releasesA mount of fission product releases High (more than 10% of Cs-I)High (more than 10% of Cs-I) Moderate (1% to 10%)Moderate (1% to 10%) Low (less than 1%)Low (less than 1%)

29 - 31 March 2004 16
Individual Plant Examination
9 PDS9 PDS
Containment Event Tree developed for the Containment Event Tree developed for the Accident Progression Analysis.Accident Progression Analysis.
50 to 400 accident progression paths for every 50 to 400 accident progression paths for every Containment Event TreeContainment Event Tree
Codes: CAFTA and MAAPCodes: CAFTA and MAAP

29 - 31 March 2004 17
Containment Failure Mode for LVNPP (CNSNS study)
CONTAINMENT FAILURE
MODE
ATWS
(5.73E-06)
LOCA
( 5.49E-07)
SBO
( 4.41E-05)
T-LOCA
( 4.58E-06)
TRANS
(1.54E-06)
ALL
(5.65E-05)*
Containment failure before vessel breach.
The vessel breach occurs at high
pressure.
0.9 %
37%
8.7%
29 %
Containment failure before vessel breach.
The vessel breach occurs at low
pressure.
0.1%
90%
55.7%
78 %
7.5 %
Containment failure at/near the
vessel breach.
7%
10 %
15%
14%
13%
14%
Containment failure after
vessel breach.
92%
40%
20.6%
42.5%
There is not release to the environment.
7.5%
9.6%
7%

29 - 31 March 2004 18
LVNPP PSA Level 2 Results
CNSNSCNSNS IPEIPE
Containment failure frequencyContainment failure frequency 5.25E-55.25E-5 2.59E-52.59E-5
Conditional probability of vessel breach at Conditional probability of vessel breach at high pressure given core damagehigh pressure given core damage
0.140.14 0.270.27
Conditional probability of containment failure Conditional probability of containment failure by leak or ruptureby leak or rupture
0.550.55 0.60.6
Conditional probability of containment Conditional probability of containment ventingventing
0.370.37 0.060.06
Conditional probability of no containment Conditional probability of no containment failurefailure
0.070.07 0.190.19
Conditional probability of containment bypassConditional probability of containment bypass ---- 0.140.14
29 - 31 March 2004 19
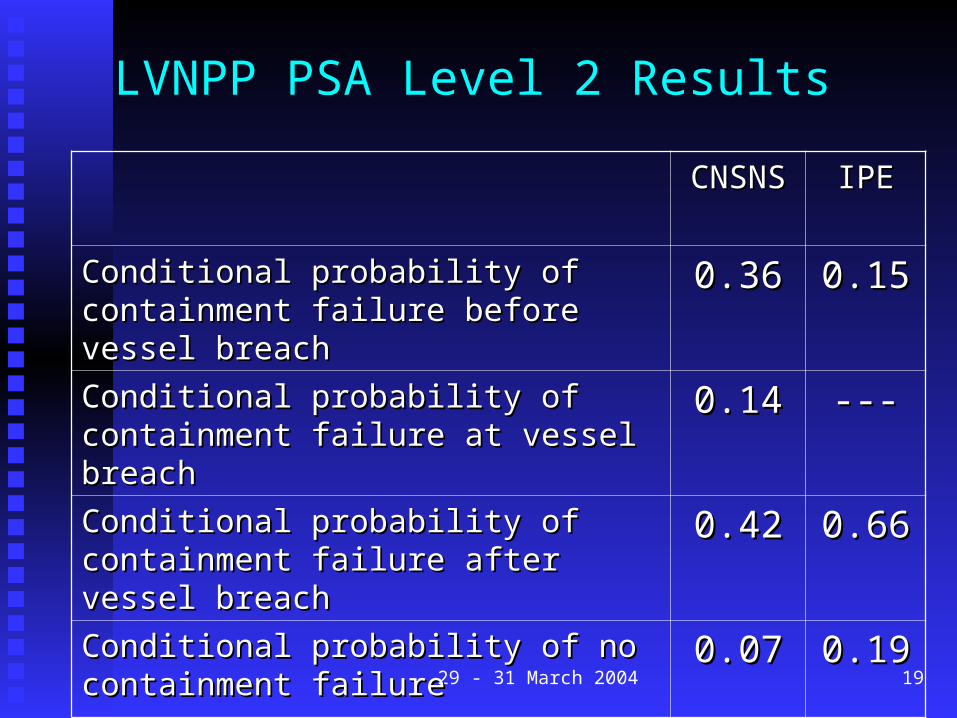
LVNPP PSA Level 2 Results
CNSNSCNSNS IPEIPE
Conditional probability of containment Conditional probability of containment failure before vessel breachfailure before vessel breach
0.360.36 0.150.15
Conditional probability of containment Conditional probability of containment failure at vessel breachfailure at vessel breach
0.140.14 ------
Conditional probability of containment Conditional probability of containment failure after vessel breachfailure after vessel breach
0.420.42 0.660.66
Conditional probability of no containment Conditional probability of no containment failurefailure
0.070.07 0.190.19

29 - 31 March 2004 20
LVNPP PSA Level 2 Results
CNSNSCNSNS IPEIPE
Large Early Release FrequencyLarge Early Release Frequency 1.02E-081.02E-08 3.4E-73.4E-7
Conditional probability of Cs and I Conditional probability of Cs and I release greater or equal to 10%:release greater or equal to 10%:
0.740.74 0.360.36
Conditional probability of Cs and I Conditional probability of Cs and I release between 1% and 10%:release between 1% and 10%:
0.050.05 0.130.13
Conditional probability of Cs and I Conditional probability of Cs and I release lower than 1%:release lower than 1%:
0.130.13 0.320.32

29 - 31 March 2004 21
LVNPP PSA Level 2 Results
CNSNSCNSNS IPEIPE
Conditional probability of releases in Conditional probability of releases in an early periodan early period
0.070.07 0.050.05
Conditional probability of releases in Conditional probability of releases in an intermediate periodan intermediate period
0.70.7 0.670.67
Conditional probability of releases in Conditional probability of releases in a late perioda late period
0.170.17 0.090.09
Conditional probability of no Conditional probability of no containment failurecontainment failure
0.070.07 0.190.19

29 - 31 March 2004 22
Categories of fission products releases
IPE
HE1%
HI49%
LL17%
NL16%
HL7%
LI8% LE
1%MI0%
ME1%
ML0%
CNSNS
HE0%
HI59%HL
16%
ME3%
MI2%
ML0%
LE4%
LI9%
LL0%
NL7%

29 - 31 March 2004 23
Experience Gained During the Review Process
The experience gained during the development The experience gained during the development of the regulatory PSA allow us to focus the of the regulatory PSA allow us to focus the
review process on those important features of review process on those important features of the back end analysis.the back end analysis.
Timing of phenomenological issuesTiming of phenomenological issuesParameter figuresParameter figuresThe usage of simulations code resultsThe usage of simulations code resultsContainment structural analysisContainment structural analysisSource term analysisSource term analysis

29 - 31 March 2004 24
Review Process
Modifications and improvements:Modifications and improvements:
CET structure CET structure Fault tree modelsFault tree models Input deck of MAAP codeInput deck of MAAP code Conatainment filure modes inclutionConatainment filure modes inclution

29 - 31 March 2004 25
CONCLUSIONS Largest source terms in both studies are Largest source terms in both studies are
associated to Station Blackout scenariosassociated to Station Blackout scenarios The overpressure is the dominant containment The overpressure is the dominant containment
failure mode, and the location is in the drywell.failure mode, and the location is in the drywell. In general both studies show similar trends in the In general both studies show similar trends in the
evolution of the accident progression and source evolution of the accident progression and source term released.term released.
The small containment event tree method is more The small containment event tree method is more traceable, and considerably easier to reviewtraceable, and considerably easier to review
IPE did not characterize uncertainty.IPE did not characterize uncertainty.