Embed Size (px)
Citation preview
29 April 2010
China Petroleum & Chemical Corporation
Q1 2010 Results Announcement

2010-4-29 2
Disclaimer
As required by the CSRC, financial statements of the first quarter of Sinopec Corp. (the
“Company”) were prepared under China Accounting Standards for Business Enterprises. The
Company has adjusted part of the financial data in accordance with the International Financial
Reporting Standards hereby for the reference of international investors. Financial data of the first
quarter contained in the presentation and presentation materials are unaudited.
This presentation and the presentation materials distributed herein include forward-looking
statements. All statements, other than statements of historical facts, that address activities, events or
developments that Sinopec Corp. expects or anticipates will or may occur in the future (including but
not limited to projections, targets, estimates and business plans) are forward-looking statements.
Sinopec Corp.'s actual results or developments may differ materially from those indicated by these
forward-looking statements as a result of various factors and uncertainties, including but not limited
to price fluctuations, actual demand, exchange rate fluctuations, exploration and development
outcomes, estimates of proven reserves, competition, environmental risks, changes in legal,
financial and regulatory frameworks, international economic and financial market conditions, political
risks, project delay, project approval, cost estimates and other risks and factors beyond our control.
In addition, Sinopec Corp. makes the forward-looking statements referred to herein as of today and
undertakes no obligation to update these statements.

2010-4-29 3
Market Environment in Q1 2010
China’s GDP grew by 11.9% in the first quarter
Crude oil traded within a narrow range, but the trend was positive
Domestic demand for natural gas, oil products and chemical products increased steadily
2010-4-29 4
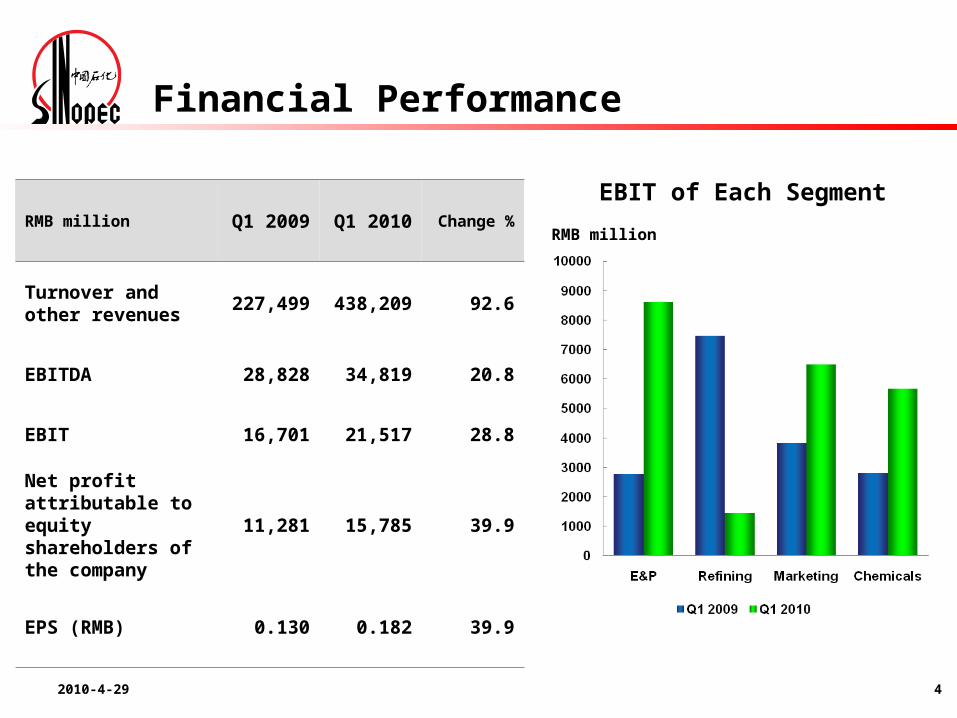
Financial Performance
RMB million Q1 2009 Q1 2010 Change %
Turnover and other revenues
227,499 438,209 92.6
EBITDA 28,828 34,819 20.8
EBIT 16,701 21,517 28.8
Net profit attributable to equity shareholders of the company
11,281 15,785 39.9
EPS (RMB) 0.130 0.182 39.9
EBIT of Each Segment
RMB million

2010-4-29 5
Financial Position
RMB million 31 Dec 2009 31 Mar 2010
Short-term debt 58,898 61,740
Long-term debt 108,828 111,359
Total equity attributable to equity shareholders of the company
375,661 391,312
RMB million Q1 2010
Net cash flow generated from operating activities
27,995
Net cash flow used in investing activities
31,375
Net cash flow generated from financing activities
4,702

2010-4-29 6
Note: 1 tonne=7.1 barrels, 1 cubic meter=35.31 cubic feet
E&P—Operational Summary & Performance
Q1 2009 Q1 2010 Change%
Crude oil production (mm bbls) 73.81 73.70 (0.1)
Natural gas production (bcf) 69.98 98.65 41.0
Realized price of crude oil (RMB/tonne) 1,599.01 3,315.94 107.4
Realized price of natural gas
(RMB/thousand cubic meter)961.53 1,006.53 4.7
Lifting cost (RMB/tonne) 604.79 610.56 1.0
EBIT ( RMB million) 2,756 8,625 213.0

2010-4-29 7
Refining—Operational Summary
Q1 2009 Q1 2010 Change%
Refinery throughput (mm tonnes) 41.11 49.50 20.4
Gasoline production (mm tonnes) 8.16 8.62 5.6
Diesel production (mm tonnes) 15.38 18.00 17.0
Kerosene incl. jet fuel production (mm tonnes)
2.18 2.87 31.7
Light chemical feedstock production (mm tonnes)
5.77 8.50 47.3
Light stream yield(%) 74.93 75.75 82bps
Refining yield(%) 93.66 94.80 114bps

2010-4-29 8
Refining marginRMB/tonne
Refining Margin / Cash Operating Cost
RMB million
EBIT of Refining Segment
Cash operating costRMB/tonne
Refining—Performance

2010-4-29 9
Marketing—Operational Summary
Q1 2009 Q1 2010 Change%
Domestic sales of refined oil products(mm tonnes)
26.43 32.84 24.3
Incl. Retail (mm tonnes) 17.37 20.19 16.2
Distribution (mm tonnes) 5.05 7.76 53.7
Wholesale (mm tonnes) 4.01 4.89 21.9
Annualized average pump volume per station (tonnes)
2,420 2,769 14.4
31 Dec 2009 31 Mar 2010 Change%
Total number of service stations (unit) 29,698 29,795 0.3
Incl. Company-operated 29,055 29,158 0.4
Franchised 643 637 (0.9)

2010-4-29 10
EBIT of Marketing Segment
RMB million
Marketing—Performance
RMB/tonne Q1 2009 Q1 2010
Marketing cash operating cost
162.6 149.0
Maximum retail price ofRON 90# gasoline and 0# diesel
RMB/tonne USD/bbl
10
20
30
40
50
60
70
80
90
100
110
3000
4000
5000
6000
7000
8000
9000
09-1 09-4 09-7 09-10 10-1 10-4
RON90 Gasoline0# DieselDubai Crude (Right Scale)

2010-4-29 11
Chemicals—Operational Summary
‘000 tonnes Q1 2009 Q1 2010 Change %
Ethylene 1,488 2,028 36.3
Synthetic resins 2,416 2,917 20.7
Synthetic rubbers 198 240 21.2
Monomers & Polymers for synthetic
fibers1,723 2,133 23.8
Synthetic fibers 315 327 3.8
Urea 362 487 34.5
Note: The above data includes 100% production of JVs.

2010-4-29 12
EBIT of Chemicals Segment
RMB million
Chemicals—Performance
Chemicals Price SpreadUSD/tonne

2010-4-29 13
Capital Expenditure
Total Capex in Q1: 16.8bn
RMB billion E&P
Sichuan-East China Gas Project, Shengli, Northwest and Southwest Oil Fields as well as pipeline construction.
Refining Revamping crude adaptability;
Construction of new storage facilities and pipelines.
Chemicals Construction of major Ethylene
projects.
Marketing Accelerated construction of
pipelines and newly developed 337 service stations in key areas

2010-4-29 14
http://www.sinopec.com
For Further Information
Investor Inquiries
Beijing: Tel: (8610) 59960028 Fax: (8610) 59960386Email: [email protected]
Hong Kong: Tel: (852) 28242638 Fax: (852) 28243669Email: [email protected]
New York : Tel: (212) 759 5085 Fax: (212) 759 6882Email: [email protected]
Media Inquires
Tel: (8610)59960028Fax: (8610) 59960386Email: [email protected]