Embed Size (px)
Citation preview

PART 2.9
DEPARTMENT OF HEALTH AND COMMUNITY SERVICES
DIABETES IN NEWFOUNDLAND AND LABRADOR
Auditor General of Newfoundland and Labrador Annual Report, Part 2.9, January 2011 275
Diabetes in Newfoundland and Labrador
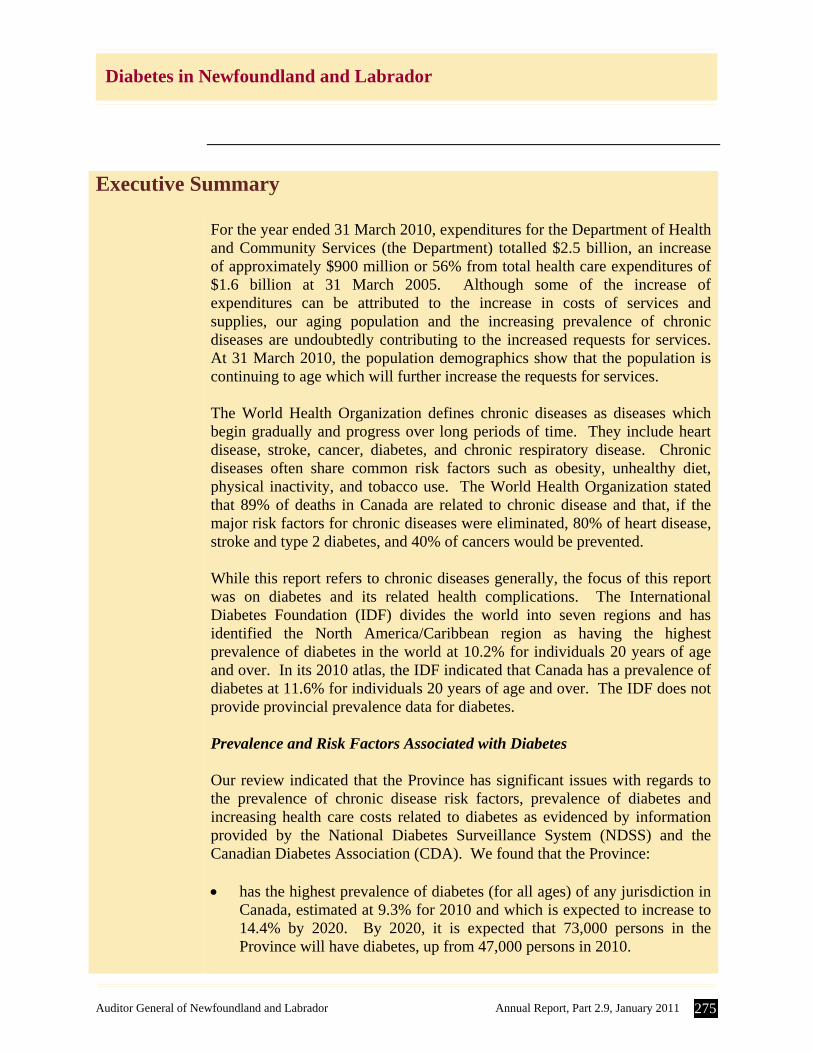
Executive Summary For the year ended 31 March 2010, expenditures for the Department of Health
and Community Services (the Department) totalled $2.5 billion, an increase of approximately $900 million or 56% from total health care expenditures of $1.6 billion at 31 March 2005. Although some of the increase of expenditures can be attributed to the increase in costs of services and supplies, our aging population and the increasing prevalence of chronic diseases are undoubtedly contributing to the increased requests for services. At 31 March 2010, the population demographics show that the population is continuing to age which will further increase the requests for services. The World Health Organization defines chronic diseases as diseases which begin gradually and progress over long periods of time. They include heart disease, stroke, cancer, diabetes, and chronic respiratory disease. Chronic diseases often share common risk factors such as obesity, unhealthy diet, physical inactivity, and tobacco use. The World Health Organization stated that 89% of deaths in Canada are related to chronic disease and that, if the major risk factors for chronic diseases were eliminated, 80% of heart disease, stroke and type 2 diabetes, and 40% of cancers would be prevented. While this report refers to chronic diseases generally, the focus of this report was on diabetes and its related health complications. The International Diabetes Foundation (IDF) divides the world into seven regions and has identified the North America/Caribbean region as having the highest prevalence of diabetes in the world at 10.2% for individuals 20 years of age and over. In its 2010 atlas, the IDF indicated that Canada has a prevalence of diabetes at 11.6% for individuals 20 years of age and over. The IDF does not provide provincial prevalence data for diabetes. Prevalence and Risk Factors Associated with Diabetes Our review indicated that the Province has significant issues with regards to the prevalence of chronic disease risk factors, prevalence of diabetes and increasing health care costs related to diabetes as evidenced by information provided by the National Diabetes Surveillance System (NDSS) and the Canadian Diabetes Association (CDA). We found that the Province: has the highest prevalence of diabetes (for all ages) of any jurisdiction in
Canada, estimated at 9.3% for 2010 and which is expected to increase to 14.4% by 2020. By 2020, it is expected that 73,000 persons in the Province will have diabetes, up from 47,000 persons in 2010.
276 Annual Report, Part 2.9, January 2011 Auditor General of Newfoundland and Labrador
Diabetes in Newfoundland and Labrador
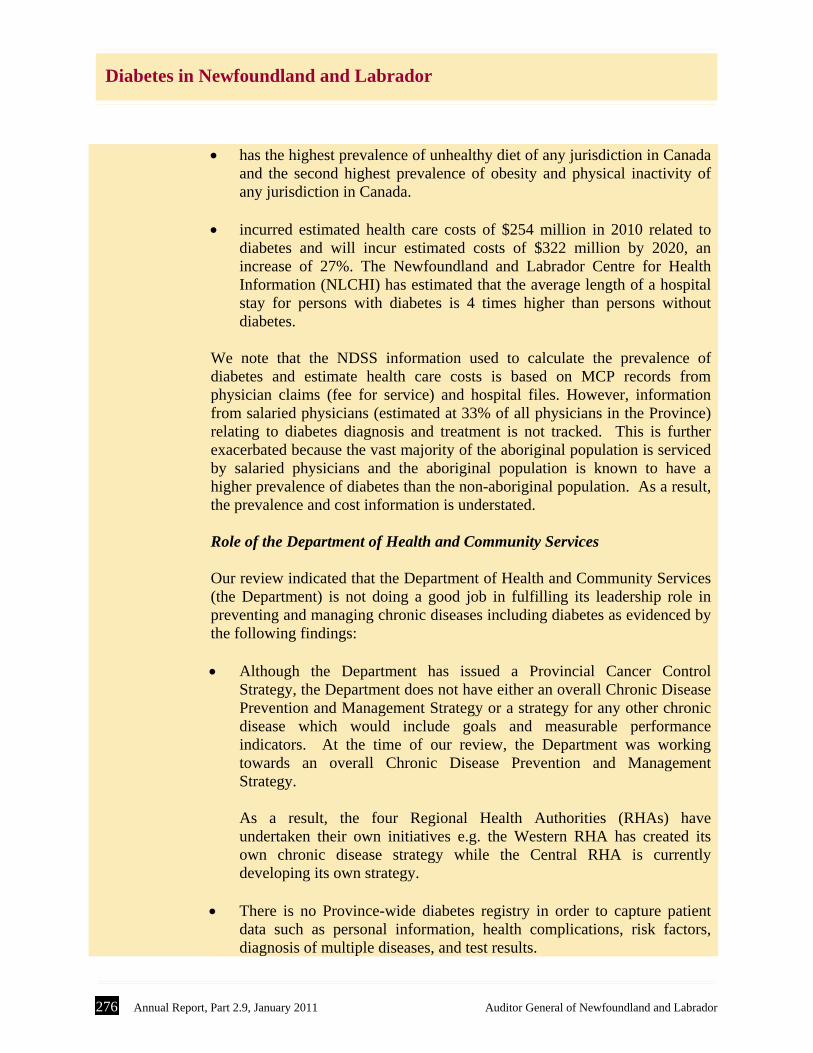
has the highest prevalence of unhealthy diet of any jurisdiction in Canada and the second highest prevalence of obesity and physical inactivity of any jurisdiction in Canada.
incurred estimated health care costs of $254 million in 2010 related to
diabetes and will incur estimated costs of $322 million by 2020, an increase of 27%. The Newfoundland and Labrador Centre for Health Information (NLCHI) has estimated that the average length of a hospital stay for persons with diabetes is 4 times higher than persons without diabetes.
We note that the NDSS information used to calculate the prevalence of diabetes and estimate health care costs is based on MCP records from physician claims (fee for service) and hospital files. However, information from salaried physicians (estimated at 33% of all physicians in the Province) relating to diabetes diagnosis and treatment is not tracked. This is further exacerbated because the vast majority of the aboriginal population is serviced by salaried physicians and the aboriginal population is known to have a higher prevalence of diabetes than the non-aboriginal population. As a result, the prevalence and cost information is understated. Role of the Department of Health and Community Services Our review indicated that the Department of Health and Community Services (the Department) is not doing a good job in fulfilling its leadership role in preventing and managing chronic diseases including diabetes as evidenced by the following findings: Although the Department has issued a Provincial Cancer Control
Strategy, the Department does not have either an overall Chronic Disease Prevention and Management Strategy or a strategy for any other chronic disease which would include goals and measurable performance indicators. At the time of our review, the Department was working towards an overall Chronic Disease Prevention and Management Strategy.
As a result, the four Regional Health Authorities (RHAs) have undertaken their own initiatives e.g. the Western RHA has created its own chronic disease strategy while the Central RHA is currently developing its own strategy.
There is no Province-wide diabetes registry in order to capture patient
data such as personal information, health complications, risk factors, diagnosis of multiple diseases, and test results.
Auditor General of Newfoundland and Labrador Annual Report, Part 2.9, January 2011 277
Diabetes in Newfoundland and Labrador
As a result, the Department does not have complete statistics related to diabetes which would be necessary in order to adequately manage the disease and its resulting health complications. However, the Western RHA has taken initiative to develop a diabetes registry.
The Department is no longer coordinating primary health care teams. For
the 7 years from 2000 to 2006, the Province received a total of $9.7 million from the Federal Government to help renew their primary health care systems. The funding was used to create networks of physicians, nurse practitioners, public health officials, social workers and other health care providers to come together as primary health care teams (9 throughout the Province) and provide a continuum of services. One of these services was the treatment and management of chronic diseases such as diabetes, coordinated through the Primary Health Care Office at the Department. However, when the Federal funding ended in 2006, the Province did not continue to fund the Office and as a result, the Office closed and the Department ceased its coordinating role.
As a result of the lack of coordination by the Department, the RHAs are concerned about the lack of consistency throughout the Province in the treatment and management of chronic diseases such as diabetes.
The Department has not implemented all recommendations contained in
its 2008 report entitled A Review of Chronic Disease Prevention and Management Services (Diabetes) in Primary Health Care Teams. As a result, the Province has not progressed to the level at which it should be with regards to the management and control of chronic disease. In particular:
the Department has not coordinated the roles and activities
associated with primary health care with its Health Promotion and Wellness and Board Services Divisions in order to work together to address chronic disease management;
there are issues with regard to the capturing and reporting of diabetes patient information, such as personal information, health complications, risk factors, diagnosis of multiple diseases, and test results, as follows:
- with the elimination of the Department’s Primary Health
Care Office, the Department has not continued to provide support for the maintenance of the diabetes flow sheet which was designed to document results of patient visits;
278 Annual Report, Part 2.9, January 2011 Auditor General of Newfoundland and Labrador
Diabetes in Newfoundland and Labrador
- the Department has stopped providing funding for the Provincial Chronic Disease Collaborative Database at the Eastern RHA which was designed to collect and report information documented in the diabetes flow sheets. Officials at the RHAs indicated that: the reporting/viewing features of the Database were
never implemented; many primary health care teams are either no longer
completing the diabetes flow sheets and/or not entering the data into the Database;
the full database was not available to all primary
health care teams across the Province; and the diabetes flow sheets have not been updated even
though Canadian Diabetes Association guidelines have changed.
the Department did not complete a Memorandum of Understanding
to facilitate sharing data on patient visits across RHAs and the NLCHI.
Although the CDA has estimated health care costs relating to diabetes care in the Province, albeit knowingly understated as a result of incomplete data, the Department has not made any determination of these costs. In fact, the Department has not determined the health care costs associated with any chronic diseases. Such information would be essential in order to adequately plan, manage and control initiatives. As a result of not having this information, it is more difficult for the Department to demonstrate whether any initiatives are having the desired effect.
Insulin Pumps Since Government introduced funding for insulin pumps in 2007, an estimated 450 individuals have availed of the program. From 2007 to 2010, insulin pumps were provided to qualifying individuals up to the age of 18. None of the RHAs indicated that they have been provided with any additional resources which would be required in order to adequately manage and monitor these individuals. As a result, the RHAs indicated that they had to reallocate resources to deal with these pumps and still have some concern about the level of diabetes care that they can provide.
Auditor General of Newfoundland and Labrador Annual Report, Part 2.9, January 2011 279
Diabetes in Newfoundland and Labrador
In March 2010, Government expanded coverage for the insulin pump therapy to include individuals aged 18 to 25 and provided an additional $797,700 in the 2010-11 budget to cover this expansion. It should be noted that an official at the Eastern RHA indicated that persons with insulin pumps, while representing only 1% of persons with diabetes, are consuming 50% of resources under its diabetes education program.
Audit Objectives and Scope
Audit objectives
The objectives of our review of chronic disease were to determine if the Department of Health and Community Services (the Department) has: Identified:
the chronic diseases affecting the people of the Province; the risk factors of chronic diseases; and the complications of chronic diseases.
documented:
the prevalence of diabetes in Newfoundland and Labrador; and comparisons of the prevalence of diabetes in Newfoundland and
Labrador to other provinces, and in Canada to other countries.
a chronic disease prevention and management strategy; and identified the costs associated with chronic diseases and related
complications in the Province and in particular with regards to diabetes.
Audit scope
We commenced our review in February 2010. We interviewed staff at the Department of Health and Community Services, as well as at each of the four Regional Health Authorities (RHAs) in the Province. We completed our review in October 2010.
280 Annual Report, Part 2.9, January 2011 Auditor General of Newfoundland and Labrador
Diabetes in Newfoundland and Labrador
Background
The Department, through the four RHAs, is responsible for the delivery of
health care in the Province. The Department identified chronic disease management as one of the strategic issues in its Departmental Strategic Plan for 2008-11. For the fiscal year ended 31 March 2010, expenditures for the Department totalled $2.5 billion, an increase of approximately $900 million or 56% from total health care expenditures of $1.6 billion at 31 March 2005. Although some of the increase of expenditures can be attributed to the increase in costs of services and supplies, our aging population and the increasing prevalence of chronic diseases are undoubtedly contributing to the increased requests for services.
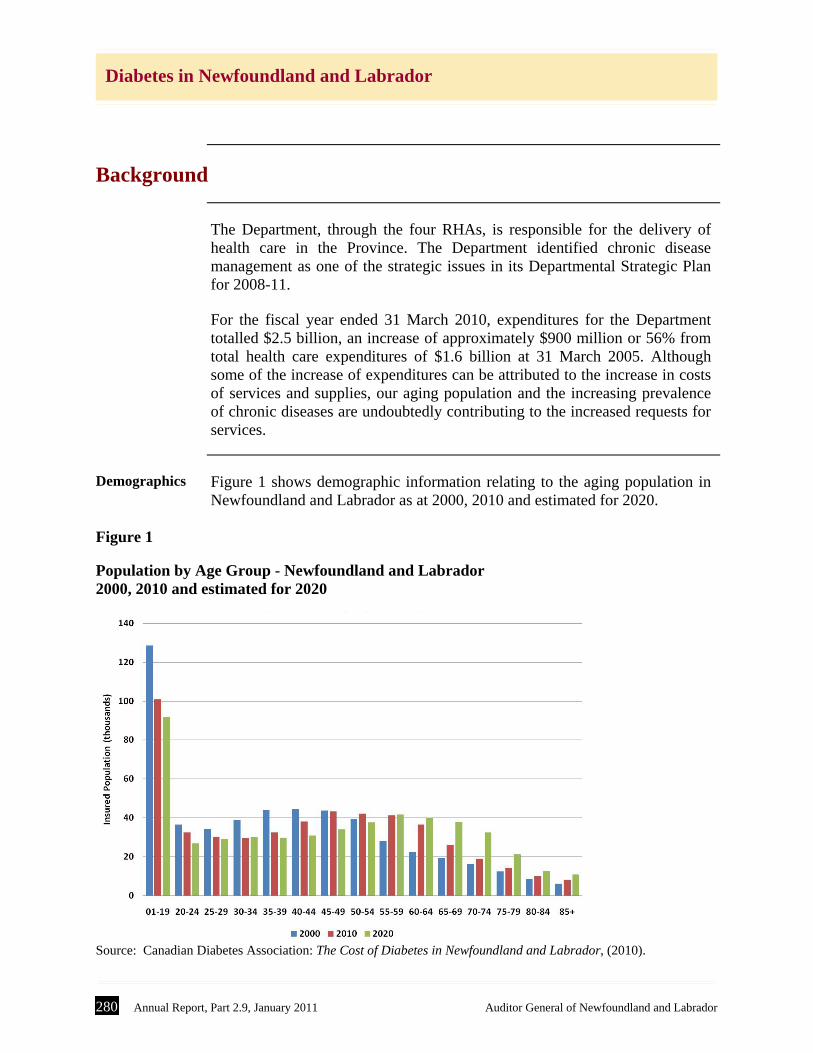
Demographics Figure 1 shows demographic information relating to the aging population in
Newfoundland and Labrador as at 2000, 2010 and estimated for 2020.
Figure 1
Population by Age Group - Newfoundland and Labrador 2000, 2010 and estimated for 2020
Source: Canadian Diabetes Association: The Cost of Diabetes in Newfoundland and Labrador, (2010).
Auditor General of Newfoundland and Labrador Annual Report, Part 2.9, January 2011 281
Diabetes in Newfoundland and Labrador
As Figure 1 shows, the Province’s population will continue to age, resulting
in further increases in requests for health care services. These increased requests for services are, for the most part, the result of the increase in the prevalence of chronic diseases associated with an aging population.
Chronic diseases
The World Health Organization defines chronic diseases as diseases which begin gradually and progress over long periods of time. They include heart disease, stroke, cancer, diabetes, and chronic respiratory disease. Chronic diseases often share common risk factors such as obesity, unhealthy diet, physical inactivity, and tobacco use. The World Health Organization stated in 2005 that 89% of deaths in Canada are related to chronic disease and that, if the major risk factors for chronic diseases were eliminated, 80% of heart disease, stroke and type 2 diabetes, and 40% of cancers would be prevented. The prevalence of chronic diseases is evident from statistics released by the Health Council of Canada. According to their 2007 report Population Patterns of Chronic Health Conditions in Canada, one in three Canadian youth and adults have one or more chronic conditions, and chronic conditions are more common among older Canadians and among women. According to the Newfoundland and Labrador Centre for Health Information (NLCHI), chronic diseases are the leading cause of death in Newfoundland and Labrador. The most prevalent chronic diseases resulting in death are diseases of the circulatory system, cancer and respiratory disease. In this Province, these three diseases accounted for 74.7% of all deaths in 2000.
Diabetes
Diabetes is a chronic disease whereby the body either does not produce or is unable to properly use insulin. Typically the body converts the food we eat into glucose, which provides energy. When the glucose level in the body increases, the pancreas produces insulin which allows the body to use the glucose for energy, store glucose in the liver for use later, and to convert the excess glucose into fat. The first symptoms of diabetes which manifest are related to the high blood glucose levels, a condition known as hyperglycemia. The high glucose levels usually leave the body through urine. The kidneys produce extra water to dilute the high levels of glucose, causing excess urination and leads to abnormal thirst.
282 Annual Report, Part 2.9, January 2011 Auditor General of Newfoundland and Labrador
Diabetes in Newfoundland and Labrador
Diabetes has received world-wide attention in recent years as a result of its increase in prevalence. Diabetes can be categorized as type 1, type 2 and gestational as follows:
Type 1 diabetes - where the body does not produce insulin (because insulin
producing beta cells in the pancreas are worn out or destroyed.) It has been formally known as insulin-dependent or juvenile diabetes. The onset usually occurs in childhood. It accounts for about 10% of all diabetes. The body breaks down fats and proteins as a source of energy. This protein/fat breakdown also produces acids or ketones which can change the blood ph-level. The onset is usually quite sudden and the symptoms include frequent urination, excessive thirst and hunger, in addition to weight loss and fatigue, all related to the inability for the body to use glucose for energy. While not preventable, it is manageable.
Type 2 diabetes - where the body either does not produce enough insulin, is
unable to use insulin in the way it is supposed to, or a combination of both. Because the body is not able to use the insulin properly and glucose is not absorbed, blood glucose levels increase. Often the body will produce more insulin to attempt to counteract, but beta cells start to fail, thereby requiring injections of insulin. Type 2 diabetes accounts for about 90% of all diabetes. The onset can be as early as age 40. Symptoms can manifest as they do with type 1, but not always. Often, complications from type 2 occur before a diagnosis is made. If detected early enough, type 2 diabetes is preventable, or at least can be delayed.
Gestational diabetes - where a woman develops diabetes during pregnancy.
It happens in about 5% of pregnancies. The mother’s blood sugar levels usually return to normal after the baby is born. However women who have gestational diabetes and children of mothers who had gestational diabetes are at a higher risk for obesity and type 2 diabetes.
Pre-diabetes Pre-diabetes is a condition known as dysglycemia where the blood sugar
levels are elevated, but not enough for a diagnosis of diabetes. There are two components to pre-diabetes: impaired glucose tolerance, which is higher than normal blood sugar
levels found after ingesting a standard amount of glucose in a glucose tolerance test; and
Auditor General of Newfoundland and Labrador Annual Report, Part 2.9, January 2011 283
Diabetes in Newfoundland and Labrador
impaired fasting glucose, which is higher than normal blood sugar levels found after fasting, usually overnight.
Both conditions are significant risk factors for developing diabetes.
Complications of diabetes
The long-term complications associated with diabetes relate to issues with the effect of high blood glucose levels on blood vessels. Complications resulting from diabetes include heart disease and stroke, kidney disease, amputations, blindness, and numbness and tingling sensations in the lower limbs.
Diabetes practices and centres
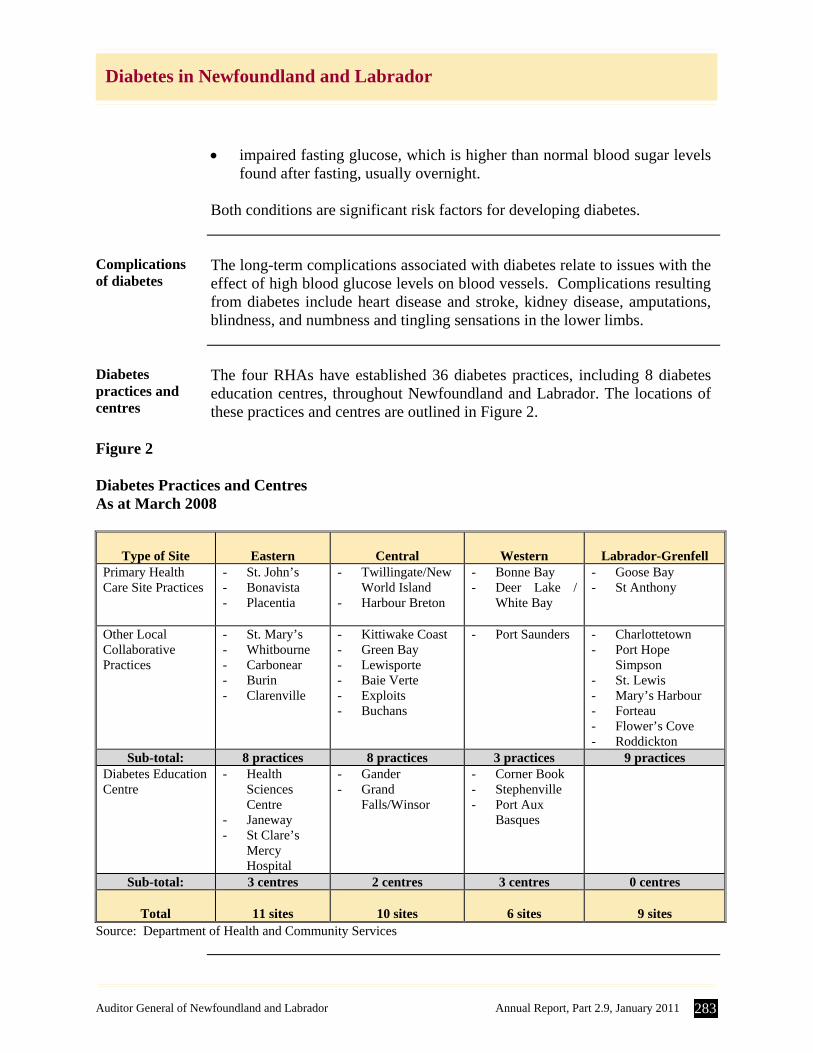
The four RHAs have established 36 diabetes practices, including 8 diabetes education centres, throughout Newfoundland and Labrador. The locations of these practices and centres are outlined in Figure 2.
Figure 2 Diabetes Practices and Centres As at March 2008
Type of Site
Eastern
Central
Western
Labrador-Grenfell
Primary Health Care Site Practices
- St. John’s - Bonavista - Placentia
- Twillingate/New World Island
- Harbour Breton
- Bonne Bay - Deer Lake /
White Bay
- Goose Bay - St Anthony
Other Local Collaborative Practices
- St. Mary’s - Whitbourne - Carbonear - Burin - Clarenville
- Kittiwake Coast - Green Bay - Lewisporte - Baie Verte - Exploits - Buchans
- Port Saunders - Charlottetown - Port Hope
Simpson - St. Lewis - Mary’s Harbour - Forteau - Flower’s Cove - Roddickton
Sub-total: 8 practices 8 practices 3 practices 9 practices Diabetes Education Centre
- Health Sciences Centre
- Janeway - St Clare’s
Mercy Hospital
- Gander - Grand
Falls/Winsor
- Corner Book - Stephenville - Port Aux
Basques
Sub-total: 3 centres 2 centres 3 centres 0 centres
Total
11 sites
10 sites
6 sites
9 sites Source: Department of Health and Community Services
284 Annual Report, Part 2.9, January 2011 Auditor General of Newfoundland and Labrador
Diabetes in Newfoundland and Labrador
Sources of diabetes information
There are many organizations involved in collecting and analyzing the data related to diabetes in the Province: the Public Health Agency of Canada, the Newfoundland and Labrador Centre for Health Information, the Canadian Institute for Health Information and Statistics Canada.
Public Health Agency of Canada
The Public Health Agency of Canada (PHAC) is the main Government of Canada agency responsible for public health in Canada. The Centre for Chronic Disease Prevention and Control (CCDPC) falls under the Health Promotion and Chronic Disease section of the PHAC. The CCDPC maintains several surveillance databases, such as the Chronic Disease Surveillance System (CDSS) and the National Diabetes Surveillance System (NDSS). The PHAC also uses information from Statistics Canada and the Canadian Institute for Health Information (CIHI).
NDSS The NDSS was an initiative of the Canadian Diabetes Strategy of the
Government of Canada in 1999. The system is populated by information from three specific provincial data sources – health insurance registry files, physician claims, and hospital files. In Newfoundland and Labrador, the Provincial component of the NDSS was developed and is maintained by the Newfoundland and Labrador Centre for Health Information (NLCHI).
NLCHI The NLCHI collects and analyzes health information data from various
sources in order to evaluate areas such as the Electronic Health Records initiative, health performance indicators and chronic diseases. They are responsible for ensuring health data from different sources is consistent in definition, measurement, collection, and interpretation. Their sources of data include Statistics Canada (for census and population), research data, hospitalization files, and the Medical Care Plan (MCP) database. They perform research and provide reports to Government and the RHAs. As noted, the NLCHI collects data for the CDSS and the NDSS. Most of the population of the country is covered by publically funded health insurance, and each person is assigned a unique health insurance number. This number is used when physicians make a claim for services, or if the individual is admitted to a hospital. The NDSS uses the insurance registry file for demographic information and as a denominator for many statistics it calculates. However in the case of Newfoundland and Labrador, the denominator factor is based on census information from the Vital Statistics Division of the Department of Government Services.
Auditor General of Newfoundland and Labrador Annual Report, Part 2.9, January 2011 285
Diabetes in Newfoundland and Labrador
The physician files were used to determine the number of diabetes related physician claims while the hospital files were used to determine the number of hospitalizations for an insured individual, the average number of days spent in the hospital, the rate of co-morbid hospitalizations, and the number of amputations.
CIHI The CIHI collects data from a number of sources, including government
health departments, hospitals, and other health care centres or organizations. The data is mostly abstracts of information, not the full client record. Approximately 85% of their data comes from hospitals. The data usually relates to the services provided by hospitals, trends regarding health care professionals, and how much money is spent on health services.
Statistics Canada
Statistics Canada is a source of information for many of the organizations already mentioned. In addition to census data, Statistics Canada conducts a Canadian Community Health Survey which targets all Canadians 12 and older and asks them core and optional health information questions. The core information relates to general health, height and weight, chronic conditions, physical activity, fruit and vegetable consumption, and income. The optional questions are chosen by provinces and include diabetes care and health care system satisfaction.
Detailed Observations
This report provides detailed audit findings and recommendations in the
following sections: 1. Prevalence and Risk Factors Associated with Diabetes 2. Prevention and Management of Chronic Diseases, including Diabetes
1.0 Prevalence and Risk Factors Associated with Diabetes
In reviewing the prevalence and risk factors of diabetes in Newfoundland and
Labrador, we identified issues in the following areas: A. Prevalence B. Risk Factors C. Health Implications of Diabetes D. Cost Implications of Diabetes
286 Annual Report, Part 2.9, January 2011 Auditor General of Newfoundland and Labrador
Diabetes in Newfoundland and Labrador
1A. Prevalence
Introduction The International Diabetes Federation (IDF), an organization of over 200
national diabetes associations in over 160 countries, promotes diabetes care and prevention worldwide. The IDF divides the world into seven regions and has identified the North America/Caribbean region as having the highest prevalence of diabetes in the world at 10.2% for individuals 20 years of age and over. The IDF indicated that Canada has a prevalence of diabetes at 11.6% for individuals 20 years of age and over, one of the highest prevalence in the world. The IDF also indicated that the prevalence for impaired glucose tolerance (IGT) or pre-diabetes for Canadians 20 years old and older is 12.9%. This means that approximately 1 in 4 Canadians has either diabetes or pre-diabetes. The Canadian Diabetes Association (CDA) stated in 2009 that Canada has a diabetes epidemic with over 3 million Canadians living with the disease. This is expected to reach 3.7 million by 2020. Information provided by the NDSS indicates that Newfoundland and Labrador has the highest prevalence of diabetes (for both sexes combined) of any other jurisdiction in Canada.
Prevalence and cost information is understated
We note that the NDSS information used to calculate the prevalence of diabetes and estimate health care costs is based on MCP records from physician claims (fee for service) and hospital files. However, information from salaried physicians (estimated at 33% of all physicians in the Province) relating to a diabetes diagnosis and treatment is not tracked. The lack of information from salaried physicians is very significant in statistics for the Labrador-Grenfell RHA because the vast majority of the aboriginal population of Labrador-Grenfell is serviced by salaried physicians (estimated by the NLCHI to be seven times greater than the number of fee for service physicians for the Labrador-Grenfell region). In addition, the aboriginal population is known to have a higher prevalence of diabetes than the non-aboriginal population. For instance, the prevalence of diabetes for the Innu population in one of the aboriginal communities (collected by the Labrador-Grenfell RHA) is between 27% and 30%.
As a result, the prevalence and cost information available for the Province related to diabetes is understated.
Auditor General of Newfoundland and Labrador Annual Report, Part 2.9, January 2011 287
Diabetes in Newfoundland and Labrador
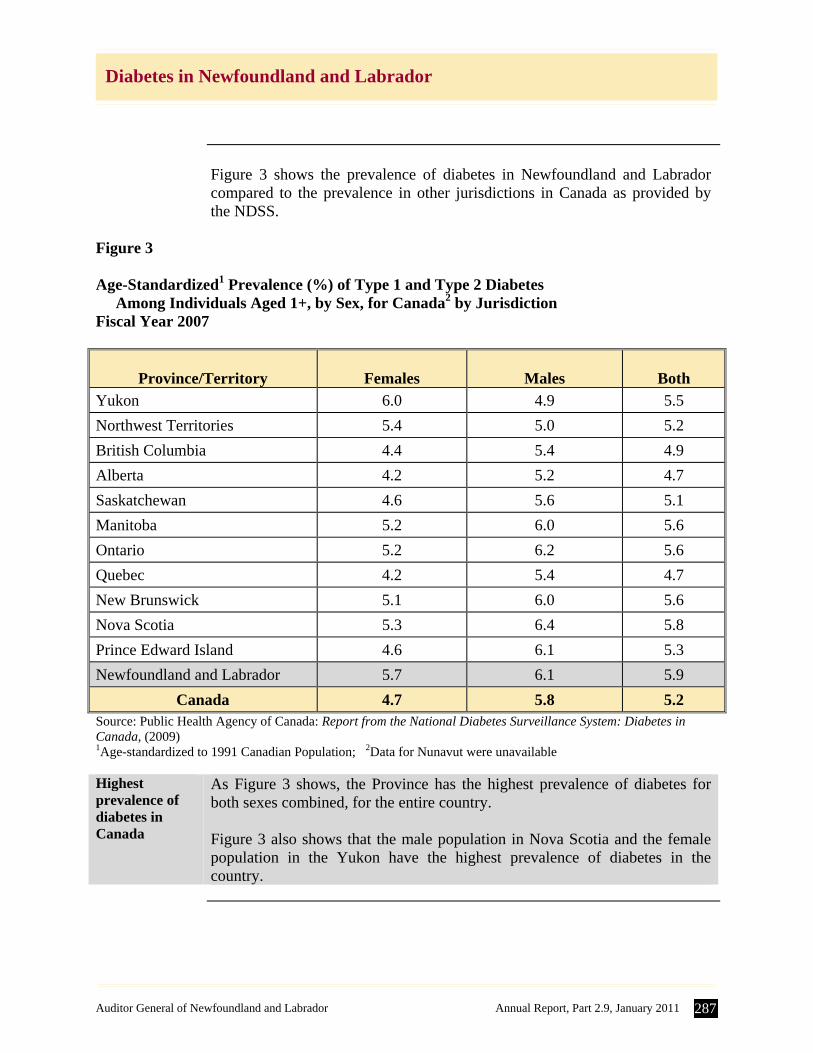
Figure 3 shows the prevalence of diabetes in Newfoundland and Labrador
compared to the prevalence in other jurisdictions in Canada as provided by the NDSS.
Figure 3 Age-Standardized1 Prevalence (%) of Type 1 and Type 2 Diabetes Among Individuals Aged 1+, by Sex, for Canada2 by Jurisdiction Fiscal Year 2007
Province/Territory
Females
Males
Both
Yukon 6.0 4.9 5.5
Northwest Territories 5.4 5.0 5.2
British Columbia 4.4 5.4 4.9
Alberta 4.2 5.2 4.7
Saskatchewan 4.6 5.6 5.1
Manitoba 5.2 6.0 5.6
Ontario 5.2 6.2 5.6
Quebec 4.2 5.4 4.7
New Brunswick 5.1 6.0 5.6
Nova Scotia 5.3 6.4 5.8
Prince Edward Island 4.6 6.1 5.3
Newfoundland and Labrador 5.7 6.1 5.9
Canada 4.7 5.8 5.2 Source: Public Health Agency of Canada: Report from the National Diabetes Surveillance System: Diabetes in Canada, (2009) 1Age-standardized to 1991 Canadian Population; 2Data for Nunavut were unavailable Highest prevalence of diabetes in Canada
As Figure 3 shows, the Province has the highest prevalence of diabetes for both sexes combined, for the entire country. Figure 3 also shows that the male population in Nova Scotia and the female population in the Yukon have the highest prevalence of diabetes in the country.
288 Annual Report, Part 2.9, January 2011 Auditor General of Newfoundland and Labrador
Diabetes in Newfoundland and Labrador
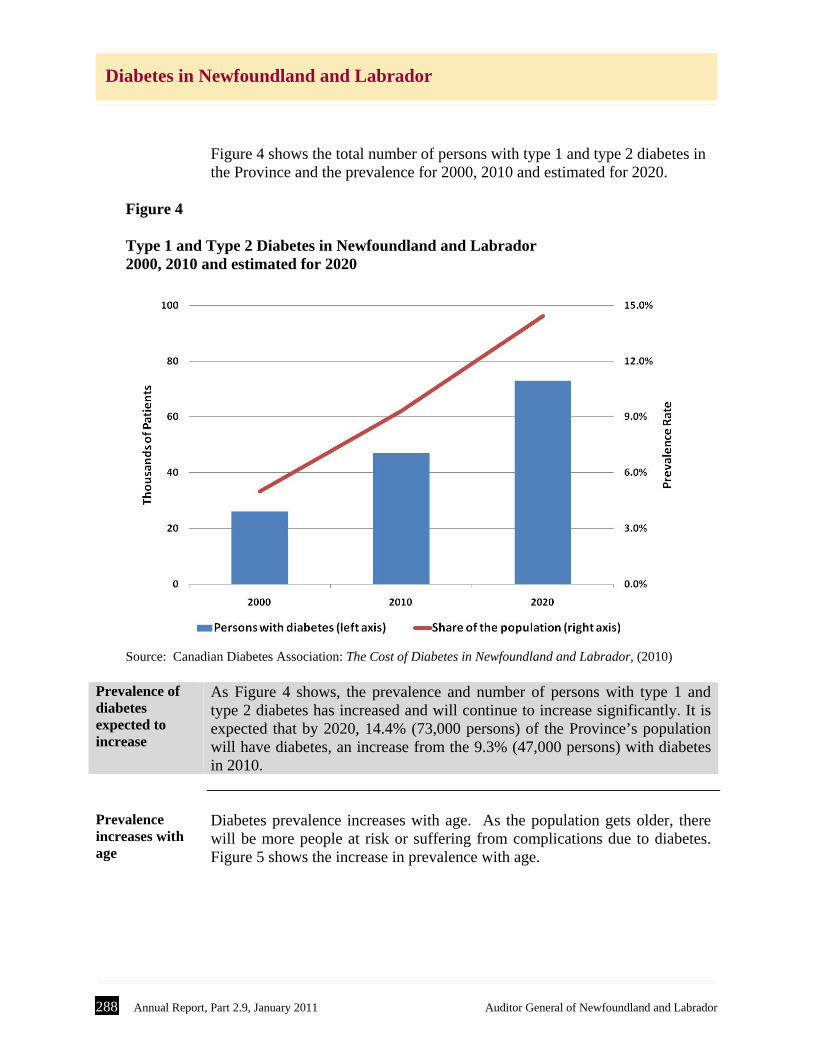
Figure 4 shows the total number of persons with type 1 and type 2 diabetes in the Province and the prevalence for 2000, 2010 and estimated for 2020.
Figure 4 Type 1 and Type 2 Diabetes in Newfoundland and Labrador 2000, 2010 and estimated for 2020
Source: Canadian Diabetes Association: The Cost of Diabetes in Newfoundland and Labrador, (2010) Prevalence of diabetes expected to increase
As Figure 4 shows, the prevalence and number of persons with type 1 and type 2 diabetes has increased and will continue to increase significantly. It is expected that by 2020, 14.4% (73,000 persons) of the Province’s population will have diabetes, an increase from the 9.3% (47,000 persons) with diabetes in 2010.
Prevalence increases with age
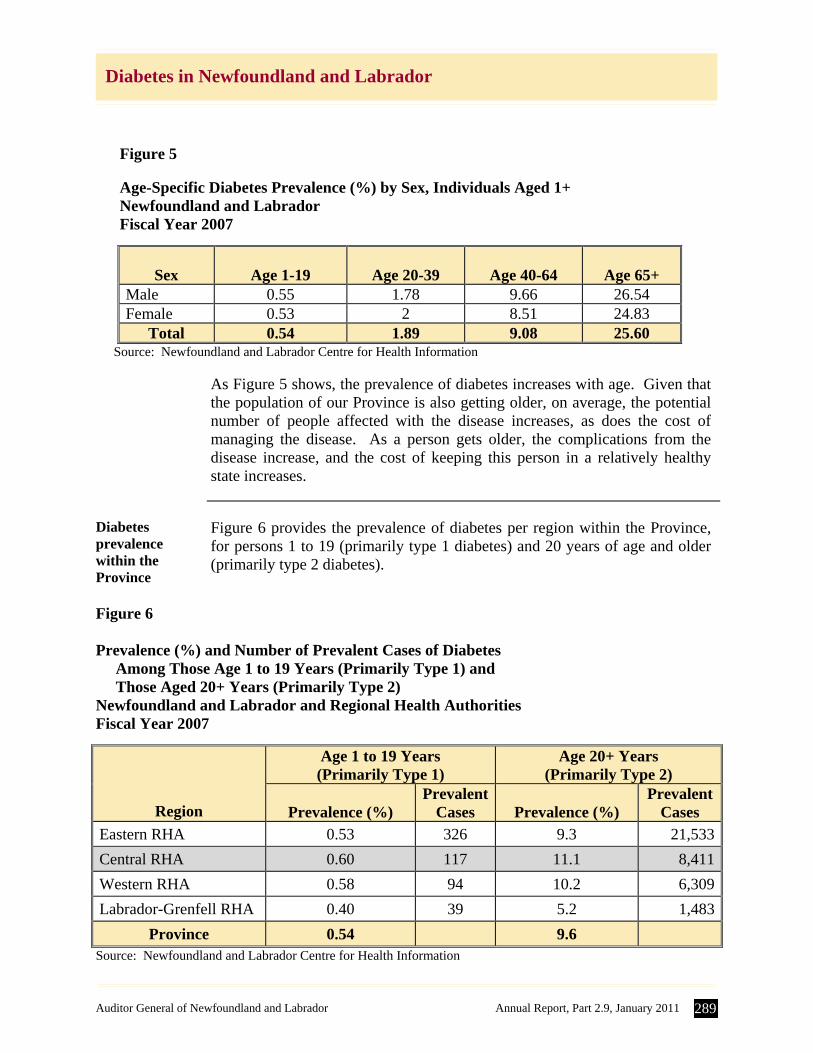
Diabetes prevalence increases with age. As the population gets older, there will be more people at risk or suffering from complications due to diabetes. Figure 5 shows the increase in prevalence with age.
Auditor General of Newfoundland and Labrador Annual Report, Part 2.9, January 2011 289
Diabetes in Newfoundland and Labrador
Figure 5 Age-Specific Diabetes Prevalence (%) by Sex, Individuals Aged 1+ Newfoundland and Labrador Fiscal Year 2007
Sex
Age 1-19
Age 20-39
Age 40-64
Age 65+
Male 0.55 1.78 9.66 26.54 Female 0.53 2 8.51 24.83
Total 0.54 1.89 9.08 25.60 Source: Newfoundland and Labrador Centre for Health Information
As Figure 5 shows, the prevalence of diabetes increases with age. Given that the population of our Province is also getting older, on average, the potential number of people affected with the disease increases, as does the cost of managing the disease. As a person gets older, the complications from the disease increase, and the cost of keeping this person in a relatively healthy state increases.
Diabetes prevalence within the Province
Figure 6 provides the prevalence of diabetes per region within the Province, for persons 1 to 19 (primarily type 1 diabetes) and 20 years of age and older (primarily type 2 diabetes).
Figure 6 Prevalence (%) and Number of Prevalent Cases of Diabetes Among Those Age 1 to 19 Years (Primarily Type 1) and Those Aged 20+ Years (Primarily Type 2) Newfoundland and Labrador and Regional Health Authorities Fiscal Year 2007
Region
Age 1 to 19 Years (Primarily Type 1)
Age 20+ Years (Primarily Type 2)
Prevalence (%)
Prevalent Cases
Prevalence (%)
Prevalent Cases
Eastern RHA 0.53 326 9.3 21,533
Central RHA 0.60 117 11.1 8,411
Western RHA 0.58 94 10.2 6,309
Labrador-Grenfell RHA 0.40 39 5.2 1,483
Province 0.54 9.6 Source: Newfoundland and Labrador Centre for Health Information
290 Annual Report, Part 2.9, January 2011 Auditor General of Newfoundland and Labrador
Diabetes in Newfoundland and Labrador
Central RHA has the highest prevalence of diabetes
As Figure 6 shows, the Central RHA has the highest reported prevalence of diabetes among those on the island portion of the Province aged 19 and younger and for those aged 20 and older. Given the extent of omitted statistics for Labrador-Grenfell, it is not possible to draw any conclusion for that region.
1B. Risk Factors
Introduction The common risk factors for diabetes are related to:
background - increasing age, ethnicity; family history of diabetes,
including personal history of gestational diabetes; behaviour - physical inactivity, obesity and unhealthy diet; and intermediate category - high blood pressure (hypertension), high
cholesterol (hyperlipidemia) and high blood glucose (hyperglycemia). While some risk factors are genetic and cannot be changed, many are related to behaviour and lifestyle and can be either modified or reduced. Research has shown that an integrated approach to chronic disease prevention and management is essential in order to influence behaviour and lifestyle. Three of the major risk factors are obesity, physical inactivity and unhealthy diet. Our review of these risk factors in relation to the population of Newfoundland and Labrador identified the following:
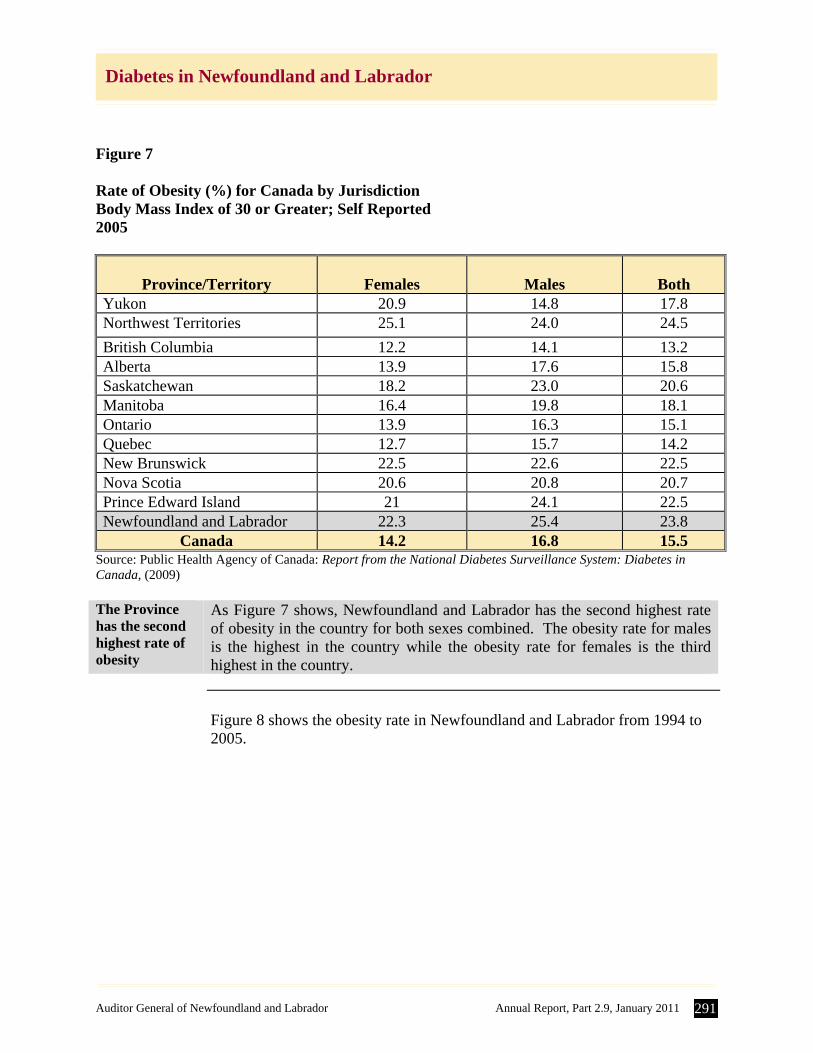
Obesity If a person is above a healthy weight, they are at a higher risk for developing
type 2 diabetes. Excess fat interferes with the body’s ability to effectively use insulin, while exercise and weight loss increase its effectiveness. Figure 7 shows the rate of obesity in Canada by jurisdiction.
Auditor General of Newfoundland and Labrador Annual Report, Part 2.9, January 2011 291
Diabetes in Newfoundland and Labrador
Figure 7 Rate of Obesity (%) for Canada by Jurisdiction Body Mass Index of 30 or Greater; Self Reported 2005
Province/Territory
Females
Males
Both
Yukon 20.9 14.8 17.8 Northwest Territories 25.1 24.0 24.5
British Columbia 12.2 14.1 13.2 Alberta 13.9 17.6 15.8 Saskatchewan 18.2 23.0 20.6 Manitoba 16.4 19.8 18.1 Ontario 13.9 16.3 15.1 Quebec 12.7 15.7 14.2 New Brunswick 22.5 22.6 22.5 Nova Scotia 20.6 20.8 20.7 Prince Edward Island 21 24.1 22.5 Newfoundland and Labrador 22.3 25.4 23.8
Canada 14.2 16.8 15.5 Source: Public Health Agency of Canada: Report from the National Diabetes Surveillance System: Diabetes in Canada, (2009) The Province has the second highest rate of obesity
As Figure 7 shows, Newfoundland and Labrador has the second highest rate of obesity in the country for both sexes combined. The obesity rate for males is the highest in the country while the obesity rate for females is the third highest in the country.
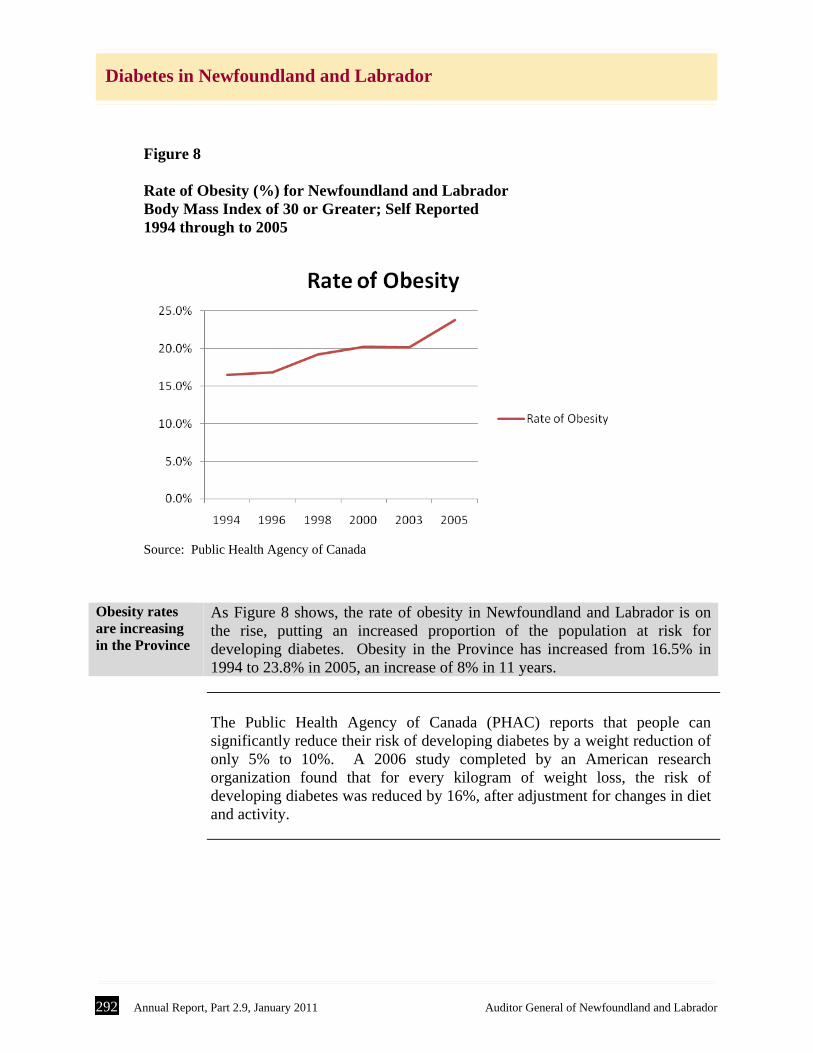
Figure 8 shows the obesity rate in Newfoundland and Labrador from 1994 to
2005.
292 Annual Report, Part 2.9, January 2011 Auditor General of Newfoundland and Labrador
Diabetes in Newfoundland and Labrador
Figure 8 Rate of Obesity (%) for Newfoundland and Labrador Body Mass Index of 30 or Greater; Self Reported 1994 through to 2005
Source: Public Health Agency of Canada
Obesity rates are increasing in the Province
As Figure 8 shows, the rate of obesity in Newfoundland and Labrador is on the rise, putting an increased proportion of the population at risk for developing diabetes. Obesity in the Province has increased from 16.5% in 1994 to 23.8% in 2005, an increase of 8% in 11 years.
The Public Health Agency of Canada (PHAC) reports that people can
significantly reduce their risk of developing diabetes by a weight reduction of only 5% to 10%. A 2006 study completed by an American research organization found that for every kilogram of weight loss, the risk of developing diabetes was reduced by 16%, after adjustment for changes in diet and activity.
Auditor General of Newfoundland and Labrador Annual Report, Part 2.9, January 2011 293
Diabetes in Newfoundland and Labrador
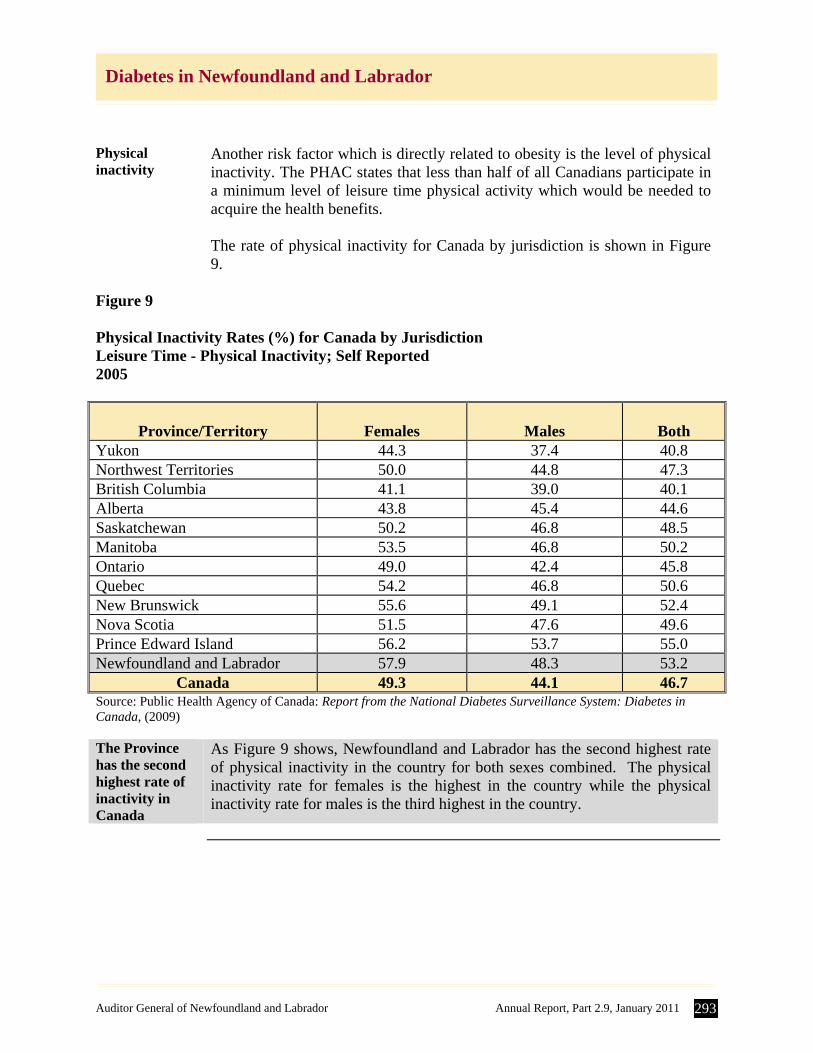
Physical inactivity
Another risk factor which is directly related to obesity is the level of physical inactivity. The PHAC states that less than half of all Canadians participate in a minimum level of leisure time physical activity which would be needed to acquire the health benefits. The rate of physical inactivity for Canada by jurisdiction is shown in Figure 9.
Figure 9 Physical Inactivity Rates (%) for Canada by Jurisdiction Leisure Time - Physical Inactivity; Self Reported 2005
Province/Territory
Females
Males
Both
Yukon 44.3 37.4 40.8 Northwest Territories 50.0 44.8 47.3 British Columbia 41.1 39.0 40.1 Alberta 43.8 45.4 44.6 Saskatchewan 50.2 46.8 48.5 Manitoba 53.5 46.8 50.2 Ontario 49.0 42.4 45.8 Quebec 54.2 46.8 50.6 New Brunswick 55.6 49.1 52.4 Nova Scotia 51.5 47.6 49.6 Prince Edward Island 56.2 53.7 55.0 Newfoundland and Labrador 57.9 48.3 53.2
Canada 49.3 44.1 46.7 Source: Public Health Agency of Canada: Report from the National Diabetes Surveillance System: Diabetes in Canada, (2009) The Province has the second highest rate of inactivity in Canada
As Figure 9 shows, Newfoundland and Labrador has the second highest rate of physical inactivity in the country for both sexes combined. The physical inactivity rate for females is the highest in the country while the physical inactivity rate for males is the third highest in the country.
294 Annual Report, Part 2.9, January 2011 Auditor General of Newfoundland and Labrador
Diabetes in Newfoundland and Labrador
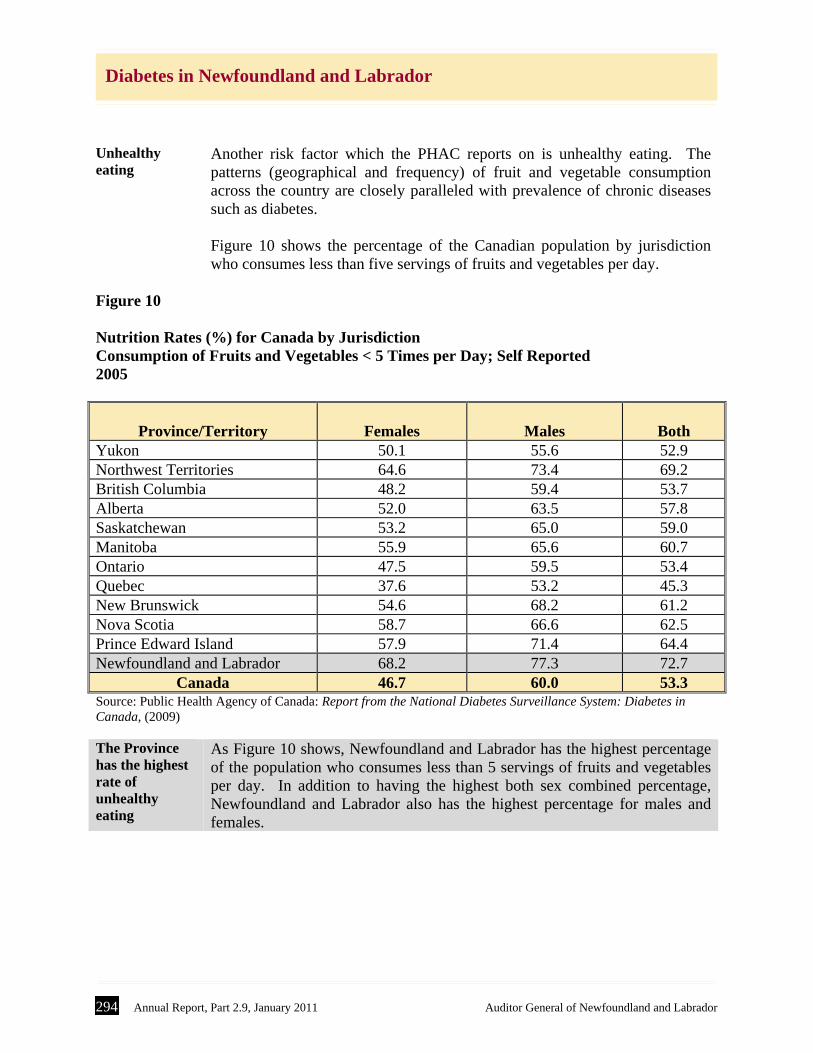
Unhealthy eating
Another risk factor which the PHAC reports on is unhealthy eating. The patterns (geographical and frequency) of fruit and vegetable consumption across the country are closely paralleled with prevalence of chronic diseases such as diabetes. Figure 10 shows the percentage of the Canadian population by jurisdiction who consumes less than five servings of fruits and vegetables per day.
Figure 10 Nutrition Rates (%) for Canada by Jurisdiction Consumption of Fruits and Vegetables < 5 Times per Day; Self Reported 2005
Province/Territory
Females
Males
Both
Yukon 50.1 55.6 52.9 Northwest Territories 64.6 73.4 69.2 British Columbia 48.2 59.4 53.7 Alberta 52.0 63.5 57.8 Saskatchewan 53.2 65.0 59.0 Manitoba 55.9 65.6 60.7 Ontario 47.5 59.5 53.4 Quebec 37.6 53.2 45.3 New Brunswick 54.6 68.2 61.2 Nova Scotia 58.7 66.6 62.5 Prince Edward Island 57.9 71.4 64.4 Newfoundland and Labrador 68.2 77.3 72.7
Canada 46.7 60.0 53.3 Source: Public Health Agency of Canada: Report from the National Diabetes Surveillance System: Diabetes in Canada, (2009) The Province has the highest rate of unhealthy eating
As Figure 10 shows, Newfoundland and Labrador has the highest percentage of the population who consumes less than 5 servings of fruits and vegetables per day. In addition to having the highest both sex combined percentage, Newfoundland and Labrador also has the highest percentage for males and females.
Auditor General of Newfoundland and Labrador Annual Report, Part 2.9, January 2011 295
Diabetes in Newfoundland and Labrador
1C. Health Implications of Diabetes
Introduction Diabetes can lead to complications later in life. These complications can be
quite costly to the health system and to the patient. The long-term complications associated with diabetes relate to issues with the effect of high blood glucose levels on blood vessels. There are three types of complications: Macrovascular - has to do with medium to large blood vessels and
can lead to heart disease and stroke. Microvascular - has to do with smaller blood vessels and causes
Nephropathy (kidney disease), foot problems (including amputations) and retinopathy (cataracts, glaucoma, blindness). In fact, according to International Diabetes Federation (IDF):
diabetic retinopathy is the leading cause of vision loss in adults of
working age (20 to 65 years) in industrialized countries, and about 2% of all people who have had diabetes for 15 years become blind, while about 10% develop a severe visual impairment.
Diabetes is the most common cause of amputation that is not the
result of an accident. People with diabetes are 15 to 40 times more likely to require lower-limb amputation compared to the general population.
Neuropathy - impacts the nervous system, especially the peripheral, in the lower limbs, and can cause pain, numbness and tingling sensations.
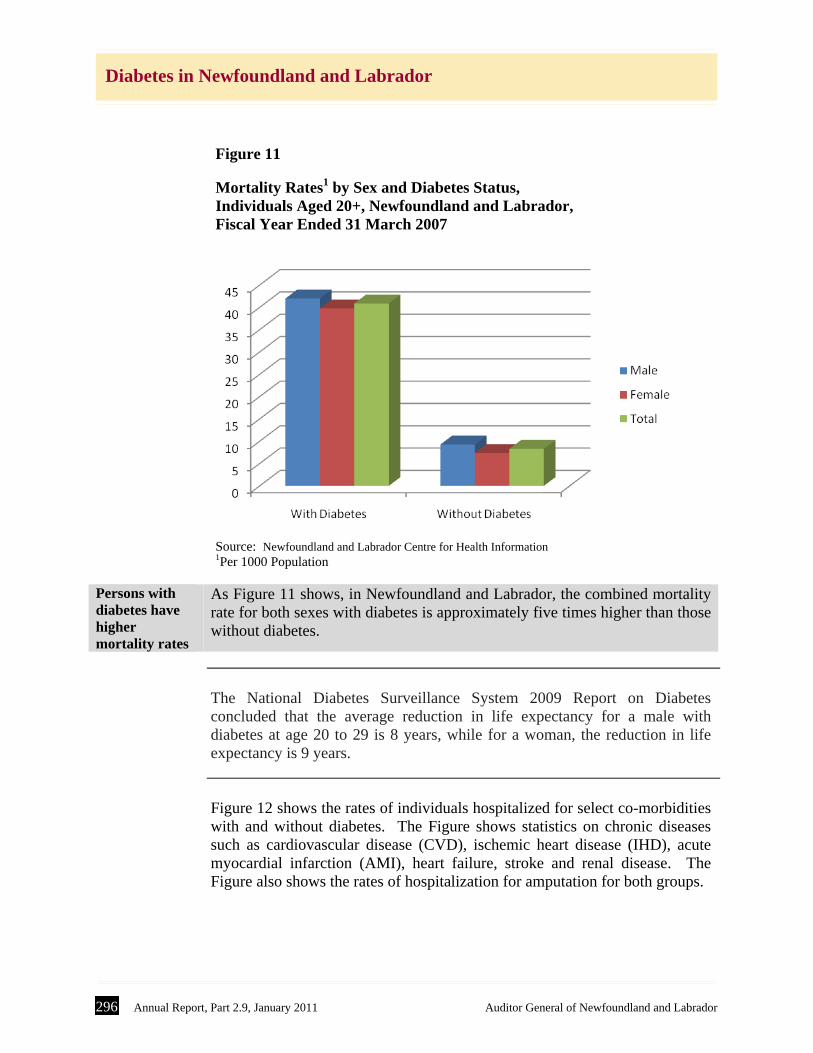
In most cases, death from diabetes will be as a result of the complications of
the disease. Figure 11 shows the mortality rates by sex and diabetes status.
296 Annual Report, Part 2.9, January 2011 Auditor General of Newfoundland and Labrador
Diabetes in Newfoundland and Labrador
Figure 11 Mortality Rates1 by Sex and Diabetes Status, Individuals Aged 20+, Newfoundland and Labrador, Fiscal Year Ended 31 March 2007
Source: Newfoundland and Labrador Centre for Health Information 1Per 1000 Population
Persons with diabetes have higher mortality rates
As Figure 11 shows, in Newfoundland and Labrador, the combined mortality rate for both sexes with diabetes is approximately five times higher than those without diabetes.
The National Diabetes Surveillance System 2009 Report on Diabetes
concluded that the average reduction in life expectancy for a male with diabetes at age 20 to 29 is 8 years, while for a woman, the reduction in life expectancy is 9 years.
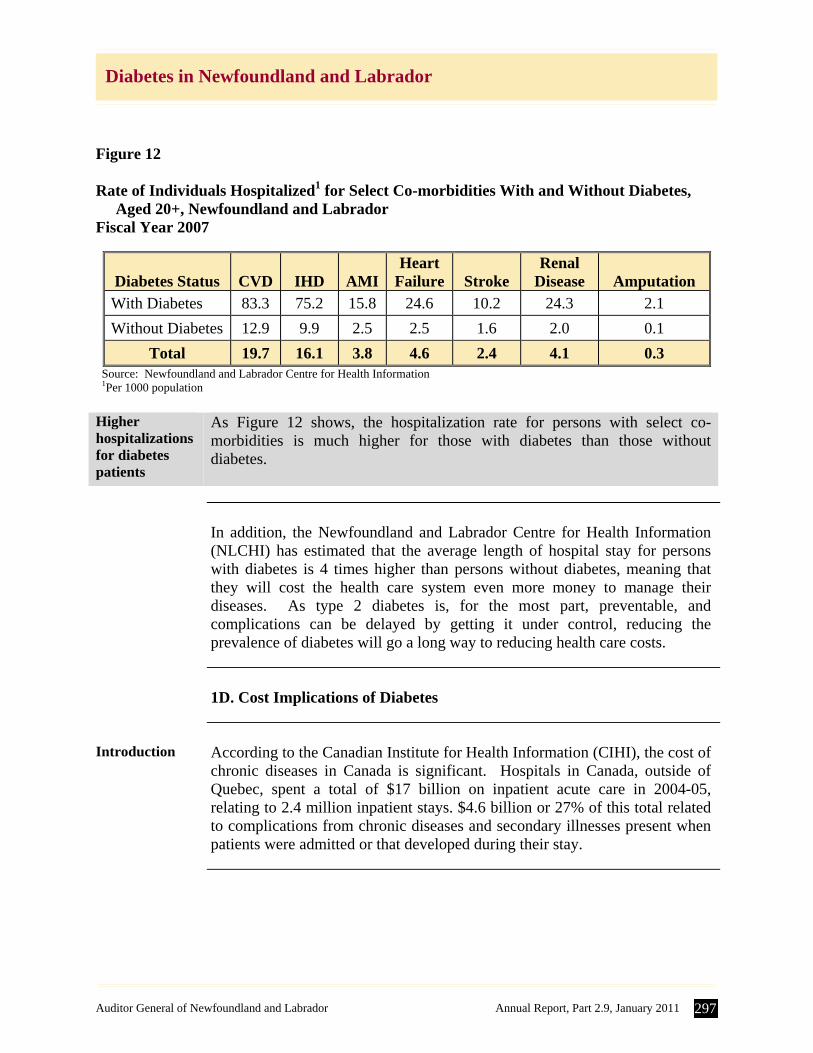
Figure 12 shows the rates of individuals hospitalized for select co-morbidities
with and without diabetes. The Figure shows statistics on chronic diseases such as cardiovascular disease (CVD), ischemic heart disease (IHD), acute myocardial infarction (AMI), heart failure, stroke and renal disease. The Figure also shows the rates of hospitalization for amputation for both groups.
Auditor General of Newfoundland and Labrador Annual Report, Part 2.9, January 2011 297
Diabetes in Newfoundland and Labrador
Figure 12 Rate of Individuals Hospitalized1 for Select Co-morbidities With and Without Diabetes, Aged 20+, Newfoundland and Labrador Fiscal Year 2007
Diabetes Status
CVD
IHD
AMI
Heart Failure
Stroke
Renal Disease
Amputation
With Diabetes 83.3 75.2 15.8 24.6 10.2 24.3 2.1
Without Diabetes 12.9 9.9 2.5 2.5 1.6 2.0 0.1
Total 19.7 16.1 3.8 4.6 2.4 4.1 0.3 Source: Newfoundland and Labrador Centre for Health Information 1Per 1000 population
Higher hospitalizations for diabetes patients
As Figure 12 shows, the hospitalization rate for persons with select co-morbidities is much higher for those with diabetes than those without diabetes.
In addition, the Newfoundland and Labrador Centre for Health Information
(NLCHI) has estimated that the average length of hospital stay for persons with diabetes is 4 times higher than persons without diabetes, meaning that they will cost the health care system even more money to manage their diseases. As type 2 diabetes is, for the most part, preventable, and complications can be delayed by getting it under control, reducing the prevalence of diabetes will go a long way to reducing health care costs.
1D. Cost Implications of Diabetes
Introduction According to the Canadian Institute for Health Information (CIHI), the cost of
chronic diseases in Canada is significant. Hospitals in Canada, outside of Quebec, spent a total of $17 billion on inpatient acute care in 2004-05, relating to 2.4 million inpatient stays. $4.6 billion or 27% of this total related to complications from chronic diseases and secondary illnesses present when patients were admitted or that developed during their stay.
298 Annual Report, Part 2.9, January 2011 Auditor General of Newfoundland and Labrador
Diabetes in Newfoundland and Labrador
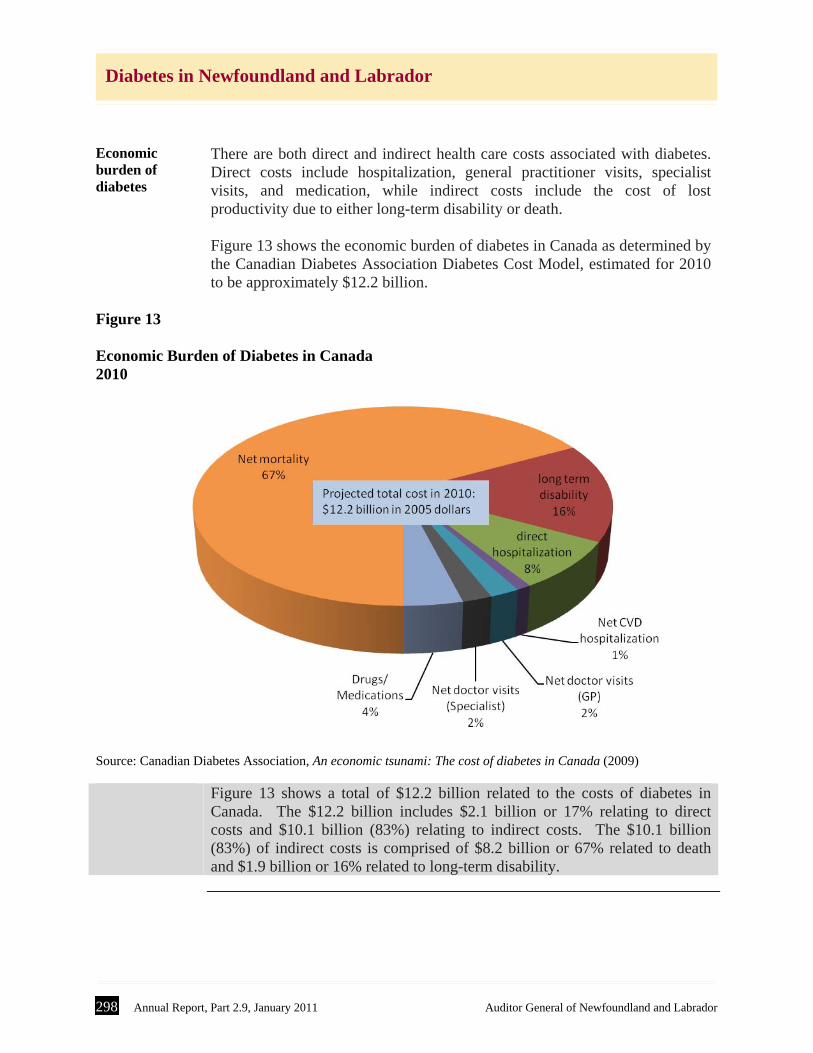
Economic burden of diabetes
There are both direct and indirect health care costs associated with diabetes. Direct costs include hospitalization, general practitioner visits, specialist visits, and medication, while indirect costs include the cost of lost productivity due to either long-term disability or death. Figure 13 shows the economic burden of diabetes in Canada as determined by the Canadian Diabetes Association Diabetes Cost Model, estimated for 2010 to be approximately $12.2 billion.
Figure 13
Economic Burden of Diabetes in Canada 2010
Source: Canadian Diabetes Association, An economic tsunami: The cost of diabetes in Canada (2009)
Figure 13 shows a total of $12.2 billion related to the costs of diabetes in
Canada. The $12.2 billion includes $2.1 billion or 17% relating to direct costs and $10.1 billion (83%) relating to indirect costs. The $10.1 billion (83%) of indirect costs is comprised of $8.2 billion or 67% related to death and $1.9 billion or 16% related to long-term disability.
Auditor General of Newfoundland and Labrador Annual Report, Part 2.9, January 2011 299
Diabetes in Newfoundland and Labrador
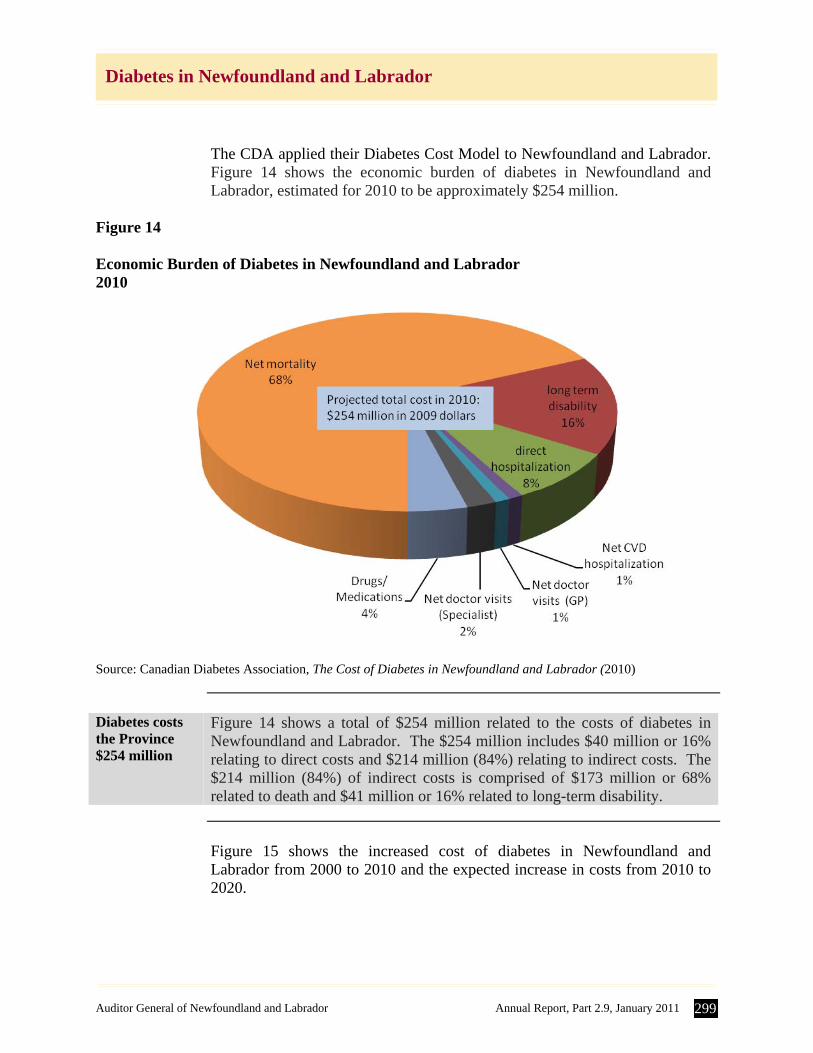
The CDA applied their Diabetes Cost Model to Newfoundland and Labrador. Figure 14 shows the economic burden of diabetes in Newfoundland and Labrador, estimated for 2010 to be approximately $254 million.
Figure 14
Economic Burden of Diabetes in Newfoundland and Labrador 2010
Source: Canadian Diabetes Association, The Cost of Diabetes in Newfoundland and Labrador (2010)
Diabetes costs the Province $254 million
Figure 14 shows a total of $254 million related to the costs of diabetes in Newfoundland and Labrador. The $254 million includes $40 million or 16% relating to direct costs and $214 million (84%) relating to indirect costs. The $214 million (84%) of indirect costs is comprised of $173 million or 68% related to death and $41 million or 16% related to long-term disability.
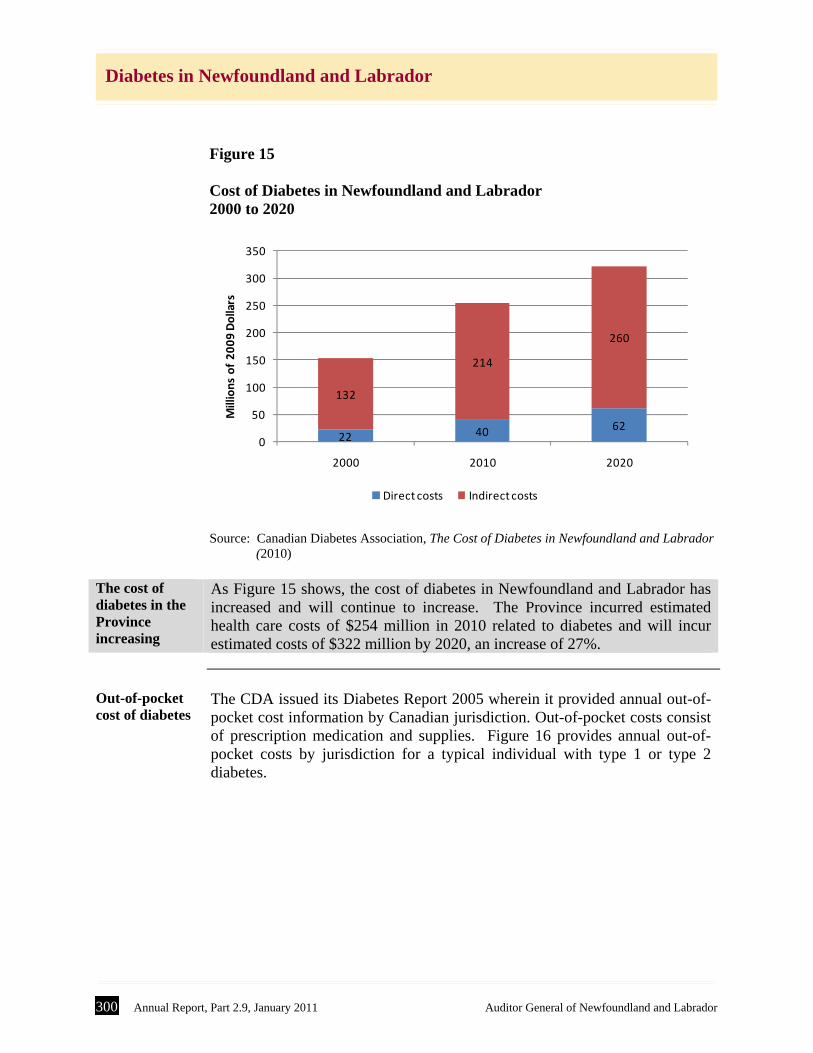
Figure 15 shows the increased cost of diabetes in Newfoundland and
Labrador from 2000 to 2010 and the expected increase in costs from 2010 to 2020.
300 Annual Report, Part 2.9, January 2011 Auditor General of Newfoundland and Labrador
Diabetes in Newfoundland and Labrador
Figure 15 Cost of Diabetes in Newfoundland and Labrador 2000 to 2020
22 40 62
132
214
260
0
50
100
150
200
250
300
350
2000 2010 2020
Millions of 2009 Dollars
Direct costs Indirect costs
Source: Canadian Diabetes Association, The Cost of Diabetes in Newfoundland and Labrador (2010)
The cost of diabetes in the Province increasing
As Figure 15 shows, the cost of diabetes in Newfoundland and Labrador has increased and will continue to increase. The Province incurred estimated health care costs of $254 million in 2010 related to diabetes and will incur estimated costs of $322 million by 2020, an increase of 27%.
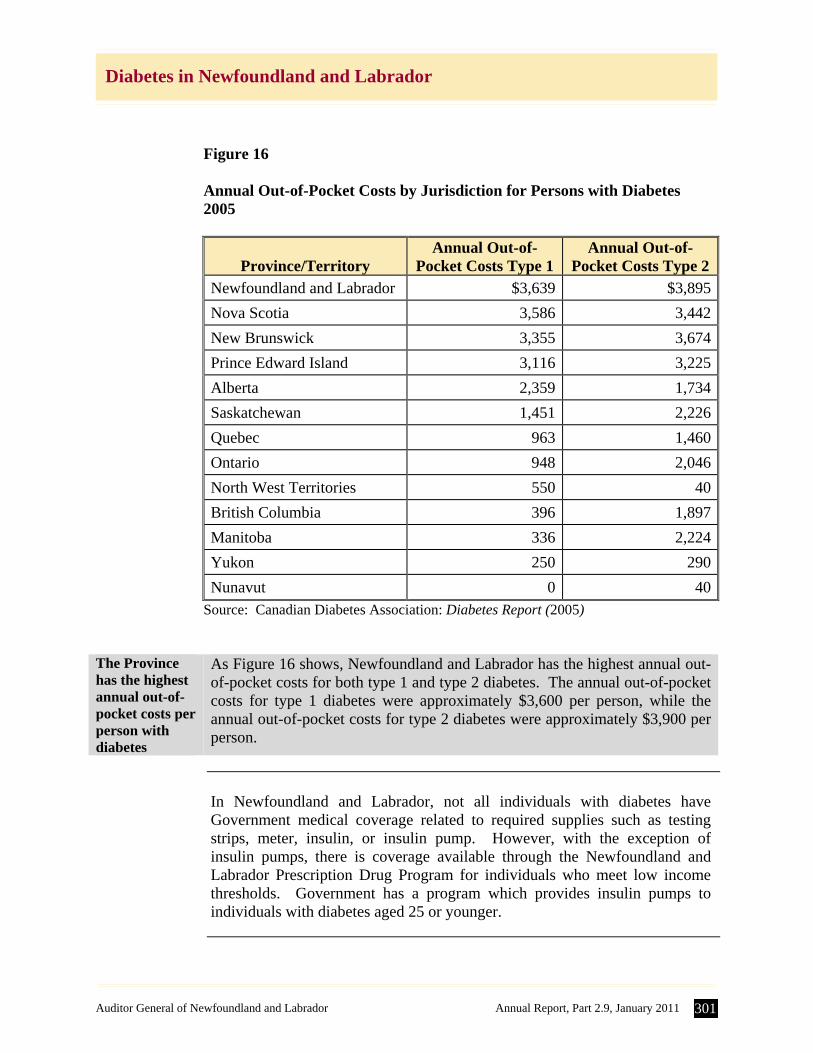
Out-of-pocket cost of diabetes
The CDA issued its Diabetes Report 2005 wherein it provided annual out-of-pocket cost information by Canadian jurisdiction. Out-of-pocket costs consist of prescription medication and supplies. Figure 16 provides annual out-of-pocket costs by jurisdiction for a typical individual with type 1 or type 2 diabetes.
Auditor General of Newfoundland and Labrador Annual Report, Part 2.9, January 2011 301
Diabetes in Newfoundland and Labrador
Figure 16 Annual Out-of-Pocket Costs by Jurisdiction for Persons with Diabetes 2005
Province/Territory Annual Out-of-
Pocket Costs Type 1 Annual Out-of-
Pocket Costs Type 2 Newfoundland and Labrador $3,639 $3,895
Nova Scotia 3,586 3,442
New Brunswick 3,355 3,674
Prince Edward Island 3,116 3,225
Alberta 2,359 1,734
Saskatchewan 1,451 2,226
Quebec 963 1,460
Ontario 948 2,046
North West Territories 550 40
British Columbia 396 1,897
Manitoba 336 2,224
Yukon 250 290
Nunavut 0 40Source: Canadian Diabetes Association: Diabetes Report (2005)
The Province has the highest annual out-of-pocket costs per person with diabetes
As Figure 16 shows, Newfoundland and Labrador has the highest annual out-of-pocket costs for both type 1 and type 2 diabetes. The annual out-of-pocket costs for type 1 diabetes were approximately $3,600 per person, while the annual out-of-pocket costs for type 2 diabetes were approximately $3,900 per person.
In Newfoundland and Labrador, not all individuals with diabetes have
Government medical coverage related to required supplies such as testing strips, meter, insulin, or insulin pump. However, with the exception of insulin pumps, there is coverage available through the Newfoundland and Labrador Prescription Drug Program for individuals who meet low income thresholds. Government has a program which provides insulin pumps to individuals with diabetes aged 25 or younger.
302 Annual Report, Part 2.9, January 2011 Auditor General of Newfoundland and Labrador
Diabetes in Newfoundland and Labrador
The Department has not determined the cost related to diabetes care
Although the CDA has estimated health care costs relating to diabetes care in the Province, albeit knowingly understated as a result of incomplete data, the Department has not made any determination of these costs. In fact, the Department has not determined the health care costs associated with any chronic diseases. Such information would be essential in order to adequately plan, manage and control initiatives. As a result of not having this information, it is more difficult for the Department to demonstrate whether any initiatives are having the desired effect.
Recommendation
The Department should determine the cost of chronic health care in the Province, including diabetes.
2.0 Prevention and Management of Chronic Diseases including Diabetes
Overview According to the then Minister of the Department of Health and Community
Services, “… decreasing the prevalence of chronic disease is key to sustaining the health care system”. This statement came about from a stakeholder session held in 2008 and it indicates that the Department is well aware of the issue of chronic diseases and that it should be working towards a strategy to deal with the prevention and management of chronic diseases in order to control health care costs.
Primary prevention
Primary prevention focuses on addressing the risk factors and working to reduce them. The strategies aim to reduce the incidence or number of new cases of the disease. This should happen at multiple levels, with the individual taking responsibility for their own health, and the community taking responsibility to create healthy public policies, services and environments that promote health and support the prevention of disease. In addition, it involves the health care provider and health care system developing policies and practices to guide behaviours in order to reduce the risk of anyone developing the disease.
Auditor General of Newfoundland and Labrador Annual Report, Part 2.9, January 2011 303
Diabetes in Newfoundland and Labrador
Secondary prevention
Secondary prevention focuses on identifying and detecting the disease before it progresses into complications. Strategies are aimed at early identification and treatment of the disease so as to minimize long-term costs. This should happen at the Provincial level whereby initiatives are developed to identify pockets of the population who are at a higher risk so as to reduce incidence and ease prevalence levels.
Tertiary prevention
Tertiary prevention focuses on management of people once they have the disease. Strategies at this level aim to improve the outcomes for those who have already been diagnosed. Both the Department and RHAs are responsible for keeping the general population healthy and improving quality of life for those with the disease.
In reviewing prevention and management activities of the Department, we
identified issues in the following areas: A. Overall Chronic Disease Strategy B. Primary Prevention Initiatives C. Secondary Prevention Initiatives D. Primary Health Care E. Insulin Pumps.
2A. Overall Chronic Disease Strategy
Introduction Prevention and management of any chronic disease is complex, and involves
multiple levels of care and service. Prevention and management are key because if you are successful in slowing down the development of risk factors and complications, you extend a person’s quality of life and decrease the cost to the patient and to the health care system. Chronic disease management involves knowing who has the disease, and tracking their progress and offering initiatives to address the potential for prevention and dealing with the complications. Many provinces have implemented chronic disease prevention and management strategies. Some provinces have developed specific strategies to deal with the prevention and management of diabetes. These strategies assist the provinces by establishing a framework, including guiding principles and strategic directions to monitor who has the disease or is at risk of getting it, providing province-wide initiatives for prevention and management, and strengthening capacities for services in all areas.
304 Annual Report, Part 2.9, January 2011 Auditor General of Newfoundland and Labrador
Diabetes in Newfoundland and Labrador
Need for Provincial strategy
As part of developing a strategy, the Province needs data to determine the current status of chronic diseases and the economic and social impact they are having on the Province. The nature, type, quantity and quality of this data can be found by researching what other provinces and countries have done in this area. There are also guidelines and policies that exist in the medical field which relate to appropriate diabetes prevention and management. The Province should serve in its leadership role with the RHAs by providing them with clear direction and goals so that they can either implement this strategy, or develop their own strategy which is in line with that of the Department.
Department identified need for strategy
The Department identified chronic disease management in its strategic plan for 2008-2011. Its plan was to develop a comprehensive chronic disease control strategy. The Department stated three annual objectives: “By March 31, 2009 the Department of Health and Community Services
will have started to develop a provincial chronic disease management strategy that includes policy directions to support an integrated and comprehensive approach to manage selected chronic diseases.”
“By March 31, 2010 the Department of Health and Community Services will have implemented policy directions and developed guidelines for management of selected chronic diseases and approved aspects of the strategy.”
“By March 31, 2011 the Department of Health and Community Services will have implemented a monitoring mechanism to measure the integration of the provincial chronic disease strategy into practice for the management of chronic diseases and conditions.”
Two of the indicators that the Department defined in the strategic plan included implementing the strategy and developing provincial guidelines and standards for selected chronic diseases. However, they admit progress has been slowed by other departmental priorities.
Auditor General of Newfoundland and Labrador Annual Report, Part 2.9, January 2011 305
Diabetes in Newfoundland and Labrador
Province does not have a strategy
The Province has not yet developed a strategy to deal with the prevention and management of chronic diseases such as diabetes. Although the Department has issued a Provincial Cancer Control Strategy, the Department does not have either an overall Chronic Disease Prevention and Management (CDPM) Strategy or a strategy for any other chronic disease which would include goals and measurable performance indicators. At the time of our review, the Department informed us that it was working towards an overall Chronic Disease Prevention and Management Strategy.
Reviews conducted by RHAs
Officials at the RHAs have noticed a lack of Provincial leadership in the area of chronic disease prevention and management, and diabetes care in particular. As a result, RHAs have undertaken their own initiatives. In particular: The Western RHA has developed its own diabetes strategy, and the RHA
has adopted the Expanded Chronic Care Model. In collaboration with the Central RHA, the Western RHA has received Provincial funding to implement the Stanford Chronic Disease Self Management Program. The Western RHA also conducted a Review of Diabetes Prevention and Management in 2008. They interviewed patients, held focus groups and surveyed stakeholders. The RHA has identified enhanced service delivery in the area of chronic disease prevention and management as a strategic goal. Recommendations from this report centered on areas such as collaborative partnerships, the necessity for leadership and resources, information management, and monitoring and evaluation of outcomes. These recommendations formed the basis of a regional Chronic Disease Prevention and Management Plan with identified actions that were achievable within existing resources.
The Central RHA is developing its own strategy for chronic disease
prevention and management, and the RHA also has adopted the Expanded Chronic Care Model and will focus on self-management. The Central RHA conducted a Diabetes Care Program Review in 2010, whereby they met with diabetes educators and policy personnel to identify threats and challenges as well as strengths and opportunities facing the region. They also met with residents of the region living with diabetes in preparation for the implementation of a self-management approach. The RHA has hired a Chronic Disease Prevention and Management Consultant and are currently recruiting for a Self-Management Coordinator. They have received funding from the Public Health Agency of Canada to complete projects focused on the prevention of diabetes as well as to do some preliminary work to prepare for the implementation of a self-management approach to service/care provision. Many of the recommendations they arrived at relate to data collection,
306 Annual Report, Part 2.9, January 2011 Auditor General of Newfoundland and Labrador
Diabetes in Newfoundland and Labrador
electronic analysis tools, regional coordination, and effecting change by “…creating more awareness, involving the communities to full capacity and most importantly integrating disease prevention initiatives into every health interaction”.
The Labrador-Grenfell RHA has drafted a work plan which will address
the issues of diabetes prevention and management; however, they are reluctant to put it into action until they have the appropriate resources in place, namely the diabetes education staff in the region. This is an area where they have been significantly lacking in the past. In 2010, the RHA significantly changed its organizational structure to a matrix leadership model.
The Eastern RHA has seconded a manager to develop the framework strategy for CDPM, and they have engaged the Eastern RHA directors who are responsible for the continuum of health services to initiate an assessment of current services provided related to chronic disease prevention and management. The RHA’s intent is to align their activities with the Department strategy.
2B. Primary Prevention Initiatives
Introduction Primary prevention involves addressing the underlying causes of type 2
diabetes, which means changes in behaviour and social and physical aspects of people’s lives. It is clear that adopting a healthier lifestyle, lowering obesity levels and increasing physical activity will lead to a healthier population. A change in social behaviour and attitude, similar to that for smoking, would have lasting effects on the population health. These changes to behaviour, while simple, are not easy to accomplish and can be quite costly to an individual. In addition, the results are not immediate; however, they can be long-lasting, and are an integral part of prevention.
Provincial Wellness Plan
The Province released a Provincial Wellness Plan in 2006 which outlined the Province’s actions for wellness. The plan focused on four areas: healthy eating, physical activity, tobacco use, and injury prevention. The Province has many wellness initiatives on-going in the schools and the community. For example, the Healthy Students, Healthy Schools; and Kids Eat Smart programs which promote healthy eating and healthy living. However, these are not directly linked with disease prevention, and the goals are not related to disease prevention.
Auditor General of Newfoundland and Labrador Annual Report, Part 2.9, January 2011 307
Diabetes in Newfoundland and Labrador
Lack of coordination of efforts
While the Province has a Provincial Wellness Plan, the links between wellness and disease prevention are weak at the Departmental level. In addition, the Department has not yet released any indicators for the Plan. The Wellness Plan is guided by principles which are collaborative and integrated in nature, yet Department officials indicated that chronic disease management and the Health Promotion and Wellness Division are not working together to achieve results.
2C. Secondary Prevention Initiatives
Introduction The key to secondary prevention is identifying individuals who are at a high
risk of developing diabetes. Without reliable information, it is not easy to reduce or slow down the development of the disease for those who are at risk or who have already developed pre-diabetes. One of the ways to identify high risk individuals and to monitor those with pre-diabetes is to complete and monitor some basic test procedures on a regular basis. There are screening tests which will identify individuals who are more susceptible to the disease.
Population at high risk of pre-diabetes
We have already noted that the statistics related to prevalence of diabetes are underestimated due to the non-inclusion of patient information from salaried physicians. We also know that: 23.8 % of individuals in our Province report that they are obese,
53.2% of individuals in our Province report that they are physically
inactive, and
72.7% of individuals in our Province report that they do not eat the daily recommended intake of fruits and vegetables.
Therefore, we know that there is a high percentage of the population that either have the disease or are at risk of developing diabetes. In order to identify people who are at risk of having the disease, there is a need to screen the population, record their information, and track their progress.
308 Annual Report, Part 2.9, January 2011 Auditor General of Newfoundland and Labrador
Diabetes in Newfoundland and Labrador
Key screening tests not conducted
One of the ways to identify high risk individuals is to complete and monitor some basic test procedures on a regular basis. Medical research has identified four basic screening tests, the results of which can identify those with pre-diabetes or who are at a risk of developing diabetes. These recommended care components are: One or more HgA1C tests in the last year;
A urine test for protein in the last year;
A dialated eye exam in the last two years; and
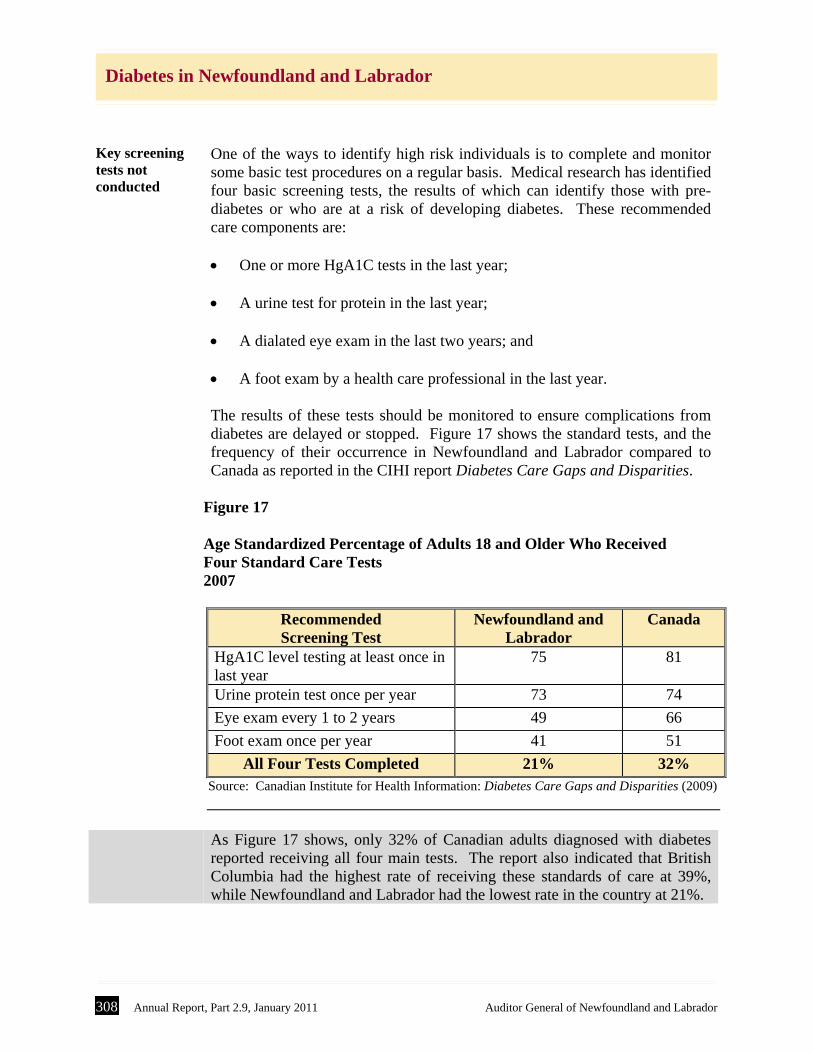
A foot exam by a health care professional in the last year. The results of these tests should be monitored to ensure complications from diabetes are delayed or stopped. Figure 17 shows the standard tests, and the frequency of their occurrence in Newfoundland and Labrador compared to Canada as reported in the CIHI report Diabetes Care Gaps and Disparities.
Figure 17 Age Standardized Percentage of Adults 18 and Older Who Received Four Standard Care Tests 2007
Recommended Screening Test
Newfoundland and Labrador
Canada
HgA1C level testing at least once in last year
75 81
Urine protein test once per year 73 74
Eye exam every 1 to 2 years 49 66
Foot exam once per year 41 51
All Four Tests Completed 21% 32% Source: Canadian Institute for Health Information: Diabetes Care Gaps and Disparities (2009)
As Figure 17 shows, only 32% of Canadian adults diagnosed with diabetes
reported receiving all four main tests. The report also indicated that British Columbia had the highest rate of receiving these standards of care at 39%, while Newfoundland and Labrador had the lowest rate in the country at 21%.
Auditor General of Newfoundland and Labrador Annual Report, Part 2.9, January 2011 309
Diabetes in Newfoundland and Labrador
Importance of regular screening
If the Province knows who is at high risk (e.g. who has been hospitalized for hyperglycemia, hypertension, renal failure, amputations, or eye surgery), and are attempting to reduce or mitigate those risks, they are also addressing other chronic disease risk factors, and the benefits are therefore two-fold.
Diabetes registry in NS
The Diabetes Care Program of Nova Scotia developed a diabetes registry in 1994. The purpose of a registry is to monitor trends in diagnosis and time sensitive information related to the care of a diabetes patient. The registry can be used to generate reports, and to develop and track program targets. The registry is housed centrally and used by 8 of the 9 District Health Authorities to track indicators of care, physician referrals, and daily statistics.
Manitoba Diabetes Reporting Act
The Province of Manitoba has a Diabetes Reporting Act whereby every physician who diagnoses a patient with diabetes has to report them to the Public Health Officer. In the case of persons under the age of 16, the diagnosis must be reported to the parents as well. This allows the Province of Manitoba to track with certainty how many people have the disease and how many have been newly diagnosed. This Act provides the Province of Manitoba with valuable information to assist in tracking patients and assess whether initiatives are working.
No registry in Newfoundland and Labrador
There is no Province-wide diabetes registry in Newfoundland and Labrador to capture patient information such as personal information, health complications, risk factors, diagnosis of multiple diseases, and test results. Also, there is no legislated requirement to track all those who are diagnosed with the disease each year. In addition, the Province does not have a complete electronic health record which could be used to track diabetes patient information. As a result, the Department does not have complete statistics related to diabetes which would be necessary in order to adequately manage the disease and its resulting health complications. Furthermore, the Western RHA has taken initiative to develop a diabetes registry using Meditech system information. Central RHA has also started a registry of diabetes patients in their region at the Twillingate/New World Island site. The other two RHAs, Eastern and Labrador-Grenfell, track statistics on diabetes patients but do not have a registry as of yet.
310 Annual Report, Part 2.9, January 2011 Auditor General of Newfoundland and Labrador
Diabetes in Newfoundland and Labrador
2D. Primary Health Care
Introduction The Primary Health Care Transition Fund was a Federal initiative announced
in 2000 to help provinces renew their primary health care systems. The Province’s share was $9.7 million which was used to create networks of physicians, nurse practitioners, public health officials, social workers and other health care providers to come together as health teams and provide a continuum of services known as collaborative care. One of these services was the treatment and management of chronic diseases such as diabetes.
Primary Health Care Framework
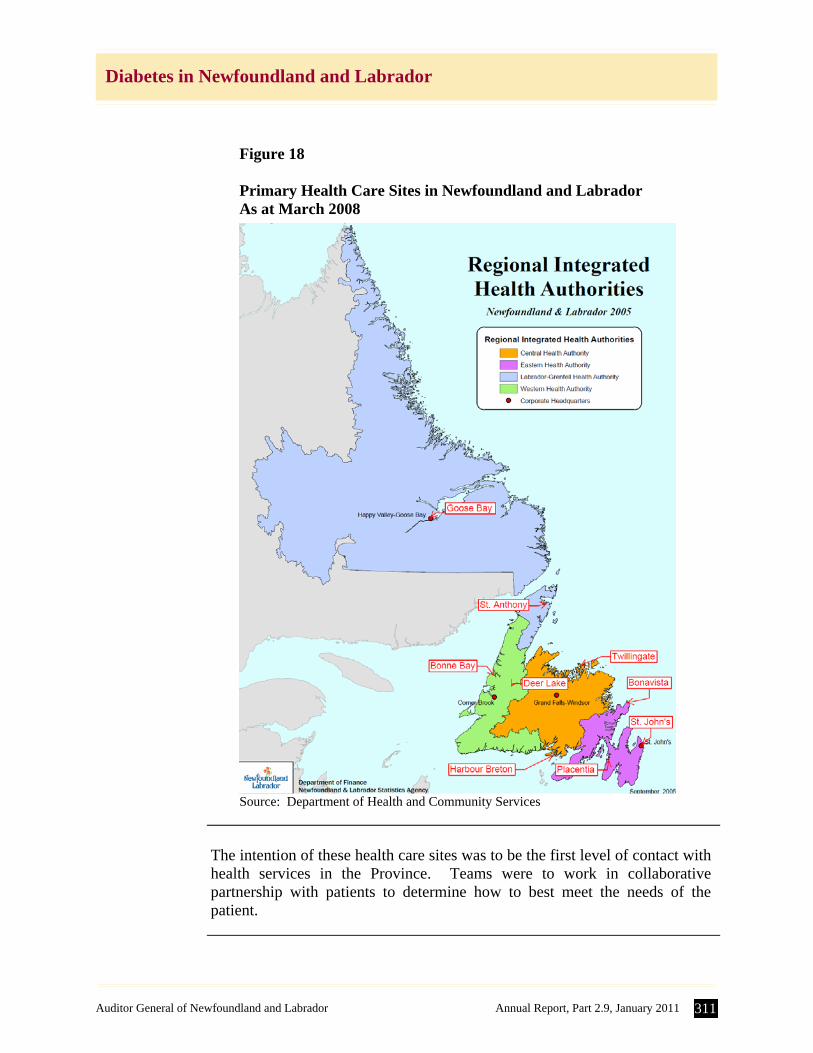
The Primary Health Care Framework is detailed in the Department’s 2003 report Moving Forward Together: Mobilizing Primary Health Care. As indicated in this report, the Department established the Office of Primary Health Care to provide Provincial policy direction, and overall implementation and evaluation of the Framework. One of the objectives of this Framework was “to establish, within existing resources, primary health care teams and networks”. Figure 18 shows the location of the 9 primary health care sites in Newfoundland and Labrador which were established in the RHAs through this funding.
Auditor General of Newfoundland and Labrador Annual Report, Part 2.9, January 2011 311
Diabetes in Newfoundland and Labrador
Figure 18 Primary Health Care Sites in Newfoundland and Labrador As at March 2008
Source: Department of Health and Community Services
The intention of these health care sites was to be the first level of contact with
health services in the Province. Teams were to work in collaborative partnership with patients to determine how to best meet the needs of the patient.
312 Annual Report, Part 2.9, January 2011 Auditor General of Newfoundland and Labrador
Diabetes in Newfoundland and Labrador
Diabetes collaboratives
The Department specifically established diabetes collaboratives at primary health care sites in the Province. The collaborative care concept is well supported in research. According to the Health Council of Canada, collaboratives are a process in which teams of health care providers receive external support, and support one another to adopt best practices and improve outcomes for their patients. The teams included, where possible, nurse practitioners, dietitians, and other staff who would work together to provide care to diabetes patients in the region. In addition to the primary health care sites, and in some cases operating in isolation, there are Diabetes Education Centres (DECs) staffed by diabetes nurse educators and dietitians which offer support services for persons living with diabetes. In addition to the primary health care sites, collaborative diabetes practices were set up at various locations identified in Figure 2.
Collecting patient information
Patients were seen at clinics and specific data was obtained and tracked in a diabetes flow sheet. The information to be collected in the flow sheet was based on the CDA clinical practice guidelines. The patient information to be captured and reported included personal information, health complications, risk factors, diagnosis of multiple diseases, and test results such as HgA1C levels and other blood work results. Not all of the sites participated in the use of the flow sheet.
Recording patient information
The Eastern RHA, in conjunction with the Office of Primary Health Care, and in consultation with the NLCHI, developed a database which would be used to collect the information contained in the flow sheets. The Provincial Chronic Disease Collaborative Database was maintained by the Eastern RHA as they had the necessary tools and resources to do so. The database had two parts – the data collection and the reporting piece. The intention was to link the information collected in each of the RHAs across the Province and to use the information to better manage diabetes patients. The Department had developed a memorandum of understanding (MOU) to be signed among the RHAs and the NLCHI to address confidentiality and privacy issues related to patient information stored in the database.
Auditor General of Newfoundland and Labrador Annual Report, Part 2.9, January 2011 313
Diabetes in Newfoundland and Labrador
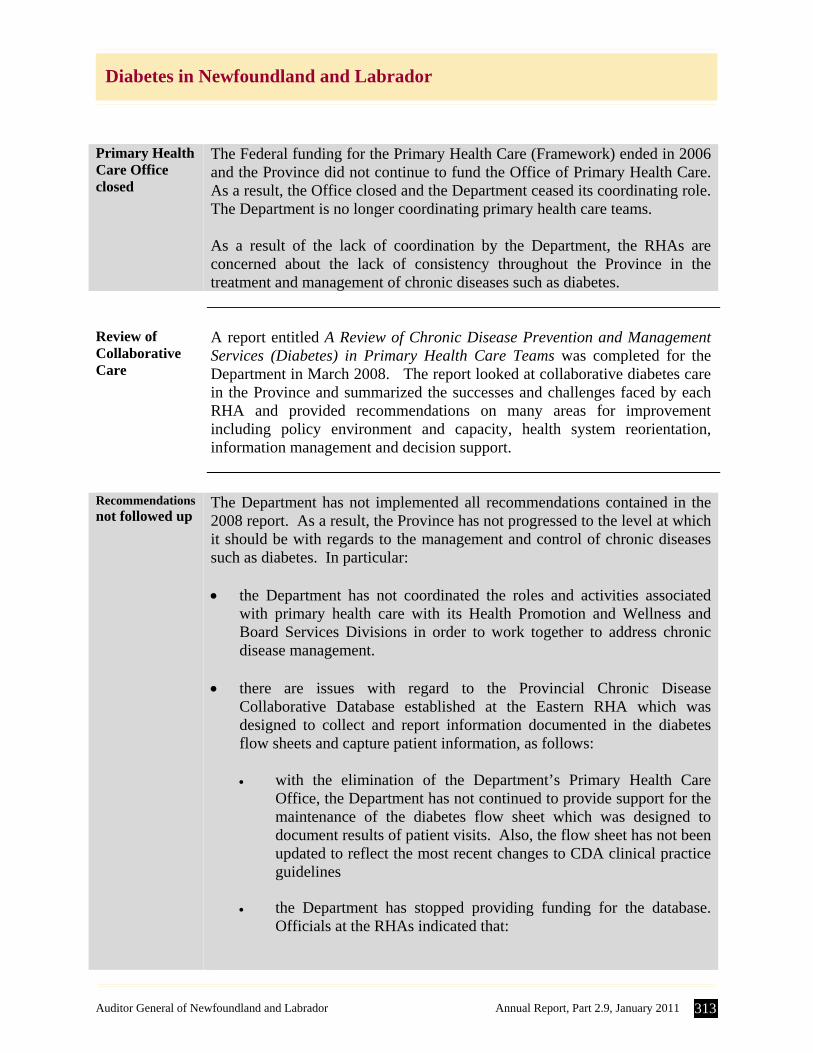
Primary Health Care Office closed
The Federal funding for the Primary Health Care (Framework) ended in 2006 and the Province did not continue to fund the Office of Primary Health Care. As a result, the Office closed and the Department ceased its coordinating role. The Department is no longer coordinating primary health care teams.
As a result of the lack of coordination by the Department, the RHAs are concerned about the lack of consistency throughout the Province in the treatment and management of chronic diseases such as diabetes.
Review of Collaborative Care
A report entitled A Review of Chronic Disease Prevention and Management Services (Diabetes) in Primary Health Care Teams was completed for the Department in March 2008. The report looked at collaborative diabetes care in the Province and summarized the successes and challenges faced by each RHA and provided recommendations on many areas for improvement including policy environment and capacity, health system reorientation, information management and decision support.
Recommendations not followed up
The Department has not implemented all recommendations contained in the 2008 report. As a result, the Province has not progressed to the level at which it should be with regards to the management and control of chronic diseases such as diabetes. In particular: the Department has not coordinated the roles and activities associated
with primary health care with its Health Promotion and Wellness and Board Services Divisions in order to work together to address chronic disease management.
there are issues with regard to the Provincial Chronic Disease
Collaborative Database established at the Eastern RHA which was designed to collect and report information documented in the diabetes flow sheets and capture patient information, as follows: with the elimination of the Department’s Primary Health Care
Office, the Department has not continued to provide support for the maintenance of the diabetes flow sheet which was designed to document results of patient visits. Also, the flow sheet has not been updated to reflect the most recent changes to CDA clinical practice guidelines
the Department has stopped providing funding for the database. Officials at the RHAs indicated that:
314 Annual Report, Part 2.9, January 2011 Auditor General of Newfoundland and Labrador
Diabetes in Newfoundland and Labrador
- the reporting/viewing features of the database were never implemented;
- many primary health care teams are either no longer completing the diabetes flow sheet and/or not entering the data into the database; and
- the full database was not available to all primary health care teams across the Province.
the Department did not complete an MOU to facilitate sharing data on
patient visits across RHAs and the NLCHI. According to staff at the Eastern RHA, they have been waiting on a response from the Department with respect to the most recent proposal for the database. They also indicated that there has been no useful assessment of the data collected to date. The RHAs would like to see a consolidation of records among all RHAs; however, without an MOU, this consolidation will not happen.
2E. Insulin Pumps
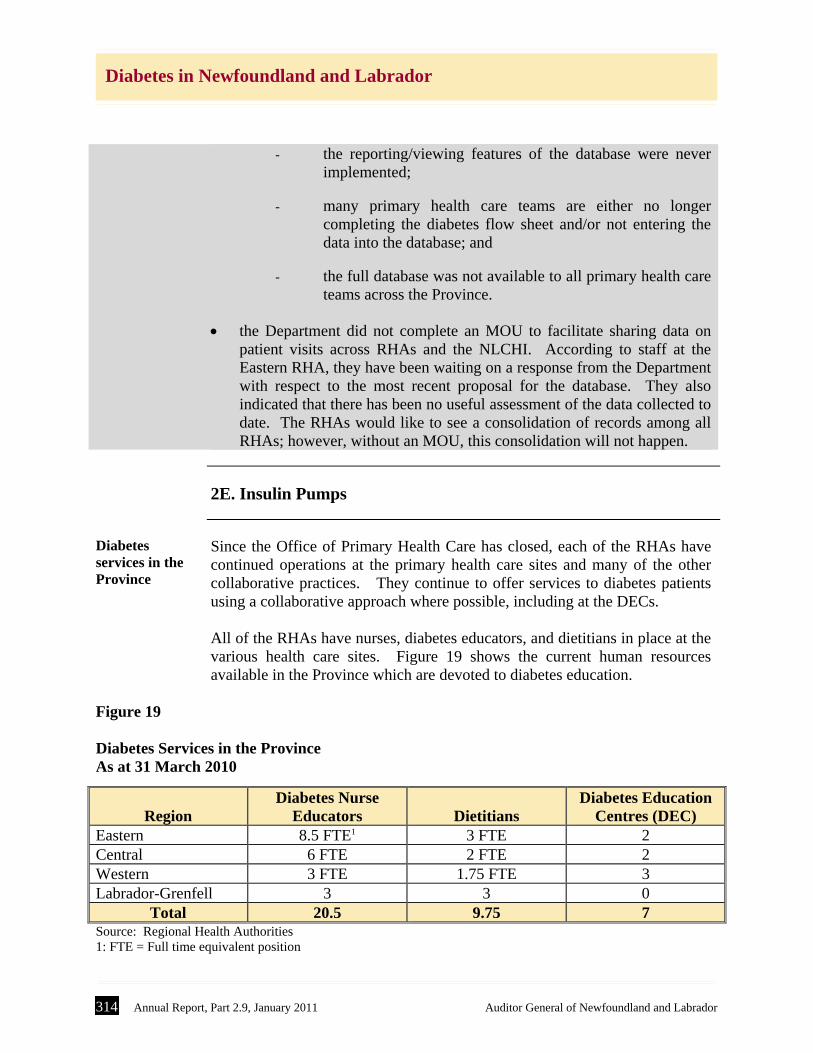
Diabetes services in the Province
Since the Office of Primary Health Care has closed, each of the RHAs have continued operations at the primary health care sites and many of the other collaborative practices. They continue to offer services to diabetes patients using a collaborative approach where possible, including at the DECs. All of the RHAs have nurses, diabetes educators, and dietitians in place at the various health care sites. Figure 19 shows the current human resources available in the Province which are devoted to diabetes education.
Figure 19 Diabetes Services in the Province As at 31 March 2010
Region
Diabetes Nurse Educators
Dietitians
Diabetes Education Centres (DEC)
Eastern 8.5 FTE1 3 FTE 2 Central 6 FTE 2 FTE 2 Western 3 FTE 1.75 FTE 3 Labrador-Grenfell 3 3 0
Total 20.5 9.75 7 Source: Regional Health Authorities 1: FTE = Full time equivalent position
Auditor General of Newfoundland and Labrador Annual Report, Part 2.9, January 2011 315
Diabetes in Newfoundland and Labrador
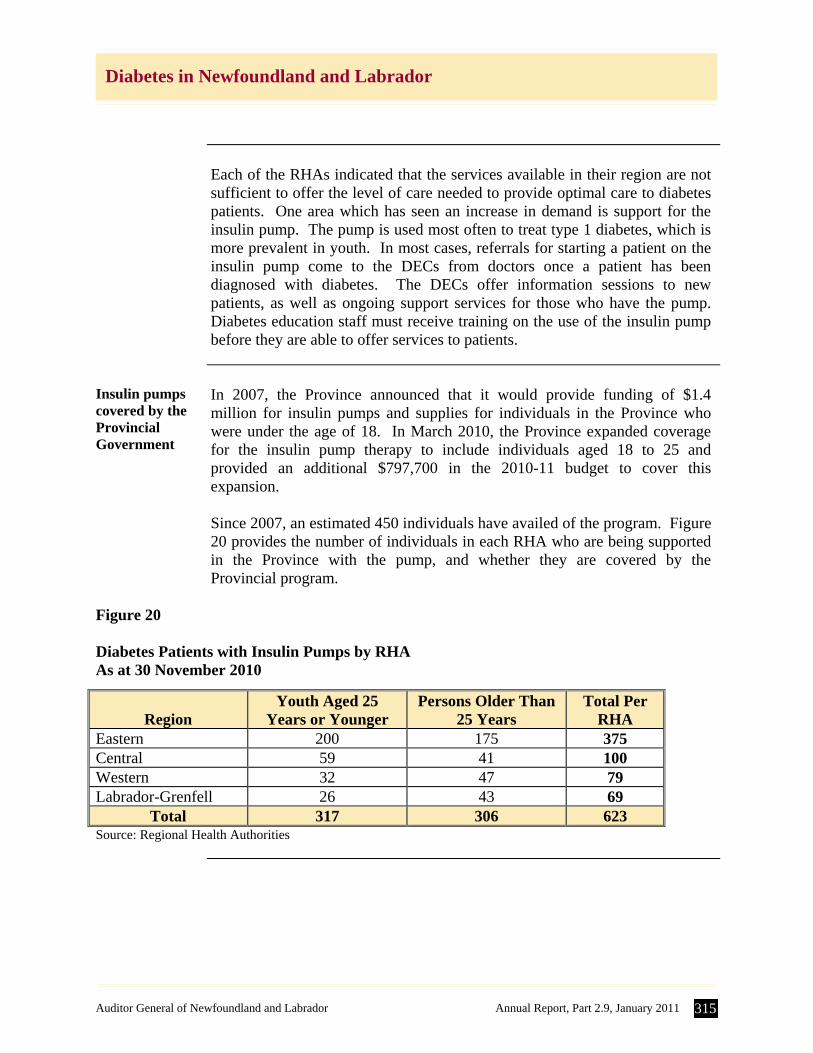
Each of the RHAs indicated that the services available in their region are not
sufficient to offer the level of care needed to provide optimal care to diabetes patients. One area which has seen an increase in demand is support for the insulin pump. The pump is used most often to treat type 1 diabetes, which is more prevalent in youth. In most cases, referrals for starting a patient on the insulin pump come to the DECs from doctors once a patient has been diagnosed with diabetes. The DECs offer information sessions to new patients, as well as ongoing support services for those who have the pump. Diabetes education staff must receive training on the use of the insulin pump before they are able to offer services to patients.
Insulin pumps covered by the Provincial Government
In 2007, the Province announced that it would provide funding of $1.4 million for insulin pumps and supplies for individuals in the Province who were under the age of 18. In March 2010, the Province expanded coverage for the insulin pump therapy to include individuals aged 18 to 25 and provided an additional $797,700 in the 2010-11 budget to cover this expansion. Since 2007, an estimated 450 individuals have availed of the program. Figure 20 provides the number of individuals in each RHA who are being supported in the Province with the pump, and whether they are covered by the Provincial program.
Figure 20 Diabetes Patients with Insulin Pumps by RHA As at 30 November 2010
Region
Youth Aged 25 Years or Younger
Persons Older Than 25 Years
Total Per RHA
Eastern 200 175 375 Central 59 41 100 Western 32 47 79 Labrador-Grenfell 26 43 69
Total 317 306 623 Source: Regional Health Authorities
316 Annual Report, Part 2.9, January 2011 Auditor General of Newfoundland and Labrador
Diabetes in Newfoundland and Labrador
Insulin pump usage highest in Eastern RHA
As Figure 20 shows, the number of individuals on the insulin pump is highest in the Eastern RHA. Officials at the Eastern RHA indicated that they estimate an additional 150 patients with diabetes within the RHA are using the insulin pump under the direct care of a general physician in conjunction with a research project. Also, the RHA is unable to provide any statistics regarding patients who may be using an insulin pump from a private company and who are managed by their own physician.
Insulin pumps require significant resources
From 2007 to 2010, insulin pumps were provided to qualifying individuals up to the age of 18. None of the RHAs indicated that they have been provided with any additional resources which would be required in order to adequately manage and monitor these individuals. As a result, the RHAs indicated that they had to reallocate resources to deal with these pumps and still have some concern about the level of diabetes care that they can provide. Staff at the Eastern RHA have stated that they do not have the qualified staff available to meet the demand for the support required. They also indicated that persons with insulin pumps, while representing only 1% of persons with diabetes, are consuming 50% of resources under its diabetes education program.
Recommendations
The Department should: develop a chronic disease prevention and management strategy. Follow-up on the recommendations in the 2008 report A Review of
Chronic Disease Prevention and Management Services (Diabetes) in Primary Health Care Teams. In particular, they should: pursue the further development of the database; and
obtain a memorandum of understanding with the NLCHI and the
RHAs to facilitate data sharing.
Auditor General of Newfoundland and Labrador Annual Report, Part 2.9, January 2011 317
Diabetes in Newfoundland and Labrador
Department’s Response
In response to your letter dated December 23, 2010, I have reviewed the
report completed by your office entitled Diabetes in Newfoundland and Labrador. The Department of Health and Community Services generally concurs with the observations and recommendations noted in the report and provides the following comments on the three recommendations noted from your review. Recommendation No. 1 The Department should determine the cost of chronic health care in the province, including diabetes. Department’s Response The Department agrees with the Auditor General’s recommendation. Where it can, the Department identifies costs for some elements of chronic diseases. In other cases, the Department uses costing information produced by reliable sources such as Health Canada, the Public Health Agency of Canada, the Health Council of Canada and national non-government organizations such as the Canadian Diabetes Association or the Canadian Stroke Strategy. The Department will continue its efforts in improving data collection through such means as the electronic health record, which in turn will improve its capacity to estimate costs. Recommendation No. 2 The Department should develop a chronic disease prevention and management strategy. Department’s Response The Department agrees with the Auditor General’s recommendation and has initiated the development of a strategy. In April 2010, a division of Chronic Disease Control was established in the Department with the mandate to work with partners to develop a chronic disease prevention and management strategy. The Regional Health Authorities and community partners have been engaged in discussions to identify priority areas and to ensure alignment with other regional and provincial strategies. A jurisdictional scan has been completed to assess strategies in other provinces and territories in Canada. As well, the new division of Chronic Disease Control is working closely with other divisions in the Department such as Health Promotion and Wellness, Board Services, Public Health, and the Office of Aging and Seniors to ensure
318 Annual Report, Part 2.9, January 2011 Auditor General of Newfoundland and Labrador
Diabetes in Newfoundland and Labrador
a comprehensive and collaborative approach to chronic disease prevention and management in the Department and throughout the province. Recommendation No. 3 The Department should follow up on the recommendations in the 2008 report A Review of Chronic Disease Prevention and Management Services (Diabetes) in Primary Health Care Teams. In particular they should: • Pursue the further development of the database • Obtain a memorandum of understanding with the NLCHI and the
RHAs to facilitate data sharing. Department’s Response The Department agrees in principle with the Auditor General’s recommendation to follow up on the recommendations in the 2008 Primary Health Care report. However, the Department also recognizes that this report is limited in that it only focused on initiatives implemented by the Office of Primary Health Care during the transition funding period. As a result, the full scope of programs and services available for individuals with chronic diseases, particularly diabetes, was not assessed. As the Department develops the provincial chronic disease prevention and management strategy the recommendations from the 2008 report will be considered and addressed as necessary.