Embed Size (px)
Citation preview

1
2nd Quarter 2015
Earnings Call Presentation
July 14, 2015

2
Louise Mehrotra
Vice President
Investor Relations

3
Note on Forward-Looking Statements These presentations contain “forward-looking statements” as defined in the Private Securities Litigation Reform Act of 1995 regarding, among
other things, future operating and financial performance, product development, market position and business strategy. The viewer is cautioned
not to rely on these forward-looking statements. These statements are based on current expectations of future events. If underlying
assumptions prove inaccurate or known or unknown risks or uncertainties materialize, actual results could vary materially from the expectations
and projections of Johnson & Johnson. Risks and uncertainties include, but are not limited to, economic factors, such as interest rate and
currency exchange rate fluctuations; competition, including technological advances, new products and patents attained by competitors;
challenges and uncertainties inherent in new product development, including uncertainty of clinical success and obtaining regulatory approvals;
uncertainty of commercial success for new and existing products; the ability of the company to successfully execute strategic plans; impact of
business combinations and divestitures; challenges to patents; the impact of patent expirations; significant adverse litigation or government
action, including related to product liability claims; changes to applicable laws and regulations, including global health care reforms; trends
toward health care cost containment; changes in behavior and spending patterns or financial distress of purchasers of health care products and
services; financial instability of international economies and legal systems and sovereign risk; manufacturing difficulties or delays, internally or
within the supply chain; product efficacy or safety concerns resulting in product recalls or regulatory action; increased scrutiny of the health care
industry by government agencies; and the potential failure to meet obligations in compliance agreements with government bodies. A further list
and description of these risks, uncertainties and other factors can be found in Johnson & Johnson’s Annual Report on Form 10-K for the fiscal
year ended December 28, 2014, including Exhibit 99 thereto, and the company’s subsequent filings with the Securities and Exchange
Commission. Copies of these filings are available online at www.sec.gov, www.investor.jnj.com, or on request from Johnson & Johnson. Any
forward-looking statement made in these presentations speaks only as of the date of these presentations. Johnson & Johnson does not
undertake to update any forward-looking statements as a result of new information or future events or developments.
Note on Non-GAAP Financial Measures These presentations refer to certain non-GAAP financial measures. These non-GAAP financial measures should not be considered
replacements for, and should be read together with, the most comparable GAAP financial measures.
A reconciliation of these non-GAAP financial measures to the most directly comparable GAAP financial measures can be found in the
accompanying financial schedules of the earnings release and the Investor Relations section of the Company’s website at www.investor.jnj.com.

4
2nd Quarter 2015 Sales by Geographic Area
% Change
TOTAL COMPANY 2Q 2015 2Q 2014 Reported Operational*
U.S. $8.9 $9.1 (2.4) (2.4)
Europe 4.2 5.1 (17.9) 1.0
Western Hemisphere
(ex U.S.) 1.5 1.9 (19.4) (4.0)
Asia-Pacific, Africa 3.2 3.4 (6.4) 2.2
International 8.9 10.4 (14.3) 0.5
Worldwide (WW) $17.8 $19.5 (8.8) (0.9)
* Excludes impact of currency translation
$ U.S. Billions

5
2Q 2015 2Q 2014 % Change
Sales $17.8 $19.5 (8.8) Total
(0.9) Ops*
GAAP Earnings 4.5 4.3 4.4
GAAP EPS 1.61 1.51 6.6
Adjusted Earnings** 4.8 5.1 (6.3)
Adjusted EPS** 1.71 1.78 (3.9)Total
6.7 Ops*
2nd Quarter 2015 Financial Highlights
* Excludes impact of currency translation
** Non-GAAP measure; excludes intangible amortization expense and special items; see reconciliation
$ U.S. Billions, except EPS

6
Consumer Highlights – 2nd Quarter 2015
Key Drivers of Operational Performance*
• Skin Care
– New product sales offset by
timing of U.S. trade inventory
build
• Women's Health
– New products & successful
marketing campaigns OUS
• Wound Care/Other
– BENECOL® divestiture OUS
in November 2014
• Total Consumer
– Excl. net impact of Acq./Div.**,
WW growth +3.1%, U.S.
+2.9%, OUS +3.2%
• Baby Care
– Lower sales of cleansers &
creams; soft sales in China
• Oral Care
– LISTERINE® new products
& successful marketing
campaigns
• OTC
– Analgesics WW growth driven
by Zyrtec in US and Upper
Respiratory OUS; US share
increases - adult share was
~12% and pediatric share
was ~44%
– US Zyrtec® & Upper
Respiratory OUS include
seasonal inventory builds
Sales: $3.5B Ops Change*: WW 2.3%, U.S. 2.7%, Int’l 2.1%
CONSUMER
SEGMENT
TOTAL WW
SALES $MM
REPORTED
% GROWTH
OPERATIONAL
% GROWTH*
Baby Care $543 (10.5%) (1.2%)
Oral Care 391 (5.3) 4.5
OTC 974 (2.9) 8.2
Skin Care 894 (7.6) (0.9)
Women’s
Health 320 (6.4) 9.9
Wound
Care/Other 361 (12.2) (7.6)
Total
Consumer $3,483 (7.0%) 2.3%
* Excludes impact of currency translation ** Non-GAAP measure; see reconciliation

7
Pharmaceutical Highlights – 2nd Quarter 2015
Key Drivers of Operational Performance*
• Oncology (cont.)
– OUS - strong growth in Asia and
Latin America partially offset by
lower sales in Europe due to
increased competition
– Strong sales of IMBRUVICA®
due to new indications and
strong patient uptake
• Cardiovascular / Metabolism /
Other**
– XARELTO® continued novel oral
anticoagulant U.S. market
leadership; 15% share of
broader oral anticoagulant
market
– INVOKANA®/INVOKAMET®
achieved ~6% in defined U.S.
T2D market and ~13% share
with endocrinologists
• Total Pharmaceutical
– Excluding net impact of acq/div
and Hep C sales***, WW growth
+9.7%, U.S. +16.5%
and OUS +2.5%
• Immunology
– Strong U.S. immunology market
growth and increased market share
for STELARA®, SIMPONI and
SIMPONI ARIA®
– Lower sales OF REMICADE to
distribution partners due to the
weakening of the euro, the loss of
exclusivity in Europe & reduction in
inventory levels
• Infectious Diseases
– Lower sales of hepatitis C products
due to competitive launches
• Neuroscience
– Long-acting injectable products
growth of +8% WW, +13% U.S.
– CONCERTA® positive impact of
reclassification of generic
competitor products in U.S.
• Oncology
– U.S. - ZYTIGA® strong market
growth partially offset by share
decline;
Sales: $7.9B Ops Change*: WW 1.0%, U.S. (1.5%), Int’l 3.8%
PHARMACEUTICAL
SEGMENT
TOTAL WW
SALES $MM
REPORTED
% GROWTH
OPERATIONAL
% GROWTH*
Immunology $2,554 (2.9%) 1.9%
Infectious Diseases 1,032 (41.4) (33.2)
Neuroscience 1,564 (3.9) 5.6
Oncology 1,144 3.0 17.2
Cardiovascular /
Metabolism / Other ** 1,652 19.9 24.3
Total Pharma $7,946 (6.6%) 1.0%
* Excludes impact of currency translation
** Previously referred to as Other *** Non-GAAP measure; see reconciliation

8
Medical Devices Highlights – 2nd Quarter 2015
Key Drivers of Operational Performance*
• Orthopaedics (cont.)
– WW Orthovisc/Monovisc strong
contributor to growth
– Pricing pressure across major
categories
• Specialty Surgery/Other
– WW Biosurgery of +8% and WW
Energy +6% due market growth,
market share gains in certain
segments & new products
• Surgical Care
– Endo growth with ECHELON
FLEXTM family partially offset by
lower sales in Women’s Health
• Vision Care
– Strong growth in Japan offset by
continuing impact of competitive
pricing dynamics
• Total Medical Devices
– Excl. net impact of Acq./Div.**, WW
growth +1.4%, U.S. +1.6%, OUS
+1.4%
• Cardiovascular
– WW electrophysiology +10%; driven
by strong growth of THERMOCOOL
SMARTTOUCH® Contact Force
Sensing Catheter
• Diabetes
– Impact of lower price offset by
ANIMAS® VIBETM strong double
digit growth and volume growth for
SMBG
• Diagnostics
– Divestiture of Ortho-Clinical
Diagnostics in June 2014
• Orthopaedics
– WW Knees +4%: strong sales of
ATTUNE® Knee System
– WW Hips +2%: driven by Primary
stem platform
– WW Trauma (1%): timing of tender
– WW Spine (1%): timing of tender
and competitive challenges
Sales: $6.4B Ops Change*: WW (4.7%), U.S. (5.8%), Int’l (3.9%)
MEDICAL DEVICES
SEGMENT
TOTAL WW
SALES $MM
REPORTED
% GROWTH
OPERATIONAL
% GROWTH*
Cardiovascular $544 (4.1%) 4.7%
Diabetes 494 (11.5) (2.1)
Diagnostics 16 (96.5) (95.0)
Orthopaedics 2,330 (5.6) 0.9
Specialty
Surgery/Other 879 (2.9) 4.5
Surgical Care 1,449 (8.0) 0.7
Vision Care 646 (8.6) 1.1
Total Med Dev $6,358 (12.2%) (4.7%)
* Excludes impact of currency translation ** Non-GAAP measure; see reconciliation

9
Important Developments in 2nd Quarter 2015
Pharmaceuticals:
• Completed a Rolling Submission of Biologic License Application (BLA) for daratumumab with U.S. FDA for the
Treatment of Multiple Myeloma*
• IMBRUVICA® Received European Commission Approval for Treatment of Waldenström’s Macroglobulinemia*
• STELARA® Received European Commission Approval for Treatment of Adolescents With Moderate-To-Severe
Psoriasis *
• SIMPONI® Received European Commission Approval for Treatment of Non-Radiographic Axial Spondyloarthritis
• Janssen Entered into a Worldwide Collaboration with Achillion Pharmaceuticals, Inc. to Combat Hepatitis C Virus
• U.S. FDA Approved INVEGA TRINZA™, First and Only Four-Times-A-Year Treatment for Schizophrenia
Medical Devices:
• Johnson & Johnson Announced Acceptance of Binding Offer from Cardinal Health to Acquire Cordis
Other:
• Johnson & Johnson and IBM Announced Plans to Collaborate on Advanced Solutions Designed to Transform
Healthcare Delivery
* Q3 2015 event

10
Alex Gorsky
Chairman of the Board
&
Chief Executive Officer

11

12
Performance Against Our Near-Term Priorities
Enterprise Delivering on our financial and
quality commitments
WW Sales1: $35.2B (+1.1% ops / ~ +6.0%2)
WW Adjusted Earnings/EPS1: $9.2B / $3.273
Delivered OTC Consent Decree commitments for the period
Pharmaceutical Continuing to build on our launch
excellence and robust pipeline
Expect 7 recently launched products to exceed $1B by YE4,5
Plan to file 10+ NME’s by 2019, each with $1B potential5
40+ Line Extensions planned to be filed by 2019
Medical Devices
Accelerating growth through
innovation and transforming our
go-to-market models
Filed > 50% of 30 major planned filings by 2016
Executing strategic partnerships (Google, IBM)
Piloting new, innovative go-to-market models
Consumer
Expanding market leadership in key
segments within OTCs, Oral Care, Baby
and Beauty
Solid operational sales growth of ~ 4.0%6
Re-launched and remediated US OTC (sales +13.0%1)
20 key product launches in 2015
1 2015 YTD 2 Ops growth excluding Acquisitions, Divestitures and hep C; see non-GAAP reconciliation 3 Non-GAAP measure; excludes intangible amortization expense and special items; see non-GAAP reconciliation
4 Products launched from 2009-2014
5 Includes partner sales, where applicable 6 2015 YTD growth excluding Acquisitions & Divestitures ; see non-GAAP reconciliation

13
Strongly Positioned to Deliver
Continued Growth
Johnson & Johnson
• Creating Value Through
Innovation
• Global Reach, Local Focus
• Excellence in Execution
• Leading with Purpose

14
A Remarkable Legacy
and an Exciting Future
• Strong Business
– Consistent Performance
• Prioritized Capital Allocation Strategy
– Transparent Approach
• Proven Record of Innovation
– Robust Pipeline
• Significant Shareholder Value
– Competitive Returns

15
Sandi Peterson
Group Worldwide Chairman

16
Driving Scale & Growth of Consumer-Facing Businesses
• Execute Consumer near-term
priorities and revitalize Consumer
Medical Device
• Target attractive global
markets
– Emerging markets
• Innovate insight-led pipelines
• Advance marketing capabilities
• Capitalize on technology
Consumer, Diabetes Solutions, Vision Care

17
Expanding Market Leadership in Key Categories OTCs, Oral Care, Baby and Beauty
Strategy
• Globalize 12 mega brands
in 11 consumer need-states
• Build on world-class
marketing capabilities and
innovative pipelines
• Create a competitive
and agile supply chain
Results
• Re-launched and remediated
US OTC
• Expanded key categories
into new markets:
- Oral Care, Beauty, Baby,
Women’s Health,
and OTC’s
• 20 key product launches
in 2015
- Neutrogena® Hydro Boost,
LISTERINE® Whitening
in EMEA and LATAM,
Motrin® Liquid-Gels

18
Consumer: Focused on Delivering Continued Growth and Improved Profitability
• Targeting highly attractive
global market
• Delivering organic sales growth
year over year
– New strategy launched in 2013
– Achieving market share gains
• Improving operating margins
• Executing disciplined portfolio
management
New Strategy Advancing and
Rebuilding Competitive Edge

19
Diabetes Solutions: Unique and Attractive Value Proposition
• Targeting attractive market with significant unmet
need in BGM and Insulin Delivery
• Expanding the market through penetration
and innovation
– Animas achieved #21 share position, 32%2 growth
– Calibra launching in 2016 in the U.S.
• Reducing complexity and costs
• Leveraging the power of the enterprise
and strategic partnerships
– Consumer Devices, Pharm, Surgery,
Health & Wellness
– Nova Biomedical, Dexcom, JDRF
Strong Domain Knowledge; Well Positioned to Lead
1 Source: Internal estimates 2 YTD operational growth
20
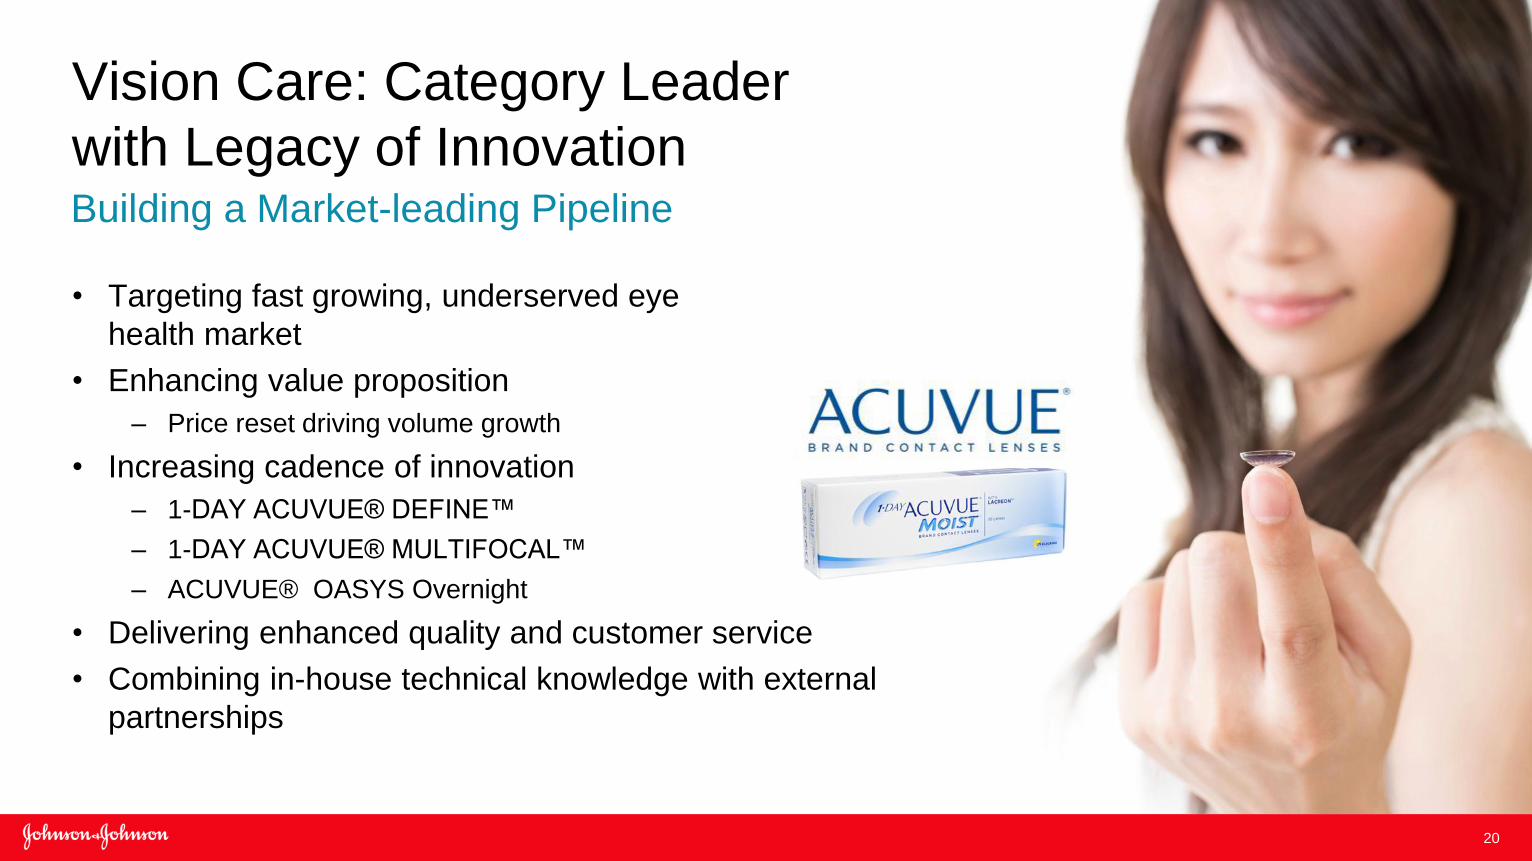
Vision Care: Category Leader
with Legacy of Innovation
• Targeting fast growing, underserved eye
health market
• Enhancing value proposition
– Price reset driving volume growth
• Increasing cadence of innovation
– 1-DAY ACUVUE® DEFINE™
– 1-DAY ACUVUE® MULTIFOCAL™
– ACUVUE® OASYS Overnight
• Delivering enhanced quality and customer service
• Combining in-house technical knowledge with external
partnerships
Building a Market-leading Pipeline
21
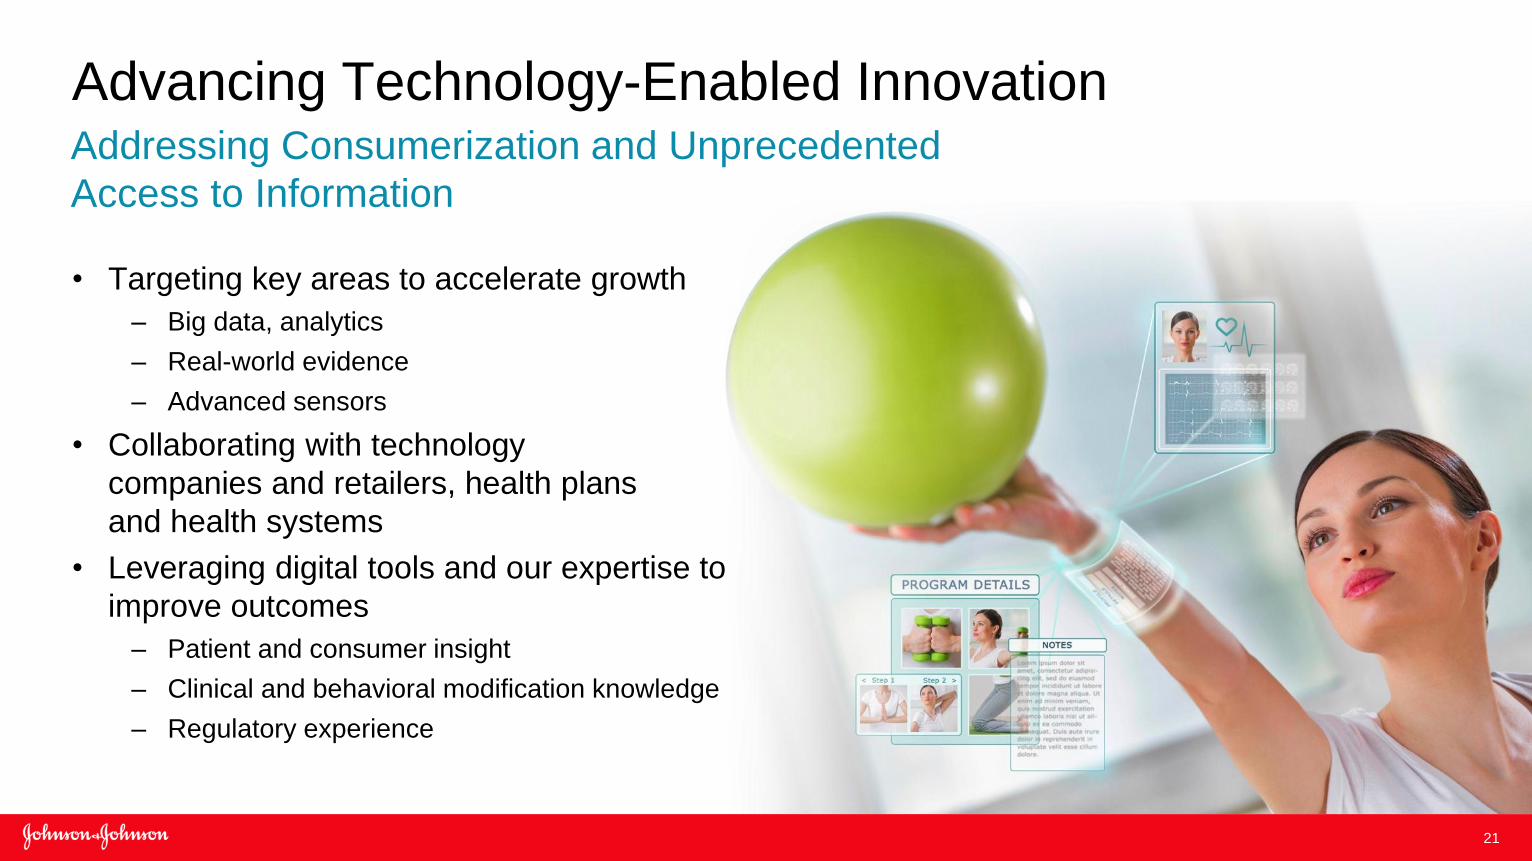
Advancing Technology-Enabled Innovation
• Targeting key areas to accelerate growth
– Big data, analytics
– Real-world evidence
– Advanced sensors
• Collaborating with technology
companies and retailers, health plans
and health systems
• Leveraging digital tools and our expertise to
improve outcomes
– Patient and consumer insight
– Clinical and behavioral modification knowledge
– Regulatory experience
Addressing Consumerization and Unprecedented
Access to Information

22
Key Takeaways
• Executing focused strategy
• Improving profitability
• Actively managing portfolio
• Capitalizing on technology advances
• Building on leadership expertise

23
Dominic Caruso
Vice President, Finance
&
Chief Financial Officer

24
2nd Quarter 2015 Condensed Consolidated Statement of Earnings (Unaudited; Dollars and Shares in Millions Except Per Share Figures)
(Unaudited; in Millions Except Per Share Figures)
Percent
Percent Percent Increase
Amount to Sales Amount to Sales (Decrease)
Sales to customers 17,787$ 100.0 19,495$ 100.0 (8.8)
Cost of products sold 5,357 30.1 6,039 31.0 (11.3)
Selling, marketing and administrative expenses 5,384 30.3 5,481 28.1 (1.8)
Research and development expense 2,129 12.0 2,005 10.3 6.2
In-process research and development - - 4 0.0
Interest (income) expense, net 107 0.6 114 0.6
Other (income) expense, net (931) (5.3) 226 1.1
Earnings before provision for taxes on income 5,741 32.3 5,626 28.9 2.0
Provision for taxes on income 1,225 6.9 1,300 6.7 (5.8)
Net earnings 4,516$ 25.4 4,326$ 22.2 4.4
Net earnings per share (Diluted) 1.61$ 1.51$ 6.6
Average shares outstanding (Diluted) 2,812.0 2,874.2
Effective tax rate 21.3 % 23.1 %
Adjusted earnings before provision for taxes and net earnings
Earnings before provision for taxes on income 6,248$ 35.1 6,524$ 33.5 (4.2)
Net earnings 4,812$ 27.1 5,133$ 26.3 (6.3)
Net earnings per share (Diluted) 1.71$ 1.78$ (3.9)
Effective tax rate 23.0 % 21.3 %
(1) See Reconciliation of Non-GAAP Financial Measures.
SECOND QUARTER
2015 2014