Embed Size (px)
Citation preview

2nd Quarter Earnings Conference Call
July 19, 2019

2
Second quarter & YTD 2019 highlights
(1) Net income and EPS from continuing operations available to common shareholders. (2) Non-GAAP, see appendix for reconciliation.
Net Income(1)
$374MAdj. Revenue(2)
$1.5B+ 1% YoY
Adj. Expenses(2)
$857M- 2% YoY
Adj. avg loans(2)
& avg deposits
+ 1% QoQ
Adj. positiveoperating leverage(2)
+ 4% YTD
Adj. PPI(2)
+ 7% YoYAdj. efficiency ratio(2)
58.3%
2Q19 EPS(1) of $0.37 up16% YoY
NII up 2%; adjusted NIR(2)
up modestly YoY
+ 3% YoY
Adjusted expenses remainwell controlled
Adj. efficiency ratio(2)
improvement of 210bps YoY Strong core business performance
and success in priority marketsYTD adj. revenue(2) up 2%;
YTD adj. NIE(2) down 2%

3
Average loans and leases Ending securities(2)
Adjusted business loans (1) Adjusted consumer loans (1)
2Q18 1Q19 2Q19
49.0 52.5 53.1
27.9
$76.9
28.3
$80.8
28.2
$81.3
Balance sheet optimization: strategically
positioning the balance sheet for maximum
efficiency to support net interest income and
margin, as well as overall profitability.
Continued balance sheet optimizationLoans and securities
06/30/18 03/31/19 06/30/19
$24.5 $25.3 $24.1
($ in billions)($ in billions)
• Reduced securities portfolio book balance
$1.5B through maturities and sales
• Repositioned another ~$2.8B improving
portfolio yield run rate 8bps; focus on
improving performance in a declining rate
environment
(1) Non-GAAP, see appendix for reconciliation. (2) Includes both AFS and HTM securities, as well as net unrealized gain (loss) on AFS securities.
4
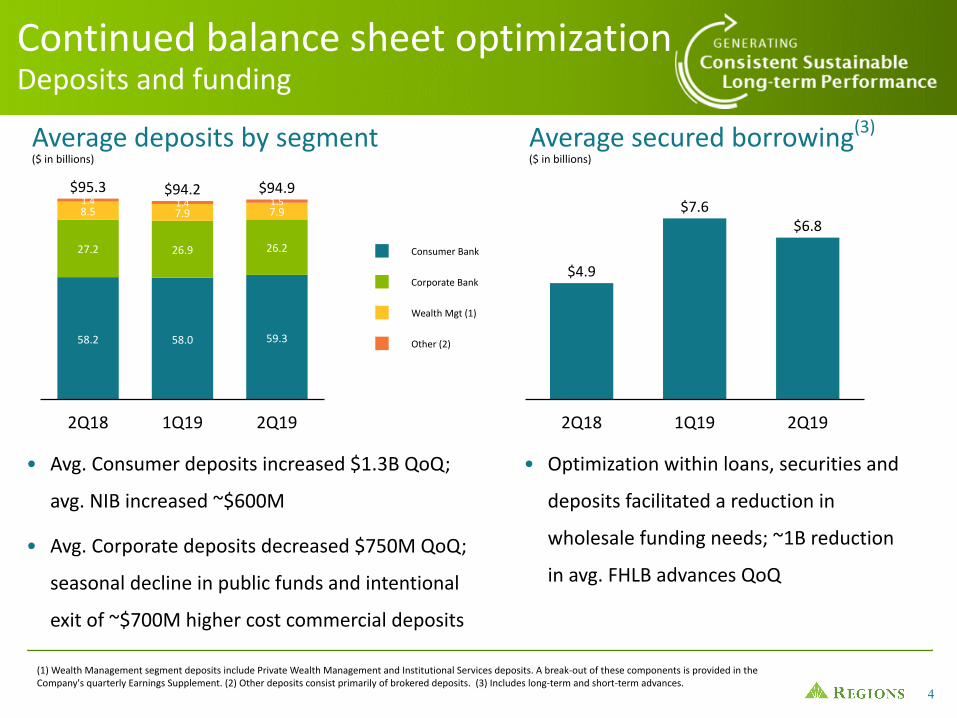
($ in billions)Average deposits by segment Average secured borrowing(3)
2Q18 1Q19 2Q19
$4.9
$7.6$6.8
Consumer Bank
Corporate Bank
Wealth Mgt (1)
Other (2)
2Q18 1Q19 2Q19
58.2 58.0 59.3
27.2 26.9 26.2
8.5 7.9 7.91.4
$95.31.4
$94.21.5
$94.9
• Optimization within loans, securities and
deposits facilitated a reduction in
wholesale funding needs; ~1B reduction
in avg. FHLB advances QoQ
($ in billions)
(1) Wealth Management segment deposits include Private Wealth Management and Institutional Services deposits. A break-out of these components is provided in theCompany's quarterly Earnings Supplement. (2) Other deposits consist primarily of brokered deposits. (3) Includes long-term and short-term advances.
Continued balance sheet optimizationDeposits and funding
• Avg. Consumer deposits increased $1.3B QoQ;
avg. NIB increased ~$600M
• Avg. Corporate deposits decreased $750M QoQ;
seasonal decline in public funds and intentional
exit of ~$700M higher cost commercial deposits
5
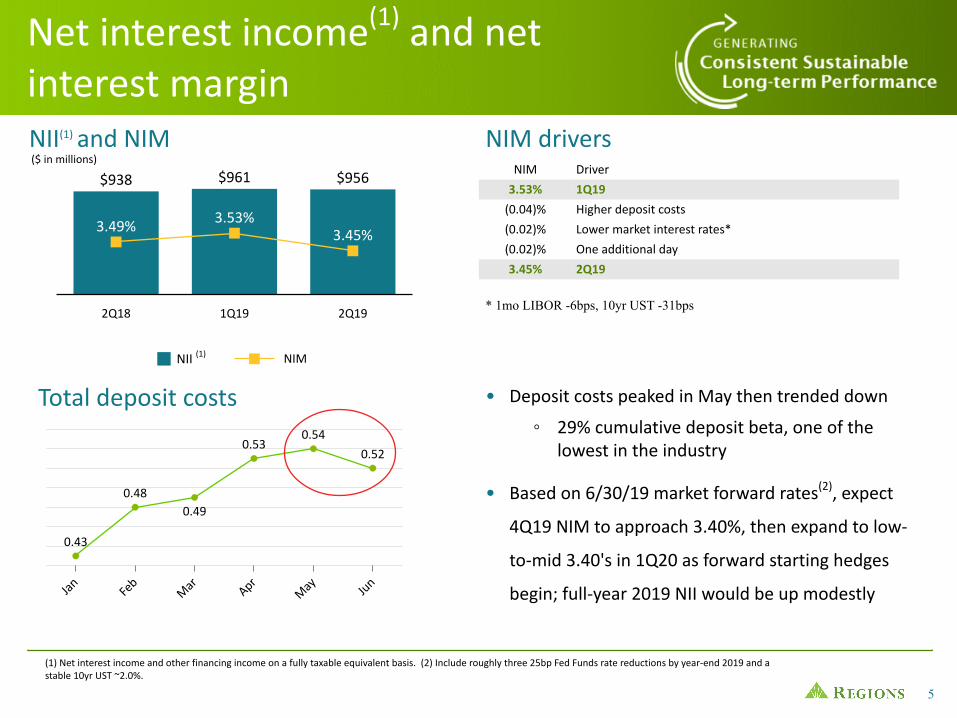
NII(1) NIM
2Q18 1Q19 2Q19
$938 $961 $956
3.49% 3.53%3.45%
Net interest income(1) and netinterest margin NII(1) and NIM($ in millions)
(1) Net interest income and other financing income on a fully taxable equivalent basis. (2) Include roughly three 25bp Fed Funds rate reductions by year-end 2019 and astable 10yr UST ~2.0%.
Jan Feb
Mar Apr
May Ju
n
0.43
0.480.49
0.530.54
0.52
Total deposit costs
NIM Driver
3.53% 1Q19
(0.04)% Higher deposit costs
(0.02)% Lower market interest rates*
(0.02)% One additional day
3.45% 2Q19
NIM drivers
• Deposit costs peaked in May then trended down
◦ 29% cumulative deposit beta, one of thelowest in the industry
• Based on 6/30/19 market forward rates(2), expect
4Q19 NIM to approach 3.40%, then expand to low-
to-mid 3.40's in 1Q20 as forward starting hedges
begin; full-year 2019 NII would be up modestly
* 1mo LIBOR -6bps, 10yr UST -31bps
NII (1)
6
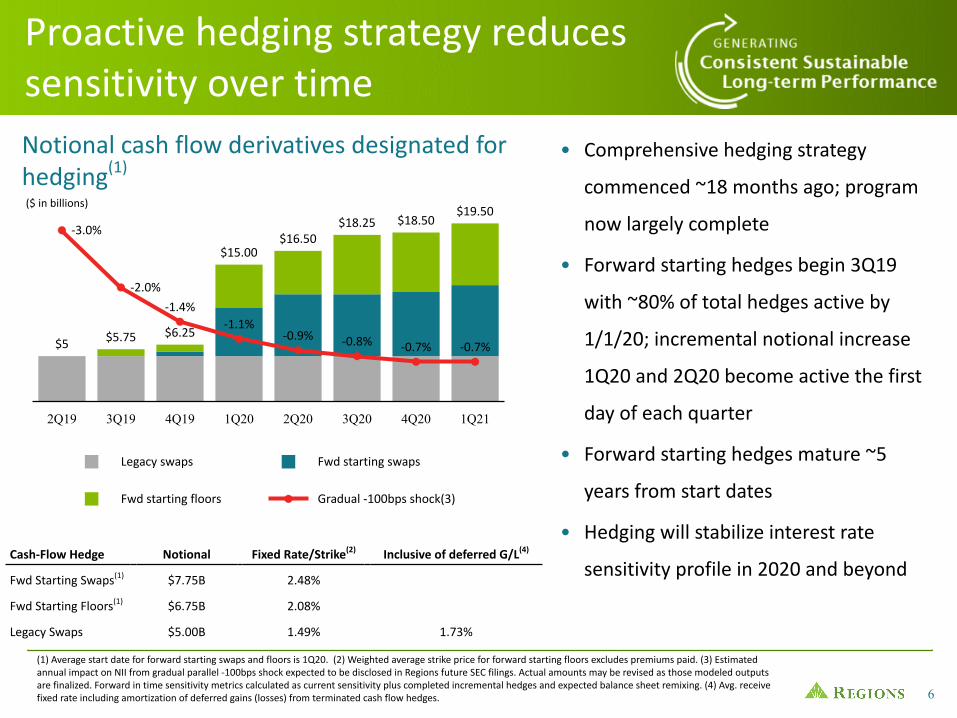
Notional cash flow derivatives designated forhedging(1)
Legacy swaps Fwd starting swaps
Fwd starting floors Gradual -100bps shock(3)
2Q19 3Q19 4Q19 1Q20 2Q20 3Q20 4Q20 1Q21
$5 $5.75 $6.25
$15.00$16.50
$18.25 $18.50$19.50
-3.0%
-2.0%
-1.4%-1.1%
-0.9% -0.8% -0.7% -0.7%
• Comprehensive hedging strategy
commenced ~18 months ago; program
now largely complete
• Forward starting hedges begin 3Q19
with ~80% of total hedges active by
1/1/20; incremental notional increase
1Q20 and 2Q20 become active the first
day of each quarter
• Forward starting hedges mature ~5
years from start dates
• Hedging will stabilize interest rate
sensitivity profile in 2020 and beyond
Proactive hedging strategy reducessensitivity over time
Cash-Flow Hedge Notional Fixed Rate/Strike(2) Inclusive of deferred G/L(4)
Fwd Starting Swaps(1) $7.75B 2.48%
Fwd Starting Floors(1) $6.75B 2.08%
Legacy Swaps $5.00B 1.49% 1.73%
($ in billions)
(1) Average start date for forward starting swaps and floors is 1Q20. (2) Weighted average strike price for forward starting floors excludes premiums paid. (3) Estimatedannual impact on NII from gradual parallel -100bps shock expected to be disclosed in Regions future SEC filings. Actual amounts may be revised as those modeled outputsare finalized. Forward in time sensitivity metrics calculated as current sensitivity plus completed incremental hedges and expected balance sheet remixing. (4) Avg. receivefixed rate including amortization of deferred gains (losses) from terminated cash flow hedges.
7
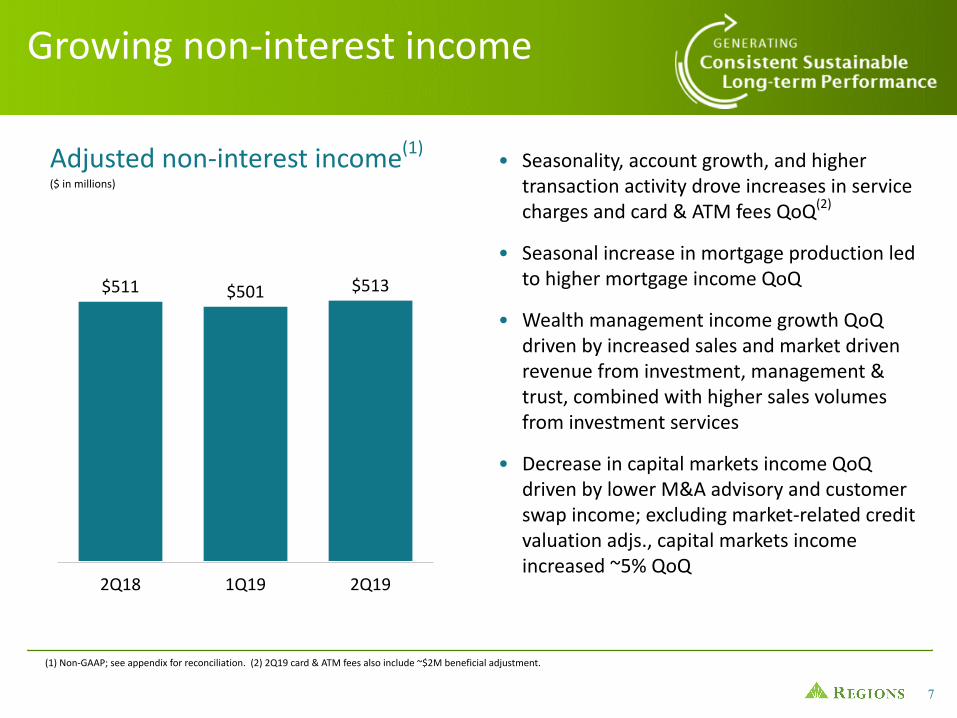
Adjusted non-interest income(1)
Growing non-interest income
($ in millions)
(1) Non-GAAP; see appendix for reconciliation. (2) 2Q19 card & ATM fees also include ~$2M beneficial adjustment.
• Seasonality, account growth, and highertransaction activity drove increases in servicecharges and card & ATM fees QoQ(2)
• Seasonal increase in mortgage production ledto higher mortgage income QoQ
• Wealth management income growth QoQdriven by increased sales and market drivenrevenue from investment, management &trust, combined with higher sales volumesfrom investment services
• Decrease in capital markets income QoQdriven by lower M&A advisory and customerswap income; excluding market-related creditvaluation adjs., capital markets incomeincreased ~5% QoQ
2Q18 1Q19 2Q19
$511 $501 $513
8
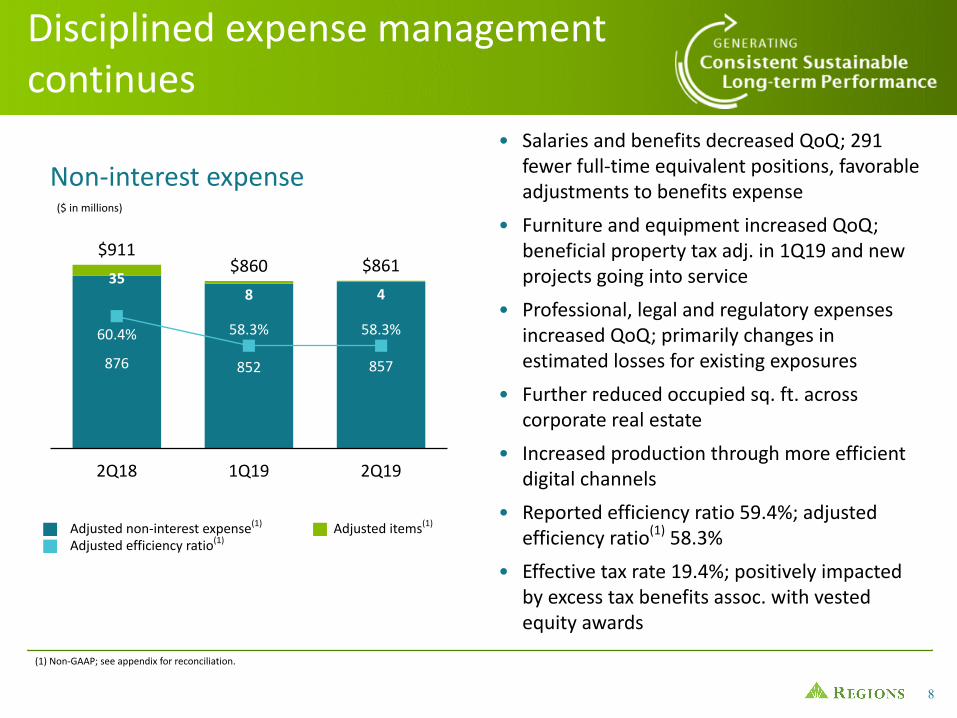
Non-interest expense
2Q18 1Q19 2Q19
60.4% 58.3% 58.3%
876 852 857
35
$911
8
$860
4
$861
Disciplined expense managementcontinues
(1) Non-GAAP; see appendix for reconciliation.
($ in millions)
Adjusted items(1)Adjusted non-interest expense(1)
Adjusted efficiency ratio(1)
• Salaries and benefits decreased QoQ; 291fewer full-time equivalent positions, favorableadjustments to benefits expense
• Furniture and equipment increased QoQ;beneficial property tax adj. in 1Q19 and newprojects going into service
• Professional, legal and regulatory expensesincreased QoQ; primarily changes inestimated losses for existing exposures
• Further reduced occupied sq. ft. acrosscorporate real estate
• Increased production through more efficientdigital channels
• Reported efficiency ratio 59.4%; adjustedefficiency ratio(1) 58.3%
• Effective tax rate 19.4%; positively impactedby excess tax benefits assoc. with vestedequity awards
9
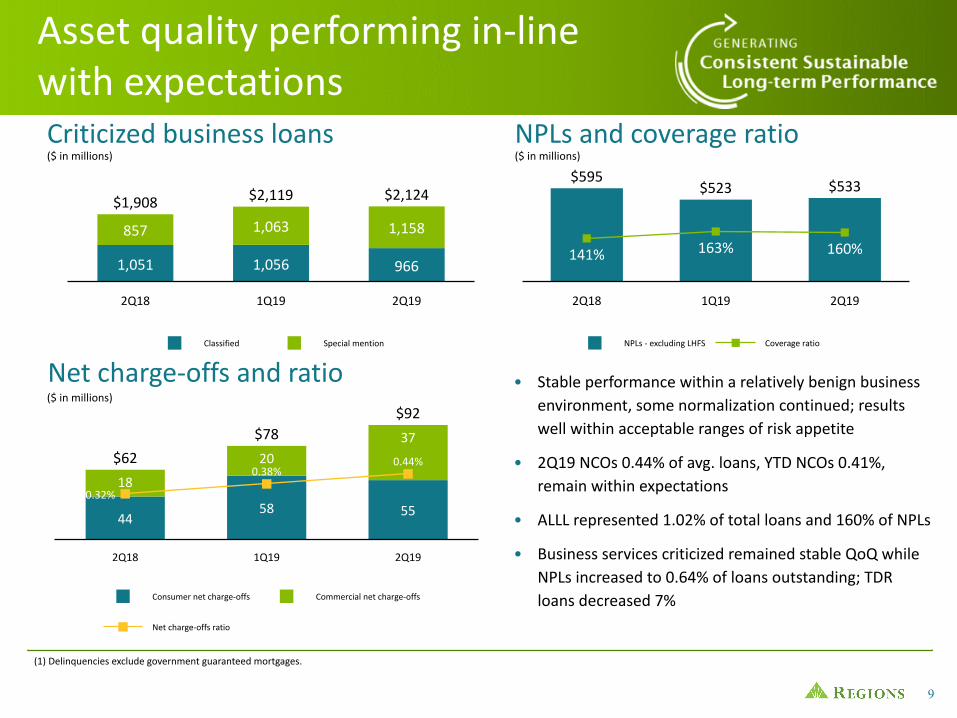
• Stable performance within a relatively benign businessenvironment, some normalization continued; resultswell within acceptable ranges of risk appetite
• 2Q19 NCOs 0.44% of avg. loans, YTD NCOs 0.41%,remain within expectations
• ALLL represented 1.02% of total loans and 160% of NPLs
• Business services criticized remained stable QoQ whileNPLs increased to 0.64% of loans outstanding; TDRloans decreased 7%
Classified Special mention
2Q18 1Q19 2Q19
1,051 1,056 966
857
$1,908
1,063
$2,119
1,158
$2,124
Consumer net charge-offs Commercial net charge-offs
Net charge-offs ratio
2Q18 1Q19 2Q19
4458 55
18
$62 20
$78 37
$92
0.32%
0.38%0.44%
NPLs - excluding LHFS Coverage ratio
2Q18 1Q19 2Q19
$595$523 $533
141% 163% 160%
NPLs and coverage ratio
Asset quality performing in-linewith expectations
($ in millions)
($ in millions) ($ in millions)Criticized business loans
Net charge-offs and ratio
53
(1) Delinquencies exclude government guaranteed mortgages.
10
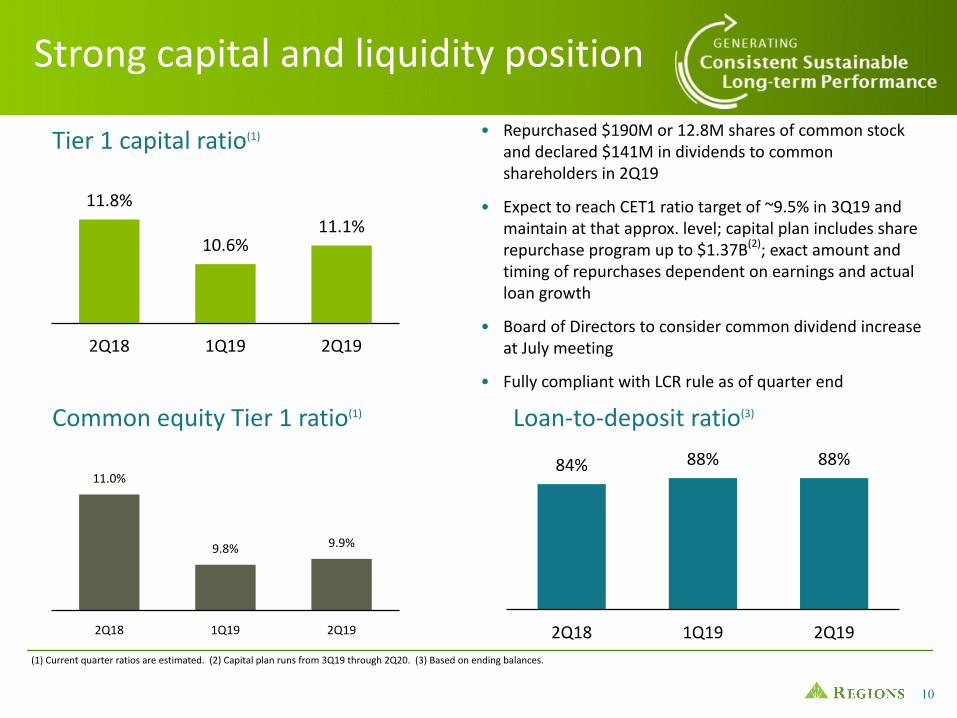
Common equity Tier 1 ratio(1)
2Q18 1Q19 2Q19
11.0%
9.8% 9.9%
2Q18 1Q19 2Q19
11.8%
10.6%11.1%
Tier 1 capital ratio(1)
Strong capital and liquidity position
• Repurchased $190M or 12.8M shares of common stockand declared $141M in dividends to commonshareholders in 2Q19
• Expect to reach CET1 ratio target of ~9.5% in 3Q19 andmaintain at that approx. level; capital plan includes sharerepurchase program up to $1.37B(2); exact amount andtiming of repurchases dependent on earnings and actualloan growth
• Board of Directors to consider common dividend increaseat July meeting
• Fully compliant with LCR rule as of quarter end
(1) Current quarter ratios are estimated. (2) Capital plan runs from 3Q19 through 2Q20. (3) Based on ending balances.
Loan-to-deposit ratio(3)
2Q18 1Q19 2Q19
84% 88% 88%
11
(1) Non-GAAP, see appendix for reconciliation. The reconciliation with respect to forward-looking non-GAAP measures is expected to be consistent with actualnon-GAAP reconciliations included in the attached appendix or previous filings with the SEC. (2) FY 2019 expectation was revised in 2Q19.
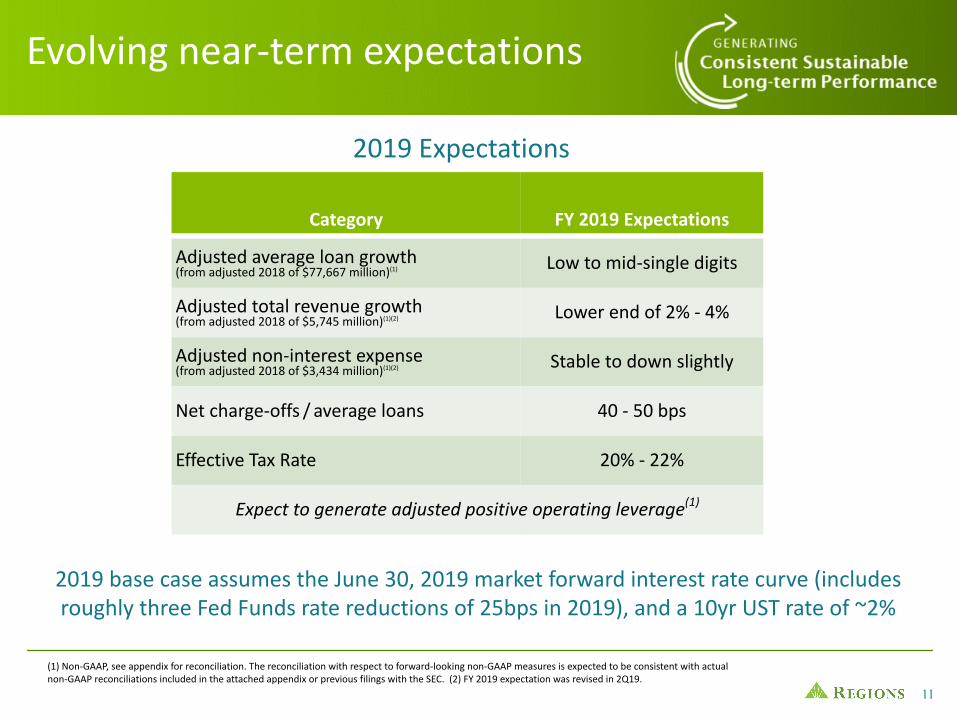
Evolving near-term expectations
Category FY 2019 Expectations
Adjusted average loan growth(from adjusted 2018 of $77,667 million)(1) Low to mid-single digits
Adjusted total revenue growth(from adjusted 2018 of $5,745 million)(1)(2) Lower end of 2% - 4%
Adjusted non-interest expense(from adjusted 2018 of $3,434 million)(1)(2) Stable to down slightly
Net charge-offs / average loans 40 - 50 bps
Effective Tax Rate 20% - 22%
Expect to generate adjusted positive operating leverage(1)
2019 Expectations
2019 base case assumes the June 30, 2019 market forward interest rate curve (includesroughly three Fed Funds rate reductions of 25bps in 2019), and a 10yr UST rate of ~2%

12
Appendix
13
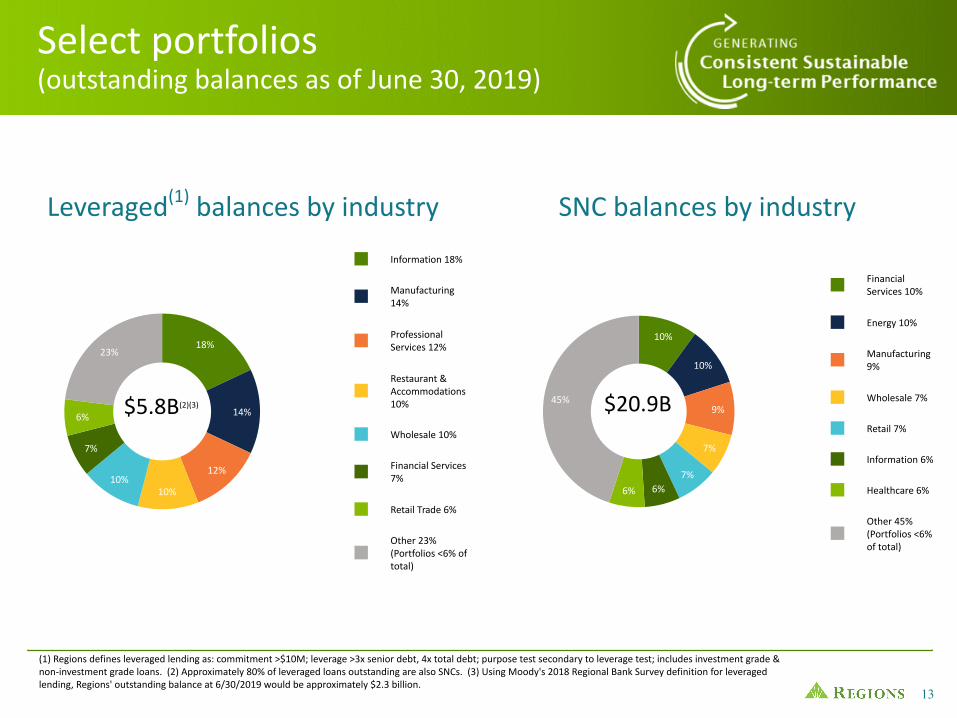
Information 18%
Manufacturing14%
ProfessionalServices 12%
Restaurant &Accommodations10%
Wholesale 10%
Financial Services7%
Retail Trade 6%
Other 23%(Portfolios <6% oftotal)
18%
14%
12%
10%10%
7%
6%
23%
FinancialServices 10%
Energy 10%
Manufacturing9%
Wholesale 7%
Retail 7%
Information 6%
Healthcare 6%
Other 45%(Portfolios <6%of total)
10%
10%
9%
7%
7%6%6%
45% $20.9B$5.8B(2)(3)
SNC balances by industryLeveraged(1) balances by industry
Select portfolios(outstanding balances as of June 30, 2019)
(1) Regions defines leveraged lending as: commitment >$10M; leverage >3x senior debt, 4x total debt; purpose test secondary to leverage test; includes investment grade &non-investment grade loans. (2) Approximately 80% of leveraged loans outstanding are also SNCs. (3) Using Moody's 2018 Regional Bank Survey definition for leveragedlending, Regions' outstanding balance at 6/30/2019 would be approximately $2.3 billion.
14
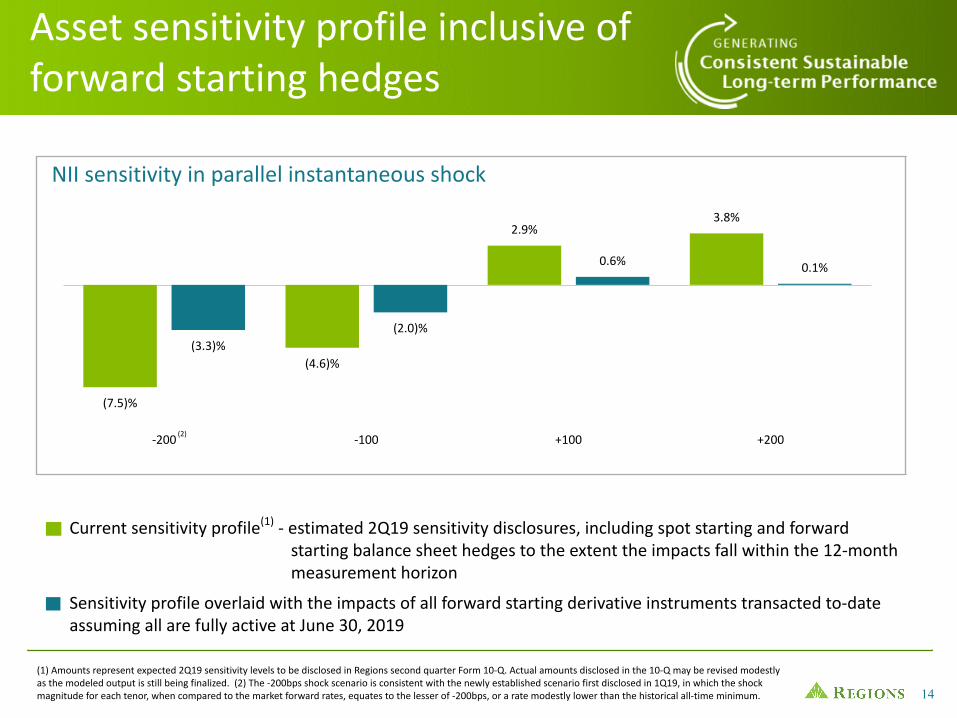
-200 -100 +100 +200
(7.5)%
(4.6)%
2.9%3.8%
(3.3)%(2.0)%
0.6% 0.1%
NII sensitivity in parallel instantaneous shock
Asset sensitivity profile inclusive offorward starting hedges
(1) Amounts represent expected 2Q19 sensitivity levels to be disclosed in Regions second quarter Form 10-Q. Actual amounts disclosed in the 10-Q may be revised modestlyas the modeled output is still being finalized. (2) The -200bps shock scenario is consistent with the newly established scenario first disclosed in 1Q19, in which the shockmagnitude for each tenor, when compared to the market forward rates, equates to the lesser of -200bps, or a rate modestly lower than the historical all-time minimum.
Current sensitivity profile(1) - estimated 2Q19 sensitivity disclosures, including spot starting and forwardstarting balance sheet hedges to the extent the impacts fall within the 12-monthmeasurement horizon
Sensitivity profile overlaid with the impacts of all forward starting derivative instruments transacted to-dateassuming all are fully active at June 30, 2019
(2)
15
This document contains non-GAAP financial measures, which exclude certain items management does not consider indicative of theCompany’s on-going financial performance. Management believes that the exclusion of these items provides a meaningful base for period-to-period comparisons, which management believes will assist investors in analyzing the operating results of the Company and predictingfuture performance. These non-GAAP financial measures are also used by management to assess the performance of Regions’ business. It ispossible that the activities related to these adjustments may recur; however, management does not consider these activities to beindications of ongoing operations. Management believes that presentation of these non-GAAP financial measures will permit investors toassess the performance of the Company on the same basis as that applied by management.
Other companies may use similarly titled non-GAAP financial measures that are calculated differently from the way we calculate suchmeasures. Accordingly, our non-GAAP financial measures may not be comparable to similar measures used by other companies. We cautioninvestors not to place undue reliance on such non-GAAP financial measures, but to consider them with the most directly comparable GAAPmeasures. Non-GAAP financial measures have limitations as analytical tools and should not be considered in isolation or as a substitute forour results reported under GAAP.
The following tables present reconciliations of Regions' non-GAAP measures to the most directly comparable GAAP financial measures.
Non-GAAP information
16
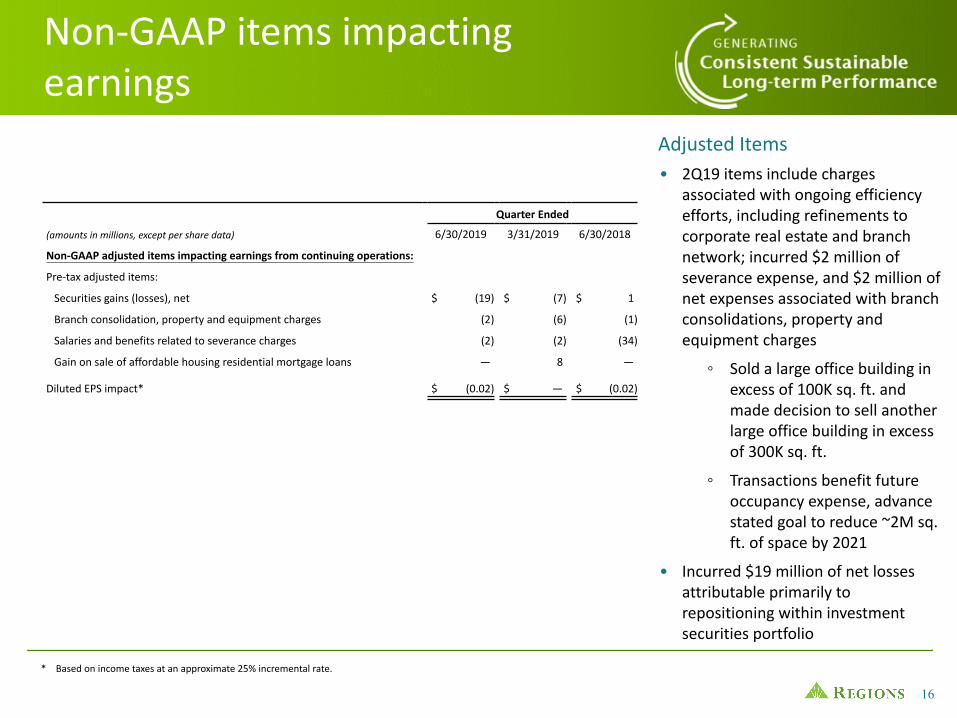
Non-GAAP items impactingearnings
Adjusted Items• 2Q19 items include charges
associated with ongoing efficiencyefforts, including refinements tocorporate real estate and branchnetwork; incurred $2 million ofseverance expense, and $2 million ofnet expenses associated with branchconsolidations, property andequipment charges
◦ Sold a large office building inexcess of 100K sq. ft. andmade decision to sell anotherlarge office building in excessof 300K sq. ft.
◦ Transactions benefit futureoccupancy expense, advancestated goal to reduce ~2M sq.ft. of space by 2021
• Incurred $19 million of net lossesattributable primarily torepositioning within investmentsecurities portfolio
* Based on income taxes at an approximate 25% incremental rate.
Quarter Ended
(amounts in millions, except per share data) 6/30/2019 3/31/2019 6/30/2018
Non-GAAP adjusted items impacting earnings from continuing operations:
Pre-tax adjusted items:
Securities gains (losses), net $ (19) $ (7) $ 1
Branch consolidation, property and equipment charges (2) (6) (1)
Salaries and benefits related to severance charges (2) (2) (34)
Gain on sale of affordable housing residential mortgage loans — 8 —
Diluted EPS impact* $ (0.02) $ — $ (0.02)
17
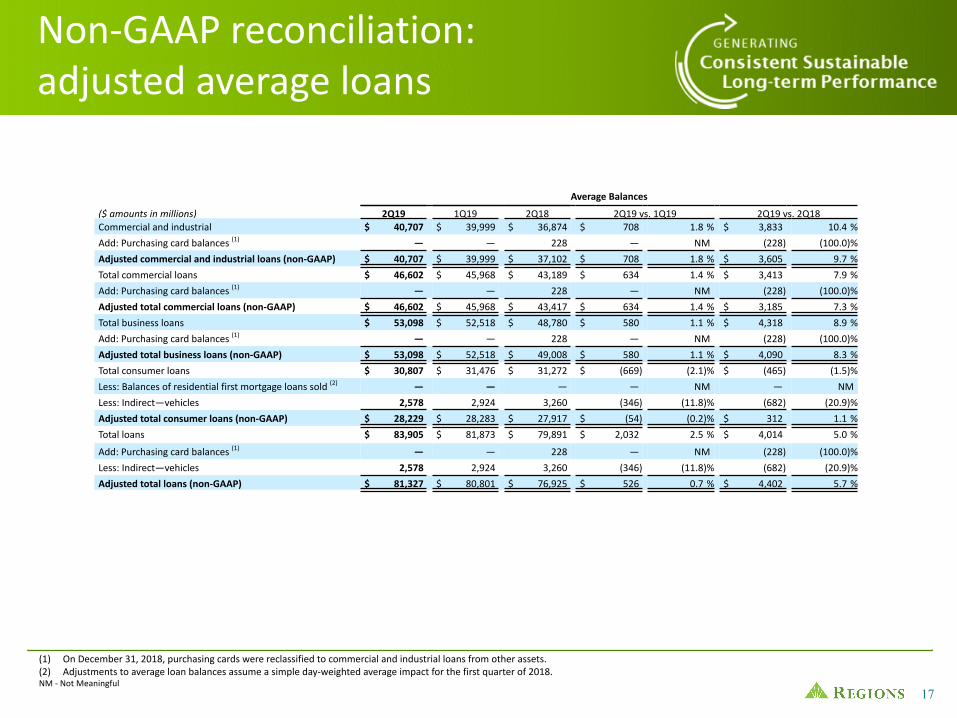
Non-GAAP reconciliation:adjusted average loans
(1) On December 31, 2018, purchasing cards were reclassified to commercial and industrial loans from other assets. (2) Adjustments to average loan balances assume a simple day-weighted average impact for the first quarter of 2018. NM - Not Meaningful
Average Balances
($ amounts in millions) 2Q19 1Q19 2Q18 2Q19 vs. 1Q19 2Q19 vs. 2Q18Commercial and industrial $ 40,707 $ 39,999 $ 36,874 $ 708 1.8 % $ 3,833 10.4 %
Add: Purchasing card balances (1) — — 228 — NM (228) (100.0)%
Adjusted commercial and industrial loans (non-GAAP) $ 40,707 $ 39,999 $ 37,102 $ 708 1.8 % $ 3,605 9.7 %
Total commercial loans $ 46,602 $ 45,968 $ 43,189 $ 634 1.4 % $ 3,413 7.9 %
Add: Purchasing card balances (1) — — 228 — NM (228) (100.0)%
Adjusted total commercial loans (non-GAAP) $ 46,602 $ 45,968 $ 43,417 $ 634 1.4 % $ 3,185 7.3 %
Total business loans $ 53,098 $ 52,518 $ 48,780 $ 580 1.1 % $ 4,318 8.9 %
Add: Purchasing card balances (1) — — 228 — NM (228) (100.0)%
Adjusted total business loans (non-GAAP) $ 53,098 $ 52,518 $ 49,008 $ 580 1.1 % $ 4,090 8.3 %
Total consumer loans $ 30,807 $ 31,476 $ 31,272 $ (669) (2.1)% $ (465) (1.5)%
Less: Balances of residential first mortgage loans sold (2) — — — — NM — NM
Less: Indirect—vehicles 2,578 2,924 3,260 (346) (11.8)% (682) (20.9)%
Adjusted total consumer loans (non-GAAP) $ 28,229 $ 28,283 $ 27,917 $ (54) (0.2)% $ 312 1.1 %
Total loans $ 83,905 $ 81,873 $ 79,891 $ 2,032 2.5 % $ 4,014 5.0 %
Add: Purchasing card balances (1) — — 228 — NM (228) (100.0)%
Less: Indirect—vehicles 2,578 2,924 3,260 (346) (11.8)% (682) (20.9)%
Adjusted total loans (non-GAAP) $ 81,327 $ 80,801 $ 76,925 $ 526 0.7 % $ 4,402 5.7 %
18
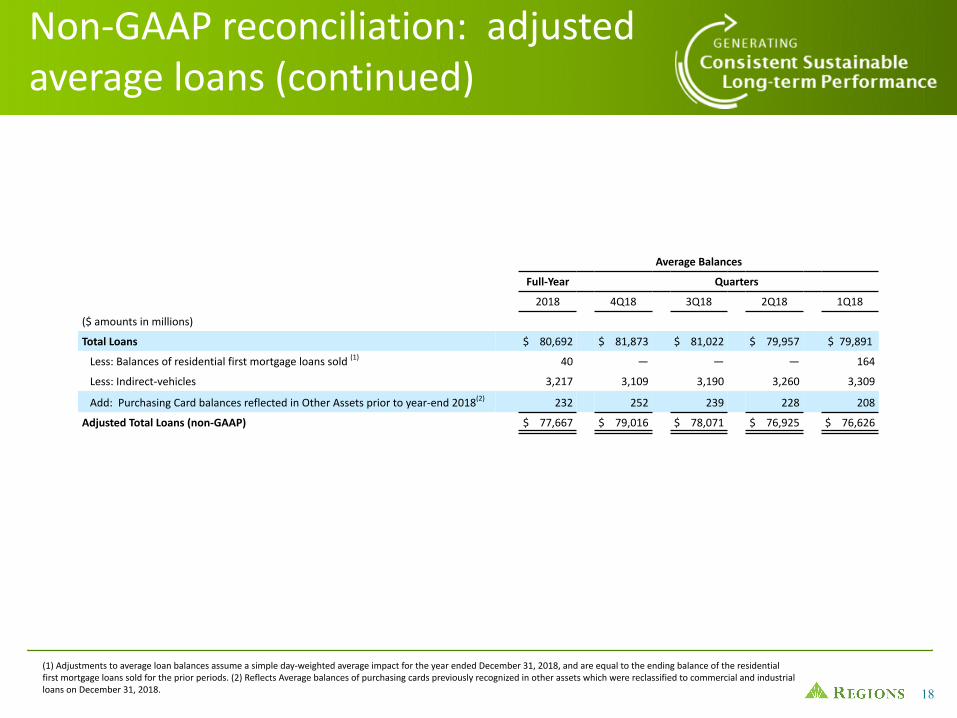
Non-GAAP reconciliation: adjustedaverage loans (continued)
Average Balances
Full-Year Quarters
2018 4Q18 3Q18 2Q18 1Q18
($ amounts in millions)
Total Loans $ 80,692 $ 81,873 $ 81,022 $ 79,957 $ 79,891
Less: Balances of residential first mortgage loans sold (1) 40 — — — 164
Less: Indirect-vehicles 3,217 3,109 3,190 3,260 3,309
Add: Purchasing Card balances reflected in Other Assets prior to year-end 2018(2) 232 252 239 228 208
Adjusted Total Loans (non-GAAP) $ 77,667 $ 79,016 $ 78,071 $ 76,925 $ 76,626
(1) Adjustments to average loan balances assume a simple day-weighted average impact for the year ended December 31, 2018, and are equal to the ending balance of the residentialfirst mortgage loans sold for the prior periods. (2) Reflects Average balances of purchasing cards previously recognized in other assets which were reclassified to commercial and industrialloans on December 31, 2018.
19
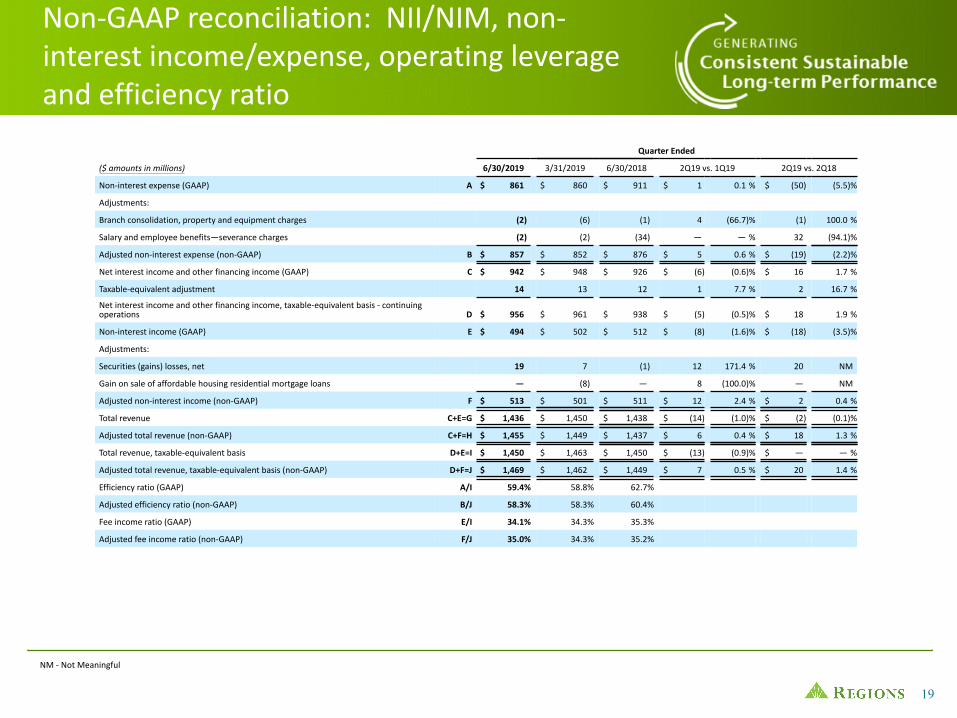
Non-GAAP reconciliation: NII/NIM, non-interest income/expense, operating leverageand efficiency ratio
NM - Not Meaningful
Quarter Ended
($ amounts in millions) 6/30/2019 3/31/2019 6/30/2018 2Q19 vs. 1Q19 2Q19 vs. 2Q18
Non-interest expense (GAAP) A $ 861 $ 860 $ 911 $ 1 0.1 % $ (50) (5.5)%
Adjustments:
Branch consolidation, property and equipment charges (2) (6) (1) 4 (66.7)% (1) 100.0 %
Salary and employee benefits—severance charges (2) (2) (34) — — % 32 (94.1)%
Adjusted non-interest expense (non-GAAP) B $ 857 $ 852 $ 876 $ 5 0.6 % $ (19) (2.2)%
Net interest income and other financing income (GAAP) C $ 942 $ 948 $ 926 $ (6) (0.6)% $ 16 1.7 %
Taxable-equivalent adjustment 14 13 12 1 7.7 % 2 16.7 %
Net interest income and other financing income, taxable-equivalent basis - continuingoperations D $ 956 $ 961 $ 938 $ (5) (0.5)% $ 18 1.9 %
Non-interest income (GAAP) E $ 494 $ 502 $ 512 $ (8) (1.6)% $ (18) (3.5)%
Adjustments:
Securities (gains) losses, net 19 7 (1) 12 171.4 % 20 NM
Gain on sale of affordable housing residential mortgage loans — (8) — 8 (100.0)% — NM
Adjusted non-interest income (non-GAAP) F $ 513 $ 501 $ 511 $ 12 2.4 % $ 2 0.4 %
Total revenue C+E=G $ 1,436 $ 1,450 $ 1,438 $ (14) (1.0)% $ (2) (0.1)%
Adjusted total revenue (non-GAAP) C+F=H $ 1,455 $ 1,449 $ 1,437 $ 6 0.4 % $ 18 1.3 %
Total revenue, taxable-equivalent basis D+E=I $ 1,450 $ 1,463 $ 1,450 $ (13) (0.9)% $ — — %
Adjusted total revenue, taxable-equivalent basis (non-GAAP) D+F=J $ 1,469 $ 1,462 $ 1,449 $ 7 0.5 % $ 20 1.4 %
Efficiency ratio (GAAP) A/I 59.4% 58.8% 62.7%
Adjusted efficiency ratio (non-GAAP) B/J 58.3% 58.3% 60.4%
Fee income ratio (GAAP) E/I 34.1% 34.3% 35.3%
Adjusted fee income ratio (non-GAAP) F/J 35.0% 34.3% 35.2%

20
Non-GAAP reconciliation: NII/NIM, non-interest income/expense, operating leverageand efficiency ratio (continued)
Six Months Ended June 30
($ amounts in millions) 2019 2018 2019 vs. 2018
Non-interest expense (GAAP) K $ 1,721 $ 1,795 $ (74) (4.1)%
Adjustments:
Branch consolidation, property and equipment charges (8) (4) (4) 100.0 %
Expenses associated with residential mortgage loan sale — (4) 4 (100.0)%
Salary and employee benefits—severance charges (4) (49) 45 (91.8)%
Adjusted non-interest expense (non-GAAP) L $ 1,709 $ 1,738 $ (29) (1.7)%
Net interest income and other financing income (GAAP) M $ 1,890 $ 1,835 $ 55 3.0 %
Taxable-equivalent adjustment 27 25 2 8.0 %
Net interest income and other financing income, taxable-equivalent basis - continuing operations N $ 1,917 $ 1,860 $ 57 3.1 %
Non-interest income (GAAP) O $ 996 $ 1,019 $ (23) (2.3)%
Adjustments:
Securities (gains) losses, net 26 (1) 27 NM
Leveraged lease termination gains — (4) 4 (100.0)%
Gain on sale of affordable housing residential mortgage loans (8) — (8) NM
Adjusted non-interest income (non-GAAP) P $ 1,014 $ 1,014 $ — — %
Total revenue M+O=Q $ 2,886 $ 2,854 $ 32 1.1 %
Adjusted total revenue (non-GAAP) M+P=R $ 2,904 $ 2,849 $ 55 1.9 %
Total revenue, taxable-equivalent basis N+O=S $ 2,913 $ 2,879 $ 34 1.2 %
Adjusted total revenue, taxable-equivalent basis (non-GAAP) N+P=T $ 2,931 $ 2,874 $ 57 2.0 %
Operating leverage ratio (GAAP) S-K 5.3 %
Adjusted operating leverage ratio (non-GAAP) T-L 3.7 %
Efficiency ratio (GAAP) K/S 59.1% 62.3%
Adjusted efficiency ratio (non-GAAP) L/T 58.3% 60.5%
Fee income ratio (GAAP) O/S 34.2% 35.4%
Adjusted fee income ratio (non-GAAP) P/T 34.6% 35.3%
NM - Not Meaningful

21
Quarter Ended
($ amounts in millions) 6/30/2019 3/31/2019 6/30/2018 2Q19 vs. 1Q19 2Q19 vs. 2Q18
Net income from continuing operations available to common shareholders (GAAP) $ 374 $ 378 $ 362 $ (4) (1.1)% $ 12 3.3 %
Preferred dividends (GAAP) 16 16 16 — — % — — %
Income tax expense (GAAP) 93 105 89 (12) (11.4)% 4 4.5 %
Income from continuing operations before income taxes (GAAP) 483 499 467 (16) (3.2)% 16 3.4 %
Provision for loan losses (GAAP) 92 91 60 1 1.1 % 32 53.3 %
Pre-tax pre-provision income from continuing operations (non-GAAP) 575 590 527 (15) (2.5)% 48 9.1 %
Other adjustments:
Gain on sale of affordable housing residential mortgage loans — (8) — 8 (100.0)% — NM
Securities (gains) losses, net 19 7 (1) 12 171.4 % 20 NM
Salaries and employee benefits—severance charges 2 2 34 — — % (32) (94.1)%
Branch consolidation, property and equipment charges 2 6 1 (4) (66.7)% 1 100.0 %
Total other adjustments 23 7 34 16 228.6 % (11) (32.4)%
Adjusted pre-tax pre-provision income from continuing operations (non-GAAP) $ 598 $ 597 $ 561 $ 1 0.2 % $ 37 6.6 %
Non-GAAP reconciliation: Pre-taxpre-provision income (PPI)
NM - Not Meaningful
22
Forward-looking statements
Forward-Looking Statements
This release may include forward-looking statements as defined in the Private Securities Litigation Reform Act of 1995. Forward-looking statements are not based on historical information, but rather are related to future operations, strategies, financial results or otherdevelopments. Forward-looking statements are based on management’s current expectations as well as certain assumptions and estimates made by, and information available to, management at the time the statements are made. Those statements are based on generalassumptions and are subject to various risks, and because they also relate to the future they are likewise subject to inherent uncertainties and other factors that may cause actual results to differ materially from the views, beliefs and projections expressed in such statements.Therefore, we caution you against relying on any of these forward-looking statements. These risks, uncertainties and other factors include, but are not limited to, those described below:
• Current and future economic and market conditions in the United States generally or in the communities we serve, including the effects of possible declines in property values, increases in unemployment rates and potential reductions of economic growth, whichmay adversely affect our lending and other businesses and our financial results and conditions.
• Possible changes in trade, monetary and fiscal policies of, and other activities undertaken by, governments, agencies, central banks and similar organizations, which could have a material adverse effect on our earnings.
• Possible changes in market interest rates or capital markets could adversely affect our revenue and expense, the value of assets and obligations, and the availability and cost of capital and liquidity.
• Any impairment of our goodwill or other intangibles, any repricing of assets, or any adjustment of valuation allowances on our deferred tax assets due to changes in law, adverse changes in the economic environment, declining operations of the reporting unit orother factors.
• The effect of changes in tax laws, including the effect of any future interpretations of or amendments to Tax Reform, which may impact our earnings, capital ratios and our ability to return capital to stockholders.
• Possible changes in the creditworthiness of customers and the possible impairment of the collectability of loans and leases, including operating leases.
• Changes in the speed of loan prepayments, loan origination and sale volumes, charge-offs, loan loss provisions or actual loan losses where our allowance for loan losses may not be adequate to cover our eventual losses.
• Possible acceleration of prepayments on mortgage-backed securities due to low interest rates, and the related acceleration of premium amortization on those securities.
• Loss of customer checking and savings account deposits as customers pursue other, higher-yield investments, which could increase our funding costs.
• Possible changes in consumer and business spending and saving habits and the related effect on our ability to increase assets and to attract deposits, which could adversely affect our net income.
• Our ability to effectively compete with other traditional and non-traditional financial services companies, some of whom possess greater financial resources than we do or are subject to different regulatory standards than we are.
• Our inability to develop and gain acceptance from current and prospective customers for new products and services and the enhancement of existing products and services to meet customers’ needs and respond to emerging technological trends in a timelymanner could have a negative impact on our revenue.
• Our inability to keep pace with technological changes could result in losing business to competitors.
• Changes in laws and regulations affecting our businesses, including legislation and regulations relating to bank products and services, as well as changes in the enforcement and interpretation of such laws and regulations by applicable governmental and self-regulatory agencies, which could require us to change certain business practices, increase compliance risk, reduce our revenue, impose additional costs on us, or otherwise negatively affect our businesses.
• Our ability to obtain a regulatory non-objection (as part of the CCAR process or otherwise) to take certain capital actions, including paying dividends and any plans to increase common stock dividends, repurchase common stock under current or future programs,or redeem preferred stock or other regulatory capital instruments, may impact our ability to return capital to stockholders and market perceptions of us.
• Our ability to comply with stress testing and capital planning requirements (as part of the CCAR process or otherwise) may continue to require a significant investment of our managerial resources due to the importance and intensity of such tests and requirements.
• Our ability to comply with applicable capital and liquidity requirements (including, among other things, the Basel III capital standards and the LCR rule), including our ability to generate capital internally or raise capital on favorable terms, and if we fail to meetrequirements, our financial condition could be negatively impacted.
• The effects of any developments, changes or actions relating to any litigation or regulatory proceedings brought against us or any of our subsidiaries.
• The costs, including possibly incurring fines, penalties, or other negative effects (including reputational harm) of any adverse judicial, administrative, or arbitral rulings or proceedings, regulatory enforcement actions, or other legal actions to which we or any ofour subsidiaries are a party, and which may adversely affect our results.
• Our ability to manage fluctuations in the value of assets and liabilities and off-balance sheet exposure so as to maintain sufficient capital and liquidity to support our business.
• Our ability to execute on our strategic and operational plans, including our ability to fully realize the financial and non-financial benefits relating to our strategic initiatives.
• The risks and uncertainties related to our acquisition or divestiture of businesses.
23
• The success of our marketing efforts in attracting and retaining customers.
• Our ability to recruit and retain talented and experienced personnel to assist in the development, management and operation of our products and services may be affected by changes in laws and regulations in effect from time to time.
• Fraud or misconduct by our customers, employees or business partners.
• Any inaccurate or incomplete information provided to us by our customers or counterparties.
• Inability of our framework to manage risks associated with our business such as credit risk and operational risk, including third-party vendors and other service providers, which could, among other things, result in a breach of operating or security systems as a resultof a cyber attack or similar act or failure to deliver our services effectively.
• Dependence on key suppliers or vendors to obtain equipment and other supplies for our business on acceptable terms.
• The inability of our internal controls and procedures to prevent, detect or mitigate any material errors or fraudulent acts.
• The effects of geopolitical instability, including wars, conflicts and terrorist attacks and the potential impact, directly or indirectly, on our businesses.
• The effects of man-made and natural disasters, including fires, floods, droughts, tornadoes, hurricanes, and environmental damage, which may negatively affect our operations and/or our loan portfolios and increase our cost of conducting business. The severity andimpact of future earthquakes, fires, hurricanes, tornadoes, droughts, floods and other weather-related events are difficult to predict and may be exacerbated by global climate change.
• Changes in commodity market prices and conditions could adversely affect the cash flows of our borrowers operating in industries that are impacted by changes in commodity prices (including businesses indirectly impacted by commodities prices such as businessesthat transport commodities or manufacture equipment used in the production of commodities), which could impair their ability to service any loans outstanding to them and/or reduce demand for loans in those industries.
• Our ability to identify and address cyber-security risks such as data security breaches, malware, “denial of service” attacks, “hacking” and identity theft, including account take-overs, a failure of which could disrupt our business and result in the disclosure of and/ormisuse or misappropriation of confidential or proprietary information, disruption or damage to our systems, increased costs, losses, or adverse effects to our reputation.
• Our ability to realize our adjusted efficiency ratio target as part of our expense management initiatives.
• Possible cessation or market replacement of LIBOR and the related effect on our LIBOR-based financial products and contracts, including, but not limited to, hedging products, debt obligations, investments, and loans.
• Possible downgrades in our credit ratings or outlook could increase the costs of funding from capital markets.
• The effects of a possible downgrade in the U.S. government’s sovereign credit rating or outlook, which could result in risks to us and general economic conditions that we are not able to predict.
• The effects of problems encountered by other financial institutions that adversely affect us or the banking industry generally could require us to change certain business practices, reduce our revenue, impose additional costs on us, or otherwise negatively affect ourbusinesses.
• The effects of the failure of any component of our business infrastructure provided by a third party could disrupt our businesses, result in the disclosure of and/or misuse of confidential information or proprietary information, increase our costs, negatively affect ourreputation, and cause losses.
• Our ability to receive dividends from our subsidiaries could affect our liquidity and ability to pay dividends to shareholders.
• Changes in accounting policies or procedures as may be required by the FASB or other regulatory agencies could materially affect our financial statements and how we report those results, and expectations and preliminary analyses relating to how such changes willaffect our financial results could prove incorrect.
• Other risks identified from time to time in reports that we file with the SEC.
• Fluctuations in the price of our common stock and inability to complete stock repurchases in the time frame and/or on the terms anticipated.
• The effects of any damage to our reputation resulting from developments related to any of the items identified above.
The foregoing list of factors is not exhaustive. For discussion of these and other factors that may cause actual results to differ from expectations, look under the captions “Forward-Looking Statements” and “Risk Factors” of Regions’ Annual Report on Form 10-K for the yearended December 31, 2018 as filed with the SEC.
The words "future," “anticipates,” "assumes," “intends,” “plans,” “seeks,” “believes,” "predicts," "potential," "objectives," “estimates,” “expects,” “targets,” “projects,” “outlook,” “forecast,” "would," “will,” “may,” “might,” “could,” “should,” “can,” and similar terms andexpressions often signify forward-looking statements. You should not place undue reliance on any forward-looking statements, which speak only as of the date made. Factors or events that could cause our actual results to differ may emerge from time to time, and it is not possibleto predict all of them. We assume no obligation and do not intend to update or revise any forward-looking statements that are made from time to time, either as a result of future developments, new information or otherwise, except as may be required by law.
Regions’ Investor Relations contact is Dana Nolan at (205) 264-7040; Regions’ Media contact is Evelyn Mitchell at (205) 264-4551.
Forward-looking statements(continued)

24
®


![en-japan inc. 2nd Quarter FY March 2016 Earnings ... · 2nd Quarter FY March 2016 Earnings Announcement [Japan GAAP] (Consolidated) November 11, 2015 ... Scheduled date for submission](https://img.pdfslide.net/doc/110x75/5f0a5f5a7e708231d42b5168/en-japan-inc-2nd-quarter-fy-march-2016-earnings-2nd-quarter-fy-march-2016-earnings.jpg)