Embed Size (px)
Citation preview
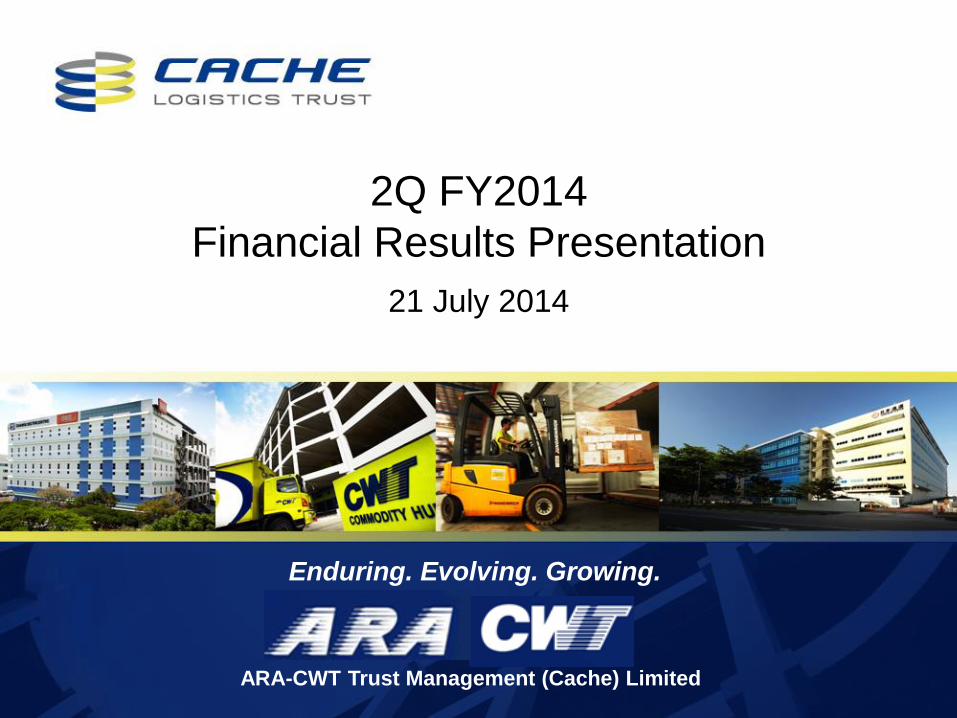
Enduring. Evolving. Growing.
ARA-CWT Trust Management (Cache) Limited
2Q FY2014
Financial Results Presentation
21 July 2014
Overview
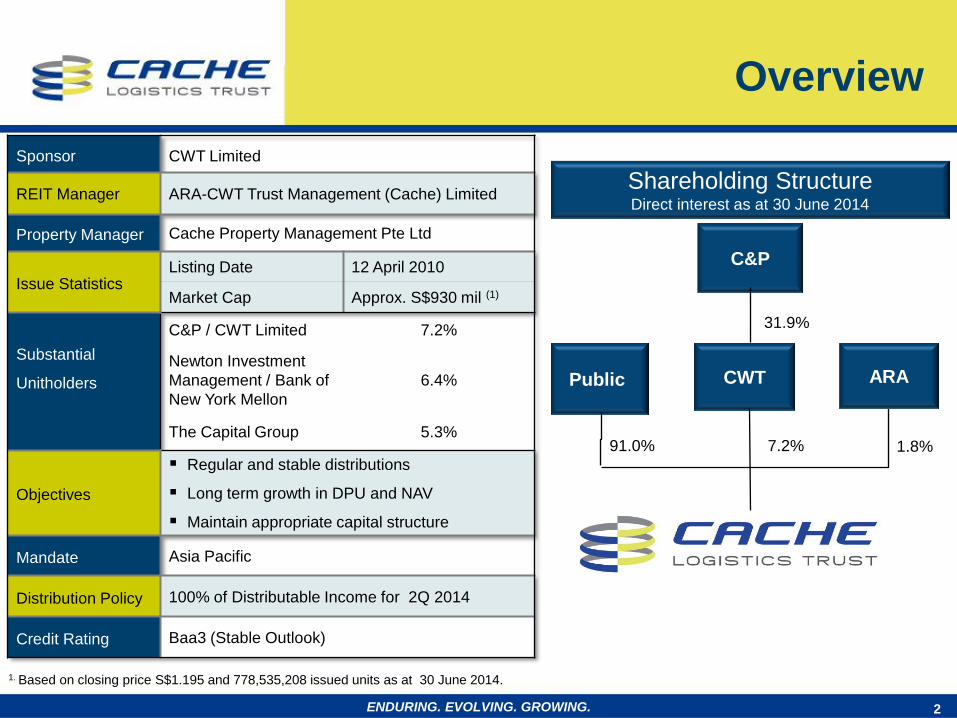
Sponsor CWT Limited
REIT Manager ARA-CWT Trust Management (Cache) Limited
Property Manager Cache Property Management Pte Ltd
Issue Statistics Listing Date 12 April 2010
Market Cap Approx. S$930 mil (1)
Substantial
Unitholders
C&P / CWT Limited 7.2%
Newton Investment
Management / Bank of
New York Mellon
6.4%
The Capital Group 5.3%
Objectives
Regular and stable distributions
Long term growth in DPU and NAV
Maintain appropriate capital structure
Mandate Asia Pacific
Distribution Policy 100% of Distributable Income for 2Q 2014
Credit Rating Baa3 (Stable Outlook)
1. Based on closing price S$1.195 and 778,535,208 issued units as at 30 June 2014.
2
91.0% 7.2% 1.8%
31.9%
C&P
Public CWT ARA
Shareholding Structure Direct interest as at 30 June 2014
ENDURING. EVOLVING. GROWING.
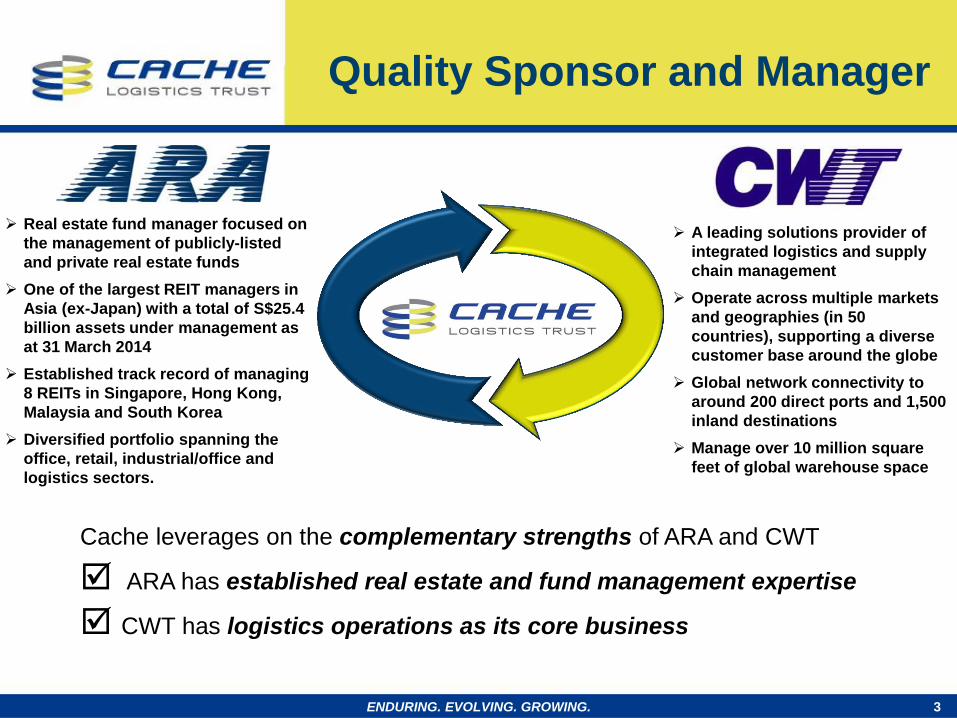
Cache leverages on the complementary strengths of ARA and CWT
ARA has established real estate and fund management expertise
CWT has logistics operations as its core business
Real estate fund manager focused on
the management of publicly-listed
and private real estate funds
One of the largest REIT managers in
Asia (ex-Japan) with a total of S$25.4
billion assets under management as
at 31 March 2014
Established track record of managing
8 REITs in Singapore, Hong Kong,
Malaysia and South Korea
Diversified portfolio spanning the
office, retail, industrial/office and
logistics sectors.
Quality Sponsor and Manager
A leading solutions provider of
integrated logistics and supply
chain management
Operate across multiple markets
and geographies (in 50
countries), supporting a diverse
customer base around the globe
Global network connectivity to
around 200 direct ports and 1,500
inland destinations
Manage over 10 million square
feet of global warehouse space
3 ENDURING. EVOLVING. GROWING.
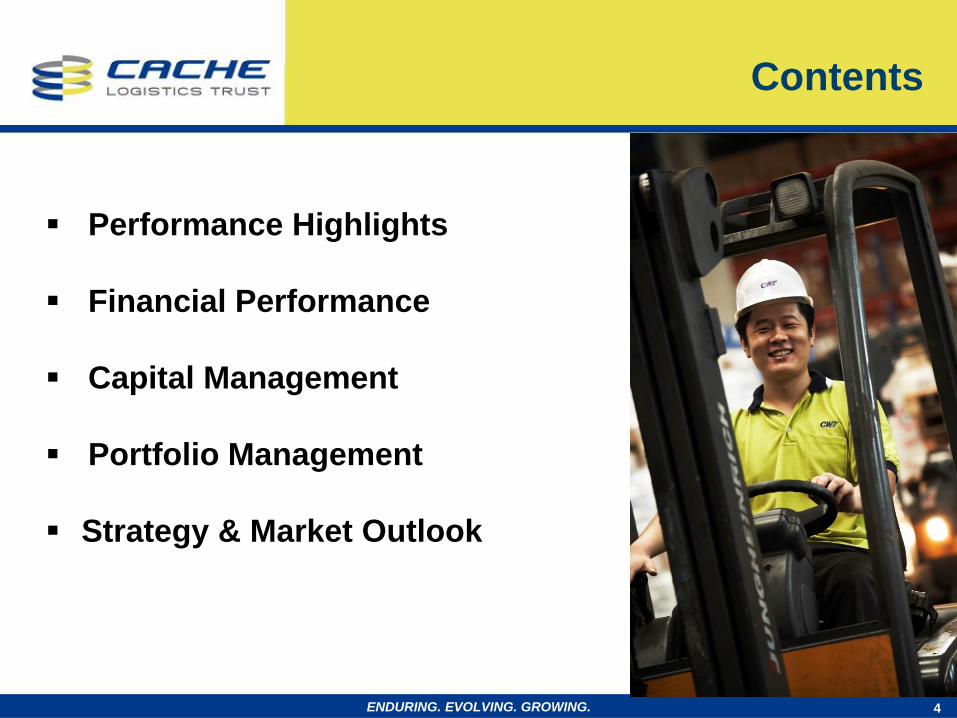
Performance Highlights
Financial Performance
Capital Management
Portfolio Management
Strategy & Market Outlook
4
Contents
ENDURING. EVOLVING. GROWING.
5 ENDURING. EVOLVING. GROWING.
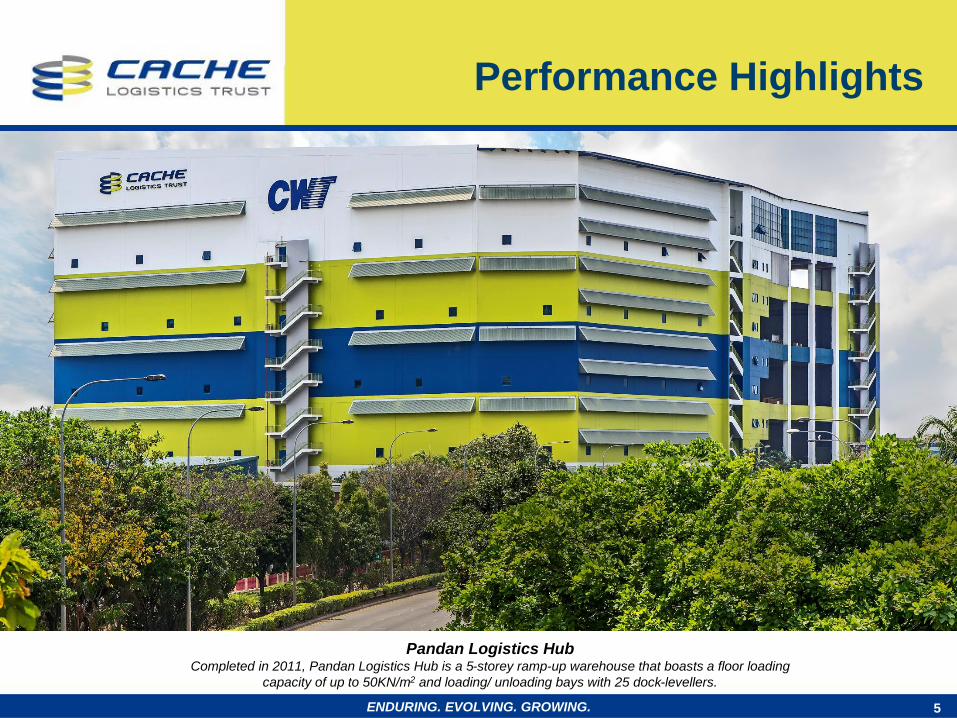
Performance Highlights
Pandan Logistics Hub Completed in 2011, Pandan Logistics Hub is a 5-storey ramp-up warehouse that boasts a floor loading
capacity of up to 50KN/m2 and loading/ unloading bays with 25 dock-levellers.
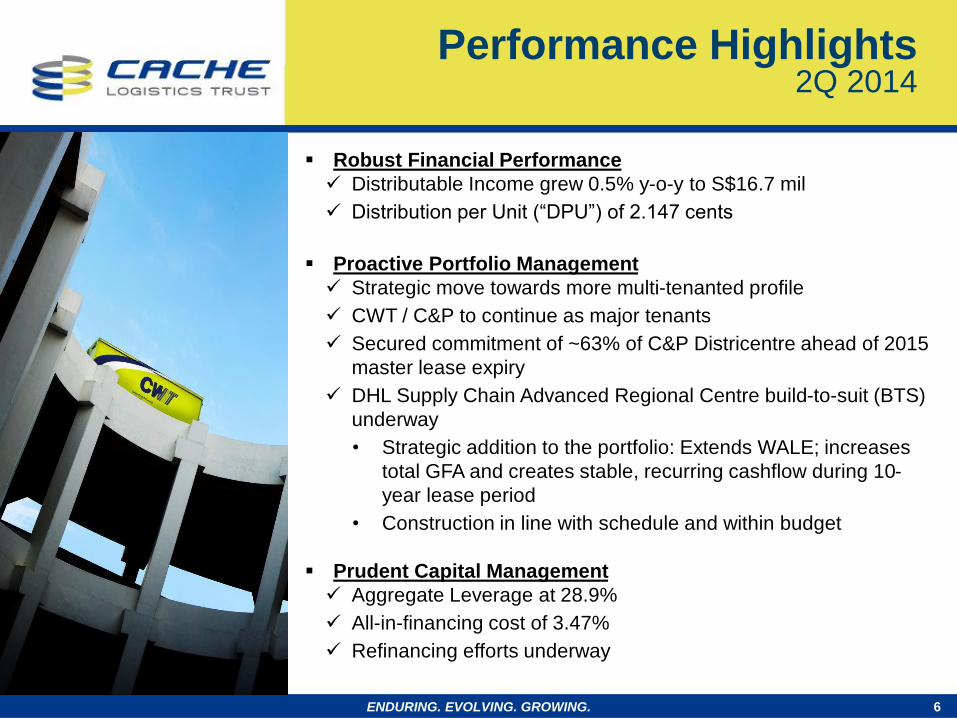
Robust Financial Performance
Distributable Income grew 0.5% y-o-y to S$16.7 mil
Distribution per Unit (“DPU”) of 2.147 cents
Proactive Portfolio Management
Strategic move towards more multi-tenanted profile
CWT / C&P to continue as major tenants
Secured commitment of ~63% of C&P Districentre ahead of 2015
master lease expiry
DHL Supply Chain Advanced Regional Centre build-to-suit (BTS)
underway
• Strategic addition to the portfolio: Extends WALE; increases
total GFA and creates stable, recurring cashflow during 10-
year lease period
• Construction in line with schedule and within budget
Prudent Capital Management
Aggregate Leverage at 28.9%
All-in-financing cost of 3.47%
Refinancing efforts underway
6
Performance Highlights 2Q 2014
ENDURING. EVOLVING. GROWING.
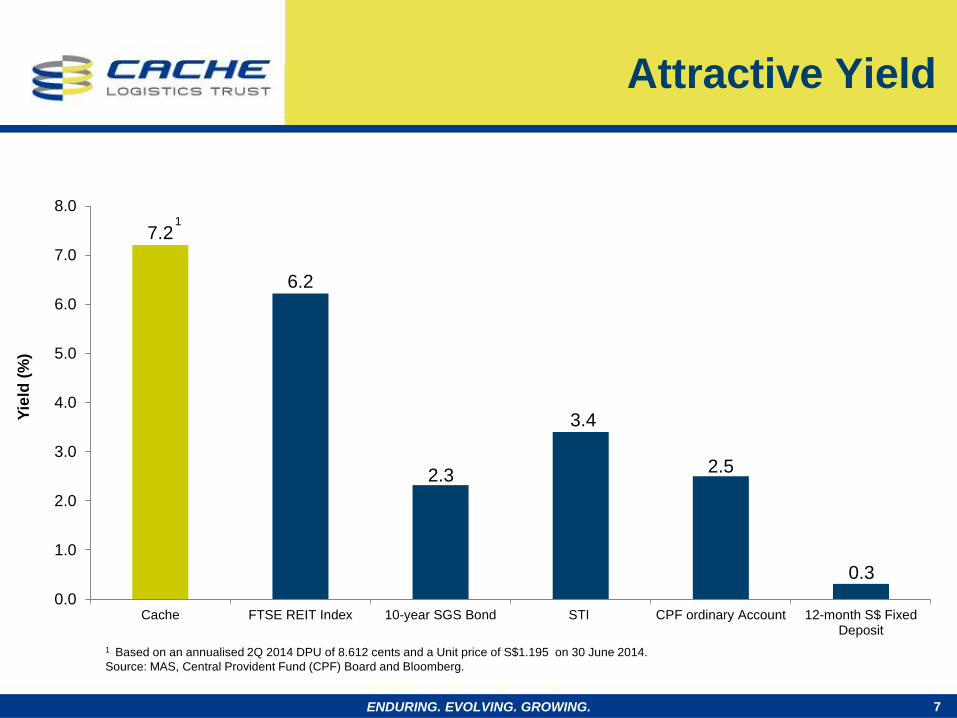
7.2
6.2
2.3
3.4
2.5
0.3
0.0
1.0
2.0
3.0
4.0
5.0
6.0
7.0
8.0
Cache FTSE REIT Index 10-year SGS Bond STI CPF ordinary Account 12-month S$ FixedDeposit
Yie
ld (
%)
7
Attractive Yield
1
ENDURING. EVOLVING. GROWING.
1 Based on an annualised 2Q 2014 DPU of 8.612 cents and a Unit price of S$1.195 on 30 June 2014.
Source: MAS, Central Provident Fund (CPF) Board and Bloomberg.
0
50
100
150
200
250
To
tal R
etu
rn (
Re
ba
se
d to
10
0 a
s a
t 1
2 A
pr
20
10
) in
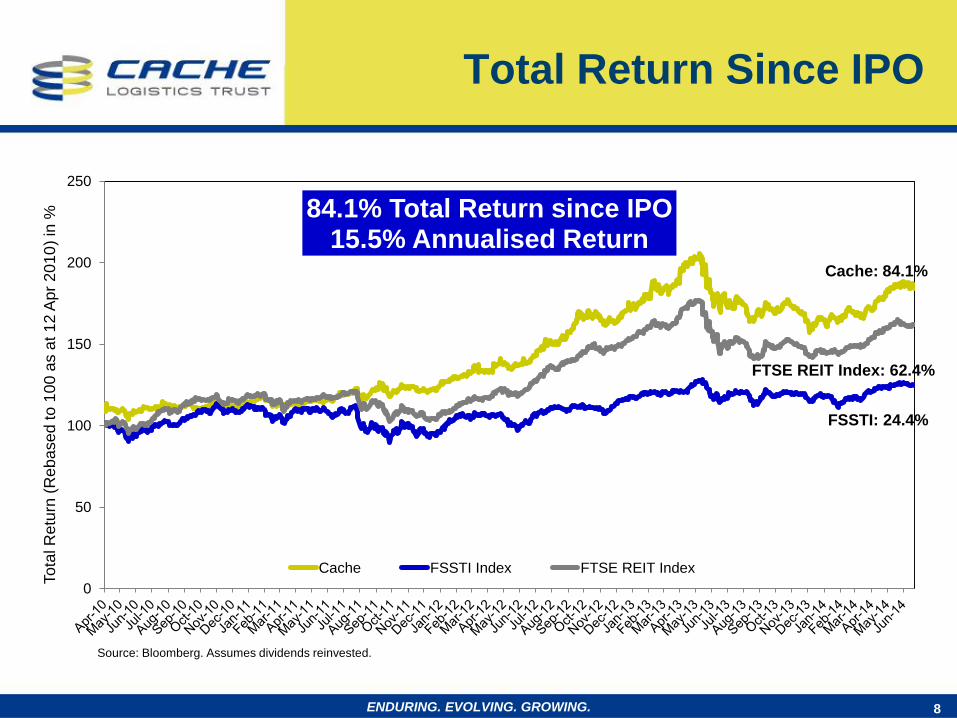
% 84.1% Total Return since IPO
15.5% Annualised Return
Cache FSSTI Index FTSE REIT Index
8
Source: Bloomberg. Assumes dividends reinvested.
Cache: 84.1%
FTSE REIT Index: 62.4%
FSSTI: 24.4%
Total Return Since IPO
ENDURING. EVOLVING. GROWING.
9 ENDURING. EVOLVING. GROWING.
Financial Performance
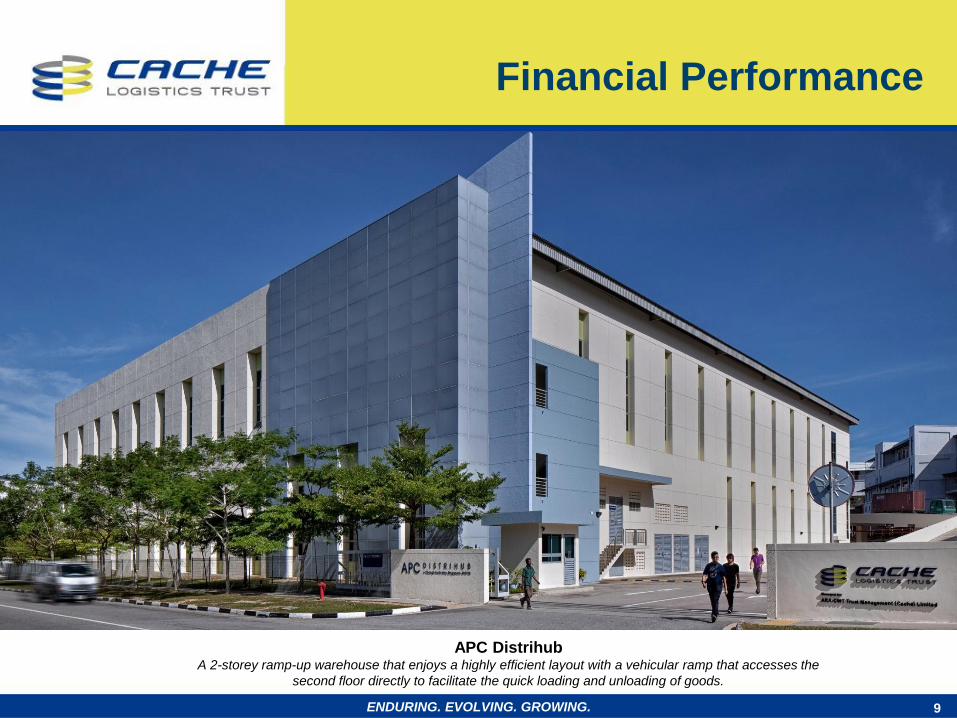
Pandan Logistics Hub Completed in 2011, Pandan Logistics Hub is a 5-storey ramp-up warehouse that boasts a floor loading capacity of up to 50KN/m2
and loading/ unloading bays with 25 dock-levellers APC Distrihub A 2-storey ramp-up warehouse that enjoys a highly efficient layout with a vehicular ramp that accesses the
second floor directly to facilitate the quick loading and unloading of goods.
Financial Performance 2Q 2014 & 1H 2014
10
1. Based on 779,559,020 issued units which includes 778,535,208 issued units as at 30 June 2014 and 1,023,812 units to be issued to the Manager within 30 days from
the quarter end as partial consideration of Manager’s fees. 2. Based on 775,273,116 issued units which includes 774,277,688 issued units as at 30 June 2013 and 995,428 units issued to the on 25 July 2013 as partial
consideration of Manager’s fees.
In S$’000 unless otherwise noted 2Q
2014
2Q
2013
y-o-y
Change
(%)
1H
2014
1H
2013
y-o-y
Change
(%)
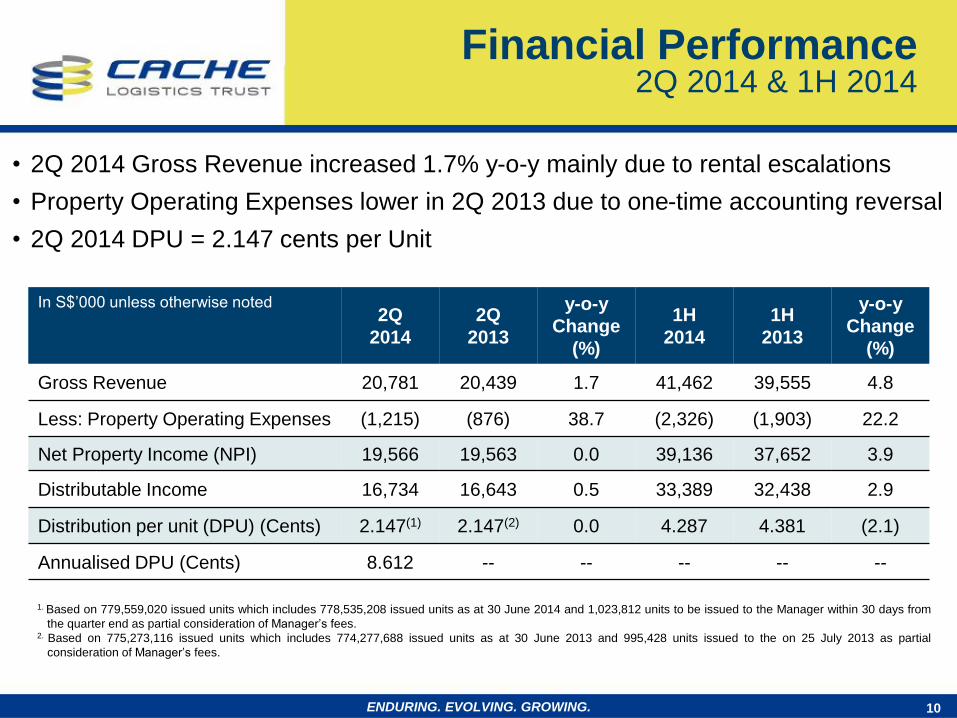
Gross Revenue 20,781 20,439 1.7 41,462 39,555 4.8
Less: Property Operating Expenses (1,215) (876) 38.7 (2,326) (1,903) 22.2
Net Property Income (NPI) 19,566 19,563 0.0 39,136 37,652 3.9
Distributable Income 16,734 16,643 0.5 33,389 32,438 2.9
Distribution per unit (DPU) (Cents) 2.147(1) 2.147(2) 0.0 4.287 4.381 (2.1)
Annualised DPU (Cents) 8.612 -- -- -- -- --
• 2Q 2014 Gross Revenue increased 1.7% y-o-y mainly due to rental escalations
• Property Operating Expenses lower in 2Q 2013 due to one-time accounting reversal
• 2Q 2014 DPU = 2.147 cents per Unit
ENDURING. EVOLVING. GROWING.
Balance Sheet
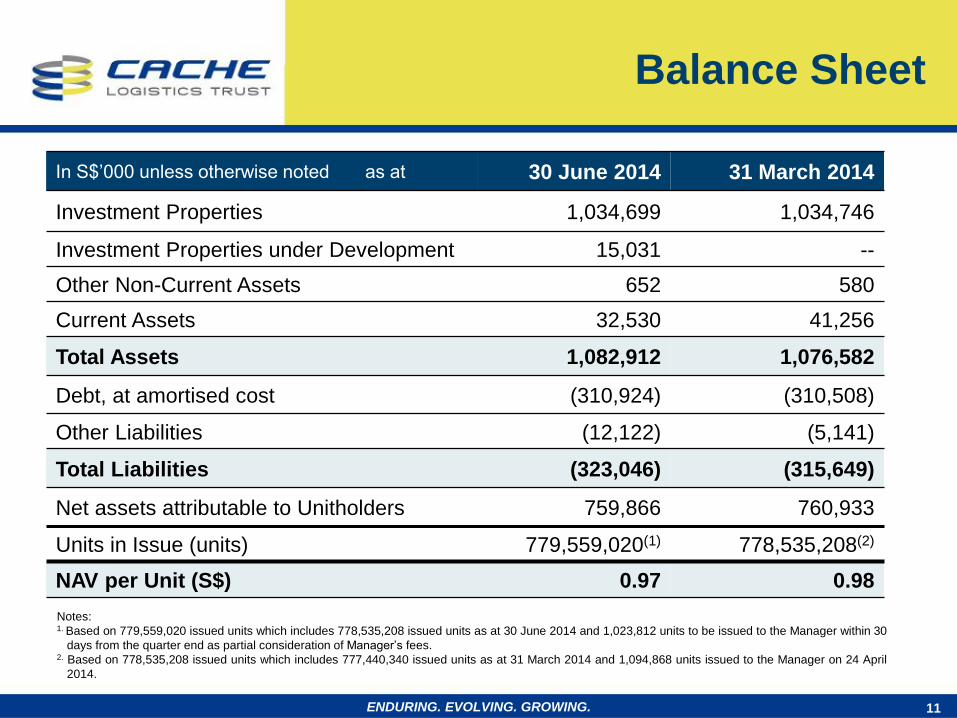
In S$’000 unless otherwise noted as at 30 June 2014 31 March 2014
Investment Properties 1,034,699 1,034,746
Investment Properties under Development 15,031 --
Other Non-Current Assets 652 580
Current Assets 32,530 41,256
Total Assets 1,082,912 1,076,582
Debt, at amortised cost (310,924) (310,508)
Other Liabilities (12,122) (5,141)
Total Liabilities (323,046) (315,649)
Net assets attributable to Unitholders 759,866 760,933
Units in Issue (units) 779,559,020(1) 778,535,208(2)
NAV per Unit (S$) 0.97 0.98
11 ENDURING. EVOLVING. GROWING.
Notes: 1. Based on 779,559,020 issued units which includes 778,535,208 issued units as at 30 June 2014 and 1,023,812 units to be issued to the Manager within 30
days from the quarter end as partial consideration of Manager’s fees. 2. Based on 778,535,208 issued units which includes 777,440,340 issued units as at 31 March 2014 and 1,094,868 units issued to the Manager on 24 April
2014.
12
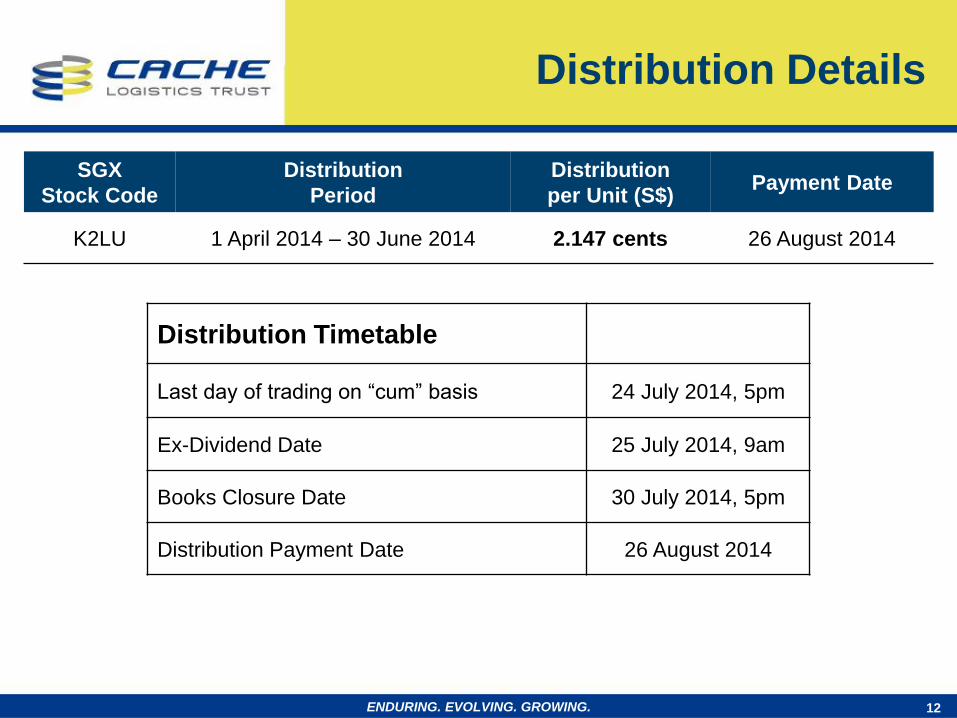
Distribution Details
SGX
Stock Code
Distribution
Period
Distribution
per Unit (S$) Payment Date
K2LU 1 April 2014 – 30 June 2014 2.147 cents 26 August 2014
Distribution Timetable
Last day of trading on “cum” basis 24 July 2014, 5pm
Ex-Dividend Date 25 July 2014, 9am
Books Closure Date 30 July 2014, 5pm
Distribution Payment Date 26 August 2014
ENDURING. EVOLVING. GROWING.
13 ENDURING. EVOLVING. GROWING.
Capital Management
Pandan Logistics Hub Completed in 2011, Pandan Logistics Hub is a 5-storey ramp-up warehouse that boasts a floor loading capacity of up to 50KN/m2
and loading/ unloading bays with 25 dock-levellers
APC Distrihub
This is a 2-storey ramp-up warehouse that enjoys a highly efficient
layout as a vehicular ramp that accesses the second floor directly to
facilitate the quick loading and unloading of goods
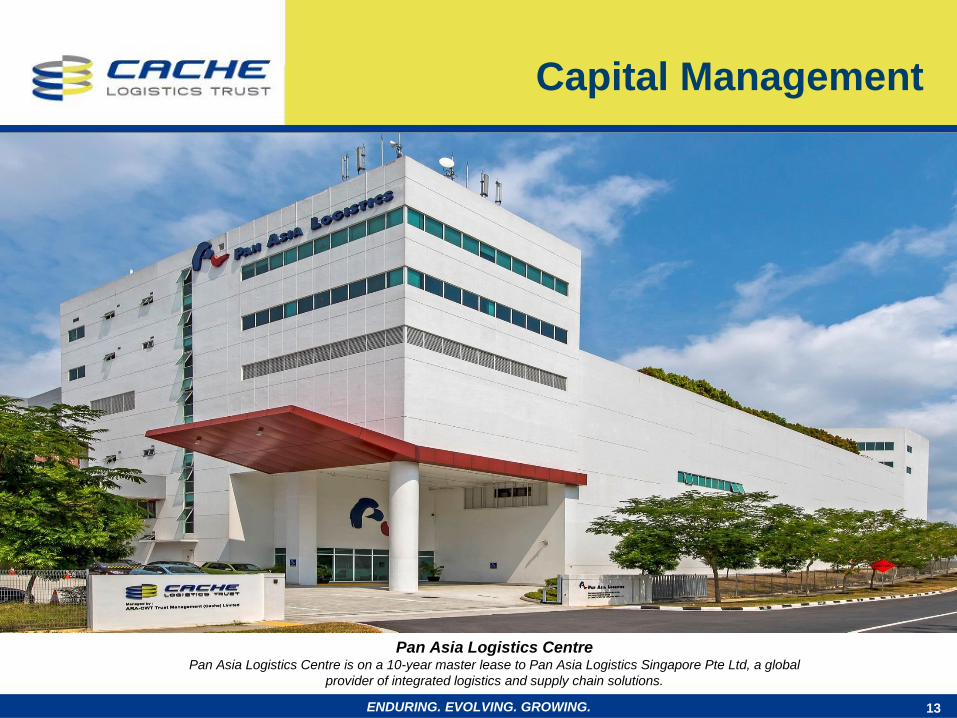
Pan Asia Logistics Centre Pan Asia Logistics Centre is on a 10-year master lease to Pan Asia Logistics Singapore Pte Ltd, a global
provider of integrated logistics and supply chain solutions.
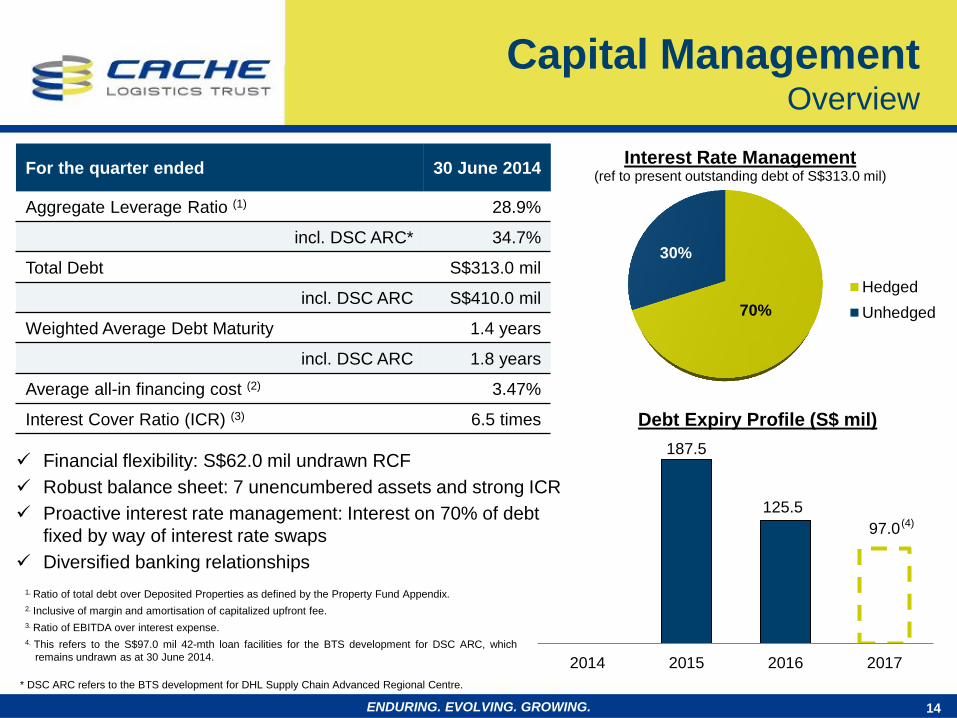
70%
30%
Interest Rate Management (ref to present outstanding debt of S$313.0 mil)
Hedged
Unhedged
For the quarter ended 30 June 2014
Aggregate Leverage Ratio (1) 28.9%
incl. DSC ARC* 34.7%
Total Debt S$313.0 mil
incl. DSC ARC S$410.0 mil
Weighted Average Debt Maturity 1.4 years
incl. DSC ARC 1.8 years
Average all-in financing cost (2) 3.47%
Interest Cover Ratio (ICR) (3) 6.5 times
1. Ratio of total debt over Deposited Properties as defined by the Property Fund Appendix.
2. Inclusive of margin and amortisation of capitalized upfront fee.
3. Ratio of EBITDA over interest expense.
4. This refers to the S$97.0 mil 42-mth loan facilities for the BTS development for DSC ARC, which
remains undrawn as at 30 June 2014.
14 ENDURING. EVOLVING. GROWING.
Capital Management Overview
187.5
125.5
97.0
2014 2015 2016 2017
Debt Expiry Profile (S$ mil)
* DSC ARC refers to the BTS development for DHL Supply Chain Advanced Regional Centre.
Financial flexibility: S$62.0 mil undrawn RCF
Robust balance sheet: 7 unencumbered assets and strong ICR
Proactive interest rate management: Interest on 70% of debt
fixed by way of interest rate swaps
Diversified banking relationships
(4)
15 ENDURING. EVOLVING. GROWING.
Portfolio Management
Pandan Logistics Hub Completed in 2011, Pandan Logistics Hub is a 5-storey ramp-up warehouse that boasts a floor loading capacity of up to 50KN/m2
and loading/ unloading bays with 25 dock-levellers
APC Distrihub
This is a 2-storey ramp-up warehouse that enjoys a highly efficient
layout as a vehicular ramp that accesses the second floor directly to
facilitate the quick loading and unloading of goods
Pan Asia Logistics Centre
Pan Asia Logistics is on a 10-year master lease to Pan Asia Logistics
Singapore Pte. Ltd, a global provider of integrated logistics and
supply chain solutions
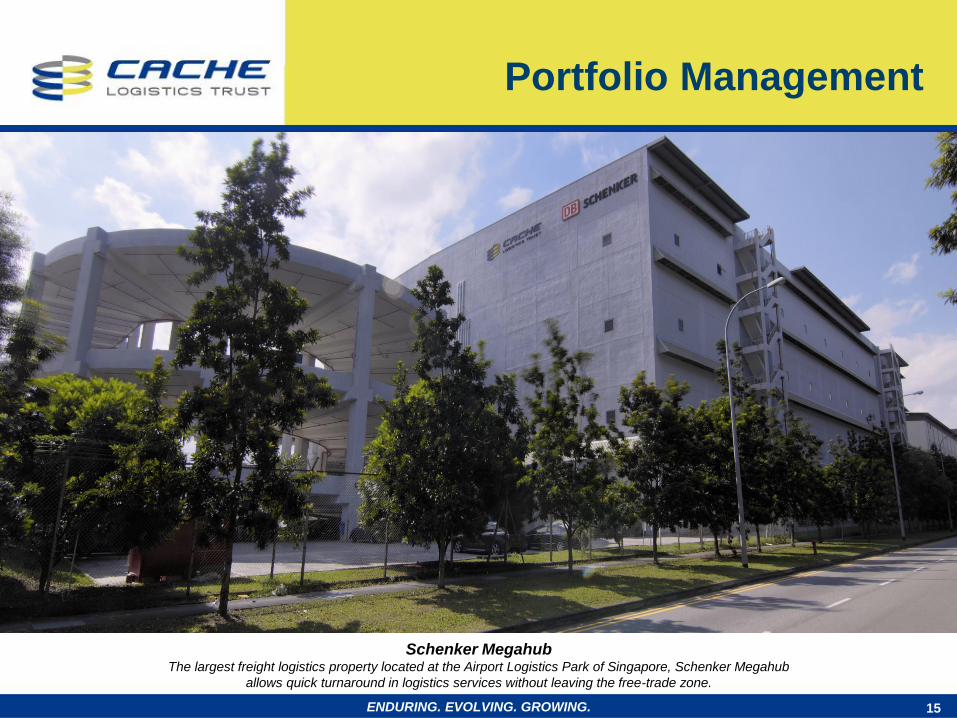
Schenker Megahub The largest freight logistics property located at the Airport Logistics Park of Singapore, Schenker Megahub
allows quick turnaround in logistics services without leaving the free-trade zone.
16
Quality, Resilient Portfolio Portfolio Statistics
as at 30 June 2014
Number of Properties 14 Properties
12 – Singapore (completed)
1 – Singapore (incl DSC ARC under development)
1 – China, Shanghai
Valuation S$1.04 bil
S$1.16 bil (incl completed value of DSC ARC)
Gross Floor Area (GFA) 5.1 mil sf
6.1 mil sf (incl DSC ARC)
Occupancy 99.6%
Number of Tenants 8 Master Lessees
4 Individual Tenants (incl DHL Supply Chain)
Building Age 6.3 years
5.3 years (incl DSC ARC)
Weighted Average Lease to Expiry (“WALE”) 3.8 years (incl DSC ARC)
Weighted Average Land Lease Expiry 31.1 years (incl DSC ARC)
Property Features 10 – Ramp-up (incl DSC ARC)
2 – Cargo Lift
2 – Single Storey
Rental Escalations built into Master Leases 1.25% to 2.50% pa
ENDURING. EVOLVING. GROWING.
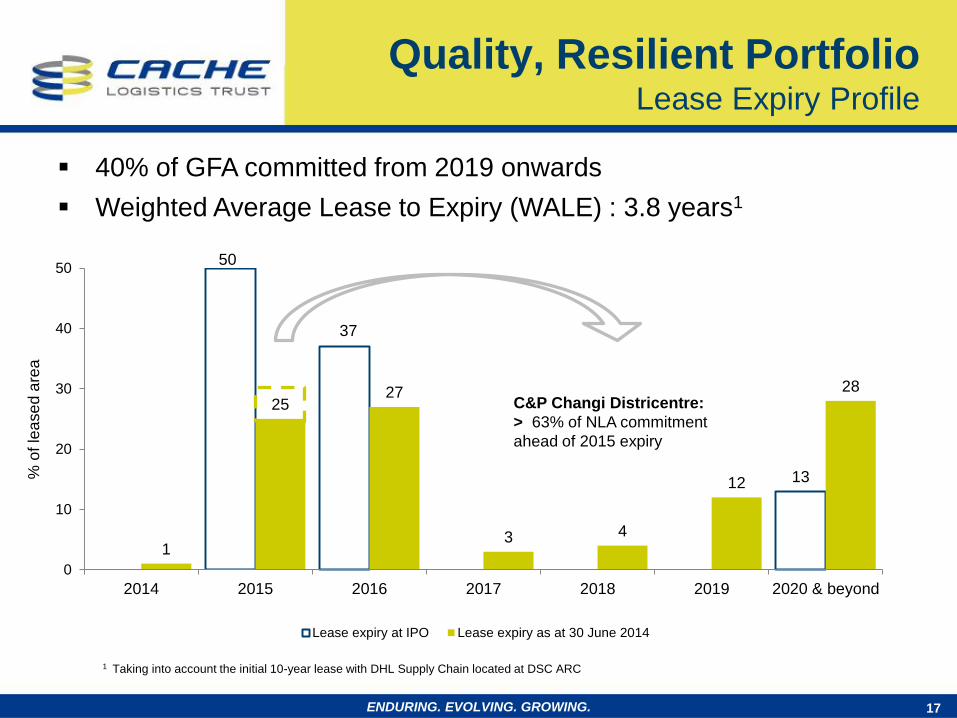
50
37
13
1
25 27
3 4
12
28
0
10
20
30
40
50
2014 2015 2016 2017 2018 2019 2020 & beyond
Lease expiry at IPO Lease expiry as at 30 June 2014
17 ENDURING. EVOLVING. GROWING.
Quality, Resilient Portfolio Lease Expiry Profile
C&P Changi Districentre:
> 63% of NLA commitment
ahead of 2015 expiry
40% of GFA committed from 2019 onwards
Weighted Average Lease to Expiry (WALE) : 3.8 years1
% o
f le
ase
d a
rea
1 Taking into account the initial 10-year lease with DHL Supply Chain located at DSC ARC
18
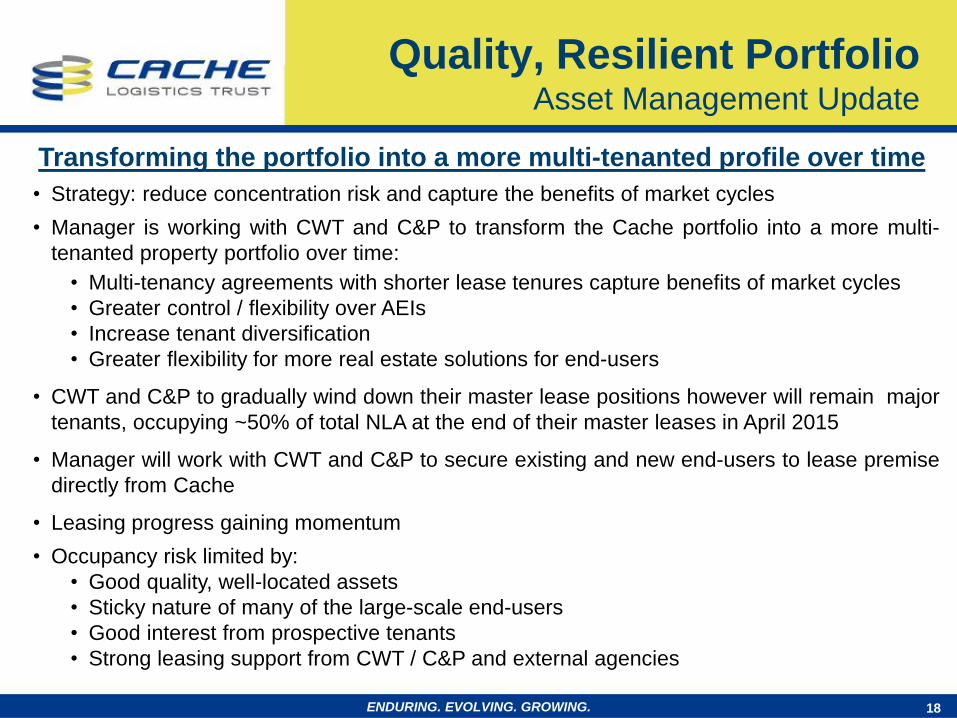
• Strategy: reduce concentration risk and capture the benefits of market cycles
• Manager is working with CWT and C&P to transform the Cache portfolio into a more multi-
tenanted property portfolio over time:
• Multi-tenancy agreements with shorter lease tenures capture benefits of market cycles
• Greater control / flexibility over AEIs
• Increase tenant diversification
• Greater flexibility for more real estate solutions for end-users
• CWT and C&P to gradually wind down their master lease positions however will remain major
tenants, occupying ~50% of total NLA at the end of their master leases in April 2015
• Manager will work with CWT and C&P to secure existing and new end-users to lease premise
directly from Cache
• Leasing progress gaining momentum
• Occupancy risk limited by:
• Good quality, well-located assets
• Sticky nature of many of the large-scale end-users
• Good interest from prospective tenants
• Strong leasing support from CWT / C&P and external agencies
ENDURING. EVOLVING. GROWING.
Transforming the portfolio into a more multi-tenanted profile over time
Quality, Resilient Portfolio Asset Management Update
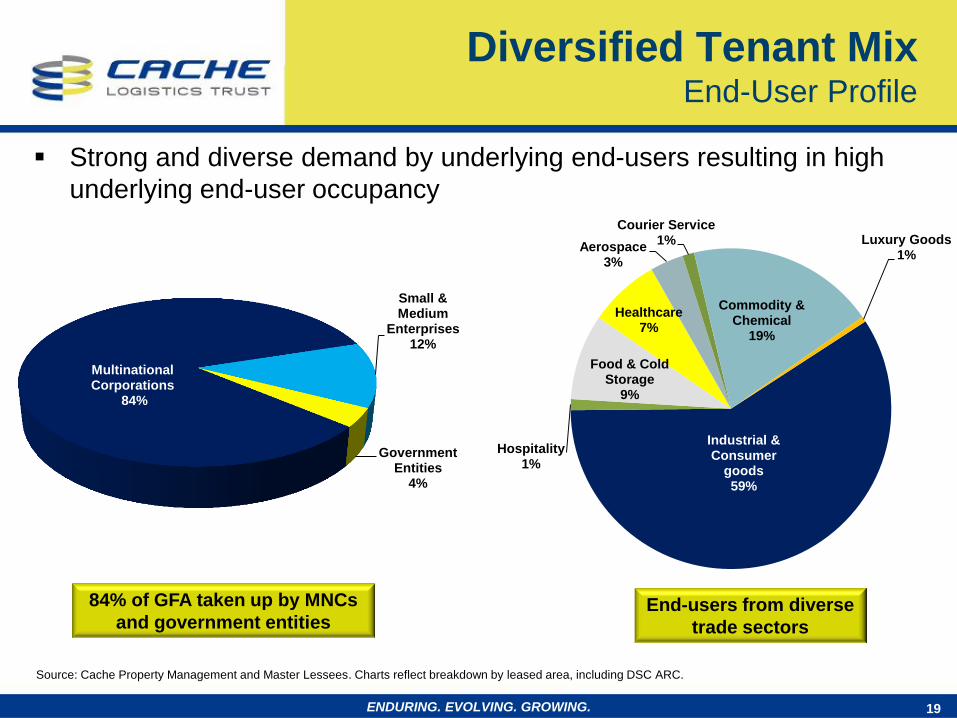
Industrial & Consumer
goods 59%
Hospitality 1%
Food & Cold Storage
9%
Healthcare 7%
Aerospace 3%
Courier Service 1%
Commodity & Chemical
19%
Luxury Goods 1%
Diversified Tenant Mix End-User Profile
Strong and diverse demand by underlying end-users resulting in high
underlying end-user occupancy
Source: Cache Property Management and Master Lessees. Charts reflect breakdown by leased area, including DSC ARC.
End-users from diverse
trade sectors
84% of GFA taken up by MNCs
and government entities
19 ENDURING. EVOLVING. GROWING.
Multinational Corporations
84%
Small & Medium
Enterprises 12%
Government Entities
4%
20
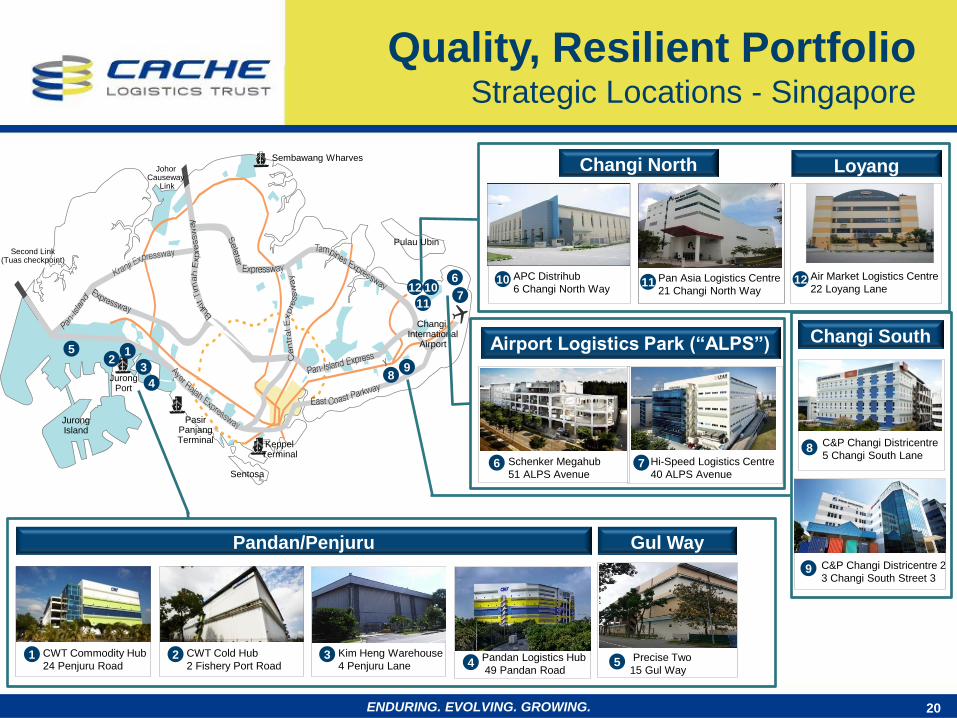
Quality, Resilient Portfolio Strategic Locations - Singapore
vv
Pandan/Penjuru
1 CWT Cold Hub
2 Fishery Port Road
CWT Commodity Hub
24 Penjuru Road
C&P Changi Districentre 2
3 Changi South Street 3
C&P Changi Districentre
5 Changi South Lane
APC Distrihub
6 Changi North Way
Kim Heng Warehouse
4 Penjuru Lane
Air Market Logistics Centre
22 Loyang Lane
Jurong Port
Pasir Panjang Terminal Keppel
Terminal
Changi International
Airport
Sembawang Wharves
Second Link (Tuas checkpoint)
Johor Causeway
Link
Sentosa
Pulau Ubin
Jurong Island
Pan Asia Logistics Centre
21 Changi North Way
2 3 4
10 11 12
Schenker Megahub
51 ALPS Avenue
Airport Logistics Park (“ALPS”)
Hi-Speed Logistics Centre
40 ALPS Avenue 6 7
Pandan Logistics Hub
49 Pandan Road
2 3
1
4
12 10
11
8 9
6
7
8
9
Changi North Loyang
Changi South
Gul Way
5 Precise Two
15 Gul Way
5
ENDURING. EVOLVING. GROWING.

Singapore - West Zone
CWT
Commodity
Hub
CWT
Cold Hub
Kim Heng
Warehouse
Pandan
Logistics Hub Precise Two
Lessee CWT CWT Kim Heng CWT Precise
Development
Ramp-up
feature √ √ Single Storey √ √
Location Penjuru Penjuru Penjuru Pandan Gul Way
GFA 2,300,000 sf 342,000 sf 54,000 sf 329,000 sf 284,000 sf
Valuation S$365.0mil S$139.6mil S$9.4mil S$66.5mil S$56.0mil
1 2
21
Quality, Resilient Portfolio Portfolio Details
Valuation as at 31 December 2013.
ENDURING. EVOLVING. GROWING.
4 3 5
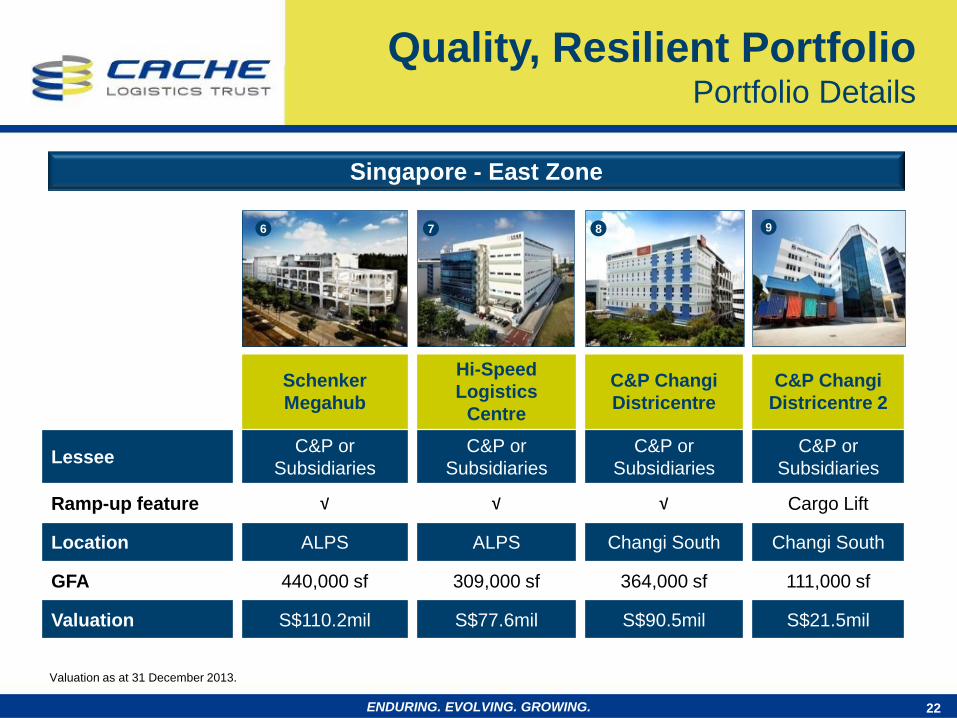
Singapore - East Zone
Schenker
Megahub
Hi-Speed
Logistics
Centre
C&P Changi
Districentre
C&P Changi
Districentre 2
Lessee C&P or
Subsidiaries
C&P or
Subsidiaries
C&P or
Subsidiaries
C&P or
Subsidiaries
Ramp-up feature √ √ √ Cargo Lift
Location ALPS ALPS Changi South Changi South
GFA 440,000 sf 309,000 sf 364,000 sf 111,000 sf
Valuation S$110.2mil S$77.6mil S$90.5mil S$21.5mil
6 7 8
22
Quality, Resilient Portfolio Portfolio Details
9
ENDURING. EVOLVING. GROWING.
Valuation as at 31 December 2013.
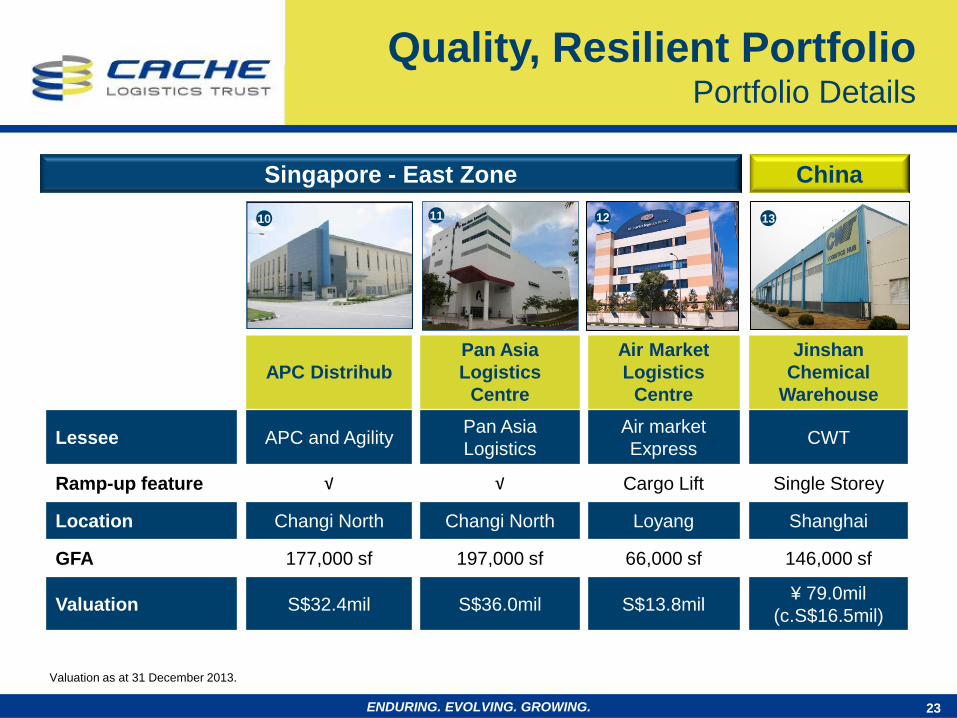
Singapore - East Zone
APC Distrihub
Pan Asia
Logistics
Centre
Air Market
Logistics
Centre
Jinshan
Chemical
Warehouse
Lessee APC and Agility Pan Asia
Logistics
Air market
Express CWT
Ramp-up feature √ √ Cargo Lift Single Storey
Location Changi North Changi North Loyang Shanghai
GFA 177,000 sf 197,000 sf 66,000 sf 146,000 sf
Valuation S$32.4mil S$36.0mil S$13.8mil ¥ 79.0mil
(c.S$16.5mil)
China
10
23
Quality, Resilient Portfolio Portfolio Details
11 12 13
ENDURING. EVOLVING. GROWING.
Valuation as at 31 December 2013.
24 ENDURING. EVOLVING. GROWING.
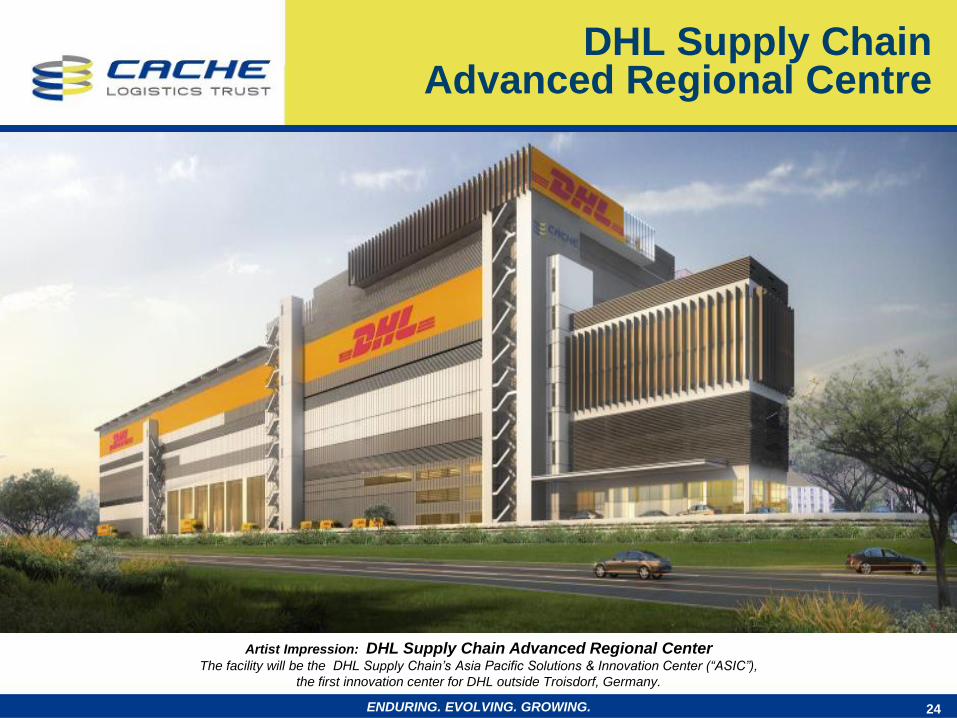
Artist Impression: DHL Supply Chain Advanced Regional Center The facility will be the DHL Supply Chain’s Asia Pacific Solutions & Innovation Center (“ASIC”),
the first innovation center for DHL outside Troisdorf, Germany.
DHL Supply Chain Advanced Regional Centre
25
Build-to-Suit Facility for DHL Supply Chain Advanced Regional Centre
Location Greenwich Drive, Tampines LogisPark
Land Area Approx. 638,400 sf
Land Lease Tenure 30 years from 16 June 2014
Asset Overview Modern ramp-up logistics warehouse comprising:
• 3-storey warehouse, including 4-storey ancillary office space (“Block 1”)
• 2-storey warehouse (“Block 2”)
Gross Floor Area (GFA) Approx. 989,200 sf
Net Lettable Area (NLA) Approx. 928,100 sf
Block 1 – approx.717,600 (77%)
Block 2 – approx. 210,500 (23%)
Design-Build Contractor Precise Development Pte Ltd
Cost Consideration Development Cost: S$ 105.1 mil ; Non-Development Cost : S$18.4 mil
Expected TOP Date 2H 2015
Lease Commitment 10-year lease term, with option to renew for 3 additional five-year terms and
a fourth renewal term lasting until the end of land lease
Block 1 – 100% of NLA from year 1
Block 2 – 50% of NLA from year 3
– Remaining 50% of NLA from year 5
Annual Rental Escalations apply
ENDURING. EVOLVING. GROWING.
DHL Supply Chain Advanced Regional Centre
Factsheet
26 ENDURING. EVOLVING. GROWING.
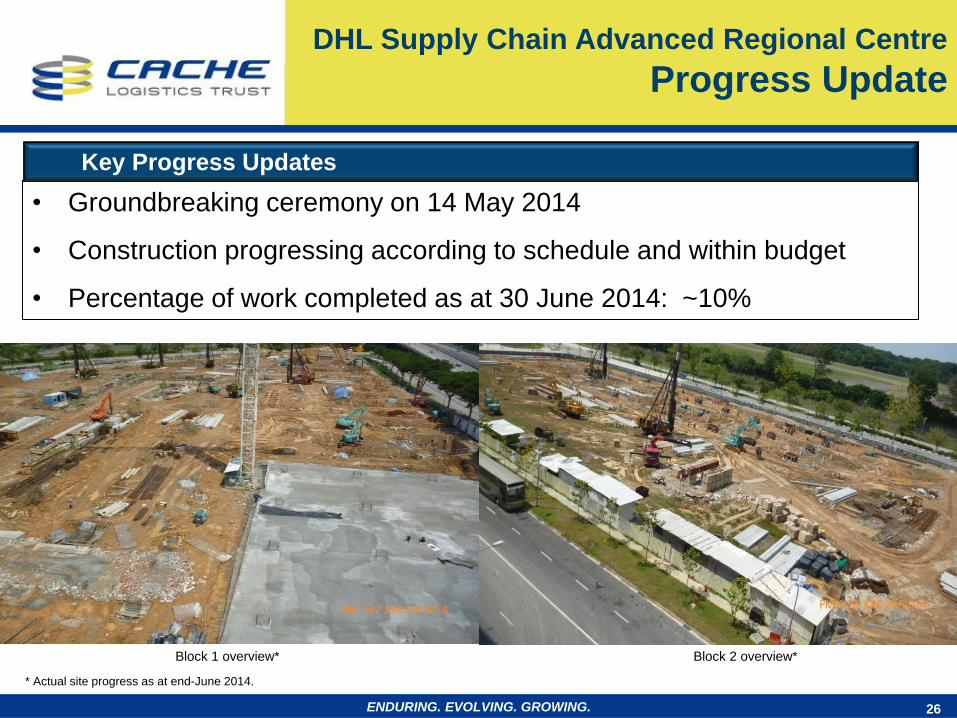
• Groundbreaking ceremony on 14 May 2014
• Construction progressing according to schedule and within budget
• Percentage of work completed as at 30 June 2014: ~10%
Key Progress Updates
Block 1 overview* Block 2 overview*
DHL Supply Chain Advanced Regional Centre
Progress Update
* Actual site progress as at end-June 2014.
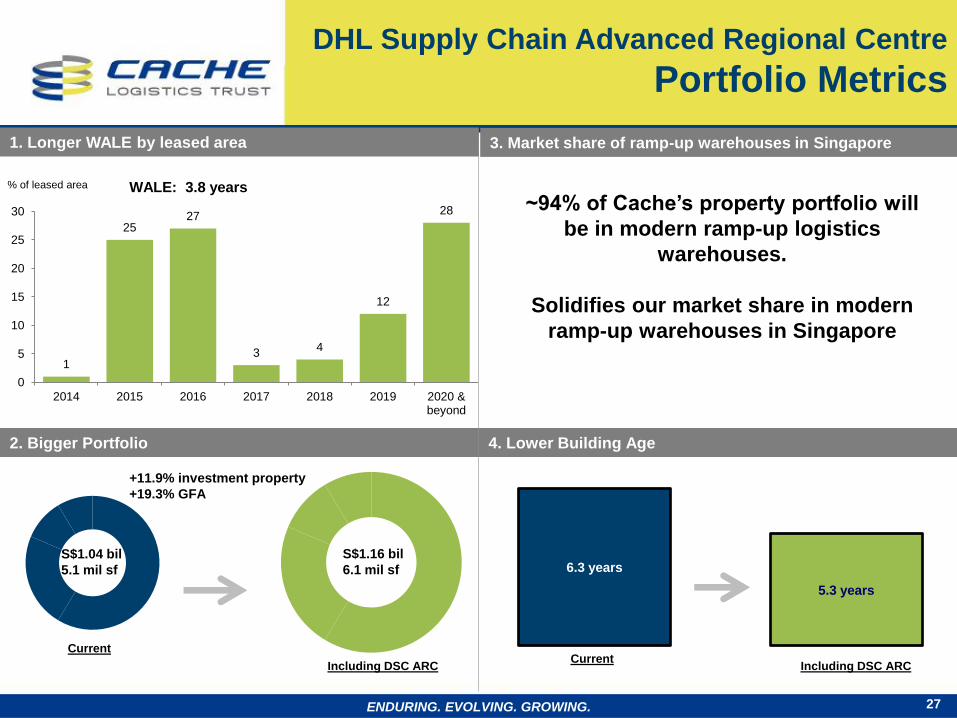
1
25 27
3 4
12
28
0
5
10
15
20
25
30
2014 2015 2016 2017 2018 2019 2020 &beyond
27
WALE: 3.8 years % of leased area
1. Longer WALE by leased area 3. Market share of ramp-up warehouses in Singapore
4. Lower Building Age
S$1.04 bil
5.1 mil sf
S$1.16 bil
6.1 mil sf 6.3 years
5.3 years
+11.9% investment property
+19.3% GFA
Current
Including DSC ARC Current
Including DSC ARC
~94% of Cache’s property portfolio will
be in modern ramp-up logistics
warehouses.
Solidifies our market share in modern
ramp-up warehouses in Singapore
ENDURING. EVOLVING. GROWING.
2. Bigger Portfolio
DHL Supply Chain Advanced Regional Centre
Portfolio Metrics
28 ENDURING. EVOLVING. GROWING.
Strategy & Market Outlook
Pandan Logistics Hub Completed in 2011, Pandan Logistics Hub is a 5-storey ramp-up warehouse that boasts a floor loading capacity of up to 50KN/m2
and loading/ unloading bays with 25 dock-levellers
APC Distrihub
This is a 2-storey ramp-up warehouse that enjoys a highly efficient
layout as a vehicular ramp that accesses the second floor directly to
facilitate the quick loading and unloading of goods
Pan Asia Logistics Centre
Pan Asia Logistics is on a 10-year master lease to Pan Asia Logistics
Singapore Pte. Ltd, a global provider of integrated logistics and
supply chain solutions
Schenker Megahub
The largest freight logistics property located at the Airport Logistics
Park of Singapore, Schenker Megahub allows quick turnaround in
logistics services without leaving the free-trade zone
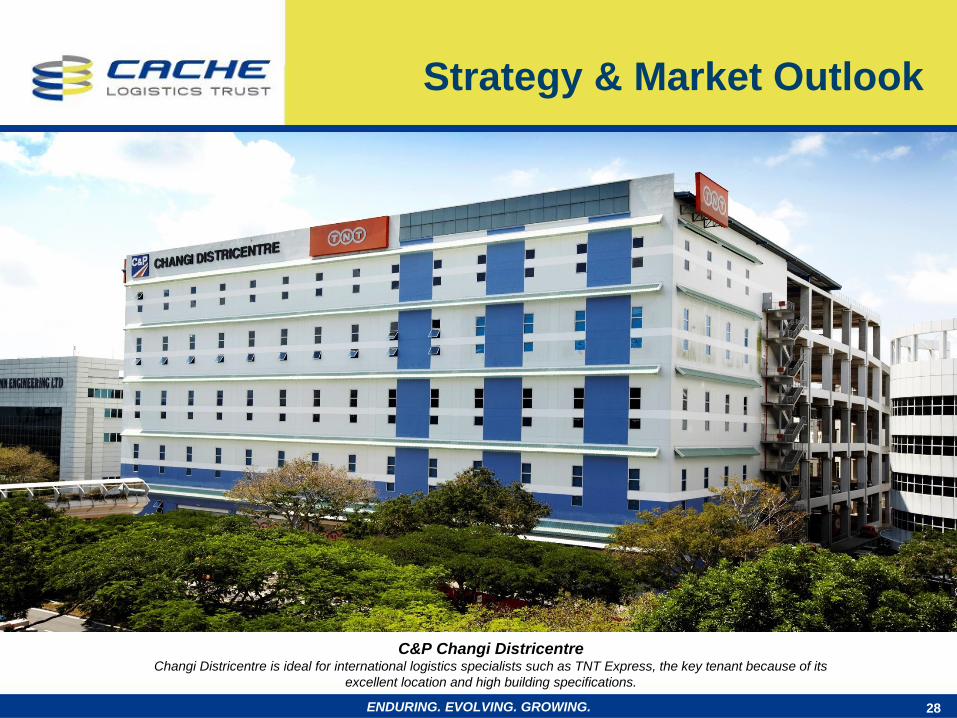
C&P Changi Districentre Changi Districentre is ideal for international logistics specialists such as TNT Express, the key tenant because of its
excellent location and high building specifications.
Market Outlook
29
• Singapore economy grew by 2.1% on a year-on-year basis in 2Q 2014, slower than the 4.7% growth in
the previous quarter. On a quarter-on-quarter seasonally-adjusted annualised basis, the economy
contracted by 0.8%, a reversal from the 1.6% growth in the preceding quarter1.
• Singapore’s June Purchasing Managers’ Index (“PMI”), a key indicator of manufacturing activity, was
slightly down from the 50.8 points recorded in May to 50.5 points, attributable to lower new and export
orders, and a drop in production output. Economists expect that Singapore may benefit from the pick-up
in manufacturing activity in the region in the medium term.
• The JTC Corporation subletting policy from 1 October 2014 will revise the anchor subtenant
requirement upwards from the current 50% to 70% of the GFA of an industrial property, and will apply to
all properties five-years from attaining TOP. In addition, a new minimum occupation period of three
years for subsequent anchor subtenants applies.
• According to Colliers International, 2Q 2014 rents for warehouse space weakened for the third straight
quarter amid competition from newer and better specification premises, such as ramp-up industrial
developments. While there is good leasing demand for high-quality, well-located warehouse space from
end-users, there is a significant amount of new industrial warehouse space that may dampen rents and
occupancy rates in the near term2.
Source:
1. Ministry of Trade and Industry, “Singapore’s GDP Growth Moderated in the Second Quarter of 2014”, press release dated 14 July 2014.
2. Colliers International, “The Singapore Industrial Property Market Experiences Momentum Gain in Leasing Activities, While Sales Remain Weak”, 2Q 2014
Industrial Property Report dated 10 July 2014.
ENDURING. EVOLVING. GROWING.
0.0
2.0
4.0
6.0
8.0
10.0
12.0
14.0
16.0
-
100
200
300
400
500
600
700
800
900
1,000
1994 1995 1996 1997 1998 1999 2000 2001 2002 2003 2004 2005 2006 2007 2008 2009 2010 2011 2012 2013 2014(E)
2015(E)
2016(E)
2017(E)
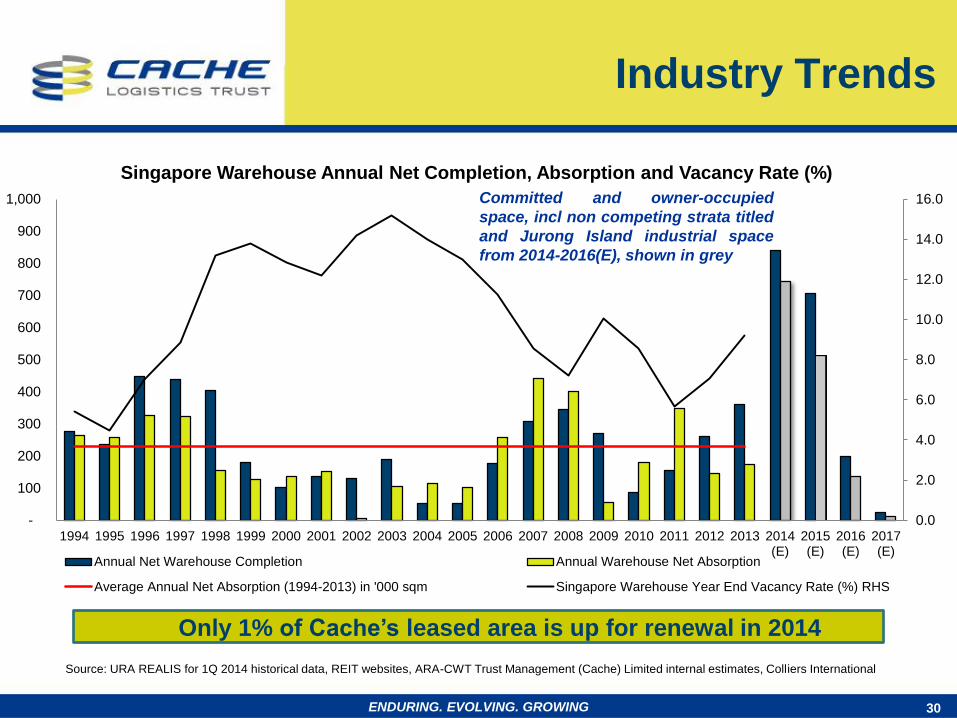
Singapore Warehouse Annual Net Completion, Absorption and Vacancy Rate (%)
Annual Net Warehouse Completion Annual Warehouse Net Absorption
Average Annual Net Absorption (1994-2013) in '000 sqm Singapore Warehouse Year End Vacancy Rate (%) RHS
30
Industry Trends
Committed and owner-occupied
space, incl non competing strata titled
and Jurong Island industrial space
from 2014-2016(E), shown in grey
Only 1% of Cache’s leased area is up for renewal in 2014
Source: URA REALIS for 1Q 2014 historical data, REIT websites, ARA-CWT Trust Management (Cache) Limited internal estimates, Colliers International
ENDURING. EVOLVING. GROWING
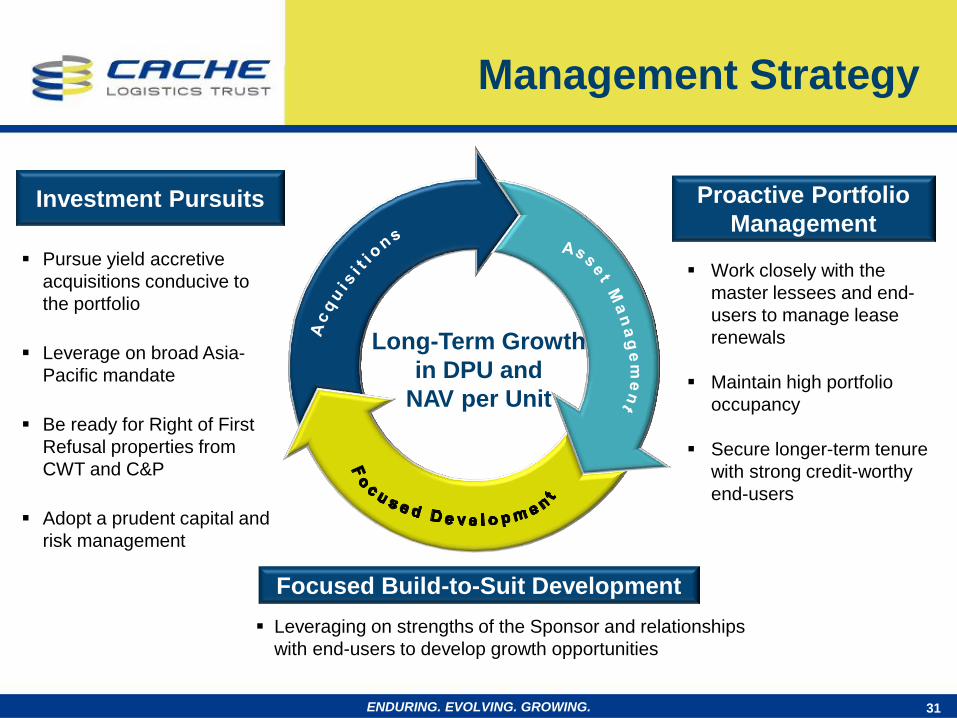
Long-Term Growth
in DPU and
NAV per Unit
Work closely with the
master lessees and end-
users to manage lease
renewals
Maintain high portfolio
occupancy
Secure longer-term tenure
with strong credit-worthy
end-users
Pursue yield accretive
acquisitions conducive to
the portfolio
Leverage on broad Asia-
Pacific mandate
Be ready for Right of First
Refusal properties from
CWT and C&P
Adopt a prudent capital and
risk management
Leveraging on strengths of the Sponsor and relationships
with end-users to develop growth opportunities
Investment Pursuits Proactive Portfolio
Management
Focused Build-to-Suit Development
Management Strategy
31 ENDURING. EVOLVING. GROWING.
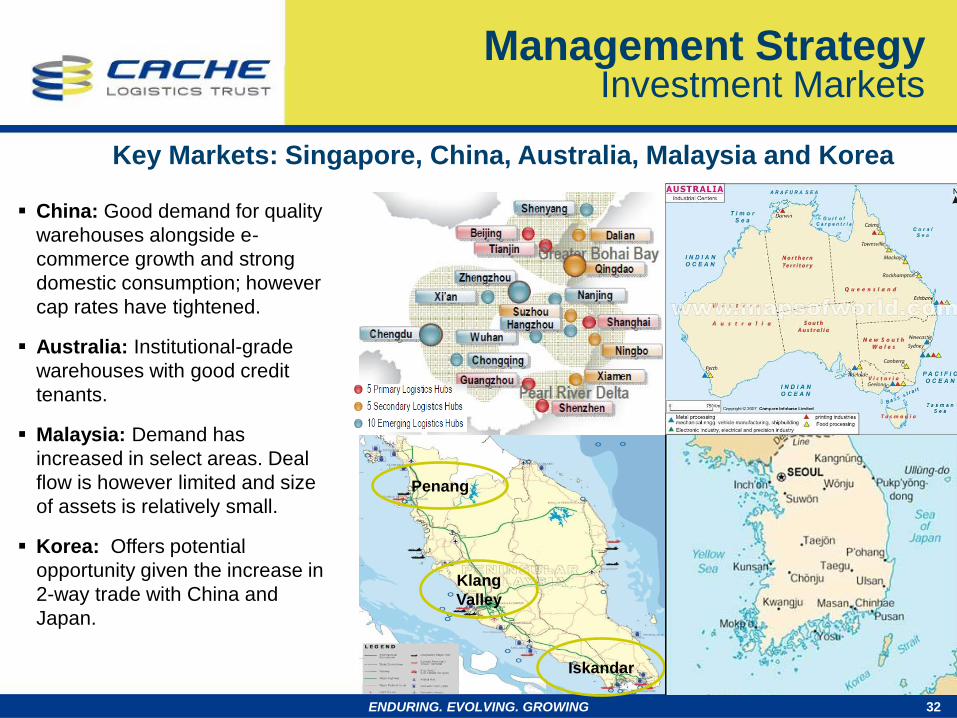
32
Iskandar
Klang
Valley
Penang
ENDURING. EVOLVING. GROWING
Key Markets: Singapore, China, Australia, Malaysia and Korea
China: Good demand for quality
warehouses alongside e-
commerce growth and strong
domestic consumption; however
cap rates have tightened.
Australia: Institutional-grade
warehouses with good credit
tenants.
Malaysia: Demand has
increased in select areas. Deal
flow is however limited and size
of assets is relatively small.
Korea: Offers potential
opportunity given the increase in
2-way trade with China and
Japan.
Management Strategy Investment Markets
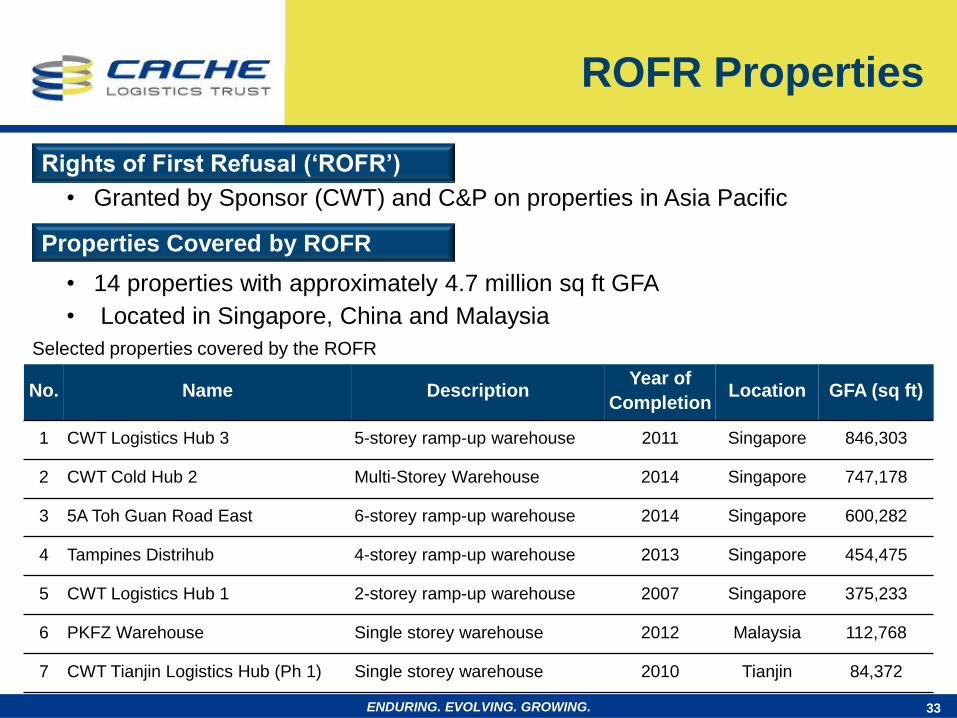
• Granted by Sponsor (CWT) and C&P on properties in Asia Pacific
• 14 properties with approximately 4.7 million sq ft GFA
• Located in Singapore, China and Malaysia
No. Name Description Year of
Completion Location GFA (sq ft)
1 CWT Logistics Hub 3 5-storey ramp-up warehouse 2011 Singapore 846,303
2 CWT Cold Hub 2 Multi-Storey Warehouse 2014 Singapore 747,178
3 5A Toh Guan Road East 6-storey ramp-up warehouse 2014 Singapore 600,282
4 Tampines Distrihub 4-storey ramp-up warehouse 2013 Singapore 454,475
5 CWT Logistics Hub 1 2-storey ramp-up warehouse 2007 Singapore 375,233
6 PKFZ Warehouse Single storey warehouse 2012 Malaysia 112,768
7 CWT Tianjin Logistics Hub (Ph 1) Single storey warehouse 2010 Tianjin 84,372
Selected properties covered by the ROFR
ROFR Properties
33
Rights of First Refusal (‘ROFR’)
Properties Covered by ROFR
ENDURING. EVOLVING. GROWING.
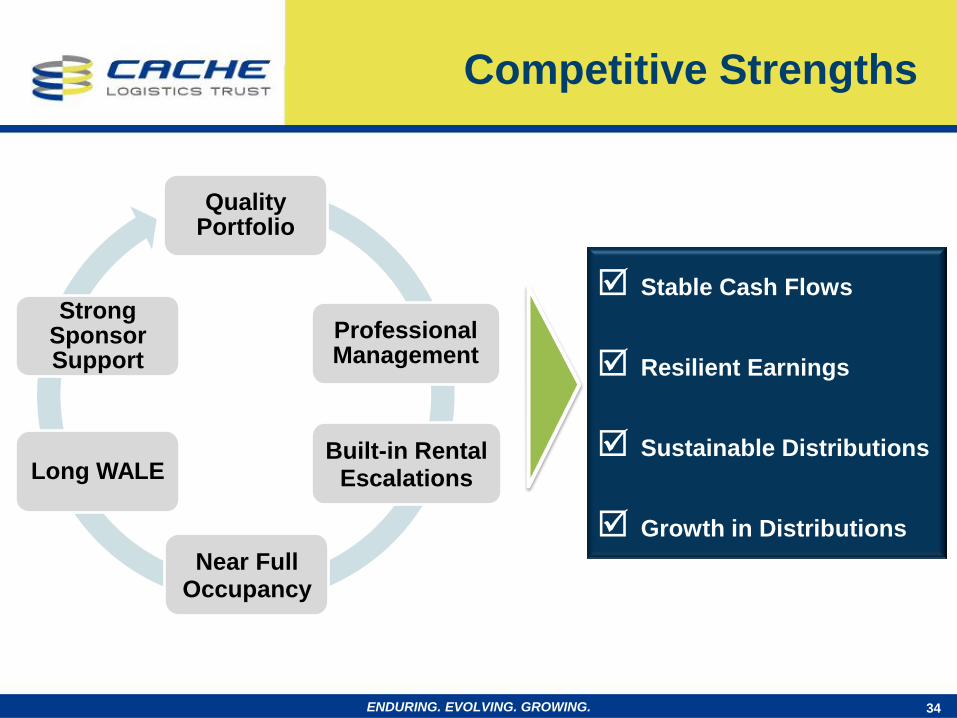
Competitive Strengths
Stable Cash Flows
Resilient Earnings
Sustainable Distributions
Growth in Distributions
34
Quality Portfolio
Professional Management
Built-in Rental Escalations
Near Full Occupancy
Long WALE
Strong Sponsor Support
ENDURING. EVOLVING. GROWING.
Contact Information
Investor Relations Contact:
Judy Tan
Investor Relations Manager
35
ARA-CWT Trust Management (Cache) Limited
6 Temasek Boulevard #16-02
Suntec Tower 4
Singapore 038986
Tel: +65 6835 9232
Website: www.cache-reit.com
ENDURING. EVOLVING. GROWING.
Disclaimer
This presentation does not constitute an offer, invitation or solicitation of securities in Singapore or any other jurisdiction
nor should it or any part of it form the basis of, or be relied upon in connection with, any contract or commitment
whatsoever.
This presentation may contain forward-looking statements that involve risks and uncertainties. Actual future performance,
outcomes and results may differ materially from those expressed in forward-looking statements as a result of a number of
risks, uncertainties and assumptions. Representative examples of these factors include (without limitation) general
industry and economic conditions, interest rate trends, cost of capital and capital availability, competition from similar
developments, shifts in expected levels of property rental income, changes in operating expenses (including employee
wages, benefits and training costs), property expenses and governmental and public policy changes and the continued
availability of financing in the amounts and the terms necessary to support future business. Investors are cautioned not to
place undue reliance on these forward-looking statements, which are based on the current views of management on
future events.
The value of units in Cache (“Units”) and the income derived from them, if any, may fall or rise. Units are not obligations
of, deposits in, or guaranteed by, ARA-CWT Trust Management (Cache) Limited (as the manager of Cache) (the
“Manager”) or any of its affiliates. An investment in Units is subject to investment risks, including the possible loss of the
principal amount invested.
Investors should note that they will have no right to request the Manager to redeem or purchase their Units for so long as
the Units are listed on Singapore Exchange Securities Trading Limited (the “SGX-ST”). It is intended that holders of Units
may only deal in their Units through trading on the SGX-ST. The listing of the Units on the SGX-ST does not guarantee a
liquid market for the Units.
The past performance of Cache is not necessarily indicative of the future performance of Cache.
36 ENDURING. EVOLVING. GROWING.