Embed Size (px)
Citation preview
1
For more information, go to www.braskem.com.br/ri or contact the IR team:
Luciana Ferreira Roberta Varella Cintia Watai Marina Dalben IR Officer IR Manager IR Specialist IR Analyst
Phone: +55 (11) 3576 9178 Phone: +55 (11) 3576 9266 Phone: +55 (11) 3576 9615 Phone: +55 (11) 3576 9716 [email protected] [email protected] [email protected] [email protected]
2Q09 EBITDA of R$566 million, with EBITDA Margin of 15.3%
Net Income grows to R$1.2 billion in 2Q09 São Paulo, Brazil, August 12, 2009 – BRASKEM S.A. (BOVESPA: BRKM3, BRKM5 and BRKM6; NYSE:
BAK; LATIBEX: XBRK), the leading company in the thermoplastic resins industry in Latin America and third-largest resin producer in the Americas, announces today its results for the second quarter of 2009 (2Q09).
With the merger of Petroquímica Triunfo assets in May 2009, this release is based on pro-forma consolidated
information that includes 100% of the results from this new asset for all periods stated. In accordance with CVM Instruction 247, these figures also consider the proportional consolidation of the interest in Cetrel S.A. -
Empresa de Proteção Ambiental. The quarterly information was reviewed by independent external auditors. On June 30, 2009, the Brazilian real/U.S. dollar exchange rate was R$1.9516/US$1.00.
According to Braskem CEO Bernardo Gradin:
"Braskem operated at full capacity in the 2Q09 in order to meet the Brazilian market growing demand and
the international market gradual recovery. The force of the Brazilian consumption, boosted in food,
construction and consumption goods industries, indicate a positive third quarter. Basic petrochemicals,
mostly aromatics, presented a margin recovery as a result of the restricted supply in Asia. However it is early to affirm that the global economic crisis is completely overcome, as employment and consumption
levels in the USA and Europe have not yet posted significant recovery. The growth announced by China and
other emerging market countries feeds the expectation for resins and petrochemicals prices recovery,
assuming that the new supplies of petrochemicals coming from the Middle East and China will be offset by
iddleness and closing of plants in Europe and the USA. Even so, the downturn cycle is expected to persist until 2011. Although the Real appreciation has already been negatively affecting its operating profitability,
Braskem’s EBITDA1 reached R$566 million with recurring margin of 14% of net revenue. Braskem maintains its commitment of prioritizing its customers’ satisfaction, the productivity of the petrochemical value chain,
its financial health and the sustainable growing profitability. Based on the strengthening of its leadership in Latin America, Braskem is constantly pursuing growth opportunities aimed at increasing profitability in
promising markets”
1. 2Q09 HIGHLIGHTS:
1.1 Higher Sales Volume in all markets and products:
The second quarter faced a recovery in the Brazilian demand for petrochemical products. Domestic resin
sales were 27% higher than in 1Q09, while sales of basic petrochemicals such as BTX (benzene, toluene and xylenes), butadiene and gasoline grew by 47%. Moreover, Braskem registered strong resin export sales,
which reached 271 kton, registering an all-time high for the second quarter in a row. This robust performance
allowed Braskem to maintain its capacity utilization rate above 90% in the period.
1 EBITDA may be defined as earnings before the net financial result, income and social contribution taxes, depreciation, amortization and non-operating income. EBITDA is used by the Company’s management as a measure of performance, but does not represent cash flow for the periods presented and should not be considered a substitute for net income or an indicator of liquidity. The Company believes that in addition to serving as a measure of operating performance, EBITDA allows for comparisons with other companies. Note however that EBITDA is not a measure established in accordance with Brazilian Corporation Law or U.S. Generally Accepted Accounting Principles (US GAAP), and may be defined and calculated differently by other companies.
2
1.2 Net Revenue of R$3.7 billion:
The strong recovery in domestic sales volume and in basic petrochemicals international prices, notably aromatics, supported net revenue growth of 13% against the previous quarter to R$3.7 billion. In dollar
terms and in the same comparison period, net revenue grew by US$368 million.
1.3 2Q09 EBITDA of R$566 million, with EBITDA margin of 15.3%:
Braskem registered EBITDA of R$566 million in 2Q09, with EBITDA margin of 15.3%, 1.3 p.p. higher than 1Q09. The strong recovery in basic petrochemical prices, better domestic sales volume and continued strong
performance of exports supported growth of 24% against the first quarter. Excluding the non-recurring
positive adjustment of R$36.3 million involving the recognition of fines related to supply agreements (take or pay), EBITDA margin in the quarter was 14.2%.
1.4 Net Income grows by R$1.2 billion over 1Q09:
Braskem reported net income of R$1.2 billion in the 2Q09, an increase of R$ 1,146 million in relation to R$ 10
million from 1Q09. In addition to the better operacional performance during the quarter, the devaluation of dollar against the Brazilian Real positively affected the net financial result.
1.5 Net debt in U.S. dollar declines by 5% in relation to 1Q09:
Braskem closed 2Q09 with net debt of US$ 3,764 million, 5% lower than in the previous quarter. The 9%
growth in cash, which closed at R$3.2 billion, contributed for this reduction. In Brazilian reais, net debt
decreased by 20%, mainly due to the dollar depreciation in the period. As revenue and costs are pegged, directly and indirectly, to this currency, Company consideres appropriate the maintenance of a significant
portion of its debt in dollars.
1.6 Braskem raises R$250 million:
At the close of the second quarter, Braskem raised R$250 million through a receivables-backed investment
fund (FIDC) comprising R$227 million in senior shares and R$23 million in subordinated shares. The process
was concluded in early July. The strong demand for senior shares (AAA rating) reduced by 53% the spread over the CDI rate, for final remuneration of CDI + 1.40% p.a. The subordinated Mezzanine shares (BB+
rating), reflecting their higher exposure to potential non-performance in the fund, had final remuneration of
CDI + 7.50% p.a., in line with the underwriting agreement. The weighted cost of the transaction was CDI + 1.85% p.a. This financial transaction contributes to expand the Company’s working capital and to maintain
credit to customers, while underscoring Braskem’s continued capacity to tap a wide variety of credit markets in various different liquidity situations.
1.7 Green Polymer Project moves forward:
Braskem is in the advanced stages of negotiations for the supply of approximately 60% of the ethanol
volume required to operate at full capacity its green ethylene plant (Green PE) at the Triunfo Petrochemical Complex. The new plant will consume 460,000 m3 of ethanol per year. The agreements should come into
force in August 2010, and have average duration of two years. With most of this ethanol feedstock coming
from producers in São Paulo state and a well equipped river terminal, Braskem expects to use barges to transport most of its ethanol needs, reducing road transportation to a minimum.
1.8 Merger of Petroquímica Triunfo:
Petroquímica Triunfo was merged into Braskem in May 2009, as approved by the Extraordinary Shareholders’
Meeting (ESM) of Triunfo on May 5, 2009. This transaction had already been approved by Braskem’s ESM on April 30, 2009. The base-date of the merger of these assets was December 31, 2008, and accordingly all
equity variations in the assets of Petroquímica Triunfo as of January 1, 2009 were incorporated in the Balance
Statement and Income Statement of Braskem. This was another important step towards the Brazilian petrochemical consolidation process through the integration of first and second generation petrochemical
companies, and represented the final step of the integration, as per the Investment Agreement entered into on November 30, 2007 between Braskem, Petróleo Brasileiro S/A – Petrobras, Petrobras Química S/A –
Petroquisa, Odebrecht S/A and Nordeste Química S/A - Norquisa.

3
1.9 Startup of the ETBE Plant in the Camaçari Petrochemical Complex as planned:
The growing demand for biofuels and the intrinsic competitiveness of Brazilian ethanol led Braskem to invest
in the conversion of its MTBE plants for the production of ETBE. The first plant involved was Triunfo, which
began production in late 2007. With the start-up of Camaçari’s plant, the Company adds 210 kton/year of ETBE capacity, leading to a total production of 378 kton/year of this product by Braskem. The project’s total
investment was approximately R$ 100 million. ETBE is used as an additive to gasoline and enjoys a premium
over MTBE of between US$200/t and 300/t, depending on the time of year. Moreover, ETBE helps reduce greenhouse gas emissions by sequestering and capturing 0.8 ton of CO2 per ton of ETBE produced.
1.10 Conservative policy for use of derivative instruments:
With the objective of protecting its cash flow and reducing volatility in the financing of its operational working
capital and investment programs, Braskem adopts market and credit risk management procedures that are aligned with its Financial Management Policy and Risk Management Policy approved by the Board of
Directors. In this context, Braskem holds no target forward operations or operations involving other similar derivatives. With practically 100% of revenue directly or indirectly pegged to the variation in the U.S. dollar
and a large portion of its costs pegged to the same currency as well, the Company believes that maintaining
a significant portion of its debt also in U.S. dollar creates a “natural hedge”. This position is based on the principle that the Company’s debt should always be denominated in the same currency as its cash flow. To
protect cash flow in the short term, Braskem seeks to match the maturities of its dollar-denominated liabilities with its dollar-denominated revenue plus its cash investments in the same currency.
At the close of June 2009, the Company held three derivative transactions for hedging purposes with
maturities, currencies, rates and amounts perfectly adequate for the assets or liabilities protected. Therefore, in a given scenario, any negative or positive adjustments in derivative positions will be offset by positive or
negative adjustments in the protected assets and liabilities.
The main financial indicators in the period are presented below:
Key Indicators Unit 2Q09 (A) 1Q09 (B) 2Q08 (C)Change %
(A/B)
Change %
(A/C)1H09 (D) 1H08 (E)
Change %
(D/E)
Net Revenue R$ million 3,688 3,260 4,628 13 (20) 6,948 9,175 (24)
EBITDA R$ million 566 457 557 24 2 1,023 1,183 (14)
EBITDA Margin % 15.3% 14.0% 12.0% 1.3 p.p. 3.3 p.p. 14.7% 12.9% 1.8 p.p.
Net profit / Loss R$ million 1,156 10 404 12,052 186 1,166 500 133
2. OPERATING PERFORMANCE:
2.1 Quarterly Performance of the Polymers Unit
The second quarter was marked by recovery in international resin prices driven by (i) supply constraints
(operational problems and scheduled maintenance stoppages) outside Brazil; (ii) the impact of higher oil
prices on naphtha prices; and (iii) the rebuilding of inventories in Asia.
In the Brazilian market, demand2 for thermoplastic resins recovered, increasing by 18% in relation to 1Q09.
However, in relation to 2Q08, this demand is still down 5%, most likely reflecting the still-low inventory levels in the production chain. Prices followed the trend in the international market and recovered during the
quarter in U.S. dollar terms, though declining slightly in Brazilian real terms due to the local currency
appreciation.
Braskem's domestic PE and PP sales rose against the first quarter by 16% and 29%, respectively. The
stronger sales volume was driven by: (i) the recovery in domestic demand, reflecting the greater optimism among consumers, and (ii) the lower supply of imports. The solid performance of PP reflects the higher
demand from the automotive and whiteline sectors, which were supported by the federal government's extension of tax incentives. In the case of PE, the good performance of sectors related to consumption, such
2 The measurement of demand was based on the Company’s internal estimates, since Abiquim did not publish 2Q09 data for
thermoplastic resin purchases in the Brazilian market.
4
as food, cosmetics, personal hygiene and cleaning products, fueled a recovery in sales. In relation to 2Q08, PE and PP sales were down by 15% and 6%, respectively.
In the case of PVC, domestic sales followed the stronger domestic demand, posting growth of 55% on the
first quarter. The higher sales volume was led by the recovery in the tubes and fittings segment and by the continued improvement in consumer goods sectors: (i) laminates (e.g. furniture, truck and swimming pool
coverings), (ii) films (e.g., food industry) and (iii) composites (e.g. footwear and yarn and cable). Against 2Q08, PVC domestic sales contracted by 4%. The rebound in domestic sales and the lower supply of imports
led Braskem to recover market share, which stood at 52% in 2Q09.
Despite the recovery in domestic sales volume, Braskem’s resin exports registered solid growth once again, to
271 kton.
Total resin sales volume reached 833 kton, growing by 18% in relation to 1Q09 and by 7% on 2Q08. The recovery in capacity utilization rates led to production volume of 807 kton, up 27% on the prior quarter. In
relation to the same quarter of 2008, resin production volume grew by 23%, since in that quarter two of the basic petrochemical units carried out scheduled maintenance stoppages.
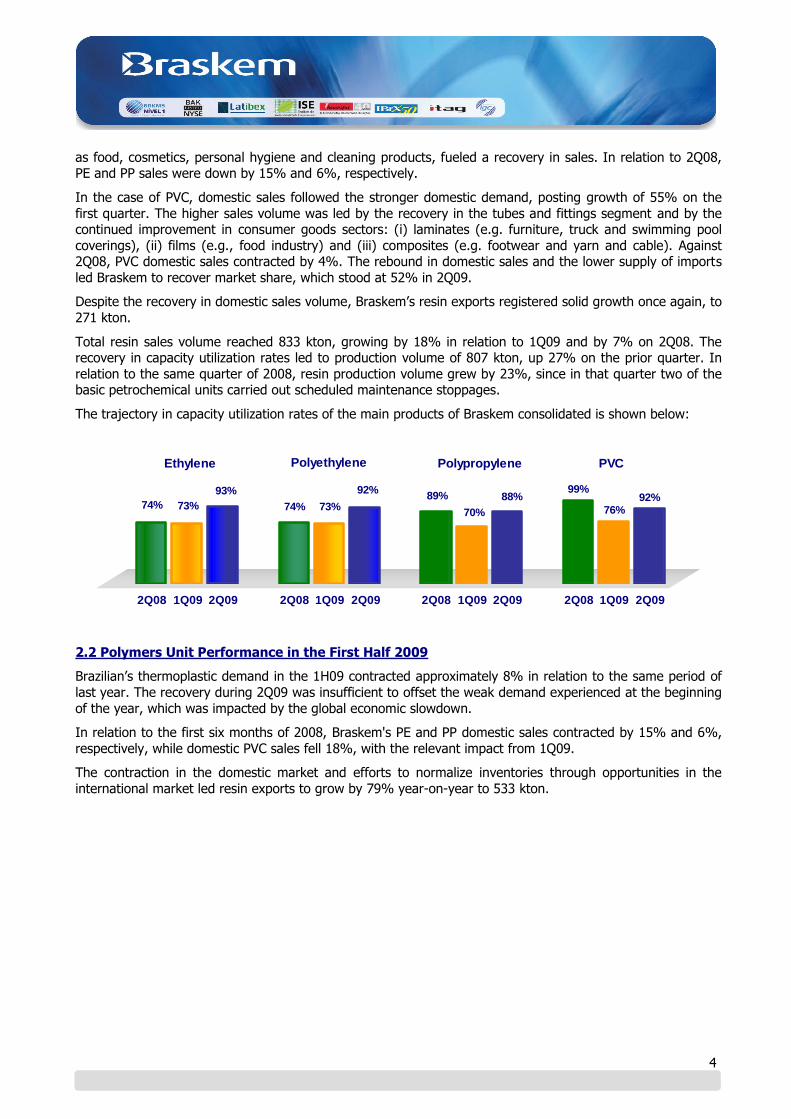
The trajectory in capacity utilization rates of the main products of Braskem consolidated is shown below:
76%92%
99%
74% 73%
93%
74% 73%
92%89%
70%
88%
2Q08 1Q09 2Q09 2Q08 1Q09 2Q09 2Q08 1Q09 2Q09 2Q08 1Q09 2Q09
Polyethylene Polypropylene PVCEthylene
2.2 Polymers Unit Performance in the First Half 2009
Brazilian’s thermoplastic demand in the 1H09 contracted approximately 8% in relation to the same period of
last year. The recovery during 2Q09 was insufficient to offset the weak demand experienced at the beginning
of the year, which was impacted by the global economic slowdown.
In relation to the first six months of 2008, Braskem's PE and PP domestic sales contracted by 15% and 6%,
respectively, while domestic PVC sales fell 18%, with the relevant impact from 1Q09.
The contraction in the domestic market and efforts to normalize inventories through opportunities in the
international market led resin exports to grow by 79% year-on-year to 533 kton.
5
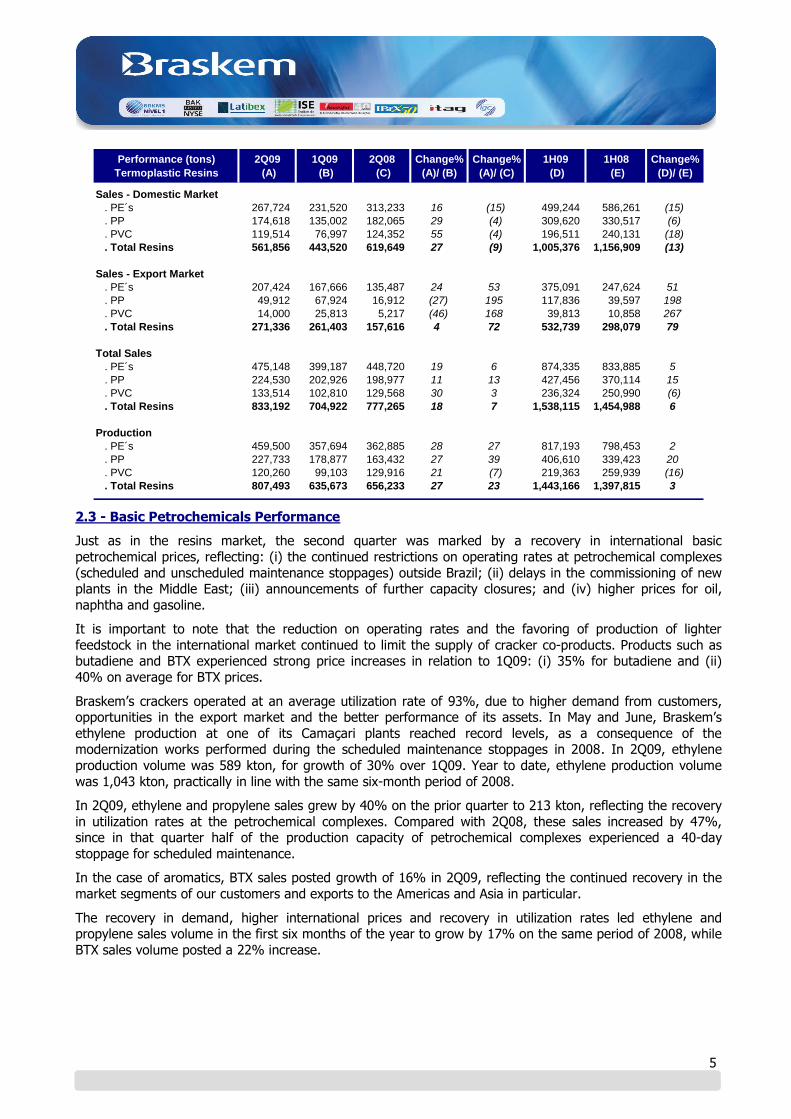
Performance (tons)
Termoplastic Resins
2Q09
(A)
1Q09
(B)
2Q08
(C)
Change%
(A)/ (B)
Change%
(A)/ (C)
1H09
(D)
1H08
(E)
Change%
(D)/ (E)
Sales - Domestic Market
. PE´s 267,724 231,520 313,233 16 (15) 499,244 586,261 (15)
. PP 174,618 135,002 182,065 29 (4) 309,620 330,517 (6)
. PVC 119,514 76,997 124,352 55 (4) 196,511 240,131 (18)
. Total Resins 561,856 443,520 619,649 27 (9) 1,005,376 1,156,909 (13)
Sales - Export Market
. PE´s 207,424 167,666 135,487 24 53 375,091 247,624 51
. PP 49,912 67,924 16,912 (27) 195 117,836 39,597 198
. PVC 14,000 25,813 5,217 (46) 168 39,813 10,858 267
. Total Resins 271,336 261,403 157,616 4 72 532,739 298,079 79
Total Sales
. PE´s 475,148 399,187 448,720 19 6 874,335 833,885 5
. PP 224,530 202,926 198,977 11 13 427,456 370,114 15
. PVC 133,514 102,810 129,568 30 3 236,324 250,990 (6)
. Total Resins 833,192 704,922 777,265 18 7 1,538,115 1,454,988 6
Production
. PE´s 459,500 357,694 362,885 28 27 817,193 798,453 2
. PP 227,733 178,877 163,432 27 39 406,610 339,423 20
. PVC 120,260 99,103 129,916 21 (7) 219,363 259,939 (16)
. Total Resins 807,493 635,673 656,233 27 23 1,443,166 1,397,815 3
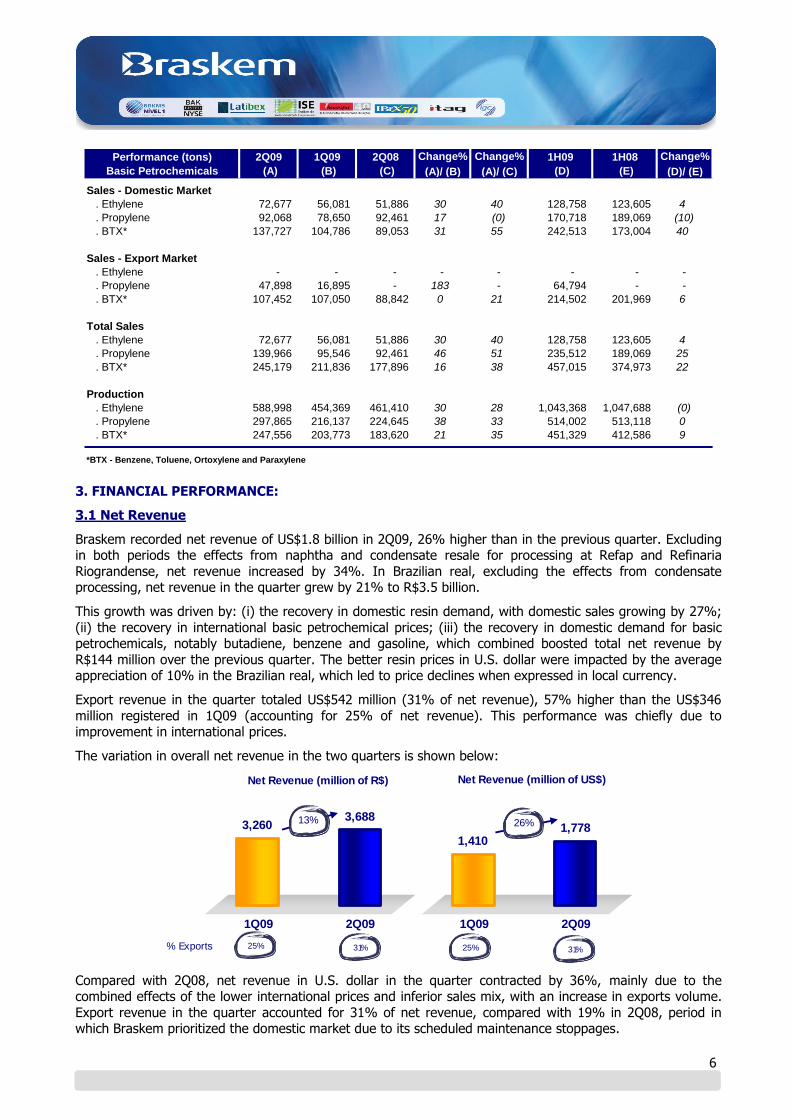
2.3 - Basic Petrochemicals Performance
Just as in the resins market, the second quarter was marked by a recovery in international basic
petrochemical prices, reflecting: (i) the continued restrictions on operating rates at petrochemical complexes
(scheduled and unscheduled maintenance stoppages) outside Brazil; (ii) delays in the commissioning of new plants in the Middle East; (iii) announcements of further capacity closures; and (iv) higher prices for oil,
naphtha and gasoline.
It is important to note that the reduction on operating rates and the favoring of production of lighter
feedstock in the international market continued to limit the supply of cracker co-products. Products such as butadiene and BTX experienced strong price increases in relation to 1Q09: (i) 35% for butadiene and (ii)
40% on average for BTX prices.
Braskem’s crackers operated at an average utilization rate of 93%, due to higher demand from customers, opportunities in the export market and the better performance of its assets. In May and June, Braskem’s
ethylene production at one of its Camaçari plants reached record levels, as a consequence of the modernization works performed during the scheduled maintenance stoppages in 2008. In 2Q09, ethylene
production volume was 589 kton, for growth of 30% over 1Q09. Year to date, ethylene production volume
was 1,043 kton, practically in line with the same six-month period of 2008.
In 2Q09, ethylene and propylene sales grew by 40% on the prior quarter to 213 kton, reflecting the recovery
in utilization rates at the petrochemical complexes. Compared with 2Q08, these sales increased by 47%, since in that quarter half of the production capacity of petrochemical complexes experienced a 40-day
stoppage for scheduled maintenance.
In the case of aromatics, BTX sales posted growth of 16% in 2Q09, reflecting the continued recovery in the
market segments of our customers and exports to the Americas and Asia in particular.
The recovery in demand, higher international prices and recovery in utilization rates led ethylene and propylene sales volume in the first six months of the year to grow by 17% on the same period of 2008, while
BTX sales volume posted a 22% increase.
6
Performance (tons)
Basic Petrochemicals
2Q09
(A)
1Q09
(B)
2Q08
(C)
Change%
(A)/ (B)
Change%
(A)/ (C)
1H09
(D)
1H08
(E)
Change%
(D)/ (E)
Sales - Domestic Market
. Ethylene 72,677 56,081 51,886 30 40 128,758 123,605 4
. Propylene 92,068 78,650 92,461 17 (0) 170,718 189,069 (10)
. BTX* 137,727 104,786 89,053 31 55 242,513 173,004 40
Sales - Export Market
. Ethylene - - - - - - - -
. Propylene 47,898 16,895 - 183 - 64,794 - -
. BTX* 107,452 107,050 88,842 0 21 214,502 201,969 6
Total Sales
. Ethylene 72,677 56,081 51,886 30 40 128,758 123,605 4
. Propylene 139,966 95,546 92,461 46 51 235,512 189,069 25
. BTX* 245,179 211,836 177,896 16 38 457,015 374,973 22
Production
. Ethylene 588,998 454,369 461,410 30 28 1,043,368 1,047,688 (0)
. Propylene 297,865 216,137 224,645 38 33 514,002 513,118 0
. BTX* 247,556 203,773 183,620 21 35 451,329 412,586 9
*BTX - Benzene, Toluene, Ortoxylene and Paraxylene
3. FINANCIAL PERFORMANCE:
3.1 Net Revenue
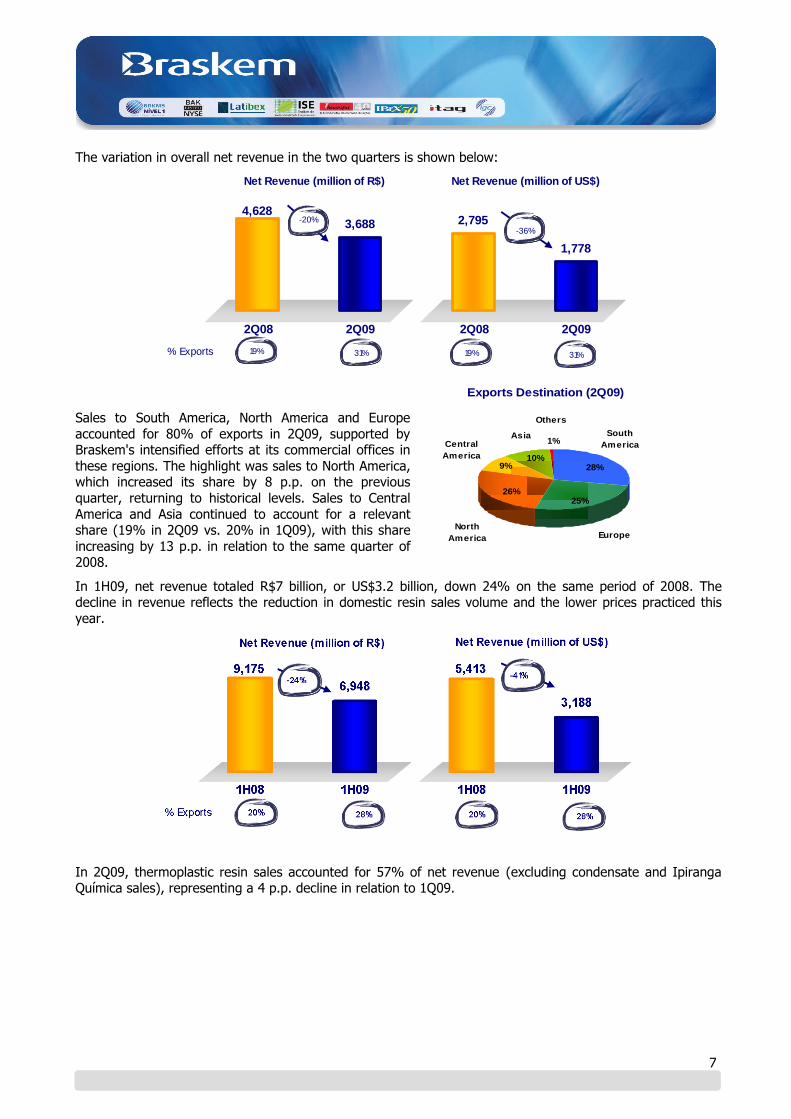
Braskem recorded net revenue of US$1.8 billion in 2Q09, 26% higher than in the previous quarter. Excluding in both periods the effects from naphtha and condensate resale for processing at Refap and Refinaria
Riograndense, net revenue increased by 34%. In Brazilian real, excluding the effects from condensate processing, net revenue in the quarter grew by 21% to R$3.5 billion.
This growth was driven by: (i) the recovery in domestic resin demand, with domestic sales growing by 27%;
(ii) the recovery in international basic petrochemical prices; (iii) the recovery in domestic demand for basic petrochemicals, notably butadiene, benzene and gasoline, which combined boosted total net revenue by
R$144 million over the previous quarter. The better resin prices in U.S. dollar were impacted by the average appreciation of 10% in the Brazilian real, which led to price declines when expressed in local currency.
Export revenue in the quarter totaled US$542 million (31% of net revenue), 57% higher than the US$346
million registered in 1Q09 (accounting for 25% of net revenue). This performance was chiefly due to improvement in international prices.
The variation in overall net revenue in the two quarters is shown below:
3,6883,260
1Q09 2Q09
13%
Net Revenue (million of R$) Net Revenue (million of US$)
1,7781,410
1Q09 2Q09
26%
25%% Exports 31% 25% 31%
Compared with 2Q08, net revenue in U.S. dollar in the quarter contracted by 36%, mainly due to the combined effects of the lower international prices and inferior sales mix, with an increase in exports volume. Export revenue in the quarter accounted for 31% of net revenue, compared with 19% in 2Q08, period in which Braskem prioritized the domestic market due to its scheduled maintenance stoppages.
7
The variation in overall net revenue in the two quarters is shown below:
4,6283,688
2Q08 2Q09
-20%
Net Revenue (million of R$) Net Revenue (million of US$)
2,795
1,778
2Q08 2Q09
-36%
19%% Exports 31% 19% 31%
Sales to South America, North America and Europe
accounted for 80% of exports in 2Q09, supported by Braskem's intensified efforts at its commercial offices in
these regions. The highlight was sales to North America, which increased its share by 8 p.p. on the previous
quarter, returning to historical levels. Sales to Central
America and Asia continued to account for a relevant share (19% in 2Q09 vs. 20% in 1Q09), with this share
increasing by 13 p.p. in relation to the same quarter of 2008.
In 1H09, net revenue totaled R$7 billion, or US$3.2 billion, down 24% on the same period of 2008. The decline in revenue reflects the reduction in domestic resin sales volume and the lower prices practiced this
year.
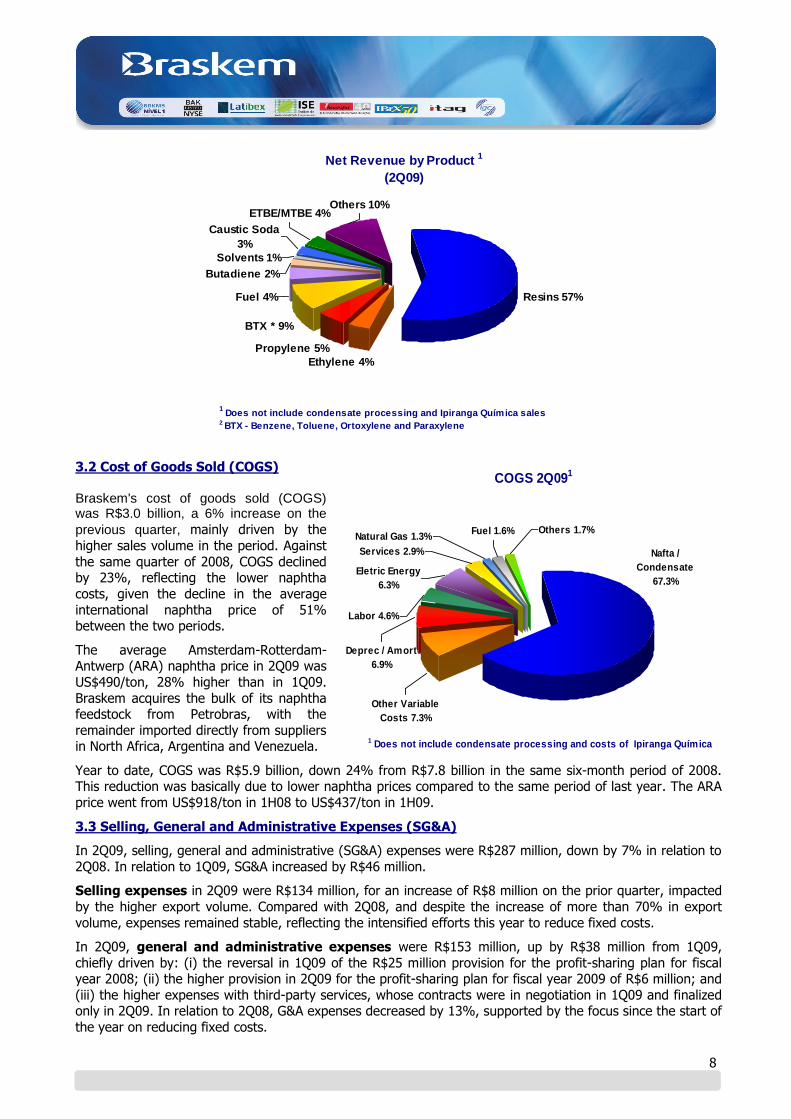
In 2Q09, thermoplastic resin sales accounted for 57% of net revenue (excluding condensate and Ipiranga Química sales), representing a 4 p.p. decline in relation to 1Q09.
1%
10%
26%
9%
25%
28%
North
America
Asia
Others
South
America
Europe
Exports Destination (2Q09)
Central
America
8
BTX * 9%
Others 10%
Propylene 5%
Ethylene 4%
Resins 57%Fuel 4%
Butadiene 2%
Solvents 1%
Caustic Soda
3%
ETBE/MTBE 4%
Net Revenue by Product 1
(2Q09)
1 Does not include condensate processing and Ipiranga Química sales
2 BTX - Benzene, Toluene, Ortoxylene and Paraxylene
3.2 Cost of Goods Sold (COGS)
Braskem's cost of goods sold (COGS) was R$3.0 billion, a 6% increase on the
previous quarter, mainly driven by the
higher sales volume in the period. Against
the same quarter of 2008, COGS declined by 23%, reflecting the lower naphtha
costs, given the decline in the average
international naphtha price of 51% between the two periods.
The average Amsterdam-Rotterdam-Antwerp (ARA) naphtha price in 2Q09 was
US$490/ton, 28% higher than in 1Q09. Braskem acquires the bulk of its naphtha feedstock from Petrobras, with the
remainder imported directly from suppliers in North Africa, Argentina and Venezuela.
Year to date, COGS was R$5.9 billion, down 24% from R$7.8 billion in the same six-month period of 2008. This reduction was basically due to lower naphtha prices compared to the same period of last year. The ARA
price went from US$918/ton in 1H08 to US$437/ton in 1H09.
3.3 Selling, General and Administrative Expenses (SG&A)
In 2Q09, selling, general and administrative (SG&A) expenses were R$287 million, down by 7% in relation to
2Q08. In relation to 1Q09, SG&A increased by R$46 million.
Selling expenses in 2Q09 were R$134 million, for an increase of R$8 million on the prior quarter, impacted
by the higher export volume. Compared with 2Q08, and despite the increase of more than 70% in export
volume, expenses remained stable, reflecting the intensified efforts this year to reduce fixed costs.
In 2Q09, general and administrative expenses were R$153 million, up by R$38 million from 1Q09,
chiefly driven by: (i) the reversal in 1Q09 of the R$25 million provision for the profit-sharing plan for fiscal year 2008; (ii) the higher provision in 2Q09 for the profit-sharing plan for fiscal year 2009 of R$6 million; and
(iii) the higher expenses with third-party services, whose contracts were in negotiation in 1Q09 and finalized only in 2Q09. In relation to 2Q08, G&A expenses decreased by 13%, supported by the focus since the start of
the year on reducing fixed costs.
Nafta /
Condensate
67.3%
Natural Gas 1.3%Fuel 1.6% Others 1.7%
Services 2.9%
Eletric Energy
6.3%
Labor 4.6%
Deprec / Amort
6.9%
Other Variable
Costs 7.3%
COGS 2Q091
1 Does not include condensate processing and costs of Ipiranga Química
sales
9
In the six months to June, SG&A declined by 9%, or R$50 million, in relation to the same period of 2008, reflecting the Company’s commitment to its strategy of maintaining fixed costs and expenses within
parameters that ensure its global competitiveness. Higher sales volume of resins and basic petrochemicals
increased sales expenses in 12% over to the same period of 2008. General and administrative expenses, on the contrary, decreased 23% in the 1H09 compared to 1H08.
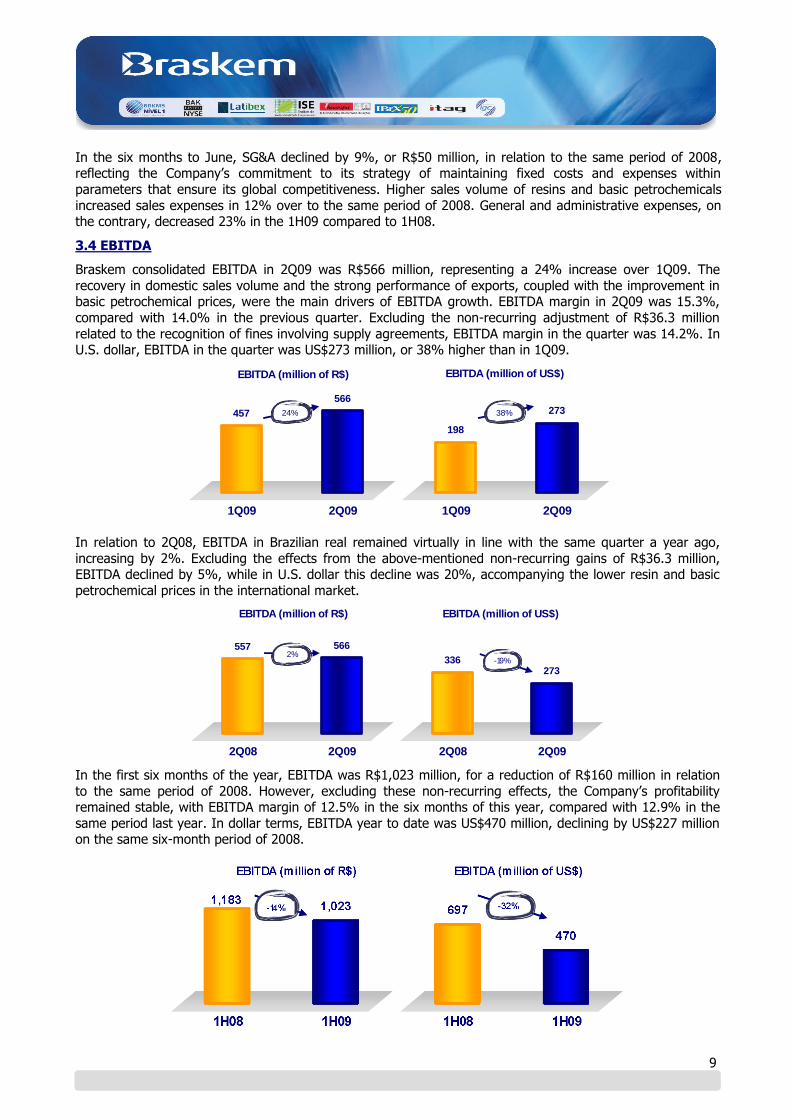
3.4 EBITDA
Braskem consolidated EBITDA in 2Q09 was R$566 million, representing a 24% increase over 1Q09. The
recovery in domestic sales volume and the strong performance of exports, coupled with the improvement in basic petrochemical prices, were the main drivers of EBITDA growth. EBITDA margin in 2Q09 was 15.3%,
compared with 14.0% in the previous quarter. Excluding the non-recurring adjustment of R$36.3 million
related to the recognition of fines involving supply agreements, EBITDA margin in the quarter was 14.2%. In U.S. dollar, EBITDA in the quarter was US$273 million, or 38% higher than in 1Q09.
EBITDA (million of R$) EBITDA (million of US$)
566
457
1Q09 2Q09
24% 273
198
1Q09 2Q09
38%
In relation to 2Q08, EBITDA in Brazilian real remained virtually in line with the same quarter a year ago,
increasing by 2%. Excluding the effects from the above-mentioned non-recurring gains of R$36.3 million, EBITDA declined by 5%, while in U.S. dollar this decline was 20%, accompanying the lower resin and basic
petrochemical prices in the international market.
557 566
2Q08 2Q09
2%
EBITDA (million of R$) EBITDA (million of US$)
336273
2Q08 2Q09
-19%
In the first six months of the year, EBITDA was R$1,023 million, for a reduction of R$160 million in relation
to the same period of 2008. However, excluding these non-recurring effects, the Company’s profitability remained stable, with EBITDA margin of 12.5% in the six months of this year, compared with 12.9% in the
same period last year. In dollar terms, EBITDA year to date was US$470 million, declining by US$227 million on the same six-month period of 2008.
10
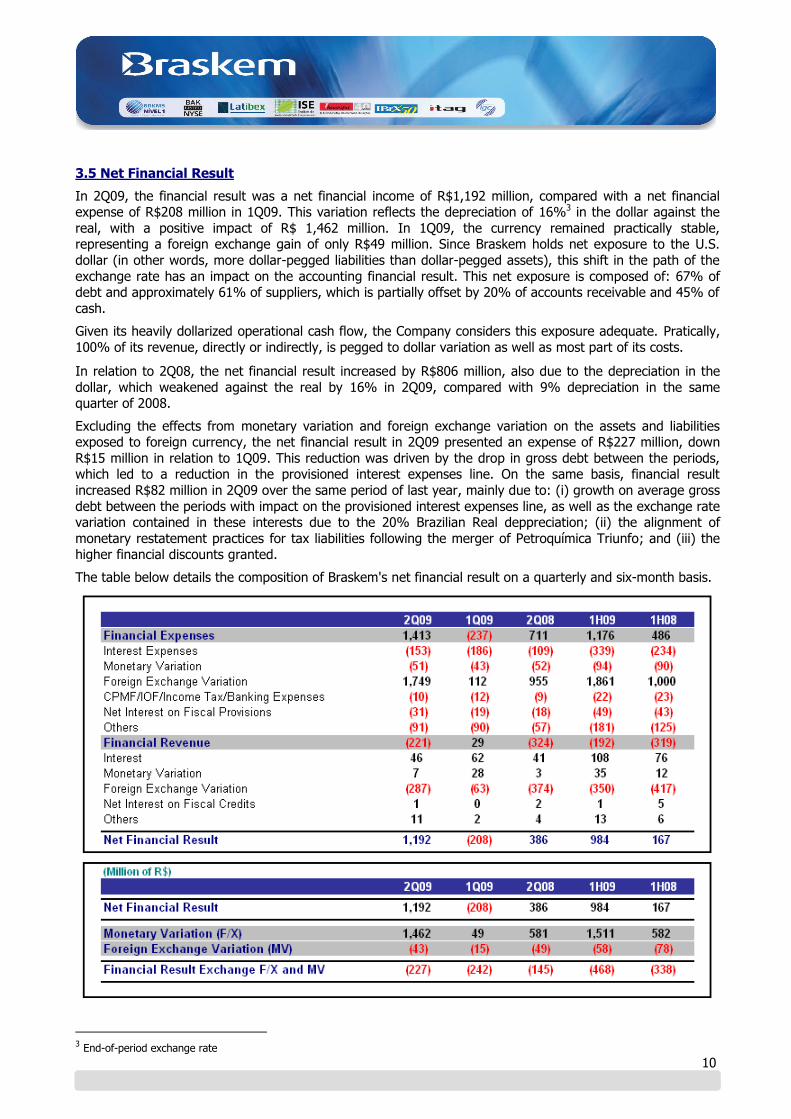
3.5 Net Financial Result
In 2Q09, the financial result was a net financial income of R$1,192 million, compared with a net financial expense of R$208 million in 1Q09. This variation reflects the depreciation of 16%3 in the dollar against the
real, with a positive impact of R$ 1,462 million. In 1Q09, the currency remained practically stable, representing a foreign exchange gain of only R$49 million. Since Braskem holds net exposure to the U.S.
dollar (in other words, more dollar-pegged liabilities than dollar-pegged assets), this shift in the path of the
exchange rate has an impact on the accounting financial result. This net exposure is composed of: 67% of debt and approximately 61% of suppliers, which is partially offset by 20% of accounts receivable and 45% of
cash.
Given its heavily dollarized operational cash flow, the Company considers this exposure adequate. Pratically,
100% of its revenue, directly or indirectly, is pegged to dollar variation as well as most part of its costs.
In relation to 2Q08, the net financial result increased by R$806 million, also due to the depreciation in the
dollar, which weakened against the real by 16% in 2Q09, compared with 9% depreciation in the same quarter of 2008.
Excluding the effects from monetary variation and foreign exchange variation on the assets and liabilities exposed to foreign currency, the net financial result in 2Q09 presented an expense of R$227 million, down
R$15 million in relation to 1Q09. This reduction was driven by the drop in gross debt between the periods, which led to a reduction in the provisioned interest expenses line. On the same basis, financial result
increased R$82 million in 2Q09 over the same period of last year, mainly due to: (i) growth on average gross
debt between the periods with impact on the provisioned interest expenses line, as well as the exchange rate variation contained in these interests due to the 20% Brazilian Real deppreciation; (ii) the alignment of
monetary restatement practices for tax liabilities following the merger of Petroquímica Triunfo; and (iii) the higher financial discounts granted.
The table below details the composition of Braskem's net financial result on a quarterly and six-month basis.
3 End-of-period exchange rate
11
It is important to note that foreign exchange variation has no direct effects on the Company's cash position in the near term. This amount represents foreign exchange accounting effects, especially those on the
Company’s debt, with any expenditure occurring when the debt matures, which has an average term of 10.1
years.
With the objective of protecting its cash flow and reducing volatility in the financing of its working capital and
investment programs, Braskem adopts market and credit risk management procedures in line with its Financial Management Policy and Risk Management Policy. At the close of June 2009, the Company held
three derivative transactions for hedging purposes with maturities, currencies, rates and amounts perfectly adequate for the assets or liabilities protected. Therefore, in any given scenario, negative or positive
adjustments in derivative positions will be offset by positive or negative adjustments in the protected assets
and liabilities.
3.6 Net Income
Braskem reported 2Q09 net income of R$1,156 million, which represented an R$1,146 million increase from
the R$10 million posted in 1Q09. In addition to the better operating performance in the quarter, the
depreciation in the dollar against the real had a positive impact on the net financial result.
In relation to 2Q08, net income increased by R$752 million, once again due to the higher depreciation in the
dollar against the real.
For the same reasons explained above, net income in the six months to June was R$1,166 million, for an
increase of R$666 million on the same period of 2008.
3.7 Free Cash Flow
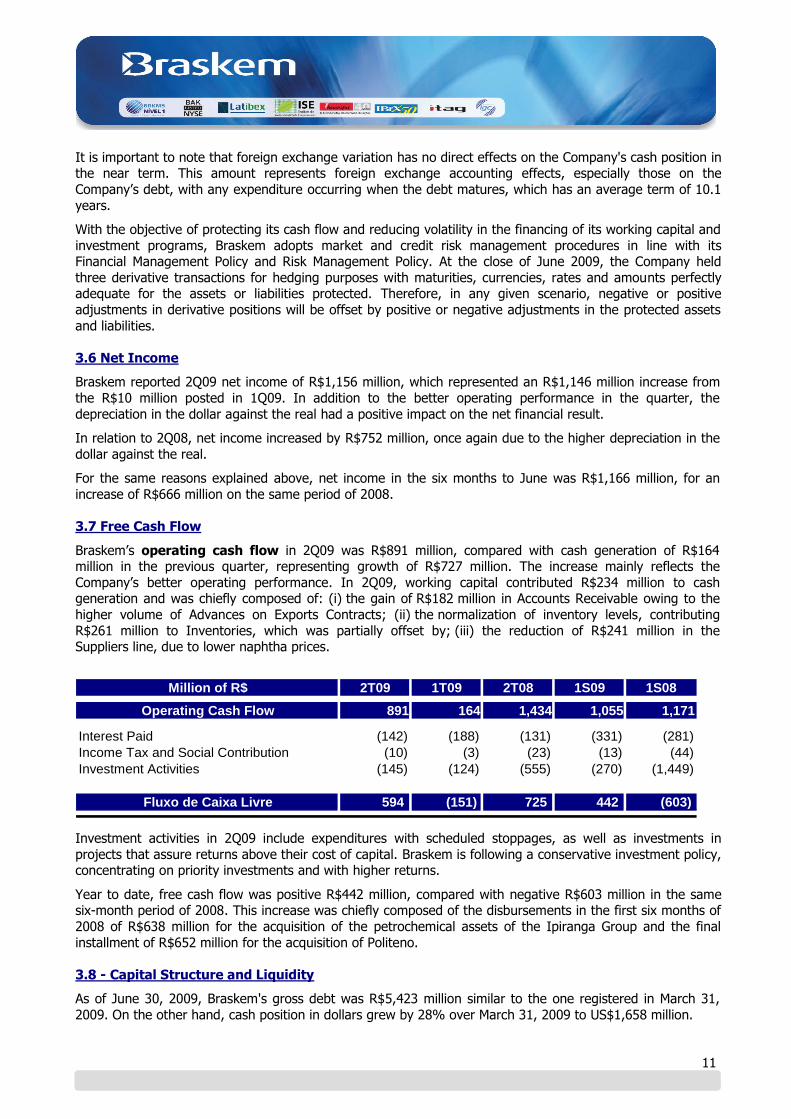
Braskem’s operating cash flow in 2Q09 was R$891 million, compared with cash generation of R$164 million in the previous quarter, representing growth of R$727 million. The increase mainly reflects the
Company’s better operating performance. In 2Q09, working capital contributed R$234 million to cash generation and was chiefly composed of: (i) the gain of R$182 million in Accounts Receivable owing to the
higher volume of Advances on Exports Contracts; (ii) the normalization of inventory levels, contributing
R$261 million to Inventories, which was partially offset by; (iii) the reduction of R$241 million in the Suppliers line, due to lower naphtha prices.
Million of R$ 2T09 1T09 2T08 1S09 1S08
Operating Cash Flow 891 164 1,434 1,055 1,171
Interest Paid (142) (188) (131) (331) (281)
Income Tax and Social Contribution (10) (3) (23) (13) (44)
Investment Activities (145) (124) (555) (270) (1,449)
Fluxo de Caixa Livre 594 (151) 725 442 (603)
Investment activities in 2Q09 include expenditures with scheduled stoppages, as well as investments in
projects that assure returns above their cost of capital. Braskem is following a conservative investment policy, concentrating on priority investments and with higher returns.
Year to date, free cash flow was positive R$442 million, compared with negative R$603 million in the same six-month period of 2008. This increase was chiefly composed of the disbursements in the first six months of
2008 of R$638 million for the acquisition of the petrochemical assets of the Ipiranga Group and the final
installment of R$652 million for the acquisition of Politeno.
3.8 - Capital Structure and Liquidity
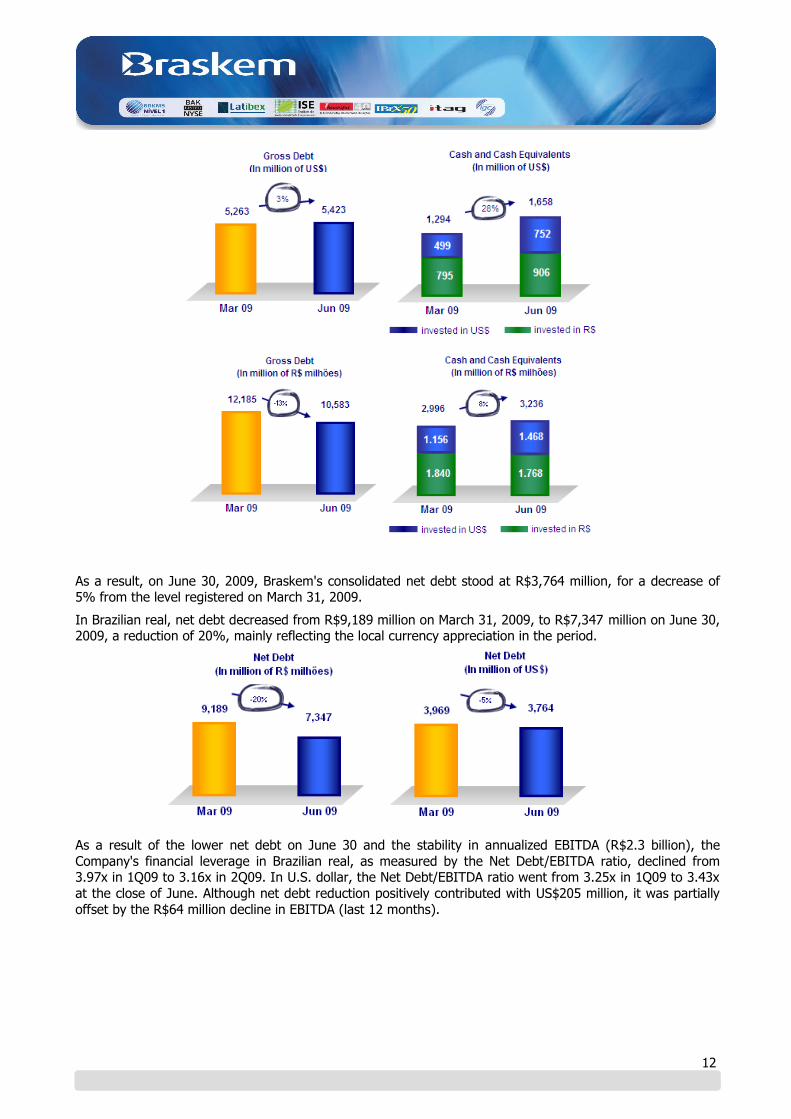
As of June 30, 2009, Braskem's gross debt was R$5,423 million similar to the one registered in March 31,
2009. On the other hand, cash position in dollars grew by 28% over March 31, 2009 to US$1,658 million.
12
As a result, on June 30, 2009, Braskem's consolidated net debt stood at R$3,764 million, for a decrease of 5% from the level registered on March 31, 2009.
In Brazilian real, net debt decreased from R$9,189 million on March 31, 2009, to R$7,347 million on June 30, 2009, a reduction of 20%, mainly reflecting the local currency appreciation in the period.
As a result of the lower net debt on June 30 and the stability in annualized EBITDA (R$2.3 billion), the
Company's financial leverage in Brazilian real, as measured by the Net Debt/EBITDA ratio, declined from 3.97x in 1Q09 to 3.16x in 2Q09. In U.S. dollar, the Net Debt/EBITDA ratio went from 3.25x in 1Q09 to 3.43x
at the close of June. Although net debt reduction positively contributed with US$205 million, it was partially
offset by the R$64 million decline in EBITDA (last 12 months).
13
3,16
3,97
Mar 09 Jun 09
-20%
3,433,25
Mar 09 Jun 09
6%
Net Debt / EBITDA (x) R$ Net Debt / EBITDA (x) US$
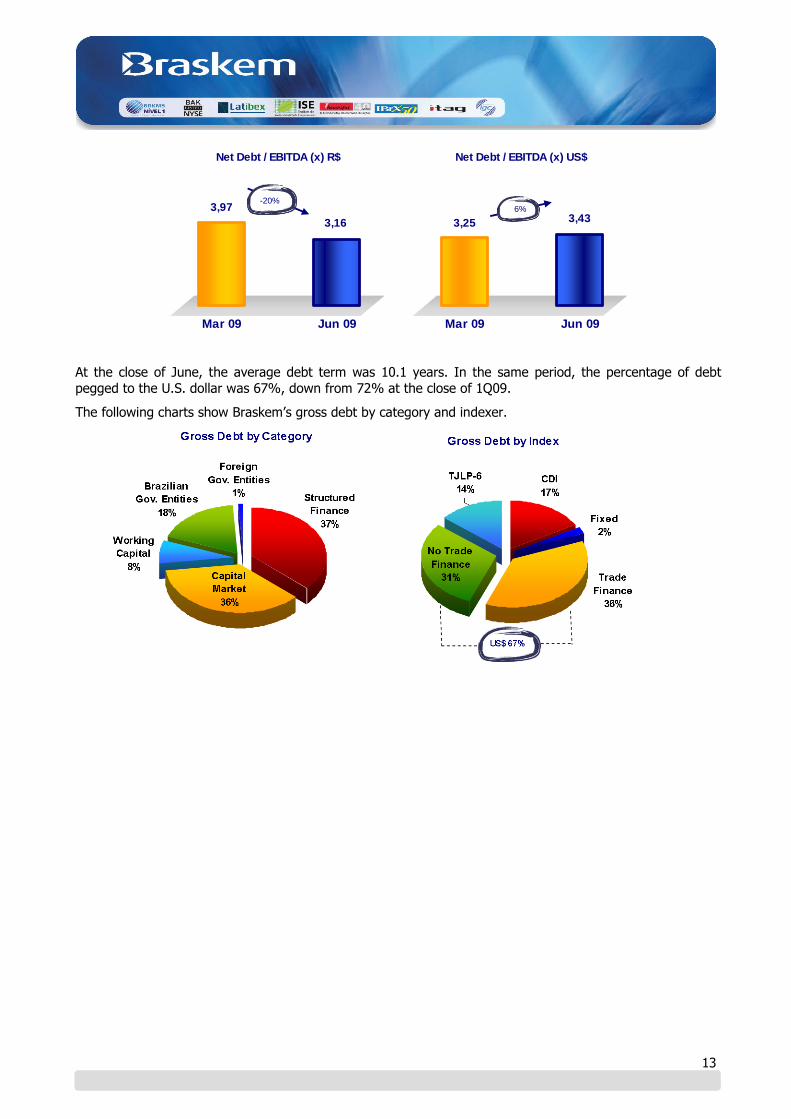
At the close of June, the average debt term was 10.1 years. In the same period, the percentage of debt
pegged to the U.S. dollar was 67%, down from 72% at the close of 1Q09.
The following charts show Braskem’s gross debt by category and indexer.
14
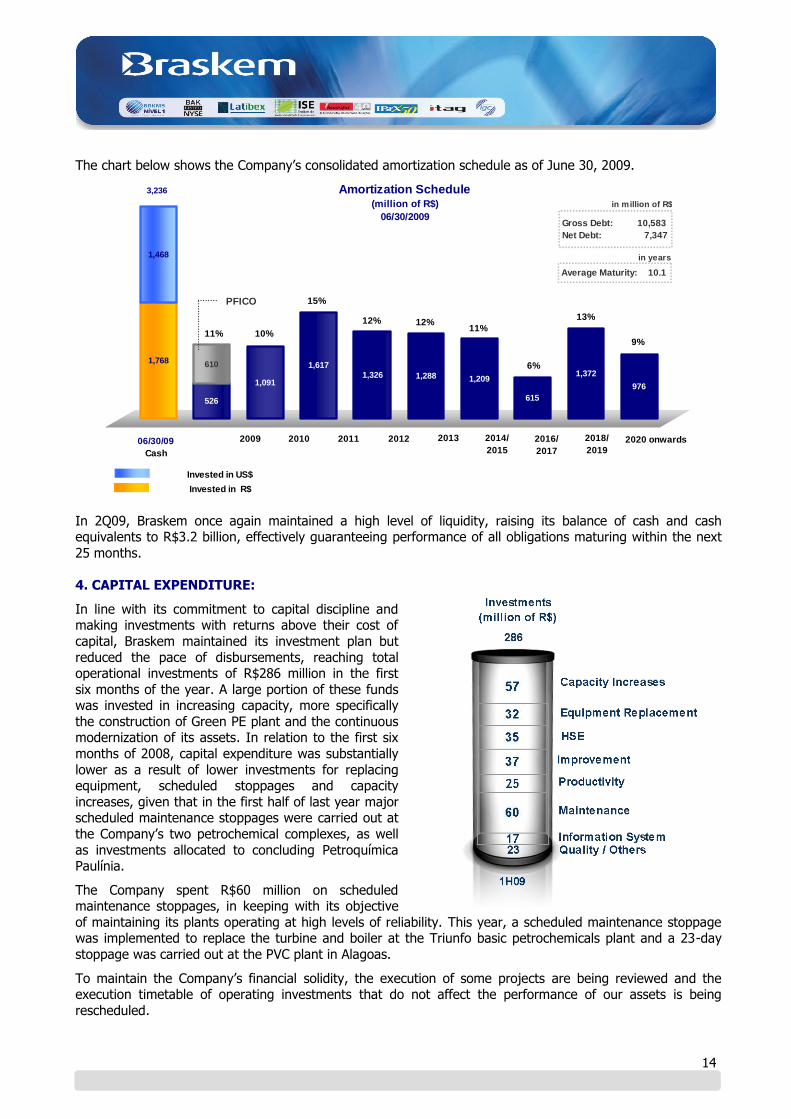
The chart below shows the Company’s consolidated amortization schedule as of June 30, 2009.
526
1,091
1,617
1,326 1,288 1,209
615
1,372
976
1,768 610
1,468
06/30/09
Cash
2009 2010 2011 2012 2013 2014/
2015
2016/
2017
2018/
20192020 onwards
Invested in US$
Invested in R$
PFICO
11% 10%
15%
12% 12%11%
6%
13%
9%
3,236 Amortization Schedule(million of R$)
06/30/2009Gross Debt: 10,583
Net Debt: 7,347
Average Maturity: 10.1
in million of R$
in years
In 2Q09, Braskem once again maintained a high level of liquidity, raising its balance of cash and cash equivalents to R$3.2 billion, effectively guaranteeing performance of all obligations maturing within the next
25 months.
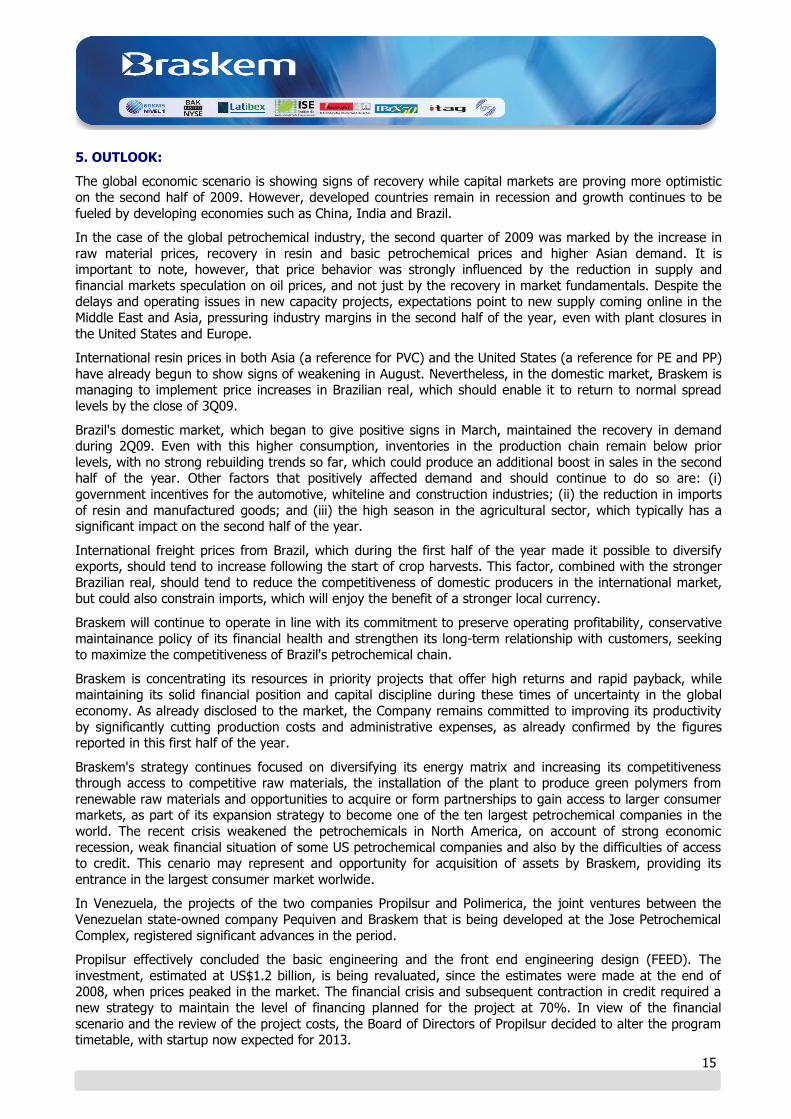
4. CAPITAL EXPENDITURE:
In line with its commitment to capital discipline and making investments with returns above their cost of
capital, Braskem maintained its investment plan but
reduced the pace of disbursements, reaching total operational investments of R$286 million in the first
six months of the year. A large portion of these funds was invested in increasing capacity, more specifically
the construction of Green PE plant and the continuous modernization of its assets. In relation to the first six
months of 2008, capital expenditure was substantially
lower as a result of lower investments for replacing equipment, scheduled stoppages and capacity
increases, given that in the first half of last year major scheduled maintenance stoppages were carried out at
the Company’s two petrochemical complexes, as well
as investments allocated to concluding Petroquímica Paulínia.
The Company spent R$60 million on scheduled maintenance stoppages, in keeping with its objective
of maintaining its plants operating at high levels of reliability. This year, a scheduled maintenance stoppage was implemented to replace the turbine and boiler at the Triunfo basic petrochemicals plant and a 23-day
stoppage was carried out at the PVC plant in Alagoas.
To maintain the Company’s financial solidity, the execution of some projects are being reviewed and the execution timetable of operating investments that do not affect the performance of our assets is being
rescheduled.
15
5. OUTLOOK:
The global economic scenario is showing signs of recovery while capital markets are proving more optimistic
on the second half of 2009. However, developed countries remain in recession and growth continues to be
fueled by developing economies such as China, India and Brazil.
In the case of the global petrochemical industry, the second quarter of 2009 was marked by the increase in
raw material prices, recovery in resin and basic petrochemical prices and higher Asian demand. It is important to note, however, that price behavior was strongly influenced by the reduction in supply and
financial markets speculation on oil prices, and not just by the recovery in market fundamentals. Despite the delays and operating issues in new capacity projects, expectations point to new supply coming online in the
Middle East and Asia, pressuring industry margins in the second half of the year, even with plant closures in
the United States and Europe.
International resin prices in both Asia (a reference for PVC) and the United States (a reference for PE and PP)
have already begun to show signs of weakening in August. Nevertheless, in the domestic market, Braskem is managing to implement price increases in Brazilian real, which should enable it to return to normal spread
levels by the close of 3Q09.
Brazil's domestic market, which began to give positive signs in March, maintained the recovery in demand during 2Q09. Even with this higher consumption, inventories in the production chain remain below prior
levels, with no strong rebuilding trends so far, which could produce an additional boost in sales in the second half of the year. Other factors that positively affected demand and should continue to do so are: (i)
government incentives for the automotive, whiteline and construction industries; (ii) the reduction in imports
of resin and manufactured goods; and (iii) the high season in the agricultural sector, which typically has a significant impact on the second half of the year.
International freight prices from Brazil, which during the first half of the year made it possible to diversify exports, should tend to increase following the start of crop harvests. This factor, combined with the stronger
Brazilian real, should tend to reduce the competitiveness of domestic producers in the international market, but could also constrain imports, which will enjoy the benefit of a stronger local currency.
Braskem will continue to operate in line with its commitment to preserve operating profitability, conservative
maintainance policy of its financial health and strengthen its long-term relationship with customers, seeking to maximize the competitiveness of Brazil's petrochemical chain.
Braskem is concentrating its resources in priority projects that offer high returns and rapid payback, while maintaining its solid financial position and capital discipline during these times of uncertainty in the global
economy. As already disclosed to the market, the Company remains committed to improving its productivity
by significantly cutting production costs and administrative expenses, as already confirmed by the figures reported in this first half of the year.
Braskem's strategy continues focused on diversifying its energy matrix and increasing its competitiveness through access to competitive raw materials, the installation of the plant to produce green polymers from
renewable raw materials and opportunities to acquire or form partnerships to gain access to larger consumer markets, as part of its expansion strategy to become one of the ten largest petrochemical companies in the
world. The recent crisis weakened the petrochemicals in North America, on account of strong economic
recession, weak financial situation of some US petrochemical companies and also by the difficulties of access to credit. This cenario may represent and opportunity for acquisition of assets by Braskem, providing its
entrance in the largest consumer market worlwide.
In Venezuela, the projects of the two companies Propilsur and Polimerica, the joint ventures between the
Venezuelan state-owned company Pequiven and Braskem that is being developed at the Jose Petrochemical
Complex, registered significant advances in the period.
Propilsur effectively concluded the basic engineering and the front end engineering design (FEED). The
investment, estimated at US$1.2 billion, is being revaluated, since the estimates were made at the end of 2008, when prices peaked in the market. The financial crisis and subsequent contraction in credit required a
new strategy to maintain the level of financing planned for the project at 70%. In view of the financial
scenario and the review of the project costs, the Board of Directors of Propilsur decided to alter the program timetable, with startup now expected for 2013.
16
Polimerica signed technology license agreements for each of the three polyethylene plants (PE), which will produce 400 kton/year of high-density polyethylene (HDPE), 300 kton/year of low-density polyethylene
(LDPE) and 430 kton/year of linear low-density polyethylene (LLDPE). In addition, Polimerica concluded
evaluations of the technical and economic proposals for the construction of an ethylene plant with capacity of 1,300 kton/year. Construction of the plants is scheduled to begin in 2011 and operational startup is expected
in 2014. Investment is projected at US$3.25 billion.
Regarding developments in Peru, Braskem, Petrobras and PetroPerú concluded studies for the technical and
economic pre-feasibility phase of a petrochemical project to be installed in that country, within the scope of the agreement signed in May 2008. The preliminary evaluations indicated the feasibility of an integrated
project to produce 700 kton to 1,200 kton of polyethylene using the natural gas available in Peru as
feedstock. The companies are moving forward in the negotiations to renew the agreement, which will enable more in-depth technical and economic evaluations of the project. The implementation of this project could
give Braskem a position in the largest integrated complex on the Pacific coast, which is fully aligned with the company's strategy of expanding internationally and growing and consolidating its operations in the region.
The construction of the Green Ethylene plant, which was approved by the Board of Directors in December
2008, is advancing as planned, in accordance with the installation timetable. Braskem is currently in the final phase of negotiations for the supply of approximately 60% of the ethanol volume required for operating at
full green ethylene (Green PE) production capacity at the Triunfo Petrochemical Complex, assuring the plant's startup by the end of 2010.
Management remains confident and committed to making Braskem a leading global petrochemical company.
In this time marked by crisis and a low in the economic cycle, Brazil remains one of the best-positioned countries, presenting robust economic fundamentals and financial solidity to face the global economic crisis.
The Company’s management maintains its commitment to sustainable growth, acting proactively and strategically in pursuit of better opportunities, seeking to create value for shareholders and increase
competitiveness throughout the entire petrochemical and plastics production chain.
6. EXHIBITS LIST Page
EXHIBIT I – Consolidated Income Statement 17
EXHIBIT II – Consolidated Balance Sheet 18
EXHIBIT III – Consolidated Cash Flow Statement 19
EXHIBIT IV – Consolidated Production Volume 20
EXHIBIT V – Consolidated Sales Volume – Domestic Market 21
EXHIBIT VI – Consolidated Sales Volume – Export Market 22
EXHIBIT VII - Consolidated Net Revenues 23
Braskem, a world-class Brazilian petrochemical company, is the leader in the thermoplastic resins segment in Latin America and the third-largest Brazilian industrial company owned by the private sector. The company operates 18
industrial plants across Brazil and has annual production capacity of 11 million tons of chemical and petrochemical products.
DISCLAIMER
This press release contains forward-looking statements. These forward-looking statements are not historical data, but rather reflect the targets and expectations of Braskem’s management. Words such as "anticipate", "wish", "expect", "foresee", "intend", "plan", "predict", "project", "aim" and similar terms seek to identify
statements that necessarily involve known and unknown risks. Braskem does not undertake any responsibility for transactions or investment decisions based on the information contained in this document.
17
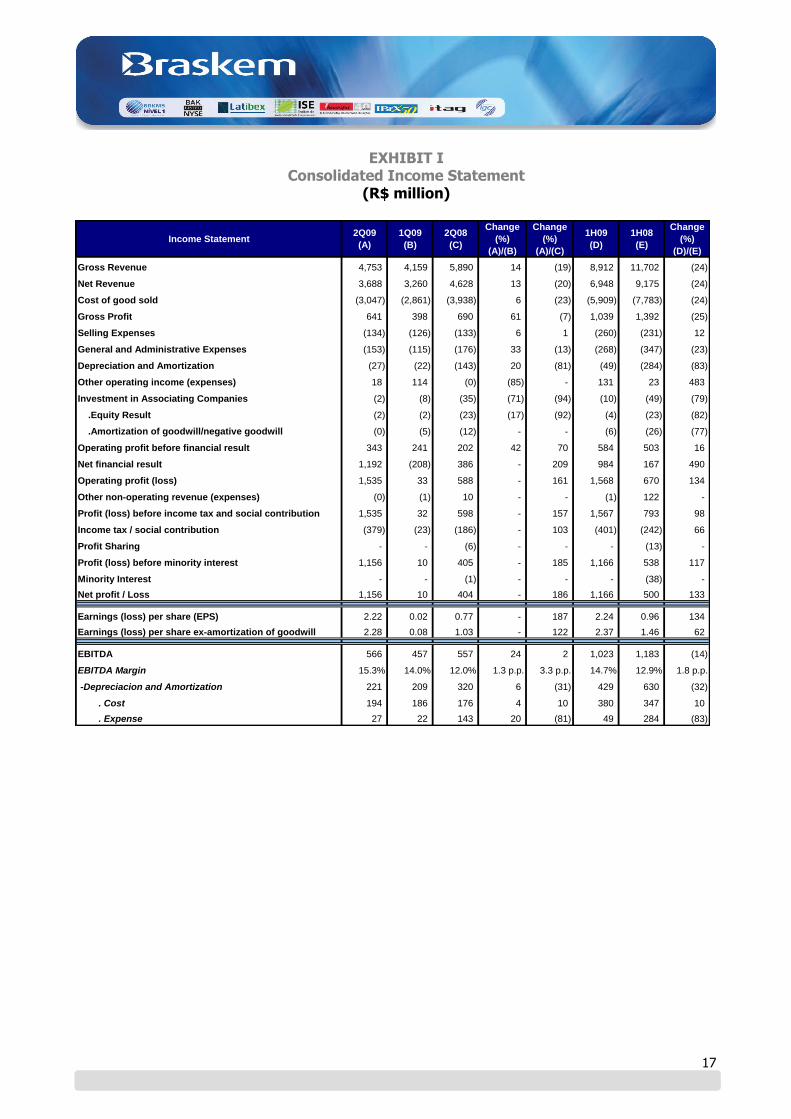
EXHIBIT I Consolidated Income Statement
(R$ million)
Income Statement2Q09
(A)
1Q09
(B)
2Q08
(C)
Change
(%)
(A)/(B)
Change
(%)
(A)/(C)
1H09
(D)
1H08
(E)
Change
(%)
(D)/(E)
Gross Revenue 4,753 4,159 5,890 14 (19) 8,912 11,702 (24)
Net Revenue 3,688 3,260 4,628 13 (20) 6,948 9,175 (24)
Cost of good sold (3,047) (2,861) (3,938) 6 (23) (5,909) (7,783) (24)
Gross Profit 641 398 690 61 (7) 1,039 1,392 (25)
Selling Expenses (134) (126) (133) 6 1 (260) (231) 12
General and Administrative Expenses (153) (115) (176) 33 (13) (268) (347) (23)
Depreciation and Amortization (27) (22) (143) 20 (81) (49) (284) (83)
Other operating income (expenses) 18 114 (0) (85) - 131 23 483
Investment in Associating Companies (2) (8) (35) (71) (94) (10) (49) (79)
.Equity Result (2) (2) (23) (17) (92) (4) (23) (82)
.Amortization of goodwill/negative goodwill (0) (5) (12) - - (6) (26) (77)
Operating profit before financial result 343 241 202 42 70 584 503 16
Net financial result 1,192 (208) 386 - 209 984 167 490
Operating profit (loss) 1,535 33 588 - 161 1,568 670 134
Other non-operating revenue (expenses) (0) (1) 10 - - (1) 122 -
Profit (loss) before income tax and social contribution 1,535 32 598 - 157 1,567 793 98
Income tax / social contribution (379) (23) (186) - 103 (401) (242) 66
Profit Sharing - - (6) - - - (13) -
Profit (loss) before minority interest 1,156 10 405 - 185 1,166 538 117
Minority Interest - - (1) - - - (38) -
Net profit / Loss 1,156 10 404 - 186 1,166 500 133
Earnings (loss) per share (EPS) 2.22 0.02 0.77 - 187 2.24 0.96 134
Earnings (loss) per share ex-amortization of goodwill 2.28 0.08 1.03 - 122 2.37 1.46 62
EBITDA 566 457 557 24 2 1,023 1,183 (14)
EBITDA Margin 15.3% 14.0% 12.0% 1.3 p.p. 3.3 p.p. 14.7% 12.9% 1.8 p.p.
-Depreciacion and Amortization 221 209 320 6 (31) 429 630 (32)
. Cost 194 186 176 4 10 380 347 10
. Expense 27 22 143 20 (81) 49 284 (83)

18
EXHIBIT II Consolidated Balance Sheet
(R$ million)
ASSETS06/30/2009
(A)
03/31/2009
(B)
Change (%)
(A)/(B)
Current 7,141 7,434 (4)
. Cash and Cash Equivalents 3,225 2,986 8
. Accounts Receivable 1,236 1,427 (13)
. Inventories 2,032 2,300 (12)
. Recoverable Taxes 405 432 (6)
. Advances to Suppliers 52 78 (33)
. Others 191 210 (9)
Non Current 15,086 15,154
. Long-Term Assets
. Related Parties 58 47 23
. Compulsory Deposits and Escrow accounts 136 125 9
. Deferred income tax and social contribution 637 643 (1)
. Recoverable Taxes 1,418 1,461 (3)
. Others 180 147 23
.Investments 38 37 3
.Plant, property and equipment 12,520 12,591 (1)
.Deferred 98 102 (4)
Total Assets 22,227 22,588 (2)
Current 6,551 7,012 (7)
. Suppliers 4,181 4,421 (5)
. Short-term financing 1,851 2,030 (9)
. Hedge Operations 42 - -
. Salaries and social charges 173 221 (22)
. Dividends/Interest on Owners' Equity 4 15 (72)
. Receivable Taxes 115 103 12
. Advances from Clients 57 90 (36)
. Others 128 132 (3)
Non Current 10,678 11,788
Long-Term Liabilities
. Long-term financing 8,732 10,155 (14)
. Hedge Transactions 36 114 (68)
. Taxes Payable 1,657 1,271 30
. Others 254 248 2
Shareholders' Equity 4,998 3,789 32
. Capital 5,473 5,473 -
. Capital Reserves 429 429 -
. Treasury Shares (12) (12) -
. Adjustment of Asset Evaluation (Law 11.638/07) (57) (109) (47)
. Retained Earnings (Losses) (834) (1,992) (58)
Total Liabilities and Shareholders' Equity 22,227 22,588 (2)
06/30/2009
(A)
Change (%)
(A)/(B)
03/31/2009
(B)LIABILITIES AND SHAREHOLDERS' EQUITY
19
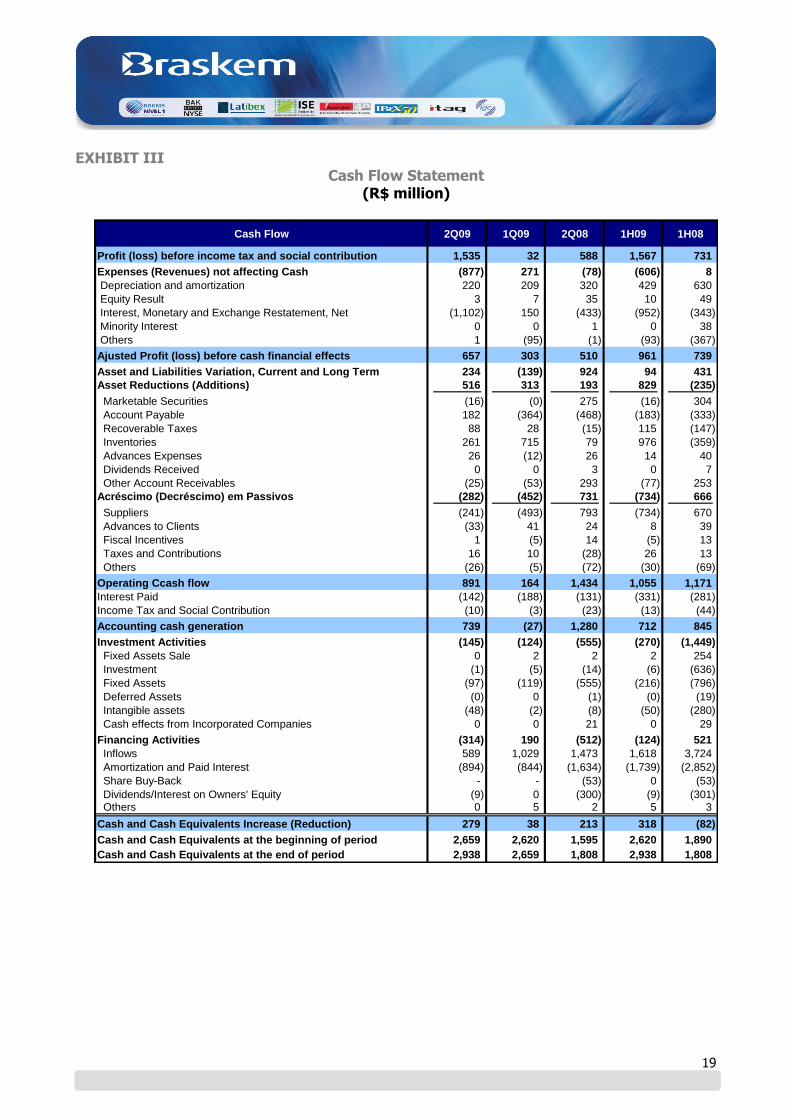
EXHIBIT III Cash Flow Statement
(R$ million)
Cash Flow 2Q09 1Q09 2Q08 1H09 1H08
Profit (loss) before income tax and social contribution 1,535 32 588 1,567 731
Expenses (Revenues) not affecting Cash (877) 271 (78) (606) 8
Depreciation and amortization 220 209 320 429 630
Equity Result 3 7 35 10 49
Interest, Monetary and Exchange Restatement, Net (1,102) 150 (433) (952) (343)
Minority Interest 0 0 1 0 38
Others 1 (95) (1) (93) (367)
Ajusted Profit (loss) before cash financial effects 657 303 510 961 739
Asset and Liabilities Variation, Current and Long Term 234 (139) 924 94 431
Asset Reductions (Additions) 516 313 193 829 (235)
Marketable Securities (16) (0) 275 (16) 304
Account Payable 182 (364) (468) (183) (333)
Recoverable Taxes 88 28 (15) 115 (147)
Inventories 261 715 79 976 (359)
Advances Expenses 26 (12) 26 14 40
Dividends Received 0 0 3 0 7
Other Account Receivables (25) (53) 293 (77) 253
Acréscimo (Decréscimo) em Passivos (282) (452) 731 (734) 666
Suppliers (241) (493) 793 (734) 670
Advances to Clients (33) 41 24 8 39
Fiscal Incentives 1 (5) 14 (5) 13
Taxes and Contributions 16 10 (28) 26 13
Others (26) (5) (72) (30) (69)
Operating Ccash flow 891 164 1,434 1,055 1,171
Interest Paid (142) (188) (131) (331) (281)
Income Tax and Social Contribution (10) (3) (23) (13) (44)
Accounting cash generation 739 (27) 1,280 712 845
Investment Activities (145) (124) (555) (270) (1,449)
Fixed Assets Sale 0 2 2 2 254
Investment (1) (5) (14) (6) (636)
Fixed Assets (97) (119) (555) (216) (796)
Deferred Assets (0) 0 (1) (0) (19)
Intangible assets (48) (2) (8) (50) (280)
Cash effects from Incorporated Companies 0 0 21 0 29
Financing Activities (314) 190 (512) (124) 521
Inflows 589 1,029 1,473 1,618 3,724
Amortization and Paid Interest (894) (844) (1,634) (1,739) (2,852)
Share Buy-Back - - (53) 0 (53)
Dividends/Interest on Owners' Equity (9) 0 (300) (9) (301) Others 0 5 2 5 3
Cash and Cash Equivalents Increase (Reduction) 279 38 213 318 (82)
Cash and Cash Equivalents at the beginning of period 2,659 2,620 1,595 2,620 1,890
Cash and Cash Equivalents at the end of period 2,938 2,659 1,808 2,938 1,808
20
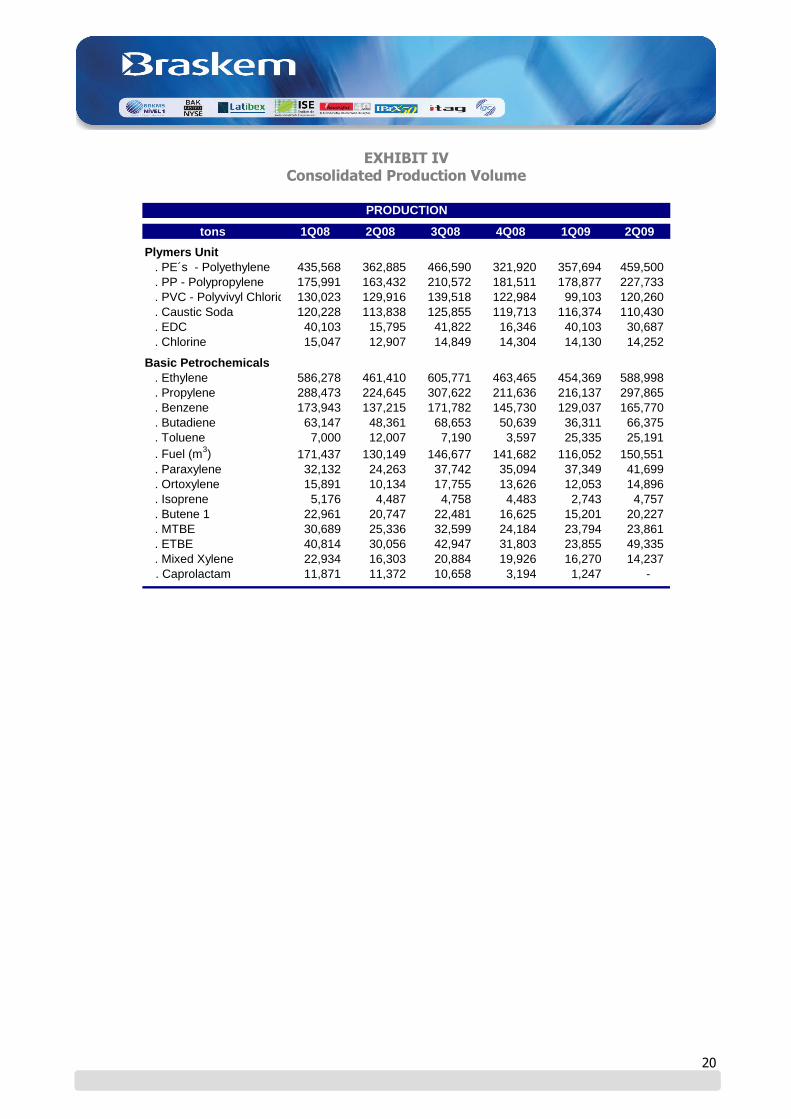
EXHIBIT IV Consolidated Production Volume
tons 1Q08 2Q08 3Q08 4Q08 1Q09 2Q09
Plymers Unit
. PE´s - Polyethylene 435,568 362,885 466,590 321,920 357,694 459,500
. PP - Polypropylene 175,991 163,432 210,572 181,511 178,877 227,733
. PVC - Polyvivyl Chloride 130,023 129,916 139,518 122,984 99,103 120,260
. Caustic Soda 120,228 113,838 125,855 119,713 116,374 110,430
. EDC 40,103 15,795 41,822 16,346 40,103 30,687
. Chlorine 15,047 12,907 14,849 14,304 14,130 14,252 - - - - - -
Basic Petrochemicals
. Ethylene 586,278 461,410 605,771 463,465 454,369 588,998
. Propylene 288,473 224,645 307,622 211,636 216,137 297,865
. Benzene 173,943 137,215 171,782 145,730 129,037 165,770
. Butadiene 63,147 48,361 68,653 50,639 36,311 66,375
. Toluene 7,000 12,007 7,190 3,597 25,335 25,191
. Fuel (m3) 171,437 130,149 146,677 141,682 116,052 150,551
. Paraxylene 32,132 24,263 37,742 35,094 37,349 41,699
. Ortoxylene 15,891 10,134 17,755 13,626 12,053 14,896
. Isoprene 5,176 4,487 4,758 4,483 2,743 4,757
. Butene 1 22,961 20,747 22,481 16,625 15,201 20,227
. MTBE 30,689 25,336 32,599 24,184 23,794 23,861
. ETBE 40,814 30,056 42,947 31,803 23,855 49,335
. Mixed Xylene 22,934 16,303 20,884 19,926 16,270 14,237
. Caprolactam 11,871 11,372 10,658 3,194 1,247 -
PRODUCTION

21
EXHIBIT V Consolidated Sales Volume
Domestic Market
tons 1Q08 2Q08 3Q08 4Q08 1Q09 2Q09
Polymers Unit
. PE´s - Polyethylene 273,028 313,233 271,981 225,490 231,520 267,724
. PP - Polypropylene 148,452 182,065 172,316 140,038 135,002 174,618
. PVC - Polyvivyl Chloride 115,780 124,352 141,888 114,247 76,997 119,514
. PET 9,851 10,418 11,624 11,997 11,745 6,280
. Caustic Soda 107,999 124,947 116,908 111,861 96,027 91,914
. EDC 15,084 12,093 7,044 - - -
. Chlorine 14,800 13,139 14,879 15,015 12,636 12,145
Basic Petrochemicals Unit
. Ethylene 71,719 51,886 67,655 61,242 56,081 72,677
. Propylene 96,608 92,461 102,819 57,124 78,650 92,068
. Benzene 57,595 67,534 63,553 50,730 74,780 105,316
. Butadiene 55,641 45,075 55,395 47,534 13,583 45,543
. Toluene 9,371 10,629 10,583 6,004 16,092 16,512
. Fuel (m3) 134,747 125,790 112,931 129,237 105,435 145,619
. Paraxylene - - - - - -
. Ortoxylene 16,985 10,891 16,984 11,429 13,913 15,899
. Isoprene 2,949 2,166 3,278 2,970 1,611 2,200
. Butene 1 6,771 5,380 7,209 367 2,208 1,456
. MTBE 33 11 33 49 - 80
. ETBE 23 - - - - -
. Mixed Xylene 13,354 11,313 10,213 12,133 10,422 8,730
. Caprolactam 3,870 4,508 4,919 3,104 2,788 3,139
DOMESTIC MARKET - Sales Volume
22
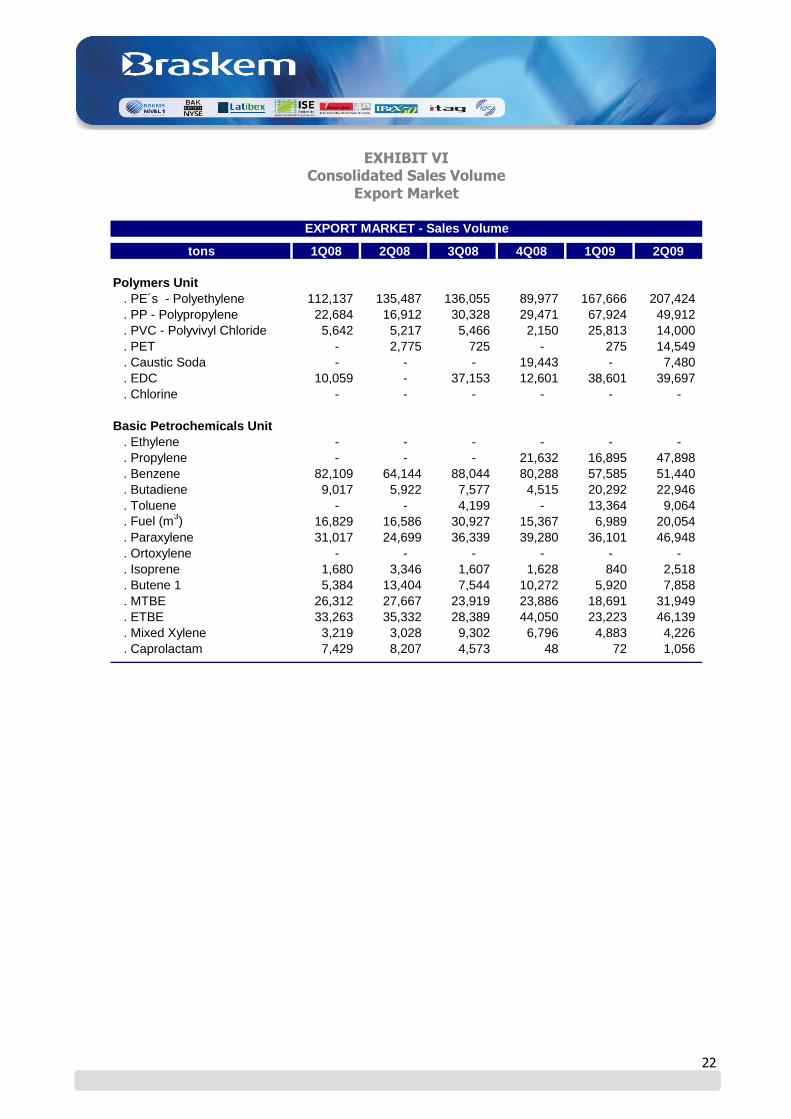
EXHIBIT VI Consolidated Sales Volume
Export Market
tons 1Q08 2Q08 3Q08 4Q08 1Q09 2Q09
Polymers Unit
. PE´s - Polyethylene 112,137 135,487 136,055 89,977 167,666 207,424
. PP - Polypropylene 22,684 16,912 30,328 29,471 67,924 49,912
. PVC - Polyvivyl Chloride 5,642 5,217 5,466 2,150 25,813 14,000
. PET - 2,775 725 - 275 14,549
. Caustic Soda - - - 19,443 - 7,480
. EDC 10,059 - 37,153 12,601 38,601 39,697
. Chlorine - - - - - -
Basic Petrochemicals Unit
. Ethylene - - - - - -
. Propylene - - - 21,632 16,895 47,898
. Benzene 82,109 64,144 88,044 80,288 57,585 51,440
. Butadiene 9,017 5,922 7,577 4,515 20,292 22,946
. Toluene - - 4,199 - 13,364 9,064
. Fuel (m3) 16,829 16,586 30,927 15,367 6,989 20,054
. Paraxylene 31,017 24,699 36,339 39,280 36,101 46,948
. Ortoxylene - - - - - -
. Isoprene 1,680 3,346 1,607 1,628 840 2,518
. Butene 1 5,384 13,404 7,544 10,272 5,920 7,858
. MTBE 26,312 27,667 23,919 23,886 18,691 31,949
. ETBE 33,263 35,332 28,389 44,050 23,223 46,139
. Mixed Xylene 3,219 3,028 9,302 6,796 4,883 4,226
. Caprolactam 7,429 8,207 4,573 48 72 1,056
EXPORT MARKET - Sales Volume
23
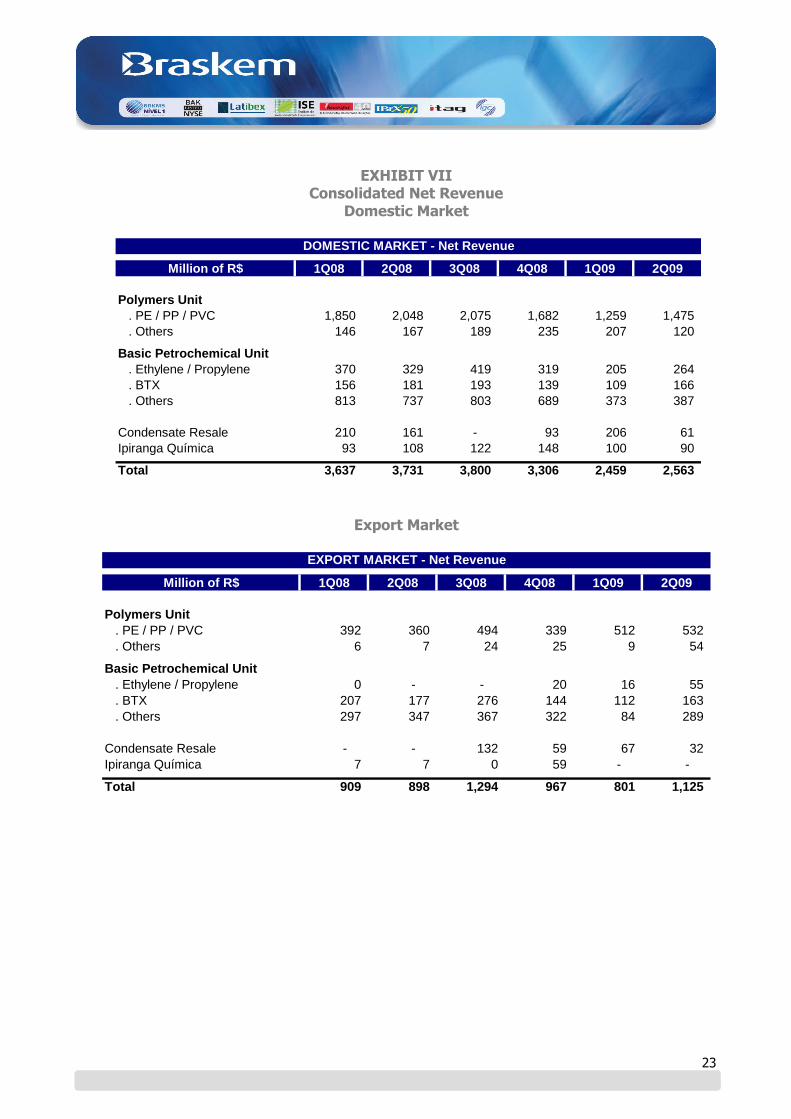
EXHIBIT VII
Consolidated Net Revenue Domestic Market
Million of R$ 1Q08 2Q08 3Q08 4Q08 1Q09 2Q09
Polymers Unit
. PE / PP / PVC 1,850 2,048 2,075 1,682 1,259 1,475
. Others 146 167 189 235 207 120 - - - - - -
Basic Petrochemical Unit
. Ethylene / Propylene 370 329 419 319 205 264
. BTX 156 181 193 139 109 166
. Others 813 737 803 689 373 387
Condensate Resale 210 161 - 93 206 61
Ipiranga Química 93 108 122 148 100 90
Total 3,637 3,731 3,800 3,306 2,459 2,563
DOMESTIC MARKET - Net Revenue
Export Market
Million of R$ 1Q08 2Q08 3Q08 4Q08 1Q09 2Q09
Polymers Unit
. PE / PP / PVC 392 360 494 339 512 532
. Others 6 7 24 25 9 54 - - - - - -
Basic Petrochemical Unit
. Ethylene / Propylene 0 - - 20 16 55
. BTX 207 177 276 144 112 163
. Others 297 347 367 322 84 289
Condensate Resale - - 132 59 67 32
Ipiranga Química 7 7 0 59 - -
Total 909 898 1,294 967 801 1,125
EXPORT MARKET - Net Revenue