Embed Size (px)
Citation preview
Deutsche Bank
Deutsche Bank2Q2014 results
29 July 2014
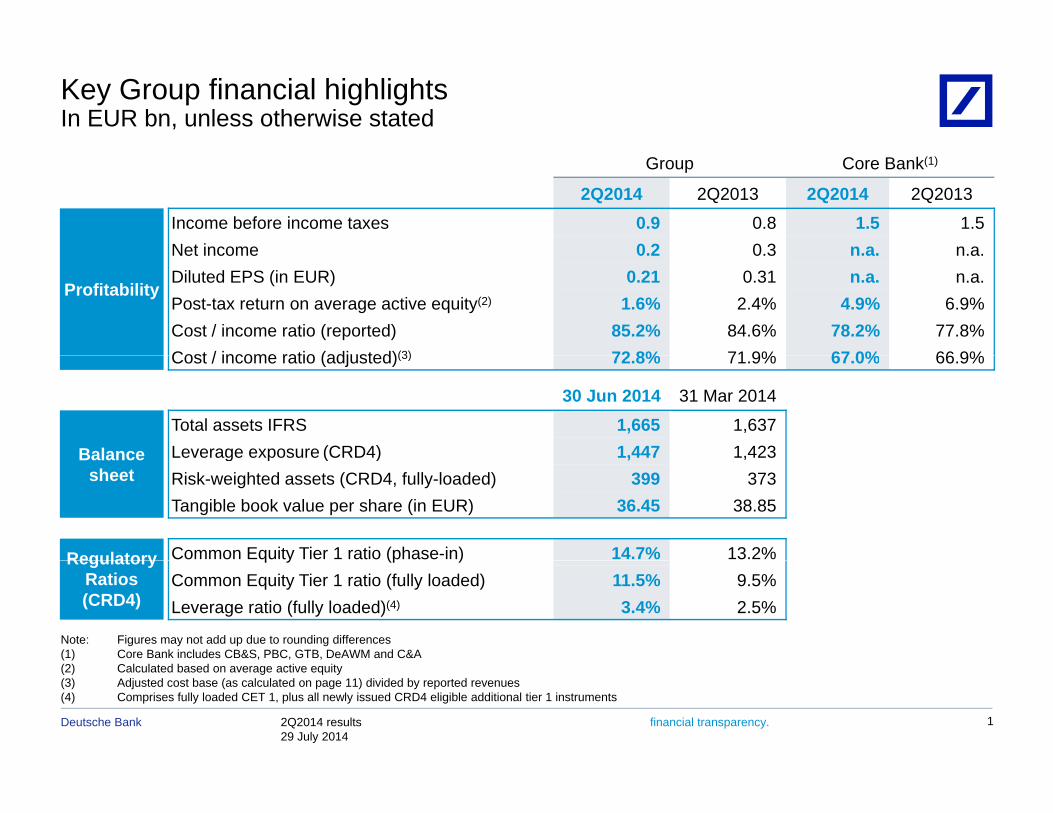
Key Group financial highlightsIn EUR bn, unless otherwise stated
Group Core Bank(1)
2Q2014 2Q2013 2Q2014 2Q2013
Income before income taxes 0.9 0.8 1.5 1.5Net income 0 2 0 3 n a n a
Profitability
Net income 0.2 0.3 n.a. n.a.Diluted EPS (in EUR) 0.21 0.31 n.a. n.a.Post-tax return on average active equity(2) 1.6% 2.4% 4.9% 6.9%Cost / income ratio (reported) 85.2% 84.6% 78.2% 77.8%Cost / income ratio (adjusted)(3) 72 8% 71 9% 67 0% 66 9%Cost / income ratio (adjusted)(3) 72.8% 71.9% 67.0% 66.9%
30 Jun 2014 31 Mar 2014
BalanceTotal assets IFRS 1,665 1,637Leverage exposure (CRD4) 1,447 1,423Balance
sheetg p ( ) , ,
Risk-weighted assets (CRD4, fully-loaded) 399 373Tangible book value per share (in EUR) 36.45 38.85
Regulatory Common Equity Tier 1 ratio (phase-in) 14.7% 13.2%RegulatoryRatios (CRD4)
q y (p )Common Equity Tier 1 ratio (fully loaded) 11.5% 9.5%Leverage ratio (fully loaded)(4) 3.4% 2.5%
Note: Figures may not add up due to rounding differences(1) Core Bank includes CB&S, PBC, GTB, DeAWM and C&A
2Q2014 results29 July 2014
Deutsche Bank financial transparency. 1
(2) Calculated based on average active equity (3) Adjusted cost base (as calculated on page 11) divided by reported revenues(4) Comprises fully loaded CET 1, plus all newly issued CRD4 eligible additional tier 1 instruments
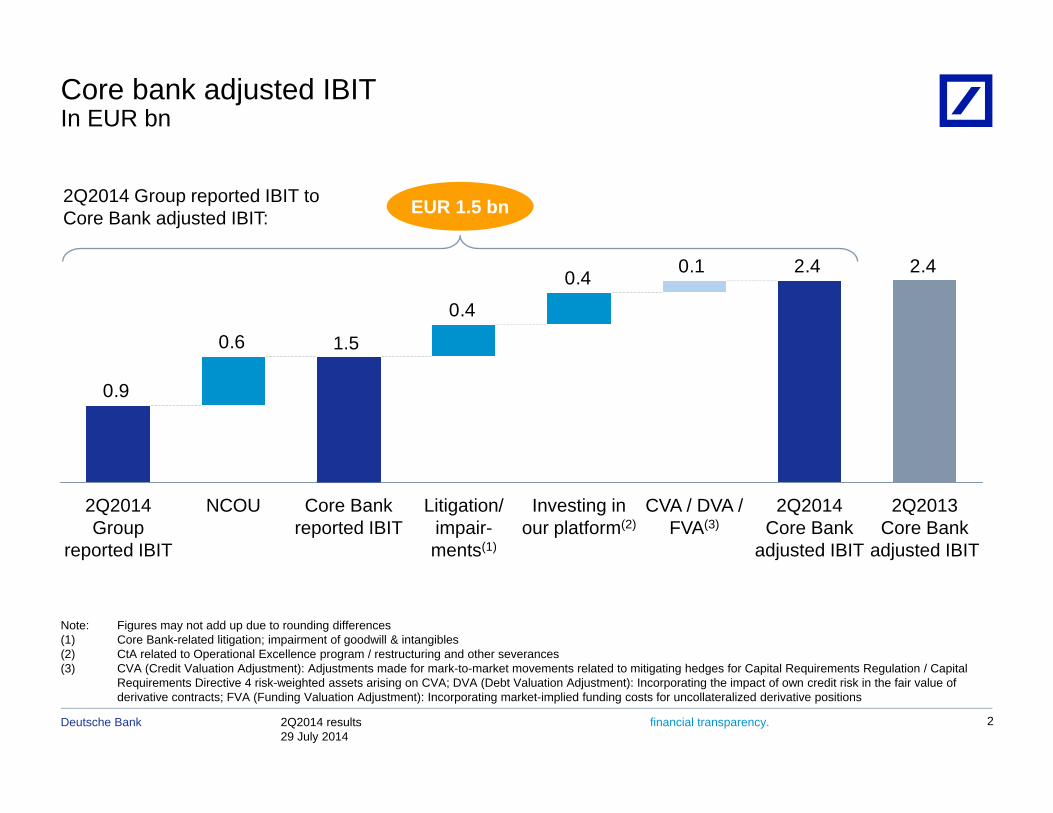
Core bank adjusted IBITIn EUR bn
EUR 1.5 bn2Q2014 Group reported IBIT toCore Bank adjusted IBIT:
2.4 2.4 0.1 0.4
0.4
0.6 1.5
0.9
2Q2013 Core Bank
adjusted IBIT
2Q2014 Core Bank
adjusted IBIT
CVA / DVA /FVA(3)
Investing in our platform(2)
Litigation/ impair-ments(1)
Core Bank reported IBIT
NCOU2Q2014 Group
reported IBIT
Note: Figures may not add up due to rounding differences(1) Core Bank-related litigation; impairment of goodwill & intangibles(2) CtA related to Operational Excellence program / restructuring and other severances
2Q2014 results29 July 2014
Deutsche Bank financial transparency. 2
(3) CVA (Credit Valuation Adjustment): Adjustments made for mark-to-market movements related to mitigating hedges for Capital Requirements Regulation / Capital Requirements Directive 4 risk-weighted assets arising on CVA; DVA (Debt Valuation Adjustment): Incorporating the impact of own credit risk in the fair value of derivative contracts; FVA (Funding Valuation Adjustment): Incorporating market-implied funding costs for uncollateralized derivative positions
Agenda
1 Key current themes1 Key current themes
1.1 Capital
1.2 Leverage
1 3 Litigation
2 Group results
1.3 Litigation
3 Segment results
2Q2014 results29 July 2014
Deutsche Bank financial transparency. 3
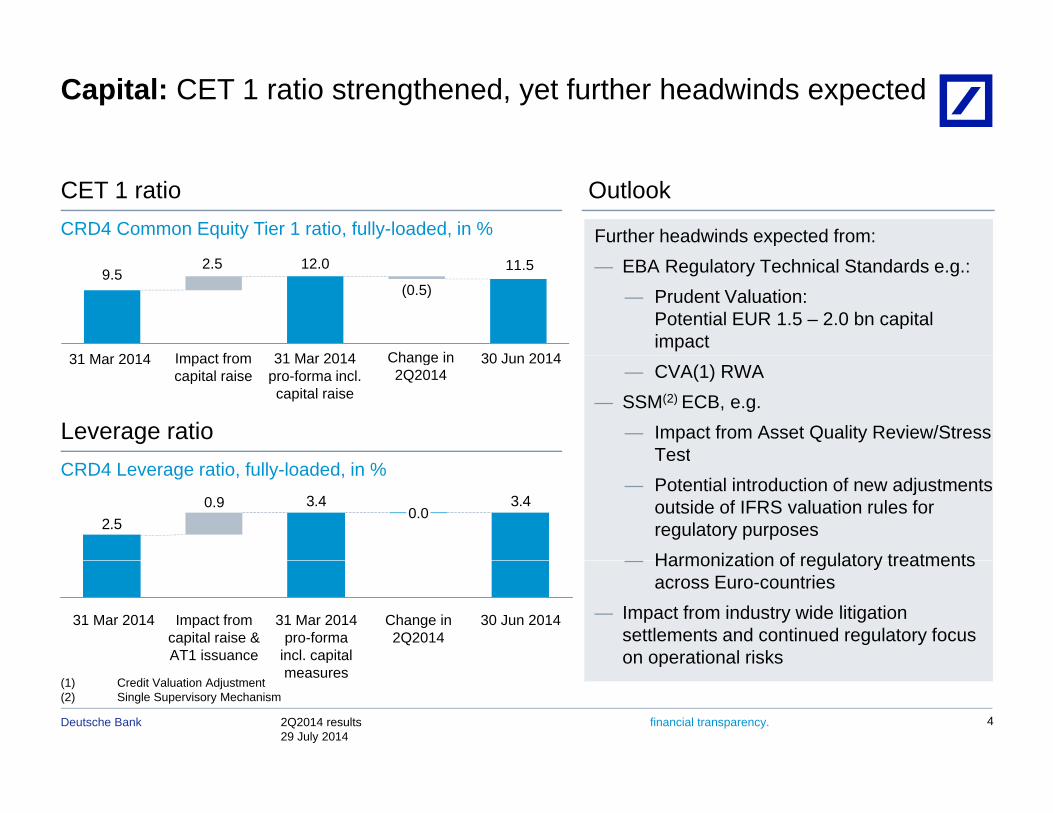
Capital: CET 1 ratio strengthened, yet further headwinds expected
CET 1 ratioCRD4 Common Equity Tier 1 ratio, fully-loaded, in %
Outlook
Further headwinds expected from:
9.52.5 12.0
(0.5)
11.5
31 M 2014 I t f 31 M 2014 30 J 2014Change in
— EBA Regulatory Technical Standards e.g.:— Prudent Valuation:
Potential EUR 1.5 – 2.0 bn capital impact
31 Mar 2014 Impact from capital raise
31 Mar 2014pro-forma incl. capital raise
30 Jun 2014Change in 2Q2014
Leverage ratio
— CVA(1) RWA— SSM(2) ECB, e.g.
— Impact from Asset Quality Review/Stress Test
CRD4 Leverage ratio, fully-loaded, in %3.43.4
2.50.0
Test— Potential introduction of new adjustments
outside of IFRS valuation rules for regulatory purposesHarmonization of regulatory treatments
0.9
Change in 2Q2014
30 Jun 201431 Mar 2014 pro-forma
incl. capital
Impact from capital raise & AT1 issuance
31 Mar 2014
— Harmonization of regulatory treatments across Euro-countries
— Impact from industry wide litigation settlements and continued regulatory focus on operational risks
2Q2014 results29 July 2014
Deutsche Bank financial transparency. 4
(1) Credit Valuation Adjustment(2) Single Supervisory Mechanism
measureson operational risks
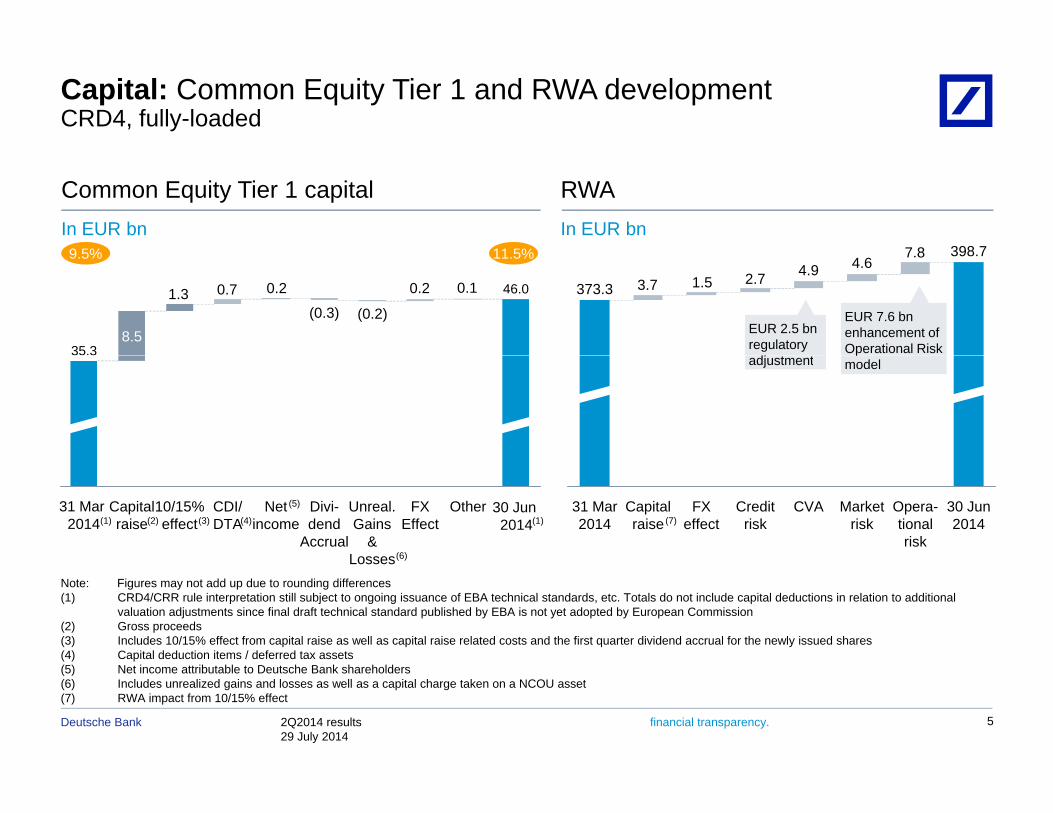
Capital: Common Equity Tier 1 and RWA development CRD4, fully-loaded
7 8
RWAIn EUR bn
Common Equity Tier 1 capitalIn EUR bn
398 711 5%9 5%
1.3 0.7 0.2
(0.3) (0.2)
0.2 0.1 3.7 1.5 2.7 4.9 4.67.8 398.7
373.3
EUR 7.6 bnenhancement ofOperational Risk
8.535.3
46.0
11.5%9.5%
EUR 2.5 bnregulatory
djp
modeladjustment
31 Mar 2014
30 Jun 2014
Opera-tionalrisk
Market risk
CVACredit risk
FX effect
Capital raise
31 Mar 2014(1)
OtherFX Effect
Unreal. Gains
& Losses
Divi-dend
Accrual
Net income
CDI/ DTA
10/15% effect
Capital raise (7)(2)
30 Jun 2014
(5)
(4)(3)
(6)
(1)
Note: Figures may not add up due to rounding differences(1) CRD4/CRR rule interpretation still subject to ongoing issuance of EBA technical standards, etc. Totals do not include capital deductions in relation to additional
valuation adjustments since final draft technical standard published by EBA is not yet adopted by European Commission(2) Gross proceeds(3) Includes 10/15% effect from capital raise as well as capital raise related costs and the first quarter dividend accrual for the newly issued shares(4) Capital deduction items / deferred tax assets
Losses( )
2Q2014 results29 July 2014
Deutsche Bank financial transparency.
(5) Net income attributable to Deutsche Bank shareholders(6) Includes unrealized gains and losses as well as a capital charge taken on a NCOU asset(7) RWA impact from 10/15% effect
5
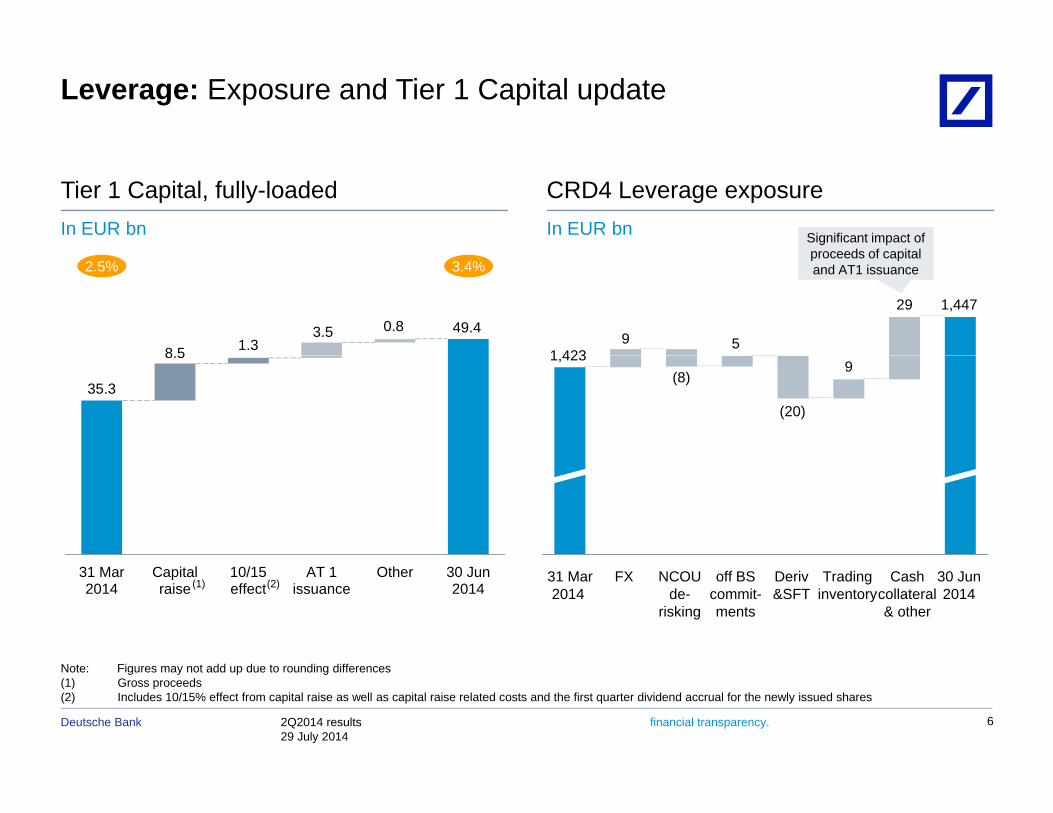
Leverage: Exposure and Tier 1 Capital update
Tier 1 Capital, fully-loadedIn EUR bn
CRD4 Leverage exposureIn EUR bn Significant impact of
proceeds of capital
8 5 1.33.5 0.8 49.4
9
1,447
51 423
proceeds of capital and AT1 issuance 3.4%2.5%
29
48.6
35.3
8.59
(20)
(8)1,423
31 Mar 2014
Capital raise
10/15 effect
AT 1 issuance
Other 30 Jun 2014
30 Jun2014
Cash collateral & other
Trading inventory
Deriv&SFT
off BS commit-ments
NCOU de-
risking
FX31 Mar2014
(2)(1)
2Q2014 results29 July 2014
Deutsche Bank financial transparency. 6
Note: Figures may not add up due to rounding differences(1) Gross proceeds(2) Includes 10/15% effect from capital raise as well as capital raise related costs and the first quarter dividend accrual for the newly issued shares
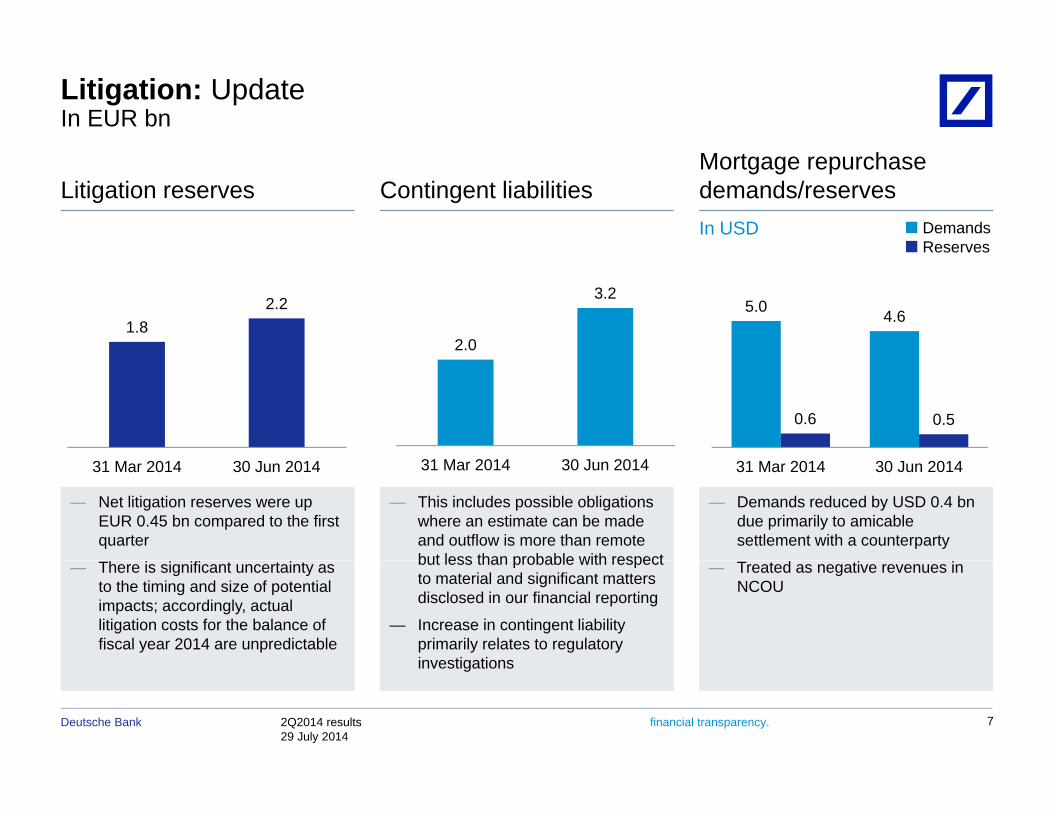
Litigation: UpdateIn EUR bn
Litigation reserves Contingent liabilitiesMortgage repurchase demands/reserves
DemandsReserves
In USD
1.82.2 5.0 4.6
2.0
3.2
0.6 0.5
31 Mar 2014 30 Jun 2014 31 Mar 2014 30 Jun 201431 Mar 2014 30 Jun 2014
— Net litigation reserves were upEUR 0.45 bn compared to the first quarter
— This includes possible obligations where an estimate can be made and outflow is more than remote but less than probable with respect
— Demands reduced by USD 0.4 bndue primarily to amicable settlement with a counterparty
— There is significant uncertainty as to the timing and size of potential impacts; accordingly, actual litigation costs for the balance of fiscal year 2014 are unpredictable
but less than probable with respect to material and significant matters disclosed in our financial reporting
— Increase in contingent liability primarily relates to regulatory investigations
— Treated as negative revenues in NCOU
2Q2014 results29 July 2014
Deutsche Bank financial transparency. 7
investigations
Agenda
1 Key current themes1 Key current themes
2 Group resultsp
3 Segment results
2Q2014 results29 July 2014
Deutsche Bank financial transparency. 8
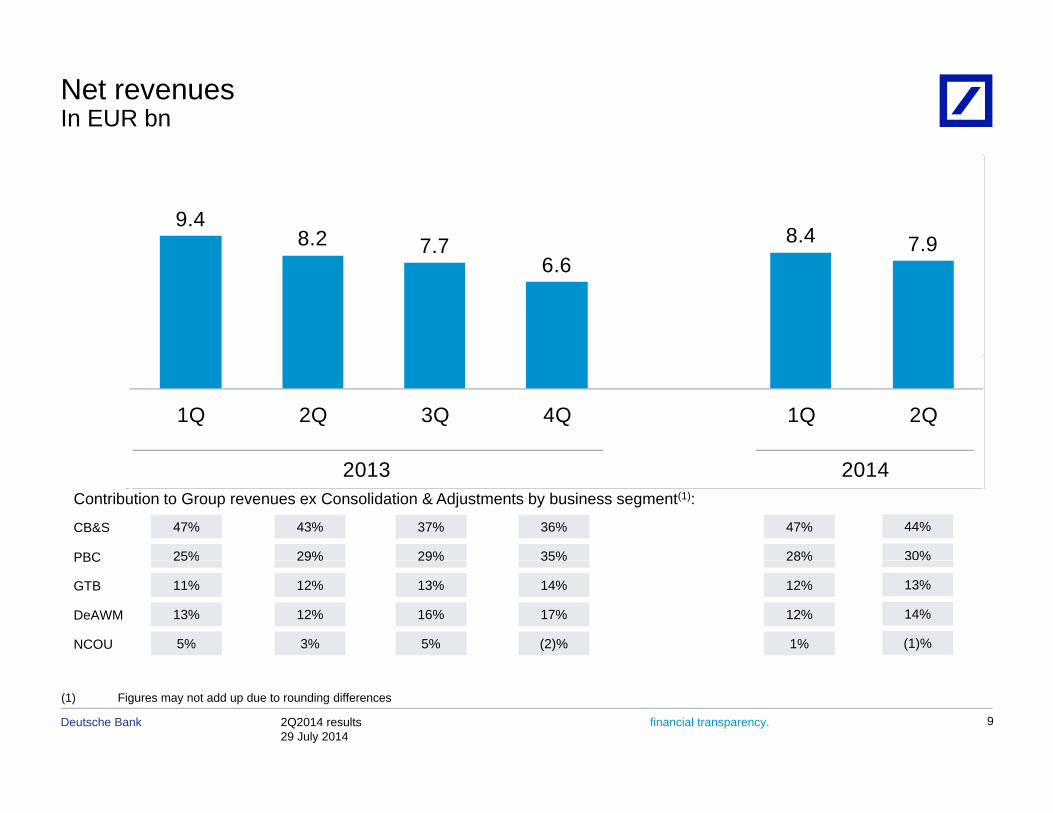
Net revenuesIn EUR bn
9.48.2 7.7 8.4 7.97.7
6.6
1Q 2Q 3Q 4Q 1Q 2Q
20142013Contribution to Group revenues ex Consolidation & Adjustments by business segment(1):
CB&S 47% 43% 37% 36% 47%
25% 29% 29% 35% 28%
44%
30%PBC 25% 29% 29% 35% 28%
GTB 11% 12% 13% 14% 12%
DeAWM 13% 12% 16% 17% 12%
NCOU 5% 3% 5% (2)% 1%
%
13%
14%
(1)%
PBC
2Q2014 results29 July 2014
Deutsche Bank financial transparency. 9
(1) Figures may not add up due to rounding differences
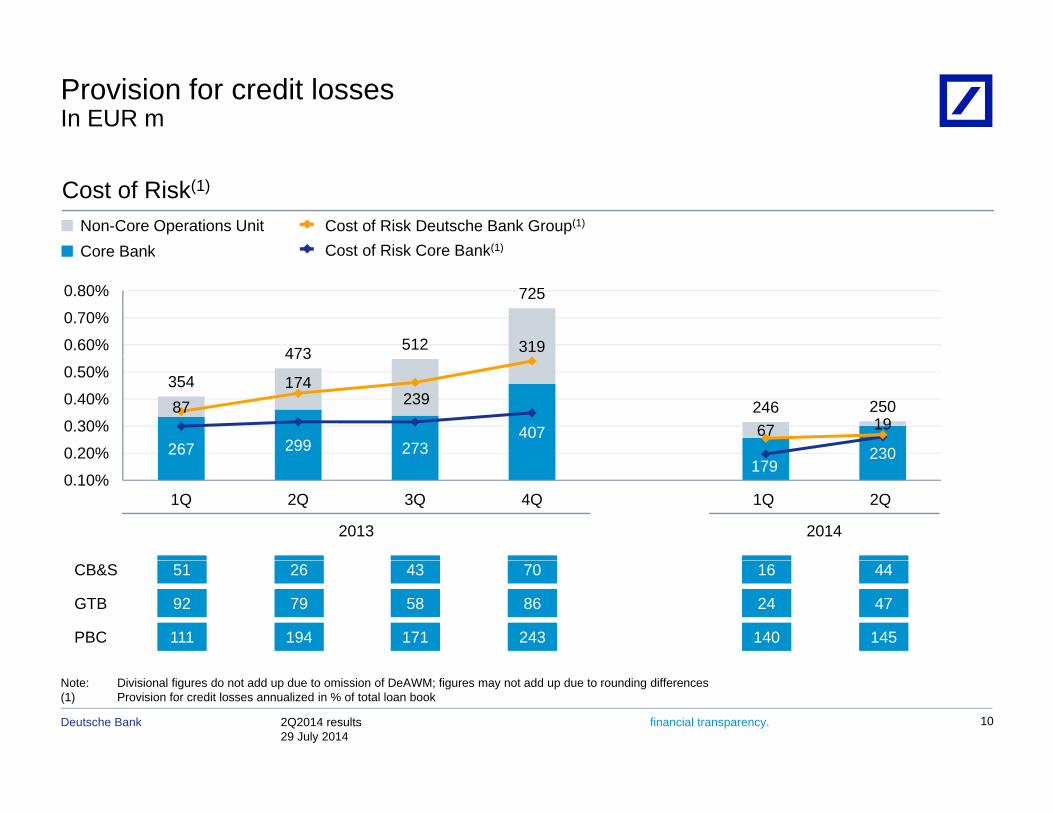
Provision for credit lossesIn EUR m
Cost of Risk(1)
Non-Core Operations UnitCore Bank
Cost of Risk Deutsche Bank Group(1)
Cost of Risk Core Bank(1)Core Bank Cost of Risk Core Bank( )
319473 512
725
0.60%
0.70%
0.80%
267 299 273407
230
87174
239
67 19
354
473
246 250
0.20%
0.30%
0.40%
0.50%
179230
0.10%
0.20%
1Q 2Q 3Q 4Q 1Q 2Q
2013 2014
51 26 43 70 16 44
92 79 58 86 24 47
111 194 171 243 140 145
CB&S
GTB
PBC
2Q2014 results29 July 2014
Deutsche Bank financial transparency. 10
Note: Divisional figures do not add up due to omission of DeAWM; figures may not add up due to rounding differences(1) Provision for credit losses annualized in % of total loan book
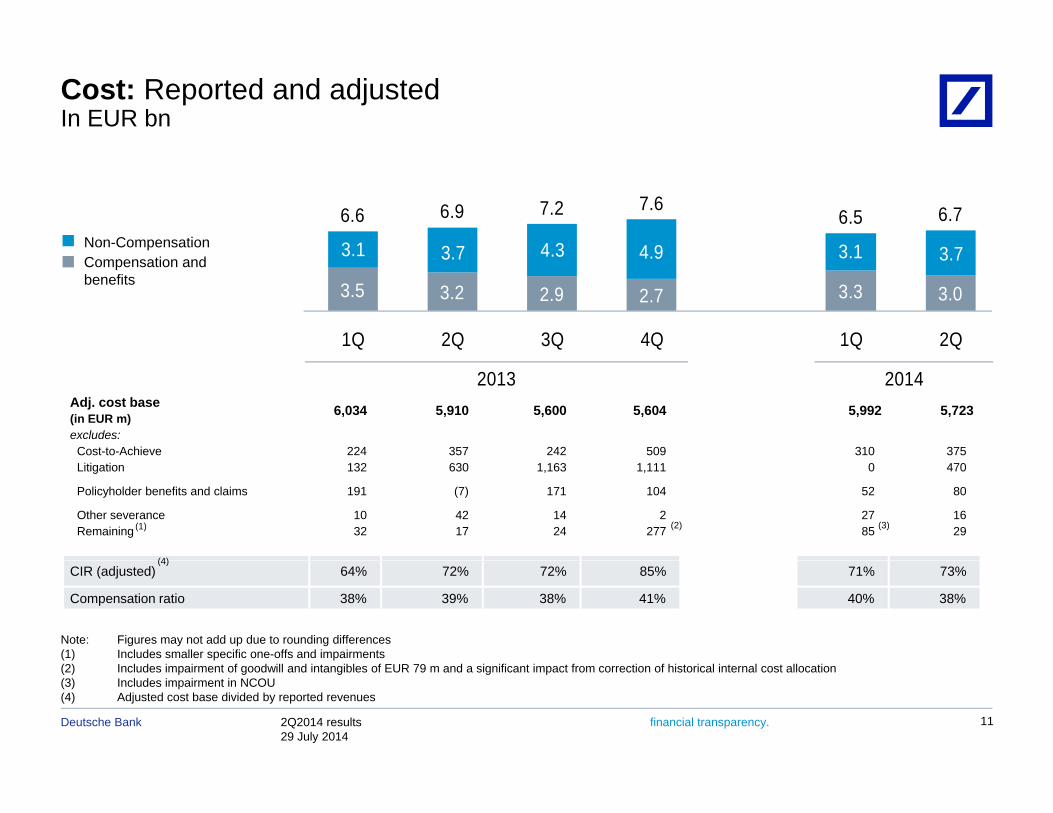
Cost: Reported and adjusted In EUR bn
Non-Compensation 3 1 3 7 4 3 4 9 3 1 3 7
6.6 6.9 7.2 7.66.5 6.7
Compensation andbenefits 3.5 3.2 2.9 2.7 3.3 3.0
3.1 3.7 4.3 4.9 3.1 3.7
1Q 2Q 3Q 4Q 1Q 2Q
Adj. cost base 6,034 5,910 5,600 5,604 5,992 5,723(in EUR m) excludes:
Cost-to-Achieve 224 357 242 509 310 375
2013 2014
Litigation 132 630 1,163 1,111 0 470
Policyholder benefits and claims 191 (7) 171 104 52 80
Other severance 10 42 14 2 27 16Remaining 32 17 24 277 85 29(2)
(4)
(3)(1)
CIR (adjusted) 64% 72% 72% 85% 71% 73%
Compensation ratio 38% 39% 38% 41% 40% 38%
Note: Figures may not add up due to rounding differences(1) Includes smaller specific one-offs and impairments
(4)
2Q2014 results29 July 2014
Deutsche Bank financial transparency. 11
(2) Includes impairment of goodwill and intangibles of EUR 79 m and a significant impact from correction of historical internal cost allocation(3) Includes impairment in NCOU(4) Adjusted cost base divided by reported revenues
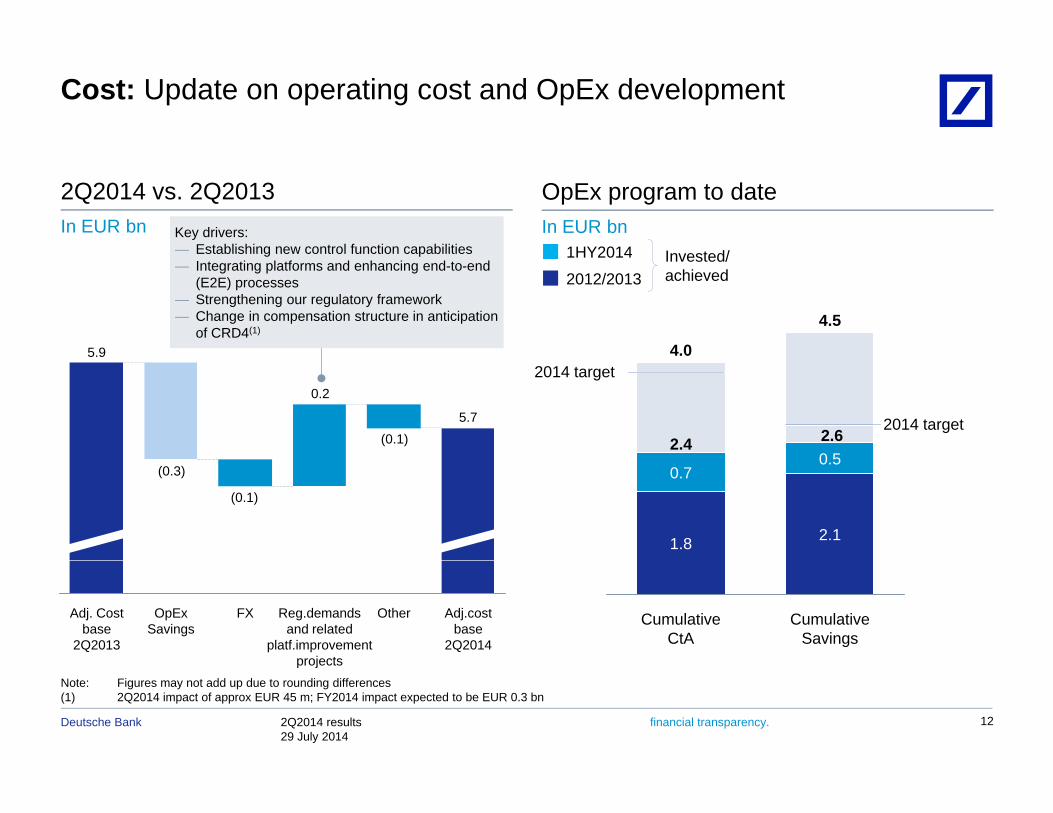
Cost: Update on operating cost and OpEx development
2Q2014 vs. 2Q2013 In EUR bn Key drivers:
— Establishing new control function capabilities
OpEx program to dateIn EUR bn
I t d/1HY2014
5 9
Establishing new control function capabilities— Integrating platforms and enhancing end-to-end
(E2E) processes— Strengthening our regulatory framework— Change in compensation structure in anticipation
of CRD4(1)
2012/2013Invested/achieved
1HY2014
4.5
4.0
(0.1)
0.2
5.7
5.9
0 5
4.0
2.4 2.62014 target
2014 target
(0.3)
(0.1)
2.1
0.5
1.8
0.7
Adj.cost base
2Q2014
OtherReg.demands and related
platf.improvement projects
FXOpEx Savings
Adj. Cost base
2Q2013
CumulativeSavings
CumulativeCtA
2Q2014 results29 July 2014
Deutsche Bank financial transparency. 12
Note: Figures may not add up due to rounding differences(1) 2Q2014 impact of approx EUR 45 m; FY2014 impact expected to be EUR 0.3 bn
projects
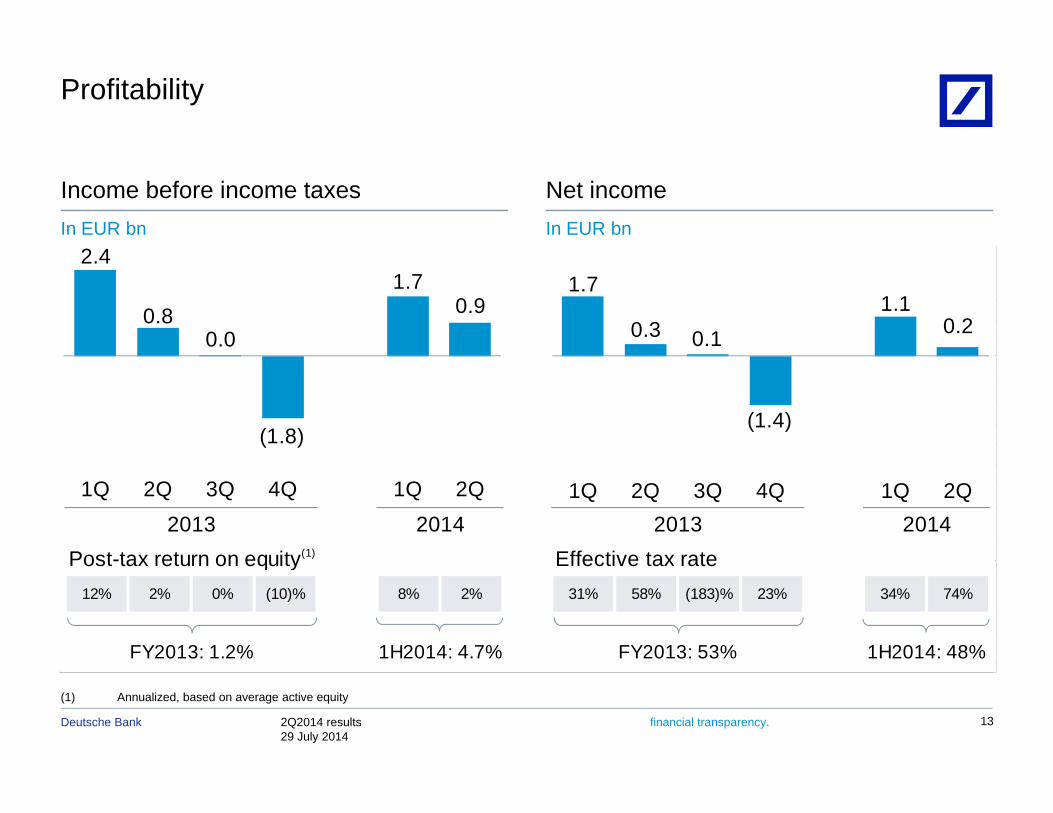
Profitability
Income before income taxesIn EUR bn
Net incomeIn EUR bn
2 42.4
0.80.0
1.70.9
1.7
0.3 0.11.1
0.2
(1.8)(1.4)
Post-tax return on equity(1) Effective tax rate2013 20132014 2014
1Q 2Q 3Q 4Q 1Q 2Q 1Q 2Q 3Q 4Q 1Q 2Q
Post-tax return on equity Effective tax rate12% 2% 0% (10)% 8% 2% 31% 58% (183)% 23% 34% 74%
1H2014: 4.7% FY2013: 53%FY2013: 1.2% 1H2014: 48%
2Q2014 results29 July 2014
Deutsche Bank financial transparency. 13
(1) Annualized, based on average active equity
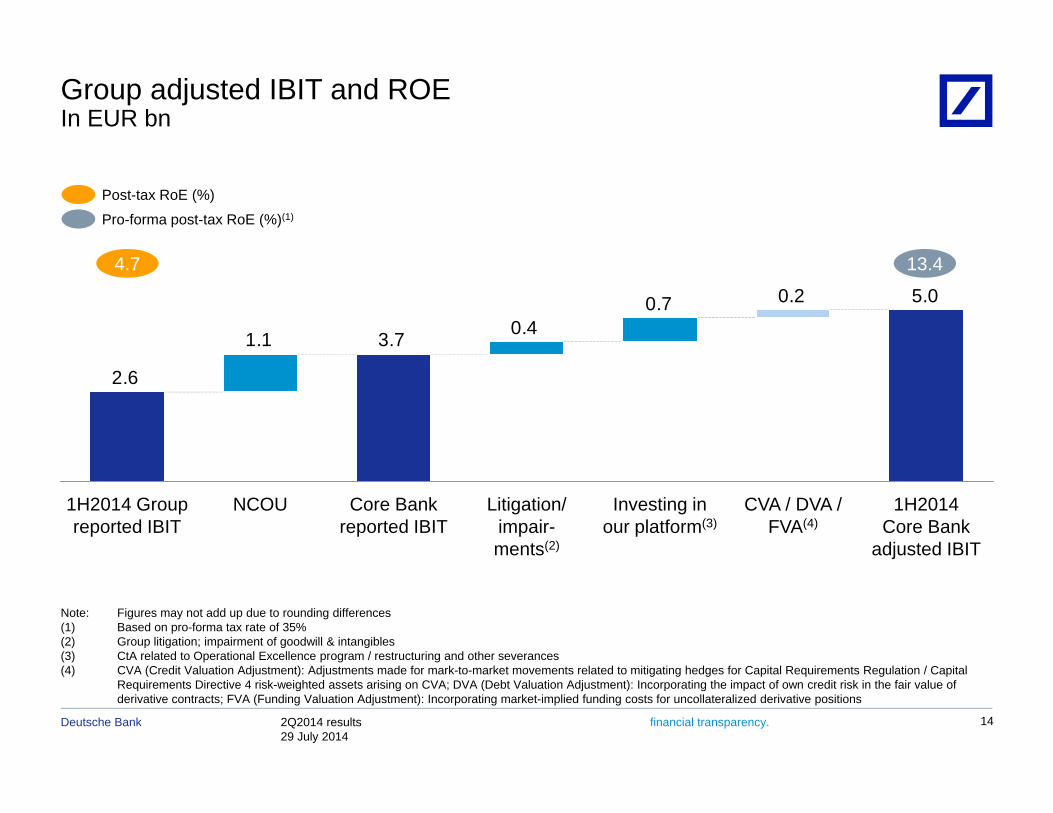
Group adjusted IBIT and ROEIn EUR bn
Post-tax RoE (%)
Pro-forma post-tax RoE (%)(1)
13.44.7
5.0 0.2 0.7 0.4 3.7 1.1
2.6
1H2014 Core Bank
adjusted IBIT
CVA / DVA /FVA(4)
Investing in our platform(3)
Litigation/ impair-ments(2)
Core Bank reported IBIT
NCOU1H2014 Group reported IBIT
Note: Figures may not add up due to rounding differences(1) Based on pro-forma tax rate of 35%(2) Group litigation; impairment of goodwill & intangibles(3) CtA related to Operational Excellence program / restructuring and other severances
2Q2014 results29 July 2014
Deutsche Bank financial transparency. 14
(4) CVA (Credit Valuation Adjustment): Adjustments made for mark-to-market movements related to mitigating hedges for Capital Requirements Regulation / Capital Requirements Directive 4 risk-weighted assets arising on CVA; DVA (Debt Valuation Adjustment): Incorporating the impact of own credit risk in the fair value of derivative contracts; FVA (Funding Valuation Adjustment): Incorporating market-implied funding costs for uncollateralized derivative positions
Agenda
1 Key current themes1 Key current themes
2 Group resultsp
3 Segment results
2Q2014 results29 July 2014
Deutsche Bank financial transparency. 15
Corporate Banking & Securities
2Q14 2Q13 1Q14 2Q14 vs. 2Q14 vs. 1 908
Income before income taxesIn EUR m
Key featuresIn EUR m
2Q14 2Q13 1Q142Q13 1Q14
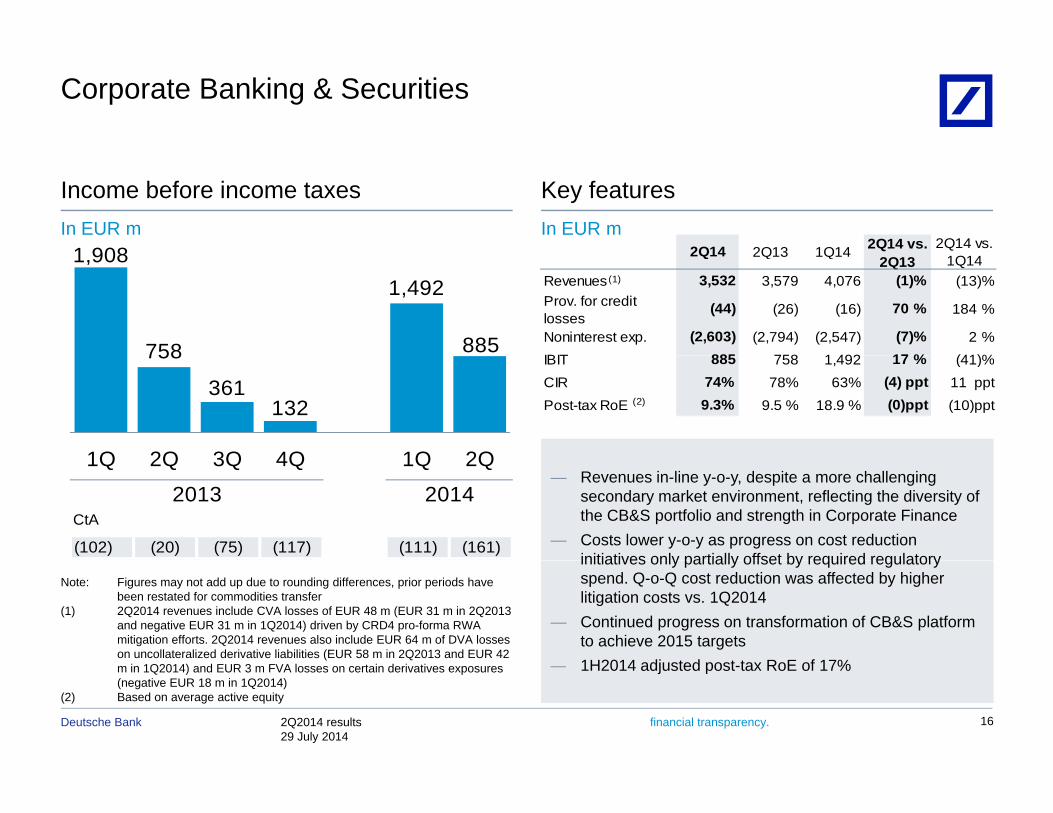
Revenues 3,532 3,579 4,076 (1)% (13)%Prov. for credit losses
(44) (26) (16) 70 % 184 %
Noninterest exp. (2,603) (2,794) (2,547) (7)% 2 %IBIT 885 758 1 492 17 % (41)%
(1)
1,908
758
1,492
885IBIT 885 758 1,492 17 % (41)%CIR 74% 78% 63% (4) ppt 11 pptPost-tax RoE 9.3% 9.5 % 18.9 % (0)ppt (10)ppt(2)
758
361132
1Q 2Q 3Q 4Q 1Q 2Q
CtA
(102) (20) (75) (117) (111) (161)
2013 2014
1Q 2Q 3Q 4Q 1Q 2Q— Revenues in-line y-o-y, despite a more challenging
secondary market environment, reflecting the diversity of the CB&S portfolio and strength in Corporate Finance
— Costs lower y-o-y as progress on cost reduction initiatives only partially offset by required regulatory
Note: Figures may not add up due to rounding differences, prior periods have been restated for commodities transfer
(1) 2Q2014 revenues include CVA losses of EUR 48 m (EUR 31 m in 2Q2013 and negative EUR 31 m in 1Q2014) driven by CRD4 pro-forma RWA mitigation efforts. 2Q2014 revenues also include EUR 64 m of DVA losses on uncollateralized derivative liabilities (EUR 58 m in 2Q2013 and EUR 42
initiatives only partially offset by required regulatory spend. Q-o-Q cost reduction was affected by higher litigation costs vs. 1Q2014
— Continued progress on transformation of CB&S platform to achieve 2015 targets1H2014 adjusted post tax RoE of 17%
2Q2014 results29 July 2014
Deutsche Bank financial transparency. 16
m in 1Q2014) and EUR 3 m FVA losses on certain derivatives exposures (negative EUR 18 m in 1Q2014)
(2) Based on average active equity
— 1H2014 adjusted post-tax RoE of 17%
Sales & Trading
2 717Debt Sales & Trading— FX revenues significantly lower and Rates revenues
RevenuesDebt S&T, in EUR m
Key features
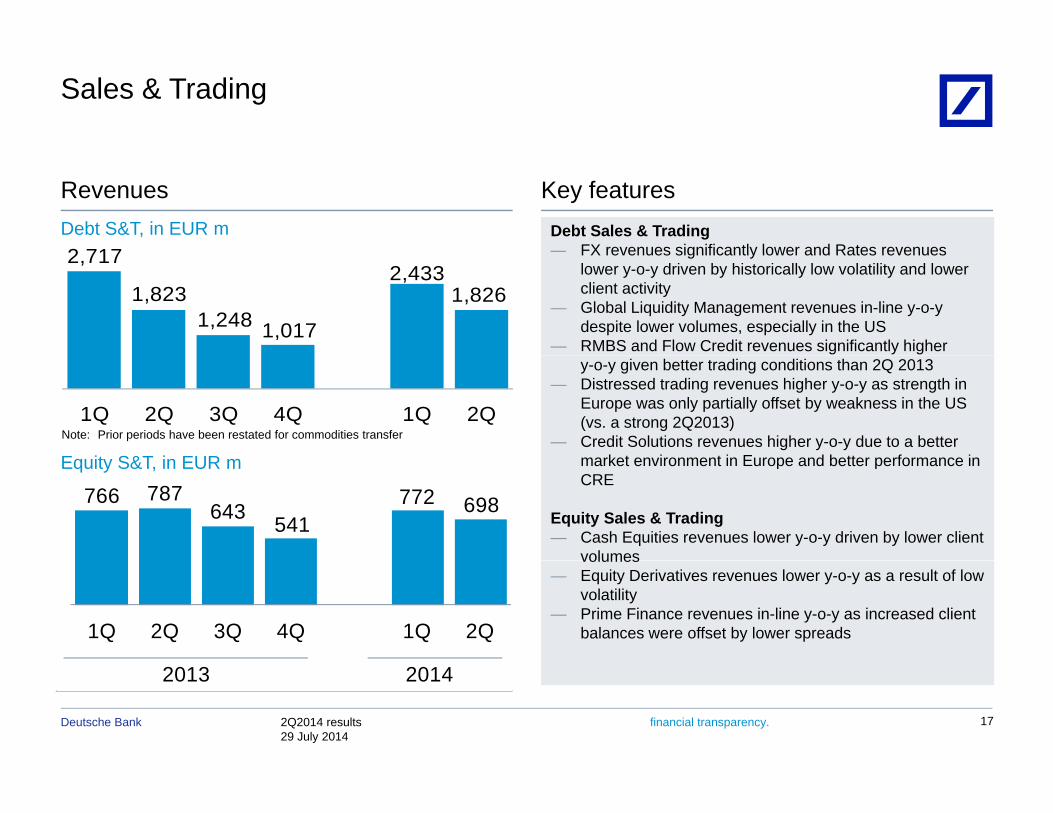
2,717
1,8231,248 1,017
2,4331,826
FX revenues significantly lower and Rates revenues lower y-o-y driven by historically low volatility and lower client activity
— Global Liquidity Management revenues in-line y-o-y despite lower volumes, especially in the US
— RMBS and Flow Credit revenues significantly higher
1Q 2Q 3Q 4Q 1Q 2Q
y-o-y given better trading conditions than 2Q 2013— Distressed trading revenues higher y-o-y as strength in
Europe was only partially offset by weakness in the US (vs. a strong 2Q2013)
— Credit Solutions revenues higher y-o-y due to a better market environment in Europe and better performance in
Note: Prior periods have been restated for commodities transfer
E it S&T i EUR market environment in Europe and better performance in CRE
Equity Sales & Trading— Cash Equities revenues lower y-o-y driven by lower client
volumes
Equity S&T, in EUR m
766 787643 541
772 698
volumes— Equity Derivatives revenues lower y-o-y as a result of low
volatility— Prime Finance revenues in-line y-o-y as increased client
balances were offset by lower spreads1Q 2Q 3Q 4Q 1Q 2Q
2Q2014 results29 July 2014
Deutsche Bank financial transparency. 17
2013 2014
Origination & Advisory
AdvisoryOrigination
OverallRevenues up 10% y o y driven by higher revenues in
Revenuesin EUR m
Key features
69116
140
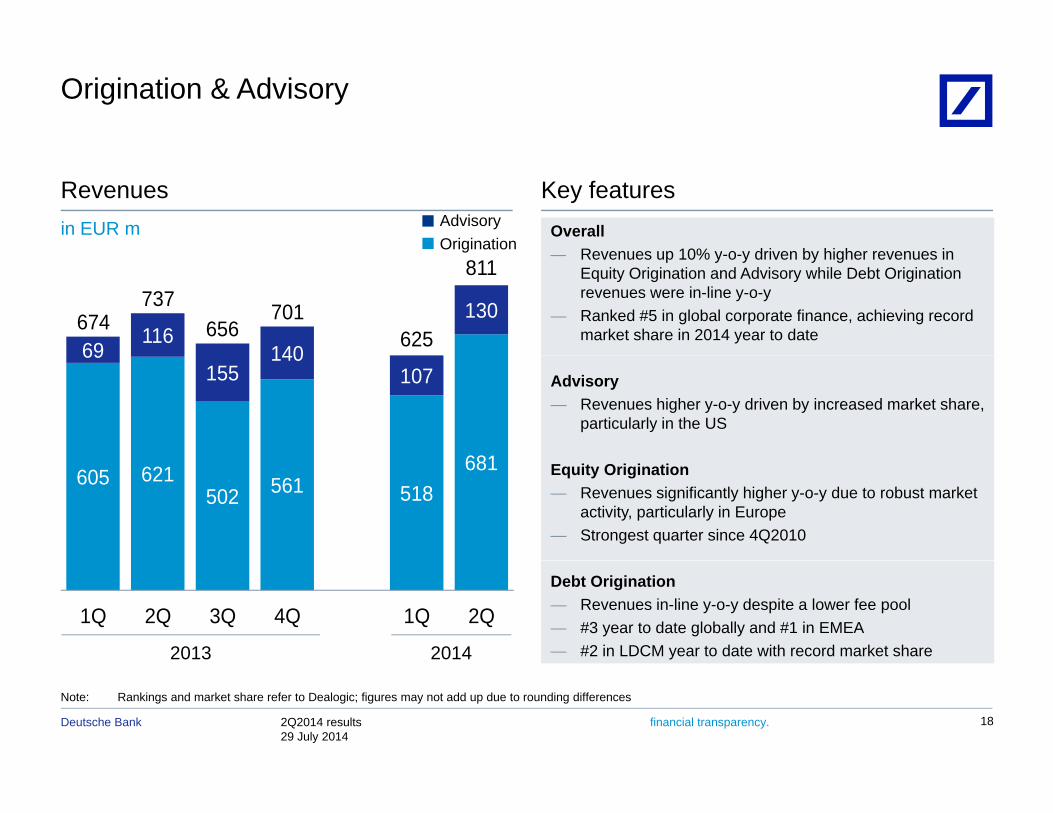
130674737
656701
625
811— Revenues up 10% y-o-y driven by higher revenues in
Equity Origination and Advisory while Debt Origination revenues were in-line y-o-y
— Ranked #5 in global corporate finance, achieving record market share in 2014 year to date
681
69155
140107 Advisory
— Revenues higher y-o-y driven by increased market share, particularly in the US
605 621502 561 518
681 Equity Origination— Revenues significantly higher y-o-y due to robust market
activity, particularly in Europe— Strongest quarter since 4Q2010
1Q 2Q 3Q 4Q 1Q 2Q
Debt Origination— Revenues in-line y-o-y despite a lower fee pool— #3 year to date globally and #1 in EMEA— #2 in LDCM year to date with record market share20142013
2Q2014 results29 July 2014
Deutsche Bank financial transparency. 18
Note: Rankings and market share refer to Dealogic; figures may not add up due to rounding differences
Private & Business Clients
2Q14 2Q13 1Q14 2Q14 vs. 2Q14 vs.
Key featuresIn EUR m
Income before income taxesIn EUR m
2Q14 2Q13 1Q142Q13 1Q14
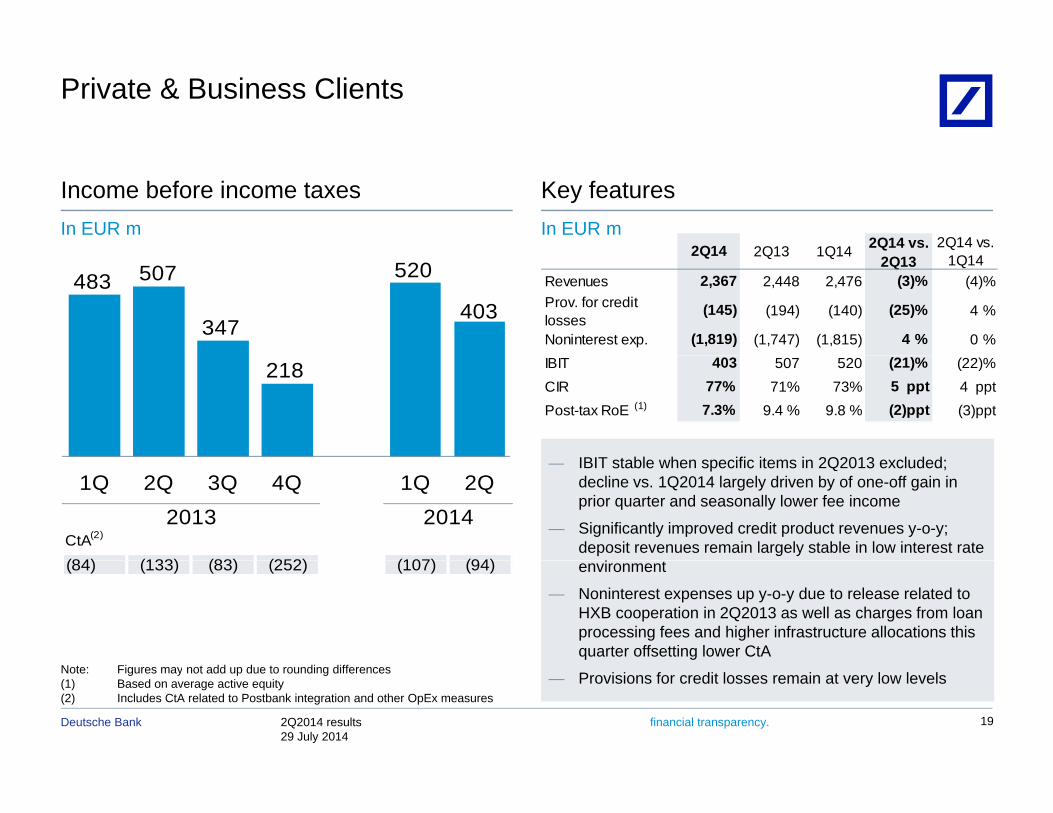
Revenues 2,367 2,448 2,476 (3)% (4)%Prov. for credit losses
(145) (194) (140) (25)% 4 %
Noninterest exp. (1,819) (1,747) (1,815) 4 % 0 %
483 507
347
520
403
IBIT 403 507 520 (21)% (22)%CIR 77% 71% 73% 5 ppt 4 pptPost-tax RoE 7.3% 9.4 % 9.8 % (2)ppt (3)ppt(1)
IBIT t bl h ifi it i 2Q2013 l d d
218
— IBIT stable when specific items in 2Q2013 excluded; decline vs. 1Q2014 largely driven by of one-off gain in prior quarter and seasonally lower fee income
— Significantly improved credit product revenues y-o-y; deposit revenues remain largely stable in low interest rate
iCtA(2)
(84) (133) (83) (252) (107) (94)
2013 20141Q 2Q 3Q 4Q 1Q 2Q
environment
— Noninterest expenses up y-o-y due to release related to HXB cooperation in 2Q2013 as well as charges from loan processing fees and higher infrastructure allocations this quarter offsetting lower CtA
(84) (133) (83) (252) (107) (94)
2Q2014 results29 July 2014
Deutsche Bank financial transparency. 19
Note: Figures may not add up due to rounding differences(1) Based on average active equity(2) Includes CtA related to Postbank integration and other OpEx measures
— Provisions for credit losses remain at very low levels
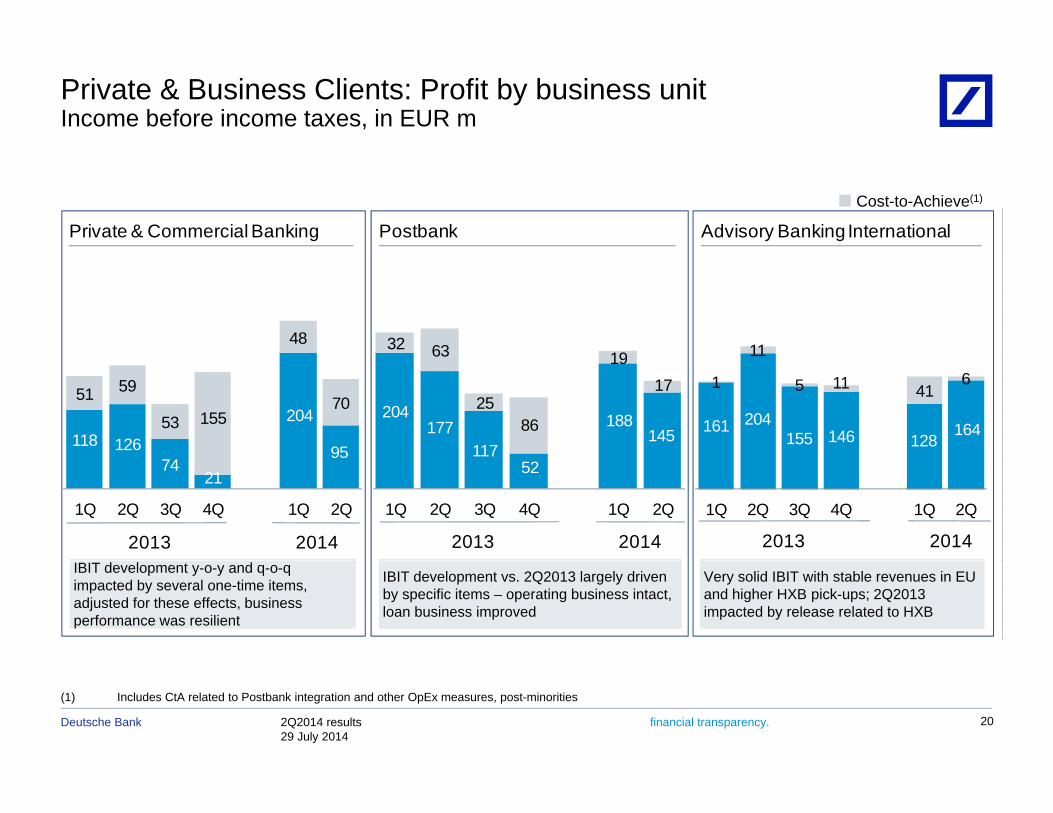
Private & Business Clients: Profit by business unit Income before income taxes, in EUR m
Private & Commercial Banking Postbank Advisory Banking International
Cost-to-Achieve(1)
48 32 63 19 11
118 126
204
95
51 59
53 15570 204
177117
188145
63
2586
1917
161 204155 146 128
164
1
11
5 11 416
7421
95
1Q 2Q 3Q 4Q 1Q 2Q
2013 2014
52
1Q 2Q 3Q 4Q 1Q 2Q
2013 2014
1Q 2Q 3Q 4Q 1Q 2Q
2013 2014IBIT development y-o-y and q-o-q impacted by several one-time items, adjusted for these effects, business performance was resilient
IBIT development vs. 2Q2013 largely driven by specific items – operating business intact, loan business improved
Very solid IBIT with stable revenues in EU and higher HXB pick-ups; 2Q2013 impacted by release related to HXB
2Q2014 results29 July 2014
Deutsche Bank financial transparency. 20
(1) Includes CtA related to Postbank integration and other OpEx measures, post-minorities
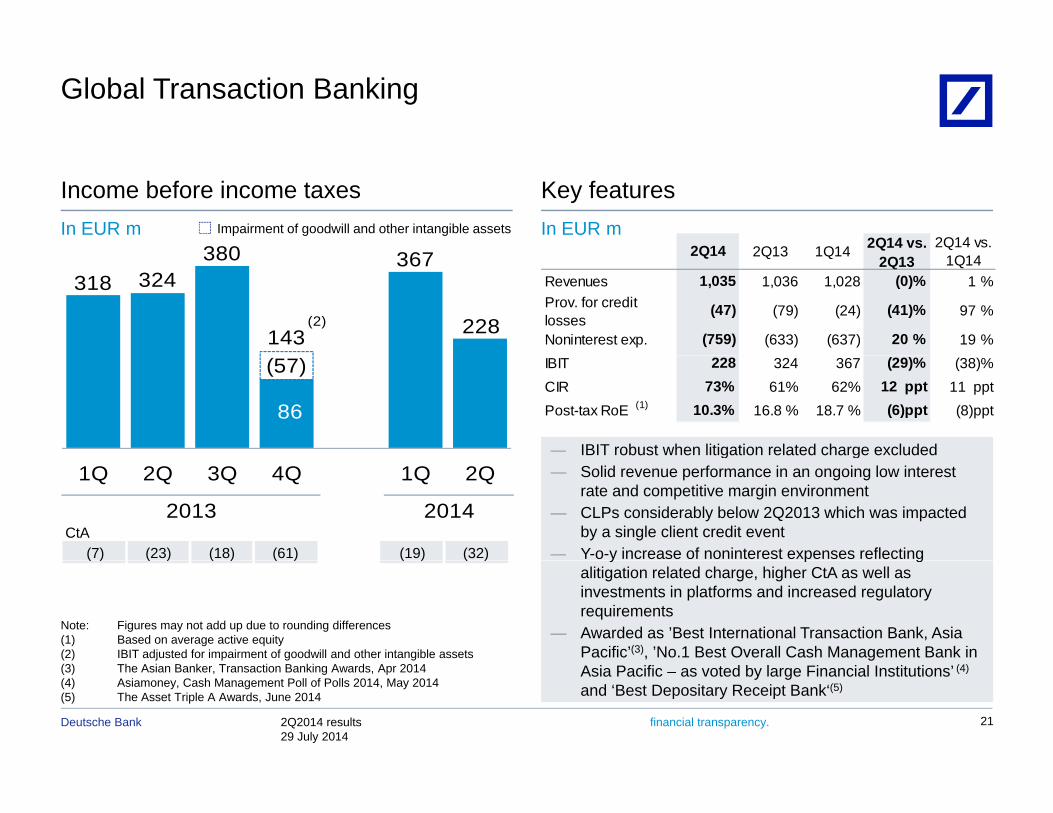
Global Transaction Banking
2Q14 2Q13 1Q14 2Q14 vs. 2Q14 vs. In EUR m
Income before income taxesImpairment of goodwill and other intangible assets
Key featuresIn EUR m
380 367 2Q14 2Q13 1Q142Q13 1Q14
Revenues 1,035 1,036 1,028 (0)% 1 %Prov. for credit losses
(47) (79) (24) (41)% 97 %
Noninterest exp. (759) (633) (637) 20 % 19 %
318 324380
143
367
228(2)
IBIT 228 324 367 (29)% (38)%CIR 73% 61% 62% 12 ppt 11 pptPost-tax RoE 10.3% 16.8 % 18.7 % (6)ppt (8)ppt(1)
(57)
86
— IBIT robust when litigation related charge excluded
CtA(7) (23) (18) (61) (19) (32)
2013 2014
1Q 2Q 3Q 4Q 1Q 2Qg g
— Solid revenue performance in an ongoing low interest rate and competitive margin environment
— CLPs considerably below 2Q2013 which was impacted by a single client credit event
— Y-o-y increase of noninterest expenses reflecting ( ) ( ) ( ) ( ) ( ) ( ) y p galitigation related charge, higher CtA as well as investments in platforms and increased regulatory requirements
— Awarded as ’Best International Transaction Bank, Asia Pacific’(3), ’No.1 Best Overall Cash Management Bank in
Note: Figures may not add up due to rounding differences(1) Based on average active equity(2) IBIT adjusted for impairment of goodwill and other intangible assets
2Q2014 results29 July 2014
Deutsche Bank financial transparency. 21
Asia Pacific – as voted by large Financial Institutions’ (4)
and ‘Best Depositary Receipt Bank‘(5)
(3) The Asian Banker, Transaction Banking Awards, Apr 2014(4) Asiamoney, Cash Management Poll of Polls 2014, May 2014 (5) The Asset Triple A Awards, June 2014
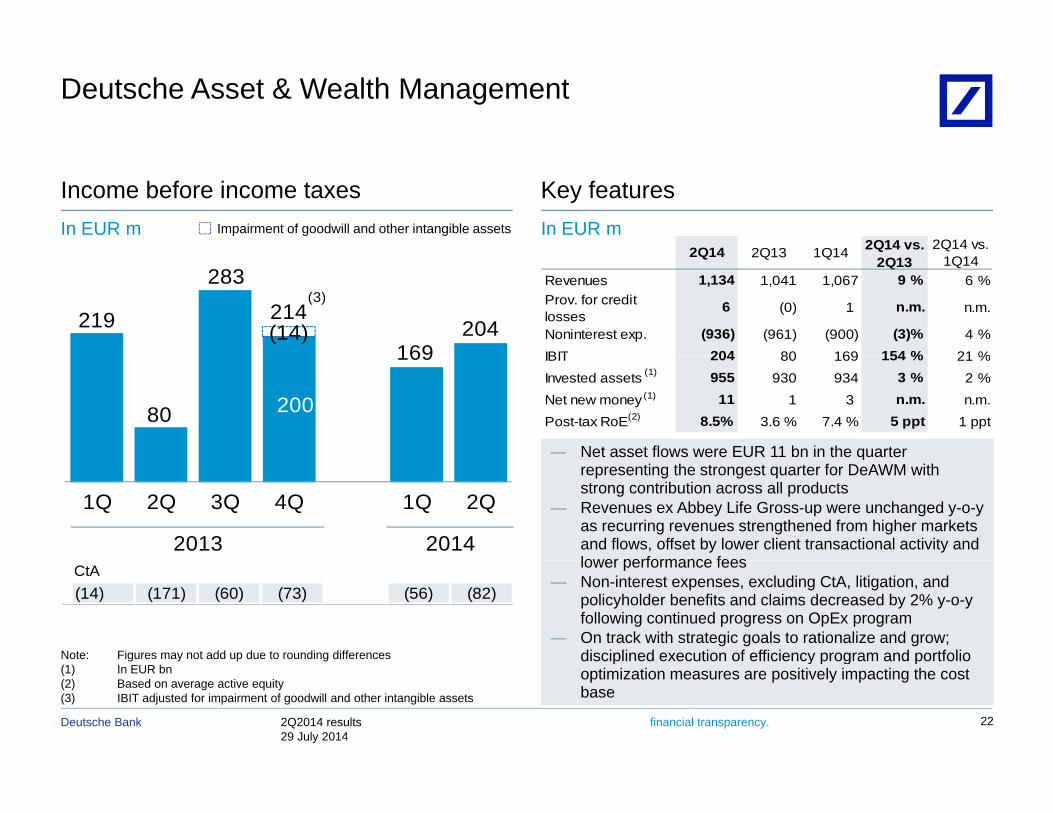
Deutsche Asset & Wealth Management
2Q14 2Q13 1Q14 2Q14 vs. 2Q14 vs.
Income before income taxes Key featuresIn EUR mImpairment of goodwill and other intangible assetsIn EUR m
2Q14 2Q13 1Q142Q13 1Q14
Revenues 1,134 1,041 1,067 9 % 6 %Prov. for credit losses
6 (0) 1 n.m. n.m.
Noninterest exp. (936) (961) (900) (3)% 4 %IBIT 204 80 169 154 % 21 %
219
283
214
169204(14)
(3)
IBIT 204 80 169 154 % 21 %Invested assets 955 930 934 3 % 2 %Net new money 11 1 3 n.m. n.m.Post-tax RoE 8.5% 3.6 % 7.4 % 5 ppt 1 ppt(2)
(1)
(1)
80
169
200
— Net asset flows were EUR 11 bn in the quarter
2013 2014
1Q 2Q 3Q 4Q 1Q 2Q
qrepresenting the strongest quarter for DeAWM with strong contribution across all products
— Revenues ex Abbey Life Gross-up were unchanged y-o-y as recurring revenues strengthened from higher markets and flows, offset by lower client transactional activity and lower performance fees
Note: Figures may not add up due to rounding differences
CtA(14) (171) (60) (73) (56) (82)
lower performance fees— Non-interest expenses, excluding CtA, litigation, and
policyholder benefits and claims decreased by 2% y-o-y following continued progress on OpEx program
— On track with strategic goals to rationalize and grow; disciplined execution of efficiency program and portfolio
2Q2014 results29 July 2014
Deutsche Bank financial transparency. 22
(1) In EUR bn(2) Based on average active equity(3) IBIT adjusted for impairment of goodwill and other intangible assets
p y p g poptimization measures are positively impacting the cost base
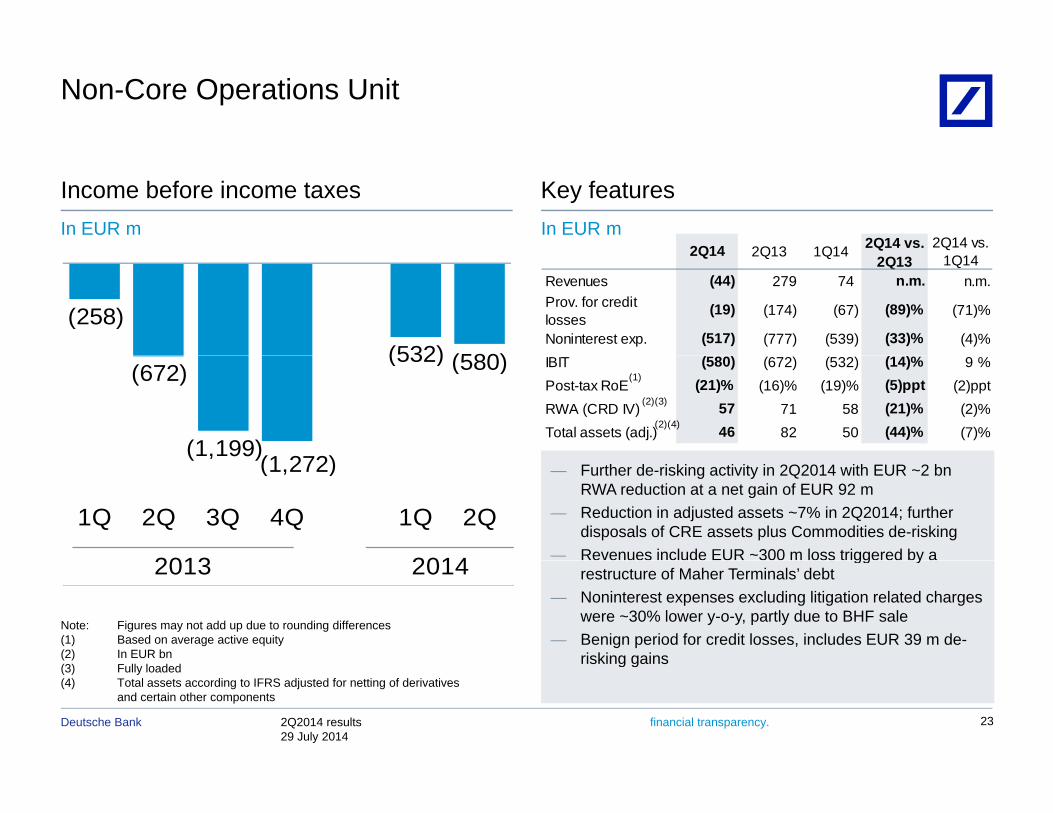
Non-Core Operations Unit
Income before income taxes Key featuresIn EUR mIn EUR m
2Q14 2Q13 1Q14 2Q14 vs. 2Q14 vs.
(258)(532) (580)
2Q14 2Q13 1Q142Q13 1Q14
Revenues (44) 279 74 n.m. n.m.Prov. for credit losses
(19) (174) (67) (89)% (71)%
Noninterest exp. (517) (777) (539) (33)% (4)%
(672)
(1,199)(1 272)
(532) (580) IBIT (580) (672) (532) (14)% 9 %Post-tax RoE (21)% (16)% (19)% (5)ppt (2)pptRWA (CRD IV) 57 71 58 (21)% (2)%Total assets (adj.) 46 82 50 (44)% (7)%
(2)(3)
(1)
(2)(4)
2013 2014
( , )(1,272)
1Q 2Q 3Q 4Q 1Q 2Q
— Further de-risking activity in 2Q2014 with EUR ~2 bnRWA reduction at a net gain of EUR 92 m
— Reduction in adjusted assets ~7% in 2Q2014; further disposals of CRE assets plus Commodities de-risking
— Revenues include EUR ~300 m loss triggered by a
Note: Figures may not add up due to rounding differences(1) Based on average active equity(2) In EUR bn
2013 2014 gg yrestructure of Maher Terminals’ debt
— Noninterest expenses excluding litigation related charges were ~30% lower y-o-y, partly due to BHF sale
— Benign period for credit losses, includes EUR 39 m de-risking gains
2Q2014 results29 July 2014
Deutsche Bank financial transparency. 23
(3) Fully loaded(4) Total assets according to IFRS adjusted for netting of derivatives
and certain other components
risking gains
NCOU: De-risking since June 2012
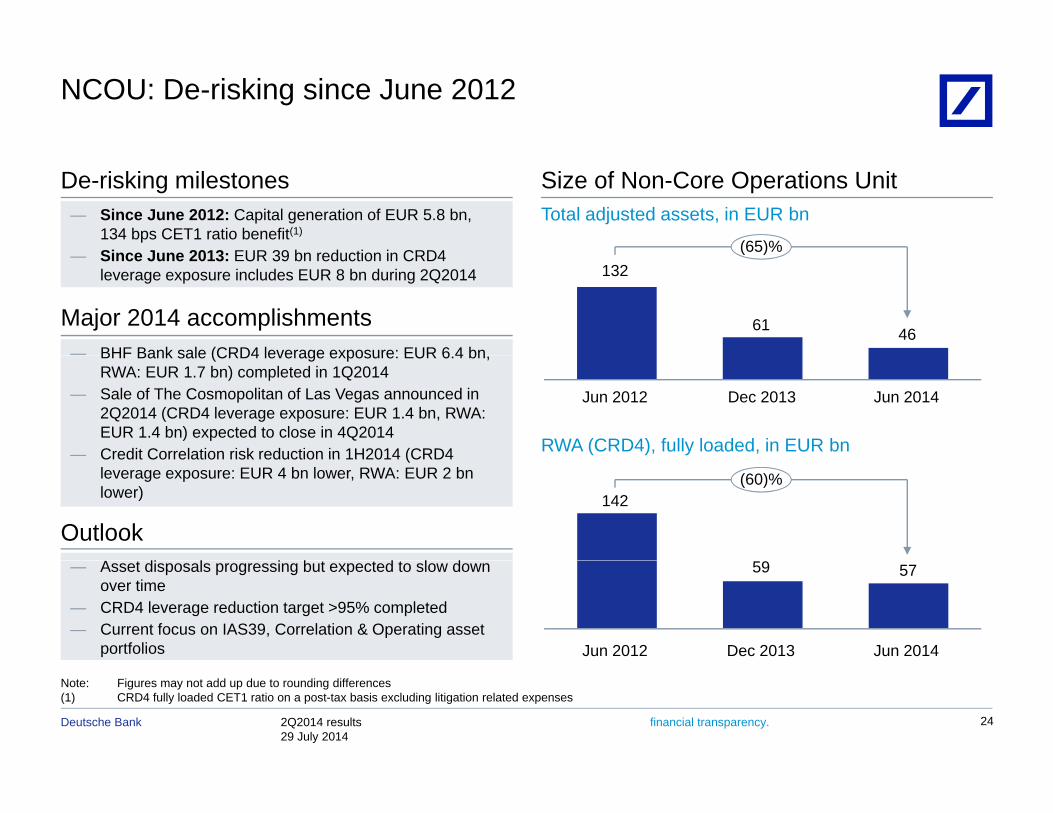
De-risking milestones — Since June 2012: Capital generation of EUR 5.8 bn,
134 bps CET1 ratio benefit(1)
Since June 2013: EUR 39 bn reduction in CRD4 (65)%
Size of Non-Core Operations UnitTotal adjusted assets, in EUR bn
— BHF Bank sale (CRD4 leverage exposure: EUR 6 4 bn
— Since June 2013: EUR 39 bn reduction in CRD4 leverage exposure includes EUR 8 bn during 2Q2014
Major 2014 accomplishments
( )
4661
132
BHF Bank sale (CRD4 leverage exposure: EUR 6.4 bn, RWA: EUR 1.7 bn) completed in 1Q2014
— Sale of The Cosmopolitan of Las Vegas announced in 2Q2014 (CRD4 leverage exposure: EUR 1.4 bn, RWA: EUR 1.4 bn) expected to close in 4Q2014
— Credit Correlation risk reduction in 1H2014 (CRD4
Jun 2012 Jun 2014Dec 2013
RWA (CRD4), fully loaded, in EUR bnCredit Correlation risk reduction in 1H2014 (CRD4 leverage exposure: EUR 4 bn lower, RWA: EUR 2 bnlower)
OutlookA di l i b d l d
142(60)%
— Asset disposals progressing but expected to slow down over time
— CRD4 leverage reduction target >95% completed— Current focus on IAS39, Correlation & Operating asset
portfolios
59 57
Jun 2012 Jun 2014Dec 2013
2Q2014 results29 July 2014
Deutsche Bank financial transparency.
Note: Figures may not add up due to rounding differences(1) CRD4 fully loaded CET1 ratio on a post-tax basis excluding litigation related expenses
24
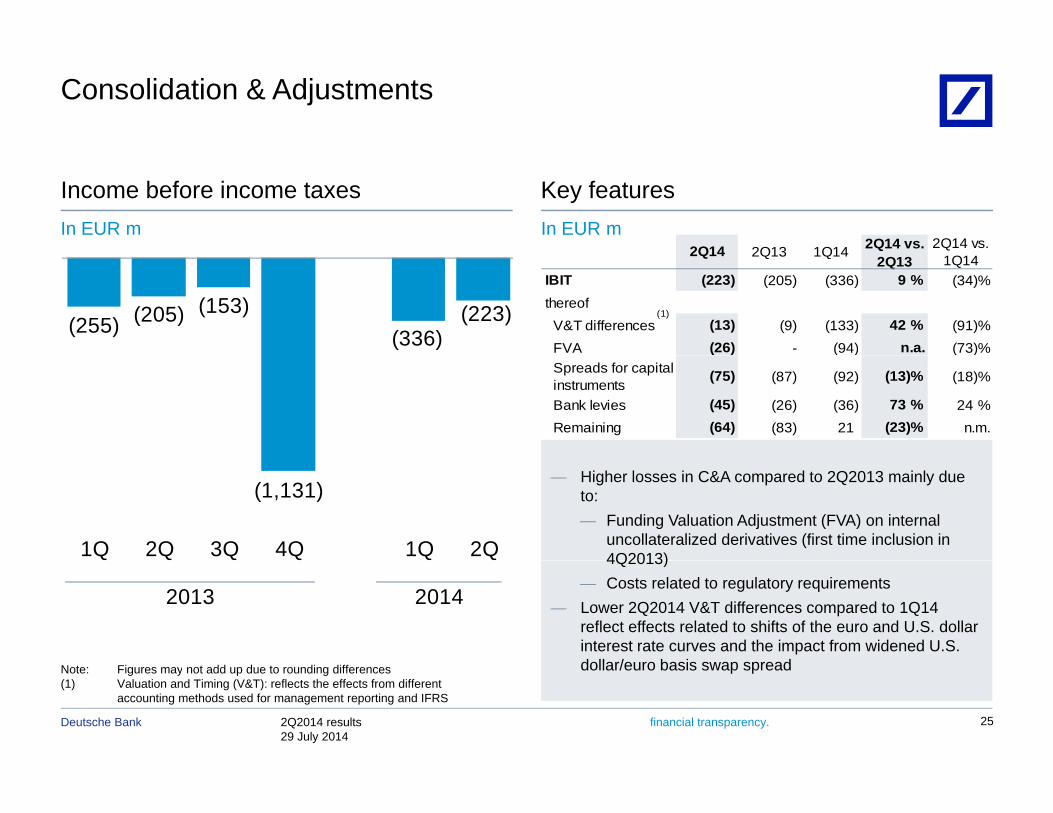
Consolidation & Adjustments
Income before income taxes Key featuresIn EUR mIn EUR m
2Q14 2Q13 1Q14 2Q14 vs. 2Q14 vs. 2Q14 2Q13 1Q142Q13 1Q14
IBIT (223) (205) (336) 9 % (34)%thereof
V&T differences (13) (9) (133) 42 % (91)%FVA (26) - (94) n.a. (73)%
(1)
(255) (205) (153)(336)
(223)( ) ( )
Spreads for capital instruments (75) (87) (92) (13)% (18)%
Bank levies (45) (26) (36) 73 % 24 %Remaining (64) (83) 21 (23)% n.m.
(1,131)
1Q 2Q 3Q 4Q 1Q 2Q
— Higher losses in C&A compared to 2Q2013 mainly due to:— Funding Valuation Adjustment (FVA) on internal
uncollateralized derivatives (first time inclusion in 4Q2013)
2013 2014
4Q2013) — Costs related to regulatory requirements
— Lower 2Q2014 V&T differences compared to 1Q14 reflect effects related to shifts of the euro and U.S. dollar interest rate curves and the impact from widened U.S. dollar/euro basis swap spread
2Q2014 results29 July 2014
Deutsche Bank financial transparency. 25
Note: Figures may not add up due to rounding differences(1) Valuation and Timing (V&T): reflects the effects from different
accounting methods used for management reporting and IFRS
dollar/euro basis swap spread
Deutsche Bank
AppendixAppendix
26
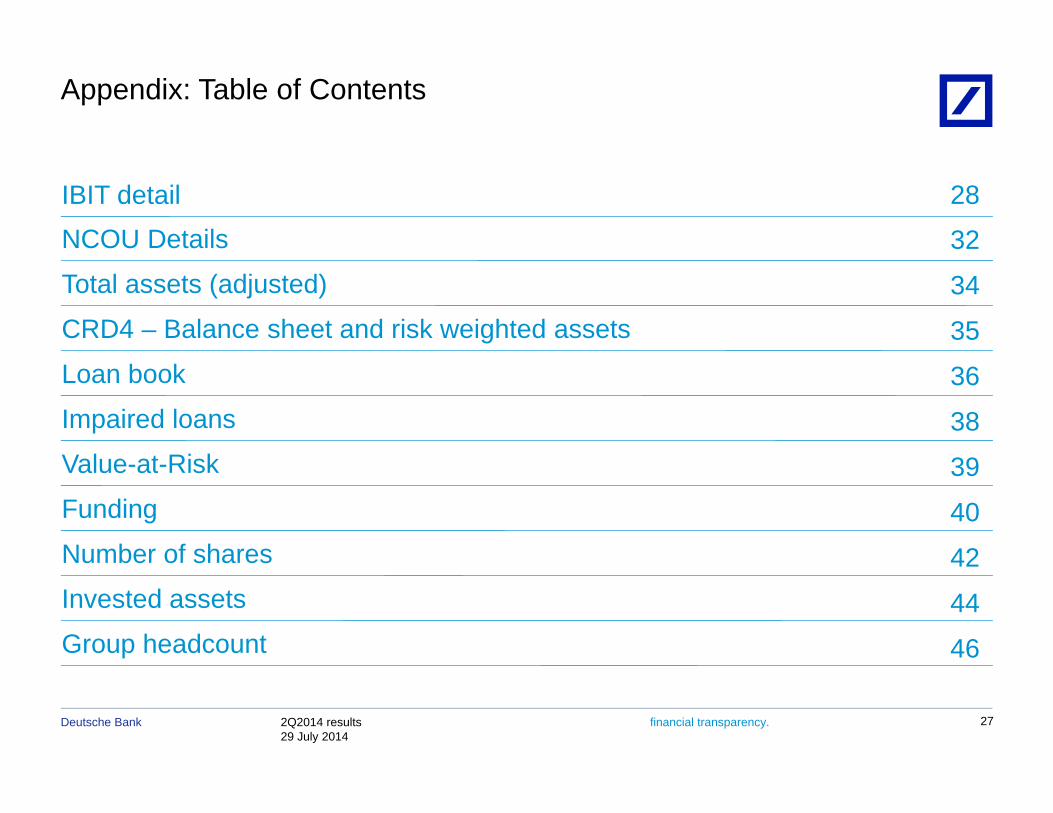
Appendix: Table of Contents
28IBIT detail
32NCOU Details
34Total assets (adjusted)
35CRD4 – Balance sheet and risk weighted assets
36Loan book
38Impaired loans
39V l t Ri k 39Value-at-Risk
Funding
Number of shares40
42Number of shares 42Invested assets
Group headcount44
46
2Q2014 results29 July 2014
Deutsche Bank financial transparency. 27
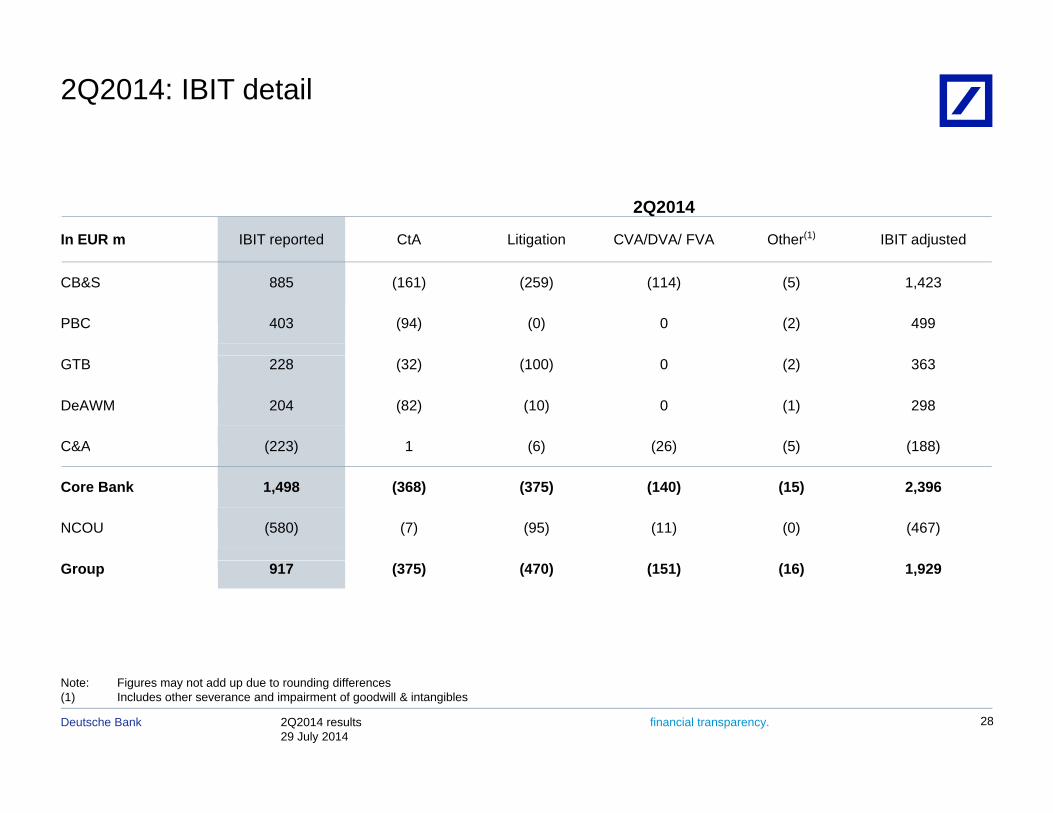
2Q2014: IBIT detail
2Q2014
In EUR m IBIT reported CtA Litigation CVA/DVA/ FVA Other(1) IBIT adjusted
CB&S 885 (161) (259) (114) (5) 1,423
PBC 403 (94) (0) 0 (2) 499
GTB 228 (32) (100) 0 (2) 363
DeAWM 204 (82) (10) 0 (1) 298
C&A (223) 1 (6) (26) (5) (188)
Core Bank 1,498 (368) (375) (140) (15) 2,396
NCOU (580) (7) (95) (11) (0) (467)
Group 917 (375) (470) (151) (16) 1,929
2Q2014 results29 July 2014
Deutsche Bank financial transparency. 28
Note: Figures may not add up due to rounding differences(1) Includes other severance and impairment of goodwill & intangibles

2Q2013: IBIT detail
2Q2013
In EUR m IBIT reported CtA Litigation CVA/DVA/ FVA Other(1) IBIT adjusted
CB&S 758 (20) (452) (88) (20) 1,339
PBC 507 (133) (1) 0 (10) 652
GTB 324 (23) (0) 0 (3) 349
DeAWM 80 (171) (10) 0 (6) 267
C&A (205) (3) (0) 0 (3) (199)
Core Bank 1,464 (351) (463) (88) (42) 2,408
NCOU (672) (6) (167) 0 (1) (499)
Group 792 (357) (630) (88) (42) 1,909
2Q2014 results29 July 2014
Deutsche Bank financial transparency. 29
Note: Figures may not add up due to rounding differences(1) Includes other severance and impairment of goodwill & intangibles

1H2014: IBIT detail
1H2014
In EUR m IBIT reported CtA Litigation CVA/DVA/ FVA Other(1) IBIT adjusted
CB&S 2,376 (272) (240) (106) (17) 3,012
PBC 923 (201) (0) 0 (6) 1,130
GTB 595 (51) (98) 0 (3) 748
DeAWM 374 (138) (23) 0 (5) 539
C&A (559) (4) (7) (120) (11) (417)
Core Bank 3,709 (665) (369) (226) (42) 5,012
NCOU (1,112) (20) (101) (20) (0) (970)
Group 2,597 (685) (470) (246) (43) 4,042
2Q2014 results29 July 2014
Deutsche Bank financial transparency. 30
Note: Figures may not add up due to rounding differences(1) Includes other severance and impairment of goodwill & intangibles
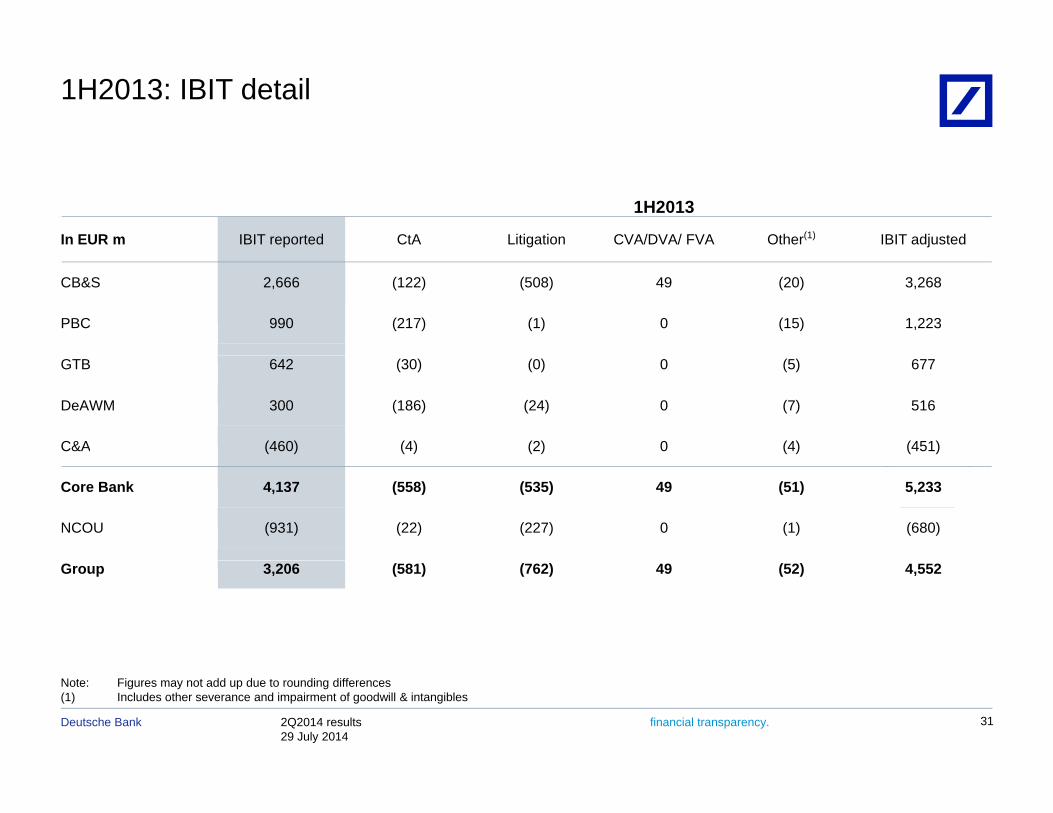
1H2013: IBIT detail
1H2013
In EUR m IBIT reported CtA Litigation CVA/DVA/ FVA Other(1) IBIT adjusted
CB&S 2,666 (122) (508) 49 (20) 3,268
PBC 990 (217) (1) 0 (15) 1,223
GTB 642 (30) (0) 0 (5) 677
DeAWM 300 (186) (24) 0 (7) 516
C&A (460) (4) (2) 0 (4) (451)
Core Bank 4,137 (558) (535) 49 (51) 5,233
NCOU (931) (22) (227) 0 (1) (680)
Group 3,206 (581) (762) 49 (52) 4,552
2Q2014 results29 July 2014
Deutsche Bank financial transparency. 31
Note: Figures may not add up due to rounding differences(1) Includes other severance and impairment of goodwill & intangibles
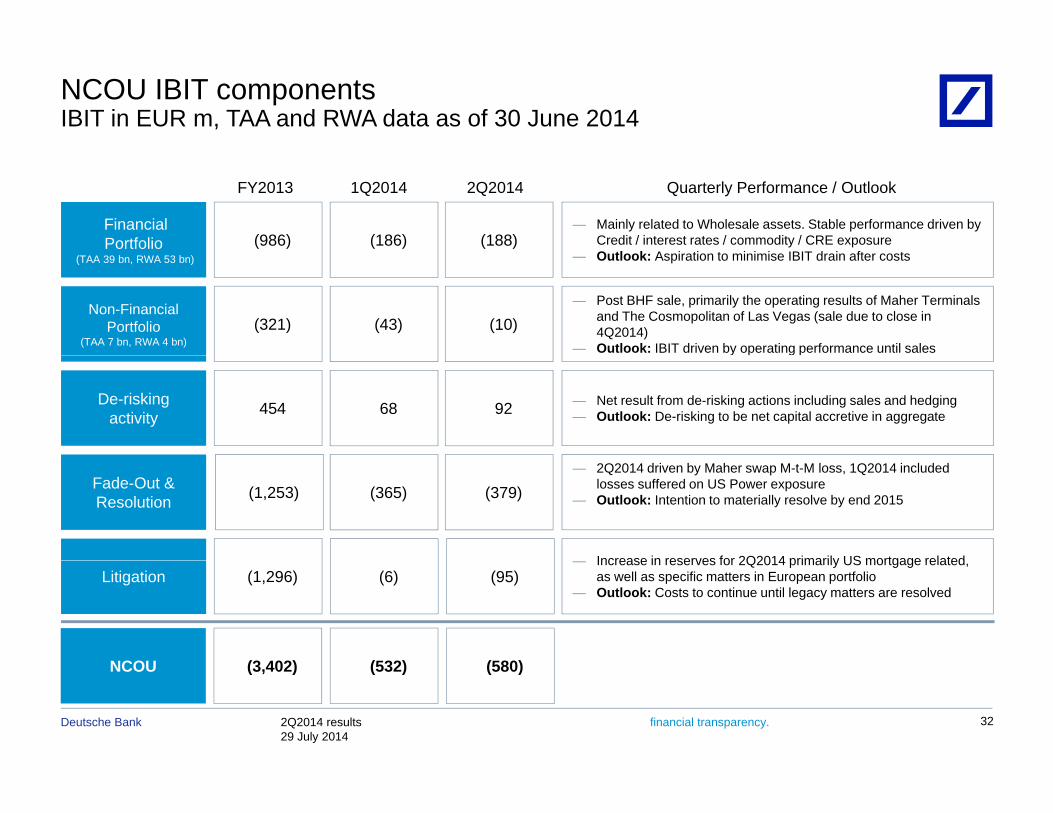
NCOU IBIT componentsIBIT in EUR m, TAA and RWA data as of 30 June 2014
FY2013 1Q2014 2Q2014 Quarterly Performance / Outlook
Financial Portfolio (986) (186) (188)
— Mainly related to Wholesale assets. Stable performance driven by Credit / interest rates / commodity / CRE exposureO tl k A i ti t i i i IBIT d i ft t(TAA 39 bn, RWA 53 bn) — Outlook: Aspiration to minimise IBIT drain after costs
Non-Financial Portfolio
(TAA 7 bn, RWA 4 bn)(321) (43) (10)
— Post BHF sale, primarily the operating results of Maher Terminals and The Cosmopolitan of Las Vegas (sale due to close in 4Q2014)
— Outlook: IBIT driven by operating performance until sales
De-riskingactivity 454 68 92 — Net result from de-risking actions including sales and hedging
— Outlook: De-risking to be net capital accretive in aggregate
y g
Increase in reserves for 2Q2014 primarily US mortgage related
— 2Q2014 driven by Maher swap M-t-M loss, 1Q2014 included losses suffered on US Power exposure
— Outlook: Intention to materially resolve by end 2015Fade-Out & Resolution (1,253) (365) (379)
NCOU (3 402) (532) (580)
Litigation (1,296) (6) (95)— Increase in reserves for 2Q2014 primarily US mortgage related,
as well as specific matters in European portfolio— Outlook: Costs to continue until legacy matters are resolved
2Q2014 results29 July 2014
Deutsche Bank financial transparency.
NCOU (3,402) (532) (580)
32
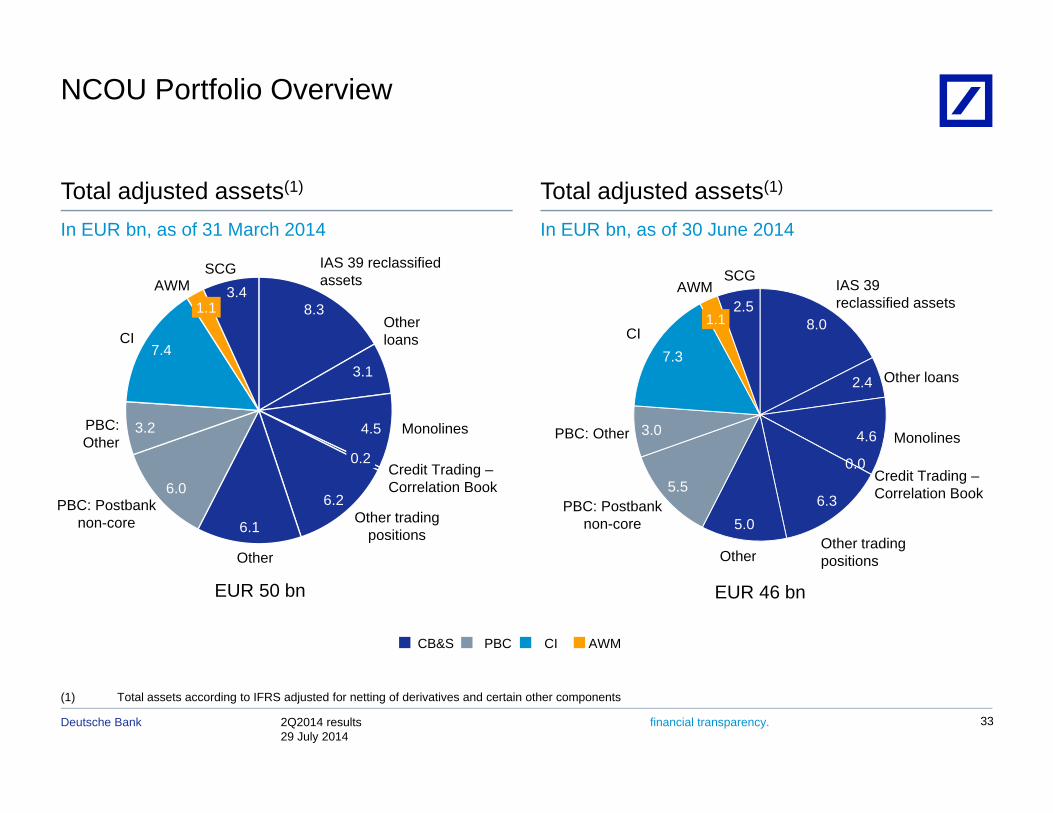
NCOU Portfolio Overview
Total adjusted assets(1)
In EUR bn, as of 31 March 2014
Total adjusted assets(1)
In EUR bn, as of 30 June 2014
IAS 39 reclassifiedassets
Other loansCI
AWM
7.4
1.1 8.38.0
7 3
1.12.5
AWM
CI
IAS 39 reclassified assets
SCG3.4
SCG
MonolinesPBC:Other
4.5
3.1
0 2
2.4
4.63.0
7.3
PBC: Other Monolines
Other loans
3.2
Other tradingpositions
Credit Trading –Correlation Book
PBC: Postbanknon-core
Other
6.1
6.0
0.2
6.2
0.0
6.35.0
5.5PBC: Postbank
non-coreOther trading positionsOther
Credit Trading –Correlation Book
EUR 50 bn
CB&S PBC CI AWM
EUR 46 bn
Other positionsOther
2Q2014 results29 July 2014
Deutsche Bank financial transparency. 33
(1) Total assets according to IFRS adjusted for netting of derivatives and certain other components
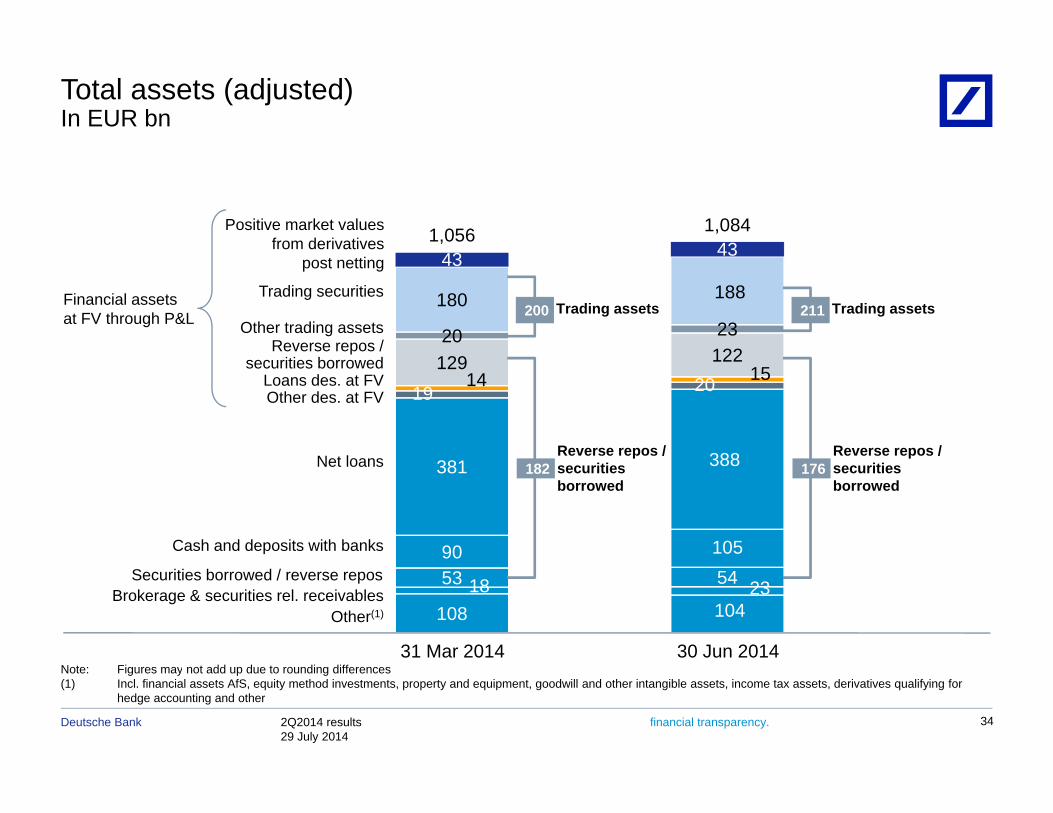
Total assets (adjusted)In EUR bn
43 431,056 1,084Positive market values
from derivatives
12220 23
180 188
43 43
Trading assets211
post netting
Trading securities
Reverse repos /
Financial assets at FV through P&L Other trading assets
Trading assets200
388
19 2014 15129 122
N t l
securities borrowed
Other des. at FVLoans des. at FV
Reverse repos / Reverse repos /
90 105
381 388
Cash and deposits with banks
Net loansp
securitiesborrowed
176p
securitiesborrowed
182
108 10418 2353 54 Securities borrowed / reverse repos
Other(1)Brokerage & securities rel. receivables
31 Mar 2014 30 Jun 2014
2Q2014 results29 July 2014
Deutsche Bank financial transparency. 34
Note: Figures may not add up due to rounding differences(1) Incl. financial assets AfS, equity method investments, property and equipment, goodwill and other intangible assets, income tax assets, derivatives qualifying for
hedge accounting and other
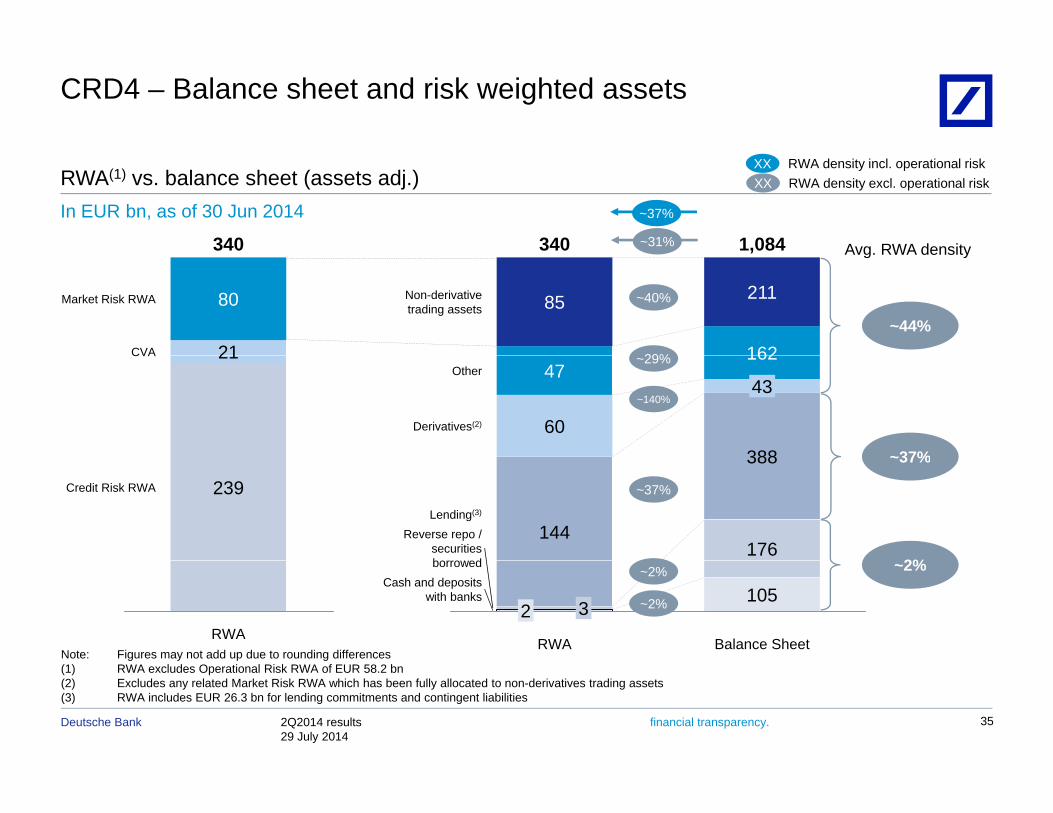
CRD4 – Balance sheet and risk weighted assets
RWA(1) vs. balance sheet (assets adj.)In EUR bn, as of 30 Jun 2014
XX RWA density incl. operational riskXX RWA density excl. operational risk
340 1,084340 ~31%
~37%
Avg RWA density
6464Market Risk RWA 80
CVA 21
Non-derivativetrading assets
,
162
21185 ~40%
29%
Avg. RWA density
~44%
250
CVA 21
Derivatives(2)
Other
388
43
162
60
47~140%
~29%
~37%250Credit Risk RWA 239
Reverse repo /securitiesb d
Lending(3)
176
388
144
~37%
2%
~37%
Note: Figures may not add up due to rounding differencesRWA
Cash and depositswith banks
borrowed
Balance Sheet
105
RWA
2 3 ~2%
~2% ~2%
2Q2014 results29 July 2014
Deutsche Bank financial transparency.
(1) RWA excludes Operational Risk RWA of EUR 58.2 bn(2) Excludes any related Market Risk RWA which has been fully allocated to non-derivatives trading assets(3) RWA includes EUR 26.3 bn for lending commitments and contingent liabilities
35
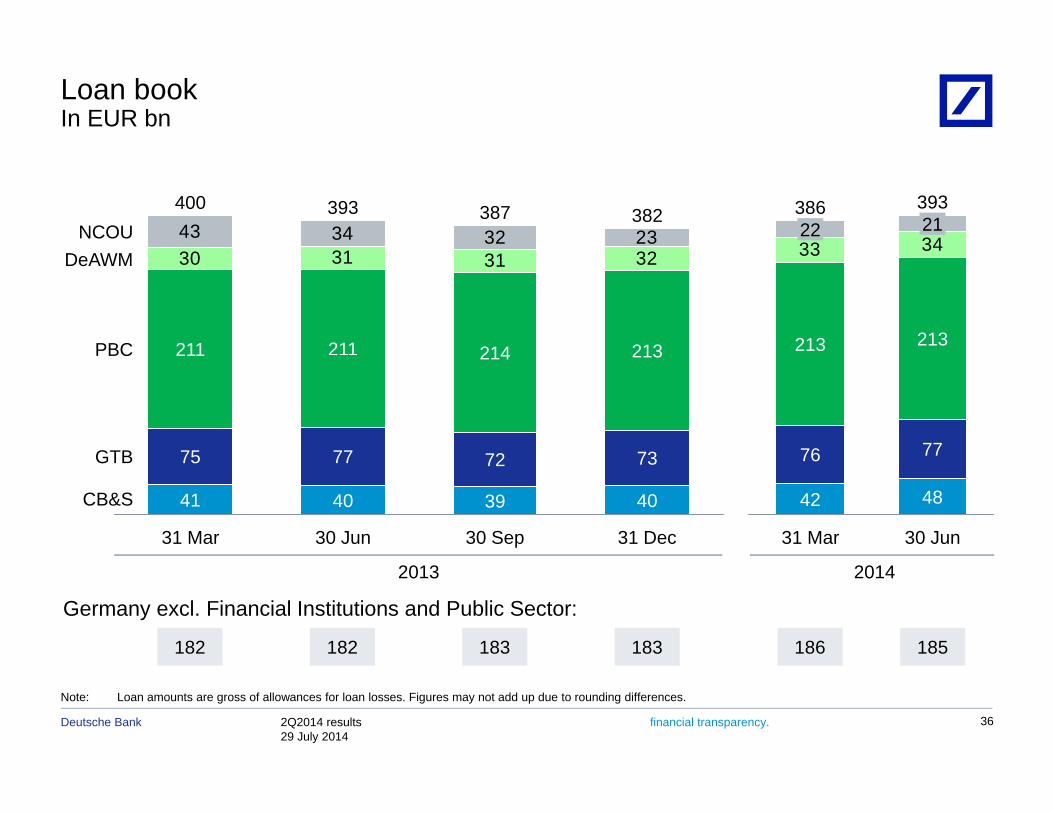
Loan bookIn EUR bn
30 31 3243 34 32 23NCOU
D AWM
382387393400
33 3421393
22386
30 31 31 32DeAWM
PBC 211 213211 214
33
213213PBC 211
73
213
GTB 75 77 72
214
7776
40
73
31 Dec
GTB
CB&S 41
75
40
77
39
72
31 Mar 30 Jun 30 Sep
4842
76
31 Mar 30 Jun
182
Germany excl. Financial Institutions and Public Sector:
2013
182 183
2014
183 186 185
2Q2014 results29 July 2014
Deutsche Bank financial transparency. 36
Note: Loan amounts are gross of allowances for loan losses. Figures may not add up due to rounding differences.
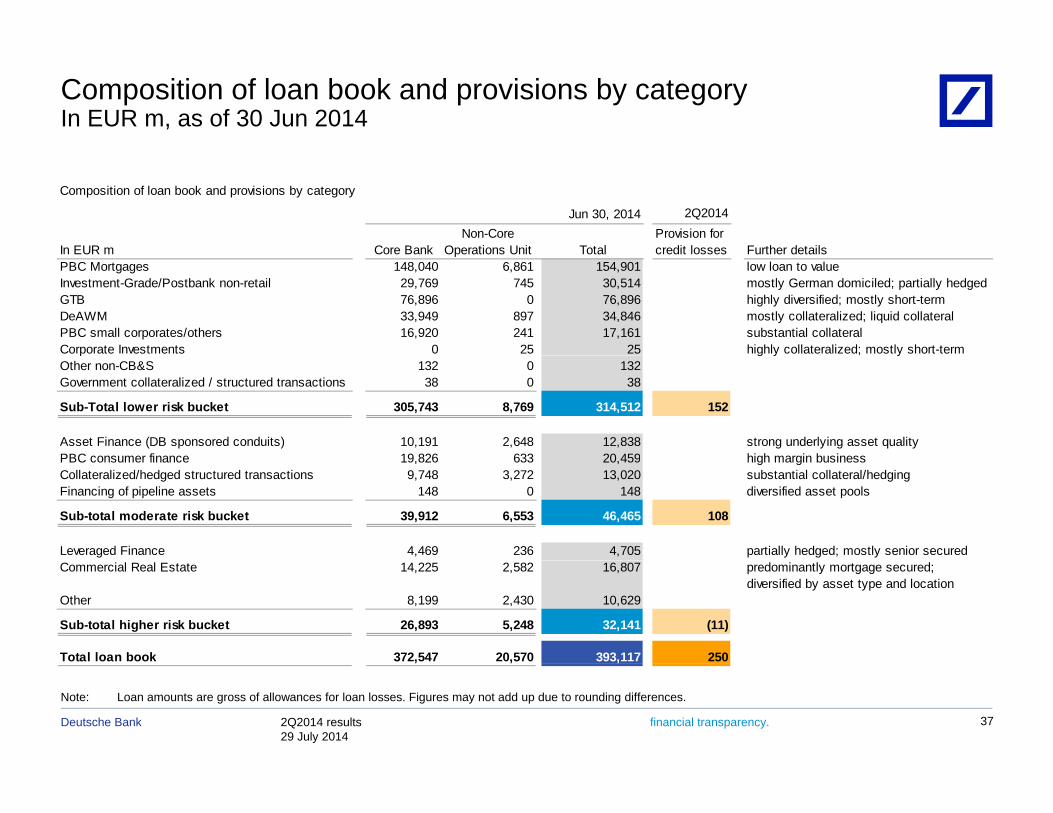
Composition of loan book and provisions by category In EUR m, as of 30 Jun 2014
Composition of loan book and provisions by category
2Q2014
In EUR m Core BankNon-Core
Operations Unit TotalProvision for credit losses Further details
Jun 30, 2014
In EUR m Core Bank Operations Unit Total credit losses Further detailsPBC Mortgages 148,040 6,861 154,901 low loan to valueInvestment-Grade/Postbank non-retail 29,769 745 30,514 mostly German domiciled; partially hedgedGTB 76,896 0 76,896 highly diversified; mostly short-termDeAWM 33,949 897 34,846 mostly collateralized; liquid collateralPBC small corporates/others 16,920 241 17,161 substantial collateralCorporate Investments 0 25 25 highly collateralized; mostly short-termp g y yOther non-CB&S 132 0 132Government collateralized / structured transactions 38 0 38
Sub-Total lower risk bucket 305,743 8,769 314,512 152
Asset Finance (DB sponsored conduits) 10,191 2,648 12,838 strong underlying asset qualityPBC consumer finance 19 826 633 20 459 high margin businessPBC consumer finance 19,826 633 20,459 high margin businessCollateralized/hedged structured transactions 9,748 3,272 13,020 substantial collateral/hedgingFinancing of pipeline assets 148 0 148 diversified asset pools
Sub-total moderate risk bucket 39,912 6,553 46,465 108
Leveraged Finance 4,469 236 4,705 partially hedged; mostly senior securedCommercial Real Estate 14,225 2,582 16,807 predominantly mortgage secured;
diversified by asset type and locationOther 8,199 2,430 10,629
Sub-total higher risk bucket 26,893 5,248 32,141 (11)
Total loan book 372,547 20,570 393,117 250
2Q2014 results29 July 2014
Deutsche Bank financial transparency. 37
, , ,
Note: Loan amounts are gross of allowances for loan losses. Figures may not add up due to rounding differences.
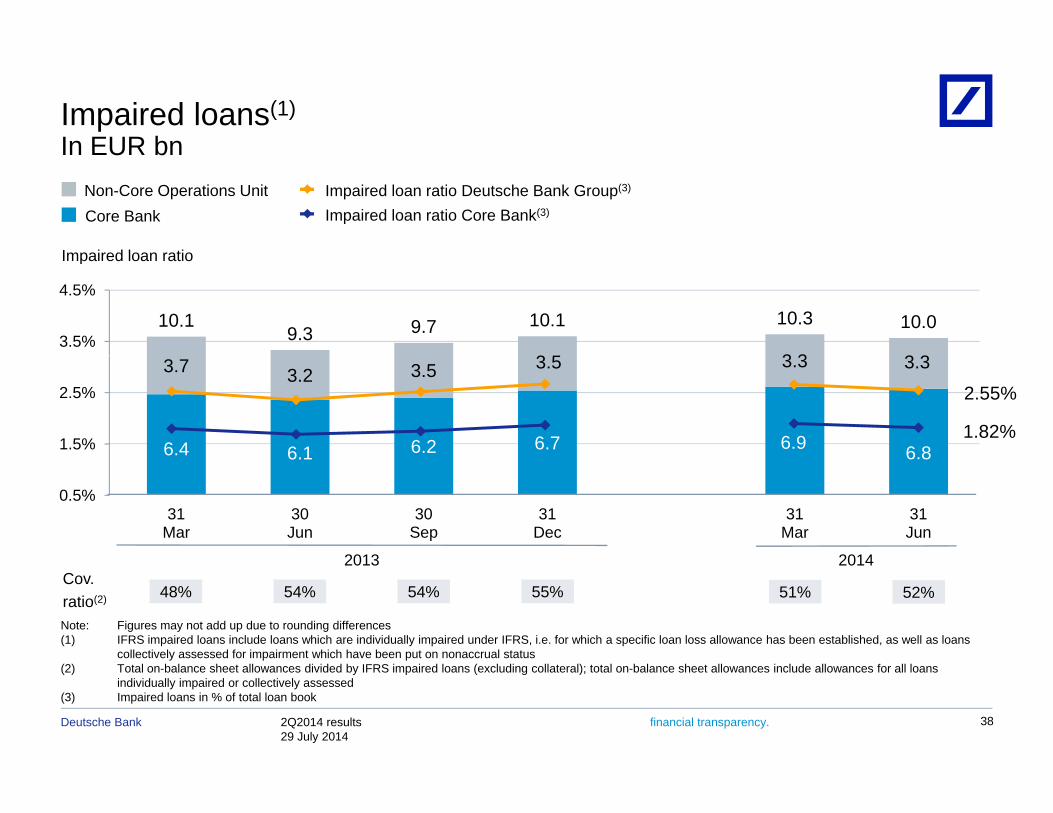
Impaired loans(1)
In EUR bnIn EUR bnNon-Core Operations UnitCore Bank
Impaired loan ratio Deutsche Bank Group(3)
Impaired loan ratio Core Bank(3)
Impaired loan ratio
3 5 3 3 3 3
10.19.3 9.7 10.1 10.3 10.0
3.5%
4.5%
Impaired loan ratio
6.4 6.1 6.2 6.7 6.9 6.8
3.7 3.2 3.5 3.5 3.3 3.3
1.5%
2.5% 2.55%
1.82%6.1 6.8
31Mar
30Jun
30Sep
31Dec
31Mar
31Jun
0.5%
2013 2014
Note: Figures may not add up due to rounding differences(1) IFRS impaired loans include loans which are individually impaired under IFRS, i.e. for which a specific loan loss allowance has been established, as well as loans
collectively assessed for impairment which have been put on nonaccrual status
Cov.ratio(2)
2013
48% 54% 54% 55%
2014
52%51%
2Q2014 results29 July 2014
Deutsche Bank financial transparency. 38
(2) Total on-balance sheet allowances divided by IFRS impaired loans (excluding collateral); total on-balance sheet allowances include allowances for all loans individually impaired or collectively assessed
(3) Impaired loans in % of total loan book
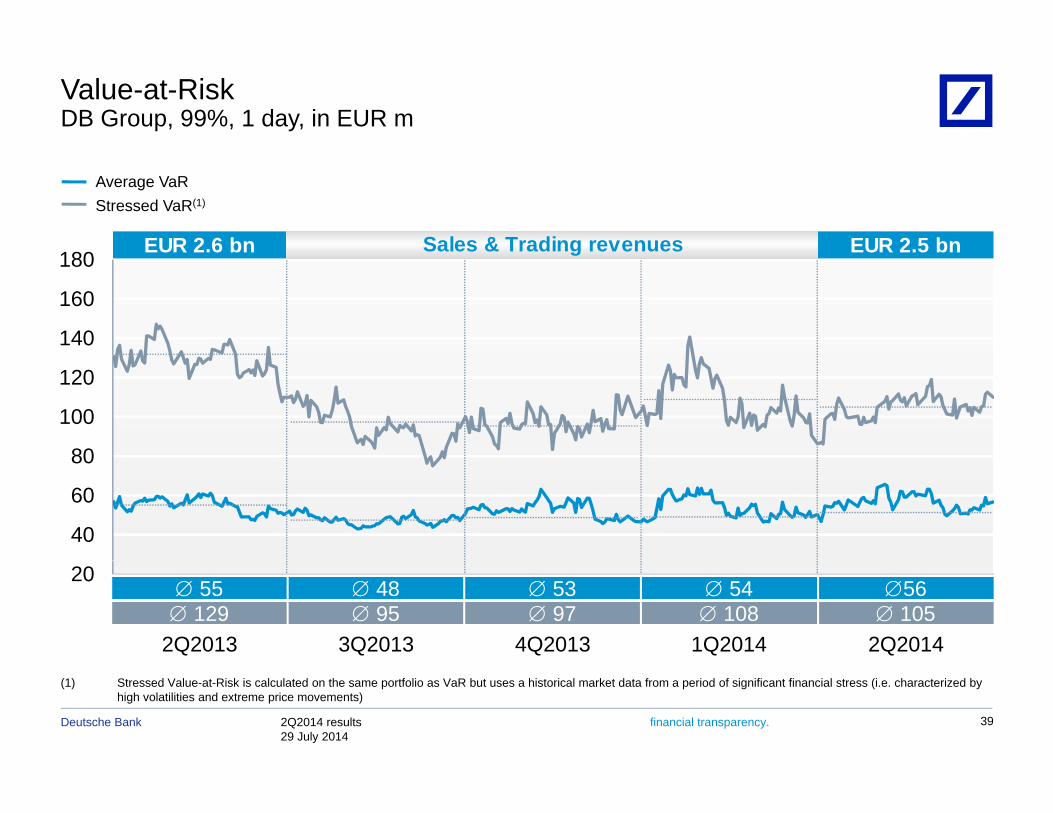
Value-at-RiskDB Group, 99%, 1 day, in EUR m
180
Average VaRStressed VaR(1)
EUR 2.6 bn EUR 2.5 bnSales & Trading revenues
140
160
180g
80
100
120
40
60
80
20
2Q2013 2Q2014
55 48 129 95
56 105
3Q2013
53 97
4Q2013 1Q2014
54 108
2Q2014 results29 July 2014
Deutsche Bank financial transparency. 39
(1) Stressed Value-at-Risk is calculated on the same portfolio as VaR but uses a historical market data from a period of significant financial stress (i.e. characterized by high volatilities and extreme price movements)
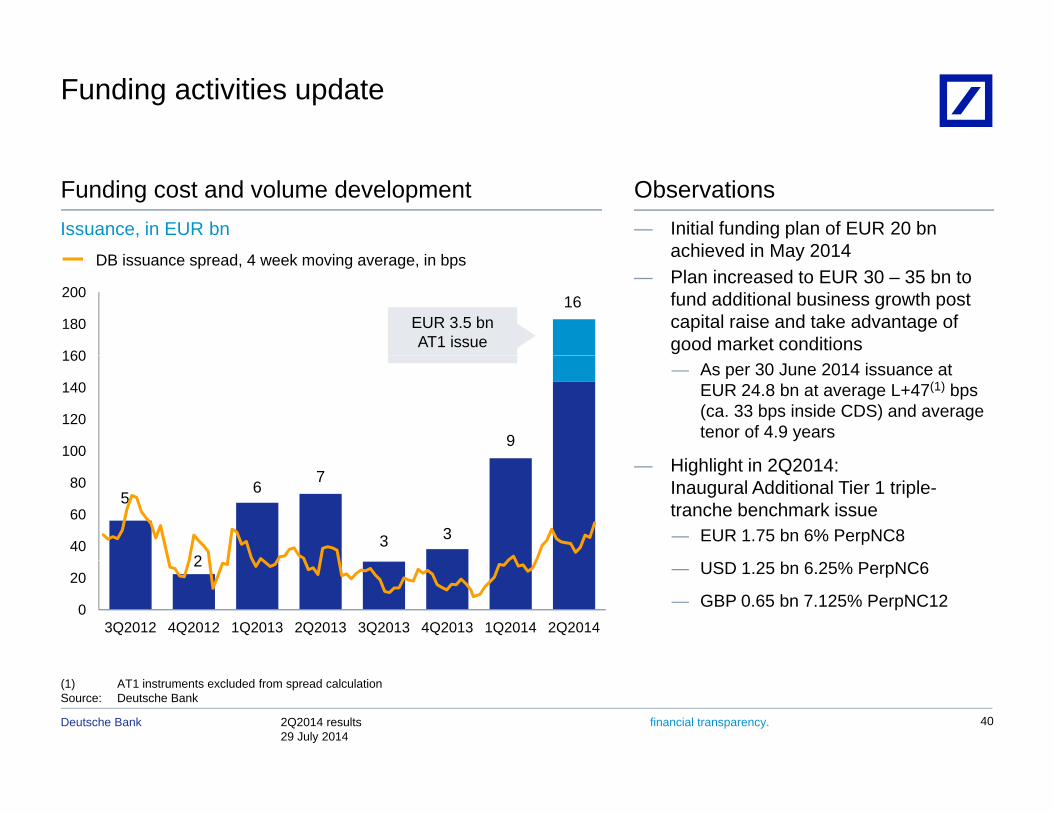
Funding activities update
Observations— Initial funding plan of EUR 20 bn
achieved in May 2014
Funding cost and volume developmentIssuance, in EUR bn
16
160
180
200
achieved in May 2014— Plan increased to EUR 30 – 35 bn to
fund additional business growth post capital raise and take advantage of good market conditions
EUR 3.5 bnAT1 issue
DB issuance spread, 4 week moving average, in bps
9100
120
140
160— As per 30 June 2014 issuance at
EUR 24.8 bn at average L+47(1) bps (ca. 33 bps inside CDS) and average tenor of 4.9 years
Q
5
2
6 7
3 340
60
80— Highlight in 2Q2014:
Inaugural Additional Tier 1 triple-tranche benchmark issue — EUR 1.75 bn 6% PerpNC8
2
3Q2012 4Q2012 1Q2013 2Q2013 3Q2013 4Q2013 1Q2014 2Q20140
20 — USD 1.25 bn 6.25% PerpNC6
— GBP 0.65 bn 7.125% PerpNC12
2Q2014 results29 July 2014
Deutsche Bank financial transparency. 40
(1) AT1 instruments excluded from spread calculationSource: Deutsche Bank
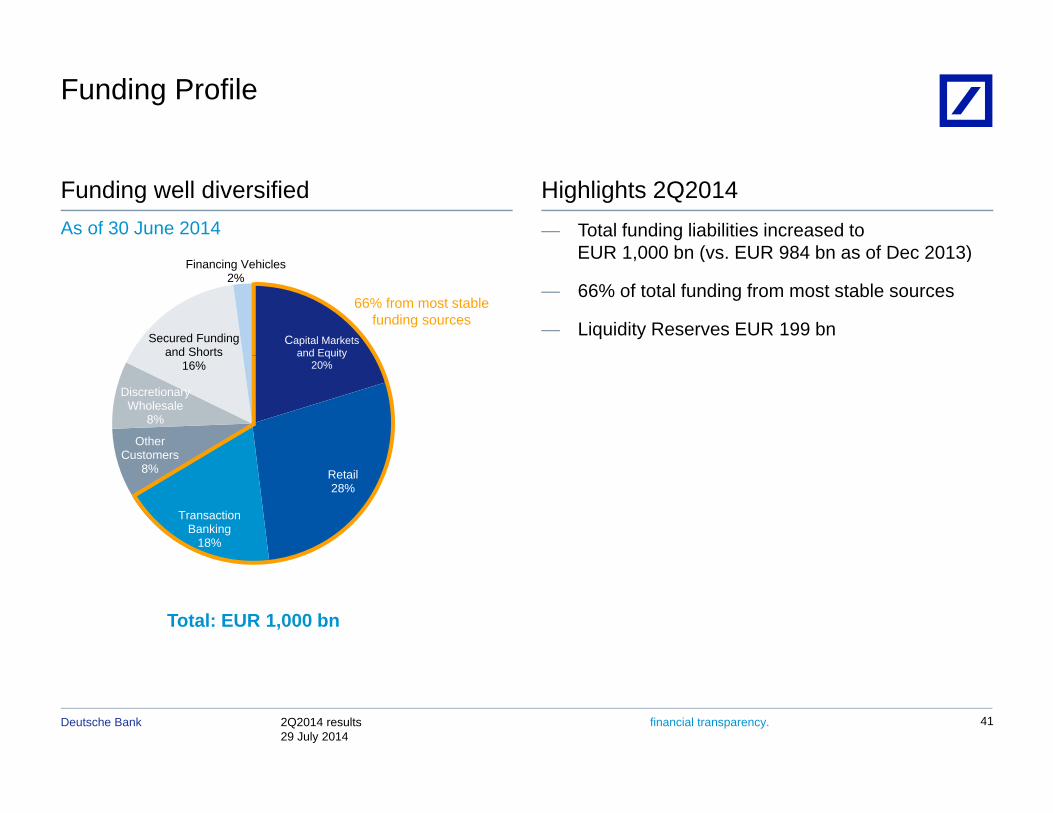
Funding Profile
— Total funding liabilities increased to EUR 1 000 bn (vs EUR 984 bn as of Dec 2013)
Highlights 2Q2014Funding well diversifiedAs of 30 June 2014
EUR 1,000 bn (vs. EUR 984 bn as of Dec 2013)
— 66% of total funding from most stable sources
— Liquidity Reserves EUR 199 bnCapital Markets
and EquitySecured Funding
and Shorts
Financing Vehicles2%
66% from most stable funding sources
and Equity20%
OtherCustomers
Discretionary Wholesale
8%
and Shorts16%
Retail28%
TransactionBanking
18%
Customers8%
Total: EUR 1,000 bn
2Q2014 results29 July 2014
Deutsche Bank financial transparency. 41
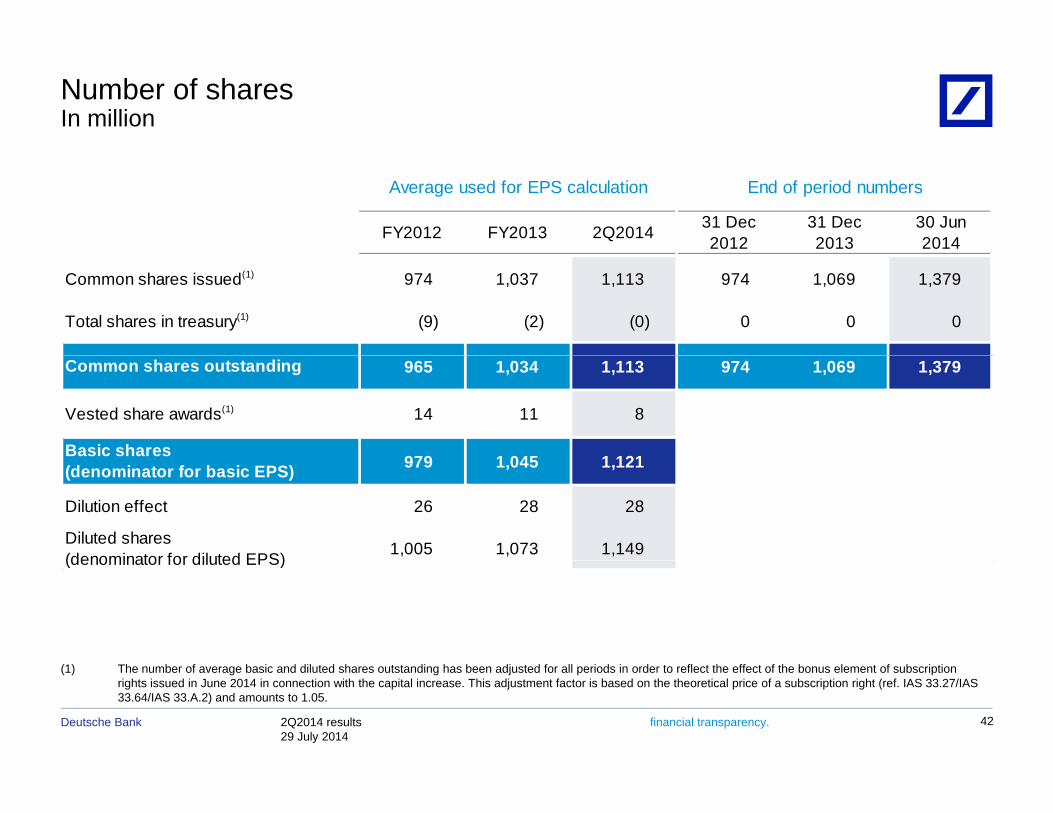
Number of sharesIn million
FY2012 FY2013 2Q2014 31 Dec2012
31 Dec2013
30 Jun2014
End of period numbersAverage used for EPS calculation
Common shares issued(1) 974 1,037 1,113 974 1,069 1,379
Total shares in treasury(1) (9) (2) (0) 0 0 0
965 1,034 1,113 974 1,069 1,379
Vested share awards(1) 14 11 8
979 1 045 1 121
Common shares outstanding
Basic shares 979 1,045 1,121
Dilution effect 26 28 28
1,005 1,073 1,149Diluted shares(denominator for diluted EPS)
(denominator for basic EPS)
(denominator for diluted EPS)
2Q2014 results29 July 2014
Deutsche Bank financial transparency. 42
(1) The number of average basic and diluted shares outstanding has been adjusted for all periods in order to reflect the effect of the bonus element of subscription rights issued in June 2014 in connection with the capital increase. This adjustment factor is based on the theoretical price of a subscription right (ref. IAS 33.27/IAS 33.64/IAS 33.A.2) and amounts to 1.05.
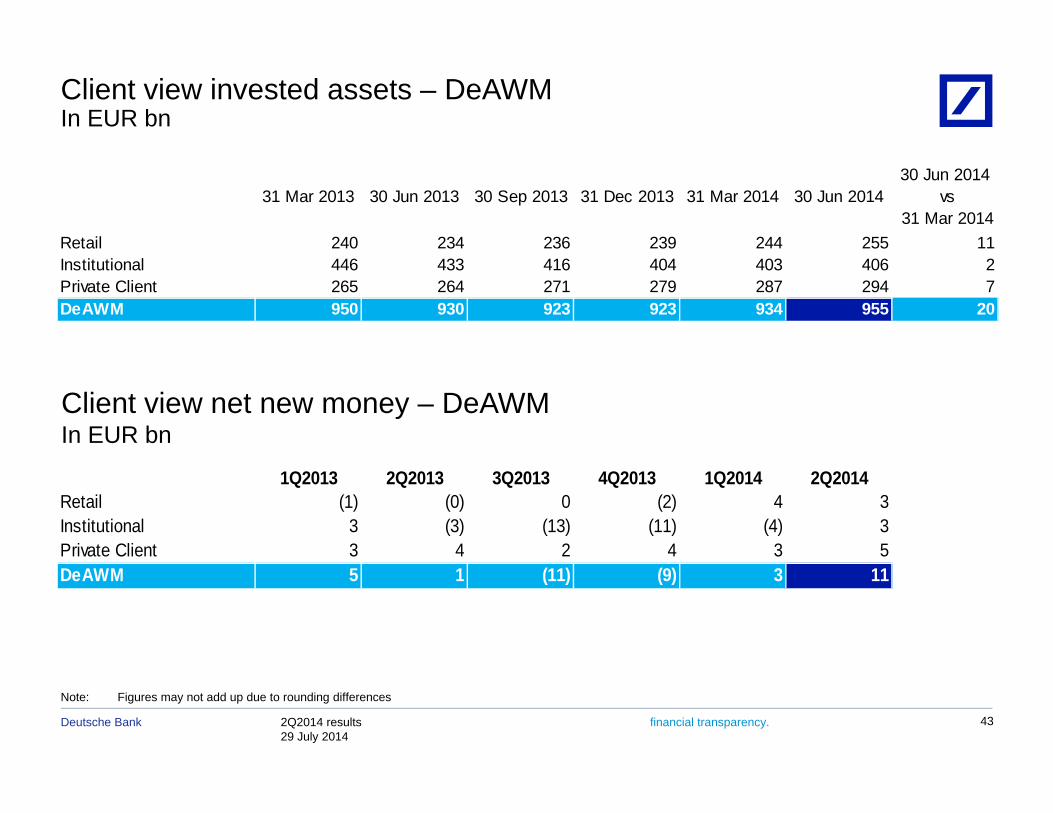
Client view invested assets – DeAWMIn EUR bn
31 Mar 2013 30 Jun 2013 30 Sep 2013 31 Dec 2013 31 Mar 2014 30 Jun 201430 Jun 2014
vs 31 Mar 2014
Retail 240 234 236 239 244 255 11Institutional 446 433 416 404 403 406 2Private Client 265 264 271 279 287 294 7DeAWM 950 930 923 923 934 955 20
Client view net new money – DeAWMIn EUR bn
1Q2013 2Q2013 3Q2013 4Q2013 1Q2014 2Q2014Retail (1) (0) 0 (2) 4 3Institutional 3 (3) (13) (11) (4) 3Private Client 3 4 2 4 3 5DeAWM 5 1 (11) (9) 3 11
2Q2014 results29 July 2014
Deutsche Bank financial transparency. 43
Note: Figures may not add up due to rounding differences
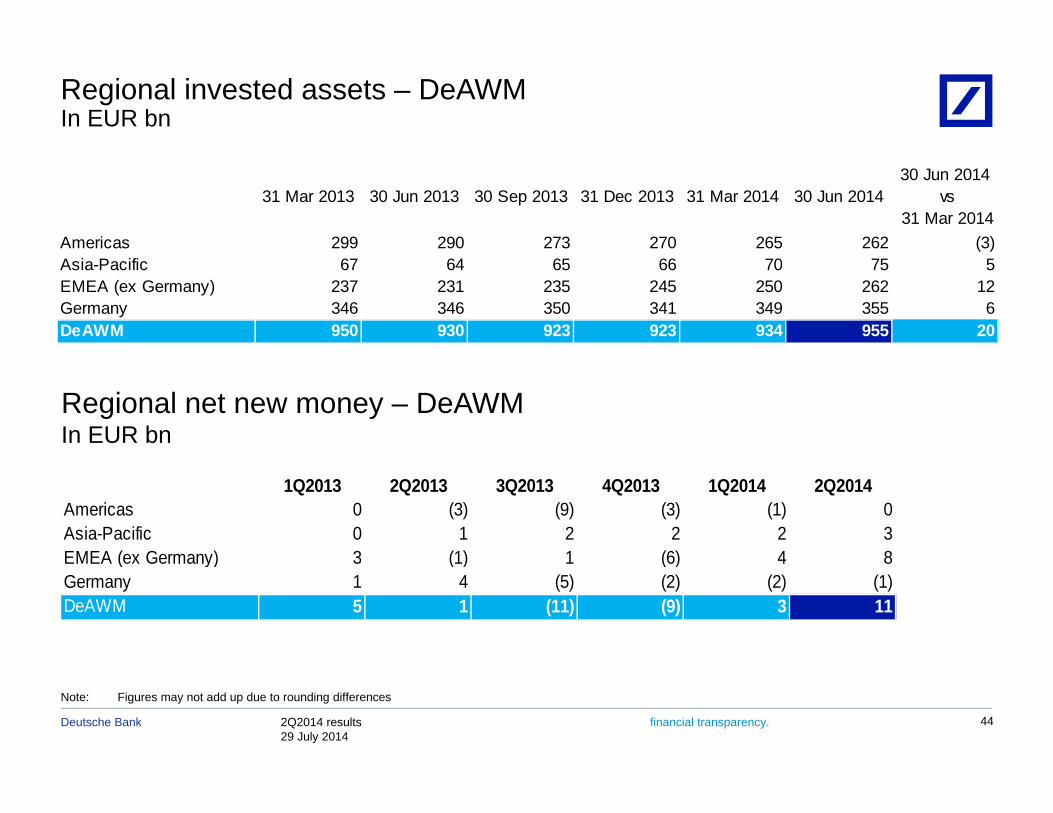
Regional invested assets – DeAWMIn EUR bn
31 Mar 2013 30 Jun 2013 30 Sep 2013 31 Dec 2013 31 Mar 2014 30 Jun 201430 Jun 2014
vs 31 Mar 2014
Americas 299 290 273 270 265 262 (3)Asia-Pacific 67 64 65 66 70 75 5EMEA (ex Germany) 237 231 235 245 250 262 12Germany 346 346 350 341 349 355 6DeAWM 950 930 923 923 934 955 20
Regional net new money – DeAWMIn EUR bn
1Q2013 2Q2013 3Q2013 4Q2013 1Q2014 2Q2014Americas 0 (3) (9) (3) (1) 0Asia-Pacific 0 1 2 2 2 3EMEA (ex Germany) 3 (1) 1 (6) 4 8EMEA (ex Germany) 3 (1) 1 (6) 4 8Germany 1 4 (5) (2) (2) (1)DeAWM 5 1 (11) (9) 3 11
2Q2014 results29 July 2014
Deutsche Bank financial transparency. 44
Note: Figures may not add up due to rounding differences
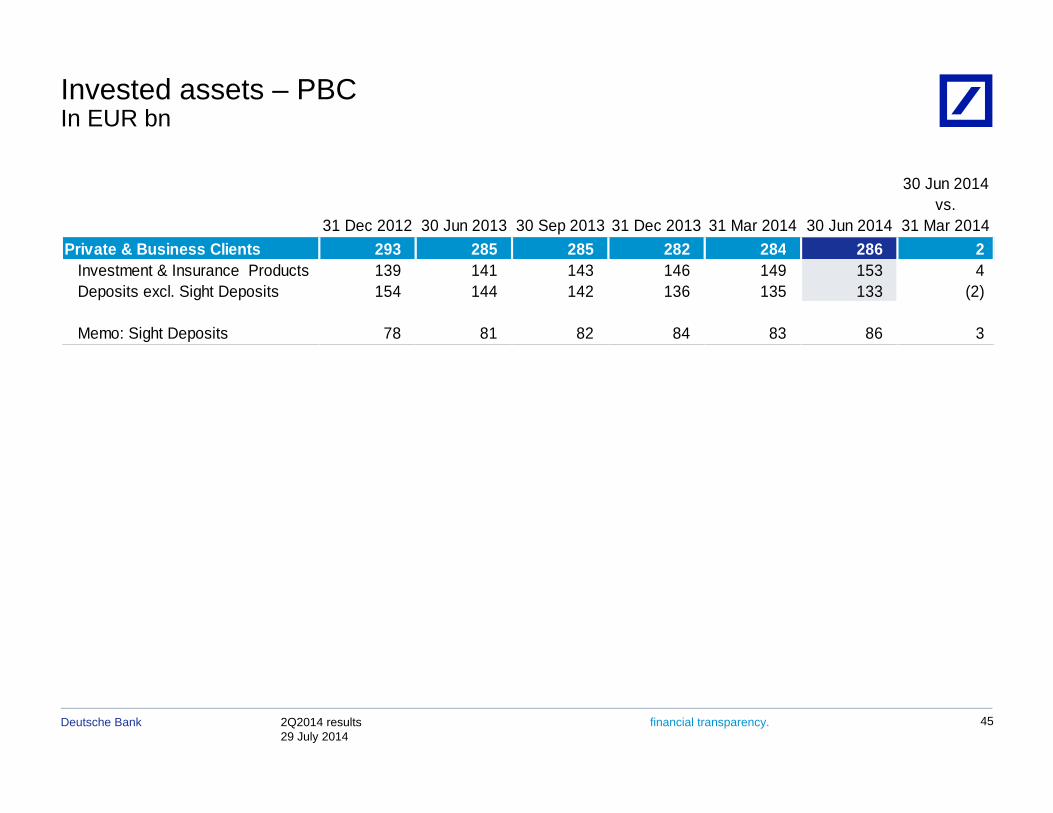
Invested assets – PBCIn EUR bn
31 Dec 2012 30 Jun 2013 30 Sep 2013 31 Dec 2013 31 Mar 2014 30 Jun 2014
30 Jun 2014vs.
31 Mar 2014Private & Business Clients 293 285 285 282 284 286 2Private & Business Clients 293 285 285 282 284 286 2
Investment & Insurance Products 139 141 143 146 149 153 4Deposits excl. Sight Deposits 154 144 142 136 135 133 (2)
Memo: Sight Deposits 78 81 82 84 83 86 3
2Q2014 results29 July 2014
Deutsche Bank financial transparency. 45
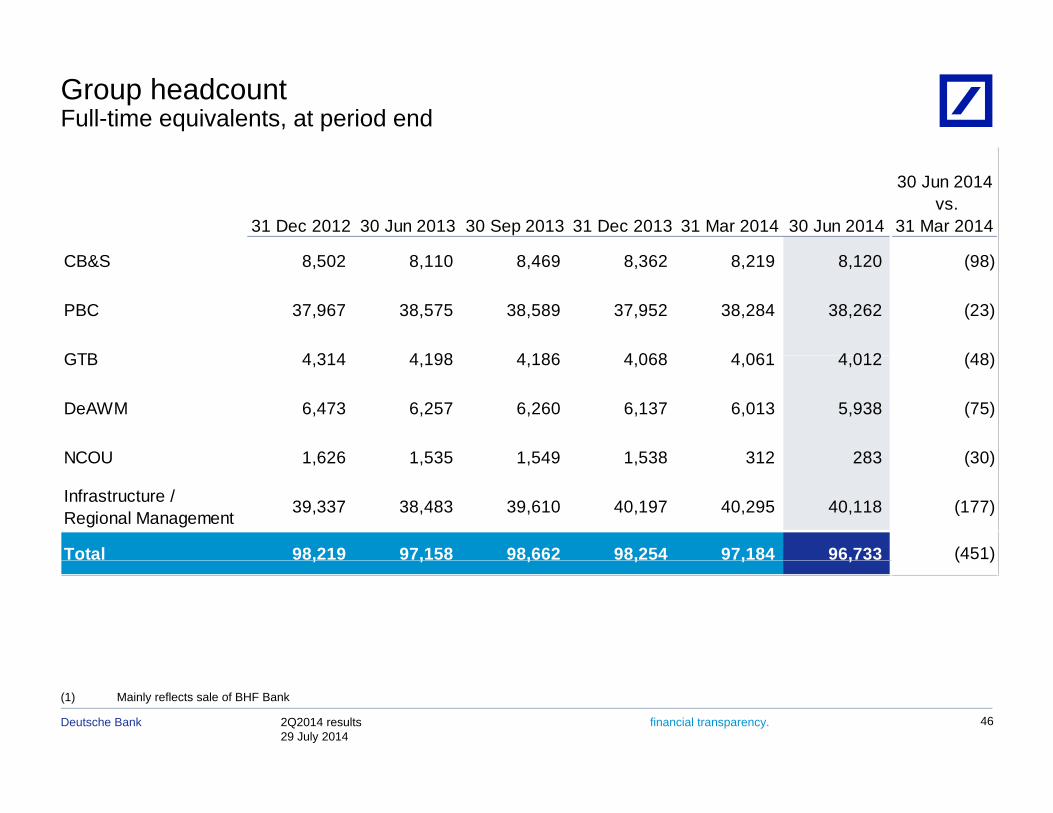
Group headcountFull-time equivalents, at period end
31 Dec 2012 30 Jun 2013 30 Sep 2013 31 Dec 2013 31 Mar 2014 30 Jun 2014
30 Jun 2014 vs.
31 Mar 2014
CB&S 8,502 8,110 8,469 8,362 8,219 8,120 (98)
PBC 37,967 38,575 38,589 37,952 38,284 38,262 (23)
GTB 4 314 4 198 4 186 4 068 4 061 4 012 (48)GTB 4,314 4,198 4,186 4,068 4,061 4,012 (48)
DeAWM 6,473 6,257 6,260 6,137 6,013 5,938 (75)
NCOU 1 626 1 535 1 549 1 538 312 283 (30)NCOU 1,626 1,535 1,549 1,538 312 283 (30)
Infrastructure / Regional Management 39,337 38,483 39,610 40,197 40,295 40,118 (177)
Total 98,219 97,158 98,662 98,254 97,184 96,733 (451), , , , , , ( )
2Q2014 results29 July 2014
Deutsche Bank financial transparency. 46
(1) Mainly reflects sale of BHF Bank
Cautionary statements
This presentation contains forward-looking statements. Forward-looking statements are statements that are not historicalfacts; they include statements about our beliefs and expectations and the assumptions underlying them. These; y p p y gstatements are based on plans, estimates and projections as they are currently available to the management of DeutscheBank. Forward-looking statements therefore speak only as of the date they are made, and we undertake no obligation toupdate publicly any of them in light of new information or future events.
By their very nature forward-looking statements involve risks and uncertainties A number of important factors couldBy their very nature, forward looking statements involve risks and uncertainties. A number of important factors couldtherefore cause actual results to differ materially from those contained in any forward-looking statement. Such factorsinclude the conditions in the financial markets in Germany, in Europe, in the United States and elsewhere from which wederive a substantial portion of our revenues and in which we hold a substantial portion of our assets, the development ofasset prices and market volatility, potential defaults of borrowers or trading counterparties, the implementation of ourstrategic initiatives, the reliability of our risk management policies, procedures and methods, and other risks referenced inour filings with the U.S. Securities and Exchange Commission. Such factors are described in detail in our SEC Form20-F of 20 March 2014 under the heading “Risk Factors.” Copies of this document are readily available upon request orcan be downloaded from www.db.com/ir.
This presentation also contains non-IFRS financial measures. For a reconciliation to directly comparable figures reportedunder IFRS, to the extent such reconciliation is not provided in this presentation, refer to the 2Q2014 Financial DataSupplement, which is accompanying this presentation and available at www.db.com/ir.
2Q2014 results29 July 2014
Deutsche Bank financial transparency. 47