Embed Size (px)
Citation preview
8/20/2019 2Q15 Quarterly Financial Reports
http://slidepdf.com/reader/full/2q15-quarterly-financial-reports 1/53
( Convenience Translation into English from the
Original Previously Issued in Portuguese)
Mills Estruturas e Serviços
de Engenharia S.A.
Presentation of Interim Financial Information
for the Quarter Ended June 30, 2015 andReport on Review of Interim FinancialInformation
Deloitte Touche Tohmatsu Auditores Independentes
8/20/2019 2Q15 Quarterly Financial Reports
http://slidepdf.com/reader/full/2q15-quarterly-financial-reports 2/53
(Convenience Translation into English from the Original Previously Issued in Portuguese)
REPORT ON REVIEW OF INTERIM FINANCIAL INFORMATION
To the Board of Directors and Shareholders ofMills Estruturas e Serviços de Engenharia S.A.Rio de Janeiro - RJ
Introduction
We have reviewed the accompanying interim financial information, of Mills Estruturas e Serviçosde Engenharia S.A. (“Company”) included in the Interim Financial Information Form (ITR), for thethree-month period ended June 30, 2015, which comprises the balance sheet as of June 30, 2015and the related statements of income, comprehensive income, for the three and six-month periodsthen ended, and the statements of changes in equity and cash flows for the six-month period then
ended, including the explanatory notes.
The company’s management is responsible for the preparation of interim financial information inaccordance with technical pronouncement CPC 21 (R1) - Interim Financial Reporting and IAS 34 -Interim Financial Reporting, issued by the International Accounting Standards Board (IASB), aswell as for the presentation of such information in accordance with the standards issued by theBrazilian Securities and Exchange Commission (CVM), applicable to the preparation of InterimFinancial Information (ITR). Our responsibility is to express a conclusion on this interim financialinformation based on our review.
Scope of review
We conducted our review in accordance with Brazilian and international standards on review ofinterim financial information (NBCTR 2410 and ISRE 2410 – Review of Interim FinancialInformation Performed by the Independent Auditor of the Entity, respectively). A review of interimfinancial information consists of making inquiries, primarily of persons responsible for financialand accounting matters, and applying analytical and other review procedures. A review issubstantially less in scope than an audit conducted in accordance with the standards on auditing andconsequently does not enable us to obtain assurance that we would become aware of all significantmatters that might be identified in an audit. Accordingly, we do not express an audit opinion.
Conclusion on the interim financial information
Based on our review, nothing has come to our attention that causes us to believe that theaccompanying interim financial information, included in the ITR referred to above, was not
prepared, in all material respects, in accordance with technical pronouncement CPC 21(R1) andinternational standard IAS 34, applicable to the preparation of Interim Financial Information (ITR),and presented in accordance with the standards issued by the CVM.
8/20/2019 2Q15 Quarterly Financial Reports
http://slidepdf.com/reader/full/2q15-quarterly-financial-reports 3/53
Deloitte Touche Tohmatsu
2
Other matters
Statements of value added
We have also reviewed the interim statement of value added (“DVA”), for the six-month periodended June 30, 2015, prepared under the responsibility of the Company's management, the
presentation of which is required by the standards issued by the CVM applicable to the preparationof Interim Financial Information (ITR), and considered as supplemental information for IFRS,which do not require the presentation of DVA. This statement was subject to the same review
procedures described above, and, based on our review, nothing has come to our attention that causesus to believe that it was not prepared, in all material respects, consistently with the interim financialinformation taken as a whole.
The accompanying interim financial information has been translated into English for theconvenience of readers outside Brazil.
Rio de Janeiro, August 5, 2015
DELOITTE TOUCHE TOHMATSU Fernando de Souza Leite
Auditores Independentes Engagement Partner
8/20/2019 2Q15 Quarterly Financial Reports
http://slidepdf.com/reader/full/2q15-quarterly-financial-reports 4/53
3
(Convenience Translation into English from the Original Previously Issued in Portuguese)
MILLS ESTRUTURAS E SERVIÇOS DE ENGENHARIA S.A.
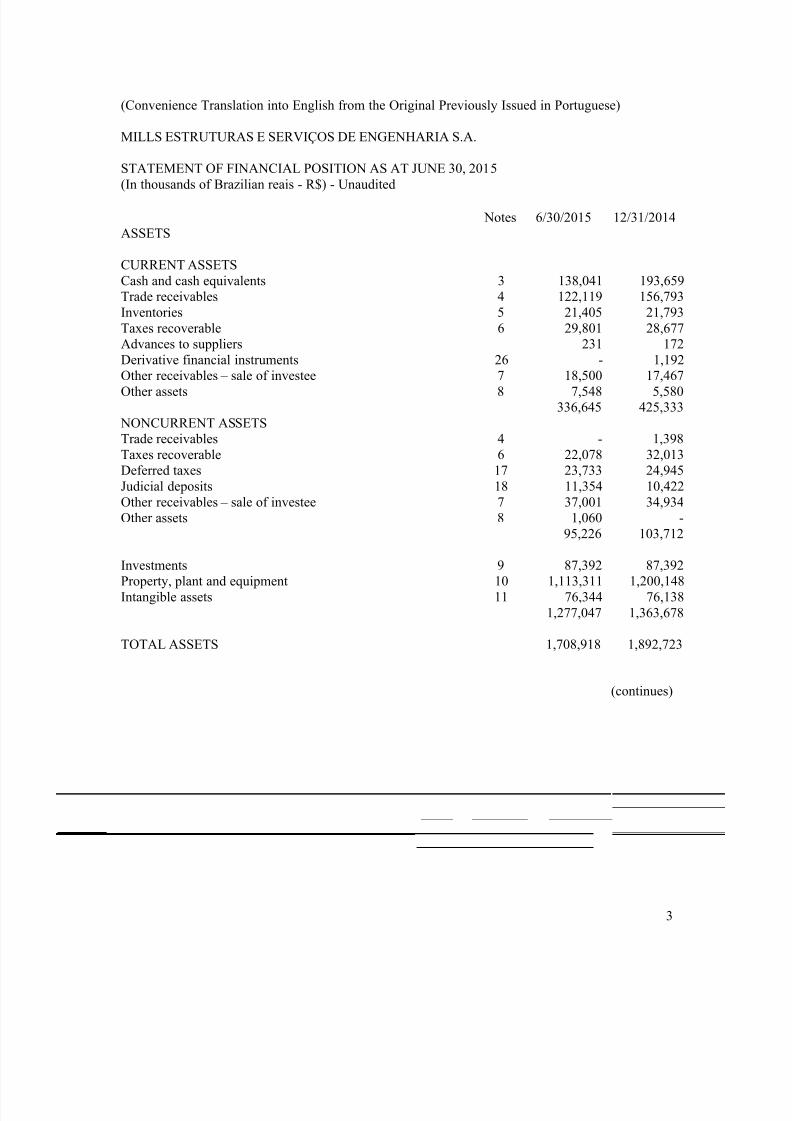
STATEMENT OF FINANCIAL POSITION AS AT JUNE 30, 2015(In thousands of Brazilian reais - R$) - Unaudited
Notes 6/30/2015 12/31/2014ASSETS
CURRENT ASSETSCash and cash equivalents 3 138,041 193,659Trade receivables 4 122,119 156,793Inventories 5 21,405 21,793Taxes recoverable 6 29,801 28,677
Advances to suppliers 231 172Derivative financial instruments 26 - 1,192Other receivables – sale of investee 7 18,500 17,467Other assets 8 7,548 5,580
336,645 425,333 NONCURRENT ASSETSTrade receivables 4 - 1,398Taxes recoverable 6 22,078 32,013Deferred taxes 17 23,733 24,945Judicial deposits 18 11,354 10,422Other receivables – sale of investee 7 37,001 34,934Other assets 8 1,060 -
95,226 103,712
Investments 9 87,392 87,392Property, plant and equipment 10 1,113,311 1,200,148Intangible assets 11 76,344 76,138
1,277,047 1,363,678
TOTAL ASSETS 1,708,918 1,892,723
(continues)
8/20/2019 2Q15 Quarterly Financial Reports
http://slidepdf.com/reader/full/2q15-quarterly-financial-reports 5/53
4
(Convenience Translation into English from the Original Previously Issued in Portuguese)
MILLS ESTRUTURAS E SERVIÇOS DE ENGENHARIA S.A.
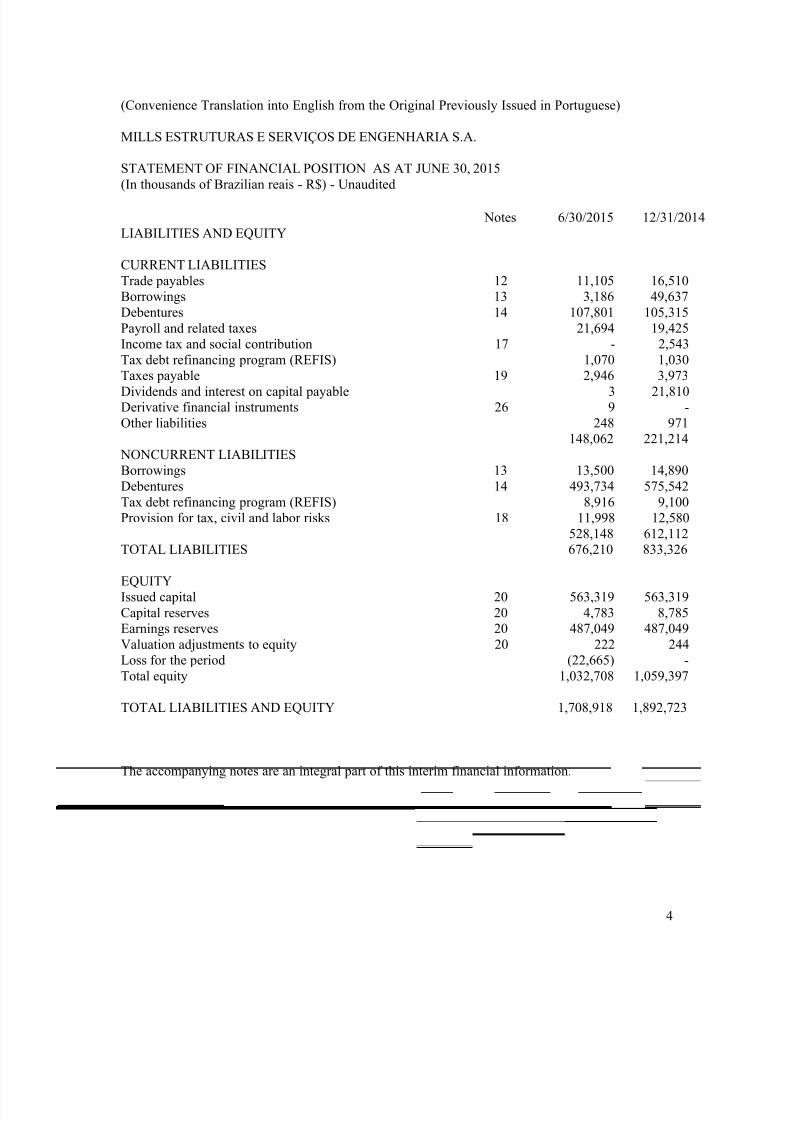
STATEMENT OF FINANCIAL POSITION AS AT JUNE 30, 2015(In thousands of Brazilian reais - R$) - Unaudited
Notes 6/30/2015 12/31/2014LIABILITIES AND EQUITY
CURRENT LIABILITIESTrade payables 12 11,105 16,510Borrowings 13 3,186 49,637Debentures 14 107,801 105,315Payroll and related taxes 21,694 19,425
Income tax and social contribution 17 - 2,543Tax debt refinancing program (REFIS) 1,070 1,030Taxes payable 19 2,946 3,973Dividends and interest on capital payable 3 21,810Derivative financial instruments 26 9 -Other liabilities 248 971
148,062 221,214 NONCURRENT LIABILITIESBorrowings 13 13,500 14,890Debentures 14 493,734 575,542Tax debt refinancing program (REFIS) 8,916 9,100Provision for tax, civil and labor risks 18 11,998 12,580
528,148 612,112TOTAL LIABILITIES 676,210 833,326
EQUITYIssued capital 20 563,319 563,319Capital reserves 20 4,783 8,785Earnings reserves 20 487,049 487,049Valuation adjustments to equity 20 222 244Loss for the period (22,665) -
Total equity 1,032,708 1,059,397
TOTAL LIABILITIES AND EQUITY 1,708,918 1,892,723
The accompanying notes are an integral part of this interim financial information.
8/20/2019 2Q15 Quarterly Financial Reports
http://slidepdf.com/reader/full/2q15-quarterly-financial-reports 6/53
5
(Convenience Translation into English from the Original Previously Issued in Portuguese)
MILLS ESTRUTURAS E SERVIÇOS DE ENGENHARIA S.A.
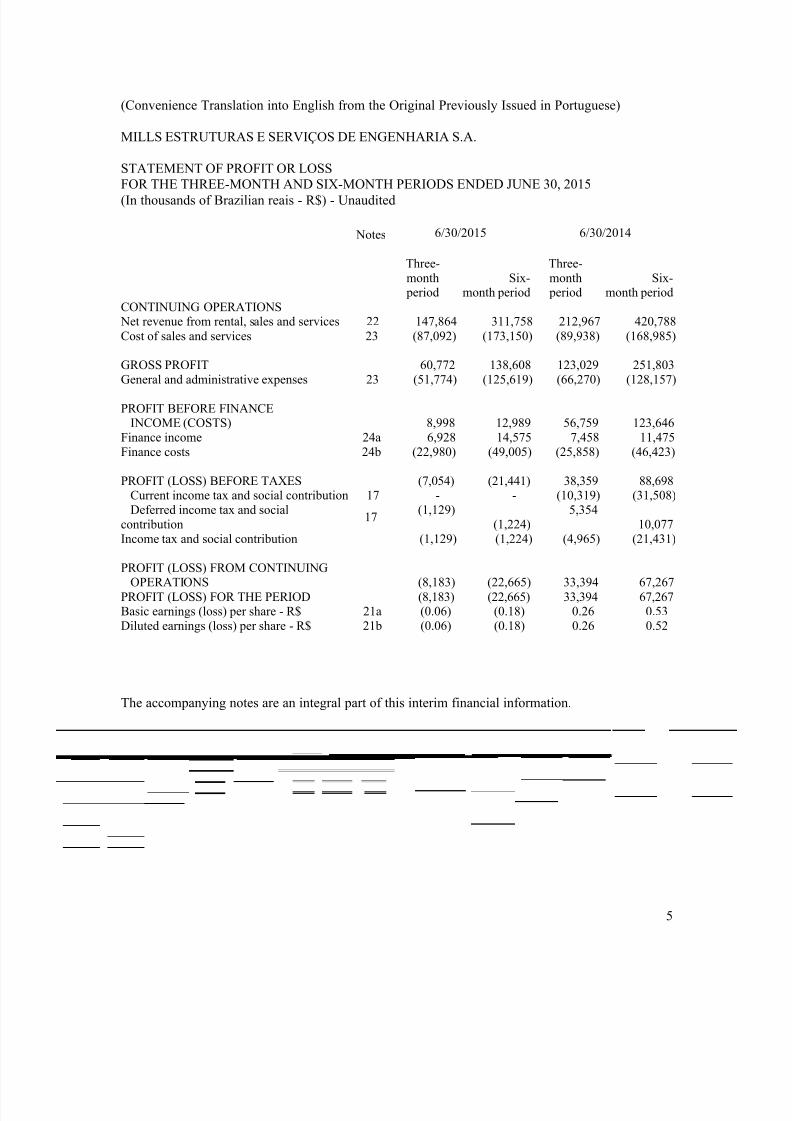
STATEMENT OF PROFIT OR LOSSFOR THE THREE-MONTH AND SIX-MONTH PERIODS ENDED JUNE 30, 2015(In thousands of Brazilian reais - R$) - Unaudited
Notes 6/30/2015 6/30/2014
Three-month period
Six-month period
Three-month period
Six-month period
CONTINUING OPERATIONS Net revenue from rental, sales and services 22 147,864 311,758 212,967 420,788
Cost of sales and services 23 (87,092) (173,150) (89,938) (168,985)
GROSS PROFIT 60,772 138,608 123,029 251,803General and administrative expenses 23 (51,774) (125,619) (66,270) (128,157)
PROFIT BEFORE FINANCEINCOME (COSTS) 8,998 12,989 56,759 123,646
Finance income 24a 6,928 14,575 7,458 11,475Finance costs 24b (22,980) (49,005) (25,858) (46,423)
PROFIT (LOSS) BEFORE TAXES (7,054) (21,441) 38,359 88,698Current income tax and social contribution 17 - - (10,319) (31,508)
Deferred income tax and socialcontribution
17 (1,129)(1,224)
5,35410,077
Income tax and social contribution (1,129) (1,224) (4,965) (21,431)
PROFIT (LOSS) FROM CONTINUINGOPERATIONS (8,183) (22,665) 33,394 67,267
PROFIT (LOSS) FOR THE PERIOD (8,183) (22,665) 33,394 67,267Basic earnings (loss) per share - R$ 21a (0.06) (0.18) 0.26 0.53Diluted earnings (loss) per share - R$ 21b (0.06) (0.18) 0.26 0.52
The accompanying notes are an integral part of this interim financial information.
8/20/2019 2Q15 Quarterly Financial Reports
http://slidepdf.com/reader/full/2q15-quarterly-financial-reports 7/53
6
(Convenience Translation into English from the Original Previously Issued in Portuguese)
MILLS ESTRUTURAS E SERVIÇOS DE ENGENHARIA S.A.
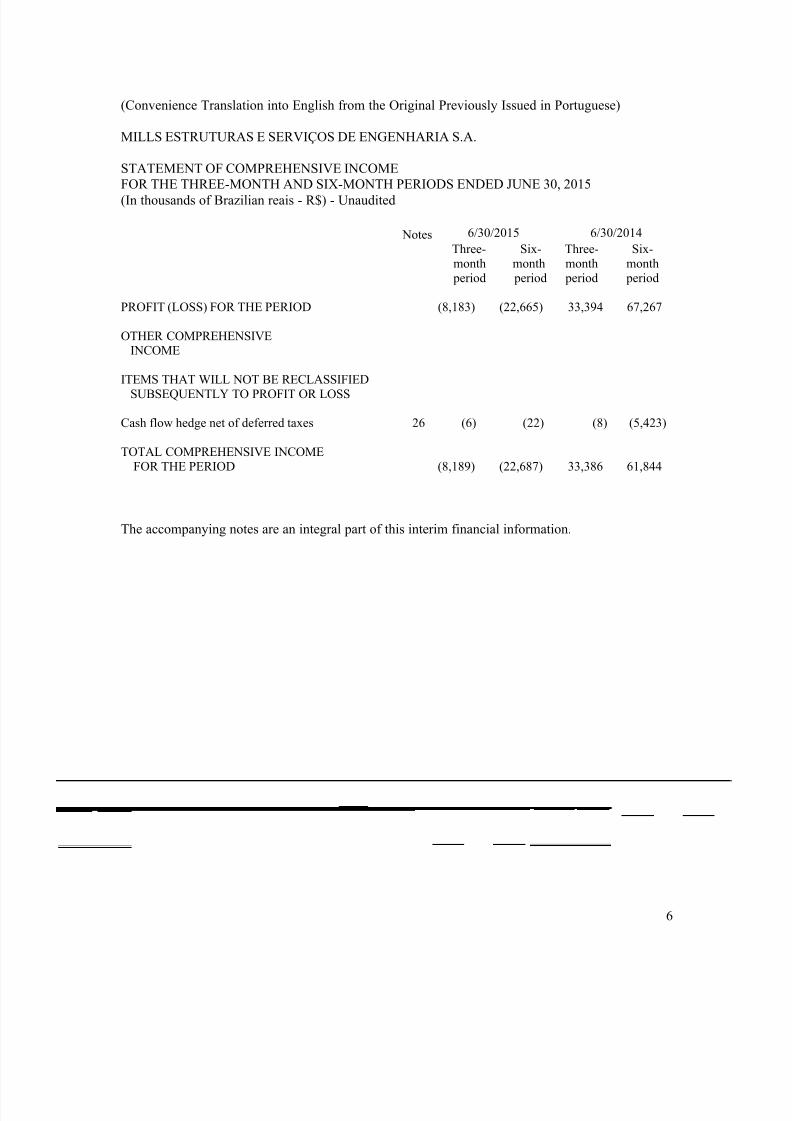
STATEMENT OF COMPREHENSIVE INCOMEFOR THE THREE-MONTH AND SIX-MONTH PERIODS ENDED JUNE 30, 2015(In thousands of Brazilian reais - R$) - Unaudited
Notes 6/30/2015 6/30/2014
Three-month period
Six-month period
Three-month period
Six-month period
PROFIT (LOSS) FOR THE PERIOD (8,183) (22,665) 33,394 67,267
OTHER COMPREHENSIVEINCOME
ITEMS THAT WILL NOT BE RECLASSIFIEDSUBSEQUENTLY TO PROFIT OR LOSS
Cash flow hedge net of deferred taxes 26 (6) (22) (8) (5,423)
TOTAL COMPREHENSIVE INCOMEFOR THE PERIOD (8,189) (22,687) 33,386 61,844
The accompanying notes are an integral part of this interim financial information.
8/20/2019 2Q15 Quarterly Financial Reports
http://slidepdf.com/reader/full/2q15-quarterly-financial-reports 8/53
7
(Convenience Translation into English from the Original Previously Issued in Portuguese)
MILLS ESTRUTURAS E SERVIÇOS DE ENGENHARIA S.A.
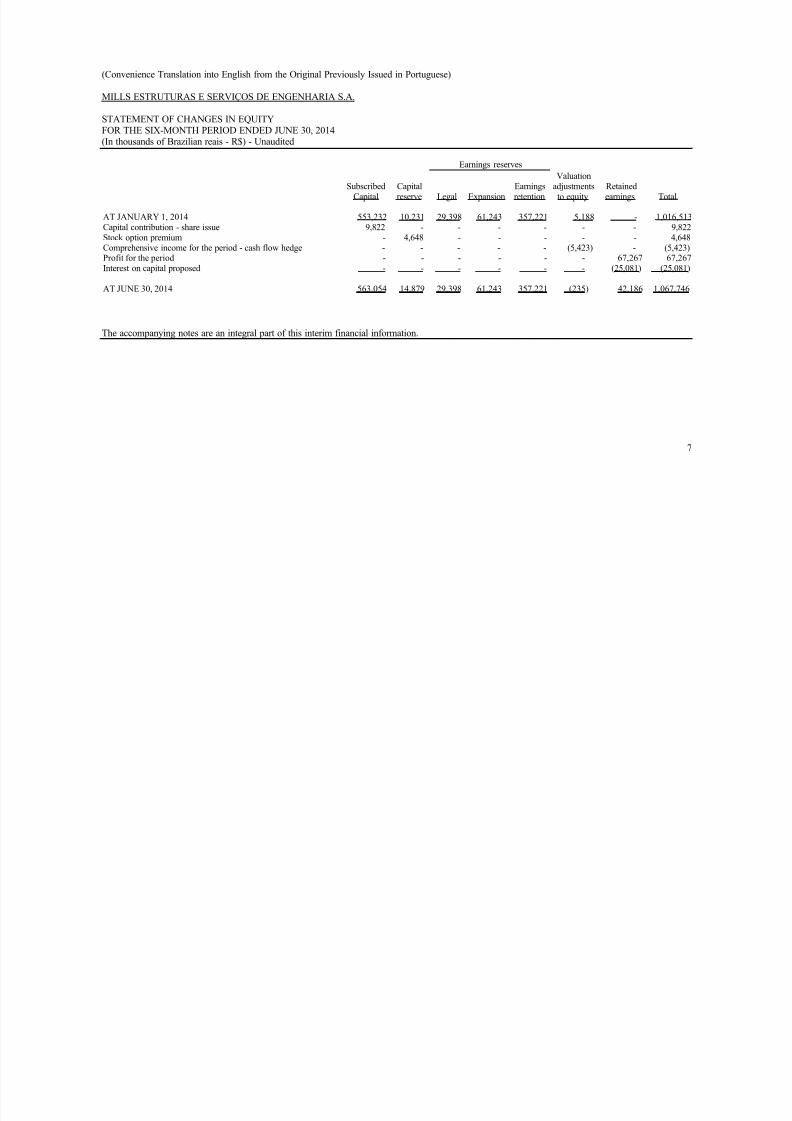
STATEMENT OF CHANGES IN EQUITYFOR THE SIX-MONTH PERIOD ENDED JUNE 30, 2014(In thousands of Brazilian reais - R$) - Unaudited
Earnings reserves
Subscribed Capital EarningsValuation
adjustments RetainedCapital reserve Legal Expansion retention to equity earnings Total
AT JANUARY 1, 2014 553,232 10,231 29,398 61,243 357,221 5,188 - 1,016,513Capital contribution - share issue 9,822 - - - - - - 9,822Stock option premium - 4,648 - - - - - 4,648Comprehensive income for the period - cash flow hedge - - - - - (5,423) - (5,423)Profit for the period - - - - - - 67,267 67,267Interest on capital proposed - - - - - - (25,081) (25,081)
AT JUNE 30, 2014 563,054 14,879 29,398 61,243 357,221 (235) 42,186 1,067,746
The accompanying notes are an integral part of this interim financial information.
8/20/2019 2Q15 Quarterly Financial Reports
http://slidepdf.com/reader/full/2q15-quarterly-financial-reports 9/53
8
(Convenience Translation into English from the Original Previously Issued in Portuguese)
MILLS ESTRUTURAS E SERVIÇOS DE ENGENHARIA S.A.
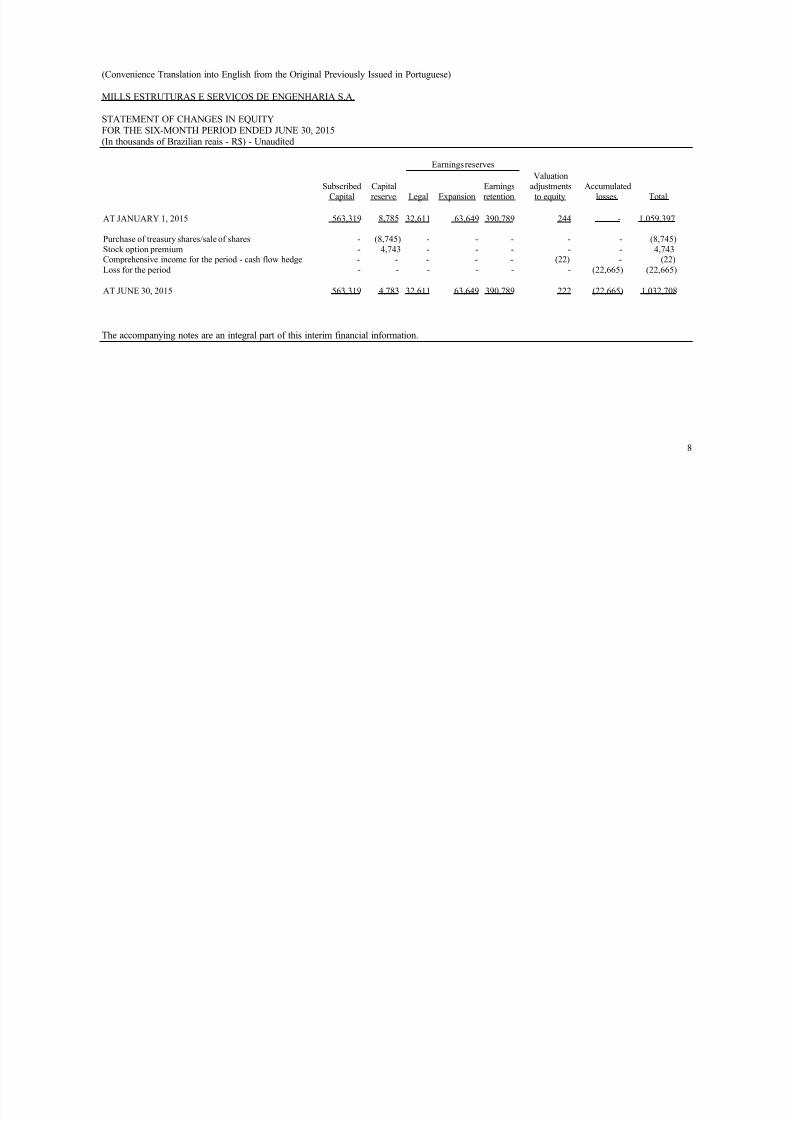
STATEMENT OF CHANGES IN EQUITYFOR THE SIX-MONTH PERIOD ENDED JUNE 30, 2015(In thousands of Brazilian reais - R$) - Unaudited
Earnings reserves
Subscribed Capital EarningsValuation
adjustments AccumulatedCapital reserve Legal Expansion retention to equity losses Total
AT JANUARY 1, 2015 563,319 8,785 32,611 63,649 390,789 244 - 1,059,397
Purchase of treasury shares/sale of shares - (8,745) - - - - - (8,745)Stock option premium - 4,743 - - - - - 4,743Comprehensive income for the period - cash flow hedge - - - - - (22) - (22)Loss for the period - - - - - - (22,665) (22,665)
AT JUNE 30, 2015 563,319 4,783 32,611 63,649 390,789 222 (22,665) 1,032,708
The accompanying notes are an integral part of this interim financial information.
8/20/2019 2Q15 Quarterly Financial Reports
http://slidepdf.com/reader/full/2q15-quarterly-financial-reports 10/53
9
(Convenience Translation into English from the Original Previously Issued in Portuguese)
MILLS ESTRUTURAS E SERVIÇOS DE ENGENHARIA S.A.
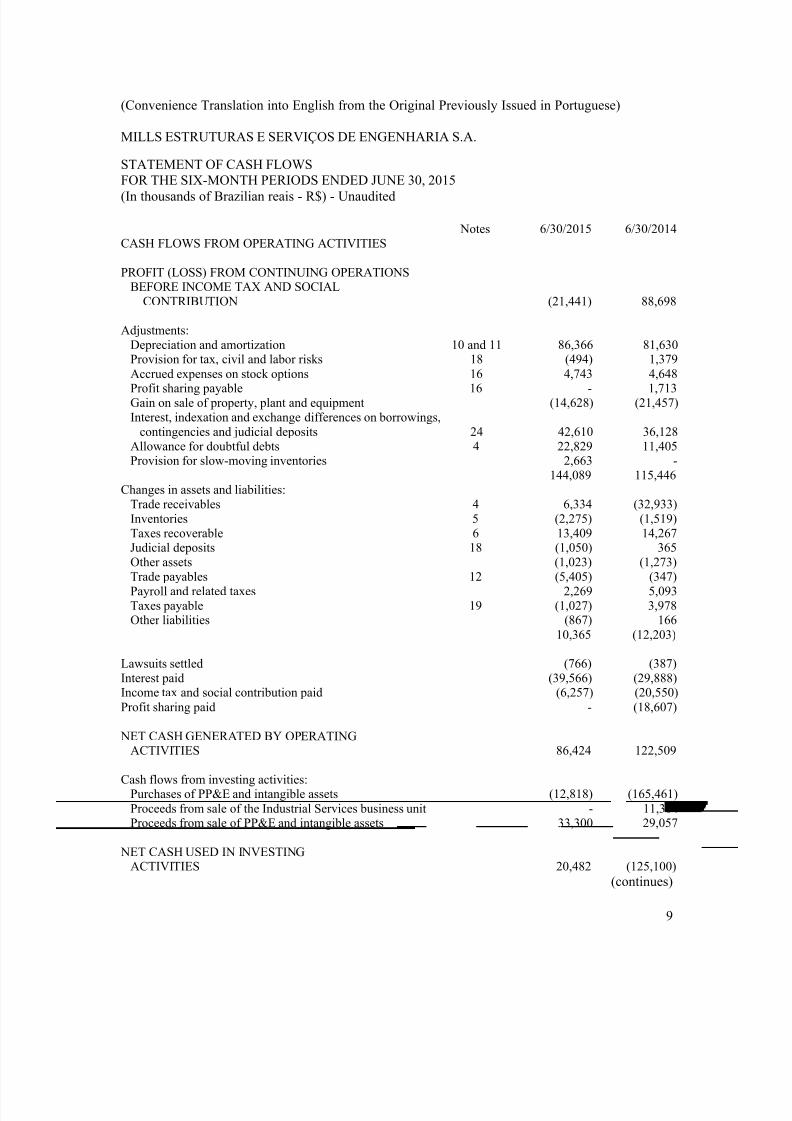
STATEMENT OF CASH FLOWSFOR THE SIX-MONTH PERIODS ENDED JUNE 30, 2015(In thousands of Brazilian reais - R$) - Unaudited
Notes 6/30/2015 6/30/2014CASH FLOWS FROM OPERATING ACTIVITIES
PROFIT (LOSS) FROM CONTINUING OPERATIONSBEFORE INCOME TAX AND SOCIAL
CONTRIBUTION (21,441) 88,698
Adjustments:
Depreciation and amortization 10 and 11 86,366 81,630Provision for tax, civil and labor risks 18 (494) 1,379Accrued expenses on stock options 16 4,743 4,648Profit sharing payable 16 - 1,713Gain on sale of property, plant and equipment (14,628) (21,457)Interest, indexation and exchange differences on borrowings,
contingencies and judicial deposits 24 42,610 36,128Allowance for doubtful debts 4 22,829 11,405Provision for slow-moving inventories 2,663 -
144,089 115,446Changes in assets and liabilities:
Trade receivables 4 6,334 (32,933)Inventories 5 (2,275) (1,519)Taxes recoverable 6 13,409 14,267Judicial deposits 18 (1,050) 365Other assets (1,023) (1,273)Trade payables 12 (5,405) (347)Payroll and related taxes 2,269 5,093Taxes payable 19 (1,027) 3,978Other liabilities (867) 166
10,365 (12,203)
Lawsuits settled (766) (387)
Interest paid (39,566) (29,888)Income tax and social contribution paid (6,257) (20,550)Profit sharing paid - (18,607)
NET CASH GENERATED BY OPERATINGACTIVITIES 86,424 122,509
Cash flows from investing activities:Purchases of PP&E and intangible assets (12,818) (165,461)Proceeds from sale of the Industrial Services business unit - 11,304Proceeds from sale of PP&E and intangible assets 33,300 29,057
NET CASH USED IN INVESTINGACTIVITIES 20,482 (125,100)
(continues)
8/20/2019 2Q15 Quarterly Financial Reports
http://slidepdf.com/reader/full/2q15-quarterly-financial-reports 11/53
10
(Convenience Translation into English from the Original Previously Issued in Portuguese)
MILLS ESTRUTURAS E SERVIÇOS DE ENGENHARIA S.A.
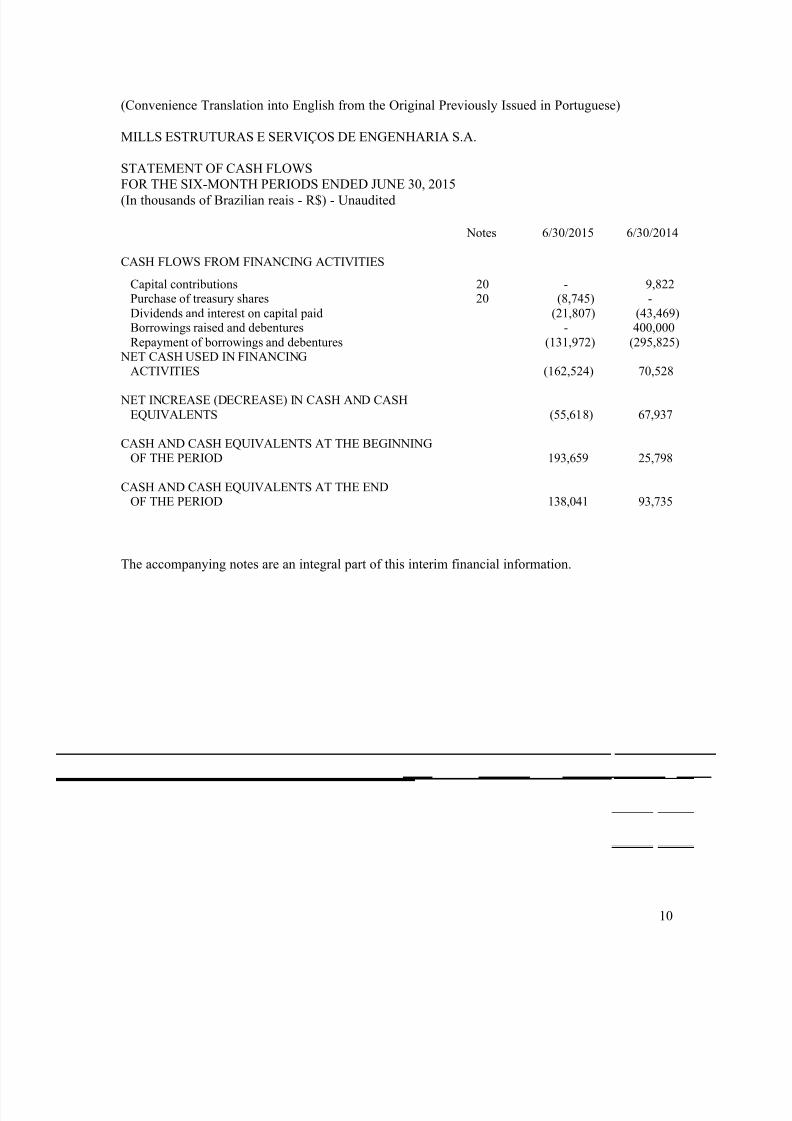
STATEMENT OF CASH FLOWSFOR THE SIX-MONTH PERIODS ENDED JUNE 30, 2015(In thousands of Brazilian reais - R$) - Unaudited
Notes 6/30/2015 6/30/2014
CASH FLOWS FROM FINANCING ACTIVITIES
Capital contributions 20 - 9,822Purchase of treasury shares 20 (8,745) -Dividends and interest on capital paid (21,807) (43,469)Borrowings raised and debentures - 400,000
Repayment of borrowings and debentures (131,972) (295,825) NET CASH USED IN FINANCING
ACTIVITIES (162,524) 70,528
NET INCREASE (DECREASE) IN CASH AND CASHEQUIVALENTS (55,618) 67,937
CASH AND CASH EQUIVALENTS AT THE BEGINNINGOF THE PERIOD 193,659 25,798
CASH AND CASH EQUIVALENTS AT THE ENDOF THE PERIOD 138,041 93,735
The accompanying notes are an integral part of this interim financial information.
8/20/2019 2Q15 Quarterly Financial Reports
http://slidepdf.com/reader/full/2q15-quarterly-financial-reports 12/53
11
(Convenience Translation into English from the Original Previously Issued in Portuguese)MILLS ESTRUTURAS E SERVIÇOS DE ENGENHARIA S.A.
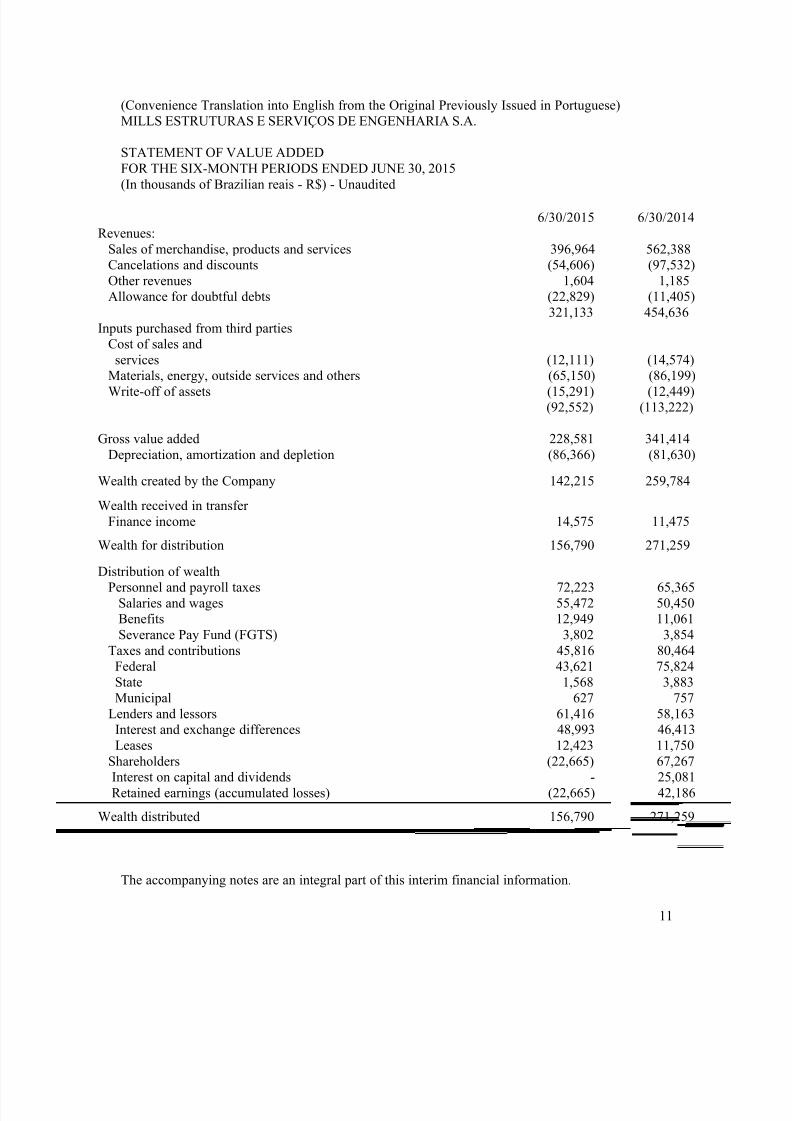
STATEMENT OF VALUE ADDED
FOR THE SIX-MONTH PERIODS ENDED JUNE 30, 2015(In thousands of Brazilian reais - R$) - Unaudited
6/30/2015 6/30/2014Revenues:
Sales of merchandise, products and services 396,964 562,388Cancelations and discounts (54,606) (97,532)Other revenues 1,604 1,185Allowance for doubtful debts (22,829) (11,405)
321,133 454,636
Inputs purchased from third parties
Cost of sales andservices (12,111) (14,574)
Materials, energy, outside services and others (65,150) (86,199)Write-off of assets (15,291) (12,449)
(92,552) (113,222)
Gross value added 228,581 341,414Depreciation, amortization and depletion (86,366) (81,630)
Wealth created by the Company 142,215 259,784
Wealth received in transferFinance income 14,575 11,475
Wealth for distribution 156,790 271,259
Distribution of wealthPersonnel and payroll taxes 72,223 65,365
Salaries and wages 55,472 50,450Benefits 12,949 11,061Severance Pay Fund (FGTS) 3,802 3,854
Taxes and contributions 45,816 80,464Federal 43,621 75,824
State 1,568 3,883Municipal 627 757
Lenders and lessors 61,416 58,163Interest and exchange differences 48,993 46,413Leases 12,423 11,750
Shareholders (22,665) 67,267Interest on capital and dividends - 25,081Retained earnings (accumulated losses) (22,665) 42,186
Wealth distributed 156,790 271,259
The accompanying notes are an integral part of this interim financial information.
8/20/2019 2Q15 Quarterly Financial Reports
http://slidepdf.com/reader/full/2q15-quarterly-financial-reports 13/53
12
(Convenience Translation into English from the Original Previously Issued in Portuguese)
MILLS ESTRUTURAS E SERVIÇOS DE ENGENHARIA S.A.
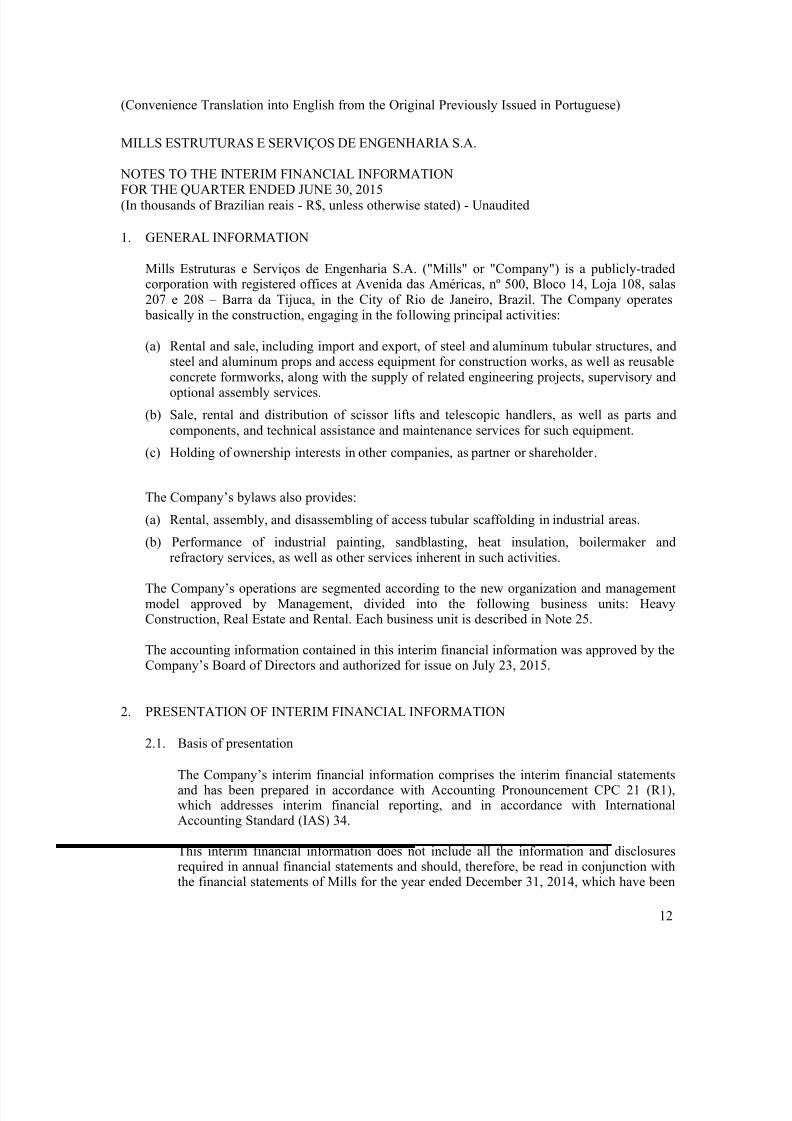
NOTES TO THE INTERIM FINANCIAL INFORMATIONFOR THE QUARTER ENDED JUNE 30, 2015(In thousands of Brazilian reais - R$, unless otherwise stated) - Unaudited
1. GENERAL INFORMATION
Mills Estruturas e Serviços de Engenharia S.A. ("Mills" or "Company") is a publicly-tradedcorporation with registered offices at Avenida das Américas, nº 500, Bloco 14, Loja 108, salas207 e 208 – Barra da Tijuca, in the City of Rio de Janeiro, Brazil. The Company operates
basically in the construction, engaging in the following principal activities:
(a) Rental and sale, including import and export, of steel and aluminum tubular structures, andsteel and aluminum props and access equipment for construction works, as well as reusableconcrete formworks, along with the supply of related engineering projects, supervisory andoptional assembly services.
(b) Sale, rental and distribution of scissor lifts and telescopic handlers, as well as parts andcomponents, and technical assistance and maintenance services for such equipment.
(c) Holding of ownership interests in other companies, as partner or shareholder.
The Company’s bylaws also provides:
(a) Rental, assembly, and disassembling of access tubular scaffolding in industrial areas.
(b) Performance of industrial painting, sandblasting, heat insulation, boilermaker andrefractory services, as well as other services inherent in such activities.
The Company’s operations are segmented according to the new organization and managementmodel approved by Management, divided into the following business units: HeavyConstruction, Real Estate and Rental. Each business unit is described in Note 25.
The accounting information contained in this interim financial information was approved by theCompany’s Board of Directors and authorized for issue on July 23, 2015.
2. PRESENTATION OF INTERIM FINANCIAL INFORMATION
2.1. Basis of presentation
The Company’s interim financial information comprises the interim financial statementsand has been prepared in accordance with Accounting Pronouncement CPC 21 (R1),which addresses interim financial reporting, and in accordance with InternationalAccounting Standard (IAS) 34.
This interim financial information does not include all the information and disclosuresrequired in annual financial statements and should, therefore, be read in conjunction withthe financial statements of Mills for the year ended December 31, 2014, which have been
8/20/2019 2Q15 Quarterly Financial Reports
http://slidepdf.com/reader/full/2q15-quarterly-financial-reports 14/53
Mills Estruturas e Serviços de Engenharia S.A.
13
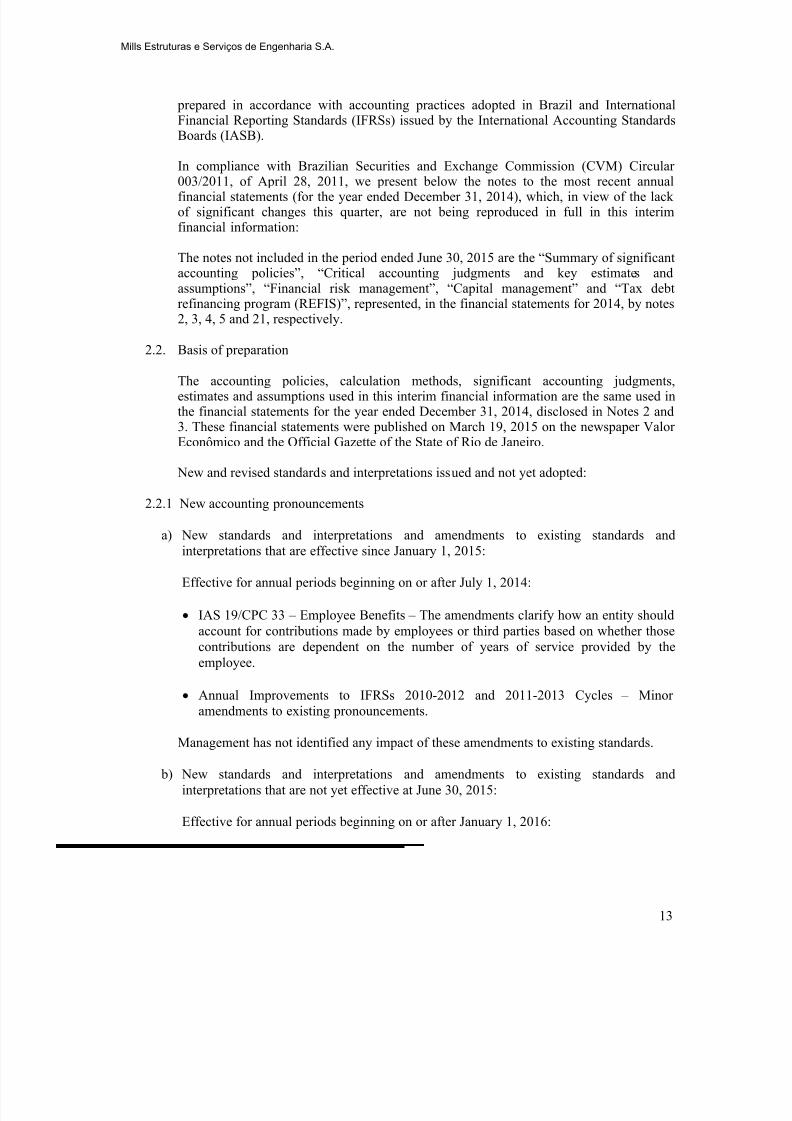
prepared in accordance with accounting practices adopted in Brazil and InternationalFinancial Reporting Standards (IFRSs) issued by the International Accounting StandardsBoards (IASB).
In compliance with Brazilian Securities and Exchange Commission (CVM) Circular003/2011, of April 28, 2011, we present below the notes to the most recent annualfinancial statements (for the year ended December 31, 2014), which, in view of the lackof significant changes this quarter, are not being reproduced in full in this interimfinancial information:
The notes not included in the period ended June 30, 2015 are the “Summary of significantaccounting policies”, “Critical accounting judgments and key estimates andassumptions”, “Financial risk management”, “Capital management” and “Tax debtrefinancing program (REFIS)”, represented, in the financial statements for 2014, by notes2, 3, 4, 5 and 21, respectively.
2.2. Basis of preparation
The accounting policies, calculation methods, significant accounting judgments,estimates and assumptions used in this interim financial information are the same used inthe financial statements for the year ended December 31, 2014, disclosed in Notes 2 and3. These financial statements were published on March 19, 2015 on the newspaper ValorEconômico and the Official Gazette of the State of Rio de Janeiro.
New and revised standards and interpretations issued and not yet adopted:
2.2.1 New accounting pronouncements
a) New standards and interpretations and amendments to existing standards andinterpretations that are effective since January 1, 2015:
Effective for annual periods beginning on or after July 1, 2014:
IAS 19/CPC 33 – Employee Benefits – The amendments clarify how an entity shouldaccount for contributions made by employees or third parties based on whether thosecontributions are dependent on the number of years of service provided by theemployee.
Annual Improvements to IFRSs 2010-2012 and 2011-2013 Cycles – Minoramendments to existing pronouncements.
Management has not identified any impact of these amendments to existing standards.
b) New standards and interpretations and amendments to existing standards andinterpretations that are not yet effective at June 30, 2015:
Effective for annual periods beginning on or after January 1, 2016:
8/20/2019 2Q15 Quarterly Financial Reports
http://slidepdf.com/reader/full/2q15-quarterly-financial-reports 15/53
Mills Estruturas e Serviços de Engenharia S.A.
14
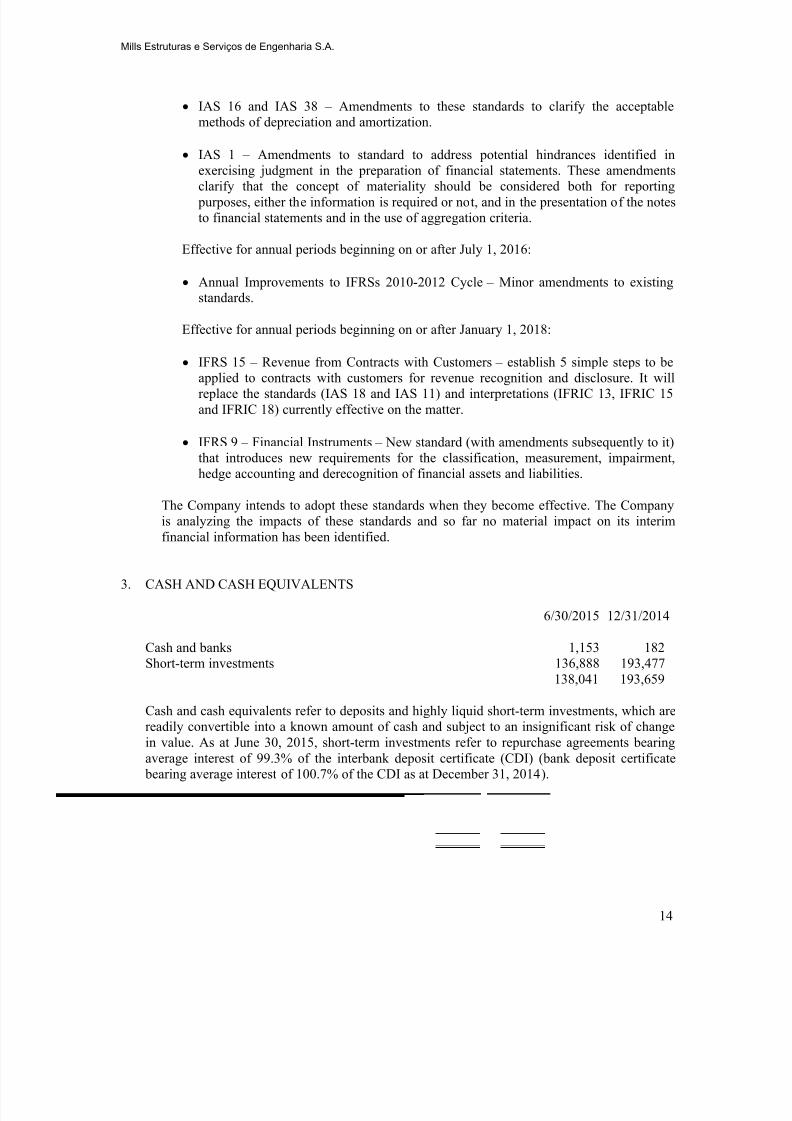
IAS 16 and IAS 38 – Amendments to these standards to clarify the acceptablemethods of depreciation and amortization.
IAS 1 – Amendments to standard to address potential hindrances identified in
exercising judgment in the preparation of financial statements. These amendmentsclarify that the concept of materiality should be considered both for reporting
purposes, either the information is required or not, and in the presentation of the notesto financial statements and in the use of aggregation criteria.
Effective for annual periods beginning on or after July 1, 2016:
Annual Improvements to IFRSs 2010-2012 Cycle – Minor amendments to existingstandards.
Effective for annual periods beginning on or after January 1, 2018:
IFRS 15 – Revenue from Contracts with Customers – establish 5 simple steps to beapplied to contracts with customers for revenue recognition and disclosure. It willreplace the standards (IAS 18 and IAS 11) and interpretations (IFRIC 13, IFRIC 15and IFRIC 18) currently effective on the matter.
IFRS 9 – Financial Instruments – New standard (with amendments subsequently to it)that introduces new requirements for the classification, measurement, impairment,hedge accounting and derecognition of financial assets and liabilities.
The Company intends to adopt these standards when they become effective. The Companyis analyzing the impacts of these standards and so far no material impact on its interimfinancial information has been identified.
3. CASH AND CASH EQUIVALENTS
6/30/2015 12/31/2014
Cash and banks 1,153 182Short-term investments 136,888 193,477
138,041 193,659
Cash and cash equivalents refer to deposits and highly liquid short-term investments, which arereadily convertible into a known amount of cash and subject to an insignificant risk of changein value. As at June 30, 2015, short-term investments refer to repurchase agreements bearingaverage interest of 99.3% of the interbank deposit certificate (CDI) (bank deposit certificate
bearing average interest of 100.7% of the CDI as at December 31, 2014).
8/20/2019 2Q15 Quarterly Financial Reports
http://slidepdf.com/reader/full/2q15-quarterly-financial-reports 16/53
Mills Estruturas e Serviços de Engenharia S.A.
15
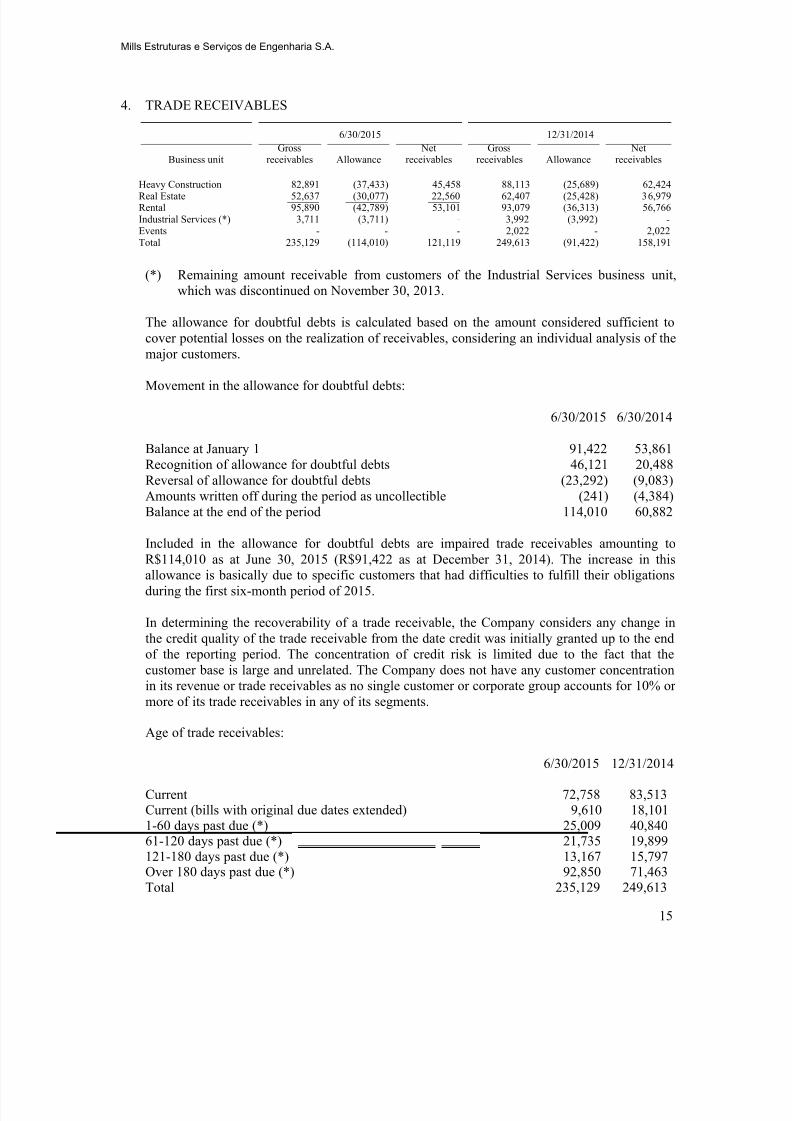
4. TRADE RECEIVABLES
6/30/2015 12/31/2014
Business unitGross
receivables Allowance Net
receivablesGross
receivables Allowance Net
receivables
Heavy Construction 82,891 (37,433) 45,458 88,113 (25,689) 62,424Real Estate 52,637 (30,077) 22,560 62,407 (25,428) 36,979 Rental 95,890 (42,789) 53,101 93,079 (36,313) 56,766Industrial Services (*) 3,711 (3,711) - 3,992 (3,992) -Events - - - 2,022 - 2,022Total 235,129 (114,010) 121,119 249,613 (91,422) 158,191
(*) Remaining amount receivable from customers of the Industrial Services business unit,which was discontinued on November 30, 2013.
The allowance for doubtful debts is calculated based on the amount considered sufficient to
cover potential losses on the realization of receivables, considering an individual analysis of themajor customers.
Movement in the allowance for doubtful debts:
6/30/2015 6/30/2014
Balance at January 1 91,422 53,861Recognition of allowance for doubtful debts 46,121 20,488Reversal of allowance for doubtful debts (23,292) (9,083)Amounts written off during the period as uncollectible (241) (4,384)
Balance at the end of the period 114,010 60,882
Included in the allowance for doubtful debts are impaired trade receivables amounting toR$114,010 as at June 30, 2015 (R$91,422 as at December 31, 2014). The increase in thisallowance is basically due to specific customers that had difficulties to fulfill their obligationsduring the first six-month period of 2015.
In determining the recoverability of a trade receivable, the Company considers any change inthe credit quality of the trade receivable from the date credit was initially granted up to the endof the reporting period. The concentration of credit risk is limited due to the fact that thecustomer base is large and unrelated. The Company does not have any customer concentration
in its revenue or trade receivables as no single customer or corporate group accounts for 10% ormore of its trade receivables in any of its segments.
Age of trade receivables:
6/30/2015 12/31/2014
Current 72,758 83,513Current (bills with original due dates extended) 9,610 18,1011-60 days past due (*) 25,009 40,84061-120 days past due (*) 21,735 19,899121-180 days past due (*) 13,167 15,797Over 180 days past due (*) 92,850 71,463Total 235,129 249,613
8/20/2019 2Q15 Quarterly Financial Reports
http://slidepdf.com/reader/full/2q15-quarterly-financial-reports 17/53
Mills Estruturas e Serviços de Engenharia S.A.
16
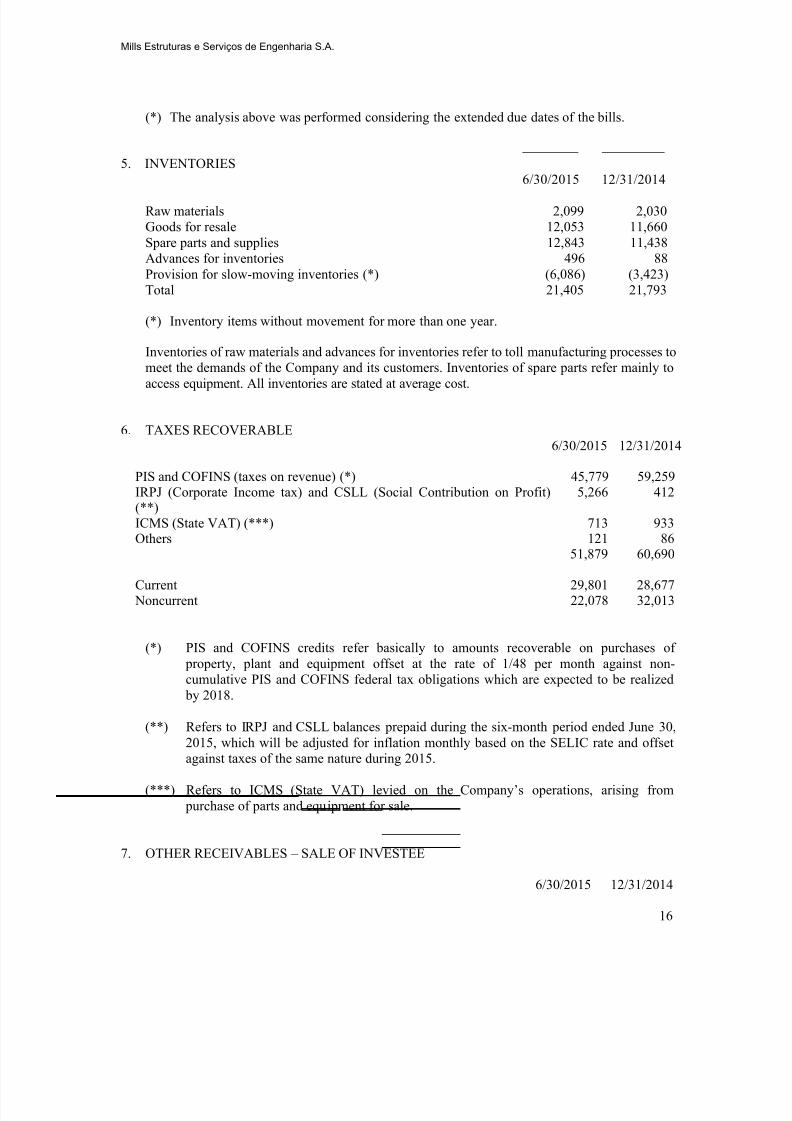
(*) The analysis above was performed considering the extended due dates of the bills.
5. INVENTORIES 6/30/2015 12/31/2014
Raw materials 2,099 2,030Goods for resale 12,053 11,660Spare parts and supplies 12,843 11,438Advances for inventories 496 88Provision for slow-moving inventories (*) (6,086) (3,423)Total 21,405 21,793
(*) Inventory items without movement for more than one year.
Inventories of raw materials and advances for inventories refer to toll manufacturing processes tomeet the demands of the Company and its customers. Inventories of spare parts refer mainly toaccess equipment. All inventories are stated at average cost.
6. TAXES RECOVERABLE6/30/2015 12/31/2014
PIS and COFINS (taxes on revenue) (*) 45,779 59,259IRPJ (Corporate Income tax) and CSLL (Social Contribution on Profit)
(**)
5,266 412
ICMS (State VAT) (***) 713 933Others 121 86
51,879 60,690
Current 29,801 28,677 Noncurrent 22,078 32,013
(*) PIS and COFINS credits refer basically to amounts recoverable on purchases of property, plant and equipment offset at the rate of 1/48 per month against non-
cumulative PIS and COFINS federal tax obligations which are expected to be realized by 2018.
(**) Refers to IRPJ and CSLL balances prepaid during the six-month period ended June 30,2015, which will be adjusted for inflation monthly based on the SELIC rate and offsetagainst taxes of the same nature during 2015.
(***) Refers to ICMS (State VAT) levied on the Company’s operations, arising from purchase of parts and equipment for sale.
7. OTHER RECEIVABLES – SALE OF INVESTEE
6/30/2015 12/31/2014
8/20/2019 2Q15 Quarterly Financial Reports
http://slidepdf.com/reader/full/2q15-quarterly-financial-reports 18/53
Mills Estruturas e Serviços de Engenharia S.A.
17
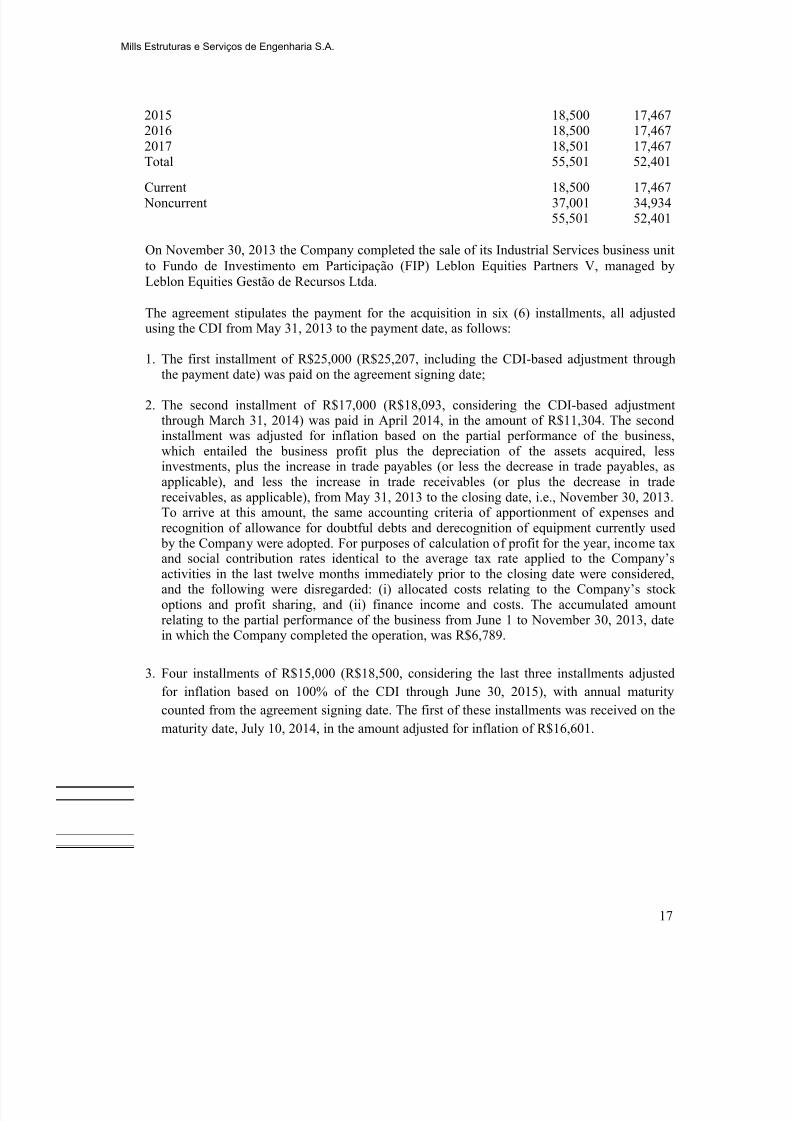
2015 18,500 17,4672016 18,500 17,4672017 18,501 17,467Total 55,501 52,401
Current 18,500 17,467 Noncurrent 37,001 34,934
55,501 52,401
On November 30, 2013 the Company completed the sale of its Industrial Services business unitto Fundo de Investimento em Participação (FIP) Leblon Equities Partners V, managed byLeblon Equities Gestão de Recursos Ltda.
The agreement stipulates the payment for the acquisition in six (6) installments, all adjustedusing the CDI from May 31, 2013 to the payment date, as follows:
1. The first installment of R$25,000 (R$25,207, including the CDI-based adjustment throughthe payment date) was paid on the agreement signing date;
2. The second installment of R$17,000 (R$18,093, considering the CDI-based adjustmentthrough March 31, 2014) was paid in April 2014, in the amount of R$11,304. The secondinstallment was adjusted for inflation based on the partial performance of the business,which entailed the business profit plus the depreciation of the assets acquired, lessinvestments, plus the increase in trade payables (or less the decrease in trade payables, asapplicable), and less the increase in trade receivables (or plus the decrease in tradereceivables, as applicable), from May 31, 2013 to the closing date, i.e., November 30, 2013.
To arrive at this amount, the same accounting criteria of apportionment of expenses andrecognition of allowance for doubtful debts and derecognition of equipment currently used
by the Company were adopted. For purposes of calculation of profit for the year, income taxand social contribution rates identical to the average tax rate applied to the Company’sactivities in the last twelve months immediately prior to the closing date were considered,and the following were disregarded: (i) allocated costs relating to the Company’s stockoptions and profit sharing, and (ii) finance income and costs. The accumulated amountrelating to the partial performance of the business from June 1 to November 30, 2013, datein which the Company completed the operation, was R$6,789.
3. Four installments of R$15,000 (R$18,500, considering the last three installments adjusted
for inflation based on 100% of the CDI through June 30, 2015), with annual maturity
counted from the agreement signing date. The first of these installments was received on the
maturity date, July 10, 2014, in the amount adjusted for inflation of R$16,601.
8/20/2019 2Q15 Quarterly Financial Reports
http://slidepdf.com/reader/full/2q15-quarterly-financial-reports 19/53
Mills Estruturas e Serviços de Engenharia S.A.
18
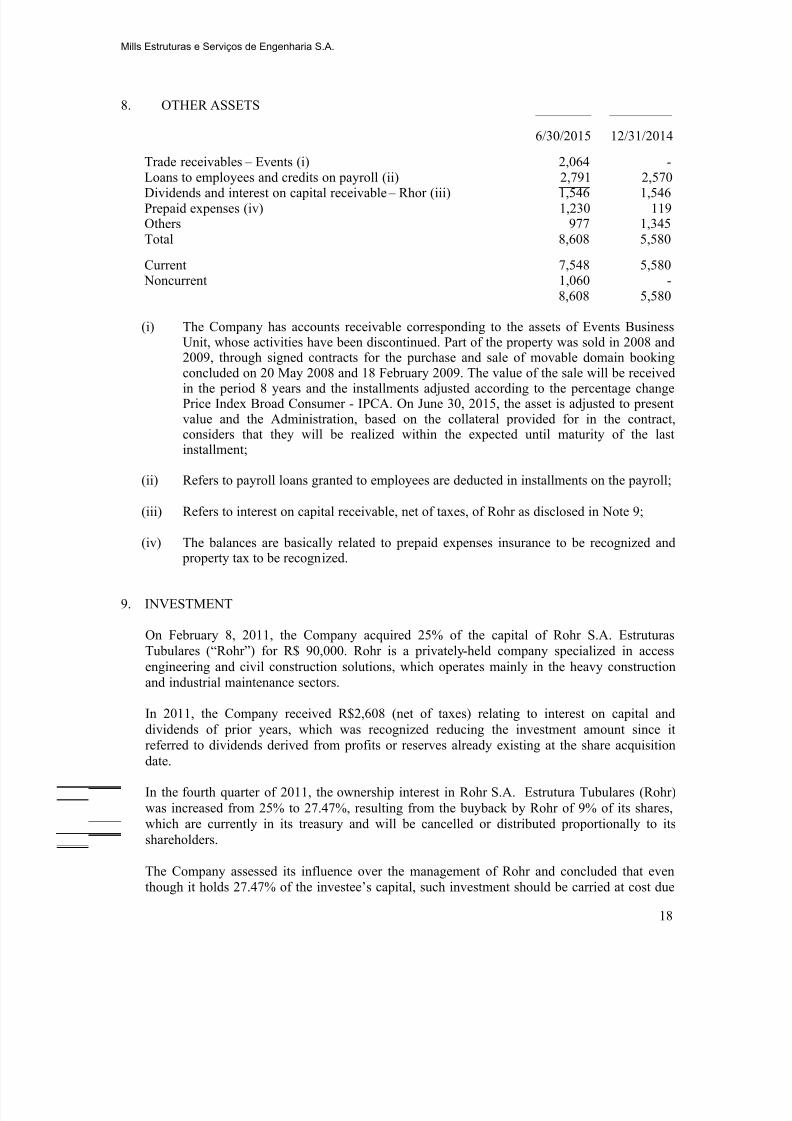
8. OTHER ASSETS
6/30/2015 12/31/2014
Trade receivables – Events (i) 2,064 -Loans to employees and credits on payroll (ii) 2,791 2,570Dividends and interest on capital receivable – Rhor (iii) 1,546 1,546Prepaid expenses (iv) 1,230 119Others 977 1,345Total 8,608 5,580
Current 7,548 5,580 Noncurrent 1,060 -
8,608 5,580
(i) The Company has accounts receivable corresponding to the assets of Events Business
Unit, whose activities have been discontinued. Part of the property was sold in 2008 and2009, through signed contracts for the purchase and sale of movable domain bookingconcluded on 20 May 2008 and 18 February 2009. The value of the sale will be receivedin the period 8 years and the installments adjusted according to the percentage changePrice Index Broad Consumer - IPCA. On June 30, 2015, the asset is adjusted to presentvalue and the Administration, based on the collateral provided for in the contract,considers that they will be realized within the expected until maturity of the lastinstallment;
(ii) Refers to payroll loans granted to employees are deducted in installments on the payroll;
(iii) Refers to interest on capital receivable, net of taxes, of Rohr as disclosed in Note 9;
(iv) The balances are basically related to prepaid expenses insurance to be recognized and property tax to be recognized.
9. INVESTMENT
On February 8, 2011, the Company acquired 25% of the capital of Rohr S.A. EstruturasTubulares (“Rohr”) for R$ 90,000. Rohr is a privately-held company specialized in accessengineering and civil construction solutions, which operates mainly in the heavy construction
and industrial maintenance sectors.
In 2011, the Company received R$2,608 (net of taxes) relating to interest on capital anddividends of prior years, which was recognized reducing the investment amount since itreferred to dividends derived from profits or reserves already existing at the share acquisitiondate.
In the fourth quarter of 2011, the ownership interest in Rohr S.A. Estrutura Tubulares (Rohr)was increased from 25% to 27.47%, resulting from the buyback by Rohr of 9% of its shares,which are currently in its treasury and will be cancelled or distributed proportionally to itsshareholders.
The Company assessed its influence over the management of Rohr and concluded that eventhough it holds 27.47% of the investee’s capital, such investment should be carried at cost due
8/20/2019 2Q15 Quarterly Financial Reports
http://slidepdf.com/reader/full/2q15-quarterly-financial-reports 20/53
Mills Estruturas e Serviços de Engenharia S.A.
19
to the following facts: Mills does not have power to participate in the preparation of and in thedecisions on Rohr’s financial, operational and strategic policies, does not control such policieseither individually or jointly, and does not have representatives in the investee’s management. Furthermore, there is no shareholders agreement that may confer Mills the right to have
influence over the investee’s management or that may confer it the right to increase itsownership interest in the future. Based on these factors, the Company concluded that it does nothave significant influence over the investee and will maintain the investment carried at cost.
In December 2014 the Company recognized finance income of R$1,818 (R$1,648 in December2013) relating to Rohr interest on capital for 2014.
Impairment loss
In 2014 the Company reviewed the recoverable amount of the investment in Rohr S.A. basedon an internal report. The recoverable amount of this asset was determined based on economic
projections to determine Rohr market value, using the income approach, through a discountedcash flow projection as a basis for the amount paid. The main assumptions were: moderatesales growth; (ii) continuous cost reduction program that will cause its evolution to be lowerthan the sales growth percentage, (iii) capital expenditures only for recovering the depreciation,and (iv) a strict control policy over the working capital evolution, in the projection years. Thediscount rate used to measure the recoverable amount was 13.51% per year. Management
believes that any reasonably possible change in the key assumptions on which recoverableamount is based would not cause the investment’s carrying amount to exceed its recoverableamount. Management understands that there were no events during the period ended June 30,2015 that could affect the assessment made on December 31, 2014.
8/20/2019 2Q15 Quarterly Financial Reports
http://slidepdf.com/reader/full/2q15-quarterly-financial-reports 21/53
Mills Estruturas e Serviços de Engenharia S.A.
20
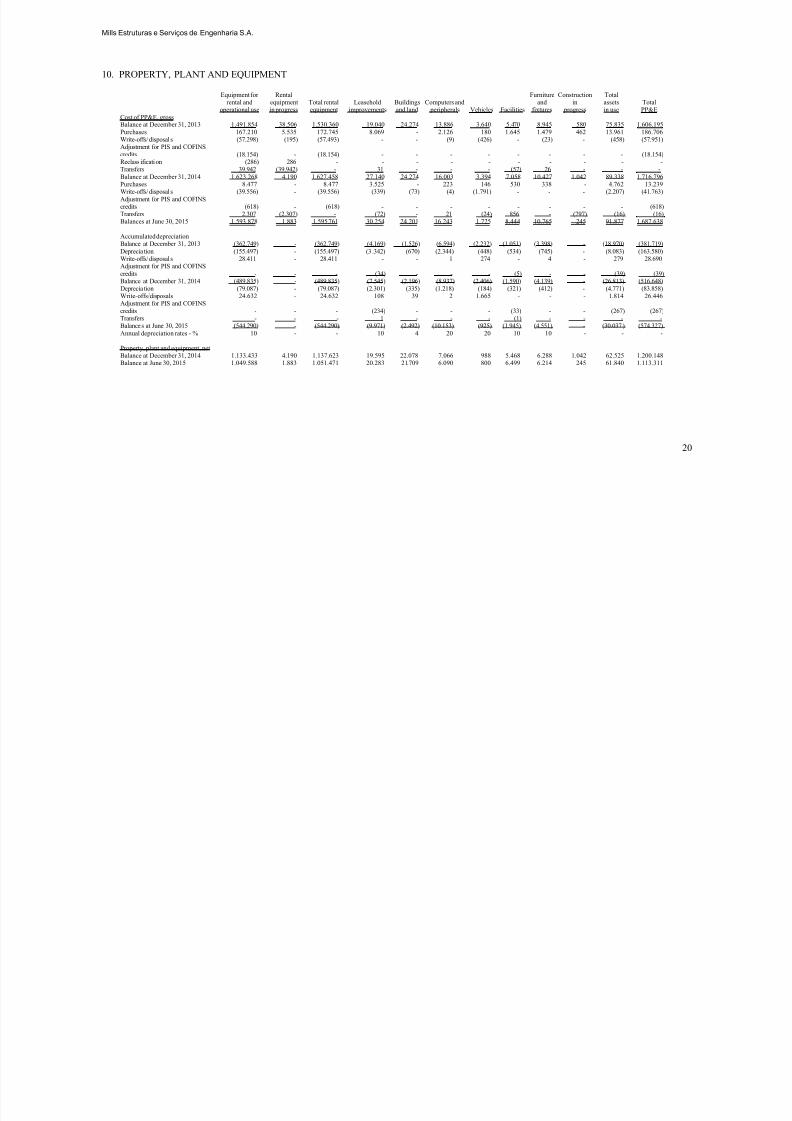
10. PROPERTY, PLANT AND EQUIPMENT
Equipment forrental and
operational use
Rentalequipmentin progress
Total rentalequipment
Leaseholdimprovements
Buildingsand land
Computers and peripherals Vehicles Facilities
Furnitureand
fixtures
Constructionin
progress
Totalassetsin use
TotalPP&E
Cost of PP&E, grossBalance at December 31, 2013 1.491.854 38.506 1.530.360 19.040 24.274 13.886 3.640 5.470 8.945 580 75.835 1.606.195Purchases 167.210 5.535 172.745 8.069 - 2.126 180 1.645 1.479 462 13.961 186.706Write-offs/disposals (57.298) (195) (57.493) - - (9) (426) - (23) - (458) (57.951)Adjustment for PIS and COFINScredits (18.154) - (18.154) - - - - - - - - (18.154)Reclass ification (286) 286 - - - - - - - - - -
Transfers 39.942 (39.942) - 31 - - - (57) 26 - - -Balance at December 31, 2014 1.623.268 4.190 1.627.458 27.140 24.274 16.003 3.394 7.058 10.427 1.042 89.338 1.716.796Purchases 8.477 - 8.477 3.525 - 223 146 530 338 - 4.762 13.239Write-offs/disposals (39.556) - (39.556) (339) (73) (4) (1.791) - - - (2.207) (41.763)Adjustment for PIS and COFINScredits (618) - (618) - - - - - - - - (618)Transfers 2.307 (2.307) - (72) - 21 (24) 856 - (797) (16) (16)Balances at June 30, 2015 1.593.878 1.883 1.595.761 30.254 24.201 16.243 1.725 8.444 10.765 245 91.877 1.687.638
Accumulated depreciationBalance at December 31, 2013 (362.749) - (362.749) (4.169) (1.526) (6.594) (2.232) (1.051) (3.398) - (18.970) (381.719)Deprecia tion (155.497) - (155.497) (3 .342) (670) (2.344) (448) (534) (745) - (8.083) (163.580)Write-offs/disposals 28.411 - 28.411 - - 1 274 - 4 - 279 28.690Adjustment for PIS and COFINScredits - - - (34) - - - (5) - - (39) (39)Balance at December 31, 2014 (489.835) - (489.835) (7.545) (2.196) (8.937) (2.406) (1.590) (4.139) - (26.813) (516.648)Deprecia tion (79.087) - (79.087) (2.301) (335) (1.218) (184) (321) (412) - (4.771) (83.858)Write-offs/disposals 24.632 - 24.632 108 39 2 1.665 - - - 1.814 26.446Adjustment for PIS and COFINScredits - - - (234) - - - (33) - - (267) (267)Transfers - - - 1 - - - (1) - - - -Balances at June 30, 2015 (544.290) - (544.290) (9.971) (2.492) (10.153) (925) (1.945) (4.551) - (30.037) (574.327)Annual depreciation rates - % 10 - - 10 4 20 20 10 10 - - -
Property, plant and equipment, netBalance at December 31, 2014 1.133.433 4.190 1.137.623 19.595 22.078 7.066 988 5.468 6.288 1.042 62.525 1.200.148Balance at June 30, 2015 1.049.588 1.883 1.051.471 20.283 21.709 6.090 800 6.499 6.214 245 61.840 1.113.311
8/20/2019 2Q15 Quarterly Financial Reports
http://slidepdf.com/reader/full/2q15-quarterly-financial-reports 22/53
Mills Estruturas e Serviços de Engenharia S.A.
21
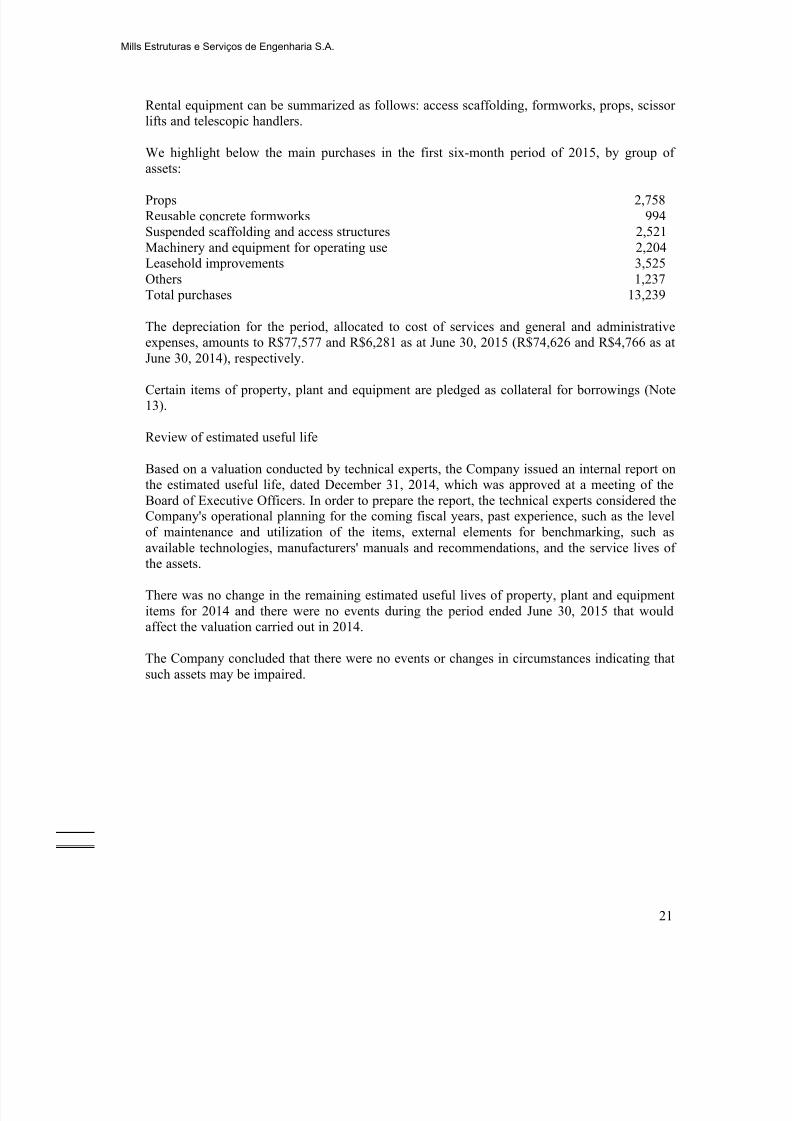
Rental equipment can be summarized as follows: access scaffolding, formworks, props, scissorlifts and telescopic handlers.
We highlight below the main purchases in the first six-month period of 2015, by group of
assets:
Props 2,758Reusable concrete formworks 994Suspended scaffolding and access structures 2,521Machinery and equipment for operating use 2,204Leasehold improvements 3,525Others 1,237Total purchases 13,239
The depreciation for the period, allocated to cost of services and general and administrative
expenses, amounts to R$77,577 and R$6,281 as at June 30, 2015 (R$74,626 and R$4,766 as atJune 30, 2014), respectively.
Certain items of property, plant and equipment are pledged as collateral for borrowings (Note13).
Review of estimated useful life
Based on a valuation conducted by technical experts, the Company issued an internal report onthe estimated useful life, dated December 31, 2014, which was approved at a meeting of theBoard of Executive Officers. In order to prepare the report, the technical experts considered theCompany's operational planning for the coming fiscal years, past experience, such as the levelof maintenance and utilization of the items, external elements for benchmarking, such asavailable technologies, manufacturers' manuals and recommendations, and the service lives ofthe assets.
There was no change in the remaining estimated useful lives of property, plant and equipmentitems for 2014 and there were no events during the period ended June 30, 2015 that wouldaffect the valuation carried out in 2014.
The Company concluded that there were no events or changes in circumstances indicating that
such assets may be impaired.
8/20/2019 2Q15 Quarterly Financial Reports
http://slidepdf.com/reader/full/2q15-quarterly-financial-reports 23/53
Mills Estruturas e Serviços de Engenharia S.A.
22
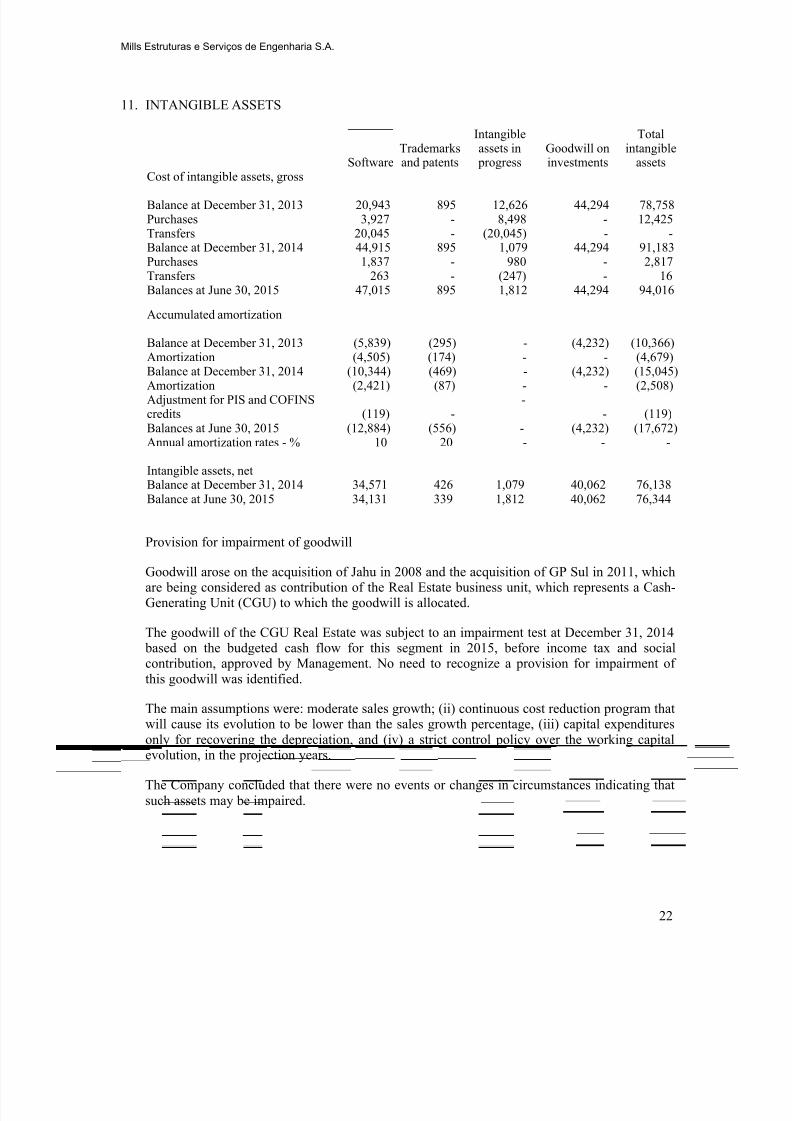
11. INTANGIBLE ASSETS
SoftwareTrademarksand patents
Intangibleassets in
progressGoodwill oninvestments
Totalintangible
assetsCost of intangible assets, gross
Balance at December 31, 2013 20,943 895 12,626 44,294 78,758Purchases 3,927 - 8,498 - 12,425Transfers 20,045 - (20,045) - -Balance at December 31, 2014 44,915 895 1,079 44,294 91,183Purchases 1,837 - 980 - 2,817Transfers 263 - (247) - 16Balances at June 30, 2015 47,015 895 1,812 44,294 94,016
Accumulated amortization
Balance at December 31, 2013 (5,839) (295) - (4,232) (10,366)Amortization (4,505) (174) - - (4,679)Balance at December 31, 2014 (10,344) (469) - (4,232) (15,045)Amortization (2,421) (87) - - (2,508)Adjustment for PIS and COFINScredits (119) -
-- (119)
Balances at June 30, 2015 (12,884) (556) - (4,232) (17,672)Annual amortization rates - % 10 20 - - -
Intangible assets, netBalance at December 31, 2014 34,571 426 1,079 40,062 76,138Balance at June 30, 2015 34,131 339 1,812 40,062 76,344
Provision for impairment of goodwill
Goodwill arose on the acquisition of Jahu in 2008 and the acquisition of GP Sul in 2011, whichare being considered as contribution of the Real Estate business unit, which represents a Cash-Generating Unit (CGU) to which the goodwill is allocated.
The goodwill of the CGU Real Estate was subject to an impairment test at December 31, 2014 based on the budgeted cash flow for this segment in 2015, before income tax and socialcontribution, approved by Management. No need to recognize a provision for impairment of
this goodwill was identified.
The main assumptions were: moderate sales growth; (ii) continuous cost reduction program thatwill cause its evolution to be lower than the sales growth percentage, (iii) capital expendituresonly for recovering the depreciation, and (iv) a strict control policy over the working capitalevolution, in the projection years.
The Company concluded that there were no events or changes in circumstances indicating thatsuch assets may be impaired.
8/20/2019 2Q15 Quarterly Financial Reports
http://slidepdf.com/reader/full/2q15-quarterly-financial-reports 24/53
Mills Estruturas e Serviços de Engenharia S.A.
23
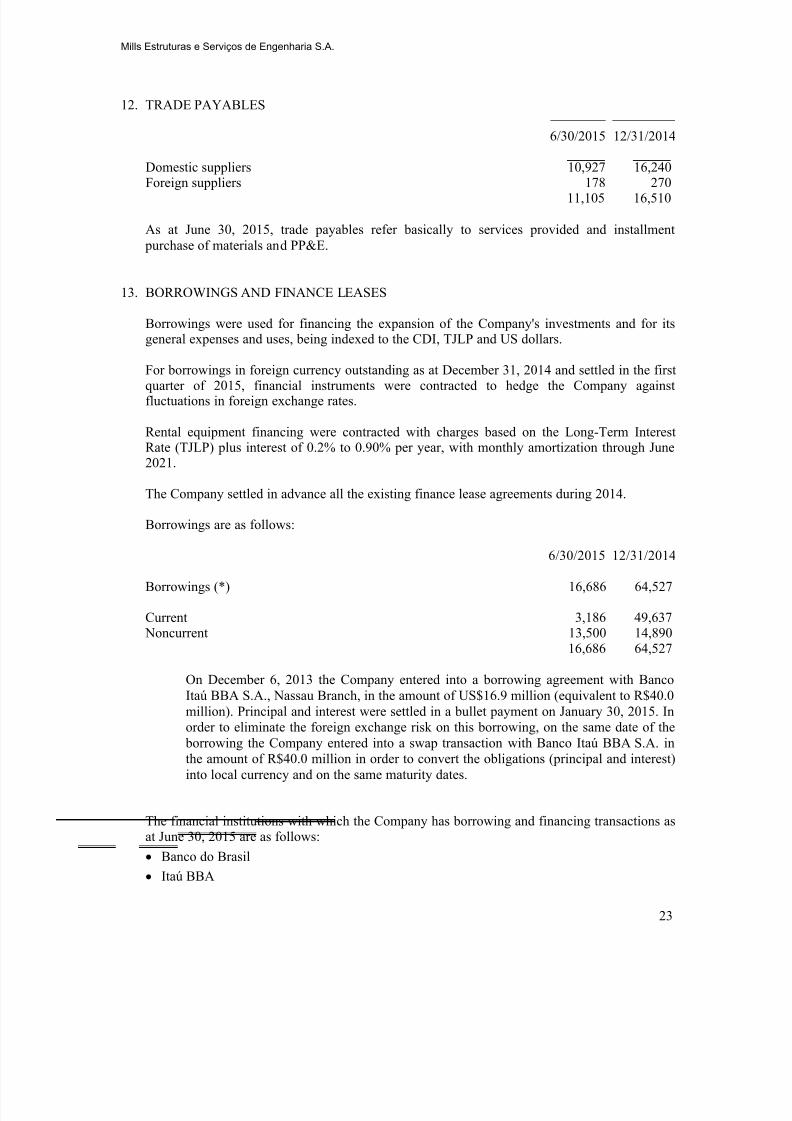
12. TRADE PAYABLES
6/30/2015 12/31/2014
Domestic suppliers 10,927 16,240Foreign suppliers 178 270
11,105 16,510
As at June 30, 2015, trade payables refer basically to services provided and installment purchase of materials and PP&E.
13. BORROWINGS AND FINANCE LEASES
Borrowings were used for financing the expansion of the Company's investments and for its
general expenses and uses, being indexed to the CDI, TJLP and US dollars.
For borrowings in foreign currency outstanding as at December 31, 2014 and settled in the firstquarter of 2015, financial instruments were contracted to hedge the Company againstfluctuations in foreign exchange rates.
Rental equipment financing were contracted with charges based on the Long-Term InterestRate (TJLP) plus interest of 0.2% to 0.90% per year, with monthly amortization through June2021.
The Company settled in advance all the existing finance lease agreements during 2014.
Borrowings are as follows:
6/30/2015 12/31/2014
Borrowings (*) 16,686 64,527
Current 3,186 49,637 Noncurrent 13,500 14,890
16,686 64,527
On December 6, 2013 the Company entered into a borrowing agreement with BancoItaú BBA S.A., Nassau Branch, in the amount of US$16.9 million (equivalent to R$40.0million). Principal and interest were settled in a bullet payment on January 30, 2015. Inorder to eliminate the foreign exchange risk on this borrowing, on the same date of the
borrowing the Company entered into a swap transaction with Banco Itaú BBA S.A. inthe amount of R$40.0 million in order to convert the obligations (principal and interest)into local currency and on the same maturity dates.
The financial institutions with which the Company has borrowing and financing transactions asat June 30, 2015 are as follows:
Banco do Brasil
Itaú BBA
8/20/2019 2Q15 Quarterly Financial Reports
http://slidepdf.com/reader/full/2q15-quarterly-financial-reports 25/53
Mills Estruturas e Serviços de Engenharia S.A.
24
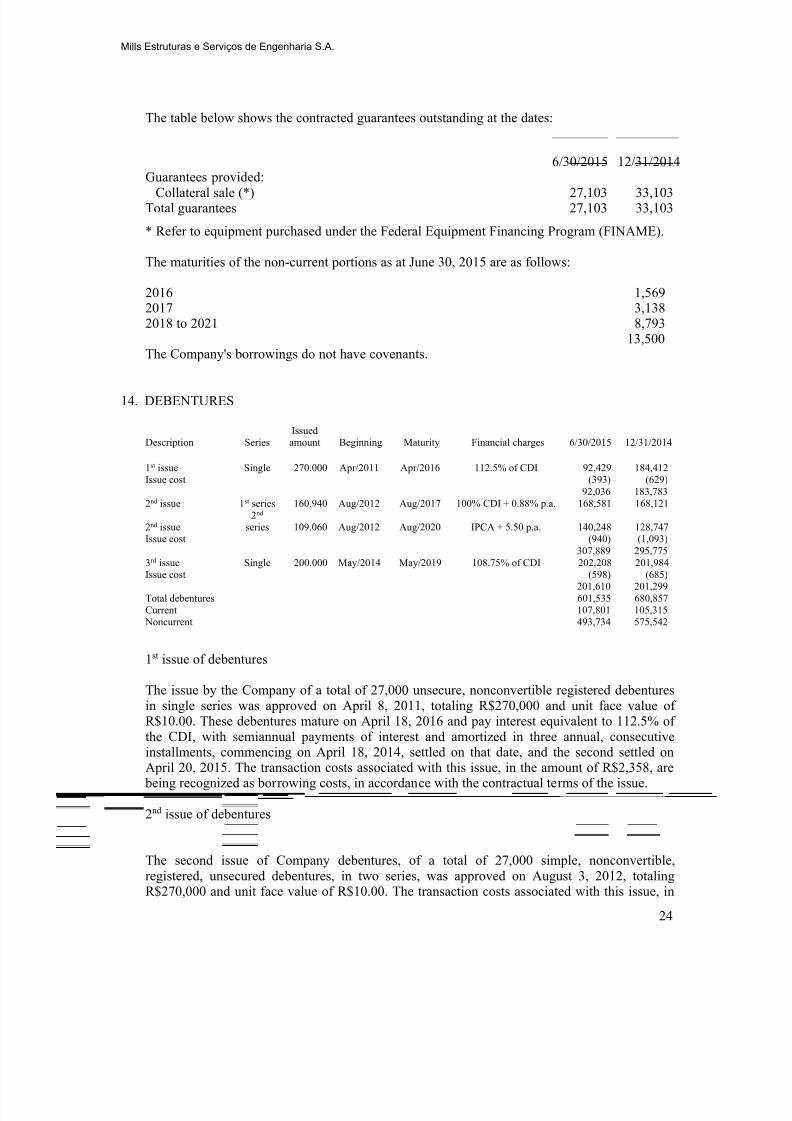
The table below shows the contracted guarantees outstanding at the dates:
6/30/2015 12/31/2014Guarantees provided:
Collateral sale (*) 27,103 33,103Total guarantees 27,103 33,103
* Refer to equipment purchased under the Federal Equipment Financing Program (FINAME).
The maturities of the non-current portions as at June 30, 2015 are as follows:
2016 1,5692017 3,1382018 to 2021 8,793
13,500The Company's borrowings do not have covenants.
14. DEBENTURES
Description SeriesIssuedamount Beginning Maturity Financial charges 6/30/2015 12/31/2014
1st issue Single 270.000 Apr/2011 Apr/2016 112.5% of CDI 92,429 184,412Issue cost (393) (629)
92,036 183,7832nd issue 1st series 160.940 Aug/2012 Aug/2017 100% CDI + 0.88% p.a. 168,581 168,121
2nd issue2nd
series 109.060 Aug/2012 Aug/2020 IPCA + 5.50 p.a. 140,248 128,747Issue cost (940) (1,093)
307,889 295,7753rd issue Single 200.000 May/2014 May/2019 108.75% of CDI 202,208 201,984Issue cost (598) (685)
201,610 201,299Total debentures 601,535 680,857Current 107,801 105,315 Noncurrent 493,734 575,542
1st issue of debentures
The issue by the Company of a total of 27,000 unsecure, nonconvertible registered debenturesin single series was approved on April 8, 2011, totaling R$270,000 and unit face value ofR$10.00. These debentures mature on April 18, 2016 and pay interest equivalent to 112.5% ofthe CDI, with semiannual payments of interest and amortized in three annual, consecutiveinstallments, commencing on April 18, 2014, settled on that date, and the second settled onApril 20, 2015. The transaction costs associated with this issue, in the amount of R$2,358, are
being recognized as borrowing costs, in accordance with the contractual terms of the issue.
2nd issue of debentures
The second issue of Company debentures, of a total of 27,000 simple, nonconvertible,registered, unsecured debentures, in two series, was approved on August 3, 2012, totalingR$270,000 and unit face value of R$10.00. The transaction costs associated with this issue, in
8/20/2019 2Q15 Quarterly Financial Reports
http://slidepdf.com/reader/full/2q15-quarterly-financial-reports 26/53
Mills Estruturas e Serviços de Engenharia S.A.
25
the amount of R$1,810, are being recognized as borrowing costs, in accordance with thecontractual terms of the issue.
The debentures have their maturities according to the issue of each series, as follows:
1st series - 16,094 first series debentures, totaling R$160,940, with maturity on August 15,2017, not subject to adjustment for inflation. The face value of the first series debentureswill be amortized in two annual installments as from the fourth year of their issue andinterest paid semiannually will correspond to a surcharge of 0.88% p.a. levied on 100% ofthe accumulated variation of the DI rate;
2nd series - 10,906 second series debentures series, totaling R$109,060, with maturity onAugust 15, 2020, subject to adjustment for inflation based on the accumulated variation ofthe IPCA index. The face value of the second series debentures will be amortized in threeannual installments as from the sixth year of their issue and interest paid semiannually willcorrespond to 5.50% p.a. of the amount adjusted for inflation as indicated above.
3rd issue of debentures
The third issue of Company debentures, of a total of 20,000 simple, nonconvertible, registered,unsecured debentures, in a single series, was approved on May 30, 2014, totaling R$200,000and unit face value of R$10.00. These debentures mature on May 30, 2019 and pay interestequivalent to 108.75% of the CDI, payable semiannually, and amortized in three annual,consecutive installments, commencing on May 30, 2017. The transaction costs associated withthis issue, in the amount of R$745, are being recognized as borrowing costs, in accordance withthe contractual terms of the issue.
The proceeds obtained by the Company with the third issue of debentures were fully used tosettle the commercial promissory notes of the Company’s fourth issue, issued on April 11,2014.
As at June 30, 2015 the balance of debentures including transaction costs is R$108,654 incurrent liabilities and R$494,812 in non-current liabilities, and R$107,801 and R$493,734, netof transaction costs, respectively. (As at December 31, 2014, the balances of debentures areR$106,203 in current liabilities and R$577,061 in noncurrent liabilities, and R$105,315 andR$575,542, net of transaction costs, respectively.)
Covenants
The debenture indentures require the compliance with debt and interest coverage ratios under preset parameters, as follows:
(1) Net debt (i)-to-EBITDA (ii) ratio equal to or lower than three (3); and
(2) EBITDA-to-net financial expenses (iii) equal to or higher than two (2).
(i) “Net Debt” means, based on the Company’s immediately preceding ConsolidatedFinancial Statements, (a) the sum of the Company's onerous debts, on aconsolidated basis, to companies, including borrowings with third parties and/or
8/20/2019 2Q15 Quarterly Financial Reports
http://slidepdf.com/reader/full/2q15-quarterly-financial-reports 27/53
Mills Estruturas e Serviços de Engenharia S.A.
26
related parties and issue of fixed-income securities, convertible or not, in the localand/or international capital market, as well as guarantees provided by theCompany, but excluding debts arising from tax installment payments; (b) less thesum of the Company’s cash and cash equivalents (cash and short-term
investments), on a consolidated basis;
(ii) “EBITDA” means, based on the Company’s four immediately precedingConsolidated Financial Statements, profit or loss before income tax and socialcontribution, less income and plus expenses generated by finance income andcosts and nonoperating income and expenses, depreciation and amortization, andnonrecurring income and expenses; and
(iii) “Net Finance Cost” means, based on the Company’s four immediately precedingConsolidated Financial Statements, the balance of the difference between the
consolidated gross finance income and the consolidated gross finance cost.
On the closing of the interim financial information for the quarter ended June 30, 2015 theCompany was compliant with all ratios.
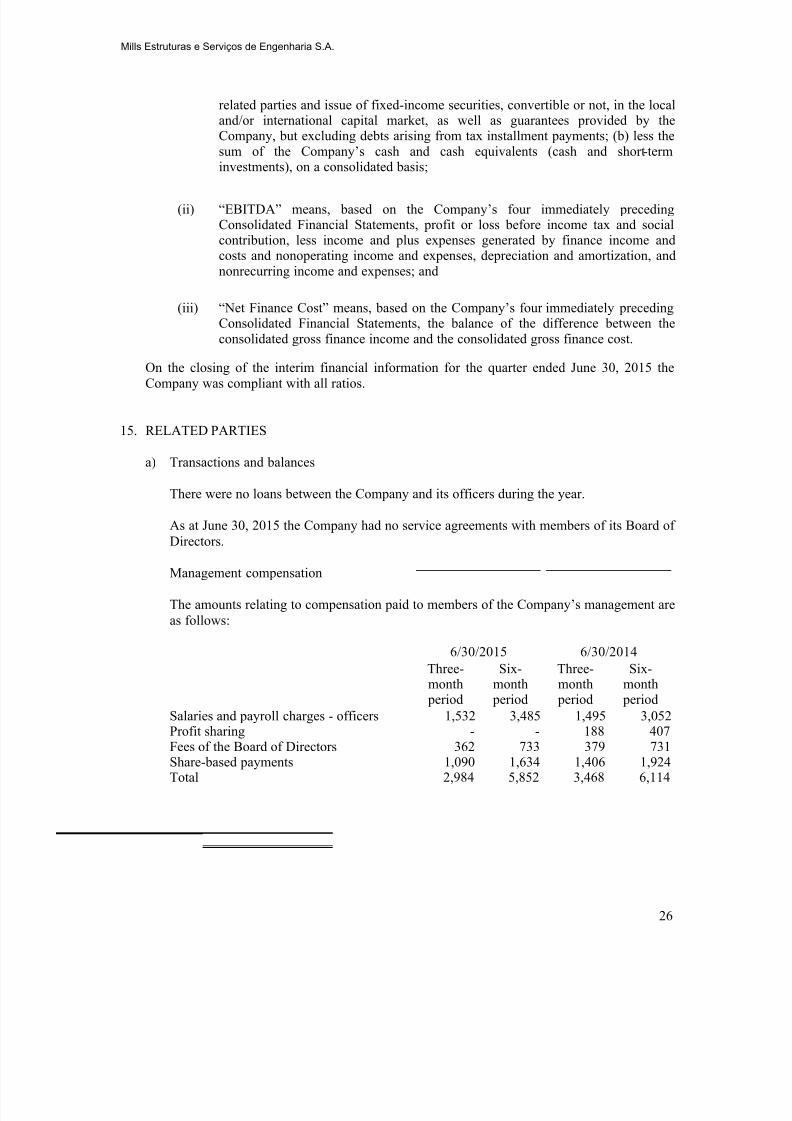
15. RELATED PARTIES
a) Transactions and balances
There were no loans between the Company and its officers during the year.
As at June 30, 2015 the Company had no service agreements with members of its Board ofDirectors.
Management compensation
The amounts relating to compensation paid to members of the Company’s management areas follows:
6/30/2015 6/30/2014
Three-
month period
Six-
month period
Three-
month period
Six-
month period
Salaries and payroll charges - officers 1,532 3,485 1,495 3,052Profit sharing - - 188 407Fees of the Board of Directors 362 733 379 731Share-based payments 1,090 1,634 1,406 1,924Total 2,984 5,852 3,468 6,114
8/20/2019 2Q15 Quarterly Financial Reports
http://slidepdf.com/reader/full/2q15-quarterly-financial-reports 28/53
Mills Estruturas e Serviços de Engenharia S.A.
27
16. EMPLOYEE BENEFITS
a) Employee profit sharing
The provision for profit sharing of employees and executive officers is recognized on anaccrual basis and is accounted for as an expense. The determination of the amount, whichis paid in the year subsequent to the recognition of the provision, considers the targets
program established together with the labor union through a collective labor agreement, inaccordance with Law 10,101/00 and the Company’s bylaws.
On June 23, 2015, the Board of Directors decided that the employee profit sharing in 2015will be based on the EBITDA, where up to 5% of the Company's EBITDA can bedistributed if the EBITDA reached exceeds the estimated EBITDA. The metrics for thiscalculation is approved by the Company’s management.
Such profit sharing, when any, will be recognized when the EBITDA annual target isreached, and will be disbursed until April 2016. Until the second quarter of 2015 theCompany has not reached the target and, therefore, for this period and for the year 2014 no
provision is recognized for this expense.
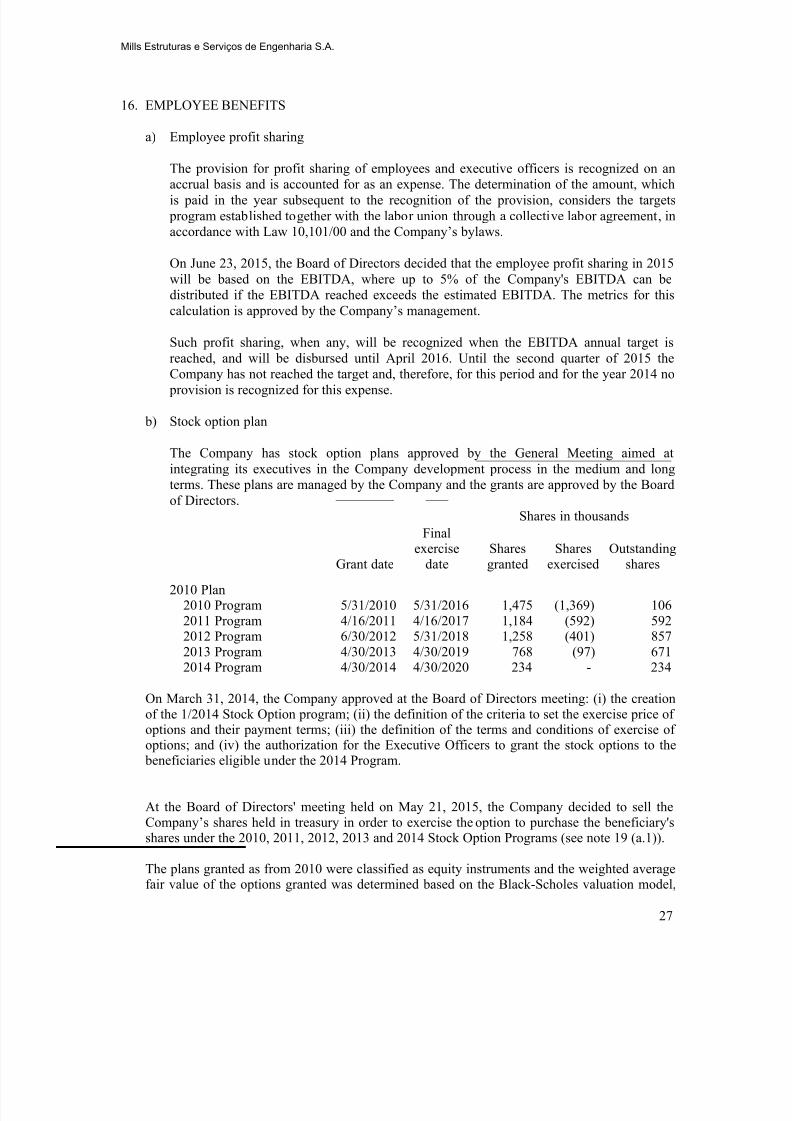
b) Stock option plan
The Company has stock option plans approved by the General Meeting aimed atintegrating its executives in the Company development process in the medium and longterms. These plans are managed by the Company and the grants are approved by the Boardof Directors.
Shares in thousands
Grant date
Finalexercise
dateSharesgranted
Sharesexercised
Outstandingshares
2010 Plan2010 Program 5/31/2010 5/31/2016 1,475 (1,369) 1062011 Program 4/16/2011 4/16/2017 1,184 (592) 5922012 Program 6/30/2012 5/31/2018 1,258 (401) 8572013 Program 4/30/2013 4/30/2019 768 (97) 6712014 Program 4/30/2014 4/30/2020 234 - 234
On March 31, 2014, the Company approved at the Board of Directors meeting: (i) the creationof the 1/2014 Stock Option program; (ii) the definition of the criteria to set the exercise price ofoptions and their payment terms; (iii) the definition of the terms and conditions of exercise ofoptions; and (iv) the authorization for the Executive Officers to grant the stock options to the
beneficiaries eligible under the 2014 Program.
At the Board of Directors' meeting held on May 21, 2015, the Company decided to sell theCompany’s shares held in treasury in order to exercise the option to purchase the beneficiary'sshares under the 2010, 2011, 2012, 2013 and 2014 Stock Option Programs (see note 19 (a.1)).
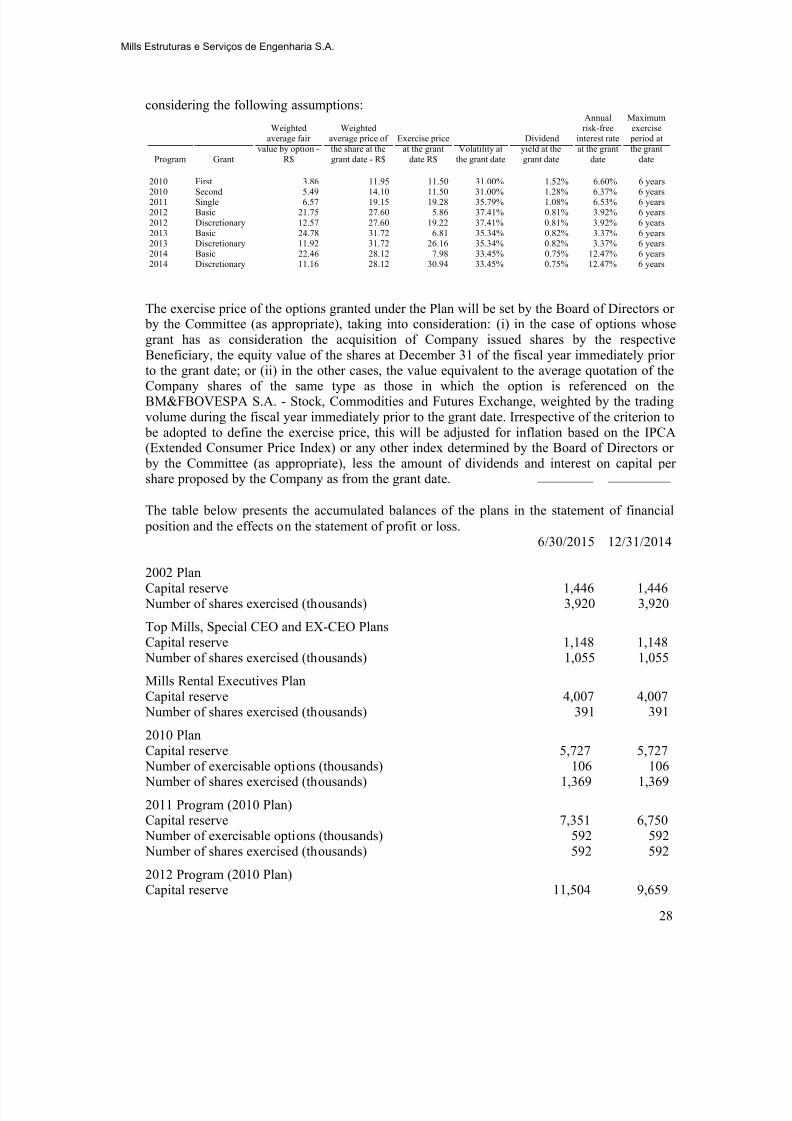
The plans granted as from 2010 were classified as equity instruments and the weighted averagefair value of the options granted was determined based on the Black-Scholes valuation model,
8/20/2019 2Q15 Quarterly Financial Reports
http://slidepdf.com/reader/full/2q15-quarterly-financial-reports 29/53
Mills Estruturas e Serviços de Engenharia S.A.
28
considering the following assumptions:
Program Grant
Weightedaverage fair
value by option -R$
Weightedaverage price ofthe share at thegrant date - R$
Exercise priceat the grant
date R$Volatility at
the grant date
Dividendyield at thegrant date
Annualrisk-free
interest rateat the grant
date
Maximumexercise
period atthe grant
date
2010 First 3.86 11.95 11.50 31.00% 1.52% 6.60% 6 years2010 Second 5.49 14.10 11.50 31.00% 1.28% 6.37% 6 years2011 Single 6.57 19.15 19.28 35.79% 1.08% 6.53% 6 years2012 Basic 21.75 27.60 5.86 37.41% 0.81% 3.92% 6 years2012 Discretionary 12.57 27.60 19.22 37.41% 0.81% 3.92% 6 years2013 Basic 24.78 31.72 6.81 35.34% 0.82% 3.37% 6 years2013 Discretionary 11.92 31.72 26.16 35.34% 0.82% 3.37% 6 years2014 Basic 22.46 28.12 7.98 33.45% 0.75% 12.47% 6 years2014 Discretionary 11.16 28.12 30.94 33.45% 0.75% 12.47% 6 years
The exercise price of the options granted under the Plan will be set by the Board of Directors or by the Committee (as appropriate), taking into consideration: (i) in the case of options whose
grant has as consideration the acquisition of Company issued shares by the respectiveBeneficiary, the equity value of the shares at December 31 of the fiscal year immediately priorto the grant date; or (ii) in the other cases, the value equivalent to the average quotation of theCompany shares of the same type as those in which the option is referenced on theBM&FBOVESPA S.A. - Stock, Commodities and Futures Exchange, weighted by the tradingvolume during the fiscal year immediately prior to the grant date. Irrespective of the criterion to
be adopted to define the exercise price, this will be adjusted for inflation based on the IPCA(Extended Consumer Price Index) or any other index determined by the Board of Directors or
by the Committee (as appropriate), less the amount of dividends and interest on capital pershare proposed by the Company as from the grant date.
The table below presents the accumulated balances of the plans in the statement of financial position and the effects on the statement of profit or loss.
6/30/2015 12/31/2014
2002 PlanCapital reserve 1,446 1,446
Number of shares exercised (thousands) 3,920 3,920
Top Mills, Special CEO and EX-CEO PlansCapital reserve 1,148 1,148
Number of shares exercised (thousands) 1,055 1,055
Mills Rental Executives PlanCapital reserve 4,007 4,007
Number of shares exercised (thousands) 391 391
2010 PlanCapital reserve 5,727 5,727
Number of exercisable options (thousands) 106 106 Number of shares exercised (thousands) 1,369 1,369
2011 Program (2010 Plan)Capital reserve 7,351 6,750
Number of exercisable options (thousands) 592 592
Number of shares exercised (thousands) 592 592
2012 Program (2010 Plan)Capital reserve 11,504 9,659
8/20/2019 2Q15 Quarterly Financial Reports
http://slidepdf.com/reader/full/2q15-quarterly-financial-reports 30/53
Mills Estruturas e Serviços de Engenharia S.A.
29
6/30/2015 12/31/2014
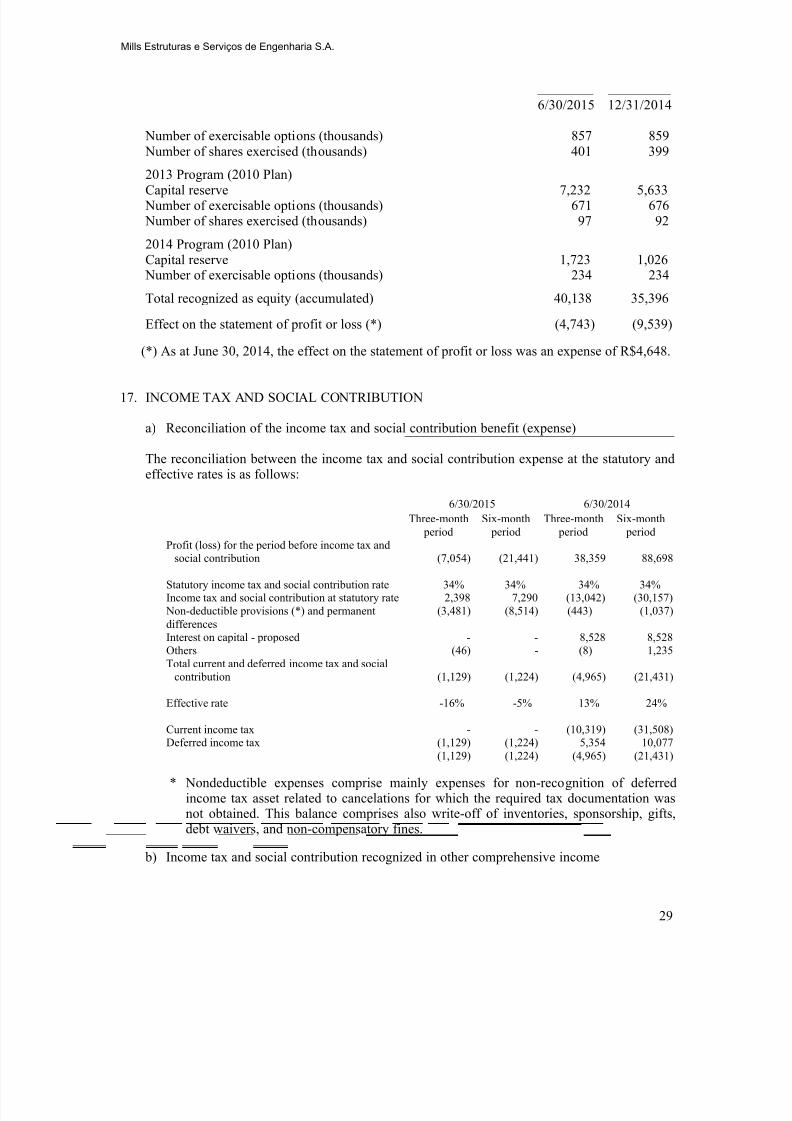
Number of exercisable options (thousands) 857 859 Number of shares exercised (thousands) 401 399
2013 Program (2010 Plan)Capital reserve 7,232 5,633
Number of exercisable options (thousands) 671 676 Number of shares exercised (thousands) 97 92
2014 Program (2010 Plan)Capital reserve 1,723 1,026
Number of exercisable options (thousands) 234 234
Total recognized as equity (accumulated) 40,138 35,396
Effect on the statement of profit or loss (*) (4,743) (9,539)
(*) As at June 30, 2014, the effect on the statement of profit or loss was an expense of R$4,648.
17. INCOME TAX AND SOCIAL CONTRIBUTION
a) Reconciliation of the income tax and social contribution benefit (expense)
The reconciliation between the income tax and social contribution expense at the statutory andeffective rates is as follows:
6/30/2015 6/30/2014
Three-month period
Six-month period
Three-month period
Six-month period
Profit (loss) for the period before income tax andsocial contribution (7,054) (21,441) 38,359 88,698
Statutory income tax and social contribution rate 34% 34% 34% 34%Income tax and social contribution at statutory rate 2,398 7,290 (13,042) (30,157)
Non-deductible provisions (*) and permanentdifferences
(3,481) (8,514) (443) (1,037)
Interest on capital - proposed - - 8,528 8,528Others (46) - (8) 1,235Total current and deferred income tax and social
contribution (1,129) (1,224) (4,965) (21,431)
Effective rate -16% -5% 13% 24%
Current income tax - - (10,319) (31,508)Deferred income tax (1,129) (1,224) 5,354 10,077
(1,129) (1,224) (4,965) (21,431)
* Nondeductible expenses comprise mainly expenses for non-recognition of deferredincome tax asset related to cancelations for which the required tax documentation wasnot obtained. This balance comprises also write-off of inventories, sponsorship, gifts,debt waivers, and non-compensatory fines.
b) Income tax and social contribution recognized in other comprehensive income
8/20/2019 2Q15 Quarterly Financial Reports
http://slidepdf.com/reader/full/2q15-quarterly-financial-reports 31/53
Mills Estruturas e Serviços de Engenharia S.A.
30
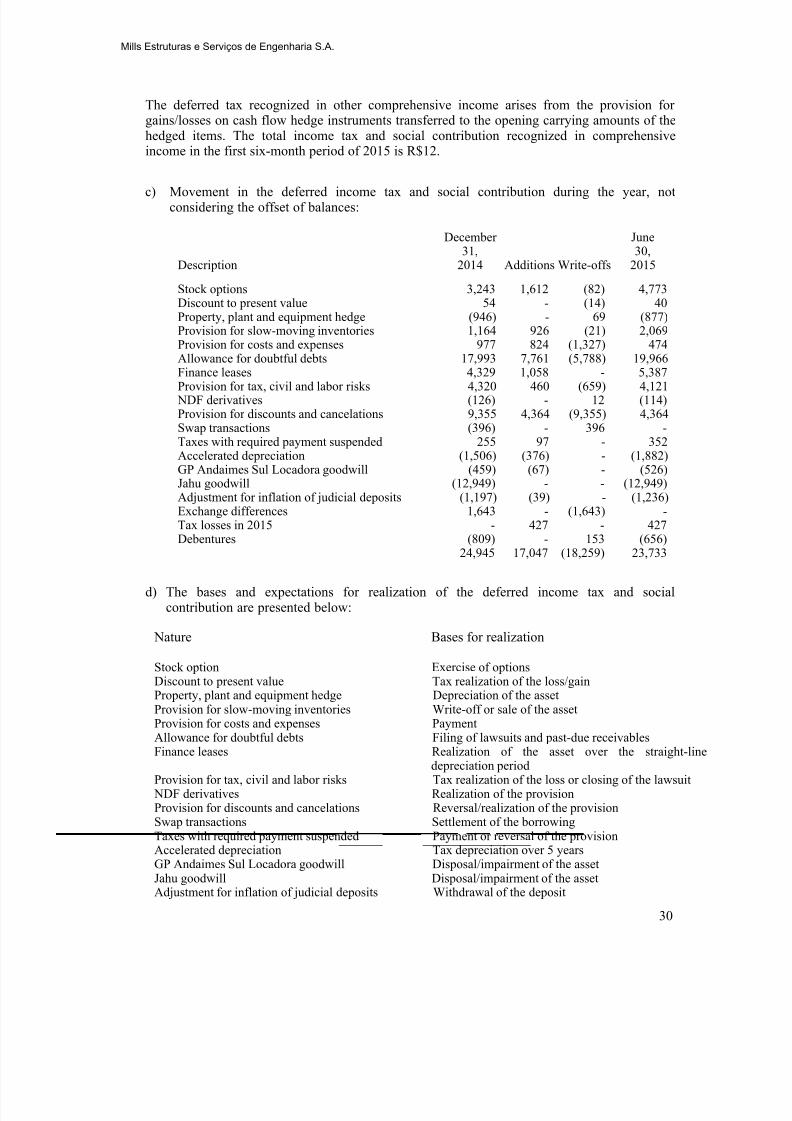
The deferred tax recognized in other comprehensive income arises from the provision forgains/losses on cash flow hedge instruments transferred to the opening carrying amounts of thehedged items. The total income tax and social contribution recognized in comprehensiveincome in the first six-month period of 2015 is R$12.
c) Movement in the deferred income tax and social contribution during the year, notconsidering the offset of balances:
Description
December31,
2014 Additions Write-offs
June30,
2015
Stock options 3,243 1,612 (82) 4,773Discount to present value 54 - (14) 40Property, plant and equipment hedge (946) - 69 (877)Provision for slow-moving inventories 1,164 926 (21) 2,069Provision for costs and expenses 977 824 (1,327) 474Allowance for doubtful debts 17,993 7,761 (5,788) 19,966Finance leases 4,329 1,058 - 5,387Provision for tax, civil and labor risks 4,320 460 (659) 4,121 NDF derivatives (126) - 12 (114)Provision for discounts and cancelations 9,355 4,364 (9,355) 4,364Swap transactions (396) - 396 -Taxes with required payment suspended 255 97 - 352Accelerated depreciation (1,506) (376) - (1,882)GP Andaimes Sul Locadora goodwill (459) (67) - (526)Jahu goodwill (12,949) - - (12,949)Adjustment for inflation of judicial deposits (1,197) (39) - (1,236)
Exchange differences 1,643 - (1,643) -Tax losses in 2015 - 427 - 427Debentures (809) - 153 (656)
24,945 17,047 (18,259) 23,733
d) The bases and expectations for realization of the deferred income tax and socialcontribution are presented below:
Nature Bases for realization
Stock option Exercise of options
Discount to present value Tax realization of the loss/gainProperty, plant and equipment hedge Depreciation of the assetProvision for slow-moving inventories Write-off or sale of the assetProvision for costs and expenses PaymentAllowance for doubtful debts Filing of lawsuits and past-due receivablesFinance leases Realization of the asset over the straight-line
depreciation periodProvision for tax, civil and labor risks Tax realization of the loss or closing of the lawsuit NDF derivatives Realization of the provisionProvision for discounts and cancelations Reversal/realization of the provisionSwap transactions Settlement of the borrowingTaxes with required payment suspended Payment or reversal of the provision
Accelerated depreciation Tax depreciation over 5 yearsGP Andaimes Sul Locadora goodwill Disposal/impairment of the assetJahu goodwill Disposal/impairment of the assetAdjustment for inflation of judicial deposits Withdrawal of the deposit
8/20/2019 2Q15 Quarterly Financial Reports
http://slidepdf.com/reader/full/2q15-quarterly-financial-reports 32/53
Mills Estruturas e Serviços de Engenharia S.A.
31
Exchange differences Repayment of the borrowingTax losses Expectation of future taxable profitsDebentures Amortization of the borrowing cost
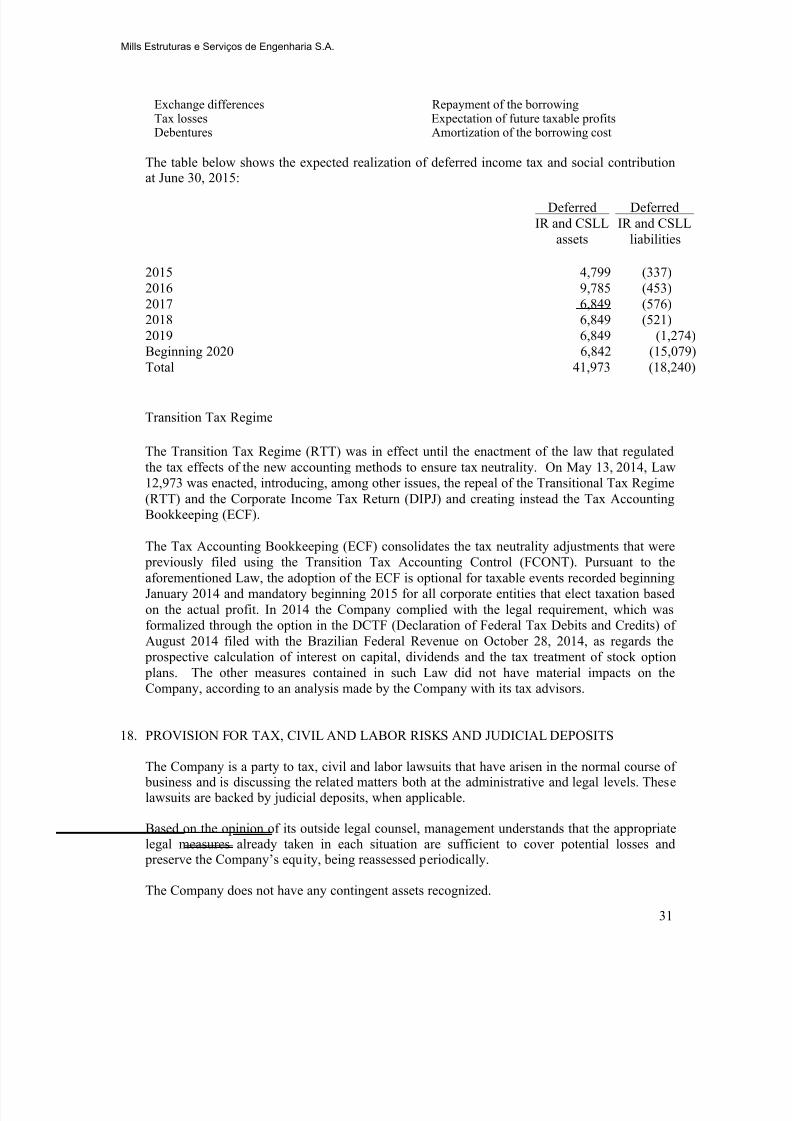
The table below shows the expected realization of deferred income tax and social contributionat June 30, 2015:
DeferredIR and CSLL
DeferredIR and CSLL
assets liabilities
2015 4,799 (337)2016 9,785 (453)2017 6,849 (576)2018 6,849 (521)
2019 6,849 (1,274)Beginning 2020 6,842 (15,079)Total 41,973 (18,240)
Transition Tax Regime
The Transition Tax Regime (RTT) was in effect until the enactment of the law that regulatedthe tax effects of the new accounting methods to ensure tax neutrality. On May 13, 2014, Law12,973 was enacted, introducing, among other issues, the repeal of the Transitional Tax Regime(RTT) and the Corporate Income Tax Return (DIPJ) and creating instead the Tax Accounting
Bookkeeping (ECF).
The Tax Accounting Bookkeeping (ECF) consolidates the tax neutrality adjustments that were previously filed using the Transition Tax Accounting Control (FCONT). Pursuant to theaforementioned Law, the adoption of the ECF is optional for taxable events recorded beginningJanuary 2014 and mandatory beginning 2015 for all corporate entities that elect taxation basedon the actual profit. In 2014 the Company complied with the legal requirement, which wasformalized through the option in the DCTF (Declaration of Federal Tax Debits and Credits) ofAugust 2014 filed with the Brazilian Federal Revenue on October 28, 2014, as regards the
prospective calculation of interest on capital, dividends and the tax treatment of stock option plans. The other measures contained in such Law did not have material impacts on theCompany, according to an analysis made by the Company with its tax advisors.
18. PROVISION FOR TAX, CIVIL AND LABOR RISKS AND JUDICIAL DEPOSITS
The Company is a party to tax, civil and labor lawsuits that have arisen in the normal course of business and is discussing the related matters both at the administrative and legal levels. Theselawsuits are backed by judicial deposits, when applicable.
Based on the opinion of its outside legal counsel, management understands that the appropriate
legal measures already taken in each situation are sufficient to cover potential losses and preserve the Company’s equity, being reassessed periodically.
The Company does not have any contingent assets recognized.
8/20/2019 2Q15 Quarterly Financial Reports
http://slidepdf.com/reader/full/2q15-quarterly-financial-reports 33/53
Mills Estruturas e Serviços de Engenharia S.A.
32
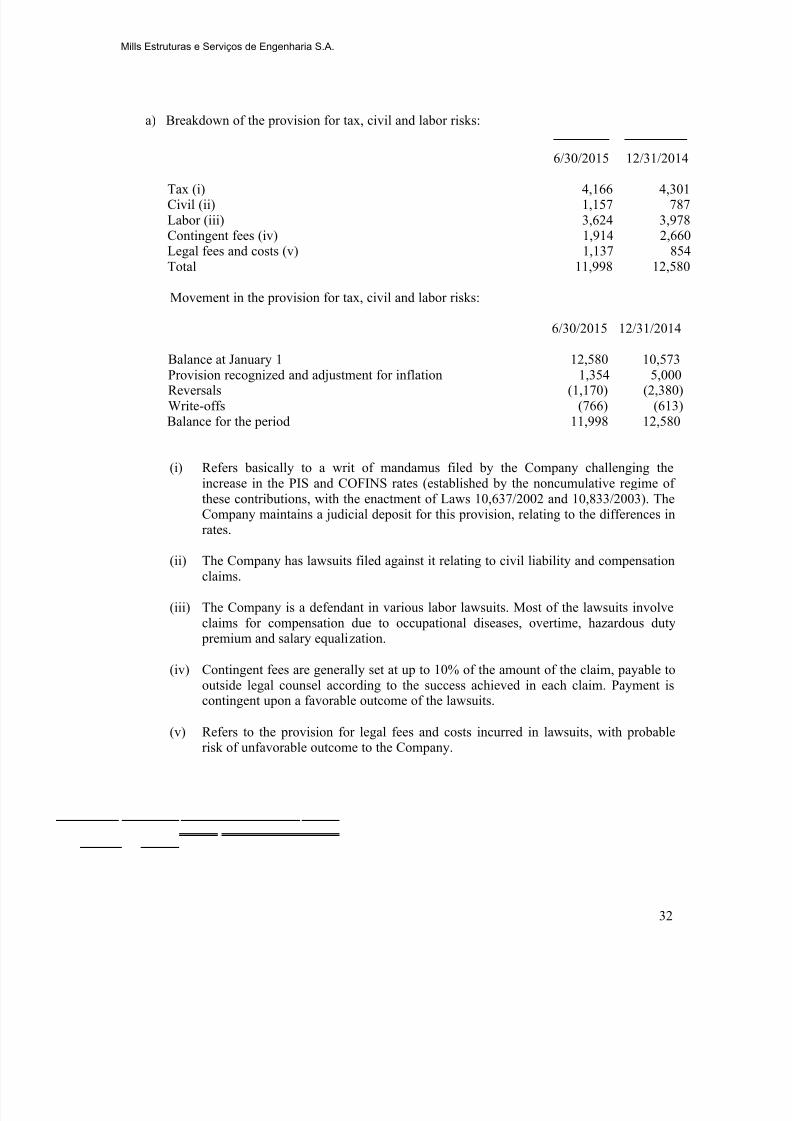
a) Breakdown of the provision for tax, civil and labor risks:
6/30/2015 12/31/2014
Tax (i) 4,166 4,301Civil (ii) 1,157 787Labor (iii) 3,624 3,978Contingent fees (iv) 1,914 2,660Legal fees and costs (v) 1,137 854Total 11,998 12,580
Movement in the provision for tax, civil and labor risks:
6/30/2015 12/31/2014
Balance at January 1 12,580 10,573Provision recognized and adjustment for inflation 1,354 5,000Reversals (1,170) (2,380)Write-offs (766) (613)Balance for the period 11,998 12,580
(i) Refers basically to a writ of mandamus filed by the Company challenging theincrease in the PIS and COFINS rates (established by the noncumulative regime ofthese contributions, with the enactment of Laws 10,637/2002 and 10,833/2003). The
Company maintains a judicial deposit for this provision, relating to the differences inrates.
(ii) The Company has lawsuits filed against it relating to civil liability and compensationclaims.
(iii) The Company is a defendant in various labor lawsuits. Most of the lawsuits involveclaims for compensation due to occupational diseases, overtime, hazardous duty
premium and salary equalization.
(iv) Contingent fees are generally set at up to 10% of the amount of the claim, payable to
outside legal counsel according to the success achieved in each claim. Payment iscontingent upon a favorable outcome of the lawsuits.
(v) Refers to the provision for legal fees and costs incurred in lawsuits, with probablerisk of unfavorable outcome to the Company.
8/20/2019 2Q15 Quarterly Financial Reports
http://slidepdf.com/reader/full/2q15-quarterly-financial-reports 34/53
Mills Estruturas e Serviços de Engenharia S.A.
33
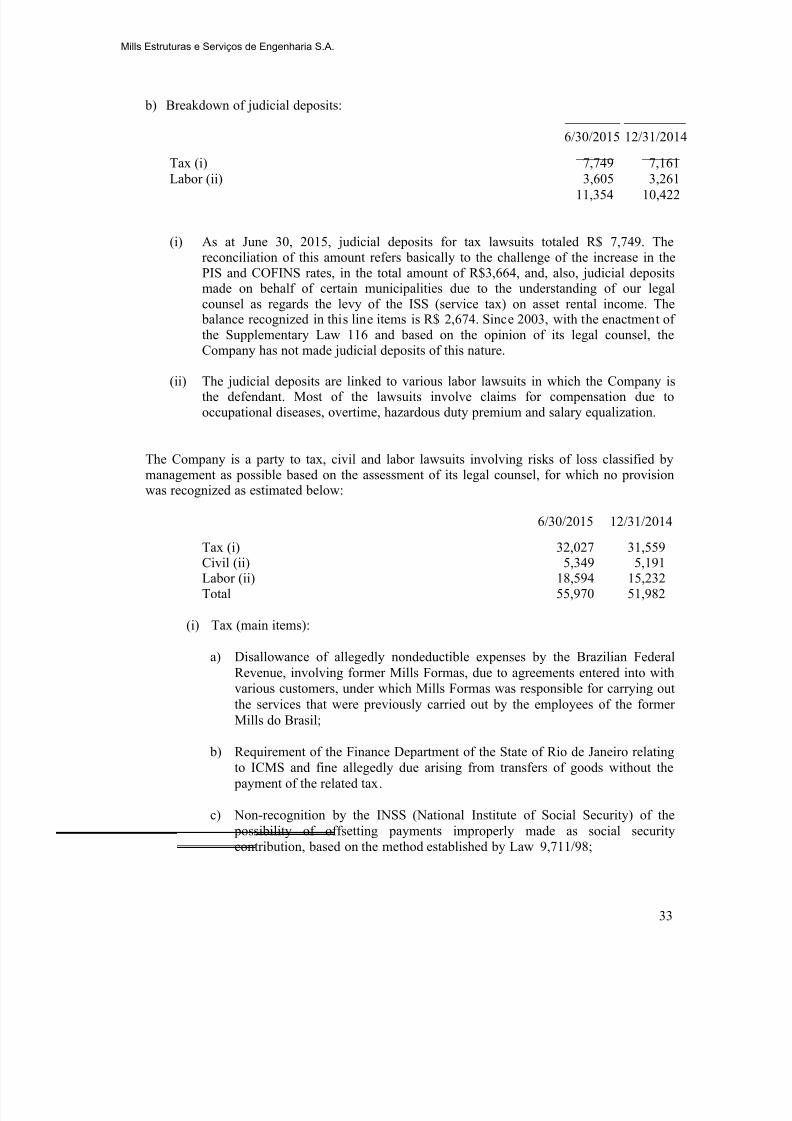
b) Breakdown of judicial deposits:
6/30/2015 12/31/2014
Tax (i) 7,749 7,161Labor (ii) 3,605 3,26111,354 10,422
(i) As at June 30, 2015, judicial deposits for tax lawsuits totaled R$ 7,749. Thereconciliation of this amount refers basically to the challenge of the increase in thePIS and COFINS rates, in the total amount of R$3,664, and, also, judicial depositsmade on behalf of certain municipalities due to the understanding of our legalcounsel as regards the levy of the ISS (service tax) on asset rental income. The
balance recognized in this line items is R$ 2,674. Since 2003, with the enactment of
the Supplementary Law 116 and based on the opinion of its legal counsel, theCompany has not made judicial deposits of this nature.
(ii) The judicial deposits are linked to various labor lawsuits in which the Company isthe defendant. Most of the lawsuits involve claims for compensation due tooccupational diseases, overtime, hazardous duty premium and salary equalization.
The Company is a party to tax, civil and labor lawsuits involving risks of loss classified bymanagement as possible based on the assessment of its legal counsel, for which no provisionwas recognized as estimated below:
6/30/2015 12/31/2014
Tax (i) 32,027 31,559Civil (ii) 5,349 5,191Labor (ii) 18,594 15,232Total 55,970 51,982
(i) Tax (main items):
a) Disallowance of allegedly nondeductible expenses by the Brazilian FederalRevenue, involving former Mills Formas, due to agreements entered into withvarious customers, under which Mills Formas was responsible for carrying outthe services that were previously carried out by the employees of the formerMills do Brasil;
b) Requirement of the Finance Department of the State of Rio de Janeiro relatingto ICMS and fine allegedly due arising from transfers of goods without the
payment of the related tax.
c) Non-recognition by the INSS (National Institute of Social Security) of the possibility of offsetting payments improperly made as social security
contribution, based on the method established by Law 9,711/98;
8/20/2019 2Q15 Quarterly Financial Reports
http://slidepdf.com/reader/full/2q15-quarterly-financial-reports 35/53
Mills Estruturas e Serviços de Engenharia S.A.
34
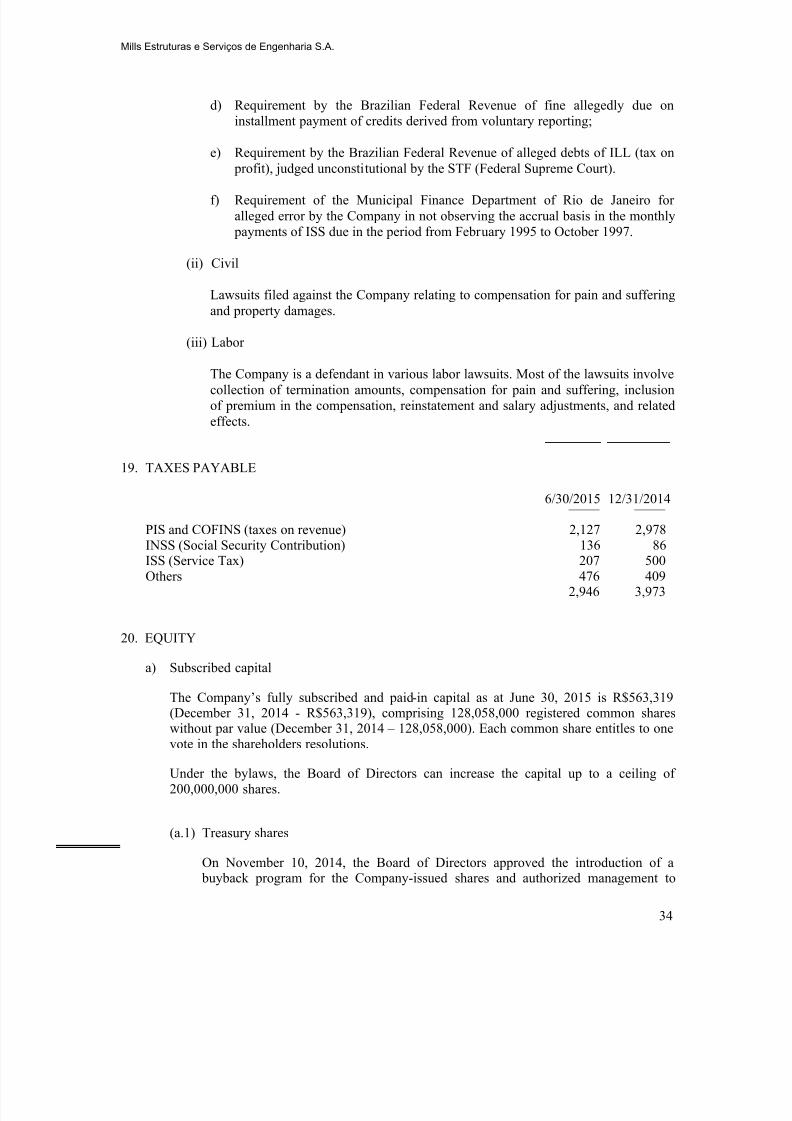
d) Requirement by the Brazilian Federal Revenue of fine allegedly due oninstallment payment of credits derived from voluntary reporting;
e) Requirement by the Brazilian Federal Revenue of alleged debts of ILL (tax on
profit), judged unconstitutional by the STF (Federal Supreme Court).
f) Requirement of the Municipal Finance Department of Rio de Janeiro foralleged error by the Company in not observing the accrual basis in the monthly
payments of ISS due in the period from February 1995 to October 1997.
(ii) Civil
Lawsuits filed against the Company relating to compensation for pain and sufferingand property damages.
(iii) Labor
The Company is a defendant in various labor lawsuits. Most of the lawsuits involvecollection of termination amounts, compensation for pain and suffering, inclusionof premium in the compensation, reinstatement and salary adjustments, and relatedeffects.
19. TAXES PAYABLE
6/30/2015 12/31/2014
PIS and COFINS (taxes on revenue) 2,127 2,978INSS (Social Security Contribution) 136 86ISS (Service Tax) 207 500Others 476 409
2,946 3,973
20. EQUITY
a) Subscribed capital
The Company’s fully subscribed and paid-in capital as at June 30, 2015 is R$563,319(December 31, 2014 - R$563,319), comprising 128,058,000 registered common shareswithout par value (December 31, 2014 – 128,058,000). Each common share entitles to onevote in the shareholders resolutions.
Under the bylaws, the Board of Directors can increase the capital up to a ceiling of200,000,000 shares.
(a.1) Treasury shares
On November 10, 2014, the Board of Directors approved the introduction of a buyback program for the Company-issued shares and authorized management to
8/20/2019 2Q15 Quarterly Financial Reports
http://slidepdf.com/reader/full/2q15-quarterly-financial-reports 36/53
Mills Estruturas e Serviços de Engenharia S.A.
35
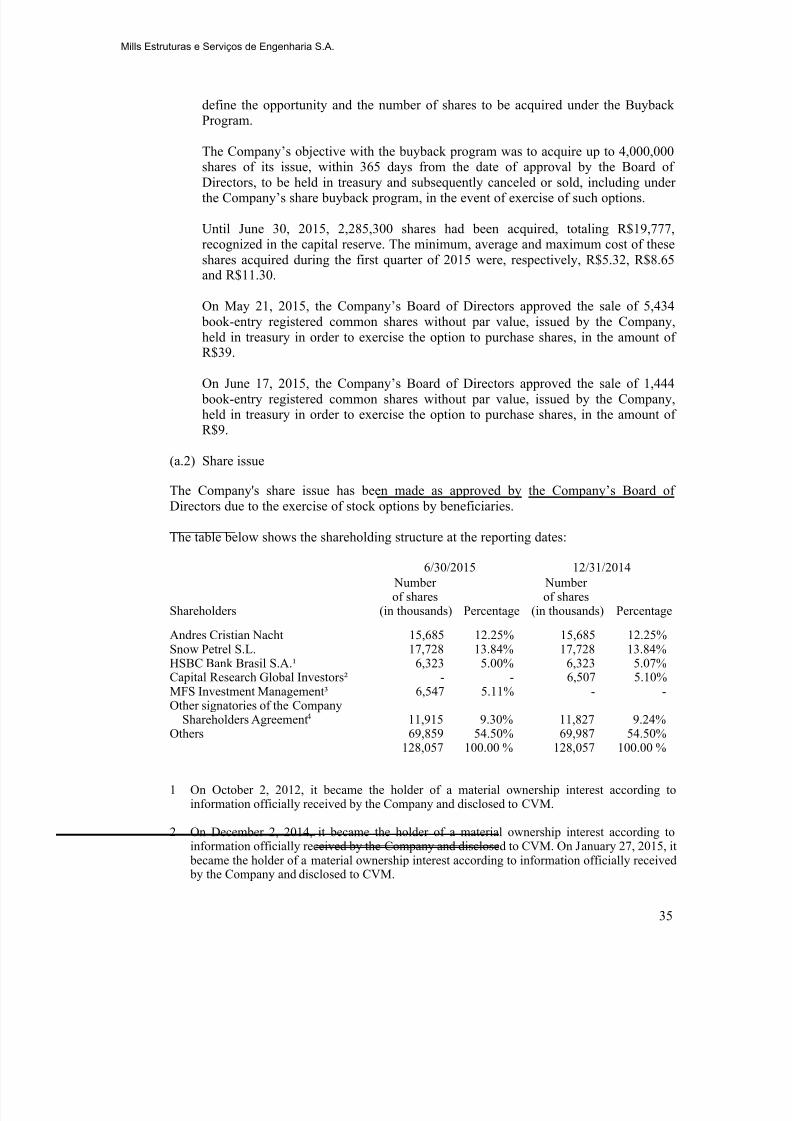
define the opportunity and the number of shares to be acquired under the BuybackProgram.
The Company’s objective with the buyback program was to acquire up to 4,000,000
shares of its issue, within 365 days from the date of approval by the Board ofDirectors, to be held in treasury and subsequently canceled or sold, including underthe Company’s share buyback program, in the event of exercise of such options.
Until June 30, 2015, 2,285,300 shares had been acquired, totaling R$19,777,recognized in the capital reserve. The minimum, average and maximum cost of theseshares acquired during the first quarter of 2015 were, respectively, R$5.32, R$8.65and R$11.30.
On May 21, 2015, the Company’s Board of Directors approved the sale of 5,434 book-entry registered common shares without par value, issued by the Company,
held in treasury in order to exercise the option to purchase shares, in the amount ofR$39.
On June 17, 2015, the Company’s Board of Directors approved the sale of 1,444 book-entry registered common shares without par value, issued by the Company,held in treasury in order to exercise the option to purchase shares, in the amount ofR$9.
(a.2) Share issue
The Company's share issue has been made as approved by the Company’s Board of
Directors due to the exercise of stock options by beneficiaries.
The table below shows the shareholding structure at the reporting dates:
6/30/2015 12/31/2014
Number Numberof shares of shares
Shareholders (in thousands) Percentage (in thousands) Percentage
Andres Cristian Nacht 15,685 12.25% 15,685 12.25%Snow Petrel S.L. 17,728 13.84% 17,728 13.84%HSBC Bank Brasil S.A.¹ 6,323 5.00% 6,323 5.07%
Capital Research Global Investors² - - 6,507 5.10%MFS Investment Management³ 6,547 5.11% - -Other signatories of the Company
Shareholders Agreement4 11,915 9.30% 11,827 9.24%Others 69,859 54.50% 69,987 54.50%
128,057 100.00 % 128,057 100.00 %
1 On October 2, 2012, it became the holder of a material ownership interest according toinformation officially received by the Company and disclosed to CVM.
2 On December 2, 2014, it became the holder of a material ownership interest according to
information officially received by the Company and disclosed to CVM. On January 27, 2015, it became the holder of a material ownership interest according to information officially received by the Company and disclosed to CVM.
8/20/2019 2Q15 Quarterly Financial Reports
http://slidepdf.com/reader/full/2q15-quarterly-financial-reports 37/53
Mills Estruturas e Serviços de Engenharia S.A.
36
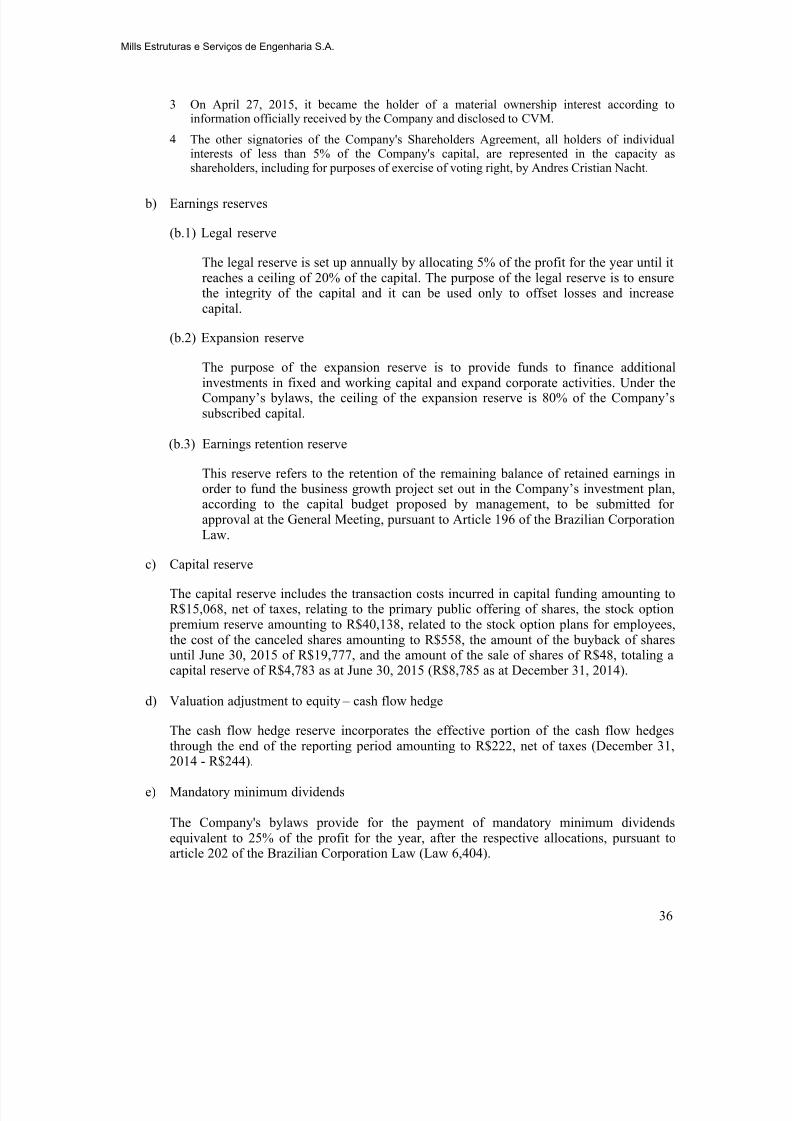
3 On April 27, 2015, it became the holder of a material ownership interest according toinformation officially received by the Company and disclosed to CVM.
4 The other signatories of the Company's Shareholders Agreement, all holders of individualinterests of less than 5% of the Company's capital, are represented in the capacity as
shareholders, including for purposes of exercise of voting right, by Andres Cristian Nacht.
b) Earnings reserves
(b.1) Legal reserve
The legal reserve is set up annually by allocating 5% of the profit for the year until itreaches a ceiling of 20% of the capital. The purpose of the legal reserve is to ensurethe integrity of the capital and it can be used only to offset losses and increasecapital.
(b.2) Expansion reserve
The purpose of the expansion reserve is to provide funds to finance additionalinvestments in fixed and working capital and expand corporate activities. Under theCompany’s bylaws, the ceiling of the expansion reserve is 80% of the Company’ssubscribed capital.
(b.3) Earnings retention reserve
This reserve refers to the retention of the remaining balance of retained earnings inorder to fund the business growth project set out in the Company’s investment plan,
according to the capital budget proposed by management, to be submitted forapproval at the General Meeting, pursuant to Article 196 of the Brazilian CorporationLaw.
c) Capital reserve
The capital reserve includes the transaction costs incurred in capital funding amounting toR$15,068, net of taxes, relating to the primary public offering of shares, the stock option
premium reserve amounting to R$40,138, related to the stock option plans for employees,the cost of the canceled shares amounting to R$558, the amount of the buyback of sharesuntil June 30, 2015 of R$19,777, and the amount of the sale of shares of R$48, totaling acapital reserve of R$4,783 as at June 30, 2015 (R$8,785 as at December 31, 2014).
d) Valuation adjustment to equity – cash flow hedge
The cash flow hedge reserve incorporates the effective portion of the cash flow hedgesthrough the end of the reporting period amounting to R$222, net of taxes (December 31,2014 - R$244).
e) Mandatory minimum dividends
The Company's bylaws provide for the payment of mandatory minimum dividendsequivalent to 25% of the profit for the year, after the respective allocations, pursuant to
article 202 of the Brazilian Corporation Law (Law 6,404).
8/20/2019 2Q15 Quarterly Financial Reports
http://slidepdf.com/reader/full/2q15-quarterly-financial-reports 38/53
Mills Estruturas e Serviços de Engenharia S.A.
37
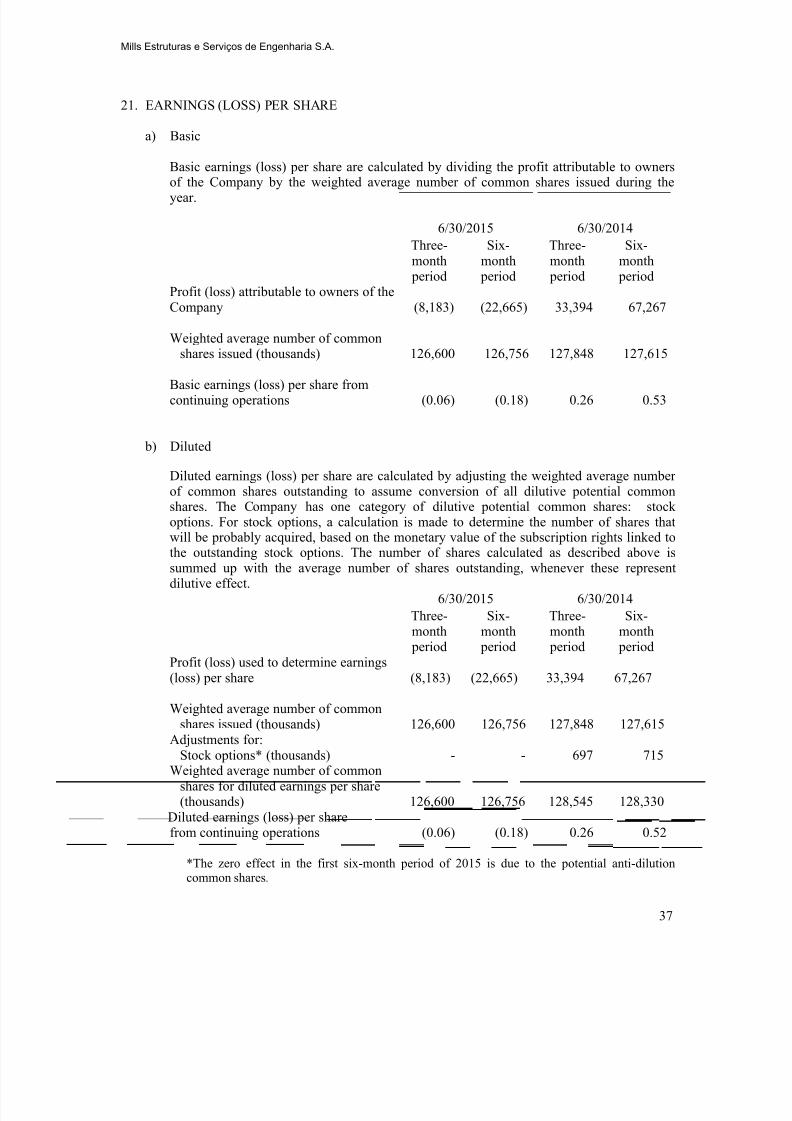
21. EARNINGS (LOSS) PER SHARE
a) Basic
Basic earnings (loss) per share are calculated by dividing the profit attributable to ownersof the Company by the weighted average number of common shares issued during theyear.
6/30/2015 6/30/2014
Three-month period
Six-month
period
Three-month period
Six-month
periodProfit (loss) attributable to owners of theCompany (8,183) (22,665) 33,394 67,267
Weighted average number of commonshares issued (thousands) 126,600 126,756 127,848 127,615
Basic earnings (loss) per share fromcontinuing operations (0.06) (0.18) 0.26 0.53
b) Diluted
Diluted earnings (loss) per share are calculated by adjusting the weighted average numberof common shares outstanding to assume conversion of all dilutive potential common
shares. The Company has one category of dilutive potential common shares: stockoptions. For stock options, a calculation is made to determine the number of shares thatwill be probably acquired, based on the monetary value of the subscription rights linked tothe outstanding stock options. The number of shares calculated as described above issummed up with the average number of shares outstanding, whenever these representdilutive effect.
6/30/2015 6/30/2014
Three-month period
Six-month
period
Three-month period
Six-month
periodProfit (loss) used to determine earnings
(loss) per share (8,183) (22,665) 33,394 67,267
Weighted average number of commonshares issued (thousands) 126,600 126,756 127,848 127,615
Adjustments for:Stock options* (thousands) - - 697 715
Weighted average number of commonshares for diluted earnings per share(thousands) 126,600 126,756 128,545 128,330
Diluted earnings (loss) per sharefrom continuing operations (0.06) (0.18) 0.26 0.52
*The zero effect in the first six-month period of 2015 is due to the potential anti-dilutioncommon shares.
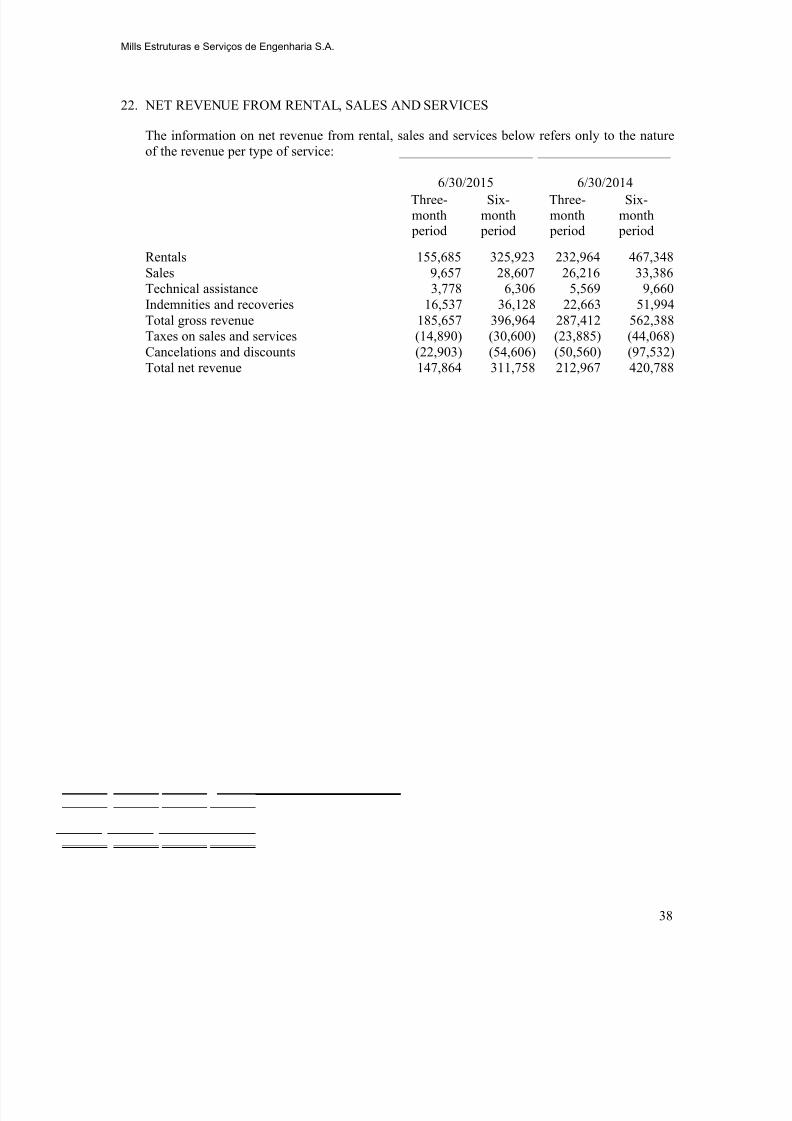
8/20/2019 2Q15 Quarterly Financial Reports
http://slidepdf.com/reader/full/2q15-quarterly-financial-reports 39/53
Mills Estruturas e Serviços de Engenharia S.A.
38
22. NET REVENUE FROM RENTAL, SALES AND SERVICES
The information on net revenue from rental, sales and services below refers only to the natureof the revenue per type of service:
6/30/2015 6/30/2014
Three-month period
Six-month
period
Three-month period
Six-month
period
Rentals 155,685 325,923 232,964 467,348Sales 9,657 28,607 26,216 33,386Technical assistance 3,778 6,306 5,569 9,660Indemnities and recoveries 16,537 36,128 22,663 51,994Total gross revenue 185,657 396,964 287,412 562,388
Taxes on sales and services (14,890) (30,600) (23,885) (44,068)Cancelations and discounts (22,903) (54,606) (50,560) (97,532)Total net revenue 147,864 311,758 212,967 420,788
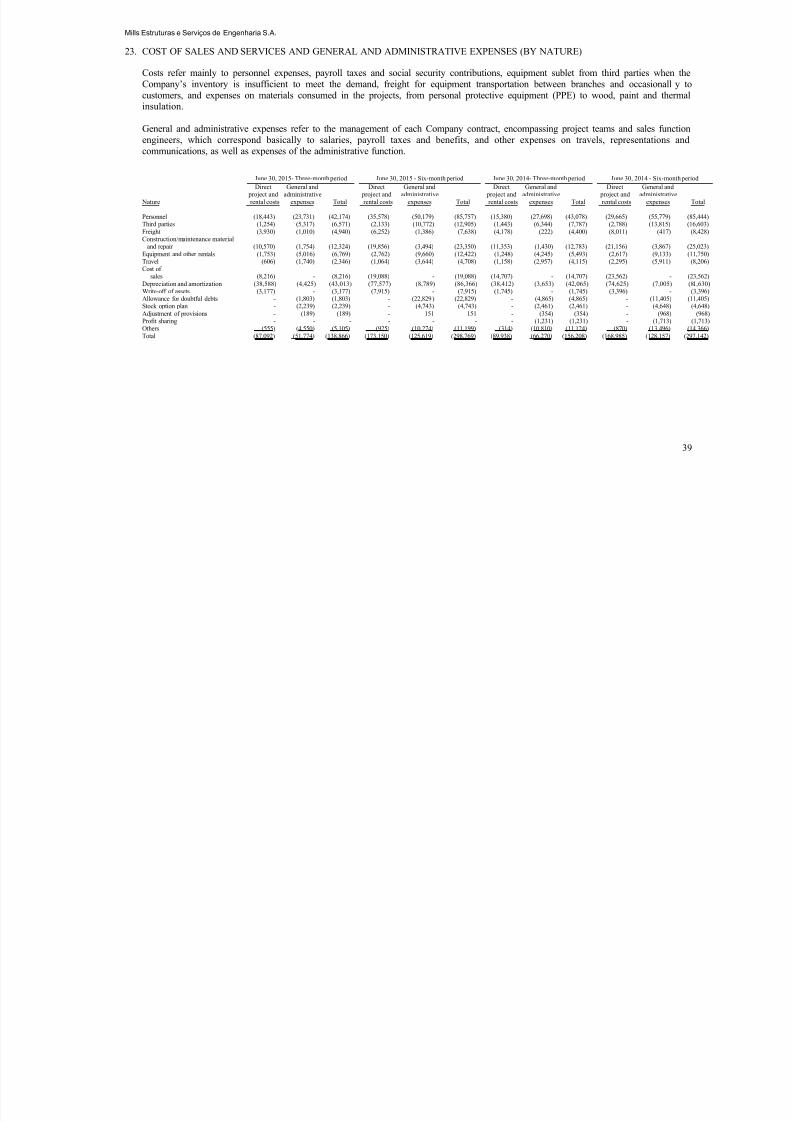
8/20/2019 2Q15 Quarterly Financial Reports
http://slidepdf.com/reader/full/2q15-quarterly-financial-reports 40/53
Mills Estruturas e Serviços de Engenharia S.A.
39
23. COST OF SALES AND SERVICES AND GENERAL AND ADMINISTRATIVE EXPENSES (BY NATURE)
Costs refer mainly to personnel expenses, payroll taxes and social security contributions, equipment sublet from third parties when theCompany’s inventory is insufficient to meet the demand, freight for equipment transportation between branches and occasionall y tocustomers, and expenses on materials consumed in the projects, from personal protective equipment (PPE) to wood, paint and thermalinsulation.
General and administrative expenses refer to the management of each Company contract, encompassing project teams and sales functionengineers, which correspond basically to salaries, payroll taxes and benefits, and other expenses on travels, representations andcommunications, as well as expenses of the administrative function.
June 30, 2015- Three-month period June 30, 2015 - Six-month period June 30, 2014- Three-month period June 30, 2014 - Six-month period
Nature
Direct project and
rental costs
General andadministrative
expenses Total
Direct project andrental costs
General andadministrative
expenses Total
Direct project andrental costs
General andadministrative
expenses Total
Direct project andrental costs
General andadministrative
expenses Total
Personnel (18,443) (23,731) (42,174) (35,578) (50,179) (85,757) (15,380) (27,698) (43,078) (29,665) (55,779) (85,444)Third parties (1,254) (5,317) (6,571) (2,133) (10,772) (12,905) (1,443) (6,344) (7,787) (2,788) (13,815) (16,603)Freight (3,930) (1,010) (4,940) (6,252) (1,386) (7,638) (4,178) (222) (4,400) (8,011) (417) (8,428)Construction/maintenance material
and repair (10,570) (1,754) (12,324) (19,856) (3,494) (23,350) (11,353) (1,430) (12,783) (21,156) (3,867) (25,023)Equipment and other rentals (1,753) (5,016) (6,769) (2,762) (9,660) (12,422) (1,248) (4,245) (5,493) (2,617) (9,133) (11,750)Travel (606) (1,740) (2,346) (1,064) (3,644) (4,708) (1,158) (2,957) (4,115) (2,295) (5,911) (8,206)Cost of
sales (8,216) - (8,216) (19,088) - (19,088) (14,707) - (14,707) (23,562) - (23,562)Depreciation and amortization (38,588) (4,425) (43,013) (77,577) (8,789) (86,366) (38,412) (3,653) (42,065) (74,625) (7,005) (81,630)Write-off of assets (3,177) - (3,177) (7,915) - (7,915) (1,745) - (1,745) (3,396) - (3,396)Allowance for doubtful debts - (1,803) (1,803) - (22,829) (22,829) - (4,865) (4,865) - (11,405) (11,405)Stock option plan - (2,239) (2,239) - (4,743) (4,743) - (2,461) (2,461) - (4,648) (4,648)Adjustment of provisions - (189) (189) - 151 151 - (354) (354) - (968) (968)Profit sharing - - - - - - - (1,231) (1,231) - (1,713) (1,713)Others (555) (4,550) (5,105) (925) (10,274) (11,199) (314) (10,810) (11,124) (870) (13,496) (14,366)
Total (87,092) (51,774) (138,866) (173,150) (125,619) (298,769) (89,938) (66,270) (156,208) (168,985) (128,157) (297,142)
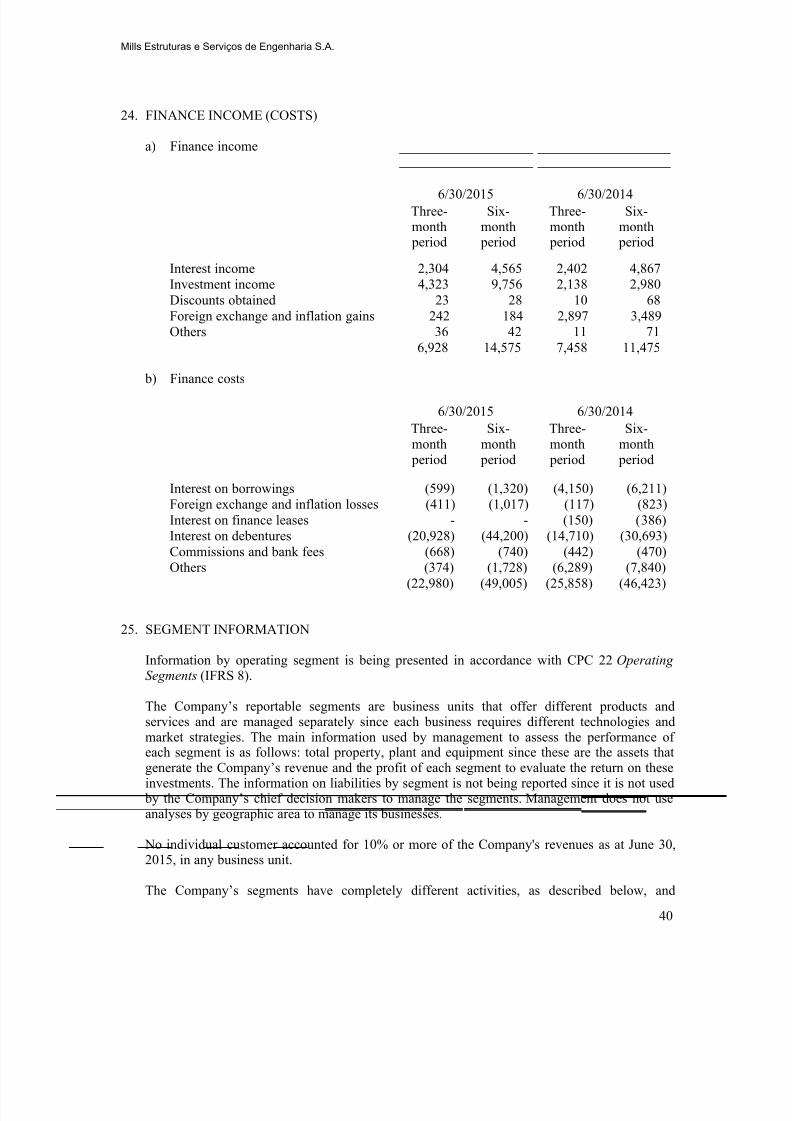
8/20/2019 2Q15 Quarterly Financial Reports
http://slidepdf.com/reader/full/2q15-quarterly-financial-reports 41/53
Mills Estruturas e Serviços de Engenharia S.A.
40
24. FINANCE INCOME (COSTS)
a) Finance income
6/30/2015 6/30/2014
Three-month period
Six-month
period
Three-month period
Six-month
period
Interest income 2,304 4,565 2,402 4,867Investment income 4,323 9,756 2,138 2,980Discounts obtained 23 28 10 68Foreign exchange and inflation gains 242 184 2,897 3,489Others 36 42 11 71
6,928 14,575 7,458 11,475
b) Finance costs
6/30/2015 6/30/2014
Three-month period
Six-month
period
Three-month period
Six-month
period
Interest on borrowings (599) (1,320) (4,150) (6,211)
Foreign exchange and inflation losses (411) (1,017) (117) (823)Interest on finance leases - - (150) (386)Interest on debentures (20,928) (44,200) (14,710) (30,693)Commissions and bank fees (668) (740) (442) (470)Others (374) (1,728) (6,289) (7,840)
(22,980) (49,005) (25,858) (46,423)
25. SEGMENT INFORMATION
Information by operating segment is being presented in accordance with CPC 22 Operating
Segments (IFRS 8).
The Company’s reportable segments are business units that offer different products andservices and are managed separately since each business requires different technologies andmarket strategies. The main information used by management to assess the performance ofeach segment is as follows: total property, plant and equipment since these are the assets thatgenerate the Company’s revenue and the profit of each segment to evaluate the return on theseinvestments. The information on liabilities by segment is not being reported since it is not used
by the Company’s chief decision makers to manage the segments. Management does not useanalyses by geographic area to manage its businesses.
No individual customer accounted for 10% or more of the Company's revenues as at June 30,2015, in any business unit.
The Company’s segments have completely different activities, as described below, and

8/20/2019 2Q15 Quarterly Financial Reports
http://slidepdf.com/reader/full/2q15-quarterly-financial-reports 42/53
Mills Estruturas e Serviços de Engenharia S.A.
41
therefore their assets are specific for each segment. The assets were allocated to each reportablesegment according to the nature of each item.Heavy Construction business unit
The Heavy Construction business unit operates in the heavy construction market, using cuttingedge technology in formworks, props, and special equipment systems to perform constructionworks. This business unit is present in several states and draws on a team of engineers andspecialized technicians who play advisory and support role to meet deadline and optimize costsand safety.
Real Estate business unit
The Real Estate business unit provides formworks, props, nonmechanized access equipment,mast climbing platforms, and scaffolds for the residential and office building constructionsector. It has the largest product and service portfolio, with customized solutions that meet the
specific needs of each project and generate efficiency and cut costs. With presence in severalstates, the Real Estate business unit has teams qualified to provide technical assistance and help planning works, detail projects, and oversee the assembly.
Rental business unit
The Rental business unit operates in the scissor lifts and telescopic handlers lease and salemarket, for height works in all sectors of the construction, trade, and manufacturing markets.The BU ensures productivity, profitability and safety, has the most advanced product line forlifting people and cargo, and offers its customers operation training certified by the IPAF(world areal access authority). Its presence in several Brazilian cities not only reinforces onlythe agility of its commercial service but it also broadens the technical assistance with certified
professionals.
The accounting policies of the operating segments are the same as those described in thesummary of significant accounting policies. The Company assesses the performance bysegment based on pretax profit or loss as well as on other operating and financial indicators.
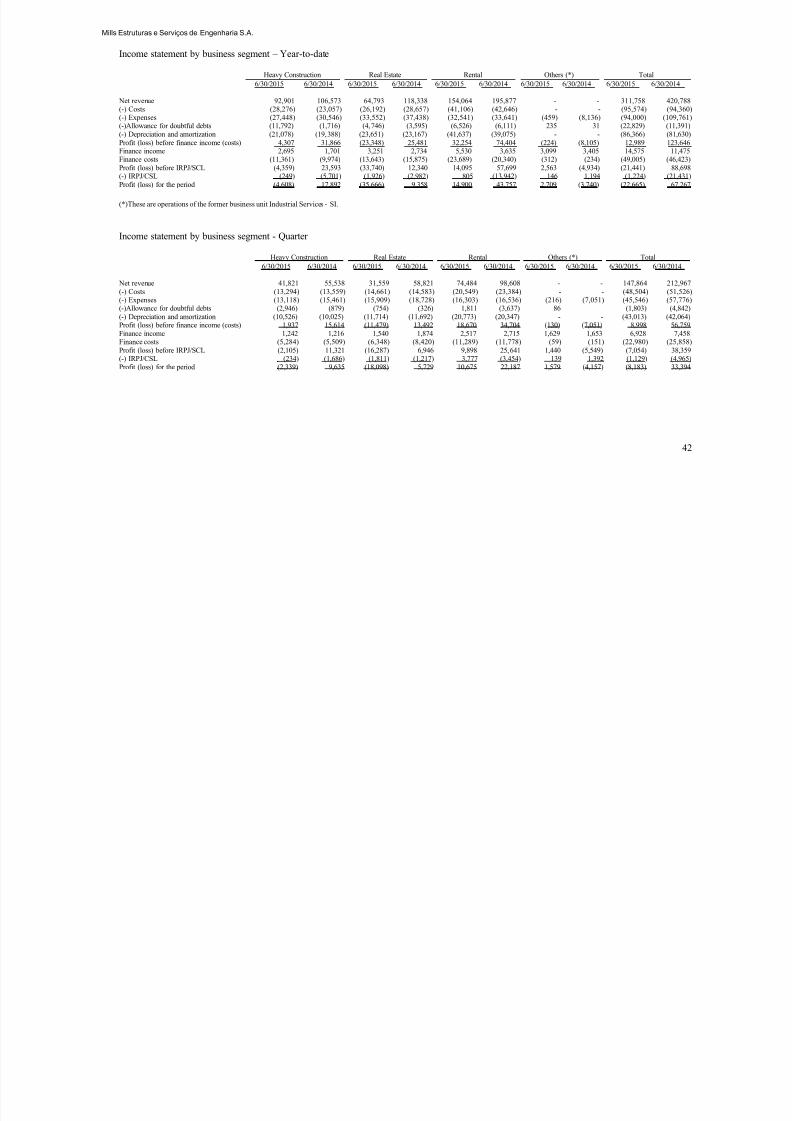
8/20/2019 2Q15 Quarterly Financial Reports
http://slidepdf.com/reader/full/2q15-quarterly-financial-reports 43/53
Mills Estruturas e Serviços de Engenharia S.A.
42
Income statement by business segment – Year-to-date
Heavy Construction Real Estate Rental Others (*) Total
6/30/2015 6/30/2014 6/30/2015 6/30/2014 6/30/2015 6/30/2014 6/30/2015 6/30/2014 6/30/2015 6/30/2014
Net revenue 92,901 106,573 64,793 118,338 154,064 195,877 - - 311,758 420,788(-) Costs (28,276) (23,057) (26,192) (28,657) (41,106) (42,646) - - (95,574) (94,360)(-) Expenses (27,448) (30,546) (33,552) (37,438) (32,541) (33,641) (459) (8,136) (94,000) (109,761)(-)Allowance for doubtful debts (11,792) (1,716) (4,746) (3,595) (6,526) (6,111) 235 31 (22,829) (11,391)(-) Depreciation and amortization (21,078) (19,388) (23,651) (23,167) (41,637) (39,075) - - (86,366) (81,630)Profit (loss) before finance income (costs) 4,307 31,866 (23,348) 25,481 32,254 74,404 (224) (8,105) 12,989 123,646Finance income 2,695 1,701 3,251 2,734 5,530 3,635 3,099 3,405 14,575 11,475Finance costs (11,361) (9,974) (13,643) (15,875) (23,689) (20,340) (312) (234) (49,005) (46,423)
Profit (loss) before IRPJ/SCL (4,359) 23,593 (33,740) 12,340 14,095 57,699 2,563 (4,934) (21,441) 88,698(-) IRPJ/CSL (249) (5,701) (1,926) (2,982) 805 (13,942) 146 1,194 (1,224) (21,431)Profit (loss) for the period (4,608) 17,892 (35,666) 9,358 14,900 43,757 2,709 (3,740) (22,665) 67,267
(*)These are operations of the former business unit Industrial Services - SI.
Income statement by business segment - Quarter
Heavy Construction Real Estate Rental Others (*) Total
6/30/2015 6/30/2014 6/30/2015 6/30/2014 6/30/2015 6/30/2014 6/30/2015 6/30/2014 6/30/2015 6/30/2014
Net revenue 41,821 55,538 31,559 58,821 74,484 98,608 - - 147,864 212,967(-) Costs (13,294) (13,559) (14,661) (14,583) (20,549) (23,384) - - (48,504) (51,526)(-) Expenses (13,118) (15,461) (15,909) (18,728) (16,303) (16,536) (216) (7,051) (45,546) (57,776)(-)Allowance for doubtful debts (2,946) (879) (754) (326) 1,811 (3,637) 86 (1,803) (4,842)(-) Depreciation and amortization (10,526) (10,025) (11,714) (11,692) (20,773) (20,347) - - (43,013) (42,064)Profit (loss) before finance income (costs) 1,937 15,614 (11,479) 13,492 18,670 34,704 (130) (7,051) 8,998 56,759Finance income 1,242 1,216 1,540 1,874 2,517 2,715 1,629 1,653 6,928 7,458Finance costs (5,284) (5,509) (6,348) (8,420) (11,289) (11,778) (59) (151) (22,980) (25,858)Profit (loss) before IRPJ/SCL (2,105) 11,321 (16,287) 6,946 9,898 25,641 1,440 (5,549) (7,054) 38,359(-) IRPJ/CSL (234) (1,686) (1,811) (1,217) 3,777 (3,454) 139 1,392 (1,129) (4,965)Profit (loss) for the period (2,339) 9,635 (18,098) 5,729 10,675 22,187 1,579 (4,157) (8,183) 33,394
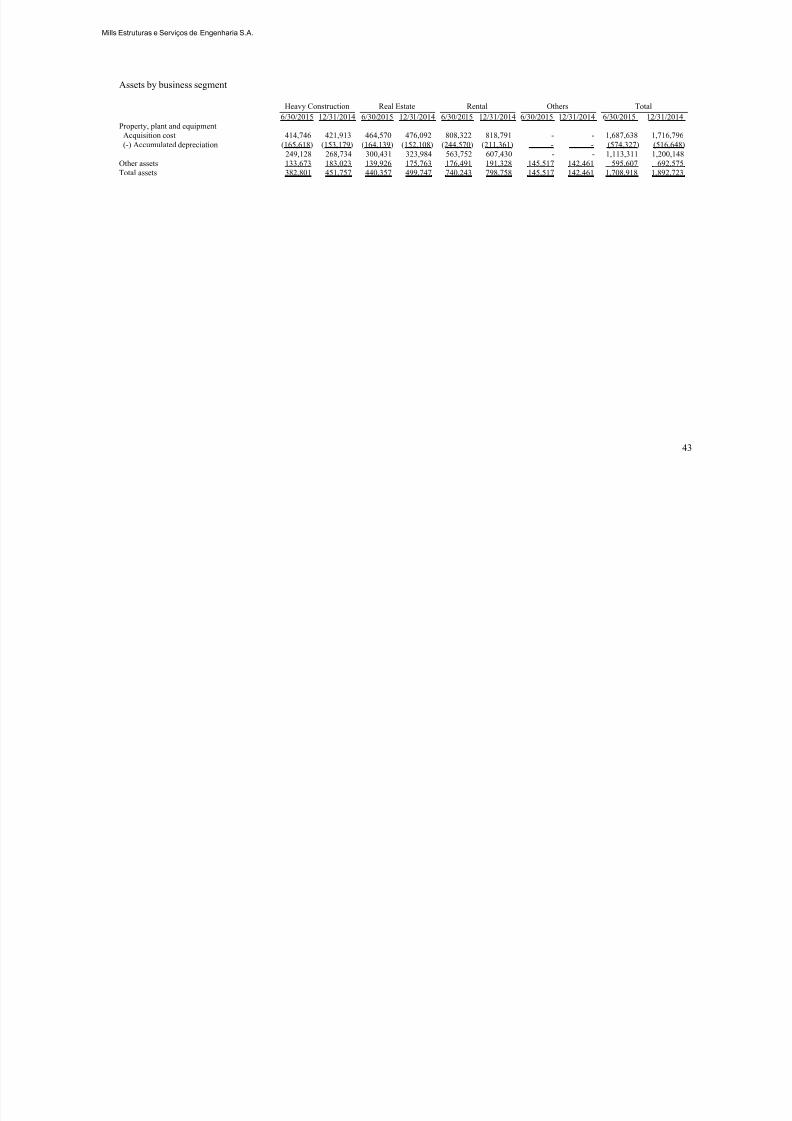
8/20/2019 2Q15 Quarterly Financial Reports
http://slidepdf.com/reader/full/2q15-quarterly-financial-reports 44/53
Mills Estruturas e Serviços de Engenharia S.A.
43
Assets by business segment
Heavy Construction Real Estate Rental Others Total
6/30/2015 12/31/2014 6/30/2015 12/31/2014 6/30/2015 12/31/2014 6/30/2015 12/31/2014 6/30/2015 12/31/2014Property, plant and equipment
Acquisition cost 414,746 421,913 464,570 476,092 808,322 818,791 - - 1,687,638 1,716,796(-) Accumulated depreciation (165,618) (153,179) (164,139) (152,108) (244,570) (211,361) - - (574,327) (516,648)
249,128 268,734 300,431 323,984 563,752 607,430 - - 1,113,311 1,200,148Other assets 133,673 183,023 139,926 175,763 176,491 191,328 145,517 142,461 595,607 692,575Total assets 382,801 451,757 440,357 499,747 740,243 798,758 145,517 142,461 1,708,918 1,892,723
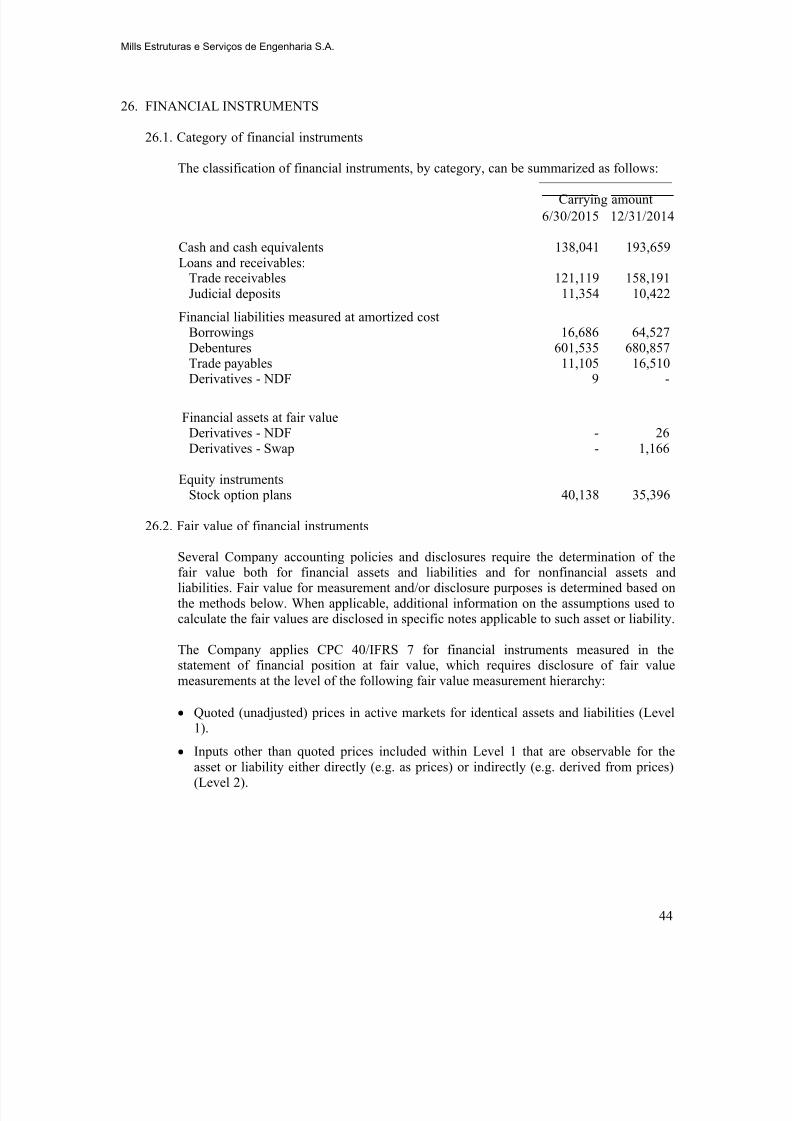
8/20/2019 2Q15 Quarterly Financial Reports
http://slidepdf.com/reader/full/2q15-quarterly-financial-reports 45/53
Mills Estruturas e Serviços de Engenharia S.A.
44
26. FINANCIAL INSTRUMENTS
26.1. Category of financial instruments
The classification of financial instruments, by category, can be summarized as follows:
Carrying amount
6/30/2015 12/31/2014
Cash and cash equivalents 138,041 193,659Loans and receivables:
Trade receivables 121,119 158,191Judicial deposits 11,354 10,422
Financial liabilities measured at amortized costBorrowings 16,686 64,527Debentures 601,535 680,857Trade payables 11,105 16,510Derivatives - NDF 9 -
Financial assets at fair valueDerivatives - NDF - 26Derivatives - Swap - 1,166
Equity instrumentsStock option plans 40,138 35,396
26.2. Fair value of financial instruments
Several Company accounting policies and disclosures require the determination of thefair value both for financial assets and liabilities and for nonfinancial assets andliabilities. Fair value for measurement and/or disclosure purposes is determined based onthe methods below. When applicable, additional information on the assumptions used tocalculate the fair values are disclosed in specific notes applicable to such asset or liability.
The Company applies CPC 40/IFRS 7 for financial instruments measured in thestatement of financial position at fair value, which requires disclosure of fair value
measurements at the level of the following fair value measurement hierarchy:
Quoted (unadjusted) prices in active markets for identical assets and liabilities (Level1).
Inputs other than quoted prices included within Level 1 that are observable for theasset or liability either directly (e.g. as prices) or indirectly (e.g. derived from prices)(Level 2).
8/20/2019 2Q15 Quarterly Financial Reports
http://slidepdf.com/reader/full/2q15-quarterly-financial-reports 46/53
Mills Estruturas e Serviços de Engenharia S.A.
45
The Company does not have financial instruments measured at fair value that areclassified as Level 3, i.e., obtained based on valuation techniques that include variablesfor the asset or liability, but which are not based on observable market inputs.
The table below shows the Company’s assets and liabilities measured at their fair valuesas at June 30, 2015.
Level 2 balances
6/30/2015 12/31/2014AssetsDerivatives used for hedging - 26Derivatives used for borrowings - 1,166Total assets - 1,192
Level 2 balances
6/30/2015 12/31/2014LiabilitiesDerivatives used for hedging 9 -Total liabilities 9 -
(a) Fair value
Cash and cash equivalents refer to short-term investments with first-tier financialinstitutions and are indexed to the variation of the Interbank Deposit Certificates(CDI). Considering that the CDI rate already reflects the interbank market position,
it is assumed that the carrying amounts of the investments approximate their fairvalues.
(b) Fair value of trade receivables and payables
The fair value of trade and other receivables is estimated as the present value offuture cash flows, discounted at the market interest rate determined at the end of thereporting period.
The fair values of trade receivables and trade payables, considering for calculationthe discounted cash flow method, are substantially similar to their carrying
amounts.
(c) Fair value of borrowings
The fair value, which is determined for disclosure purposes, is calculated based onthe present value of the principal and future cash flows, discounted at the marketinterest rate determined at the end of the reporting period. For finance leases, theinterest rate is determined by reference to similar lease agreements.
The fair value of borrowings from BNDES was not calculated since this type of borrowing does not have observable fair value calculation since BNDES adoptsdifferent rates for borrowers.
8/20/2019 2Q15 Quarterly Financial Reports
http://slidepdf.com/reader/full/2q15-quarterly-financial-reports 47/53
Mills Estruturas e Serviços de Engenharia S.A.
46
Borrowings
Fair value Carrying amount
Debt Indicator 6/30/2015 12/31/2014 6/30/2015 12/31/2014
Working capital CDI - 43,030 - 45,8601st issue of debentures CDI 87,727 185,839 92,429 184,4122nd issue of debentures
1st series CDI 148,101 167,397 168,581 168,1212ndt series IPCA 134,060 122,726 140,248 128,747
3rd issue of debentures CDI 173,519 208,291 202,208 201,984
(d) Fair value of stock options
The fair values of employee stock options and rights to share appreciation aremeasured using the Black-Scholes model. Changes in measurement include share
prices at measurement date, the strike price of the related instrument, the expectedvolatility (based on the historical weighted average volatility adjusted for expectedchanges based on publicly available information), the average weighted life of theinstruments (based on historical experience and the overall behavior of optionholders), expected dividends and risk-free interest rate (based on government
bonds). Nonmarket service conditions and performance conditions inherent to thetransactions are not taken into account in determining the fair value.
(e) Derivatives
The fair value of currency forward contracts is calculated at present value, usingmarket rates that are accrued at each measurement date.
The fair value of interest rate swap contracts is based on quotations obtained from brokers. These quotations are tested as to their reasonableness by discounting theestimated future cash flows based on the terms and maturity of each contract andusing market interest rates for a similar instrument calculated at the measurementdate. The fair values reflect the credit risk of the instrument and includeadjustments to consider the credit risk of the entity and counterparty, where
appropriate.
26.3. Derivative financial instruments
(a) Derivative policy
In order to protect its equity against the exposure to commitments assumeddenominated in foreign currency, the Company developed a strategy to mitigatesuch market risk. The strategy, when applied, is carried out to reduce the volatilityof the cash flow to the desirable level, i.e., to maintain the planned disbursements.
Mills believes that the management of such risks is key to supporting its growthstrategy without potential financial losses that can reduce its operating profits sincethe Company does not aim at obtaining financial gains through the use ofderivatives. Foreign currency risks are managed by the Finance Manager and the
8/20/2019 2Q15 Quarterly Financial Reports
http://slidepdf.com/reader/full/2q15-quarterly-financial-reports 48/53
Mills Estruturas e Serviços de Engenharia S.A.
47
CFO, who evaluate possible exposures to risks and set guidelines to measure,monitor and manage the risk related to the Company’s activities.
Based on this objective, the Company enters into derivative transactions, usually
NDFs (Nondeliverable Forwards) with first-tier financial institutions (with creditratings brAAA - national scale, Standard & Poor’s or similar), in order to guaranteethe trading value agreed when ordering the goods to be imported. Similarly, swapor NDF contracts are entered into to guarantee the flow of payments (amortizationof principal and interest) for foreign currency borrowings. Pursuant to theCompany’s bylaws, any contract or obligation assumed which exceed R$10,000(ten million reais) must be approved by the Board of Directors, unless provided forotherwise in the Business Plan. For amounts below R$100 (one hundred thousandreais) for periods of less than 90 days, it is not necessary to enter into hedgetransactions. Other commitments should be hedged against foreign exchangeexposure.
Swap and NDF transactions are carried out to convert into reais future financialcommitments in foreign currency. When these transactions are entered into, theCompany mitigates the foreign exchange risk by matching the commitment amountand the exposure period. The derivative cost is pegged to the interest rate, usually a
percentage of the CDI rate. The swap and NDF transactions with maturities shorteror longer than the final maturity of the commitments can, over time, be renegotiatedso that their final maturities match or approximate the final maturity of thecommitment. Therefore, at the settlement date, the gain or loss on the swap or NDFcan offset part of the impact of the foreign currency fluctuation in relation to thereal, contributing to stabilize the cash flow.
As these transactions involve derivatives, the calculation of the monthly position ismade using the fair value methodology and they are valued by calculating their
present value using market rates that are impacted at the dates of each calculation.This methodology, widely used, can present monthly distortions in relation to thecontracted derivative curve; however, the Company believes that this is the bestmethodology to be applied since it measures the financial risk should an earlysettlement of the derivative be required.
The monitoring the commitments assumed and the monthly fair value measurementof the derivatives permits to follow up on the financial results and the impact on thecash flow, as well as to ensure that the planned objectives are achieved. Thecalculation of the fair value of positions is made available on a monthly basis formanagement monitoring purposes.
The derivative transactions entered into by the Company for certain equipmentimports are intended to hedge against the risk of exchange rate fluctuations duringthe period between the time an order is placed and the time the equipment isdelivered in Brazil and are not used for speculative purposes.
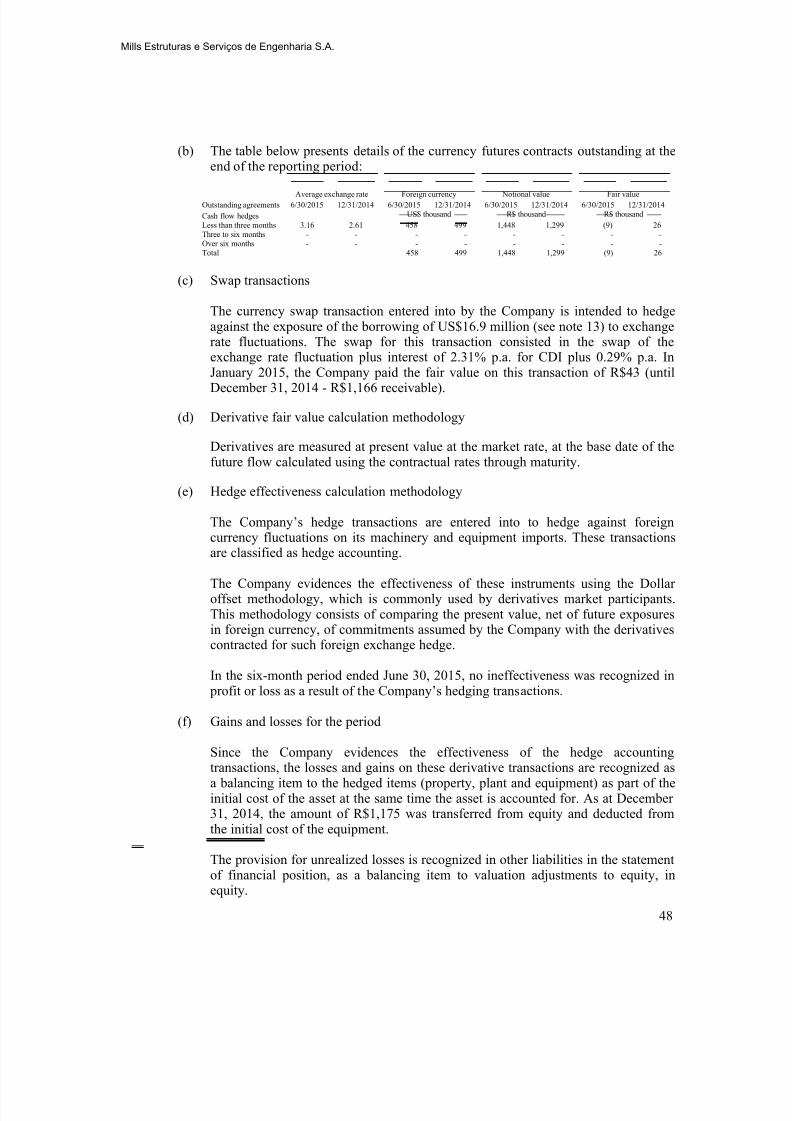
8/20/2019 2Q15 Quarterly Financial Reports
http://slidepdf.com/reader/full/2q15-quarterly-financial-reports 49/53
Mills Estruturas e Serviços de Engenharia S.A.
48
(b) The table below presents details of the currency futures contracts outstanding at the
end of the reporting period:
Average exchange rate Foreign currency Notional value Fair value
Outstanding agreements 6/30/2015 12/31/2014 6/30/2015 12/31/2014 6/30/2015 12/31/2014 6/30/2015 12/31/2014
Cash flow hedges US$ thousand R$ thousand R$ thousand
Less than three months 3.16 2.61 458 499 1,448 1,299 (9) 26Three to six months - - - - - - - -Over six months - - - - - - - -Total 458 499 1,448 1,299 (9) 26
(c) Swap transactions
The currency swap transaction entered into by the Company is intended to hedgeagainst the exposure of the borrowing of US$16.9 million (see note 13) to exchange
rate fluctuations. The swap for this transaction consisted in the swap of theexchange rate fluctuation plus interest of 2.31% p.a. for CDI plus 0.29% p.a. InJanuary 2015, the Company paid the fair value on this transaction of R$43 (untilDecember 31, 2014 - R$1,166 receivable).
(d) Derivative fair value calculation methodology
Derivatives are measured at present value at the market rate, at the base date of thefuture flow calculated using the contractual rates through maturity.
(e) Hedge effectiveness calculation methodology
The Company’s hedge transactions are entered into to hedge against foreigncurrency fluctuations on its machinery and equipment imports. These transactionsare classified as hedge accounting.
The Company evidences the effectiveness of these instruments using the Dollaroffset methodology, which is commonly used by derivatives market participants.This methodology consists of comparing the present value, net of future exposuresin foreign currency, of commitments assumed by the Company with the derivativescontracted for such foreign exchange hedge.
In the six-month period ended June 30, 2015, no ineffectiveness was recognized in profit or loss as a result of the Company’s hedging transactions.
(f) Gains and losses for the period
Since the Company evidences the effectiveness of the hedge accountingtransactions, the losses and gains on these derivative transactions are recognized asa balancing item to the hedged items (property, plant and equipment) as part of theinitial cost of the asset at the same time the asset is accounted for. As at December31, 2014, the amount of R$1,175 was transferred from equity and deducted fromthe initial cost of the equipment.
The provision for unrealized losses is recognized in other liabilities in the statementof financial position, as a balancing item to valuation adjustments to equity, inequity.
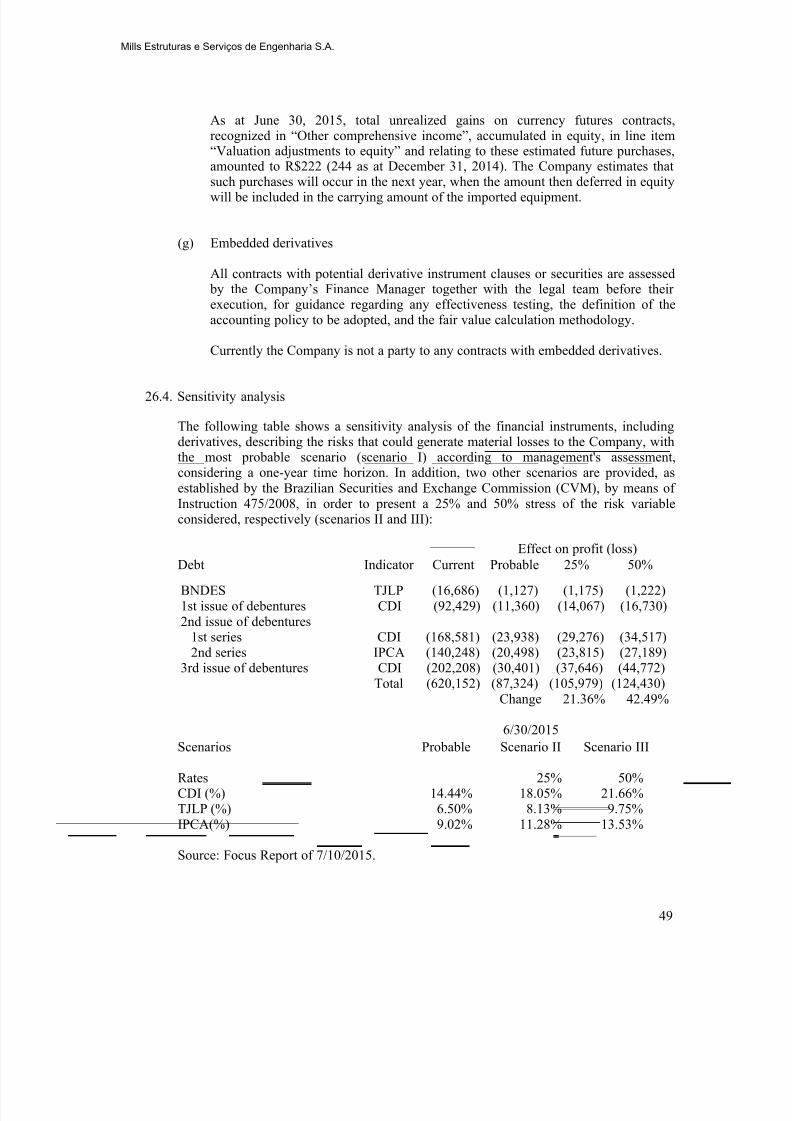
8/20/2019 2Q15 Quarterly Financial Reports
http://slidepdf.com/reader/full/2q15-quarterly-financial-reports 50/53
Mills Estruturas e Serviços de Engenharia S.A.
49
As at June 30, 2015, total unrealized gains on currency futures contracts,recognized in “Other comprehensive income”, accumulated in equity, in line item“Valuation adjustments to equity” and relating to these estimated future purchases,
amounted to R$222 (244 as at December 31, 2014). The Company estimates thatsuch purchases will occur in the next year, when the amount then deferred in equitywill be included in the carrying amount of the imported equipment.
(g) Embedded derivatives
All contracts with potential derivative instrument clauses or securities are assessed by the Company’s Finance Manager together with the legal team before theirexecution, for guidance regarding any effectiveness testing, the definition of theaccounting policy to be adopted, and the fair value calculation methodology.
Currently the Company is not a party to any contracts with embedded derivatives.
26.4. Sensitivity analysis
The following table shows a sensitivity analysis of the financial instruments, includingderivatives, describing the risks that could generate material losses to the Company, withthe most probable scenario (scenario I) according to management's assessment,considering a one-year time horizon. In addition, two other scenarios are provided, asestablished by the Brazilian Securities and Exchange Commission (CVM), by means of
Instruction 475/2008, in order to present a 25% and 50% stress of the risk variableconsidered, respectively (scenarios II and III):
Effect on profit (loss)Debt Indicator Current Probable 25% 50%
BNDES TJLP (16,686) (1,127) (1,175) (1,222)1st issue of debentures CDI (92,429) (11,360) (14,067) (16,730)2nd issue of debentures
1st series CDI (168,581) (23,938) (29,276) (34,517)2nd series IPCA (140,248) (20,498) (23,815) (27,189)
3rd issue of debentures CDI (202,208) (30,401) (37,646) (44,772)
Total (620,152) (87,324) (105,979) (124,430)Change 21.36% 42.49%
6/30/2015
Scenarios Probable Scenario II Scenario III
Rates 25% 50%CDI (%) 14.44% 18.05% 21.66%TJLP (%) 6.50% 8.13% 9.75%IPCA(%) 9.02% 11.28% 13.53%
Source: Focus Report of 7/10/2015.
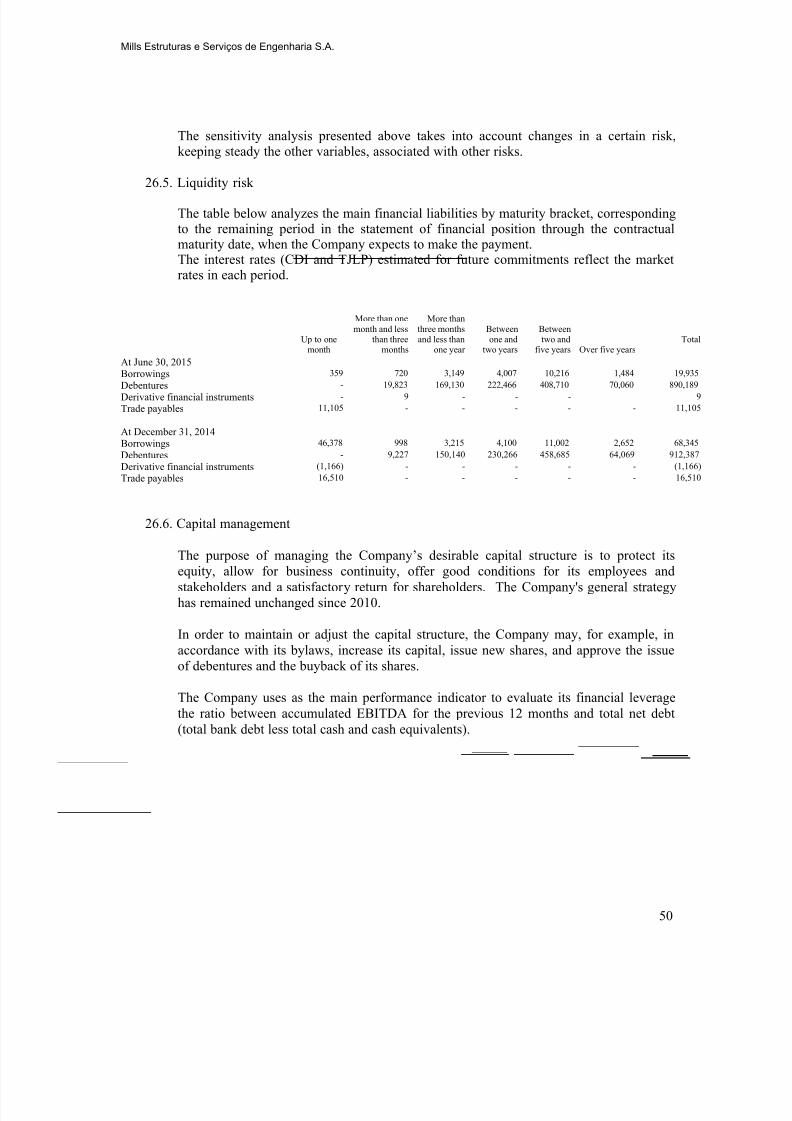
8/20/2019 2Q15 Quarterly Financial Reports
http://slidepdf.com/reader/full/2q15-quarterly-financial-reports 51/53
Mills Estruturas e Serviços de Engenharia S.A.
50
The sensitivity analysis presented above takes into account changes in a certain risk,keeping steady the other variables, associated with other risks.
26.5. Liquidity risk
The table below analyzes the main financial liabilities by maturity bracket, correspondingto the remaining period in the statement of financial position through the contractualmaturity date, when the Company expects to make the payment.The interest rates (CDI and TJLP) estimated for future commitments reflect the marketrates in each period.
Up to onemonth
More than onemonth and less
than threemonths
More thanthree months
and less thanone year
Between
one andtwo years
Between
two andfive years Over five years
Total
At June 30, 2015Borrowings 359 720 3,149 4,007 10,216 1,484 19,935
Debentures - 19,823 169,130 222,466 408,710 70,060 890,189
Derivative financial instruments - 9 - - - 9
Trade payables 11,105 - - - - - 11,105
At December 31, 2014Borrowings 46,378 998 3,215 4,100 11,002 2,652 68,345
Debentures - 9,227 150,140 230,266 458,685 64,069 912,387
Derivative financial instruments (1,166) - - - - - (1,166)
Trade payables 16,510 - - - - - 16,510
26.6. Capital management
The purpose of managing the Company’s desirable capital structure is to protect itsequity, allow for business continuity, offer good conditions for its employees andstakeholders and a satisfactory return for shareholders. The Company's general strategyhas remained unchanged since 2010.
In order to maintain or adjust the capital structure, the Company may, for example, inaccordance with its bylaws, increase its capital, issue new shares, and approve the issueof debentures and the buyback of its shares.
The Company uses as the main performance indicator to evaluate its financial leveragethe ratio between accumulated EBITDA for the previous 12 months and total net debt(total bank debt less total cash and cash equivalents).
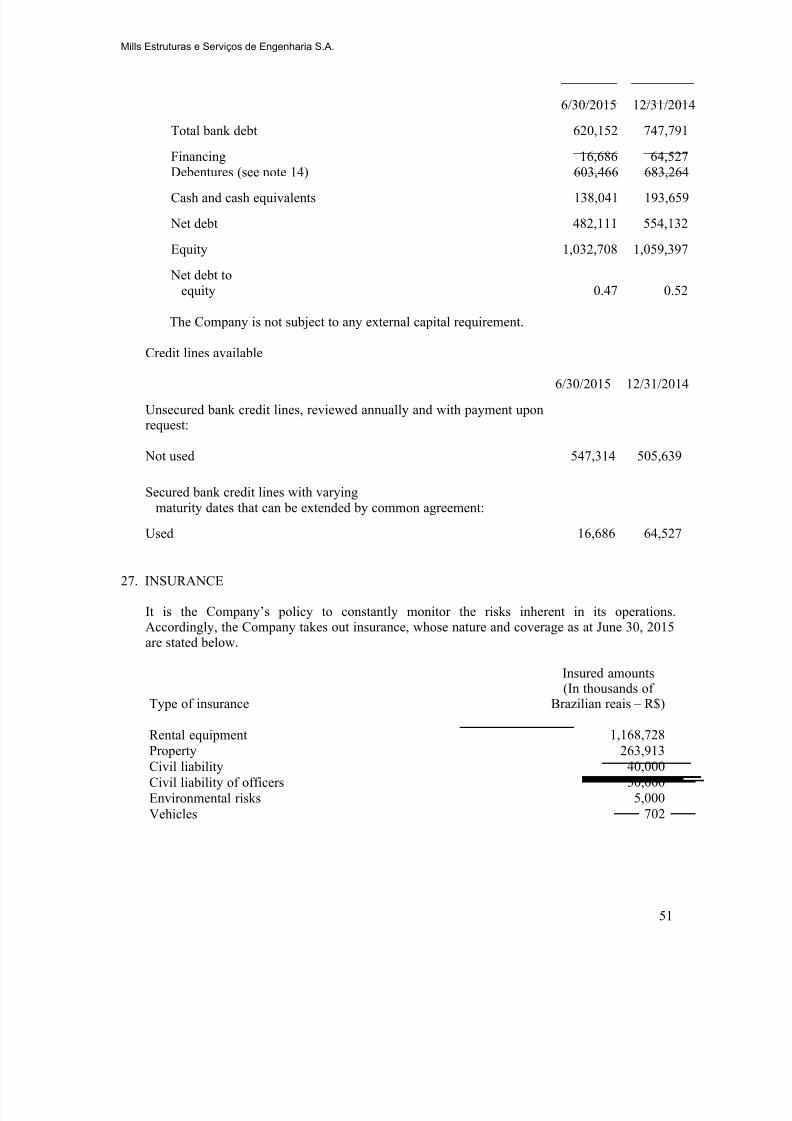
8/20/2019 2Q15 Quarterly Financial Reports
http://slidepdf.com/reader/full/2q15-quarterly-financial-reports 52/53
Mills Estruturas e Serviços de Engenharia S.A.
51
6/30/2015 12/31/2014
Total bank debt 620,152 747,791
Financing 16,686 64,527
Debentures (see note 14) 603,466 683,264
Cash and cash equivalents 138,041 193,659
Net debt 482,111 554,132
Equity 1,032,708 1,059,397
Net debt toequity 0.47 0.52
The Company is not subject to any external capital requirement.
Credit lines available
6/30/2015 12/31/2014
Unsecured bank credit lines, reviewed annually and with payment uponrequest:
Not used 547,314 505,639
Secured bank credit lines with varying
maturity dates that can be extended by common agreement:
Used 16,686 64,527
27. INSURANCE
It is the Company’s policy to constantly monitor the risks inherent in its operations. Accordingly, the Company takes out insurance, whose nature and coverage as at June 30, 2015are stated below.
Type of insurance
Insured amounts(In thousands of
Brazilian reais – R$)
Rental equipment 1,168,728Property 263,913Civil liability 40,000Civil liability of officers 50,000Environmental risks 5,000Vehicles 702
8/20/2019 2Q15 Quarterly Financial Reports
http://slidepdf.com/reader/full/2q15-quarterly-financial-reports 53/53
Mills Estruturas e Serviços de Engenharia S.A.
28. NONCASH TRANSACTIONS
Until June 30, 2015 the Company wrote off bills up to 5 years past due, totaling R$241, whichare not reflected in the statement of cash flows.
On May 29, 2015 the Company made the exchange of credit in the amount of R$4,518, withamounts payable of R $ 3,238, the same customer through the Goods Exchange PrivateInstrument and credits, and the remaining portion open of R $ 1,280 was settled in cash. Theamount of R$3,238 not reflected in the statement of cash flows.
29. EVENTS AFTER THE REPORTING PERIOD
On July 10, 2015, the Company received the fourth installment related to the sale of theIndustrial Services business unit, in the amount adjusted for inflation of R$18,575, as discussed
in Note 7.