Embed Size (px)
Citation preview

2Q16 Review & Outlook

Disclaimer
This presentation material is prepared for investors’ reference, based
on data that have not been filed with the financial supervisory
commission.
Actual business performance may not necessarily be consistent with
the projections herein, as a result of unexpected changes in the
market environment and other conditions.
The financial information in this document are consolidated earnings
results based on K-IFRS.

Total Results

4 / 12
Segment Q2 2015 Q1 2016 Q2 2016 Y-o-Y Q-o-Q
Sales 552 501 526 △4.8% 4.9%
Operating
profit 41 35 32 △22.0% △8.6%
Profit before
tax 40 23 26 △35.4% 15.0%
Net income 28 17 20 △26.5% 17.4%
◆ Sales
Y-o-Y 26.5bwn decreased(△4.8%), Q-o-Q 24.7bwn increased(4.9%)
◆ Operating Profit
Y-o-Y 9bwn decreased(△22.0%), Q-o-Q 3bwn decreased(△8.6%)
Sales & OP Income Statement (unit : bwn) (unit : bwn)
2Q ‘16 Total Results

5 / 12
(29.6%)
(21.5%)
(11.4%)
(15.7%)
(2.4%)
(11.9%)
(7.5%)
(30.5%)
(19.4%)
(14.1%)
(10.9%)
(13.6%)
(1.9%)
(9.6%)
(9.8%)
(2.0%)
(11.9%)
(11.7%)
(13.2%)
(21.2%)
(30.3%)
Breakdown by Business (unit : bwn)
◆ Headquarters
◆ Subsidiaries
* Convergence Business includes Trans SOC, Solar, Smart-Grid and EV components.
* Sales of subsidiaries are before the consolidated adjustments.
2Q ‘16 Sales Breakdown
- Electric Equipment : Volume decreased due to
economic struggle, but improved profitability by
high-end market
- Electric Infra : Weak domestic, but Iraq improved
- Automation : Continuous performance creation
from conglomerate market
- Convergence : Allowance for bad debts from solar
business worsened performance
- Wuxi : Sustainable growth from Solar PCU market
- Dalian : Volume from PJT by Korean Co. decreased
- LS Metals : Maintained in the black due to
production innovation activities

6 / 12
Segment Q2 2015 Q1 2016 Q2 2016 Y-o-Y Q-o-Q
Total Assets 2,202 2,253 2,200 △0% △2%
Current
Assets 1,320 1,409 1,356 3% △4%
Cash & cash
equivalent 310 385 330 6% △14%
Total
Liabilities 1,213 1,251 1,180 △3% △6%
Debts 682 753 686 1% △9%
Net Debts 371 369 356 △4% △4%
Equity 989 1,002 1,020 3% 2%
Finacial Statement Financial Ratios
2Q ‘16 Financial Position
◆ Total assets 2,200bwn (Y-o-Y 2bwn decreased, Q-o-Q 52.8bwn decreased)
Total liabilities 1,180bwn (Y-o-Y 32.9bwn decreased, Q-o-Q 70.8bwn decreased)
◆ Total liabilities/Equity posted 116%, and other financial ratio maintained healthy
favorable status
(unit : bwn)

Business Results & Outlook

Electric Equipment
◆ Sales Y-o-Y 3.0% decreased, Q-o-Q 4.2% increased
◆ OP Y-o-Y 3.2% increased, Q-o-Q 0.6% decreased
- Volume decreased due to economic struggle,
but improved profitability by high-end market
- Despite unfavorable demand from emerging
market, Vietnam market improved
(Sales increased 136% in Y-o-Y)
8 / 12
[ Market ]
[ LSIS ] (unit : bwn)
2Q ‘16 Results 2nd half Outlook
◆ Sales & OP trends
- Sustained favorable demand in renewable energy
market
- Volume decrease risk exists due to global
recession
- Favorable demand in Retrofit market
- Demand response in renewable energy market
(Developing large capacity DC product)
- Respond to favorable construction market in
Vietnam and international fund utilization
- Respond to favorable demand in Retrofit market

Electric Infra(T&D)
Sales Y-o-Y 6.8% decreased, Q-o-Q 14.4% increased
OP Y-o-Y, Q-o-Q turned into profit-making
- Weak domestic due to lack of backlog on the
impact of bidding restriction by disposition of
collusion
- Oversea improved from Iraq region
9 / 12
[ Market ]
[ LSIS ]
2Q ‘16 Results 2nd half Outlook
◆ Sales & OP trends (unit : bwn)
- Infra investment decreased by global recession
- Favorable demand from domestic market
- New PJT from HVDC business
- Domestic performance improve by favorable
demand
- New PJT’s from Saudi-Arabia and Equador
- HVDC revenue recognition & prepare for new
HVDC PJT
- Participate domestic FACTS(Flexible AC
Transmission) market

Automation
Sales Y-o-Y 9.9% increased, Q-o-Q 1.8% decreased
OP Y-o-Y 52.8% increased, Q-o-Q 38.9% decreased
- Continuous performance improvement from
conglomerate market
- Despite global economic struggle, SE market
improved
10 / 12
[ Market ]
[ LSIS ]
2Q ‘16 Results 2nd half Outlook
◆ Sales & OP trends (unit : bwn)
- Capex decrease by economic recession
- Smart factory market expansion by government
policy
- Strengthen direct sales activities to conglomerates
- Enhance participation in Smart factory market
(Develop Smart-station and apply pilot application
on LSIS’s factory, secure smart factory solution
according to factory size by business cooperation)
- Oversea performance improve through
Vietnam and India market

Convergence Business
Sales Y-o-Y 29.6% decreased, Q-o-Q 12.7% increased
OP Y-o-Y, Q-o-Q continuous loss
- Trans S.O.C profitability decreased by product mix
- Allowance for bad debts from Solar power business
- Won a new ESS PJT from Kepco.
11 / 12
[ Market ]
[ LSIS ]
2Q ‘16 Results 2nd half Outlook
◆ Sales & OP trends (unit : bwn)
- New policy on ESS from Korean government
(New guidance for using ESS as an emergency electric power source, Introduction private rate on ESS users, Allowed power broker business etc)
- Global Market expansion in photovoltaic market
- Find convergence business model in renewable
energy market
- Volume increase from solar power & smart-grid
business
- Implement a new ESS PJT from Kepco
- Implement a new DC distribution PJT
- Improve business performance in railway system
in oversea market

Subsidiaries
Sales Y-o-Y 3.4% increased, Q-o-Q 0.6% decreased
OP Y-o-Y 165% increased, Q-o-Q 3.9% increased
- Revenue growth from renewable energy market in
China
- LS Metals maintained in the black due to
production innovation activities
12 / 12
[ Market ]
[ LSIS ]
2Q ‘16 Results 2nd half Outlook
◆ Sales & OP trends (unit : bwn)
- Extension of competition with global players
in Chinese renewable energy market
- Energy infra PJT profitability decreased due to
oil price drop
- Development enlargement in large capacity
product for renewable energy market
- Maintain performance improvement in Wuxi
- LS Metals expects turn around yearly

Appendix 1/14
Appendix 1-1) Income Statement
(unit : bwn)
Segment '15.2Q '16.1Q '16.2Q QoQ YoY
Sales 552 501 526 4.9% △4.8%
Costs of Sales △442 △399 △415 4.0% △6.0%
Gross Profit 110 101 110 8.8% 0.1%
(%) (20.0%) (20.2%) (21.0%) - -
SG&A △69 △67 △78 17.7% 13.1%
Operating Profit 41 35 32 △8.6% △22.0%
(%) (7.4%) (7.0%) (6.1%) - -
Non-OP and Loss △0 △12 △6 △52.5% 1,350.0%
Profit befroe tax 40 23 26 15.0% △35.4%
Net Income 28 17 20 17.4% △26.5%
(%) (5.0%) (3.4%) (3.8%) - -
EBITDA Margin 12.3% 10.0% 10.1% - -

Appendix 2/14
Appendix 1-2) Statement of Financial position
(unit : bwn)
'15.2Q '16.1Q '16.2Q QoQ YoY
Total Assets 2,202 2,253 2,200 △2% △0%
Current Assets 1,320 1,409 1,356 △4% 3%
Cash&Cash Equivalents 310 384 330 △14% 6%
Inventories 169 170 166 △2% △2%
Other Current Assets 841 855 860 1% 2%
Non-Current Assets 882 844 844 △0% △4%
Tangible Assets 668 630 624 △1% △6%
Intangible Assets 140 136 132 △2% △5%
Other Non-Current Assets 74 78 87 11% 17%
Total Liabilities 1,213 1,251 1,180 △6% △3%
Current Liabilities 577 660 669 1% 16%
Short-term borrowings 100 202 218 8% 118%
Non-Current Liabilities 636 591 511 △13% △20%
Long-term borrowings 582 552 468 △15% △20%
Equity 989 1,002 1,020 2% 3%
Current Ratio 229% 213% 203% △11%p △26%p
Equity/Total Assets 45% 44% 46% 2%p 1%p
Total Liabilities/Equity 123% 125% 116% △9%p △7%p
Net debts Ratio 38% 37% 35% △2%p △3%p
Segment

Appendix 3/14
Appendix 1-3) Statements of Cash Flows
(unit : bwn)
'15.2Q '16.2Q YoY
332 286 △46
138 195 56
△47 △67 △20
Capex △44 △25 20
R&D △7 △6 1
Others 5 △36 △41
△114 △84 30
0 △0 △1
310 330 19
Cash Flows From
Financing Activities
Cash and cash equivalents
at the end of 1st half
Cash Flows From
Operating Activities
Effect of exchange rate changes on
cash and cash equivalents
Cash Flows From
Investing Activities
Cash and cash equivalents
at the beginning of year
Segment

Growing into a World’s Best from the Nation’s First!
Leading company in the industrial electric, electronics, materials and energy field
following its separation from LG in 2003
LS History
LS is a faithful and reliable business partner
Collaboration with LS people leads to greater success
Appendix 2) LSIS Company Introduction 1) LS Group
Management Philosophy
Appendix 4/14

Appendix 2) LSIS Company Introduction
Leader in Power Solutions, Automation & Green Business
Founded 1974
12,777
(As of 2015)
The Leading Company in the Power Distribution & Automation Industry
The first to build a Smart Grid, Green Village and Green Factory
Overseas branches
3,500
China, Vietnam, Japan, etc.
USA, Europe, Russia, Vietnam, etc.
Sales
Employees
Headquarters
Plants
Overseas subsidiaries
2,202billion(KRW)
LS Tower, Gyeonggi-do, Korea
Total 7 Plants
2) LSIS
Appendix 5/14

Appendix 2) LSIS Company Introduction 3) History
1. A History of Challenging the Future (1970’s ~ 2007)
2000 Sep. Established high-voltage testing agency
‘87 Mar. Established Goldstar Industrial Systems Co., Ltd. 1980’s
’74 Jul. Established Goldstar Instrument & Electrical Co., Ltd 1970’s
1990’s
Nov. Disaffiliated from LG Group, joined LS Group 2003
2001 Jun. Constructed Dalian factory
2005 Mar. Renamed from LG to LS Industrial Systems Sep. Constructed the Electric & Automation equipment factory in Wuxi, China
’94 Jul. Listed Goldstar Industrial Systems on the Korea Stock Exchange ’95 Feb. Renamed from Goldstar to LG Industrial Systems (LGIS) ‘95 Sep. LGIS merged Goldstar I&E & Goldstar Mechanical & Electrical ’99 Apr. LGIS merged LG Metal ’99 Aug. Sold copper smelting, Vending Machine, Elevator & Escalator unit
2007 Feb. Opened Marketing Subsidiary in Dubai
Appendix 6/14

Appendix 2) LSIS Company Introduction 3) History
2008 Apr. Relocated its headquarters to Anyang LS Tower Sep. Received the Korea Best Company Award (Electricity & Cable industry category) Oct. LS Industrial Systems(currently LSIS) Opened R&D Center in Shanghai, China
2009 Mar. Published the Green Business Vision Oct. Share in Mecapion acquired Oct. European sales corporation established
2011 Oct. Completed the Busan HVDC Plant Nov. Included in the Fortune Korea’s 500 Fastest Growing Companies Nov. Selected as one of the Top 100 Global Innovators by Thompson Reuters
2. Shifting the strategy to growth paradigm (2007 ~ 2012)
2010 Jan. LS Power Semithech J/V established Feb. LS Sauter established Apr. LS Metal spun off from LSIS and newly established LS Metal Apr. Construction of Busan plant completed May. LS Hogae Electric established in China May. LS Industrial Systems(currently LSIS) got the largest number of Green Certification as the first company in Korea Jul. LS Industrial Systems(currently LSIS) opened R&D Center in Beijing, China
2012 May. completed a EV Relay factory in Cheongju, Korea Jun. Awarded the Best Korean Company Grand Award Dec. Selected as one of the Top 100 Global Innovators by Thompson Reuters Dec. US and Chinese patent acquired for smart meter technology
Appendix 7/14

Appendix 2) LSIS Company Introduction 3) History
2013 Apr. Awarded the Great Place to Work Award for 2 consecutive years May. MOU with China’s Dongfang Group for developing green automobile parts May. Concluded contract for the transfer of HVDC technology, and partnered with KAPES and Alstom Jun. Awarded the Best Korean Company Grand Award Oct. Selected as one of the Top 100 Global Innovators by Thompson Reuters Nov. Awarded the 39th Korea National Quality Grand Award Dec. Won the 500 million Trade Tower Award
3. Challenging for the future of Smart Energy (2013 ~ 2015)
2014
Jan. Declared value-based management Mar. Newly constructed R&D campus in Anyang
2015
Jan. Launched new strategic automation product lines for A&D May. LSIS Vice Chairman Ja-kyun Koo Received Gold Tower Order of Industrial Service Merit May. Won the World’s Largest Order for Smart Grid Project in Iraq Jun. Awarded the Best Korean Company Grand Award for 7 consecutive years Jul. Marked the 40th anniversary of the foundation Sep. Ranked number one in the Korean Standard – Quality Excellence Index for 2 consecutive years Nov. Selected as one of the Top 100 Global Innovators by Thompson Reuters
Appendix 8/14

Appendix 2) LSIS Company Introduction 4) Mission & Vision
We guarantee all our customers a safe and affluent life and a happy future
by supplying them with convenient smart energy.
Mission Vision 2020 Strategy Core Value
- Boosting Our Market Position as a Power Solutions Provider - Leading New Markets through Convergence and Combination - Expansion of Global Markets - Securing Operational Excellence
Sales KRW 6 trillion
Operating Profit
KRW 500 billion
Appendix 9/14

Appendix 3) Business Introduction
Appendix 10/14
Electric Infra Business
Leading Provider of Total Electric Power, Automation & Green Business Solutions
Power Plant Primary Substation
Ultra-high voltage power transmission & distribution system equipment such as gas insulated switchgear (GIS) < Main Products > - Gas Insulated Switchgear (GIS) - Power Transformers - Remote Monitoring & Diagnosis Equipment - HVDC
Electric Equipment Business
Substation
Primary Transmission
Sub-Transmission
HVDC
Factory/Building/Household
Factory
Home
Top low and medium voltage electrical equipment for electricity users <Main Products> - Switchgear (SWGR) - Vacuum Circuit Breakers (VCB) - Air Circuit Breakers (ACB) - Molded Case Circuit Breakers (MCCB) - Magnetic Contactors (MC)0

Appendix 3) Business Introduction
Appendix 11/14
Automation Business
Factory / Building (FA/PA)
Convergence Business
Photovoltaic System Green Car Solution Railway System Smart Grid
Discrete Automation
Process Automation
Building Automation
From simple automation control to large-scale manufacturing facilities and process control, LSIS provides the optimal solutions to diverse industrial fields. < Main Products >
- Variable Frequency Drive - PLC (Programmable Logic Controller) - HMI (Human Machine Interface) - Servo Drive & Motor - DCS (Distributed Control System) - RTU (Remote Terminal Unit)

Appendix 4) HVDC
Appendix 12/14
HVDC system converts AC to DC to transmit long distance and then converts back again to
Connect with the AC grid with very low loss
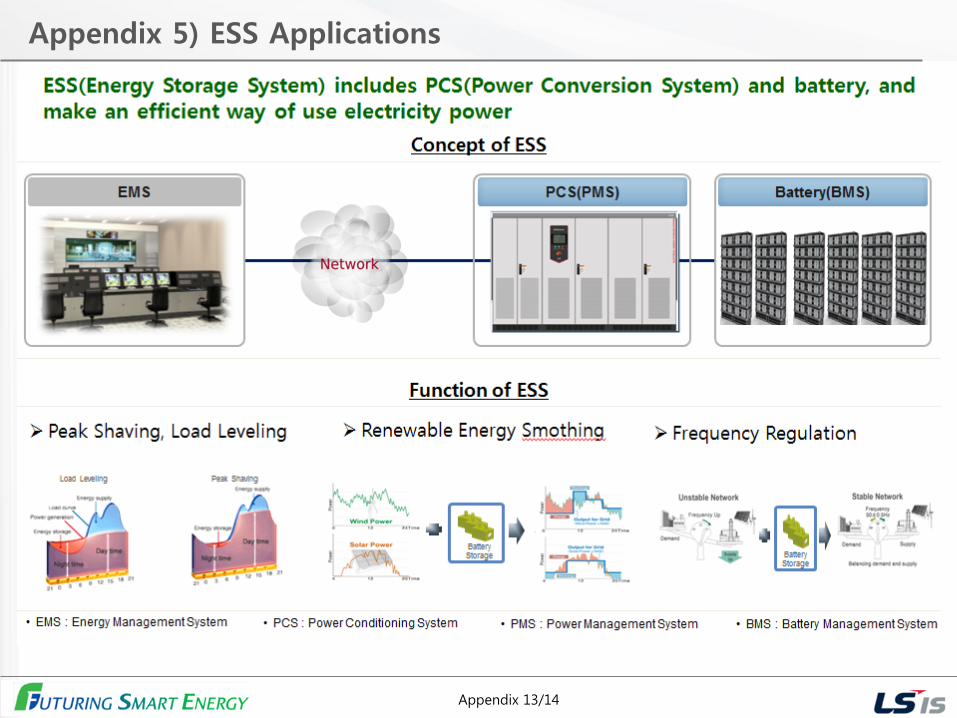
Appendix 5) ESS Applications
Appendix 13/14

Appendix 6) PV Power Plant
Appendix 14/14
System Components
PV Power System
- Module
- Inverter
- Balance of System
We provide total solution for PV Power Plant. In addition to PV products, we can provide customers with all kinds of electric power equipment manufactured by LSIS.
Substation
TR & HV/LV Switchgear MCCB Box
Interconnection
PV Power Plant
- HV Switchgear
- MV Switchgear
- LV Switchgear
Transformer
Monitoring(SCADA)