Embed Size (px)
Citation preview

Global Perspectives
Voya Global PerspectivesTM
Markets. Insights. Opportunities.
2Q2014 | for the period ended 04/30/14
VoyaTM Investment Management was formerly ING U.S. Investment Managementvoyainvestments.com
2014 MARKET OUTLOOK:
BROADENING GLOBAL ECONOMIC EXPANSION
Presented by:
Karyn Cavanaugh, CFASenior Market StrategistING Investment Management U.S.

2
DisclosureThis presentation has been prepared by Voya Investment Management for informational purposes. Nothing contained herein should be construed as (i) an offer to sell or solicitation of an offer to buy any security or (ii) a recommendation as to the advisability of investing in, purchasing or selling any security. Any opinions expressed herein reflect our judgment and are subject to change. Certain of the statements contained herein are statements of future expectations and other forward-looking statements that are based on management’s current views and assumptions and involve known and unknown risks and uncertainties that could cause actual results, performance or events to differ materially from those expressed or implied in such statements. Actual results, performance or events may differ materially from those in such statements due to, without limitation, (1) general economic conditions, (2) performance of financial markets, (3) interest rate levels, (4) increasing levels of loan defaults (5) changes in laws and regulations and (6) changes in the policies of governments and/or regulatory authorities.
The opinions, views and information expressed in this commentary regarding holdings are subject to change without notice. The information provided regarding holdings is not a recommendation to buy or sell any security.
Past performance is no guarantee of future results.
Voya Global Perspectives
Markets. Insights. Opportunities.

3
2014 State of the EconomyGlobal Consumer & Manufacturing
Global Risks
Tectonic Shifts
Forecasts and Investing
Voya Global Perspectives
Markets. Insights. Opportunities.

4
2014 State of the Economy
Voya Global PerspectivesTM
Markets. Insights. Opportunities.
5
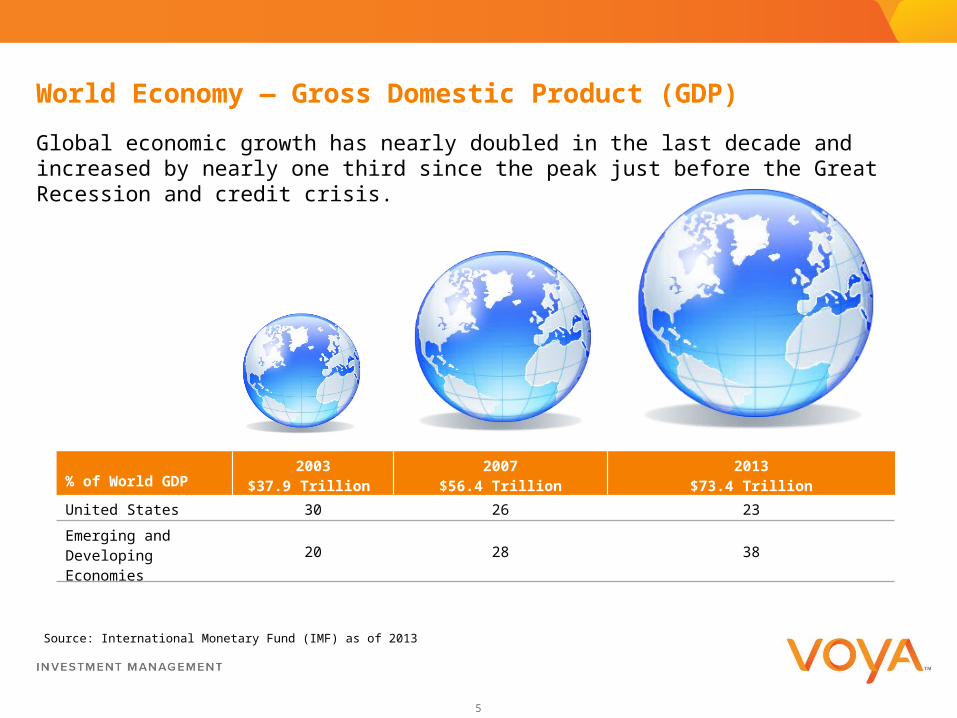
World Economy — Gross Domestic Product (GDP)
Global economic growth has nearly doubled in the last decade and increased by nearly one third since the peak just before the Great Recession and credit crisis.
% of World GDP2003
$37.9 Trillion 2007
$56.4 Trillion2013
$73.4 Trillion
United States 30 26 23
Emerging and Developing Economies 20 28 38
Source: International Monetary Fund (IMF) as of 2013
6
Washington-Proofing a Portfolio is Folly – Despite Volatility
Political Brinkmanship and Unintended Volatility
Janet Yellen confirmed Fed Chairman; Taper continues likely end in 2014; Forward Guidance preferred tool to keep rates low.
Federal Budget and Debt –Ceiling resolutions passed clearing Washington shutdown risk
2014 Mid-term elections promises news-worthy headlines
Source: Voya Investment Management/Global Perspectives
Washington Politics
7
400
700
1,000
1,300
1,600
1,900
2,200
-60%
-40%
-20%
0%
20%
40%
60%
80%
100%
120%
140%
2000 2001 2002 2003 2004 2005 2006 2007 2008 2009 2010 2011 2012 2013 2014
S&
P 5
00
Pric
eS
&P
50
0 E
PS
Gro
wth
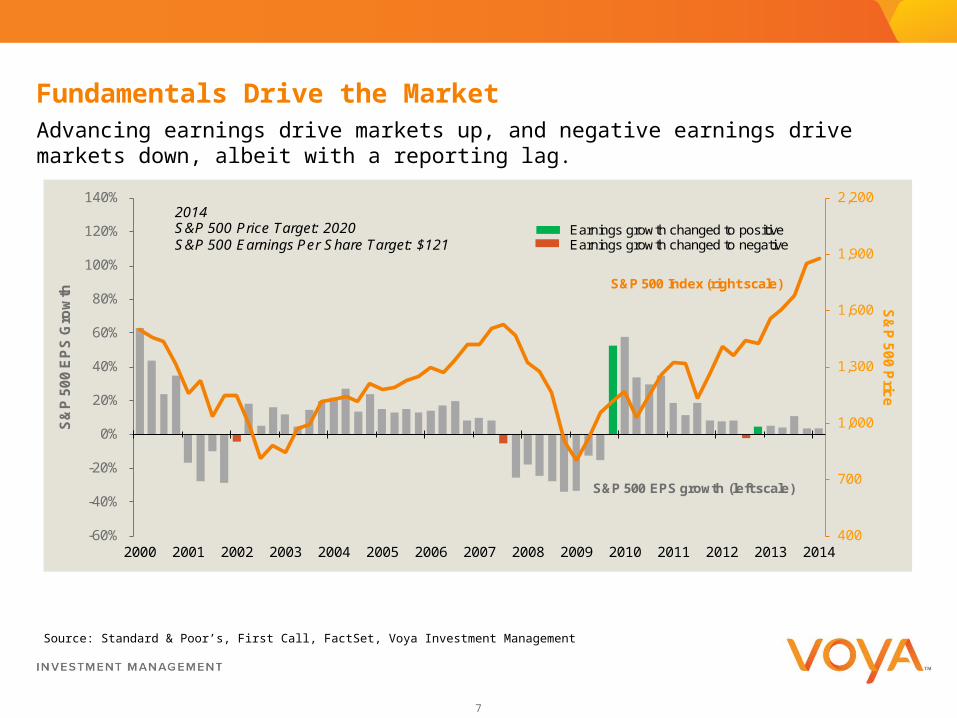
S&P 500 Index (right scale)
S&P 500 EPS growth (left scale)
Earnings growth changed to positiveEarnings growth changed to negative
2014S&P 500 Price Target: 2020S&P 500 Earnings Per Share Target: $121
Fundamentals Drive the MarketAdvancing earnings drive markets up, and negative earnings drive markets down, albeit with a reporting lag.
Source: Standard & Poor’s, First Call, FactSet, Voya Investment Management
8
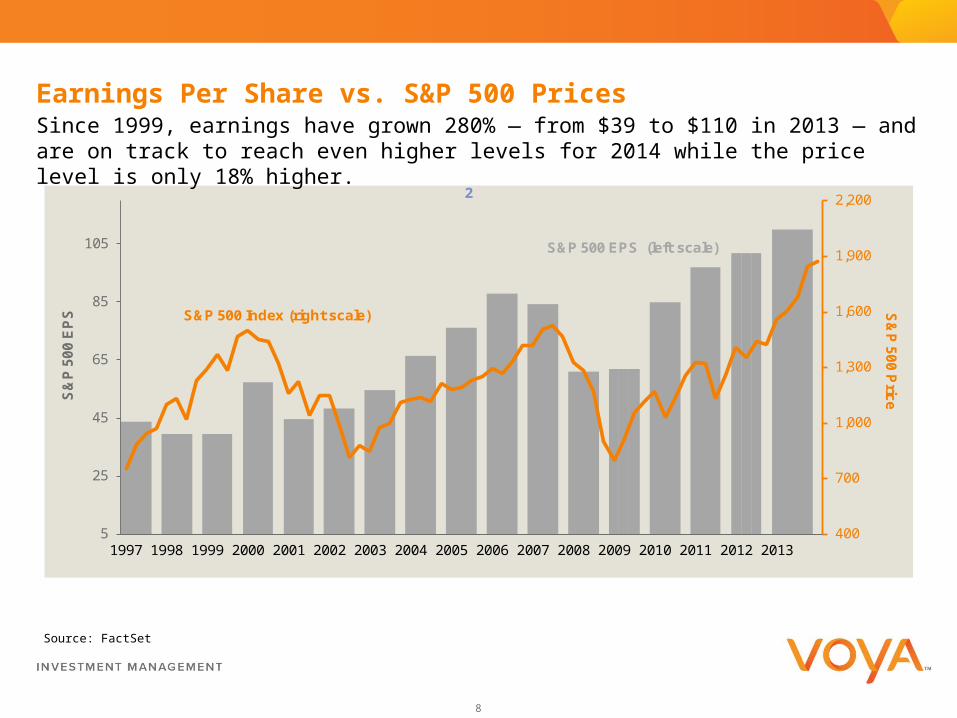
Earnings Per Share vs. S&P 500 PricesSince 1999, earnings have grown 280% — from $39 to $110 in 2013 — and are on track to reach even higher levels for 2014 while the price level is only 18% higher.
400
700
1,000
1,300
1,600
1,900
2,200
5
25
45
65
85
105
1997 1998 1999 2000 2001 2002 2003 2004 2005 2006 2007 2008 2009 2010 2011 2012 2013
S&
P 5
00
Pric
eS&
P 5
00
EP
S
S&P 500 Index (right scale)
S&P 500 EPS (left scale)
2
Source: FactSet

9
Voya Global PerspectivesTM
Markets. Insights. Opportunities.
Global Consumer and Global ManufacturingThe health and prosperity of the world, a region, or a country depends on whether its consumption and manufacturing are marching forward.
10
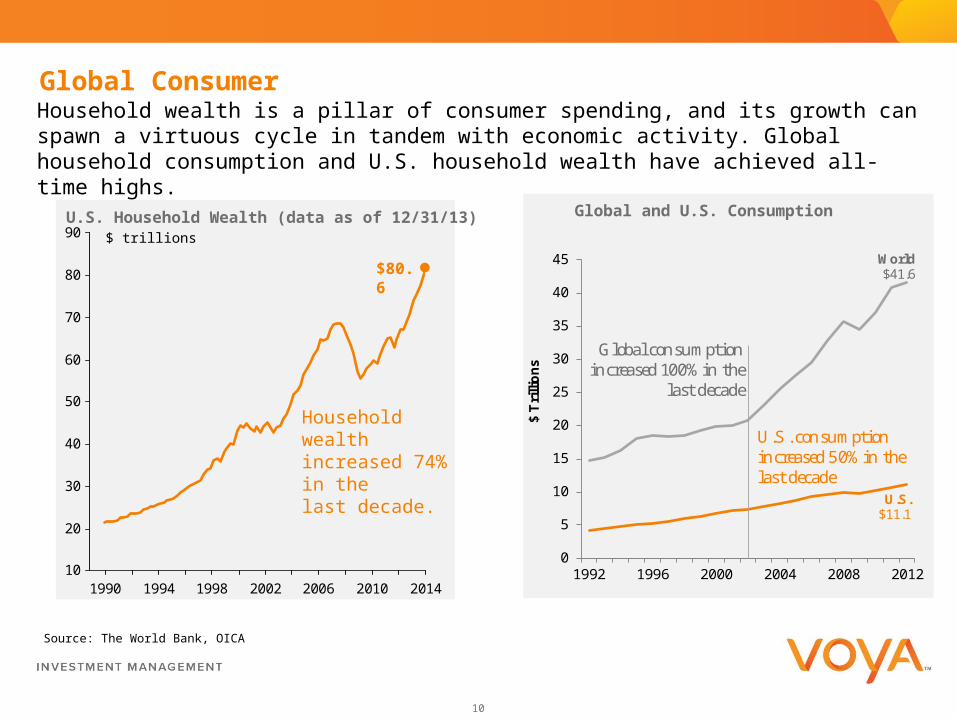
Global ConsumerHousehold wealth is a pillar of consumer spending, and its growth can spawn a virtuous cycle in tandem with economic activity. Global household consumption and U.S. household wealth have achieved all-time highs.
0
5
10
15
20
25
30
35
40
45
1992 1996 2000 2004 2008 2012
World$41.6
U.S.$11.1
Global consumption increased 100% in the
last decade
U.S. consumption increased 50% in the last decade
$ T
rilli
on
s
Source: The World Bank, OICA
Global and U.S. Consumption
1990 1994 1998 2002 2006 2010 201410
20
30
40
50
60
70
80
90
$80.6
Household wealth increased 74% in the last decade.
$ trillions
U.S. Household Wealth (data as of 12/31/13)

11
30
35
40
45
50
55
60
65
1998 2000 2002 2004 2006 2008 2010 2012 2014
Euro Zone PMI
Global PMI
Global ManufacturingManufacturing has the highest multiplier effect of any economic sector. U.S industrial production is at the highest level ever. China, U.K. and Eurozone have all been above the expansionary mark of 50 recently.
Industrial Production – United States
1990 1994 1998 2002 2006 2010 201450
60
70
80
90
100
110
U.S. recessionary
periods
Highest level ever
Source: FactSet
Global Manufacturing
52.4
53.4
12
Voya Global PerspectivesTM
Markets. Insights. Opportunities.
Global Risks
Rising Rates
Shadow Banking
Inflation/Deflation
Europe Recession
13
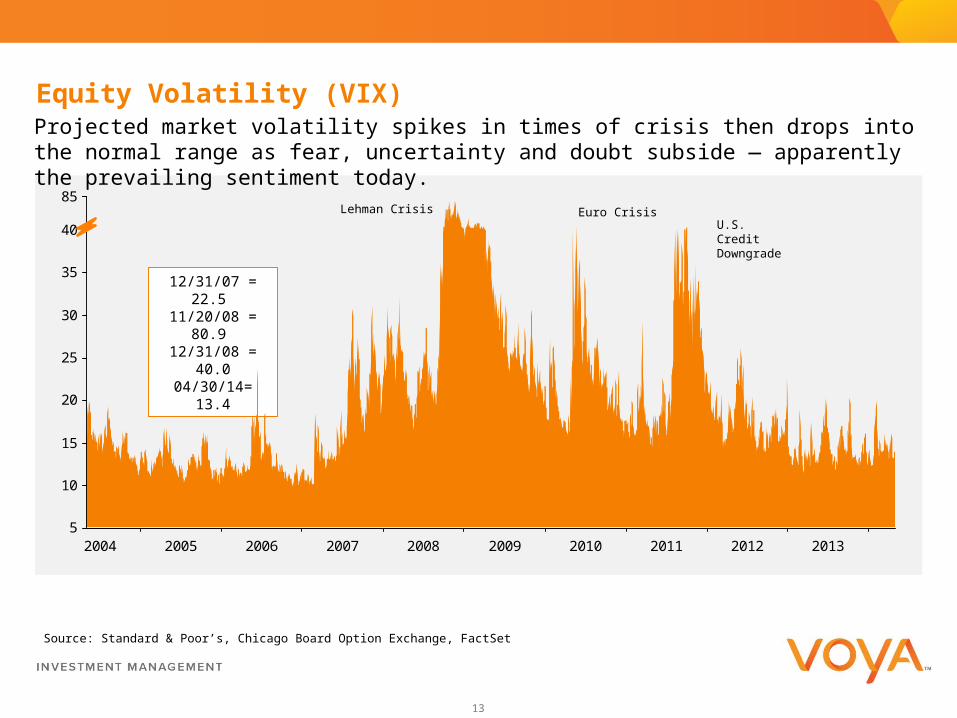
Equity Volatility (VIX)Projected market volatility spikes in times of crisis then drops into the normal range as fear, uncertainty and doubt subside — apparently the prevailing sentiment today.
2004 2005 2006 2007 2008 2009 2010 2011 2012 20135
10
15
20
25
30
35
40
85
12/31/07 = 22.5 11/20/08 = 80.9 12/31/08 = 40.004/30/14= 13.4
Lehman Crisis Euro CrisisU.S. Credit Downgrade
Source: Standard & Poor’s, Chicago Board Option Exchange, FactSet

14
Voya Global PerspectivesTM
Markets. Insights. Opportunities.
Tectonic ShiftsCatalysts for growth in the real global economy

15
Tectonic Shift - EnergyThe 80% cost advantage in the U.S. of Natural Gas is fueling a renaissance in manufacturing; Extraordinary new supplies of cheap energy increases exports and lowers trade deficit
Note: Average natural gas price for households over the period 2003-12 in U.S. cents/kWt (GCV) based on average exchange rates for each year. Source: EIA, FERC
26% 28%
8%11%
8%9%1%2%
20%19%
36%32%
0%
20%
40%
60%
80%
100%
2011 2040
Natural Gas RenewablesNuclear Liquid BiofuelsCoal Oil & Other Liquids
Primary Energy Use by FuelAverage Natural Gas Prices
3.95
11.42
15.2516.36
0
2
4
6
8
10
12
14
16
18
U.S. Europe China Japan
$/cubic foot
Energy will drive the U.S. trade deficit to trade surplus by the end of 2015. This will double GDP growth from an anemic 2% to 4% — well above its long-term trend.
16
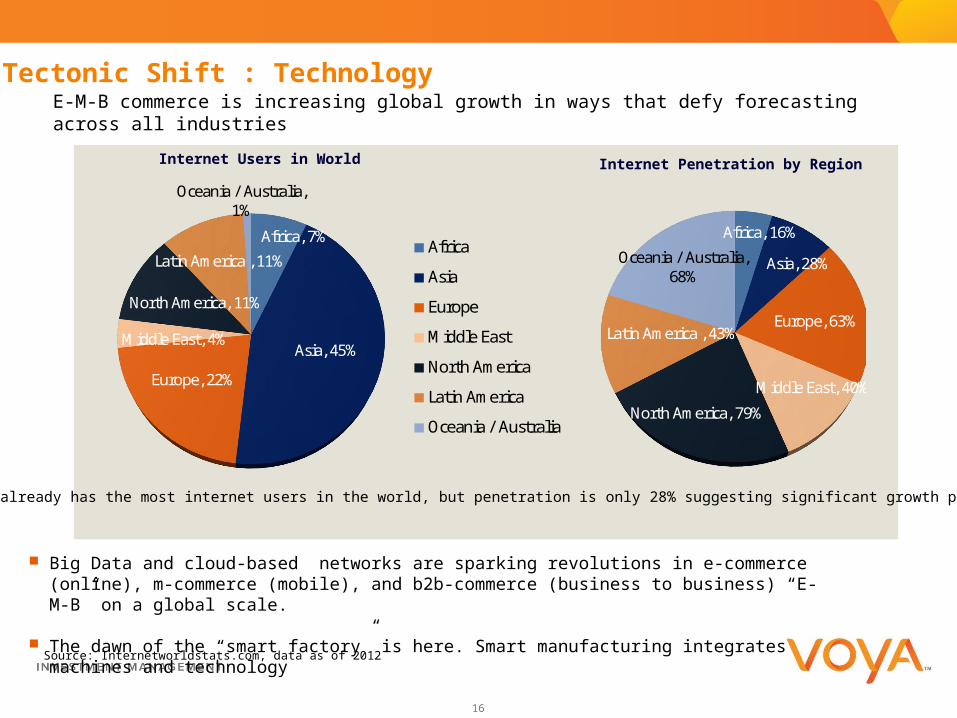
Tectonic Shift : Technology
Source: Internetworldstats.com, data as of 2012
Big Data and cloud-based networks are sparking revolutions in e-commerce (online), m-commerce (mobile), and b2b-commerce (business to business) “E-M-B” on a global scale.
The dawn of the “smart factory” is here. Smart manufacturing integrates machines and technology
E-M-B commerce is increasing global growth in ways that defy forecasting across all industries
Africa, 7%
Asia, 45%
Europe, 22%
Middle East, 4%
North America, 11%
Latin America , 11%
Oceania / Australia, 1%
Africa
Asia
Europe
Middle East
North America
Latin America
Oceania / Australia
Africa, 16%
Asia, 28%
Europe, 63%
Middle East, 40%
North America, 79%
Latin America , 43%
Oceania / Australia, 68%
Internet Users in World Internet Penetration by Region
Asia already has the most internet users in the world, but penetration is only 28% suggesting significant growth potential
Africa, 7%
Asia, 45%
Europe, 22%
Middle East, 4%
North America, 11%
Latin America , 11%
Oceania / Australia, 1%
Africa
Asia
Europe
Middle East
North America
Latin America
Oceania / Australia
17
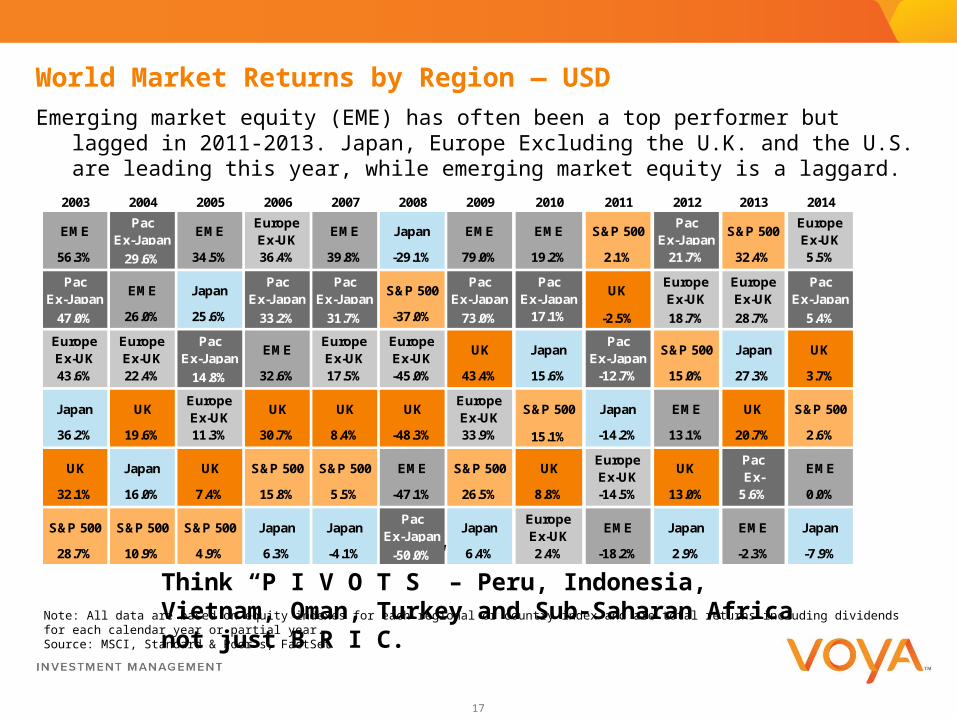
World Market Returns by Region — USD
Emerging market equity (EME) has often been a top performer but lagged in 2011-2013. Japan, Europe Excluding the U.K. and the U.S. are leading this year, while emerging market equity is a laggard.
2003 2004 2005 2006 2007 2008 2009 2010 2011 2012 2013 2014
EMEPac
Ex-JapanEME
Europe Ex-UK
EME Japan EME EME S&P 500Pac
Ex-JapanS&P 500
Europe Ex-UK
56.3% 29.6% 34.5% 36.4% 39.8% -29.1% 79.0% 19.2% 2.1% 21.7% 32.4% 5.5%
Pac Ex-Japan
EME JapanPac
Ex-JapanPac
Ex-JapanS&P 500
Pac Ex-Japan
Pac Ex-Japan
UKEurope Ex-UK
Europe Ex-UK
Pac Ex-Japan
47.0% 26.0% 25.6% 33.2% 31.7% -37.0% 73.0% 17.1% -2.5% 18.7% 28.7% 5.4%.
Europe Ex-UK
Europe Ex-UK
Pac Ex-Japan
EMEEurope Ex-UK
Europe Ex-UK
UK JapanPac
Ex-JapanS&P 500 Japan UK
43.6% 22.4% 14.8% 32.6% 17.5% -45.0% 43.4% 15.6% -12.7% 15.0% 27.3% 3.7%
Japan UKEurope Ex-UK
UK UK UKEurope Ex-UK
S&P 500 Japan EME UK S&P 500
36.2% 19.6% 11.3% 30.7% 8.4% -48.3% 33.9% 15.1% -14.2% 13.1% 20.7% 2.6%
UK Japan UK S&P 500 S&P 500 EME S&P 500 UKEurope Ex-UK
UKPac Ex-
EME
32.1% 16.0% 7.4% 15.8% 5.5% -47.1% 26.5% 8.8% -14.5% 13.0% 5.6% 0.0%
S&P 500 S&P 500 S&P 500 Japan JapanPac
Ex-JapanJapan
Europe Ex-UK
EME Japan EME Japan
28.7% 10.9% 4.9% 6.3% -4.1% -50.0% 6.4% 2.4% -18.2% 2.9% -2.3% -7.9%
Note: All data are based on equity indexes for each regional or country index and are total returns including dividends for each calendar year or partial year. Source: MSCI, Standard & Poor’s, FactSet
Think “P I V O T S” – Peru, Indonesia, Vietnam, Oman, Turkey and Sub-Saharan Africa not just B R I C.
18
Tectonic Shift: Global TradeThe tectonic shifts of energy, technology, frontier markets meet in global trade and linchpin for global growth.
China, world’s second largest economy with double U.S. growth rate, rivals the U.S. as the top trading partner in the world on exports and imports. China is the key driver of South-South trade.
U.S. surpassed Russia as largest energy producer, while China surpassed the U.S. as the largest energy importer. This is having unforeseen benefits in U.S. manufacturing
Source: Factset, Worldbank

19
Voya Global PerspectivesTM
Markets. Insights. Opportunities.
2014 Forecasts & Investing
20
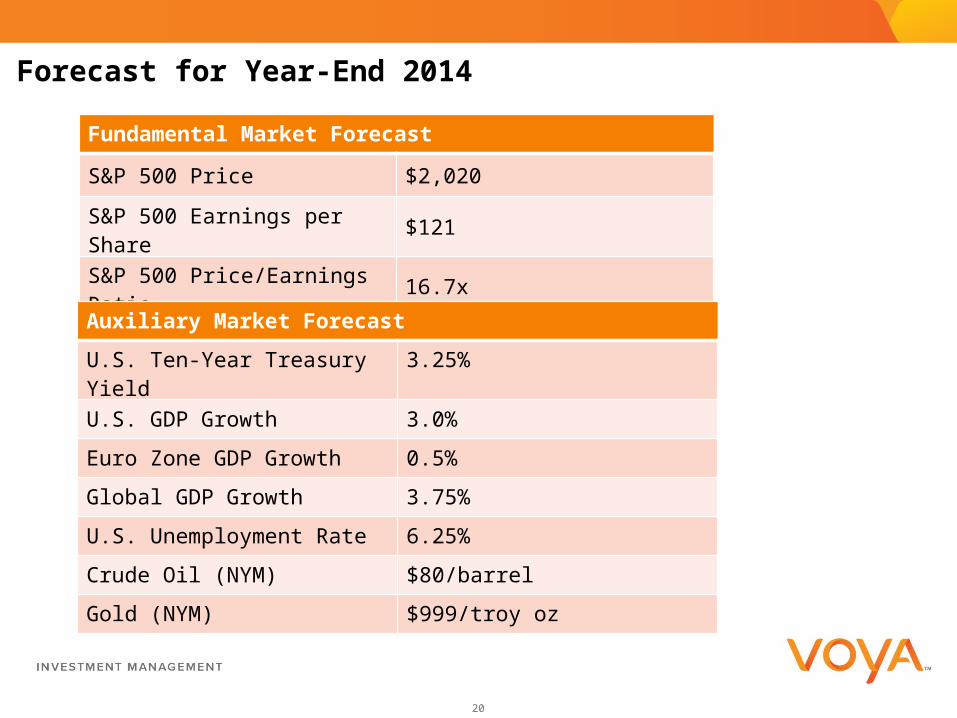
Forecast for Year-End 2014
Fundamental Market Forecast
S&P 500 Price $2,020
S&P 500 Earnings per Share $121
S&P 500 Price/Earnings Ratio 16.7x
Auxiliary Market Forecast
U.S. Ten-Year Treasury Yield 3.25%
U.S. GDP Growth 3.0%
Euro Zone GDP Growth 0.5%
Global GDP Growth 3.75%
U.S. Unemployment Rate 6.25%
Crude Oil (NYM) $80/barrel
Gold (NYM) $999/troy oz
21
Index Wgt Apr-14 YTD 2013 2012 2011 2010 2009 2008 1 year 3 years 5 years 10 years 15 years
Equity
S&P 500 10% 0.7 2.6 32.4 16.0 2.1 15.1 26.5 (37.0) 22.8 13.8 19.1 7.7 4.3
S&P Midcap 10% (1.6) 1.4 33.5 17.9 (1.7) 26.6 37.4 (36.2) 19.3 11.8 21.1 10.3 10.0
S&P Smallcap 10% (2.8) (1.7) 41.3 16.3 1.0 26.3 25.6 (31.1) 24.2 13.9 21.5 10.2 10.4
Global REITs 10% 2.8 6.9 2.2 29.8 (8.1) 20.0 41.3 (48.9) 3.1 6.8 18.2 7.0 10.5
EAFE 10% 1.5 2.3 23.3 17.9 (11.7) 8.2 32.5 (43.1) 19.8 6.2 14.1 7.4 4.7
Emerging Mkts 10% 0.4 0.0 (2.3) 18.6 (18.2) 19.2 79.0 (53.2) (0.5) (3.4) 11.4 11.4 9.5
Average 0.2 1.9 21.7 19.4 (6.1) 19.2 40.4 (41.6) 14.8 8.2 17.6 9.0 8.2
Fixed Income
Corporate 10% 1.2 4.2 (1.5) 9.8 8.1 9.0 18.7 (4.9) 2.7 5.9 9.2 5.8 6.2
U.S. Treasury 20+ 10% 2.2 10.1 (13.9) 3.4 33.8 9.4 (21.4) 33.7 (2.4) 9.3 6.3 7.2 7.1
Global Aggregate 10% 1.1 3.6 (2.6) 4.3 5.6 5.5 6.9 4.8 3.0 2.1 5.1 5.0 5.3
High Yield 10% 0.6 3.6 7.4 15.8 5.0 15.1 58.2 (26.2) 8.2 8.7 15.7 8.8 7.5
Average 1.3 5.4 (2.6) 8.3 13.2 9.8 15.6 1.9 2.9 6.5 9.1 6.7 6.5
Overall Average* 0.6 3.3 10.9 15.2 1.5 16.1 29.6 (29.9) 7.3 7.9 14.7 8.9 8.1
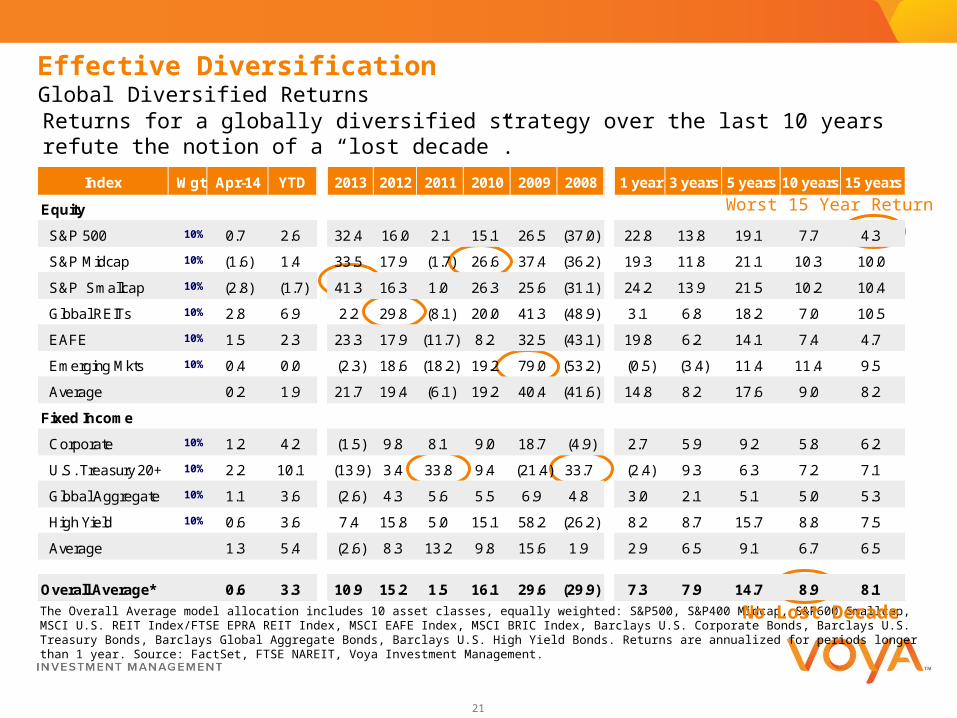
Effective Diversification
Returns for a globally diversified strategy over the last 10 years refute the notion of a “lost decade”.
The Overall Average model allocation includes 10 asset classes, equally weighted: S&P500, S&P400 Midcap, S&P600 Smallcap, MSCI U.S. REIT Index/FTSE EPRA REIT Index, MSCI EAFE Index, MSCI BRIC Index, Barclays U.S. Corporate Bonds, Barclays U.S. Treasury Bonds, Barclays Global Aggregate Bonds, Barclays U.S. High Yield Bonds. Returns are annualized for periods longer than 1 year. Source: FactSet, FTSE NAREIT, Voya Investment Management.
Worst 15 Year Return
Global Diversified Returns
No Lost Decade
22
2014 State of the EconomyGlobal Consumer & Manufacturing
Global Risks
Tectonic Shifts
Forecasts and Investing
Voya Global Perspectives
Markets. Insights. Opportunities.

23
Questions

24
Voya Global PerspectivesTM
Markets. Insights. Opportunities.
Thank You
www.voyaglobalperspectives.com
25
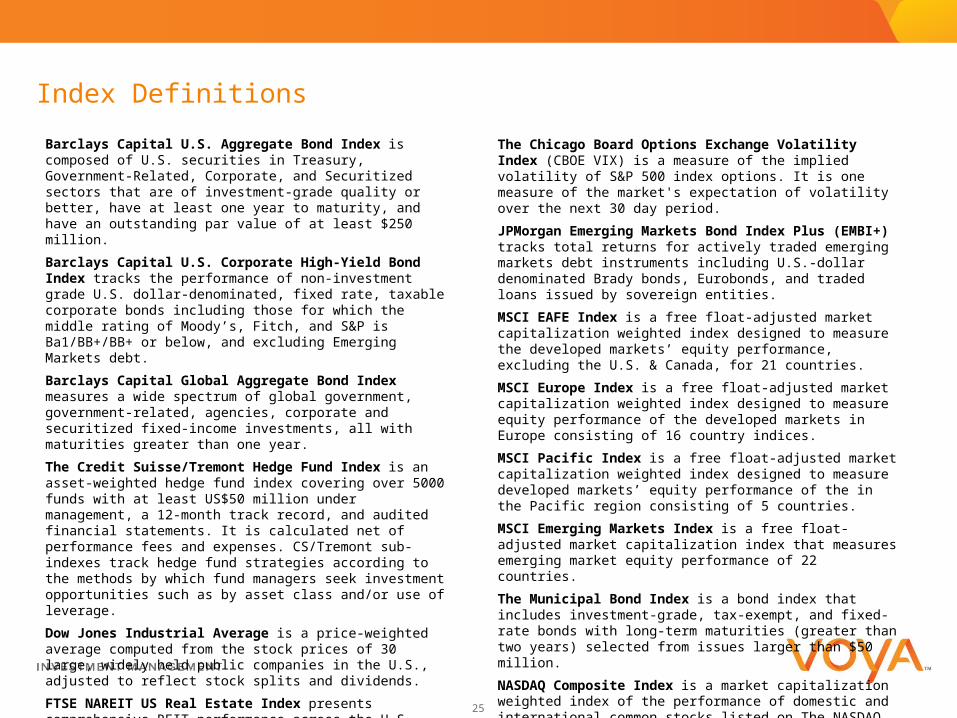
Barclays Capital U.S. Aggregate Bond Index is composed of U.S. securities in Treasury, Government-Related, Corporate, and Securitized sectors that are of investment-grade quality or better, have at least one year to maturity, and have an outstanding par value of at least $250 million.
Barclays Capital U.S. Corporate High-Yield Bond Index tracks the performance of non-investment grade U.S. dollar-denominated, fixed rate, taxable corporate bonds including those for which the middle rating of Moody’s, Fitch, and S&P is Ba1/BB+/BB+ or below, and excluding Emerging Markets debt.
Barclays Capital Global Aggregate Bond Index measures a wide spectrum of global government, government-related, agencies, corporate and securitized fixed-income investments, all with maturities greater than one year.
The Credit Suisse/Tremont Hedge Fund Index is an asset-weighted hedge fund index covering over 5000 funds with at least US$50 million under management, a 12-month track record, and audited financial statements. It is calculated net of performance fees and expenses. CS/Tremont sub-indexes track hedge fund strategies according to the methods by which fund managers seek investment opportunities such as by asset class and/or use of leverage.
Dow Jones Industrial Average is a price-weighted average computed from the stock prices of 30 large, widely held public companies in the U.S., adjusted to reflect stock splits and dividends.
FTSE NAREIT US Real Estate Index presents comprehensive REIT performance across the U.S. economy, including all commercial investment and property sectors.
FTSE EPRA/NAREIT Global Real Estate Index is designed to represent general trends in eligible real estate equities worldwide.
Index Definitions
The Chicago Board Options Exchange Volatility Index (CBOE VIX) is a measure of the implied volatility of S&P 500 index options. It is one measure of the market's expectation of volatility over the next 30 day period.
JPMorgan Emerging Markets Bond Index Plus (EMBI+) tracks total returns for actively traded emerging markets debt instruments including U.S.-dollar denominated Brady bonds, Eurobonds, and traded loans issued by sovereign entities.
MSCI EAFE Index is a free float-adjusted market capitalization weighted index designed to measure the developed markets’ equity performance, excluding the U.S. & Canada, for 21 countries.
MSCI Europe Index is a free float-adjusted market capitalization weighted index designed to measure equity performance of the developed markets in Europe consisting of 16 country indices.
MSCI Pacific Index is a free float-adjusted market capitalization weighted index designed to measure developed markets’ equity performance of the in the Pacific region consisting of 5 countries.
MSCI Emerging Markets Index is a free float-adjusted market capitalization index that measures emerging market equity performance of 22 countries.
The Municipal Bond Index is a bond index that includes investment-grade, tax-exempt, and fixed-rate bonds with long-term maturities (greater than two years) selected from issues larger than $50 million.
NASDAQ Composite Index is a market capitalization weighted index of the performance of domestic and international common stocks listed on The NASDAQ Stock Market including over 2,800 securities.
26
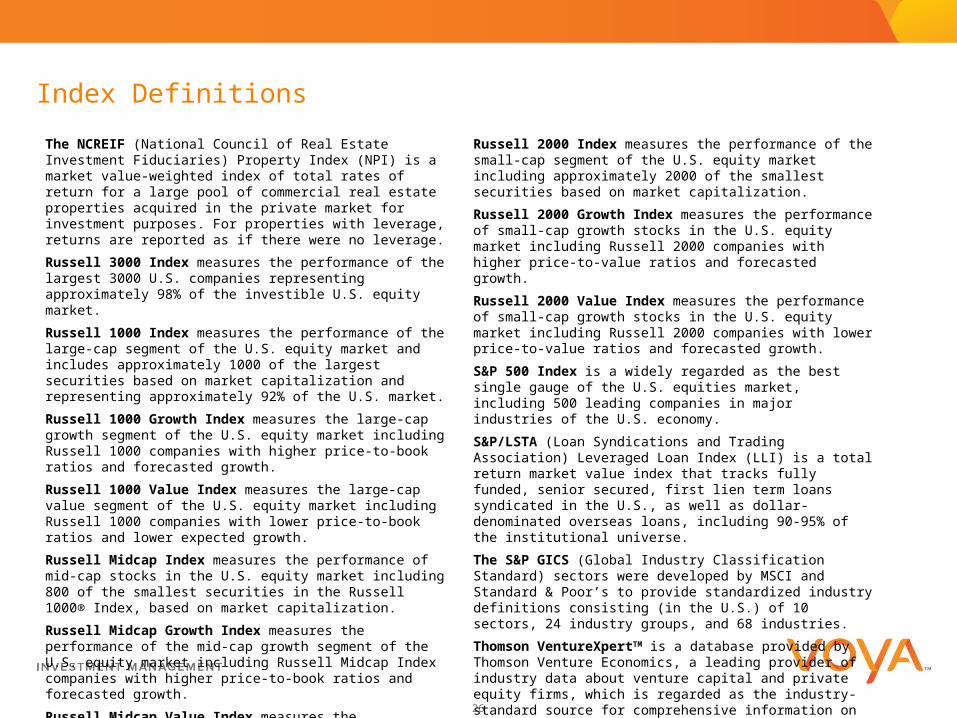
Index Definitions
The NCREIF (National Council of Real Estate Investment Fiduciaries) Property Index (NPI) is a market value-weighted index of total rates of return for a large pool of commercial real estate properties acquired in the private market for investment purposes. For properties with leverage, returns are reported as if there were no leverage.
Russell 3000 Index measures the performance of the largest 3000 U.S. companies representing approximately 98% of the investible U.S. equity market.
Russell 1000 Index measures the performance of the large-cap segment of the U.S. equity market and includes approximately 1000 of the largest securities based on market capitalization and representing approximately 92% of the U.S. market.
Russell 1000 Growth Index measures the large-cap growth segment of the U.S. equity market including Russell 1000 companies with higher price-to-book ratios and forecasted growth.
Russell 1000 Value Index measures the large-cap value segment of the U.S. equity market including Russell 1000 companies with lower price-to-book ratios and lower expected growth.
Russell Midcap Index measures the performance of mid-cap stocks in the U.S. equity market including 800 of the smallest securities in the Russell 1000® Index, based on market capitalization.
Russell Midcap Growth Index measures the performance of the mid-cap growth segment of the U.S. equity market including Russell Midcap Index companies with higher price-to-book ratios and forecasted growth.
Russell Midcap Value Index measures the performance of the mid-cap growth segment of the U.S. equity market including Russell Midcap Index companies with lower price-to-book ratios and forecasted growth.
Russell 2000 Index measures the performance of the small-cap segment of the U.S. equity market including approximately 2000 of the smallest securities based on market capitalization.
Russell 2000 Growth Index measures the performance of small-cap growth stocks in the U.S. equity market including Russell 2000 companies with higher price-to-value ratios and forecasted growth.
Russell 2000 Value Index measures the performance of small-cap growth stocks in the U.S. equity market including Russell 2000 companies with lower price-to-value ratios and forecasted growth.
S&P 500 Index is a widely regarded as the best single gauge of the U.S. equities market, including 500 leading companies in major industries of the U.S. economy.
S&P/LSTA (Loan Syndications and Trading Association) Leveraged Loan Index (LLI) is a total return market value index that tracks fully funded, senior secured, first lien term loans syndicated in the U.S., as well as dollar-denominated overseas loans, including 90-95% of the institutional universe.
The S&P GICS (Global Industry Classification Standard) sectors were developed by MSCI and Standard & Poor’s to provide standardized industry definitions consisting (in the U.S.) of 10 sectors, 24 industry groups, and 68 industries.
Thomson VentureXpertTM is a database provided by Thomson Venture Economics, a leading provider of industry data about venture capital and private equity firms, which is regarded as the industry-standard source for comprehensive information on venture funds, private firms, venture-backed companies and limited partners, as well as analytics for fund statistics and performance.
U.S. Treasury Index is a component of the Barclays Capital U.S. Aggregate Index.

27
Important Disclosures
All indexes are unmanaged and an individual cannot invest directly in an index. Index returns do not include fees or expenses. Past performance is no guarantee of future results
The views and judgments expressed are those of Voya Global Perspectives. They are subject to change at any time. These views do not necessarily reflect the opinions of any other firm.
All investing involves risks of fluctuating prices and the uncertainties of rates of return and yield inherent in investing. All security transactions involve substantial risk of loss.
You should consult your tax, legal, accounting or other advisors about the matters discussed herein.
As indicated on each page, some information was obtained from outside sources and is believed to be reliable, but ING does not guarantee its completeness or accuracy.
Diversification does not guarantee against a loss and there is no guarantee that a diversified portfolio will outperform a non-diversified portfolio.
CA 9660