Embed Size (px)
Citation preview

www.policyschool.ca
PUBLICATIONSPUBLICATIONSSPP Research PaperSPP Research Paper
Volume 11:31 November 2018
https://doi.org/10.11575/sppp.v11i0.52965
ALBERTA’S LONG-TERM FISCAL FUTURETrevor Tombe
SUMMARY Alberta’s fiscal policies are unsustainable.
The province has neither a revenue problem nor a spending problem; it has a budget problem. An aging population will increase government spending significantly, and tax revenue will fail to keep pace. A persistent dependence on resource royalties adds to the uncertainty. And even if current plans to balance early in the next decade succeed, fiscal pressures will mount and deficits balloon.
This paper examines long-term projections for resource royalties, federal transfer payments, investment income, property taxes, tuition revenue, health and education spending and debt service costs, and forecasts a deficit of almost $40 billion by 2040. At 4 per cent of the province’s economy, that’s equivalent to more than $14 billion today. A deficit of this magnitude, combined with capital investments that also add to debt, could raise the ratio of net debt to GDP to almost 50 per cent by 2040 – higher than any point in Alberta’s history. And rising debt means rising interest costs. By 2040, interest payments alone may balloon to more than $22 billion, or 17 per cent of government’s total revenue.
A number of options are available to head off this fiscal crisis, but there are no easy choices. Alberta’s fiscal gap – defined as the permanent and immediate reduction in expenditures or increase in revenues required to ensure sustainable future debt levels – is equivalent to 2.7 per cent of GDP. For perspective, that means cutting government expenditures by $1 out of every $6 spent or introducing a 10 per cent sales tax. But moderation, rather than extremism, is the best long-term approach. A combination of restrained spending growth and modest new revenues – rather than focusing solely on either tax increases or harsh spending cuts – will create a sustainable economic future for Alberta.
Broader tax reform should also be on the table. A sales tax, for example, could be used to lower income taxes and lessen our dependence on volatile resource

1
royalties. On the spending side, careful cost-benefit analyses and assessment of delivery efficiency could reveal plenty of opportunities to reduce spending. This report explores many options.
Whatever the path forward, securing Alberta’s fiscal future requires a long-term perspective and rigorous planning. Government should regularly measure and report on its long-term fiscal situation. It should set clear goals and monitor progress towards achieving them. Along the way, government must recognize what works and what does not, without being afraid to try new measures if necessary.
Alberta’s unique fiscal challenges can be managed, and the province’s fiscal gap can be eliminated. But we must abandon short-term political thinking and do things differently. We must plan for a sustainable fiscal future.
2
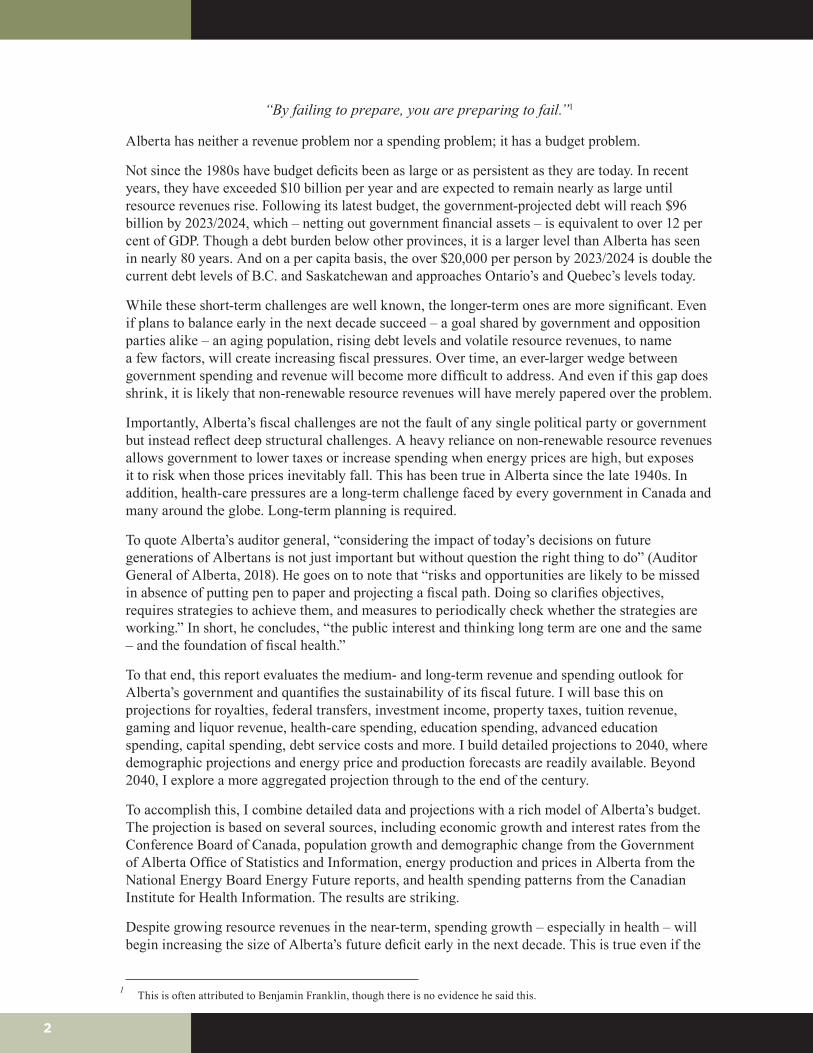
“By failing to prepare, you are preparing to fail.”1
Alberta has neither a revenue problem nor a spending problem; it has a budget problem.
Not since the 1980s have budget deficits been as large or as persistent as they are today. In recent years, they have exceeded $10 billion per year and are expected to remain nearly as large until resource revenues rise. Following its latest budget, the government-projected debt will reach $96 billion by 2023/2024, which – netting out government financial assets – is equivalent to over 12 per cent of GDP. Though a debt burden below other provinces, it is a larger level than Alberta has seen in nearly 80 years. And on a per capita basis, the over $20,000 per person by 2023/2024 is double the current debt levels of B.C. and Saskatchewan and approaches Ontario’s and Quebec’s levels today.
While these short-term challenges are well known, the longer-term ones are more significant. Even if plans to balance early in the next decade succeed – a goal shared by government and opposition parties alike – an aging population, rising debt levels and volatile resource revenues, to name a few factors, will create increasing fiscal pressures. Over time, an ever-larger wedge between government spending and revenue will become more difficult to address. And even if this gap does shrink, it is likely that non-renewable resource revenues will have merely papered over the problem.
Importantly, Alberta’s fiscal challenges are not the fault of any single political party or government but instead reflect deep structural challenges. A heavy reliance on non-renewable resource revenues allows government to lower taxes or increase spending when energy prices are high, but exposes it to risk when those prices inevitably fall. This has been true in Alberta since the late 1940s. In addition, health-care pressures are a long-term challenge faced by every government in Canada and many around the globe. Long-term planning is required.
To quote Alberta’s auditor general, “considering the impact of today’s decisions on future generations of Albertans is not just important but without question the right thing to do” (Auditor General of Alberta, 2018). He goes on to note that “risks and opportunities are likely to be missed in absence of putting pen to paper and projecting a fiscal path. Doing so clarifies objectives, requires strategies to achieve them, and measures to periodically check whether the strategies are working.” In short, he concludes, “the public interest and thinking long term are one and the same – and the foundation of fiscal health.”
To that end, this report evaluates the medium- and long-term revenue and spending outlook for Alberta’s government and quantifies the sustainability of its fiscal future. I will base this on projections for royalties, federal transfers, investment income, property taxes, tuition revenue, gaming and liquor revenue, health-care spending, education spending, advanced education spending, capital spending, debt service costs and more. I build detailed projections to 2040, where demographic projections and energy price and production forecasts are readily available. Beyond 2040, I explore a more aggregated projection through to the end of the century.
To accomplish this, I combine detailed data and projections with a rich model of Alberta’s budget. The projection is based on several sources, including economic growth and interest rates from the Conference Board of Canada, population growth and demographic change from the Government of Alberta Office of Statistics and Information, energy production and prices in Alberta from the National Energy Board Energy Future reports, and health spending patterns from the Canadian Institute for Health Information. The results are striking.
Despite growing resource revenues in the near-term, spending growth – especially in health – will begin increasing the size of Alberta’s future deficit early in the next decade. This is true even if the
1 This is often attributed to Benjamin Franklin, though there is no evidence he said this.
3
government’s own balanced-budget goal is met by 2023/2024. I project deficits on the order of nearly $40 billion by 2040 – or four per cent of GDP at the time. In today’s terms, that’s equivalent to over $14 billion per year. These deficits, plus any additional capital investments not normally expensed in the budget,2 mean the net debt to GDP ratio rises to nearly 50 per cent by 2040 – significantly above today’s eight per cent. Interest costs grow to over $22 billion by 2040, equivalent to 17 per cent of government revenue at the time or 2.3 per cent of GDP. This is not sustainable.
Motivated by this unbounded growth of provincial debt, I provide a detailed examination of debt dynamics and sustainability. Debt is central to understanding Alberta’s fiscal sustainability and the province’s net debt to GDP ratio is a key measure. I defer a complete discussion to a later section, but some intuition now is useful. In a world without unexpected shocks, debt is sustainable if one does not borrow to pay interest. Doing so risks debt snowballing to a point where sudden and drastic adjustment becomes necessary. If the economy is not growing, the overall provincial budget must balance. But in a growing economy, modest deficits are possible as government income grows as the economy expands. So long as the debt to GDP ratio is stable or falling, then the debt is sustainable. If debt is instead rising without bound, as I find may be the case for Alberta, then policy action is required. The immediate and permanent increase in revenue or decrease in spending necessary to ensure long-run debt sustainability is called “the fiscal gap”. For Alberta, that gap is large.
I estimate increasing revenue or decreasing spending by 2.7 per cent of GDP is required for long-run sustainable finances. This is equivalent to a 10 per cent sales tax or to cutting $1 in every $6 spent by government. There are many potential policy mixes to address this fiscal gap over varying time horizons, and the precise fiscal gap estimate depends on various modelling assumptions. The scale of the challenge is nevertheless undoubtedly large, as I will demonstrate. I also provide examples and estimates of concrete revenue and spending actions that can be combined in various ways to close the fiscal gap, depending on the policy preferences of government and voters.
But even if the entire fiscal gap is closed, challenges remain. I project royalty revenues will vary between 10 to 15 per cent of total government revenue over the next two decades, so future changes in energy prices translate into a large range of potential future debt levels. I estimate that even if Alberta eliminates its entire fiscal gap today, there remains a 20 per cent chance that net debt to GDP by 2040 will be larger than it is now. Ensuring Alberta’s finances are sustainable despite rising health-care costs, an inadequate revenue base and volatile resource revenues will be the defining budget challenge for Alberta’s government for many years.
To be clear, projections are not predictions. Instead, they are illustrations of potential futures given various underlying assumptions. Any number of those assumptions could miss actual future developments, so it is more important to view this exercise as revealing where we are pointed rather than a definitive prediction of where we will go. Many jurisdictions perform such long-run fiscal sustainability exercises because they are critical to understand and appreciate the potential implications of current policy. In Alberta’s case, the fiscal gap is so large that almost regardless of what one assumes (so long as they are reasonable) there will be a large and widening fiscal gap that the province will at some point be forced to tackle.
This report is not the first attempt to peer into Alberta’s fiscal future. The Parliamentary Budget Office’s latest Fiscal Sustainability Report, for example, estimates provincial fiscal health through to the end of the century (PBO, 2018). It finds the fiscal gap in Alberta is 2.3 per cent of GDP. This
2 The provincial government books capital investment spending as an expense gradually over time (i.e., as amortization). This is known as the accrual accounting method, which contrasts with the cash accounting method that books all spending as an expense in the period the spending occurred. In this report, I follow the accrual method. To be clear, while cash spending may not be an “expense” in the accrual sense, this spending may still add to debt or will draw down government cash assets. Cash spending therefore matters for the debt dynamics to come. I incorporate it there.

4
work is an important contribution to our understanding of the future fiscal health of Canada and its provinces. My analysis here differs in many important respects. First, I look only to provincial finances while the PBO took a more expansive view that included Alberta’s various municipalities. Second, I explore a finer set of provincial revenue and spending sources, including resource royalties, that leads to a different estimate of the fiscal gap. Both the PBO’s estimate, and the large 2.7 per cent gap I estimate, represent a formidable fiscal policy challenge for Alberta.
The paper proceeds as follows. First, I review the current state of Alberta’s finances, with a particular focus on debt, resource revenues and health-care costs. Given their importance for the budget, I describe at length the projection for resource revenues and health-care costs. Next, I describe the generic components of the broader budget model based on a detailed set of data. With this tool, I quantify the fiscal gap and explore various options to close it.
1 WHERE WE ARE AND WHERE WE’RE GOINGProvincial budgets are necessarily complex. Alberta’s government is set to bring in nearly $48 billion in revenue this year to fund nearly $55 billion in expenditures plus $4.3 billion in capital investment. It employs over 210,000 full-time equivalent workers across hundreds of departments, boards and other entities. Despite this complexity, a high-level appreciation of the inflows and outflows of Alberta’s provincial government is possible.
Figure 1 displays sources of revenue in 2018/2019 on the left and uses of those funds on the right. The main use of funds is operating expenditures in the areas of health, education and social services – which together account for 80 per cent of total operations. The main revenue sources are taxes, federal transfers, investment income, non-renewable resource revenues, various fees and charges, and (especially recently) borrowing. Capital investments are not typically expensed immediately, so they are excluded from the outflows in the diagram below.3 Importantly, taxes fund only 40 per cent of government expenses and income taxes on individuals fund barely more than half of health-care costs.
3 Spending on capital investments will be explicitly incorporated in the debt dynamics analysis to come. For Figure 1, I aggregate amortization of past capital investments into “Other Spending”, along with accounting adjustments like inventory consumption and acquisition and various other adjustments or miscellaneous spending. I include capital grants meanwhile, which government expenses immediately, as their own category.

5
FIGURE 1 ALBERTA GOVERNMENT FINANCIAL FLOWS, 2018-2019Alberta Government Financial Flows, 2018-19All values are in millions of dollars – From Budget 2018 – Created with sankeymatic.com
Inflows Outflows
Currently, revenue is insufficient to cover total expenditures so the government borrows to make up the difference. At $8.3 billion (excluding the risk adjustment), the deficit is the main source of recent concern. The primary cause is low oil prices that have severely reduced royalty revenues in recent years. In 2014-2015, resource revenue approached $9 billion but dropped to $2.8 billion one year later. This loss of resource revenue, along with reductions in income tax revenue (especially from corporations), accounts for the vast majority of the province’s current deficit. And at roughly three per cent of GDP at worst, with near-term deficits forecast to exceed two per cent, such deficits have not been seen in Alberta since the mid-1980s and early 1990s, as Figure 2 makes clear.4
4 Changes in accounting conventions over time make comparisons difficult. The budget balance through the 1980s to the early 1990s would be improved if measured according to today’s accounting conventions. A precise estimate of this is difficult to construct, but the difference between Alberta government “net lending” and “savings” in the National Accounts data (Table 36-10-0314-01) suggests the 1980s deficits would be roughly one per cent of GDP smaller.

6
FIGURE 2 ALBERTA BUDGET BALANCES AS A SHARE OF GDP
Budget 2018'Path to Balance'
−5.0%
−2.5%
0.0%
2.5%
5.0%
1980 1990 2000 2010 2020
Per C
ent o
f GD
PSource: Kneebone and Wilkins (2016), Statistics Canada data table 36−10−0222, and Alberta Budget 2018.
Large deficits are not an inevitable consequence of low oil prices. Government can respond to unexpected developments in various ways. It can either let debt rise and fall with budget imbalances or adjust spending and taxation levels to balance. In neighbouring Saskatchewan, a combination of tax increases and spending reductions have shrunk their resource royalty dependence in half and they will likely return to balance next year (if not this year). Alberta took a different route, using debt as a shock absorber to bridge times of low royalties with (hopefully) times of high.
Each approach has its pros and cons. The former has volatile tax-and-spending policies, while the latter has volatile debt. Accumulating debt has consequences and each province has a different capacity to carry more of it. Alberta has the strongest balance sheet, by far, and even by 2023/2024 will maintain the lowest debt to GDP ratio in the country. The debt to GDP ratio will be a key measure of sustainability in the analysis to come, and I plot all provinces in Figure 3.
To be sure, Alberta’s situation is unusual for the province. By 2020, the province may have a net debt to GDP ratio higher than at any time since the early 1940s. The province’s debt levels have also been rising consistently since the financial crisis when the province was in a net asset position equivalent to 15 per cent of GDP. That is, it owned more financial assets than it owed in debt. The swing from a 15 per cent net asset position to a 10 per cent net debt position over such a short period is comparable to Saskatchewan through the 1980s and early 1990s (when it came close to requiring a federal bailout in 1993) or the federal government over the same period. Both Saskatchewan and the federal government undertook significant fiscal restraint and adjustment under former NDP premier Roy Romanow and former Liberal prime minister Jean Chrétien, respectively. The last time Alberta experienced a swing in debt levels this large, newly elected former premier Ralph Klein also responded with significant spending reductions.

7
FIGURE 3 NET GOVERNMENT DEBT TO GDP, BY PROVINCE (EST. FOR MARCH 2019)
15.5%
8.7%
15.4%
34.2%37.6%
43%40%
34.2% 33%
47.3%
+3.6%
By 2023/24
0%
10%
20%
30%
40%
50%
BC AB SK MB ON QC NB NS PE NL
Sha
re o
f GD
PSource: Various provincial budgets for 2018 and National Bank of Canada budget summaries.
Later in this report, I explore the long-term path and sustainability of Alberta government debt in detail. But first, I unpack the short- and medium-term budget pressures facing the province, starting with resource revenues and health-care spending.
Non-Renewable Resource Revenue
Alberta is addicted to resource revenues. To appreciate the scale of this dependence over the past half-century, I plot it as a share of total Government of Alberta revenue in Figure 4. During Peter Lougheed’s time in office, for example, resource revenues accounted for an average of over 45 per cent of provincial government revenue. At its peak, nearly $6 in $10 flowing into government coffers was from resources. During Klein’s tenure, following a large drop in the mid-1980s, the share averaged 20 per cent from 1993 to 1999 and 33 per cent from 2000 to 2006. And according to figures from the latest annual report for the 2017-2018 fiscal year, $1 in $10 in government revenue is from non-renewable resources today.
Resource revenues are also volatile, so relying on them is difficult. Since 1980, the variance of Alberta’s resource revenue growth from one year to the next was 15 per cent per year while, for comparison, the variance of personal income tax revenue is less than 2.5 per cent. This causes large annual swings in the province’s budget balance. The standard deviation of changes in the province’s primary budget balance since 1980, for example, is 2.2 per cent of GDP. That means the province’s budget balance typically swings that much around its average – equivalent to over $6 billion today.

8
FIGURE 4 NON-RENEWABLE RESOURCE REVENUE AS A SHARE OF TOTAL REVENUE
0%
10%
20%
30%
40%
50%
60%
70%
1900 1920 1940 1960 1980 2000 2020
Per C
ent o
f Tot
al R
even
ueDisplays the share of Alberta government revenue from non−renewable resource revenue. Sources: Boothe (1995) for 1905−1985; Kneebone and Wilkins (2017) for 1985−2014; and Government of AlbertaBudget 2018 and Annual Report 2017−18 for 2014−2018.
And this is largely due primarily to unpredictable resource revenues. Since 1980, the typical difference between actual and budgeted resource revenues, for example, is equivalent to 1.1 per cent of GDP. Since the other large provinces of Ontario, Quebec and British Columbia have average changes in their primary budget balances between 0.6 to 1 per cent, nearly the entire difference in budget volatility between Alberta and the other large provinces is therefore due to resource revenues. Later in this report, resource revenue volatility will create large uncertainty over the range of potential future debt levels. For now, I put volatility aside and consider the medium-term prospects for Alberta’s resource revenues.
Forecasting future royalties is a challenge. But using the latest National Energy Board (2017) projection of oil and gas production and prices, one can roughly do so. The NEB expects bitumen production to increase by nearly 50 per cent by 2040, and expects gradually increasing prices with WTI rising to over $75 per barrel (in 2016 dollars) by the mid-2020s. It also forecasts rising crude production and modestly higher natural gas production. I project royalties forward based on these price and production forecasts and presume a WCS-WTI differential of $18 per barrel beyond 2021. I illustrate this implied baseline non-renewable resource revenue projection in Figure 8. By 2040, I project royalties of nearly $17 billion, equivalent to $11 billion in 2018 dollars, and by 2023 royaltiesgrow to $8.9 billion. This is a conservative projection, as I abstract from details within the royalty system as various facilities move to their post-payout phases and as royalty rates gradually increaseas prices do.

9
FIGURE 5 NON-RENEWABLE RESOURCE REVENUE PROJECTION
Projection Period
Baseline Projection
GOA `Pathto Balance`
Optimistic Scenario
$0
$5,000
$10,000
$15,000
$20,000
2015 2020 2025 2030 2035 2040
Mill
ions
of D
olla
rsDisplays a royalty projection based on NEB Energy Future 2017 and the Government of Alberta's `Path to Balance` 2018.
As an alternative, I also explore an optimistic scenario based on the government’s Budget 2018, which anticipated royalties of $10.4 billion by 2023/2024. This is larger than my forecast, as the government’s internal forecasts incorporate the movement of facilities from pre- to post-payout phases within the royalty system, as well as numerous other differences in methodology. Replicating its analysis based on publicly available sources is not feasible. Growing its royalty forecast in line with the baseline projection beyond 2023, I find royalties may approach $20 billion by 2040. This is the dotted line in Figure 5. I use both projections in the analysis to come.
Health-Care Costs and an Aging Population
Health-care costs are a large and rapidly growing area of government spending. This is true throughout the developed world. In Alberta, health accounted for roughly 20 per cent of government spending 50 years ago; today, that has doubled to over 40 per cent. Going forward, an aging population will be a significant source of spending pressure for one simple reason: each elderly person drives orders of magnitude higher spending on health-care services than other age groups. The Canadian Institute for Health Information (CIHI) compiles estimates by province, and I display Alberta and Canada in Figure 6 below. It plots the average health-care dollars spent by provincial governments per person across all age groups. The average Albertan aged 25-29, for example, costs the health-care system just over $2,700 per year. The average Albertan over the age of 90 costs $45,000. In the rest of Canada, those costs are systematically lower but the overall pattern of increasing spending by age holds.

10
FIGURE 6 HEALTH SPENDING PER PERSON BY AGE COHORT, ALBERTA AND CANADA (2015)
$0
$10,000
$20,000
$30,000
$40,000
$50,000
<1 1–4
5–9
10–1
415
–19
20–2
425
–29
30–3
435
–39
40–4
445
–49
50–5
455
–59
60–6
465
–69
70–7
475
–79
80–8
485
–89
90+
Dol
lars
per
Cap
ita (2
015$
)
Alberta Canada
Based on provincial/territorial government health expenditures only. Inflation adjusted.
Note: Age/gender specific spending by province from CIHI Open Data Table O.2. Source: Canadian Institute for Health Information, National Health Expenditure Trends 1975−2017.
These data matter since an aging population will increase the share of the population accounted for by persons in older groups with higher health-care costs. This is already happening. The baby boom generation is also now transitioning into its retirement years, which is increasing the share of the population over the age of 65 significantly. Figure 7 illustrates the latest Government of Alberta population projection to 2046. Currently, nearly 13 per cent of the province is over 65 but within 30 years that share may exceed 19 per cent and the share over the age of 90 will triple.
To project health cost increases due to an aging population, combine the distribution by age with the spending by age using
𝑐𝑐𝑡𝑡 =∑𝑐𝑐𝑖𝑖𝑠𝑠𝑡𝑡𝑖𝑖𝑖𝑖∈𝐺𝐺
,
where age-specific costs are 𝑐𝑐𝑖𝑖 for 2015, 𝑠𝑠𝑡𝑡 𝑖𝑖 are forecast population shares to 2046, and G is the set
of all five-year age-group bins over which CIHI reports health spending per capita. Projecting these population shares forward reveals Alberta is on track for a nearly 30 per cent increase in health spending over the next three decades, ignoring the effect of overall population growth, general inflation and health-care-specific inflation. This is equivalent to over $1,400 per person in today’s dollars or nearly $6 billion. I display this projection in Figure 8. The implied range of potential future outcomes, based on the government’s low and high growth scenarios, is shaded in grey. The medium scenario is used in the baseline projection.

11
FIGURE 7 AGE DISTRIBUTION IN ALBERTA FOR 2018 AND THE PROJECTION FOR 2046
19.3%12.7%
2018 2046
0
10
20
30
40
50
60
70
80
90+
2% 1% 0% 1% 2%Share of Population
Age
Source: Own calculations from Government of Alberta reference projection. Share aged 65+ highlighted.
The effect of an aging population on health spending is already evident in the data. Over the past 20 years, Alberta’s population aged 65+ increased from less than 9.8 per cent of the total population to 12.7 per cent today. This means more elderly individuals per working-age Albertan. As early as 10 years ago, there were 6.5 working-age individuals per person over the age of 65+. Today, that’s fallen to almost five and it will continue to steadily decline to roughly three workers per elderly individual within the next three decades. The aging population in recent years has already added $590 per capita to provincial health-care costs in 2018 compared to 20 years earlier. This is equivalent to $2.5 billion today (or over 11 per cent of the total health-care budget). Figure 8 (b) displays these projections from the late 1990s to 2046.
Demographics are not the only factor behind growing health-care costs. Technological change, capacity and service utilization rates, fee schedules, drug prices and so on will all affect costs. CIHI (2011) estimates that these other factors (excluding population growth, aging and inflation) added nearly 1.5 per cent on average per year since 2000. In the fiscal projection to come, I therefore augment the demographic-only projection to include an additional one per cent cost increase over and above aging, population growth and general inflation. This rate is conservative relative to not only the CIHI historical data but also more conservative than a recent analysis for the Society of Actuaries and the Canadian Institute of Actuaries. Grignon et al., (2018) forecast long-run health-care cost trends of each Canadian province. They project health cost increases that exceed five per cent per capita in the near term and four per cent per capita by 2040 onwards. In this report, putting all factors together, I find health spending growth averages 5.4 per cent between 2017 and 2046. I then assume this growth rate gradually declines to 4.3 per cent by 2060 and remains there afterwards. This implies the long-run health-care spending share of GDP converges to a constant, consistent with other health cost projection models. Specifically, it increases from 6.2 per cent today to 7.7 per cent in the long-run. This is conservative.

12
FIGURE 8 ALBERTA’S AGING POPULATION AND ITS EFFECT ON PROVINCIAL HEALTH SPENDING
(a) Number of Working-Age Persons per 65+ Population
Today●
Projection2
3
4
5
6
7
1995 2000 2005 2010 2015 2020 2025 2030 2035 2040 2045
Wor
kers
per
Ret
iree
Displays the number of working−age adults per person 65+. Own calculations from Government of Alberta reference projection.The grey area is the region between 'low' and 'high' population growth scenarios.
(b) The Effect of an Aging Population on Provincial Health Spending
Today●
Projection$4,000
$4,500
$5,000
$5,500
$6,000
$6,500
$7,000
1995 2000 2005 2010 2015 2020 2025 2030 2035 2040 2045
Rea
l 201
5 D
olla
rs p
er P
erso
n
Displays Alberta's real per capita provincial health spending, holding age/gender−specific spending constant at 2015levels and applying year−specific population weights from the Government of Alberta's 2018 projection.The grey area is the region between 'low' and 'high' population growth scenarios.
2 A MODEL OF ALBERTA’S OVERALL BUDGETThough royalties and health-care spending are critically important components of Alberta’s fiscal future, there are other factors to consider. In this section, I describe details behind the methodology to project the implied future growth of other revenue and spending items. Revenue sources are disaggregated into sub-components: royalty revenue, investment income, federal transfers, property taxes, tuition revenue, AGLC revenue, tobacco and cannabis taxes, carbon taxes, and other taxes and revenue sources (primarily income taxes). Expenditure categories are also disaggregated into sub-components: health, education, advanced education, other program expenditures and debt service costs.

13
The baseline fiscal position of the province is from Budget 2018. This document lays out the government’s near-term revenue and expenditure plans to 2020/2021 and aspirational goals to return to a balanced budget by 2023/2024. Given the lack of detail beyond 2020/2021, I use my own model of revenue and spending growth, given current policy, from that point onward. Budget 2018 does provide certain high-level projections beyond 2020/2021 but the lack of detail undermines the usefulness and credibility of those estimates.
Alberta’s Macroeconomic Future
Driving many of the relevant budget variables are population, GDP and inflation projections. I report relevant growth rates in Table 1. In short, GDP growth projections for Canada and Alberta combine forecasts reported in the most recent government budgets with long-term outlook projections from the Conference Board of Canada (2018a). I assume the Bank of Canada maintains its inflation target, and therefore assume two per cent inflation in all years. And I described the population data in the previous section.
Finally, I infer interest rates on Alberta government debt from the Conference Board (2018b) outlook for Government of Canada long-term bond yields. They project the yield rises to 3.78 per cent by 2020 and remaining constant thereafter. Given the typical premium of Alberta bonds relative to the GOC bonds, I assume Alberta government borrowing rates are roughly one percentage point above the federal rate. Alberta’s Budget 2018 projects debt service costs of $2.9 billion in 2020/2021, which is 4.46 per cent of the $65.8 in interest-bearing debt projected for the prior fiscal year of 2019/2020. I therefore only modestly (and smoothly) increase Alberta’s effective interest on government debt from 4.46 per cent in 2020/2021 to 4.78 per cent by the late 2030s. The gradual increase reflects the fact that government debt issued previously when interest rates were low matures only gradually.5 The extent to which an increasingly tenuous fiscal position affects borrowing rates is not reflected in this analysis, which assumes a credible (though implicit) federal backstop. The lack of material variation across provinces today, regardless of credit ratings, suggests this is a reasonable assumption.
TABLE 1 SUMMARY OF GROWTH RATES, BY COMPONENT AND PERIOD
MacroVariables
Average Annual Growth Rate (Per Cent)
2020 to 2025 2025 to 2030 2030 to 2035 2035 to 2040 Beyond 2040 *
Canada Nominal GDP 3.8 3.7 3.7 3.7 3.7
Canada Population 0.9 0.8 0.7 0.7 0.6
Alberta Nominal GDP 5.1 4.6 4.4 4.4 4.3
Alberta Population 1.6 1.5 1.4 1.3 1.2
Inflation 2.0 2.0 2.0 2.0 2.0
Labour Productivity 1.5 1.0 1.0 1.0 1.0
* The projection assumptions beyond 2040 are used only for long-term debt sustainability in Section 4.
5 A rough estimate of effective interest rates using the government’s reported maturity schedule closely matches the gradually increasing effective interest rates I use here.
14
Other Revenue and Spending Categories
I describe all remaining revenue and spending categories individually and briefly.
Federal Transfers
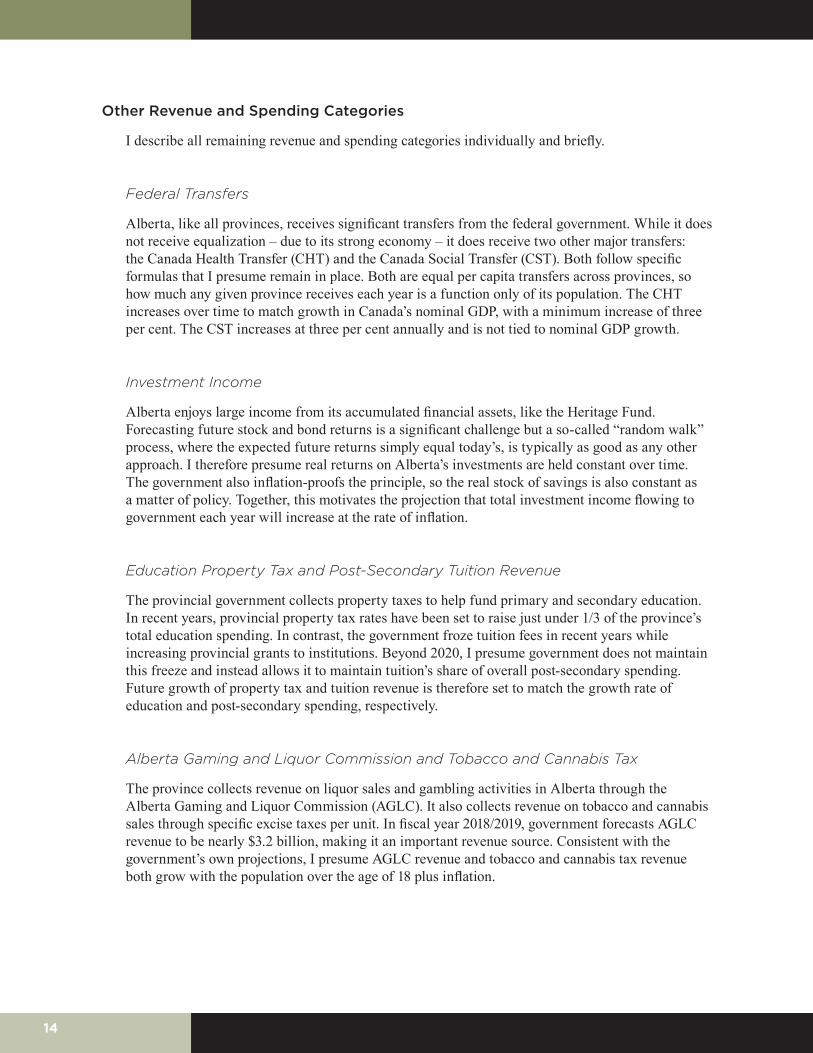
Alberta, like all provinces, receives significant transfers from the federal government. While it does not receive equalization – due to its strong economy – it does receive two other major transfers: the Canada Health Transfer (CHT) and the Canada Social Transfer (CST). Both follow specific formulas that I presume remain in place. Both are equal per capita transfers across provinces, so how much any given province receives each year is a function only of its population. The CHT increases over time to match growth in Canada’s nominal GDP, with a minimum increase of three per cent. The CST increases at three per cent annually and is not tied to nominal GDP growth.
Investment Income
Alberta enjoys large income from its accumulated financial assets, like the Heritage Fund. Forecasting future stock and bond returns is a significant challenge but a so-called “random walk” process, where the expected future returns simply equal today’s, is typically as good as any other approach. I therefore presume real returns on Alberta’s investments are held constant over time. The government also inflation-proofs the principle, so the real stock of savings is also constant as a matter of policy. Together, this motivates the projection that total investment income flowing to government each year will increase at the rate of inflation.
Education Property Tax and Post-Secondary Tuition Revenue
The provincial government collects property taxes to help fund primary and secondary education. In recent years, provincial property tax rates have been set to raise just under 1/3 of the province’s total education spending. In contrast, the government froze tuition fees in recent years while increasing provincial grants to institutions. Beyond 2020, I presume government does not maintain this freeze and instead allows it to maintain tuition’s share of overall post-secondary spending. Future growth of property tax and tuition revenue is therefore set to match the growth rate of education and post-secondary spending, respectively.
Alberta Gaming and Liquor Commission and Tobacco and Cannabis Tax
The province collects revenue on liquor sales and gambling activities in Alberta through the Alberta Gaming and Liquor Commission (AGLC). It also collects revenue on tobacco and cannabis sales through specific excise taxes per unit. In fiscal year 2018/2019, government forecasts AGLC revenue to be nearly $3.2 billion, making it an important revenue source. Consistent with the government’s own projections, I presume AGLC revenue and tobacco and cannabis tax revenue both grow with the population over the age of 18 plus inflation.
15
Carbon Taxes
For carbon levy revenues, I presume a $50 per tonne price from 2022 onwards, with a constant carbon tax base. This implicitly assumes that improving energy and emissions intensity are offset by population and economic growth. This is not inconsistent with projected Alberta emissions to 2030 made by the Climate Leadership Panel in its report to the minister, which shows large reductions relative to business as usual without the climate leadership plan policies, but largely flat emissions relative to current levels. The large emitter tax is not explicitly included in the analysis to come. Increases in the carbon price beyond 2022 will be explored later, but current policy only goes to 2022.
Other Taxes and Revenue
Other taxes and revenue sources are primarily accounted for by income taxes, government business income, and fees and fines from goods and services sales by government. For 2018/2019, of the $24.7 billion in revenue in this broad category, nearly 2/3 is income tax revenue, with the rest accounted for by other taxes (gas, etc.), premiums, fees and licences (motor vehicle licences, etc.), government business income (ATB, etc.), and fines or sales of goods and services. To 2020/2021, values are from Budget 2018 and beyond they grow with the province’s nominal GDP. Historically, income tax revenue, both corporate and personal, does grow with GDP, and has varied between four to five per cent of GDP since 1980.
Education and Advanced Education Spending
Spending on primary and secondary education grows with enrolment and costs. To be conservative, I presume that cost increases match overall inflation plus 0.5 per cent for real wage increases. In recent decades, overall wages in Alberta tend to grow at roughly one per cent more per year than inflation. Enrolment growth is set to match the projected growth in the population aged five to 18.

16
TABLE 2 SUMMARY OF BUDGET GROWTH RATES, BY COMPONENT AND TIME
BudgetItem
ForecastAssumption
Average Annual Growth Rate(Per Cent)
2020 to 2025
2025 to 2030
2030 to 2035
2035 to 2040
Resource Revenues Growth proportional to NEB Energy Future 2017 price and production forecasts 15.0 4.7 3.1 2.8
Investment Income Increases with inflation 2.0 2.0 2.0 2.0
Federal Transfers National nominal GDP, and Alberta’s population growth, according to CHT and CST formulas 4.2 4.1 4.0 4.0
Education Property Tax Growth proportional to education spending 4.7 3.7 3.2 2.9
Post-Secondary Tuition Fees Growth proportional to advanced education spending 4.1 5.9 3.9 3.8
AGLC, Tobacco and Cannabis Inflation plus population aged 18 and over 3.5 3.7 3.6 3.5
Carbon Levy Grows to $50/t by 2022; emissions levels hold constant to 2040 9.0 0.0 0.0 0.0
Other Revenue Grows with Alberta’s nominal GDP 5.1 4.6 4.4 4.4
Health Spending Demographic change, inflation, population growth and other health-care cost increases of 1 per cent 5.5 5.6 5.6 5.3
Education Spending Grows with population aged 5-18 plus 2 per cent inflation and 0.5 per cent for real wage growth 4.7 3.7 3.2 2.9
Adv. Education Spending
Grows with population aged 19-24 plus 2 per cent inflation and 0.5 per cent for real wage growth 4.1 5.9 3.9 3.8
Other Program Expen-ditures Grows with Alberta’s nominal GDP 5.1 4.6 4.4 4.4
Debt Service Endogenous debt accumulation, interest rates rise gradually to 4.78 per cent 11.9 10.2 10.5 10.2
Combining all the above components:
Total Revenue Total of all revenue components 5.9 4.2 3.8 3.8
Total Expenditures Total of all expenditure components 5.4 5.3 5.2 5.2
As with primary and secondary education, I assume advanced education spending increases with inflation plus the growth in the population aged 19 to 24 and, as with primary and secondary education, a 0.5 per cent per year increase to reflect modest real wage growth. Following declines in recent years, there is a notable increase in the growth of university-aged persons in Alberta starting early in the next decade. The government’s population projection expects growth rates for this age group during the 10 years starting in 2023 to average nearly 2.7 per cent per year (and nearly four per cent in the peak year of 2027).
Historically, real per pupil spending in education is characterized by periods of stable or declining levels punctuated by notable increases when the government’s budget situation is strong (such as the early 1980s and early 2000s). Assuming 0.5 per cent spending growth above the growth in enrolment and prices is slightly more conservative than the 0.7 per cent growth observed in the past 30 years.
Climate Leadership Spending
Prior to Budget 2018, the Alberta government earmarked all carbon tax revenue to spending initiatives of various kinds. This policy will soon change. Starting in 2021, the government will allocate incremental revenue from rising carbon prices to general revenue. I presume that policy holds. Currently, climate leadership operating spending increases to nearly $1.2 billion by 2020/2021. I therefore hold this level constant in nominal terms from that point forward.

17
Other Program Expenditures
Other program expenditures have remained roughly stable around five per cent of Alberta’s GDP for the past 20 years. Going forward, I presume this trend continues and this expenditure category grows in line with nominal GDP.
Capital Spending
Between 2008 and the end of 2020/2021, the average government capital plan was 2.2 per cent of GDP. The Alberta government is currently projecting capital plan levels closer to 1.5 per cent – a significant departure from the government’s own previous policy. I presume this historically low share cannot be maintained and increases to two per cent for 2021/2022 onwards. The two per cent share is a smaller public infrastructure level than historic shares, and smaller than most other provinces. Infrastructure and other capital spending is generally not expensed the year in which spending occurs. Instead, it is gradually amortized over time. Some capital plan spending, however, is a grant to other entities or municipal governments that is immediately expensed. I presume these grants are 30 per cent of overall capital spending – consistent with 2018-2020 fiscal years. Despite not increasing the accrual deficit, capital investment does have balance sheet implications. If not funded with revenue, there is incremental borrowing to finance the capital plan equal to the difference between these capital investments and amortization expenses. This difference averages roughly 0.66 per cent of GDP throughout the projection period. In what follows, “expenses” or “expenditures” refers to the government’s accrual expenses; it includes amortization but not capital investment. Spending on capital investments, however, is included in the debt dynamics analysis.
3. ALBERTA’S MEDIUM-TERM FISCAL PROJECTIONWith all these data and modelling assumptions in hand, I project Alberta’s fiscal future. Figure 9 (a) plots total revenue, total expenditures and program expenditures (which excludes interest on the debt). Figure 9 (b) displays the overall budget balance, the primary balance (which excludes interest on the debt) and debt service costs. I further report various other budget metrics in Table 3.
Note that the figures are expressed as share of GDP. So the initial decreases in expenditures evident in Figure 9 (a) from 2016 through to the early 2020s does not imply expenditures are shrinking, only that they are growing more slowly than the economy. Total revenue does not similarly increase due to the significant drop in resource revenues over this period, and the projected rate of growth in such revenues over the coming years. The gradual medium-term decline in total revenue as a share of GDP is the result of many of the individual revenue components growing more slowly than the overall economy. These include investment income, federal transfers, property taxes, AGLC, tobacco and cannabis revenue, and carbon taxes.
Overall, two important results stand out. First, total expenditures exceed total revenue throughout the projection period and the resulting budget deficits are large. The overall deficit declines from 2.3 per cent of GDP today to below one per cent by 2021 before increasing to over four per cent by 2040. Second, the consequent rise in debt leads to ever higher debt service costs. In panel (b) of Figure 9, I distinguish between a government’s overall deficit (in green) from its primary deficit (in blue). The primary deficit excludes debt service costs (in red) and represents the difference between program expenditures and total revenue. When a government runs a primary deficit, it is borrowing to fund not only certain government operations but also borrowing to cover interest on its previously issued debt. This leads to growing debt and interest costs. By 2040, interest costs will be 2.3 per cent of GDP – or over $22 billion per year. This is not a sustainable situation, as will be made more explicit in the next section.

18
I list various other budget metrics in Table 3. Health spending today is just over 40 per cent of the provincial budget, but this is set to rise to 47 per cent by 2040, and well over 50 per cent soon after. Federal transfers as a share of revenue, meanwhile, fall to 15 per cent by 2030, remaining there over time. Debt service costs grow from four per cent of total government revenue today to 9.5 per cent by 2030, to 17.6 per cent by 2040. So by 2040, nearly $1 in $5 flowing into government will be used to service debt and the stock of debt will approach four times annual revenue.
This debt level is large relative to Alberta’s past. By the end of the current fiscal year (2018/2019), Alberta’s net debt will exceed eight per cent of GDP. By 2040, I project this will increase to nearly 50 per cent. I plot the projected path of future debt against Alberta’s historical experience in Figure 10. Within a few years, Alberta is almost surely going to see debt levels above any point since the early 1940s. By the early 2030s, debt levels will exceed those seen during the Great Depression a century earlier when Alberta partially defaulted. Though much can change over the coming years, the province’s current fiscal path is concerning.
FIGURE 9 ALBERTA’S REVENUE, EXPENDITURES AND DEFICITS AS A SHARE OF GDP (2014-2040)
(a) Revenue and Expenditures
Total Revenue
Program Expenditures
Total Expenditures
13%
14%
15%
16%
17%
2015 2020 2025 2030 2035 2040
Sha
re o
f GD
P
Program expenditures excludes debt service costs. Non−resource revenue excludes royalties.
(b) Total and Primary Deficits and Debt Service Costs
Budget Balance Primary Balance
Debt Service Costs
−4%
−3%
−2%
−1%
0%
1%
2%
2015 2020 2025 2030 2035 2040
Sha
re o
f GD
P
Debt service costs are interest payments on government debt. The primary balance excludes debt service.

19
TABLE 3 VARIOUS BUDGET METRICS IN THE BASELINE PROJECTION
Today 2030 2040
As a Share of Alberta’s GDP
(1) Total Revenue 13.4 13.9 13.2
(2) Program Expenditures 15.2 14.7 14.9
(2 - 1) Primary Deficit 1.8 0.7 1.8
(3) Interest on Debt 0.5 1.3 2.3
(2 + 3 – 1) Total Budget Deficit 2.3 2.1 4.1
Net Debt 8.6 25.4 49.0
Gross Debt 15.2 31.0 53.4
Primary Deficit and Capital Borrowing 2.3 1.4 2.4
Non-Renewable Resource Revenue (NRRA) 12.4 11.9 11.4
Primary Deficit and Capital Borrowing, Less NRRA 3.4 3.5 4.2
Other Budget Metrics
Health as a Share of Program Expenditures 40.7 43.7 47.4
Federal Transfer as a Share of Revenue 17.2 14.8 15.0
Federal Transfer as a Share of Program Expenditures 15.1 14.0 13.3
Gross Debt as a Share of Revenue 113.2 222.3 405.5
Net Gross Debt as a Share of Revenue 63.7 180.8 367.4
Debt Service Costs as a Share of Revenue 4.0 9.5 17.6
Resource Revenue as a Share of Revenue 8.0 14.8 13.3
To be sure, not all the projected values to 2040 exceed what is currently found in other provinces today. Program expenditures relative to GDP will approach 15 per cent by 2040 while total revenue varies between 13 and 14 per cent over this same period – these revenue and expenditure levels are lower than any other province. This suggests scope to address the fiscal challenges on the revenue side is possible while still maintaining Alberta’s overall tax competitiveness. In addition, although the debt levels grow to historic levels for Alberta they are similar to Quebec’s level today.
FIGURE 10 NET DEBT TO GDP, 1905-2018 AND BASELINE PROJECTION TO 2040
Historic Data
BaselineProjection
−30%
−20%
−10%
0%
10%
20%
30%
40%
50%
1900 1920 1940 1960 1980 2000 2020 2040
Sha
re o
f GD
P
Displays the baseline projection for Alberta's net debt to GDP from 2018 to 2040 and historic data from 1905−2018.Source: Own calculations from Boothe (1995), Kneebone and Wilkins (2016), and the baseline budget projection.
20
Overall, this projection implies Alberta’s current fiscal path is not sustainable. The next section therefore explores the province’s long-run debt sustainability in a more rigorous way. It provides explicit measure of sustainability over different time horizons and quantifies what fiscal adjustments are necessary.
4 ALBERTA’S LONG-RUN DEBT SUSTAINABILITYA sustainable fiscal position is one where government does not pay interest on previously accumulated debt with further borrowing indefinitely. This requires government revenue to exceed what it spends on delivering public services; that is, it requires that government run sufficient primary surpluses to repay its past borrowing. This requirement that government not run a Ponzi scheme implies a number of useful metrics to evaluate long-run debt sustainability. I omit the algebra, but interested readers can find all relevant detail in the appendix. Though much depends on interest rates, economic growth rates and other factors, some intuition is useful.
Debt to GDP matters since if we require the government ensure, at some point in the future, that the present value of debt falls to zero – that is, if we require the government not to run a Ponzi scheme – then it turns out that government debt to GDP must remain below a ceiling and not grow forever. Ensuring government debt to GDP does not grow without bound is therefore critical for the sustainability of the government’s overall fiscal situation.
More intuitively, significant revenue comes from proportional taxes on income, household spending and other economic factors that depend on GDP. A region’s overall economic strength influences the extent to which a government can service debt. As an economy grows, its debt burden falls. Modest permanent deficits are therefore sustainable indefinitely, so long as they do not increase the stock of debt faster than the overall economy grows. For example, if Alberta’s long-run GDP growth is, say, 4.25 per cent, then a deficit equivalent to 4.25 per cent of its current debt stock will not change the debt to GDP ratio. In 2018, for example, Alberta’s nominal GDP is expected to increase 4.7 per cent. Its current net debt stock is roughly $20 billion. A deficit of just under $1 billion would therefore leave the net debt to GDP ratio unchanged.
Before proceeding to the analysis, however, some additional assumptions are necessary to project government revenue and expenditures beyond 2040.
On the revenue side, uncertainty in resource revenues becomes unmanageable. Global technological developments or environmental policy decisions, for example, could dramatically alter the path of Alberta oil production and prices. Indeed, the International Energy Agency’s World Energy Outlook 2017 models various scenarios for oil production and supply (to 2040) under various policy actions consistent with global climate goals. Its “Sustainable Development Scenario” projects North American oil production at nearly eight million barrels per day less in 2040 than its projection under current policy. Though it does not separately model Alberta, the province’s higher cost resources make it difficult to see rising Alberta production in such a scenario. Similar challenges exist for carbon tax revenues. Whatever the future holds, I take no position either way. Instead, from 2041 onwards, I combine royalties and carbon revenues into “Taxes and Other Revenue” and increase this with nominal GDP as before. This implicitly assumes future governments manage any decline in royalties or carbon tax revenues through offsetting changes in other taxes.
On the expenditure side, demographic projections from the Alberta government end in 2046. For health-care spending, I presume that spending growth increases gradually and smoothly declines to 4.3 per cent over the years to 2060. Health spending therefore remains a constant share of GDP after 2046. Specifically, it rises from 6.2 per cent of GDP today to 7.7 per cent by 2046. Education spending is similarly difficult to project without demographic forecasts beyond 2046. For the post-

21
2046 period, I presume education spending grows at a modest 3.1 per cent. This is consistent with spending growth in line with enrolment growth, plus inflation, plus 0.5 per cent for real wage growth.
With these additional assumptions, it is possible to estimate Alberta’s fiscal gaps and overall debt sustainability.
4.1 Estimating the Size of the Fiscal Challenge: The Fiscal Gap
Earlier, I found Alberta’s debt to GDP rises without bound. This is not sustainable and an increase in revenue or a decrease in spending is required. The magnitude of this required adjustment is a common and widely used measure in the public finance literature, and governments around the world know it as the “fiscal gap”. I provide the full algebra behind deriving and estimating this gap, but the intuition is simple. The fiscal gap is the immediate and permanent increase in revenue or decrease in spending required to achieve sustainable long-run finances. In addition, I express this measure to quantify the required adjustment to achieve various debt targets (notably, zero debt) at various points in the future.
To achieve zero net debt by 2040, Alberta revenue must immediately and permanently rise (or spending immediately and permanently fall) by 2.1 per cent of GDP relative to the baseline projection. To repay all outstanding debt by 2040 requires 2.3 per cent and to do so without resource royalties requires 4.2 per cent. I display these fiscal gap estimates, along with other scenarios and timelines, in Table 4 and illustrate the sensitivity and robustness of these estimates to alternative modelling assumptions in Table 5. Across a broad range of alternative models, the magnitude of the challenge remains large. Notably, even optimistic resource revenue growth is insufficient to ensure a sustainable fiscal future.
TABLE 4 ALBERTA FISCAL GAP ESTIMATES (AS A SHARE OF GDP)
Target Debt Level
Same Net Debt to GDP Ratio as in 2018/2019 Zero Net Debt Zero Debt
By 2040 1.76 2.14 2.33
By 2100 2.59 2.68 2.69
Permanent 2.71 2.71
By 2040, Excluding Non-Renewable Resource Revenue 3.62 4.00 4.19
Note: For the permanent fiscal gap, I assume the 2100 primary deficit as a share of GDP, interest rates and economic growth rates remains constant from that year forward. The permanent gap solves , where is 2100. See the appendix for further detail.
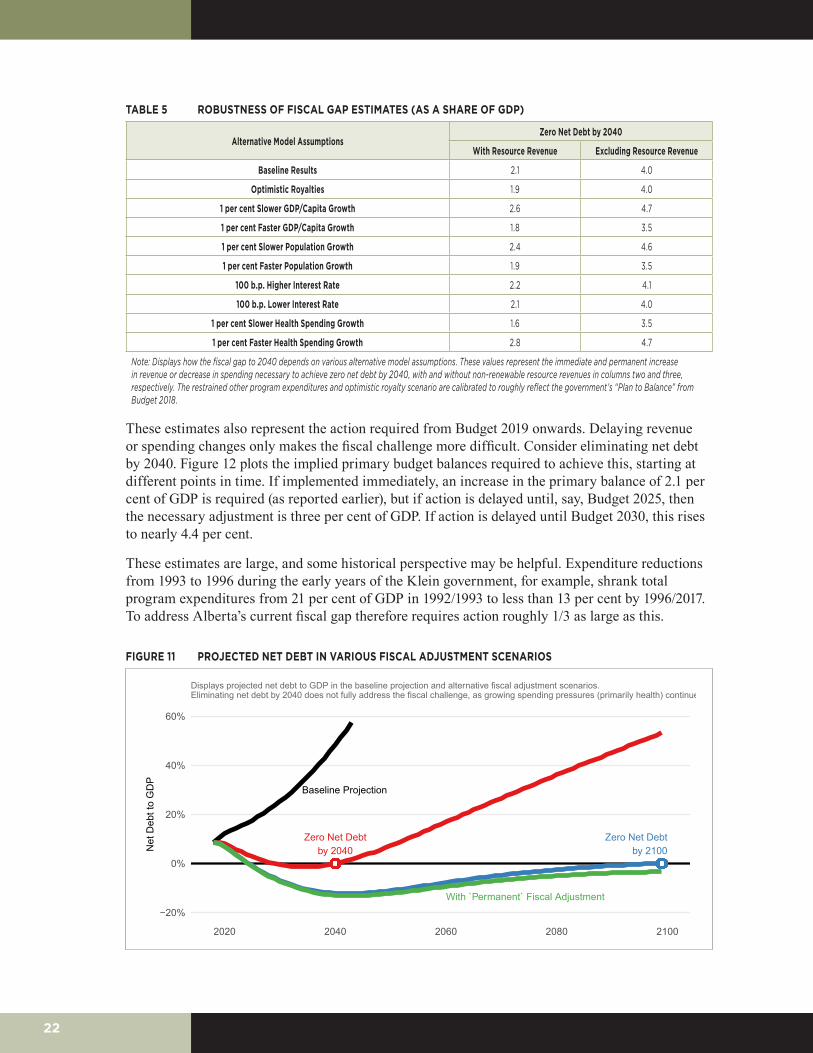
Of all these estimates, the very long-run estimates (to 2100 or for all time) are perhaps the most relevant. Eliminating debt by 2040, for example, does not guarantee sustainable long-term finances as the situation is set to worsen afterwards. That is, the job is incomplete. Many revenue components after 2040 do not keep pace with overall economic growth while health-care spending pressures remain. To see this, Figure 11 displays net debt ratios over time under the three fiscal adjustment scenarios. Fiscal adjustment sufficient to ensure Alberta’s long-term debt path is fully sustainable is therefore equivalent to the longer-horizon adjustments to 2100 and beyond. This requires a fiscal adjustment of approximately 2.7 per cent of GDP.
22
TABLE 5 ROBUSTNESS OF FISCAL GAP ESTIMATES (AS A SHARE OF GDP)
Alternative Model AssumptionsZero Net Debt by 2040
With Resource Revenue Excluding Resource Revenue
Baseline Results 2.1 4.0
Optimistic Royalties 1.9 4.0
1 per cent Slower GDP/Capita Growth 2.6 4.7
1 per cent Faster GDP/Capita Growth 1.8 3.5
1 per cent Slower Population Growth 2.4 4.6
1 per cent Faster Population Growth 1.9 3.5
100 b.p. Higher Interest Rate 2.2 4.1
100 b.p. Lower Interest Rate 2.1 4.0
1 per cent Slower Health Spending Growth 1.6 3.5
1 per cent Faster Health Spending Growth 2.8 4.7
Note: Displays how the fiscal gap to 2040 depends on various alternative model assumptions. These values represent the immediate and permanent increase in revenue or decrease in spending necessary to achieve zero net debt by 2040, with and without non-renewable resource revenues in columns two and three, respectively. The restrained other program expenditures and optimistic royalty scenario are calibrated to roughly reflect the government’s “Plan to Balance” from Budget 2018.
These estimates also represent the action required from Budget 2019 onwards. Delaying revenue or spending changes only makes the fiscal challenge more difficult. Consider eliminating net debt by 2040. Figure 12 plots the implied primary budget balances required to achieve this, starting at different points in time. If implemented immediately, an increase in the primary balance of 2.1 per cent of GDP is required (as reported earlier), but if action is delayed until, say, Budget 2025, then the necessary adjustment is three per cent of GDP. If action is delayed until Budget 2030, this rises to nearly 4.4 per cent.
These estimates are large, and some historical perspective may be helpful. Expenditure reductions from 1993 to 1996 during the early years of the Klein government, for example, shrank total program expenditures from 21 per cent of GDP in 1992/1993 to less than 13 per cent by 1996/2017. To address Alberta’s current fiscal gap therefore requires action roughly 1/3 as large as this.
FIGURE 11 PROJECTED NET DEBT IN VARIOUS FISCAL ADJUSTMENT SCENARIOS
●●●●●●●●●●●●●●●●●●●●●●●●●●●●●●●●●●●●●●●●●●●●●●●●●●●●●●●●●●●●●●●●●●●●●●●●●●●●●●●●●●●●●●●●●●●●●●●●●●●●●●●●●●●●●●●●●●●●●●●●●●●●●●●●●●●●●●●●●●●●●●●●●●●●●●●●●●●●●●●●●●●●●●●●●●●●●●●●●●●●●●●●●●●●●●●●●●●●●●●●●●●●●●●●●●●●●●●●●●●●●●●●●●●●●●●●●●●●●●●●●●●●●●●●●●●●●●●●●●●●●●●●●●●●●●●●●●●●●●●●●●●●●●●●●●●●●●●●●●●●●●●●●●●●●●●●●●●●●●●●●●●●●●●●●●●●●●●●●●●●●●●●●●●●●●●●●●●●●●●●●●●●●●●●●●●●●●●●●●●●●●●●●●●●●●●●●●●●●●●●●●●●●●●●●●●●●●●●●●●●●●●●●●●●●●●●●●●●●●●●●●●●●●●●●●●●●●●●●●●●●●●●●●●●●●●●●●●●●●●●●●●●●●●●●●●● ●●●●●●●●●●●●●●●●●●●●●●●●●●●●●●●●●●●●●●●●●●●●●●●●●●●●●●●●●●●●●●●●●●●●●●●●●●●●●●●●●●●●●●●●●●●●●●●●●●●●●●●●●●●●●●●●●●●●●●●●●●●●●●●●●●●●●●●●●●●●●●●●●●●●●●●●●●●●●●●●●●●●●●●●●●●●●●●●●●●●●●●●●●●●●●●●●●●●●●●●●●●●●●●●●●●●●●●●●●●●●●●●●●●●●●●●●●●●●●●●●●●●●●●●●●●●●●●●●●●●●●●●●●●●●●●●●●●●●●●●●●●●●●●●●●●●●●●●●●●●●●●●●●●●●●●●●●●●●●●●●●●●●●●●●●●●●●●●●●●●●●●●●●●●●●●●●●●●●●●●●●●●●●●●●●●●●●●●●●●●●●●●●●●●●●●●●●●●●●●●●●●●●●●●●●●●●●●●●●●●●●●●●●●●●●●●●●●●●●●●●●●●●●●●●●●●●●●●●●●●●●●●●●●●●●●●●●●●●●●●●●●●●●●●●●●●
Zero Net Debtby 2040
Zero Net Debtby 2100
With `Permanent` Fiscal Adjustment
Baseline Projection
−20%
0%
20%
40%
60%
2020 2040 2060 2080 2100
Net
Deb
t to
GD
P
Displays projected net debt to GDP in the baseline projection and alternative fiscal adjustment scenarios.Eliminating net debt by 2040 does not fully address the fiscal challenge, as growing spending pressures (primarily health) continue.

23
FIGURE 12 DELAYING FISCAL ADJUSTMENT INCREASES IT IN THE FUTURE
●●●●●●●●●●●●●●●●●●●●●●●●●●●●●●●●●●●●●●●●●●●●●●●●●
●●●●●●●●●●●●●●●●●●●●●●●●●●●●●●●●●●●●●●●●●●●●●●●●●
●●●●●●●●●●●●●●●●●●●●●●●●●●●●●●●●●●●●●●●●●●●●●●●●●
Baseline Primary Balance
Implement Adjustmentin Budget 2019
... or Budget 2025... or Budget 2030
−2%
0%
2%
4%
2015 2020 2025 2030 2035 2040
Sha
re o
f GD
PDisplays various alternative primary balances to achieve zero net debt by 2040, but with adjustment starting at different times.
It may also be helpful to convert these estimates into terms related to tax or spending changes. To have the same net debt to GDP ratio by 2040 as Alberta has in 2018/2019, for example, requires a permanent increase in revenue equivalent to roughly $6.5 billion in 2019, increasing with overall GDP growth form then onwards. That is equivalent to a permanent increase in personal income taxes of 50 per cent, or an increase in all taxes and levies of over one-quarter. In terms of sales taxes, each one per cent rate of HST is roughly equivalent to $1 billion in government revenue or 0.3 per cent of GDP. So to achieve the same net debt to GDP ratio in 2040 as Alberta has in 2018, fiscal adjustment equivalent to a sales tax of six per cent is required in Budget 2019 onwards. To eliminate debt by 2040 requires a provincial sales tax rate of eight per cent, and to address the full fiscal gap requires a 10 per cent rate. On the spending side, the implied spending reductions to eliminate net debt by 2040 are roughly equivalent to the entire advanced education ministry, 1/3 of the health ministry, or over 10 per cent of all program expenditures. To eliminate the fiscal gap to 2100 requires roughly $1 in every $6 in program expenditures be cut. This is larger than the budget of every single government ministry with the single exception of health.
Of course, nothing about the measured fiscal gaps above suggests an immediate, permanent and constant fiscal adjustment as a share of GDP is optimal. There are many options to achieve sustainable finances, but all involve lower spending growth, higher revenue growth or some combination of the two. In the next section, I present various concrete options.
4.2 Closing the Fiscal Gap
While not an exhaustive list by any means, Table 6 displays a range of potential concrete policy actions available. I report the effect of each in terms of share of GDP, for comparability with the fiscal gaps described earlier, and for the period starting with Budget 2019 and ending in 2040.
On the revenue side, increasing carbon prices beyond 2022 and using the proceeds to offset the deficit is one possibility. Here, I simulate a carbon tax rising at five per cent per year. A five per cent per year increase in carbon revenue may be consistent with, for example, a gradually rising price to $200 per tonne by 2040, with a price elasticity of emissions of roughly 1/3. In this case, the fiscal gap in 2040 falls by 0.2. This only makes a small dent. If carbon tax increases aren’t in the card, increasing personal income taxes by 10 per cent across the board shrinks the fiscal gap by 0.3. This

24
is also small relative to the entire fiscal gap. An eight per cent sales tax or a 35 per cent increase in all current taxes and levies are still insufficient to eliminate the entire fiscal gap of 2.7 per cent of GDP. If we look only to the revenue side of the equation, only broad and large increases make meaningful reductions in the fiscal gap.
To be sure, Alberta is not alone in facing a difficult fiscal future and there may be scope for increases in federal transfers. With health care as a provincial jurisdiction, and populations aging nationwide, many other provinces will face challenges. The PBO has long highlighted the difference in long-term fiscal health between the federal government and the provinces, with the former faring much better than the latter. Future provincial governments may consequently succeed at negotiating for higher transfers. If federal transfers grow at, say, five per cent instead of the current growth rate closer to four per cent, Alberta’s fiscal gap falls slightly by 0.3 per cent. If transfers grow at six per cent, which prevailed for CHT for many years after the September 2004 “Plan to Strengthen Health Care”, then the fiscal gap falls by 0.6 per cent of GDP. These help, but are modest. Alberta must therefore address its own fiscal challenges, as dramatic increases in transfers from the federal government are unlikely.
TABLE 6 ILLUSTRATING THE MAGNITUDE OF VARIOUS FISCAL OPTIONS
Fiscal Option (Budget 2019 Onward) Share of GDP
Revenue Measures
5 per cent Growth in Federal Transfers 0.3
6 per cent Growth in Federal Transfers 0.6
5 per cent Carbon Tax Revenue Growth 0.2
Implement 5 per cent Sales Tax 1.3
Implement 8 per cent Sales Tax 2.1
Increase in Personal Income Tax by 10 per cent 0.3
Increase in Personal Income Tax by 25 per cent 0.8
Increase All Taxes and Levies by 10 per cent 0.6
Increase All Taxes and Levies by 1/3 2.0
Increase All Taxes and Levies by 2/3 4.1
Spending Measures
Real per Patient Freeze in Health-Care Spending 0.4
Real per Capita Freeze in Health-Care Spending 1.0
Real per Pupil Freeze in Education 0.2
Real per Capita Freeze in Other Program Expenditures 0.3
2 per cent Other Program Expenditure Growth 1.2
Freeze in Other Program Expenditure Growth 1.5
Real Per Capita Freeze in Program Expenditures 1.4
2 per cent Growth in Program Expenditures 3.3
1 per cent Growth in Program Expenditures 3.9
On the spending side, if health care, education and all other program expenditures grow only with inflation and population, then the fiscal gap falls by 1.4. Though not sufficient to eliminate net debt by 2040, it bends the curve: peaking at just over 15 per cent of GDP and falling to 11 per cent by 2040. This is dramatic. But holding expenditures roughly fixed in real per capita terms will, given current GDP growth forecasts, result in a decline in the government expenditures share of GDP from its current 16.0 per cent to 11.6 per cent by 2040. This is far lower than any other province and hasn’t been seen in Alberta since the late 1950s. To eliminate the net debt by 2040 and nearly

25
eliminate our dependence on resource revenues, total program expenditures would have to grow by only one per cent annually. This measure is worth roughly 3.9 per cent of GDP between now and 2040. But in this case, program expenditures would be only seven per cent of GDP and the inflation-adjusted per capita program expenditures would be 40 per cent below today’s level. In short, Alberta’s fiscal gap is so large that gradual measures to close it over the next two decades may not be feasible if we look only to spending.
FIGURE 13 NET DEBT IN BASELINE VS. A MIX OF SCENARIOS
Baseline Projection
Restrained Spending
Restrained Spending +Modest New Revenues
0%
10%
20%
30%
40%
50%
2015 2020 2025 2030 2035 2040
Sha
re o
f GD
P
Restrained spending is a real per patient freeze in healthcare spending, a real per pupil freeze in education spending, and a realper capita freeze in other program spending. New revenues are a 5 per cent growth in carbon revenue and a 3 per cent sales tax.
Individually, most of the above options fall short. And to close the entire fiscal gap on the spending or the revenue side of the ledger alone may be difficult. Instead, a mix of the above may be the best route forward. Consider increasing the carbon tax by five per cent per year beyond 2022 (putting the proceeds towards general revenue) and introducing a modest three per cent sales tax. These two measures combine to close roughly half the gap. Total revenue as a share of GDP will average 14.7 per cent over the period. Though higher than current levels, it is comparable to the revenue to GDP ratio in the early to mid-2000s. Alberta would still have the lowest revenue to GDP of any province in Canada. In addition, consider serious spending restraint across the board with a real per pupil freeze in education, a real per patient freeze in health care and a real per capita freeze in other program expenditures. These measures mean program expenditures as a share of GDP will decline to 12.5 per cent, a level comparable to 1997 after the spending cuts in the early Klein years, and lower than any province by far. This almost closes the remainder of the fiscal gap that the revenue measures did not. I plot the path of net debt under this policy package in Figure 13.
Importantly, without new revenues, even the significant spending restraint implied here is insufficient to stabilize net debt to GDP by 2040. The conclusion here is simple: substantial spending restraint alone is insufficient to close Alberta’s fiscal gap. Entertaining new revenue sources or using carbon tax revenue to address long-run debt sustainability are an important part of the policy mix we should consider. Cancelling the carbon tax and forgoing these revenues, without a clear plan to raise other revenues or achieve spending reductions to compensate, is to exacerbate Alberta’s already unsustainable fiscal situation.
None of this suggests there aren’t meaningful savings to be found. For instance, Alberta currently spends more on health care than any other province by far when adjusting for differences in age and gender across provinces. To see this, consider Figure 14. I construct the weighted average health spending by province using population shares by age and gender for Canada as a whole to

26
weight the age-specific spending levels in each province. These are large differences. If Alberta were to match B.C., Ontario or Quebec, for example, total government spending would decline by well over $6.5 billion – which is a large majority of the fiscal gap to 2040. If it matched the other prairie provinces of Saskatchewan or Manitoba, spending would decline over $3 billion. Given the sheer magnitude of health-care spending and its future growth, this should be a priority. And if savings are found through innovations in delivery, fee setting or procurement, for example, there is less risk of constraining access or restricting services.
FIGURE 14 HEALTH SPENDING PER CAPITA, ACTUAL VS. ADJUSTED (2015)
$0
$1,000
$2,000
$3,000
$4,000
$5,000
$6,000
BC AB SK MB ON QC NB NS PE NL
Dol
lars
per
Cap
ita
Actual Health Spending Adjusted for Age/Gender Differences
Based on provincial/territorial government health expenditures only
Note: Aggregates age/gender specific spending by province from CIHI Open Data Table O.2, using Canada−wide population shares.Source: Canadian Institute for Health Information, National Health Expenditure Trends 1975−2017.
4.3 Implications of Resource Revenue Volatility
No discussion of Alberta’s fiscal sustainability is complete without examining the implications of volatile oil and gas royalty revenues. The baseline projections are abstracted from this.
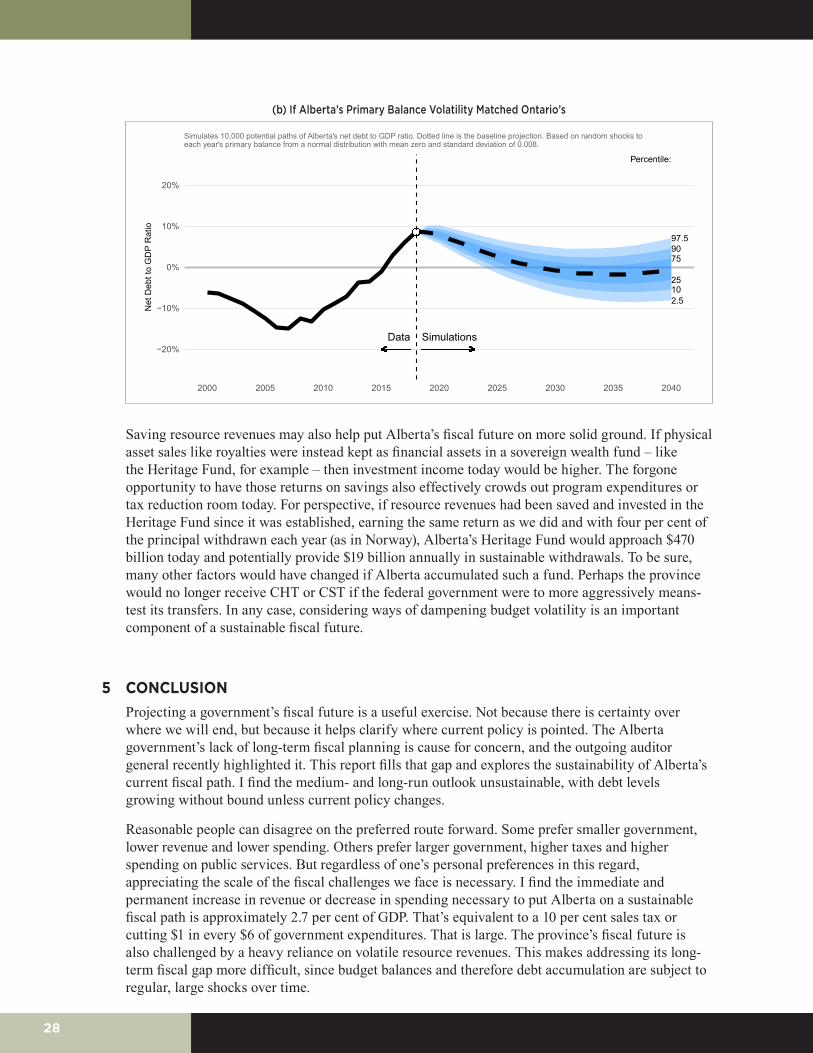
To illustrate the potentially large range of future debt levels, consider an alternative model that incorporates random shocks to Alberta’s budget balance each year. I again relegate the algebra to the appendix, but the intuition is straightforward. Debt will rise according to the projected primary balance and interest costs on prior debt (net of economic growth), as before, but a random shock will lead some years to accumulate more or less debt than originally projected. This cascades from one year to the next as new shocks arrive. In Alberta’s case, these shocks are largely due to positive or negative changes in non-renewable resource revenues. To match data, I consider the shocks as normally distributed with a standard deviation of 2.2 per cent of GDP to match the standard deviation of changes in Alberta’s primary budget balance to GDP ratio observed since 1980. I simulate the above along with a fiscal adjustment necessary to eliminate net debt by 2040 in the baseline scenario. Figure 15 displays the results.
The results are stark. Despite addressing the fiscal gap immediately in Budget 2019 onwards, the range of potential future debt outcomes is large. Roughly speaking, there is a 50 per cent chance of the debt to GDP ratio falling within a range of plus or minus seven per cent of GDP. Put another way, Alberta’s 2040 debt level is projected to be zero per cent of GDP, plus or minus 21 per cent of GDP 19 times out of 20. There’s a 20 per cent chance that the net debt to GDP ratio in 2040 will exceed that in 2018/2019 and a non-trivial 10 per cent chance the 2040 debt level exceeds 13 per cent of GDP, despite the aggressive and immediate fiscal adjustment. Greater certainty

27
of eliminating the net debt by 2040 requires greater fiscal adjustment today. To achieve a 75 per cent chance, the adjustment must be 2.5 per cent of GDP in Budget 2019. To achieve a 90 per cent chance, the adjustment must be 2.8 per cent.
The type of fiscal adjustment governments choose affects future volatility. If the current tax mix and royalty revenue dependence remain unaltered, there’s little reason to suspect volatility will fall. If Alberta not only addresses its fiscal gap but also enacts tax and royalty reform that dampens its budget volatility, the range of potential future outcomes becomes more predictable. In panel (b) of Figure 15, I plot the same fiscal adjustment scenario but where Alberta’s primary balance volatility is set to match Ontario’s. The range is significantly smaller. There is now a 50 per cent chance of falling within a range from -2.5 to +2.5 per cent by 2040.
Just as there are various options to close the fiscal gap, so too are there various routes to dampen our exposure to a volatile revenue source like resource royalties. One option for reform is broad tax reform to save more resource revenues and replace that lost revenue with a more stable source, such as a sales tax. In some sense, saving resource revenues is natural. Royalties are not income in the typical sense, as they represent an asset sale. Natural resources are owned by Albertans, and royalties are our share of the value of those resources extracted on our behalf by private companies. Those resources have value even before they are extracted, so royalties are merely a transformation of a physical asset to a financial one.
FIGURE 15 RANGE OF OUTCOMES WITH FISCAL ADJUSTMENT SUFFICIENT TO ELIMINATE BASELINE PROJECTED NET DEBT BY 2040
(a) Baseline Projection, Based on Alberta’s Actual Historic Volatility
●●●●●●●●●●●●●●●●●●●●●●●●●●●●●●●●●●●●●●●●●●●●●●●●●●●●●●●●●●●●●●●●●●●●●●●●●●●●●●●●●●
10
25
75
90
97.5
2.5
Percentile:
Data Simulations−20%
−10%
0%
10%
20%
2000 2005 2010 2015 2020 2025 2030 2035 2040
Net
Deb
t to
GD
P R
atio
Simulates 10,000 potential paths of Alberta's net debt to GDP ratio. Dotted line is the baseline projection. Based on random shocks toeach year's primary balance from a normal distribution with mean zero and standard deviation of 0.022.
28
(b) If Alberta’s Primary Balance Volatility Matched Ontario’s
●●●●●●●●●●●●●●●●●●●●●●●●●●●●●●●●●●●●●●●●●●●●●●●●●●●●●●●●●●●●●●●●●●●●●●●●●●●●●●●●●●
1025
759097.5
2.5
Percentile:
Data Simulations−20%
−10%
0%
10%
20%
2000 2005 2010 2015 2020 2025 2030 2035 2040
Net
Deb
t to
GD
P R
atio
Simulates 10,000 potential paths of Alberta's net debt to GDP ratio. Dotted line is the baseline projection. Based on random shocks toeach year's primary balance from a normal distribution with mean zero and standard deviation of 0.008.
Saving resource revenues may also help put Alberta’s fiscal future on more solid ground. If physical asset sales like royalties were instead kept as financial assets in a sovereign wealth fund – like the Heritage Fund, for example – then investment income today would be higher. The forgone opportunity to have those returns on savings also effectively crowds out program expenditures or tax reduction room today. For perspective, if resource revenues had been saved and invested in the Heritage Fund since it was established, earning the same return as we did and with four per cent of the principal withdrawn each year (as in Norway), Alberta’s Heritage Fund would approach $470 billion today and potentially provide $19 billion annually in sustainable withdrawals. To be sure, many other factors would have changed if Alberta accumulated such a fund. Perhaps the province would no longer receive CHT or CST if the federal government were to more aggressively means-test its transfers. In any case, considering ways of dampening budget volatility is an important component of a sustainable fiscal future.
5 CONCLUSIONProjecting a government’s fiscal future is a useful exercise. Not because there is certainty over where we will end, but because it helps clarify where current policy is pointed. The Alberta government’s lack of long-term fiscal planning is cause for concern, and the outgoing auditor general recently highlighted it. This report fills that gap and explores the sustainability of Alberta’s current fiscal path. I find the medium- and long-run outlook unsustainable, with debt levels growing without bound unless current policy changes.
Reasonable people can disagree on the preferred route forward. Some prefer smaller government, lower revenue and lower spending. Others prefer larger government, higher taxes and higher spending on public services. But regardless of one’s personal preferences in this regard, appreciating the scale of the fiscal challenges we face is necessary. I find the immediate and permanent increase in revenue or decrease in spending necessary to put Alberta on a sustainable fiscal path is approximately 2.7 per cent of GDP. That’s equivalent to a 10 per cent sales tax or cutting $1 in every $6 of government expenditures. That is large. The province’s fiscal future is also challenged by a heavy reliance on volatile resource revenues. This makes addressing its long-term fiscal gap more difficult, since budget balances and therefore debt accumulation are subject to regular, large shocks over time.
29
But if meaningful policy choices are made today, Alberta’s fiscal gap is manageable and can be eliminated over a reasonable time horizon without unsustainable debt levels accumulating in the meantime. But the longer we wait, the more difficult this challenge becomes. A balanced approach of increased revenues and reduced spending growth is perhaps the best route forward, rather than relying solely on raising taxes or restraining spending. I present such a path in the “restrained spending and modest new revenue” scenario explored in Section 4. Albertans should soberly consider broader tax reform that includes saving more of the province’s resource revenues and introducing a provincial sales tax to make up the difference (and more). We should also consider using carbon tax revenues to shrink the deficit. On the spending side, Albertans and their government should also consider, just as soberly, opportunities to decrease spending where benefits may not be worth the costs or improving the efficiency with which public services are delivered. In particular, we should explore innovations in health-care delivery, perhaps including private provision or competitive procurement within the public system.
Regardless of the precise path forward, good evidence and analysis are necessary. Significantly more detailed work than this report is required on a regular basis. Government should heed the auditor general’s advice and begin regular, public evaluations of Alberta’s long-term fiscal future. In doing so, it should construct a set of clear, consistent and comprehensive measures of its long-run fiscal gaps. It should report these measures regularly, and set clear and measurable objectives for short-, medium- and long-term improvements. And, perhaps most important, it should be open to Albertans about the scale of the challenge ahead and the potential options available. To lead a discussion and debate involving stakeholders from across Alberta to gain consensus for sustained action over time will not be easy, especially in today’s difficult political climate. But, to again quote the auditor general, it is the right thing to do.
As the opening quotation of this paper makes plain, failing to plan is planning to fail. To date, Alberta has kicked its fiscal can down the road. Politicians blame one another and remain focused on short-term electoral gains. We can do better. We must.

30
REFERENCESAuditor General of Alberta. 2018. “Putting Alberta’s Financial Future in Focus,” A Commentary by
the Auditor General, April. Available at https://www.oag.ab.ca/webfiles/reports/April2018_OAG_Commentary.pdf
Boothe, Paul. 1995. “The Growth of Government Spending in Alberta,” The Canadian Tax Foundation.
Canadian Institute for Health Information. 2011. “Healthcare Cost Drivers: The Facts.” Available at https://secure.cihi.ca/free_products/health_care_cost_drivers_the_facts_en.pdf
Conference Board of Canada. 2018. Canadian Outlook Long-Term Economic Forecast 2018, Ottawa: The Conference Board of Canada.
Escoano, Julio. 2010. “A Practice Guide to Public Debt Dynamics, Fiscal Sustainability, and Cyclical Adjustment of Budgetary Aggregates,” IMF Technical Notes and Manuals 10/02, Fiscal Affairs Department, January.
Grignon, Michel, Byron Spencer, and Li Wang. 2018. “Model of Long-Term Health Care Cost Trends in Canada,” Social of Actuaries and Canadian Institute of Actuaries, Document 218034. March. Available at https://www.cia-ica.ca/docs/default-source/2018/218034e.pdf
Kneebone, Ronald, and Margarita Wilkins. 2016. “Canadian Provincial Government Budget Data, 1908/81 to 2013/14,” Canadian Public Policy 42 (1): 1-19, March.
National Energy Board. 2017. Canada’s Energy Future 2017: Energy Supply and Demand Projections to 2040, Ottawa: The National Energy Board.
Parliamentary Budget Office (PBO). 2018. Fiscal Sustainability Report 2018, Ottawa, Canada: Office of the Parliamentary Budget Officer, September.

31
APPENDIX – THE ALGEBRA OF DEBT SUSTAINABILITYIn this appendix, I describe the key debt dynamics equations used in the analysis. In the main paper, I adopt the conventions of accrual accounting methods and exclude – as the government’s budget does – capital investments from immediate expenses and instead gradually amortize those over time. Such investment spending still has balance sheet implications, however, and affects debt accumulation from one period to the next. Specifically, if the accrual primary balance is �̃�𝑝 then the cash primary balance is 𝑝𝑝 = �̃�𝑝 + 𝑎𝑎 , where a are all the adjustment terms to move between cash and accrual accounting, such as expensing capital investments in the period in which they occur and removing amortization expenses from the cash accounts. In what follows, to simplify the exposition, all variables should be interpreted on a cash accounting basis.
To begin, governments have budget constraints such that a government’s current debt must be balanced against future surpluses (and any interest costs or new borrowings incurred along the way). If d0 is the current debt to GDP ratio and pt the primary surplus (in a cash accounting sense) in year t then the budget constraint requires
𝑑𝑑0 = ∑ 𝑝𝑝𝑡𝑡𝛼𝛼𝑡𝑡
∞
𝑡𝑡=1 ,
where 𝜆𝜆𝑡𝑡 = (𝑖𝑖𝑡𝑡 − 𝑔𝑔𝑡𝑡)/(1 + 𝑔𝑔𝑡𝑡) is the borrowing rate it net of economic growth gt and 𝛼𝛼𝑡𝑡 ≡ ∏ (1 + 𝜆𝜆𝑖𝑖)𝑡𝑡
𝑖𝑖=1 discounts future values at time t to today (s=0). Put simply, this equation says debt today (on the left) is perfectly matched by future budget balances (on the right).
Perhaps more intuitively, one may consider the present value of future primary balances ∑ 𝑝𝑝𝑡𝑡/𝛼𝛼𝑡𝑡∞𝑡𝑡=1 as a stock today. If future spending is greater than future revenue, then this is
equivalent to holding debt today. For Alberta, the implicit obligations to 2040 are equivalent to 37 per cent of GDP today. The relatively small current level of explicit debt masks the larger fiscal challenge ahead.
Why focus on debt to GDP ratios rather than raw dollars? The intuition was provided in the main text. More formally, debt to GDP matters since if we require the government to ensure, at some point in the future, that the present value of debt falls to zero – that is, if we require the government not to run a Ponzi scheme – then it turns out that government debt to GDP will remain below a ceiling and not grow forever. Conveniently, this also implies the government’s intertemporal budget constraint is satisfied.6 Ensuring government debt to GDP does not grow without bound is therefore critical for the sustainability of the government’s overall fiscal situation.
How does government debt evolve over time? Yesterday’s debt dt-1 grows with interest (net of economic growth) but shrinks with primary surpluses pt, so
𝑑𝑑𝑡𝑡 = (1 + 𝜆𝜆𝑡𝑡)𝑑𝑑𝑡𝑡−1 − 𝑝𝑝𝑡𝑡.
Iterating this from one year to the next, future debt to GDP at any future point T is then
𝑑𝑑𝑇𝑇 = 𝑑𝑑0𝛼𝛼𝑇𝑇 −∑𝑝𝑝𝑡𝑡𝛼𝛼𝑇𝑇𝛼𝛼𝑡𝑡
𝑇𝑇
𝑡𝑡=1.
6 Formally, with constant interest rates and economic growth rates, if i > g and 𝑝𝑝𝑡𝑡 ≤ 𝑀𝑀 for all t then lim𝑇𝑇→∞
(1 + 𝜆𝜆)−1𝑑𝑑𝑇𝑇 = 0 implies 𝑑𝑑𝑡𝑡 ≤ 𝐻𝐻 for all t. If, in addition, −𝐽𝐽 ≤ 𝑑𝑑𝑡𝑡 ≤ 𝐽𝐽 for all t then the reverse also holds. For a proof of this proposition, see Escolano (2010).

32
This expression contains most of the intuition that follows throughout the paper.7 It says debt tomorrow equals debt today that accumulates over time due to interest costs (net of economic growth) and any accumulated primary imbalances pt that add or subtract from future debt.
The fiscal gap is a measure of by how much primary balances must change to repay future debt (dT = 0). That is, it solves for the constant fT such that
∑𝑝𝑝𝑡𝑡 + 𝑓𝑓𝑇𝑇𝛼𝛼𝑡𝑡
𝑇𝑇
𝑡𝑡=1= 𝑑𝑑0.
A weaker goal to achieve some target debt level dT by 2040 implies a smaller fT that solves
∑𝑝𝑝𝑇𝑇 + 𝑓𝑓𝑇𝑇𝛼𝛼𝑡𝑡
𝑇𝑇
𝑡𝑡=1= 𝑑𝑑0 −
�̃�𝑑𝑇𝑇𝛼𝛼𝑇𝑇.
Whatever the target, the value fT is highly informative. It reveals by how much revenue must rise, or by how much spending must fall, in order to make a government’s current fiscal situation sustainable. It equivalently reveals what immediate and permanent action is required to repay government debt or achieve some target future debt level.
This measure is also used extensively in practice. The European Commission, for example, estimates 𝑓𝑓∞ as their “S2 Indicator” of debt sustainability. Critically, this measure is not a recommendation nor is an immediate and permanent adjustment necessarily optimal. There are countless possible routes to satisfy the intertemporal budget constraint. The fiscal gap is simply a transparent benchmark to quantify the magnitude of the imbalance. Any path with similar present values is as good at satisfying the intertemporal budget constraint as any other.
To model volatility, consider an alternative model such that (net) debt to GDP evolves as
𝑑𝑑𝑡𝑡 = (1 + 𝜆𝜆𝑡𝑡)𝑑𝑑𝑡𝑡−1 − 𝑝𝑝𝑡𝑡 + 𝜖𝜖𝑡𝑡,
which is as before but for a new a random component 𝜖𝜖𝑡𝑡 to capture unexpected budget developments that, in Alberta’s case, are dominated by positive or negative changes in non-renewable resource revenues. I model 𝜖𝜖𝑡𝑡~𝑁𝑁(0, 𝜎𝜎2) where 𝜎𝜎 is set at 2.2 per cent to match the standard deviation of changes in Alberta’s primary budget balance to GDP ratio since 1980.
7 For simplicity, I omit from the expressions changes in debt due to factors other than the primary balance but I include them in the analysis. These include borrowing for capital projects, inflation-proofing various savings funds, and other near-term adjustments contained within Budget 2018.

33
About the Author
Dr. Tombe is an associate professor of economics at the University of Calgary and a research fellow at The School of Public Policy. Prior to joining the University of Calgary, he was an assistant professor of economics at Wilfrid Laurier University. His research focuses on a broad range of topics from international trade and public finance to energy and environmental policy. His current work focuses on economic integration in Canada, from estimating the size and consequences of interprovincial trade costs to exploring the implications of fiscal transfers between provinces (such as through equalization). In addition to his academic work, he regularly promotes the public understanding of economics and policy issues through numerous public policy papers, active social media presence and general interest writings in various media outlets.

34
ABOUT THE SCHOOL OF PUBLIC POLICY
The School of Public Policy has become the flagship school of its kind in Canada by providing a practical, global and focused perspective on public policy analysis and practice in areas of energy and environmental policy, international policy and economic and social policy that is unique in Canada.
The mission of The School of Public Policy is to strengthen Canada’s public service, institutions and economic performance for the betterment of our families, communities and country. We do this by:
• Building capacity in Government through the formal training of public servants in degree and non-degree programs, giving the people charged with making public policy work for Canada the hands-on expertise to represent our vital interests both here and abroad;
• Improving Public Policy Discourse outside Government through executive and strategic assessment programs, building a stronger understanding of what makes public policy work for those outside of the public sector and helps everyday Canadians make informed decisions on the politics that will shape their futures;
• Providing a Global Perspective on Public Policy Research through international collaborations, education, and community outreach programs, bringing global best practices to bear on Canadian public policy, resulting in decisions that benefit all people for the long term, not a few people for the short term.
The School of Public Policy relies on industry experts and practitioners, as well as academics, to conduct research in their areas of expertise. Using experts and practitioners is what makes our research especially relevant and applicable. Authors may produce research in an area which they have a personal or professional stake. That is why The School subjects all Research Papers to a double anonymous peer review. Then, once reviewers comments have been reflected, the work is reviewed again by one of our Scientific Directors to ensure the accuracy and validity of analysis and data.
The School of Public PolicyUniversity of Calgary, Downtown Campus906 8th Avenue S.W., 5th FloorCalgary, Alberta T2P 1H9Phone: 403 210 3802
DISTRIBUTIONOur publications are available online at www.policyschool.ca.
DISCLAIMERThe opinions expressed in these publications are the authors' alone and therefore do not necessarily reflect the opinions of the supporters, staff, or boards of The School of Public Policy.
COPYRIGHTCopyright © Tombe 2018. This is an open-access paper distributed under the terms of the Creative Commons license CC BY-NC 4.0, which allows non-commercial sharing and redistribution so long as the original author and publisher are credited.
ISSNISSN 2560-8312 The School of Public Policy Publications (Print) ISSN 2560-8320 The School of Public Policy Publications (Online)
DATE OF ISSUENovember 2018
MEDIA INQUIRIES AND INFORMATIONFor media inquiries, please contact Morten Paulsen at 403-220-2540. Our web site, www.policyschool.ca, contains more information about The School's events, publications, and staff.
DEVELOPMENTFor information about contributing to The School of Public Policy, please contact Sharon deBoer-Fyie by telephone at 403-220-4624 or by e-mail at [email protected].

35
RECENT PUBLICATIONS BY THE SCHOOL OF PUBLIC POLICY
THE PROS AND CONS OF CARBON TAXES AND CAP-AND-TRADE SYSTEMShttps://www.policyschool.ca/wp-content/uploads/2018/11/Carbon-Pricing-Wood.pdfJoel Wood | November 2018
ENERGY AND ENVIRONMENTAL POLICY TRENDS: CARBON REBATES UNLIKELY TO UNDERMINE INCENTIVEShttps://www.policyschool.ca/wp-content/uploads/2018/11/Energy-Prices-and-Rebates-EEP-Trends-Nov-2018.pdfG. Kent Fellows, Trevor Tombe and Brendan Boyd | November 2018
HOUSING, HOMELESSNESS AND POVERTYhttps://www.policyschool.ca/wp-content/uploads/2018/10/Homelessness-Kneebone.pdfRonald Kneebone | November 2018
SOCIAL POLICY TRENDS: MONTHLY RENT PAYMENTS IN THE TWENTY LARGEST CANADIAN CENSUS METROPOLITAN AREAS (2017)https://www.policyschool.ca/wp-content/uploads/2018/10/Social-Policy-Trends-Canada-Rents-October-2018.pdfMargarita Wilkins and Ronald Kneebone | October 2018
ASSESSING POLICY SUPPORT FOR EMISSIONS-INTENSIVE AND TRADE-EXPOSED INDUSTRIEShttps://www.policyschool.ca/wp-content/uploads/2018/10/Assessing-EITE-Policy-Winter-Dobson.pdfSarah Dobson and Jennifer Winter | October 2018
TAX POLICY TRENDS: CANADIAN POLICY MAKERS CONSIDER RESPONSE TO U.S. TAX OVERHAULhttps://www.policyschool.ca/wp-content/uploads/2018/10/Tax-Trends-US-Tax-Overhaul-Mintz-Bazel-Final.pdfJack Mintz and Philip Bazel | October 2018
FISCAL POLICY TRENDS: ALBERTA’S GOVERNMENT SPENDING: HOW BIG A PROBLEM?https://www.policyschool.ca/wp-content/uploads/2018/10/Fiscal-Trends-AB-Gov-Spending-McMillan.pdfMelville McMillan | October 2018
CANADA’S PROGRESSIVE TRADE AGENDA AND A FREE TRADE AGREEMENT WITH CHINA: ARE THEY INCOMPATIBLEhttps://www.policyschool.ca/wp-content/uploads/2018/10/Progressive-Trade-Agenda-Stephens-final.pdfHugh Stephens | October 2018
50 YEARS OF GOVERNMENT OF ALBERTA BUDGETINGhttps://www.policyschool.ca/wp-content/uploads/2018/10/50-Years-AB-Budget-Kneebone-Wilkins.pdfRonald Kneebone and Margarita Wilkins | October 2018
SOCIAL POLICY TRENDS: HEALTH VERSUS SOCIAL SPENDING BY CANADIAN PROVINCIAL GOVERNMENTShttps://www.policyschool.ca/wp-content/uploads/2018/09/Social-Policy-Trends-Health-vs-Social-Spending-September-2018.pdfMargarita Wilkins and Ronald Kneebone | September 2018
WHY ALBERTA NEEDS A FISCAL CONSTITUTIONhttps://www.policyschool.ca/wp-content/uploads/2018/09/Fiscal-Constitution-Morton-final.pdfF.L. (Ted) Morton | September 2018
FISCAL POLICY TRENDS: THE LONG-TERM CONSEQUENCES OF FISCAL RESPONSES TO RESOURCE REVENUE FLUCTUATIONShttps://www.policyschool.ca/wp-content/uploads/2018/09/Fiscal-Trends-NRR-Ferede-final.pdfErgete Ferede | September 2018
ALBERTA’S FISCAL RESPONSES TO FLUCTUATIONS IN NON-RENEWABLE-RESOURCE REVENUEhttps://www.policyschool.ca/wp-content/uploads/2018/09/NRR-Ferede.pdfErgete Ferede | September 2018


![Mafia Royalties [Completed].txt](https://img.pdfslide.net/doc/110x75/55cf9385550346f57b9db7a8/mafia-royalties-completedtxt.jpg)