Embed Size (px)
DESCRIPTION
BIODIVERSITY MONITORING IN THE UK • Land/water body management change is the most • Pollution and climate gradients quite strong • Priority species and habitats (sites) scattered across the important driver of biodiversity change landscape in many small patches, and a few large areas – 243,620 km 2 254 people/km 2 – Proportion of urban is increasing
Citation preview

BIODIVERSITY MONITORING IN THE UK

UK Monitoring Challenge • A small densely populated landscape
– 243,620 km2 254 people/km2
• Land parcels are small – often a few hectares • Land cover changes little
– Proportion of urban is increasing
• Land/water body management change is the most important driver of biodiversity change
• Pollution and climate gradients quite strong • Priority species and habitats (sites) scattered across the
landscape in many small patches, and a few large areas
Monitoring Ecosystems, Biomes and Habitats • Land cover maps
• 1990, 2000, 2007 • Derived from satellite data, and classified with other data sets e.g.
soil, and the national digital boundary data set. • Habitats, vegetation, soils, water sample survey
– 600 1km squares, professional, 2007, 1998, 1990, 1984, 1978 – ‘Countryside Survey’ – http://www.countrysidesurvey.org.uk/
• LTER - meteorology, biodiversity, soils, chemistry, experiments – 12 terrestrial, 45 freshwater – ‘Environmental Change Network’ – http://www.ecn.ac.uk/

Why monitor biomes-habitats in this way? • Land cover stock and change drives the biggest decisions on priority
for policy (e.g. deforestation), whilst maps allow planning of effort. – In the UK change is mostly in management that makes subtle change to
land cover – It is hard to pick this up from satellite as change is at a fine spatial scale and
at small differences in classification – We need something better!
• Sampling vegetation to a stratified random design – Attributes of plant species (e.g. response to nutrients, grazing) allow
changes in vegetation to be related to pollutants and management change – It allows the UK to generate nationally representative statistics showing
whether these pressures are reducing or enhancing biodiversity. • Detailed ecological monitoring and experiments
– Are being use to relate the condition of habitats to their services e.g. carbon sequestration

Monitoring trends in selected species • Breeding Birds
– 3,000 1km squares, 2,500 volunteers do the sampling, 3 times a year – ‘Breeding Bird Survey’ – http://www.bto.org/bbs/index.htm – http://www.ebcc.info/pecbm.html
• Butterflies – 1,000 transects, annual, many 100s volunteers do the sampling, 16 times a
year (and 2 times) – ‘Butterfly Monitoring Scheme’ – http://www.ukbms.org/
• Collating presence data (distributions) – 120,000 species 50+ million observations from 1,000s of volunteers – Trends possible for around 30,000 species – The ‘Biological Records Centre’ and ‘National Biodiversity Network’ – http://www.brc.ac.uk/ , http://data.nbn.org.uk/ , http://www.jncc.gov.uk/
page-5091

Why monitor these selected species? • The species are selected to:
– Be easy and cheap to sample allowing high sample numbers – Have a good range of species within each sample location – Ecology well-established so change can be interpreted.
• The stratified random design for sample locations allows robust representative trends. – The monitoring schemes provide trends that are compiled into the UK’s
biodiversity indicator set. • Analysis can relate the trends to land management changes
– The ability to show effects of production land management on trends has driven policy (for example the use of incentives)
• The high sample numbers mean the data are easy to relate to other environmental data – The data can be analysed with modelled climate and agricultural data sets
derived at different scales, – This flexibility allows the monitoring to provide measures of the response of
biodiversity to climate change, links to many detailed policies e.g. wood fuel production.

Monitoring status of threatened species • 1150 species, highlighted as priorities for conservation
actions under the UK biodiversity action plan • Many of these are outside protected sites and scattered
at a few locations • Cannot be picked up by main sample based monitoring • Most would need specific monitoring methods • Too costly to monitor them all
– Risk based monitoring is being trialled – monitor species where existing knowledge is weak and threats judged as high
– NGOs have a big role – Many are probably informally monitored by volunteers and local
staff, a goal is to make this information repeatable and available • We believe our selected species and habitat monitoring
would pick up the widespread threats to these species.

Monitoring of protected sites • UK sites
– 6,700 sites, 2.4 million hectares – Many small sites – each a few hectares, few large – several square kilometres
• Site condition monitoring – http://www.jncc.gov.uk/page-2201 – A means of judging condition where the habitats and species vary across sites – A means of comparing assessments made by different organisations at different
locations (e.g. by the different countries in the UK) • How does it work?
– Measurable attributes for the species and habitats important at the site are chosen
– Attributes include population size, or habitat structure or composition – Target values or ranges for the attributes are set which equal the desired
condition – The fit of the monitoring results with the targets is used to judge condition
categories (favourable, unfavourable, destroyed) – Guidance informs the choice of attributes for species and habitats in order to
have consistency but allowing local flexibility – Threats and management measures also recorded
• Initially applied across all sites over 6 years – Now moving to a frequency based on risk – this means monitoring where the
combination of the level of knowledge is low and the level of threat is high


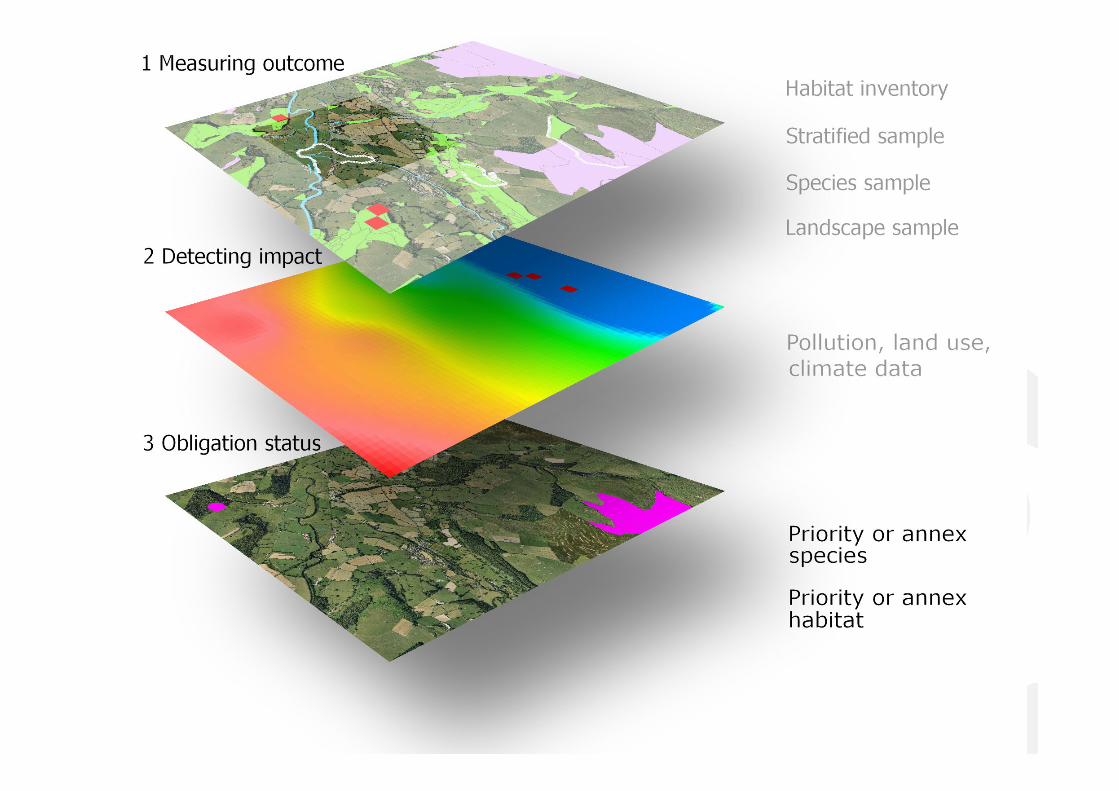
Summary of experience • Current long term monitoring doesn’t address all the
questions • Need to identify what it can tell us and identify the gaps • Rebalance effort as needed (sampling strategy) – but
difficult • Rarer species need a special approach – risk based