Embed Size (px)
Citation preview

icfi.com |
Evaluation 2014: Visionary Evaluation for a Sustainable, Equitable Future
28th Annual Conference of the American Evaluation Association
Denver, CO, USA
Approaches to Mixed Methods in Education, Community, and Social Programs
Kristen Peterson, Chair
October 16, 2014 | 3:00 - 4:30 PM
As you arrive, please discuss with your neighbor what you have done or want to do with mixed methods in your own work.

icfi.com |
Session Goals
• Highlight a few program evaluation research projects at ICF
• Share processes for designing and conducting mixed methods research
• Offer examples of how mixed methods have provided added breadth and depth of understanding
• Identify next steps to improve the ways we use mixed methods to paint a holistic picture of programs

icfi.com |
Session Agenda
1. Weaving Together Outcome Data and Site Visit Findings for a National Evaluation of Drug-Free Communities, Kazuaki Uekawa
2. Evaluation of a State GEAR UP Program: Understanding Implementation through the Integration of Annual Performance Report, site visit and survey data, Ashley Briggs
3. The Diplomas Now Validation Study: Integrating case study, fidelity, and outcome data to assess program implementation, Kathleen Wang
4. Discussion/Q&A

icfi.com |
Weaving Together Outcome Data and Site Visit Findings for a National Evaluation of Drug-Free Communities Kazuaki Uekawa
October 16, 2014
Presented to:
American Evaluation Association 2014 Conference

icfi.com | 5
Drug-Free CommunitiesOVERVIEW
DFC— Drug-Free Communities
Funding and Support—Office of National Drug Control Policy (ONDCP), with support from the Substance Abuse and Mental Health Services Administration (SAMHSA)
Grantees ––Nearly 2,000 DFC grants across the nation in various locales (660 grantees in FY 14)
Target Area—Combined population of 114.3 million, or 37.0% of the U.S. population
Map downloaded from:http://www.whitehouse.gov/ondcp/drug-free-communities-support-program

icfi.com | 6
DFC Grantees
Award Amount—Grantees receive awards of up to $125,000 per year for up to five years per award (maximum of 10 award years)
Goal— (1) reduce substance use among youth and (2) increase collaboration in the community to address substance use and associated problems
Approach—Prevention efforts through environmental approaches
Community Coalition Sectors—Youth, parents, schools, law enforcement, business, media, government (local, state, and tribal), youth-serving organizations, law enforcement agencies, religious or fraternal organizations, civic and volunteer groups, healthcare professionals
OVERVIEW

icfi.com | 7
DFC INFOGRAPHIC
Infographic downloaded from:http://www.whitehouse.gov/ondcp/drug-free-communities-support-program

icfi.com | 8
DFC National Evaluation: ChallengesEVALUATION DESIGN AND METHODOLOGY
Challenge: Not an Experimental Design– Use a natural variation design to understand how and in what situations DFC
works through mixed-methods
Challenge: Stakeholders from different sectors interested in understanding their role in improving outcomes– Conduct 36 site visits (including interviews with members from all 12
sectors)
Challenge: Annual reports are heavily focused on outputs but need to integrate qualitative information– Solution: Draw out lessons learned from site visits in issue briefs (e.g.,
parent engagement, sustainability) that draw from multiple data sources. Newsletters are also under consideration.

icfi.com | 9
Data Sources, QuantitativeEVALUATION DESIGN AND METHODOLOGY
– Progress report data on the use of Tobacco, Alcohol, Marijuana, and prescription drugs: core measures of 30-day use, perception of risk, perception of parental disapproval, perception of peer disapproval (reported every other year via. COMET system)
– Progress report on target population demographics, membership capacity, coalition processes, planning, and implementation (reported twice a year via. COMET system). Open-ended questions included.
– Coalition Classification Tool (CCT): latent constructs such as leadership, collective efficacy, sustainability, etc.
Example of 30-day use survey
Example of strategy activity details collected as part of implementation data. Interim report 2012. (http://www.whitehouse.gov/sites/default/files/dfc_2012_interim_report_annual_report_-_final.pdf)
icfi.com | 10
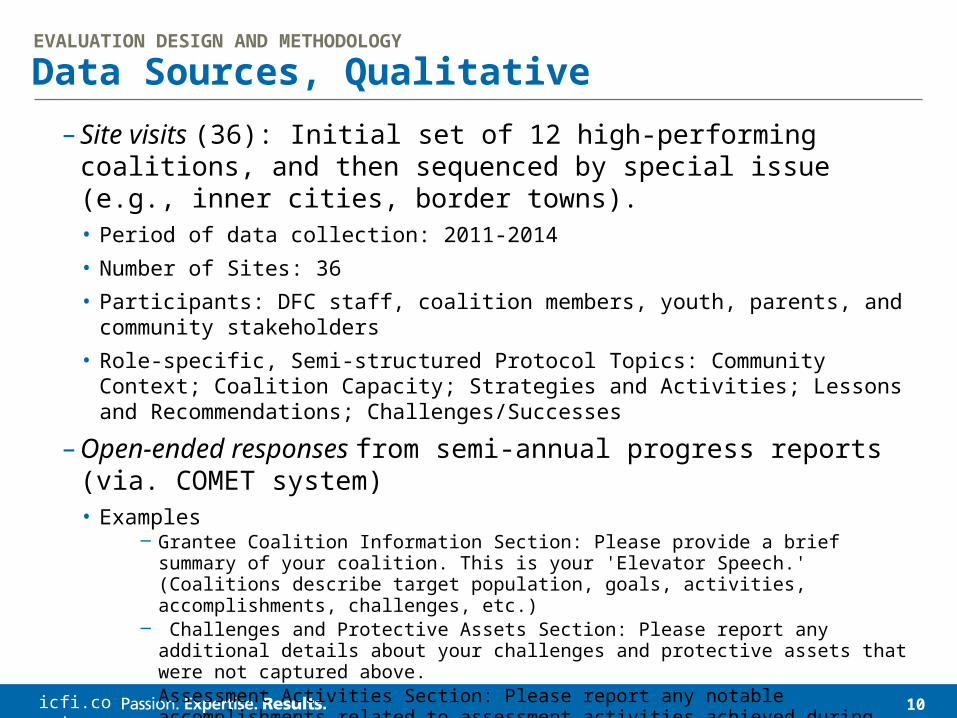
Data Sources, QualitativeEVALUATION DESIGN AND METHODOLOGY
– Site visits (36): Initial set of 12 high-performing coalitions, and then sequenced by special issue (e.g., inner cities, border towns).• Period of data collection: 2011-2014• Number of Sites: 36• Participants: DFC staff, coalition members, youth, parents, and community stakeholders• Role-specific, Semi-structured Protocol Topics: Community Context; Coalition Capacity;
Strategies and Activities; Lessons and Recommendations; Challenges/Successes
– Open-ended responses from semi-annual progress reports (via. COMET system)• Examples
– Grantee Coalition Information Section: Please provide a brief summary of your coalition. This is your 'Elevator Speech.' (Coalitions describe target population, goals, activities, accomplishments, challenges, etc.)
– Challenges and Protective Assets Section: Please report any additional details about your challenges and protective assets that were not captured above.
– Assessment Activities Section: Please report any notable accomplishments related to assessment activities achieved during this reporting period.

icfi.com | 11
Example 1. Application of Mixed Methods (in measurement)EVALUATION DESIGN AND METHODOLOGY
The goal: Refine the service categories of strategy activities – informed by both qualitative and quantitative analysis
Result: Reduced 42 service categories/7 strategies to 14 to 3 orientations. This was a shift from a typology to a more clear delineation of service strategies that relate to outcomes.
Method– Recoded service categories based on qualitative understanding of site visit
data and legacy data– Descriptive analysis to identify the size of variance, Factor analysis to
understand the subgroups of items, Correlations analysis to understand cross-use of legacy service strategies by the new categories

icfi.com | 12
Service Strategies Refined
Notes: DFC Coalitions Strategies: A Strategy Orientation Approach to Understanding How DFC Grantees Utilize Strategies
Typology of 7 environmental strategies w/ 42 service categories
PI: Providing informationES: Enhancing skillsPS: Providing supportLP: Modifying/changing policiesC: Changing ConsequencesAB: Enhancing access/Reducing barriersPD: Physical Design
3 new orientations
Building Individual Capacity
Building Protective Capacity
Building Supportive Capacity
Examples:• Physical Design : Clean up &
beautification • Providing Support: You/family
community involvement
Two of the most frequently associated activities across coalitions are promoting youth / family community involving (a skills enhancement activity) and cleanup and beautification (a physical design activity). The orientation toward building individual capacity links the skills enhancement and the opportunity to apply those skills.
Examples: Providing support• Alternative drug-free social activity
events• Youth organizations/ drop-in centers• Organized youth recreation programs• Youth/family community involvement• Youth/family support groups

icfi.com | 13
Example 2: Application of Mixed Methods (in analysis)ANALYSIS
Issue briefs for DFC stakeholders that blend site visit data with COMET data– Summary of trends across all coalitions who submitted progress report data between
2011 and 2013, Rich descriptions from site visits of strategies used, factors for success, and continued challenges, Draft briefs focus on sustainability and parent involvement.
– Example: Parent Engagement Brief• Basic quantitative information (e.g., average number of parent members)• Parents are key but engagement was often reported as a challenge, especially
engaging parents beyond those who also represent another sector• Age of youth may impact engagement• Cultural competence• Summary of common challenges in engaging parents, a) Parents may link certain
life events with permissive attitudes (e.g., prom, graduation, quinceañera, branding), b) Helping can be perceived as attacking
• Examples of parent involvement practices including parent-led workshops and small group discussions
• Recommendations from the field to engage parents strong school partnerships, PTAs, etc.

icfi.com | 14
Example 3: Application of Mixed Methods (in analysis)ANALYSIS
Ad-hoc requests from ONDCP regarding emergent topics– In response to inquiries such as “What do we know about the rise in marijuana use?,”
the evaluation team conducted a literature review on marijuana use, scanned open-ended responses on strategies used to combat marijuana, and analyzed quantitative data on the number of coalitions that target marijuana use.
– Marijuana Overview Example• Marijuana prevalence of use and trends• COMET data on marijuana as a target substance• Emerging issues (e.g., legalization and descriminalization)• Common strategy to target marijuana (e.g., social media campaigns, education, targeting
parents’ awareness)
icfi.com | 15
Lessons Learned about Using Mixed MethodsCONCLUSION
Given the complexity of this evaluation, mixed-methods research offers an opportunity to gain a more holistic understanding of coalitions.
Quantitative data is used in our primary “impact” analyses, and qualitative data expands the breadth of that data for a deeper understanding of complex processes.
Open-ended text fields offered all grantees a place for them to tell their story without necessitating site visits to every coalition.

icfi.com | 16
Next Steps in the EvaluationCONCLUSION
Synthesize results from all site visits to offer a deep understanding about challenges, successes, and context influences (e.g., inner city, border town)
Conduct quantitative analyses that help contextualize the qualitative data, supported by qualitative write-ups that help contextualize the quantitative data
Continue producing issue briefs and reports that present various types of data cohesively

icfi.com |
Evaluation of a State GEAR UP Program: Understanding Implementation through the Integration of Annual Performance Report, site visit and survey data
Ashley Briggs
October 16, 2014
Presented to:
American Evaluation Association 2014 Conference

icfi.com | 18
GEAR UP Nationally
GEAR UP— Gaining Early Awareness and Readiness for Undergraduate Programs
U.S. Department of Education (USED) discretionary grant— State and local partnership grants
Program goals— Raise postsecondary participation, strengthen academic preparation, and increase postsecondary awareness
Cohort approach— Students from 7th grade through to postsecondary education
FY12 – 132 federal grants serving 647,772 students
OVERVIEW

icfi.com | 19
About the Texas GEAR UP State Grant (SG)OVERVIEW
Texas Education Agency FY12 state grant– Approx. $5M per year (2012-19)
Single cohort of students starting in Grade 7— students are in Grade 9 in 2014–15 (4 districts and 7 high schools)
District services– Increase students’ college readiness through support services (e.g., college
visits, summer learning, and tutoring)– Provide teacher professional development to support course rigor and
postsecondary planning (e.g., project-based learning with college visits)– Promote vertical alignment of core subject teachers across the grades
Statewide Services– Postsecondary information dissemination to students and families (state
GEAR UP website)– Online communication and teaching platform – Statewide coalition of state and local GEAR UP grantees
?

icfi.com | 20
About the Texas GEAR UP SG EvaluationEVALUATION DESIGN AND METHODOLOGY
The external evaluation is a longitudinal mixed-method study using a quasi-experimental design to:
Provide a formative evaluation of implementation (facilitators/barriers, promising practices, and recommendations)
Determine impact including short, intermediate, and long-term student outcomes
Identify impact on parent perceptions
Examine access to and use of statewide services
Understand cost, spending, and sustainability

icfi.com | 21
Data SourcesEVALUATION DESIGN AND METHODOLOGY
Extant Data– Documents: Texas GEAR UP SG Grant Application, Notice and Grant
Awards (NOGAs), and implementation plans– Student-level data: Demographics, attendance, high school course
completion, and graduation– School-level data: Profile information about campus-level
performance, staff, finances, and programs
Student Tracking System (Annual Performance Report – APR)– Format: Submission by 4 subgrantee districts using a prepopulated
spreadsheet – Topics: Advanced course-taking; Academic services; Student
services; Student events and attendance; Parent events and attendance; Teacher professional development and enrollment; Community partners

icfi.com | 22
Annual Performance Report (APR) DataEVALUATION DESIGN AND METHODOLOGY
Period of data collection: March 2014
Format: Submission by 4 subgrantee districts
Topics– Advanced course taking (baseline)– Student support services (tutoring, mentoring, counseling/advising)– Student events– Parent events– Summer programs– Teacher professional development– Vertical teaming– Community partners– Statewide Information Services

icfi.com | 23
Data Sources (cont.)EVALUATION DESIGN AND METHODOLOGY
Surveys with Parents and Students– Format: Online and paper-based versions in English and Spanish– Topics: Aspirations and expectations; Knowledge of financial aspects;
Knowledge of college requirements; Perceptions of Texas GEAR UP SG
Site Visits to Texas GEAR UP SG Schools– Format: 1-1.5-day visits including interviews and focus groups with school
staff, teachers, students, parents, and community partners– Topics: GEAR UP activities and events (school and statewide); Knowledge of
college requirements and financial aspects; Perceptions of Texas GEAR UP SG; Readiness for success in college
Interviews with Key Leaders from TEA and Partner Organizations– Format: Telephone interviews– Topics: Level of partner involvement; Perceptions of program; Progress on
statewide implementation

icfi.com | 24
Application of Mixed MethodsEVALUATION DESIGN AND METHODOLOGY
Comprehensive logic model depicts how program and school staff work together to promote college readiness.
Detailed crosswalk tracks the following:–All 65 evaluation questions–The data source(s), as specific items, to inform each question–Suggestions for the type of analysis
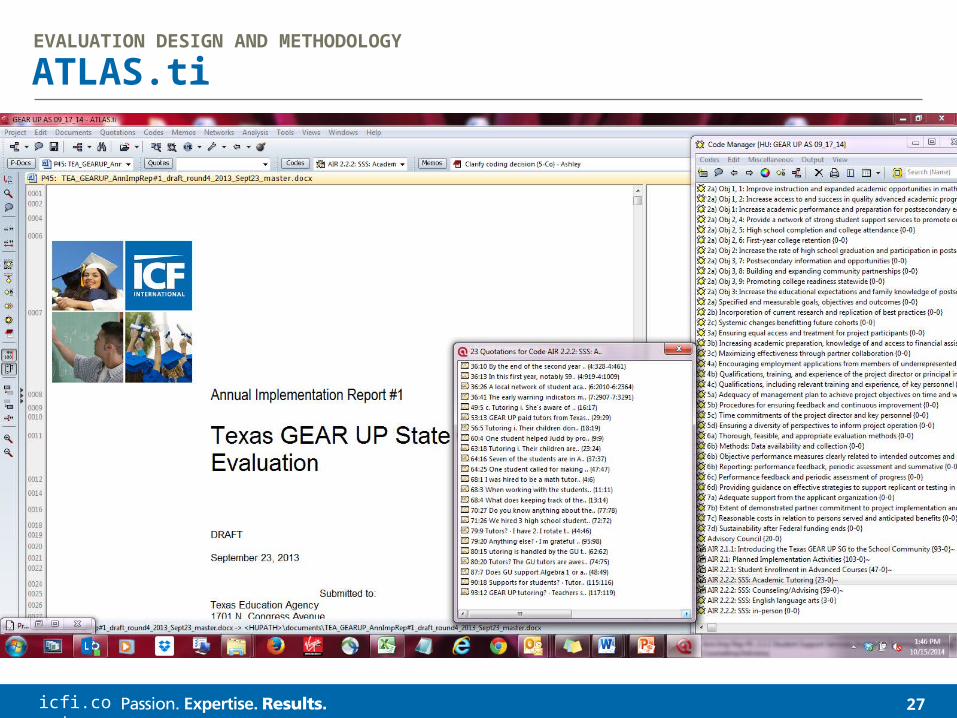
Using ATLAS.ti made data from these sources easily accessible to supplement quantitative findings: –Site visit data–Interview data–Documents

icfi.com | 25
Logical Model (Condensed)EVALUATION DESIGN AND METHODOLOGY
E.G.: student characteristics, school graduation rate, & parent education level
E.G.: Advances course taking, student services, professional development, & community partnership
E.G.: Participation levels, # of PD sessions, & # statewide materials
E.G.: Course completion, promotion rates, changes in vertical team meetings, & increased parent expectations
E.G.: proficiency on state tests, SAT scores, college credits, & perceptions of workshops
E.G.: average # of college applications, % enrolled in college, % in remedial courses

icfi.com | 26
CrosswalkEVALUATION DESIGN AND METHODOLOGY
icfi.com | 27
ATLAS.tiEVALUATION DESIGN AND METHODOLOGY

icfi.com | 28
Selected FindingsFINDINGS
APR data–Descriptive data: Mix of services across schools as well as levels of
student participation–Chi-square analyses: number of subject areas in which students were
being tutored (1 subject- 78%; 3 subjects- 5%)–ANOVA: average number of hours in tutoring (32 hours per student in
math)
?

icfi.com | 29
Selected Findings (cont.)FINDINGS
Site visit data–Details about how schools decided which students received tutoring
(diagnostic data or teacher input)–Clarity on who provided the services (local partners)–Understanding of implementation barriers/facilitators (training of tutors)–Clarification of APR data (virtual tutoring)
Survey data–Perceptions about tutoring:
• Students reported, on average that tutoring in any subject was slightly effective.
• Parents reported, on average that tutoring in any subject was mostly effective.
icfi.com | 30
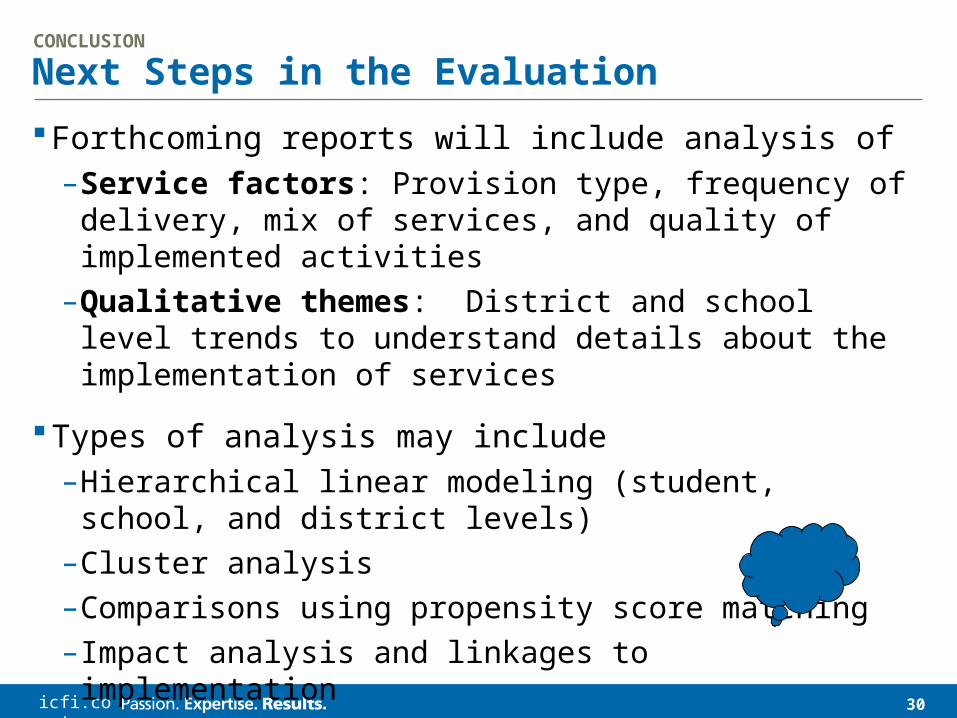
Next Steps in the EvaluationCONCLUSION
Forthcoming reports will include analysis of – Service factors: Provision type, frequency of delivery, mix of
services, and quality of implemented activities– Qualitative themes: District and school level trends to understand
details about the implementation of services
Types of analysis may include – Hierarchical linear modeling (student, school, and district levels)– Cluster analysis– Comparisons using propensity score matching– Impact analysis and linkages to implementation

icfi.com | 31
Lessons Learned about Using Mixed MethodsCONCLUSION
Tools such as logic models, crosswalks, and ATLAS.ti are helpful ways to organize large amounts of data and streamline their integration
Confirmed importance of how multiple data sources can illuminate contradictions and offer different layers of detail
Appreciation for the labor-intensive nature of examining many dimensions of a program through multiple lenses
Acknowledgement of tradeoffs in delegating the work
?

32
http://www.tea.state.tx.us/WorkArea/linkit.aspx?LinkIdentifier=id&ItemID=25769807659&libID=25769807662#25769807659
The second annual implementation and comprehensive reports are forthcoming.
For more information, first annual implementation report is available at:
icfi.com | 33
The Diplomas Now Validation Study: Integrating case study, fidelity, and outcome data
October 18, 2014
Presented to:
American Evaluation Association 2014 Conference
Kathleen Wang

icfi.com | 34
500,000 kids who drop out of school every year come from just 12 percent of the nation’s high schools or 1,700 “dropout factories.”

icfi.com | 35
JHU found that students who are most at risk of dropping out can be identified through key indicators also known as the ABCs:
Poor AttendanceUnsatisfactory Behavior
Course failure in math and EnglishWhen any one of these off-track indicators is seen as early as 6th
grade, that child has only a 10-20% likelihood of graduating from high school.
Diplomas NowOVERVIEW

icfi.com | 36
Diplomas Now
Program Goal: Reduce the number of students who drop out and provide students with a college- and career-preparatory education.
OVERVIEW

icfi.com | 37
Diplomas NowOVERVIEW
icfi.com | 38
Diplomas Now Study
U.S. Department of Education awarded Johns Hopkins University an Investing in Innovation (i3) validation grant in 2010 for the Diplomas Now model.
The grant includes funds for a mixed method study which will be conducted through the end of 2015.
OVERVIEW

icfi.com | 39
Evaluation Design
Impact Study:• Experimental evaluation (or Randomized Control
Trial-RCT) measuring the impact on secondary school students' outcomes.
Implementation study: • Fidelity assessment at 32 schools examining fidelity of
implementation.• Case studies at seven schools in year 1 and nine
schools in year 2.

icfi.com | 40
Available: http://www.mdrc.org/sites/default/files/Diplomas_Now_First_Year_FR_0.pdf
Year 1 Evaluation Report

icfi.com | 41
Year 1 Evaluation Data Sources

icfi.com | 42
Rationale for Mixed Methods
To corroborate and confirm findings that examine the same research questions (simultaneous triangulation).
Expand and elaborate using different methods to answer different research questions.
Creswell, JW, & Plano Clark, VL .(2011). Designing and conducting mixed methodsresearch. (2nd ed.). Thousand Oaks, CA: Sage.

icfi.com | 43
Implementation Study Research Question Matrix
RESEARCH QUESTION
Fidelity Assessment
Case Studies
How did the intervention as implemented compare to the intervention as planned?
X X
What were the factors that facilitated or challenged implementation of the intervention?
X X
How did treatment schools compare to control schools in their structures, programs, and practices?
X
What are the perceived benefits of the intervention?
X
What lessons can be learned from the implementation of the intervention?
X
Expand
Confirm

icfi.com | 44

icfi.com | 45

icfi.com | 46
Qualitative Case Study Data Analysis
icfi.com | 47
“Mixing” Fidelity and Case Study Data
EXPAND AND ELABORATE
“According to FIDELITY DATA, Diplomas Now schools were less successful in adapting new curricula and implementing peer coaching models…Teachers from CASE STUDY schools expressed mixed feelings about the usefulness of the peer coaching. In addition, focus group and interview participants noted difficulty implementing the Diplomas Now curriculum.”

icfi.com | 48
“Mixing” Fidelity and Case Study Data
CORROBORATE and CONFIRM
“According to FIDELITY DATA, Diplomas Now schools were the most successful in implementing a tiered intervention model and adding student supports into the existing school structure…Similarly, CASE STUDY respondents most frequently discussed Tiered Intervention Model and Student Supports in the context of effective rather than challenging implementation.”

icfi.com | 49
Application of Mixed Methods

icfi.com | 50
Next Steps… Year 2 Evaluation Report
Focused on early impacts and updating implementation study data.
Documenting CONTEXTUAL FACTORS (using case study data) that had a strong influence on program implementation and understanding why we are seeing little change in some areas due to:
- School closures- School/program staff turnover- Budget cuts- Teacher layoffs

icfi.com | 51
Key Takeaways
MIX your findings don’t just layer them–Don’t make your reader have to do all the work!–Good mixed methods will interweave the findings throughout
the evaluation report to help draw those connections for the reader.
Logic model is the backbone of good mixed methods–It is critical when evaluating a complex model like DN to provide
a common thread for different types of data sources and analyses.

icfi.com | 52
Key Takeaways
The “gold standard”– RCTs are widely seen as the “gold standard” of research since they answer
the question, “does this program work?”– This doesn’t negate the importance of other methods, but further
necessitates their use.
Good evaluation is both an art and a science.– Our design and methods are the science, but the “mixing” of multiple
methods is the “art.”– Mixed method evaluations typically have multiple analysts that divide up
quantitative and qualitative analyses. Very important that analysts/authors meet regularly to discuss confirming and conflicting evidence and determine best outline for reporting.

icfi.com | 53
Year 1 Evaluation Reporthttp://www.mdrc.org/sites/default/files/
Diplomas_Now_First_Year_FR_0.pdf
Year 2 Evaluation Report (in draft)
Additional information on Diplomas Now Study
icfi.com | 54
Discussion Benefits of mixed methods include:
1) complementarity that clarifies results, 2) initiation that illuminates contradiction, and 3) development to inform other methods (Onwuegbuzie & Teddlie, 2003).
Strong methodologists who appreciate mixed methods design allow for stronger inferences (Tashakkori & Teddlie, 2003)
Examining the interconnectedness of multiple data sources offers a better understanding of the phenomena than either one alone (Creswell & Plano Clark, 2007).
Understanding a program, beyond outcomes, is essential in sustaining the interventions put in place in schools and communities.
CALL TO ACTIONReports that thoughtfully integrate data, make it more useful and accessible to
readers. Evaluators need to know the ART and SCIENCE of mixed methods.

icfi.com | 55
Continue the conversation with your comments and questions at:
http://padlet.com/abriggs5/zpbqovr8o8uo
AUDIENCE DISCUSSION
THANK YOU

icfi.com | 56
Contact Information
Program Evaluation
Kristen Peterson, Senior Associate, [email protected]
Drug-Free Communities
Kazuaki Uekawa, Technical Specialist, [email protected]
Texas GEAR UP State GrantAshley Briggs, Technical Specialist, [email protected]
Diplomas NowKathleen Wang, Expert Consultant, [email protected]


![[XLS]fba.flmusiced.org · Web view1 1 1 1 1 1 1 2 2 2 2 2 2 2 2 2 2 2 2 2 2 2 2 2 2 2 2 2 2 2 3 3 3 3 3 3 3 3 3 3 3 3 3 3 3 3 3 3 3 3 3 3 3 3 3 3 3 3 3 3 3 3 3 3 3 3 3 3 3 3 3 3 3](https://img.pdfslide.net/doc/110x75/5b1a7c437f8b9a28258d8e89/xlsfba-web-view1-1-1-1-1-1-1-2-2-2-2-2-2-2-2-2-2-2-2-2-2-2-2-2-2-2-2-2-2.jpg)