Embed Size (px)
Citation preview
Nucleic Acids Research, 2014 1doi: 10.1093/nar/gku626
3′LIFE: a functional assay to detect miRNA targets inhigh-throughputJustin M. Wolter1,2, Kasuen Kotagama1,3, Alexandra C. Pierre-Bez2, Mari Firago1 andMarco Mangone1,2,3,*
1School of Life Sciences, Arizona State University, 427 E Tyler Mall, Tempe, AZ 85287, USA, 2Virginia G. PiperCenter for Personalized Diagnostics, Biodesign Institute, Arizona State University, 1001 S. McAllister Dr., Tempe, AZ85287, USA and 3Barrett, The Honors College, Arizona State University, 751 E Lemon Mall, Tempe, AZ 85287, USA
Received January 29, 2014; Revised June 25, 2014; Accepted June 27, 2014
ABSTRACT
MicroRNAs (miRNAs) are short non-coding RNAsthat regulate gene output at the post-transcriptionallevel by targeting degenerate elements primarily in3′untranslated regions (3′UTRs) of mRNAs. Individ-ual miRNAs can regulate networks of hundreds ofgenes, yet for the majority of miRNAs few, if any, tar-gets are known. Misexpression of miRNAs is alsoa major contributor to cancer progression, thusthere is a critical need to validate miRNA targetsin high-throughput to understand miRNAs’ contri-bution to tumorigenesis. Here we introduce a novelhigh-throughput assay to detect miRNA targets in3′UTRs, called Luminescent Identification of Func-tional Elements in 3′UTRs (3′LIFE). We demonstratethe feasibility of 3′LIFE using a data set of 275 hu-man 3′UTRs and two cancer-relevant miRNAs, let-7c and miR-10b, and compare our results to alter-native methods to detect miRNA targets throughoutthe genome. We identify a large number of novel genetargets for these miRNAs, with only 32% of hits beingbioinformatically predicted and 27% directed by non-canonical interactions. Functional analysis of targetgenes reveals consistent roles for each miRNA as ei-ther a tumor suppressor (let-7c) or oncogenic miRNA(miR-10b), and preferentially target multiple geneswithin regulatory networks, suggesting 3′LIFE is arapid and sensitive method to detect miRNA targetsin high-throughput.
INTRODUCTION
MicroRNAs (miRNAs) are short non-coding RNAs thatbind to sequence elements primarily in the 3′untranslatedregions (3′UTRs) of messenger RNAs (mRNAs), result-ing in mRNA degradation or translational repression (1).MiRNAs are expressed in nearly every eukaryotic cell type
investigated to date, where they regulate fundamental bi-ological processes such as development and morphogene-sis (2). Furthermore, miRNA misregulation has also beenobserved in a wide range of cancers (3), where they canfunction as tumor suppressors or oncogenic miRNAs (on-comiRs) (4), based solely on the function of target genes.The misexpression of miRNAs can have substantial conse-quences in development and disease, highlighting the pow-erful role miRNAs play in influencing cell behavior. In hu-man, each miRNA is predicted to target hundreds to thou-sands of genes based on complementarity with mRNAs (5),thus identifying and experimentally validating gene targetsis central to understanding an miRNA function. To ana-lyze the large number of putative miRNA/mRNA inter-actions, bioinformatic and next-gen sequencing approachesare commonly used to predict and identify miRNA targetsites throughout the genome. Each approach has inherentstrengths and shortfalls.
Many algorithms have been developed to predict miRNAtarget sites throughout the transcriptome by searching forregions of complementarity with mRNAs by Watson–Crickand G:U wobble base pairing (1). These interactions mayutilize as little as six consecutive nucleotides near the 5′end,or seed region, of the mature miRNA (5–7). Perfect comple-mentarity with the seed region is considered the canonicalindicator of an miRNA target site, but can be strengthenedby additional pairing with the 3′end of the miRNA. Dueto the small size and degenerate nature of target sequenceelements, most algorithms predict hundreds to thousandsof putative target genes for each miRNA. These algorithmstypically apply parameters such as stringent seed pairing,cross-species conservation and thermodynamic stability toidentify high-confidence targets (5,8). However, the anal-ysis of the predictive performance of several of the mostprominent algorithms reports extremely high false-negative(9–11) (Supplementary Figure S1) and false-positive rates(∼66%) (12,13). These error rates reflect that these algo-rithms typically do not predict poorly conserved species-specific interactions or non-canonical targets not reliant on
*To whom correspondence should be addressed. Tel: +1 480 965 7957; Fax: +1 480 965 3051; Email: [email protected]
C© The Author(s) 2014. Published by Oxford University Press on behalf of Nucleic Acids Research.This is an Open Access article distributed under the terms of the Creative Commons Attribution License (http://creativecommons.org/licenses/by-nc/4.0/), whichpermits non-commercial re-use, distribution, and reproduction in any medium, provided the original work is properly cited. For commercial re-use, please [email protected]
Nucleic Acids Research Advance Access published July 29, 2014 at A
rizona State University W
est 2 on March 25, 2015
http://nar.oxfordjournals.org/D
ownloaded from
2 Nucleic Acids Research, 2014
perfect seed complementarity, which recent evidence sug-gests may be widespread (11–12,14–20). These algorithmsare useful for candidate gene approaches to identify puta-tive miRNA targets, but the high error rates make system-atic target detection challenging.
Several recently developed techniques allow the exper-imental detection of miRNA targets on a transcriptomewide level, bypassing target prediction software. One of themost used methods combines the cross-link and immuno-precipitation of argonaute (AGO) family members withnext-generation sequencing (AGO-HITS-CLIP). AGO pro-teins directly bind mature miRNAs and guide the largemulti-protein complex called the RNA-induced silencingcomplex (RISC) to target mRNAs. By sequencing themRNA population bound to AGO, it is possible to map thesequence footprints occupied by the RISC on specific genes(21). However, the physical immunoprecipitation of AGOfrom cell lysates is often challenging to execute and mayadd unwanted noise, impacting reproducibility and com-plicating downstream analysis. Importantly, while this ap-proach produces hundreds to thousands of targets, it doesnot provide information about which miRNA led the RISCto that location, which has to be extracted using bioin-formatic approaches (22). Furthermore, AGO-HITS-CLIPfails to measure the functional impact of miRNA targetingon the level of protein synthesis. The result of targeting bythe RISC can range from translational repression to mRNAdegradation (13), and it is not currently clear if these alter-native mechanisms bias the results of AGO-HITS-CLIP to-ward target sites that are held in translational repression.While AGO-HITS-CLIP is an excellent method to detectmiRNA target sites in high-throughput in a specific biolog-ical context, the limitations with assigning an miRNA andthe lack of a functional measure of targeting limit this ap-proach.
To address these gaps, we have developed a high-throughput assay to probe for interactions between miR-NAs and their targets in 3′UTRs. This assay, named Lumi-nescent Identification of Functional Elements in 3′UTRs(3′LIFE), is capable of measuring direct interactions be-tween a test 3′UTR and a query miRNA using a dual lu-ciferase approach. Luciferase assays rely on the fusion ofthe 3′UTR of a gene of interest to a luciferase reportergene. The reporter is cotransfected with a query miRNA incell culture. Targeting is measured as a relative change be-tween the test 3′UTR reporter and a second, non-targetedluciferase reporter. Luciferase assays offer several advan-tages over other methods to identify miRNA targets such asmRNA sequencing and protein quantification approaches.Quantification of the luciferase assay occurs at the proteinlevel, but reflects interactions at the RNA level betweenthe miRNA and 3’UTR, bypassing differences in mRNAdegradation/translational repression, and changes in pro-tein abundance independent of 3’UTR based regulation.Luciferase assays are sensitive and scalable, yet use in high-throughput screens is greatly limited by (i) high costs associ-ated with consumable reagents, (ii) lack of publically avail-able 3′UTR reporter libraries and (iii) the absence of stan-dardized dual luciferase protocols to perform large-scalescreens, leading to difficulties in comparing functional re-pression across multiple data sets.
The 3′LIFE assay enhances the dual luciferase assay byplacing emphasis on the rapid, sensitive, standardized andhigh-throughput screening for miRNA targets. These ad-vances include the development of a test 3′UTR library,GatewayTM compatible miRNA expression and 3′UTR re-porter plasmids, non-consumable transfection reagents andnon-commercial dual-luciferase assay reagents (23). Impor-tantly, the scalability of the 3′LIFE assay allows screensof individual miRNAs against a large 3′UTR library with-out biasing the screen toward candidate genes identifiedbioinformatically (24), allowing the identification of genestargeted via non-canonical and poorly conserved interac-tions. Importantly, the sensitivity of the luciferase reporterscombined with the inherently large number of negativemiRNA/mRNA interactions in 3′LIFE allows for detec-tion of the subtle effects of miRNA targeting, a benefit notpossible with low throughput, candidate gene or other se-lection based reporter assays (25).
To test the ability of the 3′LIFE assay to detect biologi-cally relevant target genes, we studied the targets of two can-cer relevant miRNAs, let-7c and miR-10b. The let-7 familymembers are broadly characterized as tumor suppressors;reduction in the expression of multiple family members isobserved in many cancers and correlates with poor survivaloutcomes (26–29). let-7 miRNAs target genes that promotecell proliferation [RAS (30), HMGA2 (26), E2F5 (31,32)]and invasion and metastasis [MMP11, PBX3 (33)]. Eachlet-7 miRNA is bioinformatically predicted to target over1000 genes (5), with overlapping target sets. miR-10b wasinitially described in the context of late-stage breast can-cer, where overexpression initiated malignancy in vivo (34).Subsequently, miR-10b overexpression has been observed inover a dozen late-stage tumor types (35–38). There are sev-eral validated targets of miR-10b including tumor suppres-sors HOXD10, KLF4 and NCOR2 (34,39–41). Despite thesignificant body of research (283 publications in PubMed)on these miRNAs, it is striking that the number of targetswith direct experimental validation equates to less than 3%of bioinformatically predicted targets (5,40).
We tested the feasibility of the 3′LIFE assay by query-ing let-7c and miR-10b against 275 test human 3′UTRs.Our results confirmed 80% of previously validated targetsand identified many novel targets for these two miRNAs.In comparing the 3′LIFE assay to TargetScan, a widelyutilized target prediction software, we identify that 63%of predicted targets have some degree of repression in the3′LIFE screen, yet 69% of top targets were not predicted,and ∼27% did not contain a canonical seed target. We alsoobserved that many miRNA target genes contain unpre-dicted canonical seed elements and demonstrate this is likelydue to poor conservation within 3′UTRs of unpredictedgenes, and not at miRNA target sites per se. Taken together,our results suggest that the 3′LIFE assay is a powerful toolto rapidly and systematically identify miRNA targets inhigh-throughput, validate bioinformatic predictions, iden-tify novel non-canonical targets and highlights the complex-ity of miRNA targeting mechanisms.
at Arizona State U
niversity West 2 on M
arch 25, 2015http://nar.oxfordjournals.org/
Dow
nloaded from
Nucleic Acids Research, 2014 3
MATERIALS AND METHODS
MiRNA target analysis of target prediction software
We have extracted the predicted targets and their predictionscores for the miRNAs let-7c, miR-10b, miR-125a, miR-138and miR-22 from the TargetScan (5), PicTar (8) and Diana-microT (42) websites. For TargetScan, the default conser-vation filter was used, although we include both ‘Conservedsites’ and ‘Poorly conserved sites’ in our analysis. The targetscore for each gene was normalized using the mean targetscore per miRNA. A list of the validated targets was com-piled using Tarbase (43), miRTarBase (40) and a manualliterature search using the gene name and all aliases listedin NCBI gene database. A gene was assigned as a validatedtarget if it had at least two distinct experimental methodsdemonstrating direct miRNA regulation.
pLIFE-3′UTR vector construction
The original luciferase vector T7 DLP was kindly providedby Dr John Chaput. The SV40 3′UTR was amplified fromthe pcDNA3.1/V5-his vector and introduced downstreamof the Renilla luciferase open reading frame by introduc-ing the restriction sites for NsiI and XmaJI (Supplemen-tary Figure S2A). The internal ribosome entry site (IRES)was replaced with the phosphoglycerate kinase 1 (PGK)promoter by introducing a PstI restriction site and ligatedusing BamHI and PstI restriction sites upstream of fire-fly luciferase. The P2R-P3 Gateway cassette was amplifiedfrom the pDONR P2R-P3 (Invitrogen) and cloned down-stream of firefly luciferase gene by introducing BglII andNheI restriction sites using QuikChange site-directed mu-tagenesis (Agilent). MS2 repeats were amplified from pSL-MS2–6x (AddGene Clone ID: 27118). Four MS2 repeatswere cloned downstream of firefly luciferase using BglII andApaI restriction sites for use in downstream RNA isola-tion protocols. This vector is available through DNASU(http://dnasu.org Clone ID EvNO00601503) (44).
pLIFE-miRNA vector construction
The miRNA expression vector (pLIFE-miRNA) wasadapted from the pCAG-RFP-miRint plasmid (45). We re-placed the cytomegalovirus early enhancer/chicken betaactin (CAG) promoter with the cytomegalovirus (CMV)promoter by introducing SpeI and SacI restriction sitesupstream of the DSRed2 open reading frame usingQuikChange site-directed mutagenesis (Agilent). let-7c andmiR-10b were amplified from human genomic DNA andcloned into the pLIFE-miR vector using the AsiSI andNotI restriction sites. We included ∼200 nucleotides up-stream and downstream from the surrounding genomic lo-cus to replicate endogenous miRNA processing. We alsocreated a Gateway compatible miRNA expression plas-mid, which contains the L2R3 Gateway cassette clonedinto AsiSI and MluI restriction sites (Supplementary Fig-ure S2B). This vector is available through DNASU (http://dnasu.org, Clone ID EvNO00601504) (44). To prepare thepLIFE-PGK miRNA expression vector, which produceslow expression level for the test miRNAs, we amplified the
PGK promoter from the pLIFE-3′UTR plasmid and lig-ated it into the pLIFE-miRNA plasmid using SpeI andXhoI restriction sites.
Test 3′UTR library preparation
We designed primers to amplify 384 3′UTRs from var-ious protein-coding genes based on the RefSeq annota-tion (HG19) and custom Perl scripts (46). Forward primerswere anchored to the 3′end of the terminal exon. Reverseprimers anchor ∼150 nucleotides beyond the end of thelongest annotated 3′UTR to include putative elements im-portant for mRNA processing (47). The attB2 and attB3Gateway cloning elements were added to the ends for theforward and reverse primers, respectively. Primers were ar-rayed based on annealing temperature and expected ampli-con size (Supplementary Table S1). Genomic DNA was iso-lated from HEK293T cells using DNAzol (Invitrogen), permanufacturer’s protocol. Touchdown-polymerase chain re-action (PCR) was conducted using Taq polymerase (Invit-rogen) in 96-well plates with 100-ng genomic DNA per PCRreaction. Cycling conditions were based on manufacturersprotocol, with the addition of ∼15 touchdown cycles, wherethe annealing temperature started at 14◦C above the low-est primer Tm on each plate, decreasing 1◦C per cycle for15 cycles. Remaining cycles were carried out at 55◦. Ampli-cons were then recombined into the pLIFE-3′UTR vectorusing BP Clonase reactions (Invitrogen) per manufacturer’sprotocol. Cloning reactions were incubated overnight atroom temperature, and 1 �l of the cloning reaction wastransformed into DH5-� bacteria cells and plated on 48-well LB-amp agar plates. We initially picked one colony perwell, and individual colonies were screened for correct sizeusing universal primers that flank the P2R-P3 cassette incolony PCR experiments. Twenty percent were randomlypicked and sequence verified. Clones that passed these testswere further used in the 3′LIFE assay. In our positiveand negative control experiments, we recombined the SV403′UTR into the pLIFE-3′UTR vector using BP Clonase(Invitrogen), and introducing control miRNA targets forlet-7c (AACCATACAACCTACTACCTCA) and miR-10b(ACAAATTCGGTTCTACAGGGTA) using QuikChangesite-directed mutagenesis (Agilent). Putative miRNA seedsin RhoB and HOXD11 were deleted from the 3′UTR lu-ciferase reporter plasmids using QuikChange site-directedmutagenesis.
Plasmid DNA preparation
pLIFE-miRNA plasmids were prepared using Maxi Preps(Promega) and the recovered DNA was resuspended to aconcentration of 500 ng/�l. Bacterial stocks of pLIFE-3′UTR plasmids were arrayed in 96-well 2-ml blocks andgrown for ∼16 h in 1.3-ml of Terrific Broth. Plasmidswere purified using the Nucleospin 96-well mini-prep kit(Macherey-Nagel) and the Biomek FX (Beckman Coulter)liquid handling robot according to manufacturers’ proto-col. DNA was eluted in 50 �l of nuclease-free water. DNAconcentrations were then normalized to ∼100 ng/�l usingthe Biomek FX liquid handling robot. To facilitate the as-say in high-throughput, we have also optimized this step us-
at Arizona State U
niversity West 2 on M
arch 25, 2015http://nar.oxfordjournals.org/
Dow
nloaded from
4 Nucleic Acids Research, 2014
ing in-house HighRes Biosolutions fully automated DNAminiprep systems that include three Liconic automated800RPM/37C incubators, one automated Liconic auto-mated −20◦C freezer, three Denso fully articulated roboticarms, two Heraeus robotic centrifuges, two Thermo Well-mate bulk dispensers, one Thermo combi bulk dispenser,two KBio Wasp automated plate sealers, one Nexus auto-mated plate pealer, one Molecular Devices DTX880 PlateReader, one Beckman Biomek FX dual arm 96/SPAN 8liquid Handler, one EL405 plate washer and two ambientautomated plate storage hotels.
Cell culture
HEK293T cells were kindly provided by Dr Josh LaBaer.Cells were cultured in Dulbecco’s modified Eagle’s medium(Sigma), supplemented with 10% fetal bovine serum(Fisher) and 1% penicillin/streptomycin (Fisher).
Nucleofection buffer test
A significant cost associated with high-throughput cell-based assays is consumable reagents associated with trans-fection, thus we tested a panel of buffers for efficient trans-fection and cell survival using the 96-well Shuttle De-vice by Lonza. An initial panel of 11 buffers and the SFcell line solution (Lonza) were used to transfect 1 × 10⁵
HEK293T cells with 100-ng pmaxGFP plasmid (Lonza).Each buffer was tested using several different nucleofec-tion pulse codes. As the conditions of these pulse codesare proprietary, exact pulse conditions are unknown. Thepulse codes tested were ER100, CU123, CM102, EO115,DT130, FF120, CN114, CM130, CB150, DS150, CA123and DS138. We tested the following buffer solutions: phos-phate buffered saline (PBS) (pH 7.4), PBS + 10% HEPES(pH 7.0), PBS + 10% HEPES (pH 7.4), PBS + 5% HEPES(pH 7.0), PBS + 1.5% HEPES (pH 7.0), HEPES bufferedsaline (HBS), 50% PBS/50% HBS, BD Perm Wash, electro-poration buffer and phosphate buffered sucrose. HBS so-lution contains 140-mM NaCl + 1.5-mM Na2HPO4•2H2O+ 50-mM HEPES. Electroporation buffer contains 15-mMpotassium phosphate + 1-mM MgCl2 + 250-mM sucrose +10-mM HEPES adjusted to pH 7.3 using concentrated HCl.Phosphate buffered sucrose solution contains 272-mM su-crose + 7-mM K2HPO4 and is pH adjusted to 7.4 withphosphoric acid. HBS and PBS HEPES consistently pro-duced high transfection efficiency and/or cell survival, sowe performed secondary experiments using permutationsof pH and buffer composition: 75% PBS/25% HBS, 50%PBS/50% HBS, 25% PBS/75% HBS, PBS 1% HEPES (pH7.0), PBS 1.5% HEPES (pH 7.0), PBS 1.5% HEPES (pH6.4), PBS 1.5% HEPES (pH 7.4) and PBS 2% HEPES (pH7.0). Because PBS 1.5% HEPES (pH 7.0) in combinationwith the FF120 pulse code yielded relatively few nucleofec-tion errors, had high transfection efficiency, and relativelyhigh cell survival with HEK293T cells, this protocol wasused for all subsequent experiments.
Nucleofection protocol
A detailed 3′LIFE protocol is included in the Supplemen-tary Materials and Methods and updates are available at
www.mangonelab.com. In brief, cells were grown to ∼90%confluency and passaged between 24 and 48 h prior to trans-fection to be in logarithmic growth phase at the time oftransfection. Cells were removed from a 145-mm parent cul-ture plate with 0.25% trypsin (Fisher) for 3 min, washedwith an equal volume of media and spun for 5 min at 300 g.Media/trypsin was eluted and cell pellet was resuspendedto a density of ∼3.0 × 10⁷ cells/ml. For each well, 100 000cells were pelleted and resuspended in 20 �l of nucleofectionbuffer/plasmid solution, in the presence of no more than2 �l of plasmid DNA (10% total volume). Each well con-tained a plasmid solution composed of 500 ng of pLIFE-miRNA and 100 ng of pLIFE-3′UTR. Cell/buffer solutionwas loaded into a 96-well shuttle plate and transfected vianucleofection using the 96-well Shuttle System accordingto manufacturer’s conditions (Lonza). Immediately follow-ing nucleofection, 80 �l of pre-warmed complete media wasadded into each well. Transfected cells were then transferredto a 96-well culture plate to a total volume of 200-�l media.Each plate containing human 3′UTRs cloned into pLIFE-3′UTR vector was transfected in quadruplicate, with eachreplicate co-transfected with either the empty miRNA vec-tor control, pLIFE-miR let-7c or miR-10b. Transfected cellswere incubated for 48–72 h post transfection to minimizenon-specific effects caused by cascades of changing gene ex-pression due to exogenous miRNAs. Cell are then imagedusing fluorescence microscopy and dsRed2 protein to iden-tify wells with failed transfections, and subjected to the lu-ciferase assay.
Luciferase assay
Prior to luciferase assay, the media was removed and cellswere lysed for 30 min in the presence of 26 �l of pas-sive lysis buffer (Promega) and gentle rocking. 25 �l of to-tal lysate was removed from the culture plate and trans-ferred to opaque white 96-well plates and used in the lumi-nescence assay. The non-commercial dual-luciferase bufferwas prepared as previously described (23). Coelenterazine(Promega) was resuspended in 5-mM acidified methanoland stored at −80◦C. Beetle luciferin (Promega) was re-suspended in nuclease-free water and stored at −80◦C. In-dividual buffer components were prepared and stored at10X concentration. Buffers were prepared fresh with storedreagents prior to each luciferase assay. Luminescence wasmeasured using the Glomax 96 Microplate Luminometerwith dual injectors (Promega). 100-�l of firefly luciferaseand Renilla buffers were injected sequentially, followed bya 5-s delay and a 10-s measurement time.
Statistical analysis of luciferase assay
Raw data from firefly and Renilla luciferase luminescenceassay were recorded for each well. We calculated the ratiobetween firefly and Renilla using the relative light units ob-tained for each well, to control variation in DNA concentra-tions, cell number and transfection efficiency. The ratio ofthe firefly and Renilla luciferase values between the negativemiRNA control and its correspondent miRNA experimentwas then used to calculate the absolute repression (A) for
at Arizona State U
niversity West 2 on M
arch 25, 2015http://nar.oxfordjournals.org/
Dow
nloaded from
Nucleic Acids Research, 2014 5
each well using the following formula (1):
Absolute repression (A) = FLucwell/RLucwell
FLucblank/RLuccblank. (1)
The normalized repression value (N) was obtained by av-eraging the repression of every well across a plate and usedto normalize each well (2):
Normalized repression (N) = Awell
X̄ (Awell A1,A2...H12). (2)
This transformation measures repression as a function ofall the 3′UTRs on each plate and allows the comparison ofreplicates of the experiment, removing fluctuations in rawFLuc/Ren ratios caused by subtle variation in the luciferasebuffers and luminometers. Each plate is performed in qua-druplicate on different days, and normalized repression ra-tios for each well are averaged to obtain miRNA repressionindex (RI) (3):
miRNA repression index (RI) = X̄ (NReplicate 1,2,3,4). (3)
We then rank the results based on the RI value, and pu-tative hits are defined as 3′UTRs with an RI <0.80, andobtain a statistically significant repression (P < 0.05) usingstudent’s t-test.
pLIFE-PGK secondary screen
To quantify PGK expression levels, pmiRNA-LIFEor pmiRNA-LIFE-PGK was cotransfected with thepmaxGFP plasmid (Lonza). Fluorescent images for RFPand GFP were obtained, and expression levels were calcu-lated using ImageJ (NIH) with standard parameters. Totest the effect of miRNA overexpression on positive hits,one plate containing 87 3′UTRs was screened for targetingby let-7c and miR-10b driven by the PGK promoter.Experiments were performed with four replicates. Resultswere analyzed as above.
MiRNA target literature review
The genes with an RI score <0.8 and P-value <0.05 wereanalyzed in a literature search for potential contributionsto tumorigenesis. In the case of a gene having roles in tu-mors of different origins, emphasis was placed on tumorsoriginating in breast tissues due to the relevance of let-7cand miR-10b to breast cancer progression. Criteria for plac-ing each gene into a category as either a positive or negativedriver of tumorigenesis included evidence of overexpressionor downregulation, if its role was classified in at least twopublications, and was associated with a defined mechanismof action. Cases where a gene has opposing roles in distincttissues of origin are noted with dual color annotation. Ref-erences used in this analysis are provided in SupplementaryTable S3.
MiRNA target alignment
The 3′UTRs of top putative hits were analyzed for poten-tial miRNA target sites using ClustalW (48). To identifyboth canonical and likely non-canonical targets, individual
alignments were attempted for nucleotides 2–7, 1–9, 10–22,and the entirety of the miRNA, against each 3′UTR. Thegap open and gap extension parameters were adjusted be-tween 10–25 and 0.5–5, respectively, to obtain the best align-ment in terms of seed binding and 3′ compensatory com-plementarity. To create the miRNA binding footprint weused the WebLogo software (49). Gaps in the binding foot-print corresponding to loops in the mRNA were removedleaving only the nucleotides that interact with the miRNA.G:U wobbles were accounted for by first running the soft-ware with all normal sequences. Second, we temporarily re-placed all U’s in mRNA sequence with C if the interactingmiRNA nucleotide corresponded with a G and replaced allG’s with A if the corresponding miRNA nucleotide was aU. Third, we reran the software, measuring the height of thecombined wobble peaks, and fourth, corrected the originalWebLogo with the heights corresponding to the number ofbits expected if G:U wobbles are accounted for.
Comparison with AGO-HITS-CLIP CLASH data set fromHelwak et al. (2013)
The complete Supplementary data set from (50) wasdownloaded from www.cell.com/cell/fulltext/S0092-8674(13)00439-X. Chimeric reads from all let-7 andmiR-10 family members were searched for genes that werealso present in the 3′LIFE library. Genes whose readsmapped to regions other than the 3′UTR were binnedseparately. Genes with chimeric reads in the 3′UTR werecompared against the scores from the 3′LIFE assay.
Analysis of 3′UTR conservation using PhyloP
For each hit in the 3′LIFE assay that contained a canonicalseed, defined as perfect complementarity with no G:U wob-bles in nucleotides 2–7 of the miRNA, conservation scoreswere identified using the 100 vertebrates Basewise Conser-vation by PhyloP track (51) in the UCSC genome browser.For each gene conservation scores for three loci were ob-tained: the six nucleotide seed, 200 nucleotides flanking theseed (score includes seed site), and up to 200 nucleotidesof the terminal exon. The conservation score for each nu-cleotide in these loci were averaged, and this mean conserva-tion score for each locus was plotted as a schematic againsta hypothetical gene model.
RESULTS
MiRNA target predictions have high false-negative rates
Several algorithms have been developed to predictmiRNA/mRNA interactions in 3′UTRs corresponding toeach gene in the genome (7). Predictions for miRNA targetsare generally based on the characteristics of previouslyvalidated miRNA target elements and utilize additionalparameters, such as site conservation, to refine putativetarget lists. These algorithms generate hundreds to thou-sands of predicted interactions for each miRNA, and thuscan be used to analyze miRNA targets on a systems level.However, several groups have reported high false-positive(12,13) and false-negative rates (9,10). We measured theefficacy of three widely utilized algorithms, TargetScan
at Arizona State U
niversity West 2 on M
arch 25, 2015http://nar.oxfordjournals.org/
Dow
nloaded from
6 Nucleic Acids Research, 2014
(5), Diana-microT (42) and PicTar (8) to identify the mostpredictive algorithm to compare against results from the3′LIFE assay. We selected five miRNAs based on theirsignificant presence in the literature and relevance to cancerand compared the predicted targets with experimentallyvalidated targets from the literature (Supplementary FigureS1A–C). Despite the wide body of literature on these miR-NAs (thousands in PubMed), there are only 64 validatedtargets, representing ∼2% of all bioinformatic predictions.TargetScan correctly predicted 66% of experimentallyvalidated targets with the conservation filter enabled, whileDiana-microT and PicTar predicted 53% and 47% of val-idated targets, respectively (Supplementary Figure S1D).However, TargetScan predicted 3236 targets, comparedto 2001 by PicTar, which may account for differences infalse-negative rates. We compared all hits from the 3′LIFEassay against predictions from TargetScan because itcontained the lowest false-negative rate.
3′LIFE is a scalable method to rapidly detect miRNA targetsin high-throughput
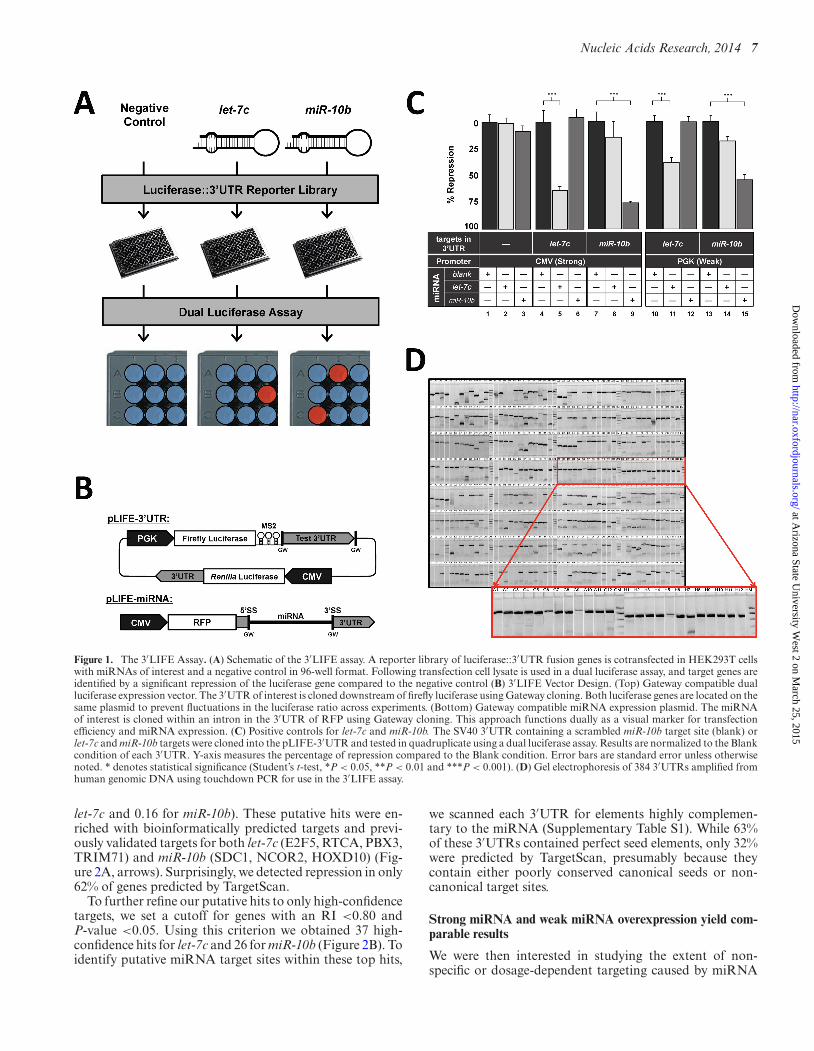
Luciferase-based assays are widely used to directly de-tect miRNA targeting due to their high sensitivity. Com-mercial high-throughput luciferase reagents are available,but are cost prohibitive for large-scale approaches. Toovercome these limitations, we have developed a cost-effective high-throughput assay that systematically screensmiRNA/mRNA interactions in an unbiased and standard-ized fashion. 3′LIFE is an adaptation of the dual luciferasereporter assay performed in high-throughput (Figure 1).The dual luciferase assay relies on the fusion of a test 3′UTRto a luminescent reporter gene. Targeting and translationalrepression of the test 3′UTR by a probe miRNA is identi-fied by a decrease in the luciferase::3′UTR signal (firefly lu-ciferase) relative to a second normalization signal (Renillaluciferase) (Figure 1A, red spots). To account for endoge-nous miRNAs that may target the luciferase reporter, we in-clude a no miRNA negative control, which provides a base-line from which to detect targeting by the exogenous testmiRNAs. 3′LIFE is designed to rapidly identify functionaltargets of a given miRNA in a panel of hundreds of test3′UTRs in co-transfection experiments.
3′LIFE uses two specially designed vectors to expressthe test 3′UTRs (pLIFE-3′UTR) and the miRNA (pLIFE-miRNA) (Figure 1B). In the pLIFE-3′UTR vector, the twoluciferase genes were cloned into the same plasmid to pre-vent fluctuations in their molar ratios across separate trans-fections. We have also included a Gateway-compatible re-combination cassette (GW) cloned downstream of the fire-fly luciferase gene to efficiently shuttle test 3′UTRs into thepLIFE-3′UTR vector (Figure 1B (top) and SupplementaryFigure S2A). In the pLIFE-miRNA vector, the miRNA iscloned within an intron in the 3′UTR of the red fluorescentprotein (45) (Figure 1B (bottom) and Supplementary Fig-ures S2B and S3), dually functioning as a marker for trans-fection efficiency and miRNA expression (SupplementaryFigure S3B).
To test the processing and functional activity of themiRNA expression vectors, we introduced perfect tar-get sites for each miRNA into the SV40 3′UTR and
co-transfected the pLIFE-SV40 vectors with a negativemiRNA control, let-7c or miR-10b. Each miRNA stronglyrepressed only the 3′UTR containing its target site, confirm-ing the processing of the miRNA and demonstrating thespecificity of the targeting (Figure 1C, panels 4–9).
Overexpression of exogenous miRNAs may cause non-specific or dosage-dependent effects. To test this hypothe-sis, we replaced the CMV promoter present in the pLIFE-miRNA vector with the weaker PGK promoter (pLIFE-PGK). In HEK293T cells, the CMV promoter was pre-viously reported to be approximately five times strongerthan PGK (52), a result echoed by our own analysis of flu-orescence expression (Supplementary Figure S4). Impor-tantly, the PGK promoter is also used to drive expres-sion of the firefly luciferase::3′UTR reporter, thus expres-sion levels of these two genes should be equivalent in thepmiRNA-PGK experiment. Repeating the SV40 targetingexperiments with the pLIFE-PGK miRNA expression vec-tor yielded decreased translational repression (Figure 1C,panels 10–15), although not to the extent expected by de-creasing expression levels 80% (Figure 1C, compare panel5 with panel 11, and panel 9 with panel 15). While it ispossible that the translation of the RFP may be effectedby unknown 5’UTR elements provided by the CMV andPGK promoters, the strong functional differences betweenthe same miRNA driven by these two promoters suggeststhat there are transcriptional differences(Figure 1C, Supple-mentary Figure 3).
The feasibility of high-throughput dual luciferase assaysis limited by high costs associated with transfection and lu-ciferase assay reagents, and the lack of a publicly availablehuman 3′UTR library. Furthermore, genome-wide screensfor miRNA targets are challenged by the need for appropri-ate high-throughput technologies and pipelines. 3′LIFE as-say utilizes low-cost non-proprietary transfection and dual-luciferase reagents (23) (Supplementary Figure S5). Wehave designed each step of the 3′UTR cloning pipeline andthe 3′LIFE assay to be highly automated (SupplementaryFigure S6). PCR, cloning, plasmid DNA preparation, cellculture, transfection and luciferase assays are performedin 96-well format using multi-channel micropipettes, dedi-cated liquid handling robots and other high-throughput in-strumentation.
To test the 3′LIFE assay, we chose a pilot library of 384human 3′UTRs containing experimentally validated tar-gets (n = 10) and bioinformatically predicted targets (n =47) of let-7c and miR-10b, as well as genes that play regu-latory roles in tumorigenesis (Figure 1D and Supplemen-tary Table S2). This human 3′UTR clone collection is pub-lically available through the DNASU plasmid repository(http://dnasu.org) (44). More clones are periodically addedto the library, with the goal of covering the entire human3′UTRome.
Here, we screened 275 of these 3′UTRs for potentialtargeting by each miRNA, performing four replicates ofeach experiment using the pLIFE-miRNA vector (totaling∼3500 transfection reactions and luciferase assays). To de-tect miRNA targeting, each 3′UTR was co-transfected withthe miRNA, and the luciferase ratio was compared to a neg-ative control. Putative hits are defined as those that havean RI below the mean standard error of the assay (0.15 for
at Arizona State U
niversity West 2 on M
arch 25, 2015http://nar.oxfordjournals.org/
Dow
nloaded from
Nucleic Acids Research, 2014 7
Figure 1. The 3′LIFE Assay. (A) Schematic of the 3′LIFE assay. A reporter library of luciferase::3′UTR fusion genes is cotransfected in HEK293T cellswith miRNAs of interest and a negative control in 96-well format. Following transfection cell lysate is used in a dual luciferase assay, and target genes areidentified by a significant repression of the luciferase gene compared to the negative control (B) 3′LIFE Vector Design. (Top) Gateway compatible dualluciferase expression vector. The 3′UTR of interest is cloned downstream of firefly luciferase using Gateway cloning. Both luciferase genes are located on thesame plasmid to prevent fluctuations in the luciferase ratio across experiments. (Bottom) Gateway compatible miRNA expression plasmid. The miRNAof interest is cloned within an intron in the 3′UTR of RFP using Gateway cloning. This approach functions dually as a visual marker for transfectionefficiency and miRNA expression. (C) Positive controls for let-7c and miR-10b. The SV40 3′UTR containing a scrambled miR-10b target site (blank) orlet-7c and miR-10b targets were cloned into the pLIFE-3′UTR and tested in quadruplicate using a dual luciferase assay. Results are normalized to the Blankcondition of each 3′UTR. Y-axis measures the percentage of repression compared to the Blank condition. Error bars are standard error unless otherwisenoted. * denotes statistical significance (Student’s t-test, *P < 0.05, **P < 0.01 and ***P < 0.001). (D) Gel electrophoresis of 384 3′UTRs amplified fromhuman genomic DNA using touchdown PCR for use in the 3′LIFE assay.
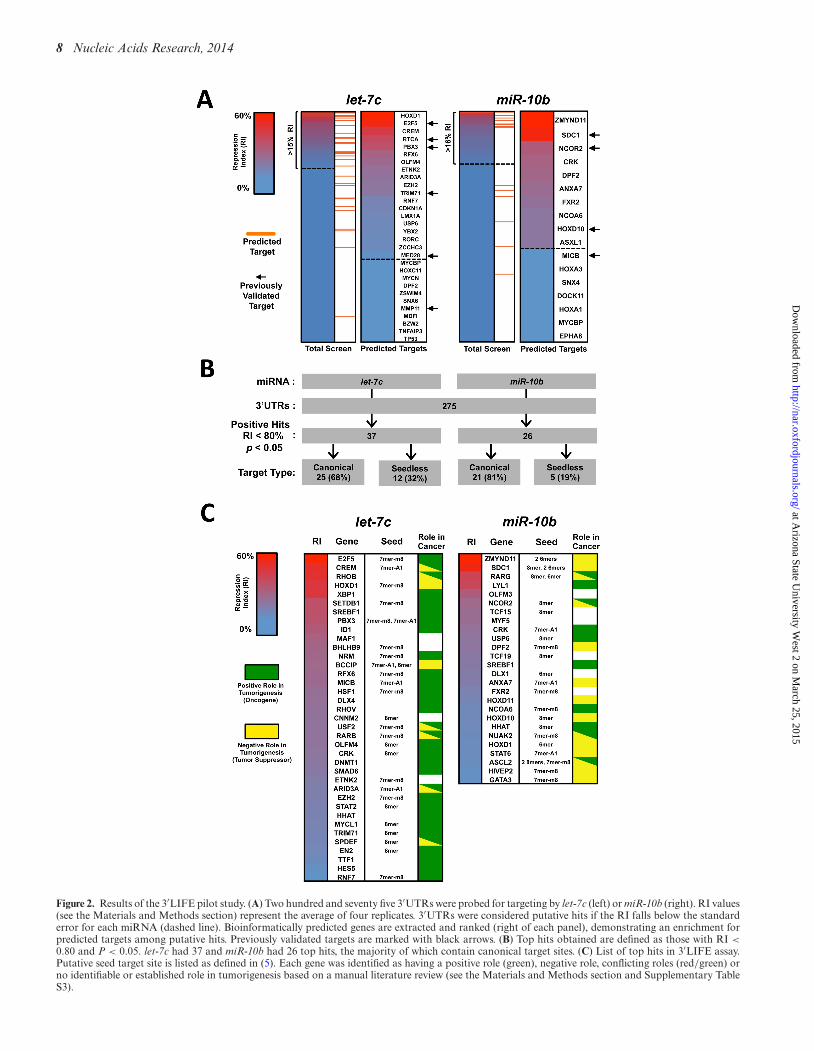
let-7c and 0.16 for miR-10b). These putative hits were en-riched with bioinformatically predicted targets and previ-ously validated targets for both let-7c (E2F5, RTCA, PBX3,TRIM71) and miR-10b (SDC1, NCOR2, HOXD10) (Fig-ure 2A, arrows). Surprisingly, we detected repression in only62% of genes predicted by TargetScan.
To further refine our putative hits to only high-confidencetargets, we set a cutoff for genes with an RI <0.80 andP-value <0.05. Using this criterion we obtained 37 high-confidence hits for let-7c and 26 for miR-10b (Figure 2B). Toidentify putative miRNA target sites within these top hits,
we scanned each 3′UTR for elements highly complemen-tary to the miRNA (Supplementary Table S1). While 63%of these 3′UTRs contained perfect seed elements, only 32%were predicted by TargetScan, presumably because theycontain either poorly conserved canonical seeds or non-canonical target sites.
Strong miRNA and weak miRNA overexpression yield com-parable results
We were then interested in studying the extent of non-specific or dosage-dependent targeting caused by miRNA
at Arizona State U
niversity West 2 on M
arch 25, 2015http://nar.oxfordjournals.org/
Dow
nloaded from
8 Nucleic Acids Research, 2014
Figure 2. Results of the 3′LIFE pilot study. (A) Two hundred and seventy five 3′UTRs were probed for targeting by let-7c (left) or miR-10b (right). RI values(see the Materials and Methods section) represent the average of four replicates. 3′UTRs were considered putative hits if the RI falls below the standarderror for each miRNA (dashed line). Bioinformatically predicted genes are extracted and ranked (right of each panel), demonstrating an enrichment forpredicted targets among putative hits. Previously validated targets are marked with black arrows. (B) Top hits obtained are defined as those with RI <
0.80 and P < 0.05. let-7c had 37 and miR-10b had 26 top hits, the majority of which contain canonical target sites. (C) List of top hits in 3′LIFE assay.Putative seed target site is listed as defined in (5). Each gene was identified as having a positive role (green), negative role, conflicting roles (red/green) orno identifiable or established role in tumorigenesis based on a manual literature review (see the Materials and Methods section and Supplementary TableS3).
at Arizona State U
niversity West 2 on M
arch 25, 2015http://nar.oxfordjournals.org/
Dow
nloaded from
Nucleic Acids Research, 2014 9
overexpression. We rescreened one plate of 3′UTRs (n =87) using the pLIFE-PGK miRNA expression vector, re-peating the assay in quadruplicate (a total of 1152 transfec-tion reactions and luciferase assays) (Supplementary FigureS7A). The RI of each gene tested against varying extents ofmiRNA overexpression yielded largely comparable results,with the majority of genes having some degree of repressionin both, or neither (Supplementary Figure S7A). Amongthe top hits obtained with pLIFE-miRNA vectors, 77% oftargets were also repressed with the pLIFE-PGK vectors,albeit generally to a lesser degree (Supplementary FigureS7B and C). We obtained three genes not repressed with thepLIFE-miRNA screen that show significant repression (RI< 0.80, P < 0.05) by miR-10b in the pLIFE-PGK experi-ment (AATK, HOXA1, KRT1). HOXA1 and KRT1 con-tain perfect seed matches for miR-10b, while AATK con-tains a highly complementary non-canonical target (Sup-plementary Figure S7D). In conclusion, these data suggestthat while there may be a dosage effect for a small portionof miRNA targets, the majority of targets show consistentrepression regardless of the degree of miRNA overexpres-sion.
Putative miRNA target genes have functions consistent withknown role of each miRNA in cancer
We next sought to identify potential correlations betweenthe functional role of each miRNA in tumorigenesis andthe novel targets identified by our pilot 3′LIFE assay. Weperformed a literature review for the top gene targets to de-termine if our ‘bona fide’ targets were previously recognizedto have positive or negative contributions to tumorigene-sis (Figure 2C and Supplementary Table S3). let-7c targetsidentified by the 3′LIFE assay are generally overexpressedin tumors and have positive roles in tumorigenesis, whichis consistent with the tumor suppressor function of let-7c.Conversely, miR-10b target genes are typically downregu-lated in late-stage tumors and inhibit cancer progressionand metastasis, which is also consistent with miR-10b as anindicator of late-stage, aggressive tumors (Figure 2C).
Each miRNA exhibits a unique binding footprint
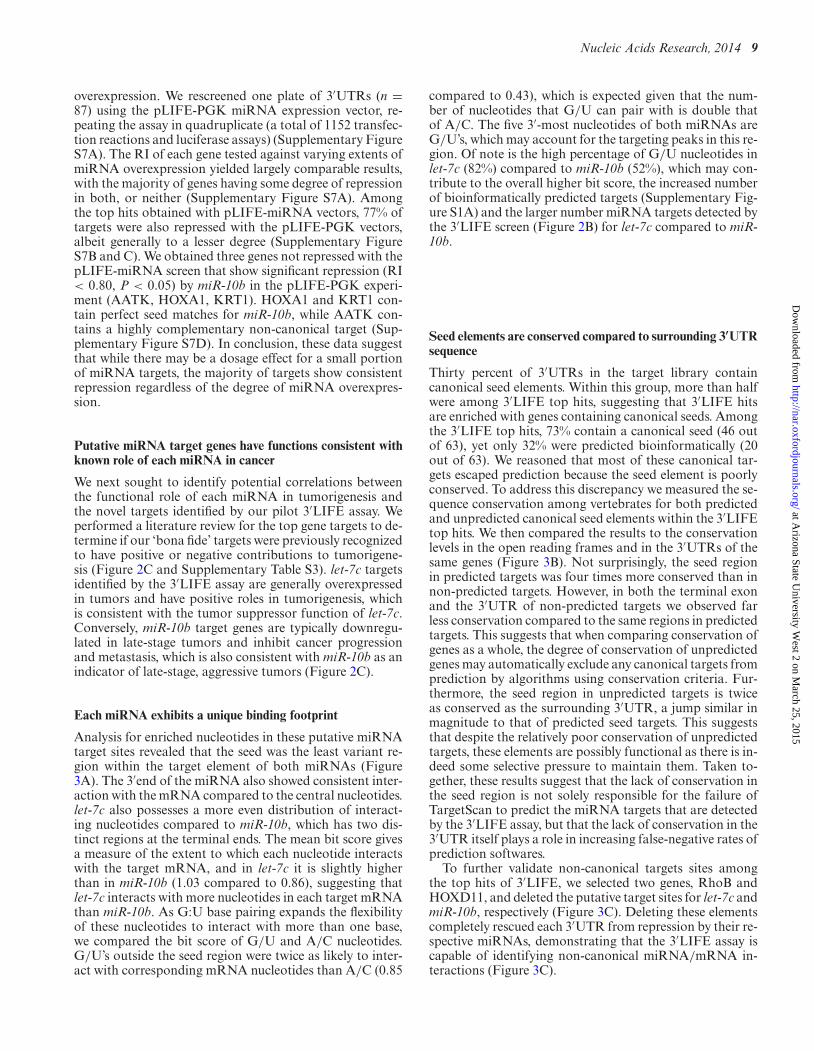
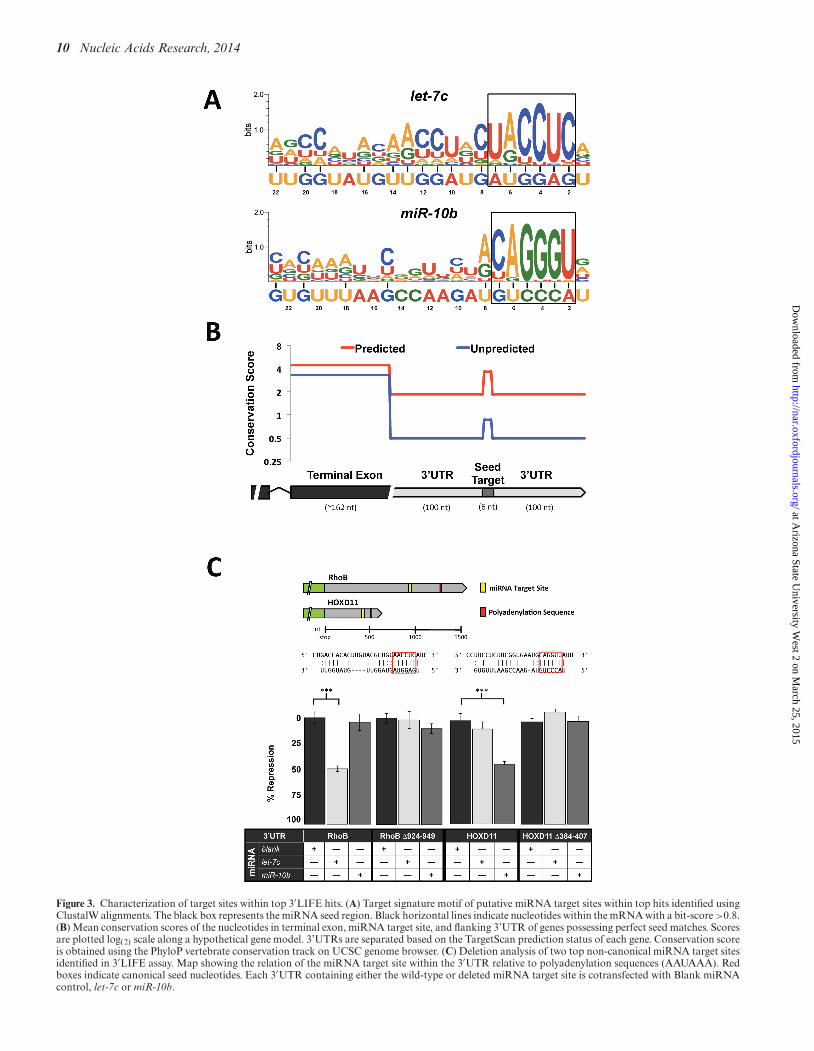
Analysis for enriched nucleotides in these putative miRNAtarget sites revealed that the seed was the least variant re-gion within the target element of both miRNAs (Figure3A). The 3′end of the miRNA also showed consistent inter-action with the mRNA compared to the central nucleotides.let-7c also possesses a more even distribution of interact-ing nucleotides compared to miR-10b, which has two dis-tinct regions at the terminal ends. The mean bit score givesa measure of the extent to which each nucleotide interactswith the target mRNA, and in let-7c it is slightly higherthan in miR-10b (1.03 compared to 0.86), suggesting thatlet-7c interacts with more nucleotides in each target mRNAthan miR-10b. As G:U base pairing expands the flexibilityof these nucleotides to interact with more than one base,we compared the bit score of G/U and A/C nucleotides.G/U’s outside the seed region were twice as likely to inter-act with corresponding mRNA nucleotides than A/C (0.85
compared to 0.43), which is expected given that the num-ber of nucleotides that G/U can pair with is double thatof A/C. The five 3′-most nucleotides of both miRNAs areG/U’s, which may account for the targeting peaks in this re-gion. Of note is the high percentage of G/U nucleotides inlet-7c (82%) compared to miR-10b (52%), which may con-tribute to the overall higher bit score, the increased numberof bioinformatically predicted targets (Supplementary Fig-ure S1A) and the larger number miRNA targets detected bythe 3′LIFE screen (Figure 2B) for let-7c compared to miR-10b.
Seed elements are conserved compared to surrounding 3′UTRsequence
Thirty percent of 3′UTRs in the target library containcanonical seed elements. Within this group, more than halfwere among 3′LIFE top hits, suggesting that 3′LIFE hitsare enriched with genes containing canonical seeds. Amongthe 3′LIFE top hits, 73% contain a canonical seed (46 outof 63), yet only 32% were predicted bioinformatically (20out of 63). We reasoned that most of these canonical tar-gets escaped prediction because the seed element is poorlyconserved. To address this discrepancy we measured the se-quence conservation among vertebrates for both predictedand unpredicted canonical seed elements within the 3′LIFEtop hits. We then compared the results to the conservationlevels in the open reading frames and in the 3′UTRs of thesame genes (Figure 3B). Not surprisingly, the seed regionin predicted targets was four times more conserved than innon-predicted targets. However, in both the terminal exonand the 3′UTR of non-predicted targets we observed farless conservation compared to the same regions in predictedtargets. This suggests that when comparing conservation ofgenes as a whole, the degree of conservation of unpredictedgenes may automatically exclude any canonical targets fromprediction by algorithms using conservation criteria. Fur-thermore, the seed region in unpredicted targets is twiceas conserved as the surrounding 3′UTR, a jump similar inmagnitude to that of predicted seed targets. This suggeststhat despite the relatively poor conservation of unpredictedtargets, these elements are possibly functional as there is in-deed some selective pressure to maintain them. Taken to-gether, these results suggest that the lack of conservation inthe seed region is not solely responsible for the failure ofTargetScan to predict the miRNA targets that are detectedby the 3′LIFE assay, but that the lack of conservation in the3′UTR itself plays a role in increasing false-negative rates ofprediction softwares.
To further validate non-canonical targets sites amongthe top hits of 3′LIFE, we selected two genes, RhoB andHOXD11, and deleted the putative target sites for let-7c andmiR-10b, respectively (Figure 3C). Deleting these elementscompletely rescued each 3′UTR from repression by their re-spective miRNAs, demonstrating that the 3′LIFE assay iscapable of identifying non-canonical miRNA/mRNA in-teractions (Figure 3C).
at Arizona State U
niversity West 2 on M
arch 25, 2015http://nar.oxfordjournals.org/
Dow
nloaded from
10 Nucleic Acids Research, 2014
Figure 3. Characterization of target sites within top 3′LIFE hits. (A) Target signature motif of putative miRNA target sites within top hits identified usingClustalW alignments. The black box represents the miRNA seed region. Black horizontal lines indicate nucleotides within the mRNA with a bit-score >0.8.(B) Mean conservation scores of the nucleotides in terminal exon, miRNA target site, and flanking 3’UTR of genes possessing perfect seed matches. Scoresare plotted log(2) scale along a hypothetical gene model. 3’UTRs are separated based on the TargetScan prediction status of each gene. Conservation scoreis obtained using the PhyloP vertebrate conservation track on UCSC genome browser. (C) Deletion analysis of two top non-canonical miRNA target sitesidentified in 3′LIFE assay. Map showing the relation of the miRNA target site within the 3′UTR relative to polyadenylation sequences (AAUAAA). Redboxes indicate canonical seed nucleotides. Each 3′UTR containing either the wild-type or deleted miRNA target site is cotransfected with Blank miRNAcontrol, let-7c or miR-10b.
at Arizona State U
niversity West 2 on M
arch 25, 2015http://nar.oxfordjournals.org/
Dow
nloaded from
Nucleic Acids Research, 2014 11
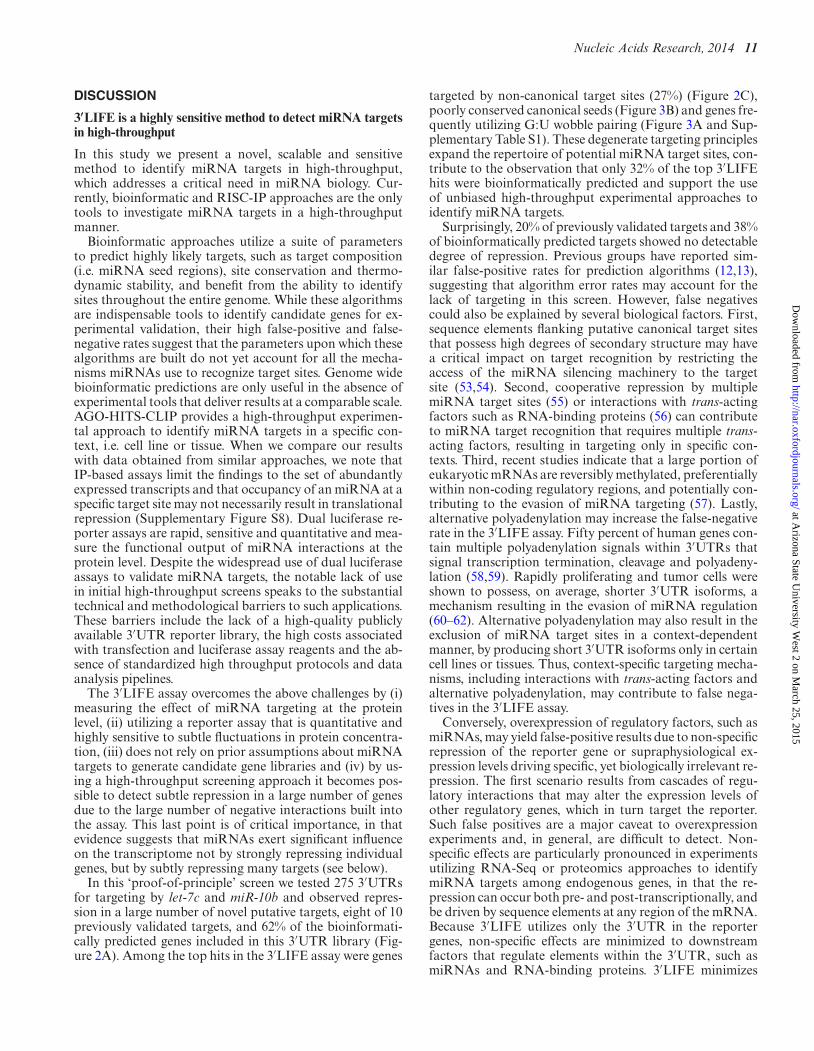
DISCUSSION
3′LIFE is a highly sensitive method to detect miRNA targetsin high-throughput
In this study we present a novel, scalable and sensitivemethod to identify miRNA targets in high-throughput,which addresses a critical need in miRNA biology. Cur-rently, bioinformatic and RISC-IP approaches are the onlytools to investigate miRNA targets in a high-throughputmanner.
Bioinformatic approaches utilize a suite of parametersto predict highly likely targets, such as target composition(i.e. miRNA seed regions), site conservation and thermo-dynamic stability, and benefit from the ability to identifysites throughout the entire genome. While these algorithmsare indispensable tools to identify candidate genes for ex-perimental validation, their high false-positive and false-negative rates suggest that the parameters upon which thesealgorithms are built do not yet account for all the mecha-nisms miRNAs use to recognize target sites. Genome widebioinformatic predictions are only useful in the absence ofexperimental tools that deliver results at a comparable scale.AGO-HITS-CLIP provides a high-throughput experimen-tal approach to identify miRNA targets in a specific con-text, i.e. cell line or tissue. When we compare our resultswith data obtained from similar approaches, we note thatIP-based assays limit the findings to the set of abundantlyexpressed transcripts and that occupancy of an miRNA at aspecific target site may not necessarily result in translationalrepression (Supplementary Figure S8). Dual luciferase re-porter assays are rapid, sensitive and quantitative and mea-sure the functional output of miRNA interactions at theprotein level. Despite the widespread use of dual luciferaseassays to validate miRNA targets, the notable lack of usein initial high-throughput screens speaks to the substantialtechnical and methodological barriers to such applications.These barriers include the lack of a high-quality publiclyavailable 3′UTR reporter library, the high costs associatedwith transfection and luciferase assay reagents and the ab-sence of standardized high throughput protocols and dataanalysis pipelines.
The 3′LIFE assay overcomes the above challenges by (i)measuring the effect of miRNA targeting at the proteinlevel, (ii) utilizing a reporter assay that is quantitative andhighly sensitive to subtle fluctuations in protein concentra-tion, (iii) does not rely on prior assumptions about miRNAtargets to generate candidate gene libraries and (iv) by us-ing a high-throughput screening approach it becomes pos-sible to detect subtle repression in a large number of genesdue to the large number of negative interactions built intothe assay. This last point is of critical importance, in thatevidence suggests that miRNAs exert significant influenceon the transcriptome not by strongly repressing individualgenes, but by subtly repressing many targets (see below).
In this ‘proof-of-principle’ screen we tested 275 3′UTRsfor targeting by let-7c and miR-10b and observed repres-sion in a large number of novel putative targets, eight of 10previously validated targets, and 62% of the bioinformati-cally predicted genes included in this 3′UTR library (Fig-ure 2A). Among the top hits in the 3′LIFE assay were genes
targeted by non-canonical target sites (27%) (Figure 2C),poorly conserved canonical seeds (Figure 3B) and genes fre-quently utilizing G:U wobble pairing (Figure 3A and Sup-plementary Table S1). These degenerate targeting principlesexpand the repertoire of potential miRNA target sites, con-tribute to the observation that only 32% of the top 3′LIFEhits were bioinformatically predicted and support the useof unbiased high-throughput experimental approaches toidentify miRNA targets.
Surprisingly, 20% of previously validated targets and 38%of bioinformatically predicted targets showed no detectabledegree of repression. Previous groups have reported sim-ilar false-positive rates for prediction algorithms (12,13),suggesting that algorithm error rates may account for thelack of targeting in this screen. However, false negativescould also be explained by several biological factors. First,sequence elements flanking putative canonical target sitesthat possess high degrees of secondary structure may havea critical impact on target recognition by restricting theaccess of the miRNA silencing machinery to the targetsite (53,54). Second, cooperative repression by multiplemiRNA target sites (55) or interactions with trans-actingfactors such as RNA-binding proteins (56) can contributeto miRNA target recognition that requires multiple trans-acting factors, resulting in targeting only in specific con-texts. Third, recent studies indicate that a large portion ofeukaryotic mRNAs are reversibly methylated, preferentiallywithin non-coding regulatory regions, and potentially con-tributing to the evasion of miRNA targeting (57). Lastly,alternative polyadenylation may increase the false-negativerate in the 3′LIFE assay. Fifty percent of human genes con-tain multiple polyadenylation signals within 3′UTRs thatsignal transcription termination, cleavage and polyadeny-lation (58,59). Rapidly proliferating and tumor cells wereshown to possess, on average, shorter 3′UTR isoforms, amechanism resulting in the evasion of miRNA regulation(60–62). Alternative polyadenylation may also result in theexclusion of miRNA target sites in a context-dependentmanner, by producing short 3′UTR isoforms only in certaincell lines or tissues. Thus, context-specific targeting mecha-nisms, including interactions with trans-acting factors andalternative polyadenylation, may contribute to false nega-tives in the 3′LIFE assay.
Conversely, overexpression of regulatory factors, such asmiRNAs, may yield false-positive results due to non-specificrepression of the reporter gene or supraphysiological ex-pression levels driving specific, yet biologically irrelevant re-pression. The first scenario results from cascades of regu-latory interactions that may alter the expression levels ofother regulatory genes, which in turn target the reporter.Such false positives are a major caveat to overexpressionexperiments and, in general, are difficult to detect. Non-specific effects are particularly pronounced in experimentsutilizing RNA-Seq or proteomics approaches to identifymiRNA targets among endogenous genes, in that the re-pression can occur both pre- and post-transcriptionally, andbe driven by sequence elements at any region of the mRNA.Because 3′LIFE utilizes only the 3′UTR in the reportergenes, non-specific effects are minimized to downstreamfactors that regulate elements within the 3′UTR, such asmiRNAs and RNA-binding proteins. 3′LIFE minimizes
at Arizona State U
niversity West 2 on M
arch 25, 2015http://nar.oxfordjournals.org/
Dow
nloaded from
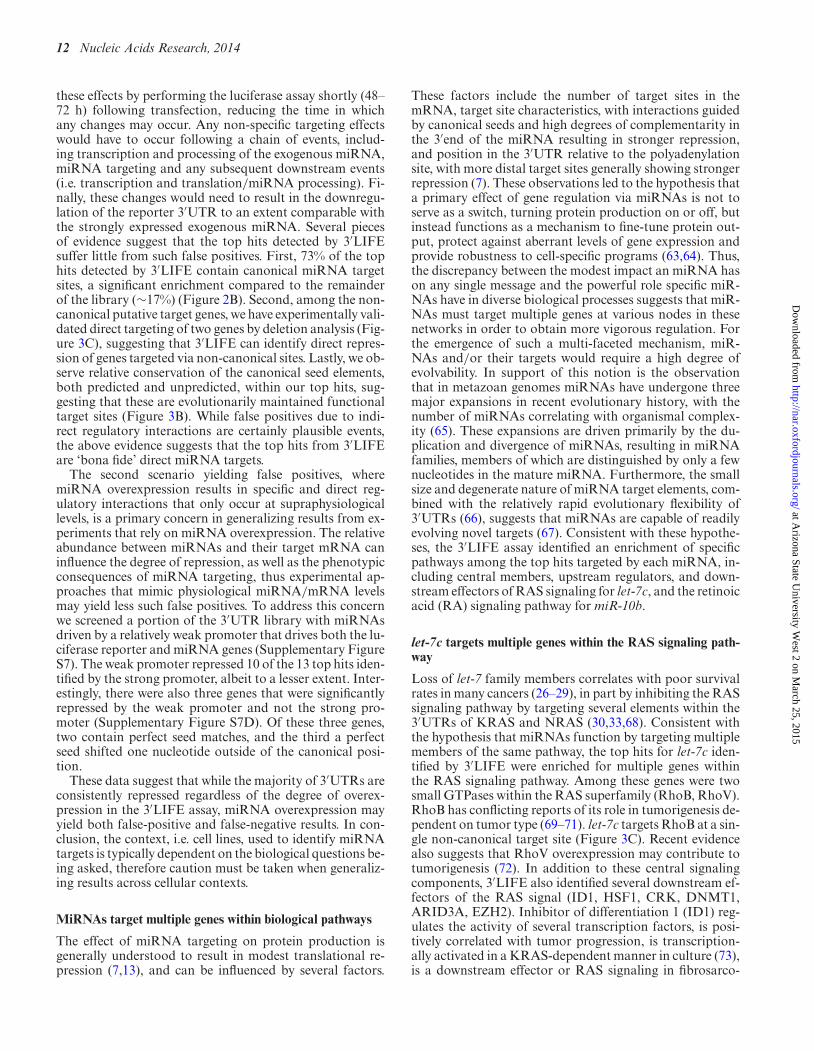
12 Nucleic Acids Research, 2014
these effects by performing the luciferase assay shortly (48–72 h) following transfection, reducing the time in whichany changes may occur. Any non-specific targeting effectswould have to occur following a chain of events, includ-ing transcription and processing of the exogenous miRNA,miRNA targeting and any subsequent downstream events(i.e. transcription and translation/miRNA processing). Fi-nally, these changes would need to result in the downregu-lation of the reporter 3′UTR to an extent comparable withthe strongly expressed exogenous miRNA. Several piecesof evidence suggest that the top hits detected by 3′LIFEsuffer little from such false positives. First, 73% of the tophits detected by 3′LIFE contain canonical miRNA targetsites, a significant enrichment compared to the remainderof the library (∼17%) (Figure 2B). Second, among the non-canonical putative target genes, we have experimentally vali-dated direct targeting of two genes by deletion analysis (Fig-ure 3C), suggesting that 3′LIFE can identify direct repres-sion of genes targeted via non-canonical sites. Lastly, we ob-serve relative conservation of the canonical seed elements,both predicted and unpredicted, within our top hits, sug-gesting that these are evolutionarily maintained functionaltarget sites (Figure 3B). While false positives due to indi-rect regulatory interactions are certainly plausible events,the above evidence suggests that the top hits from 3′LIFEare ‘bona fide’ direct miRNA targets.
The second scenario yielding false positives, wheremiRNA overexpression results in specific and direct reg-ulatory interactions that only occur at supraphysiologicallevels, is a primary concern in generalizing results from ex-periments that rely on miRNA overexpression. The relativeabundance between miRNAs and their target mRNA caninfluence the degree of repression, as well as the phenotypicconsequences of miRNA targeting, thus experimental ap-proaches that mimic physiological miRNA/mRNA levelsmay yield less such false positives. To address this concernwe screened a portion of the 3′UTR library with miRNAsdriven by a relatively weak promoter that drives both the lu-ciferase reporter and miRNA genes (Supplementary FigureS7). The weak promoter repressed 10 of the 13 top hits iden-tified by the strong promoter, albeit to a lesser extent. Inter-estingly, there were also three genes that were significantlyrepressed by the weak promoter and not the strong pro-moter (Supplementary Figure S7D). Of these three genes,two contain perfect seed matches, and the third a perfectseed shifted one nucleotide outside of the canonical posi-tion.
These data suggest that while the majority of 3′UTRs areconsistently repressed regardless of the degree of overex-pression in the 3′LIFE assay, miRNA overexpression mayyield both false-positive and false-negative results. In con-clusion, the context, i.e. cell lines, used to identify miRNAtargets is typically dependent on the biological questions be-ing asked, therefore caution must be taken when generaliz-ing results across cellular contexts.
MiRNAs target multiple genes within biological pathways
The effect of miRNA targeting on protein production isgenerally understood to result in modest translational re-pression (7,13), and can be influenced by several factors.
These factors include the number of target sites in themRNA, target site characteristics, with interactions guidedby canonical seeds and high degrees of complementarity inthe 3′end of the miRNA resulting in stronger repression,and position in the 3′UTR relative to the polyadenylationsite, with more distal target sites generally showing strongerrepression (7). These observations led to the hypothesis thata primary effect of gene regulation via miRNAs is not toserve as a switch, turning protein production on or off, butinstead functions as a mechanism to fine-tune protein out-put, protect against aberrant levels of gene expression andprovide robustness to cell-specific programs (63,64). Thus,the discrepancy between the modest impact an miRNA hason any single message and the powerful role specific miR-NAs have in diverse biological processes suggests that miR-NAs must target multiple genes at various nodes in thesenetworks in order to obtain more vigorous regulation. Forthe emergence of such a multi-faceted mechanism, miR-NAs and/or their targets would require a high degree ofevolvability. In support of this notion is the observationthat in metazoan genomes miRNAs have undergone threemajor expansions in recent evolutionary history, with thenumber of miRNAs correlating with organismal complex-ity (65). These expansions are driven primarily by the du-plication and divergence of miRNAs, resulting in miRNAfamilies, members of which are distinguished by only a fewnucleotides in the mature miRNA. Furthermore, the smallsize and degenerate nature of miRNA target elements, com-bined with the relatively rapid evolutionary flexibility of3′UTRs (66), suggests that miRNAs are capable of readilyevolving novel targets (67). Consistent with these hypothe-ses, the 3′LIFE assay identified an enrichment of specificpathways among the top hits targeted by each miRNA, in-cluding central members, upstream regulators, and down-stream effectors of RAS signaling for let-7c, and the retinoicacid (RA) signaling pathway for miR-10b.
let-7c targets multiple genes within the RAS signaling path-way
Loss of let-7 family members correlates with poor survivalrates in many cancers (26–29), in part by inhibiting the RASsignaling pathway by targeting several elements within the3′UTRs of KRAS and NRAS (30,33,68). Consistent withthe hypothesis that miRNAs function by targeting multiplemembers of the same pathway, the top hits for let-7c iden-tified by 3′LIFE were enriched for multiple genes withinthe RAS signaling pathway. Among these genes were twosmall GTPases within the RAS superfamily (RhoB, RhoV).RhoB has conflicting reports of its role in tumorigenesis de-pendent on tumor type (69–71). let-7c targets RhoB at a sin-gle non-canonical target site (Figure 3C). Recent evidencealso suggests that RhoV overexpression may contribute totumorigenesis (72). In addition to these central signalingcomponents, 3′LIFE also identified several downstream ef-fectors of the RAS signal (ID1, HSF1, CRK, DNMT1,ARID3A, EZH2). Inhibitor of differentiation 1 (ID1) reg-ulates the activity of several transcription factors, is posi-tively correlated with tumor progression, is transcription-ally activated in a KRAS-dependent manner in culture (73),is a downstream effector or RAS signaling in fibrosarco-
at Arizona State U
niversity West 2 on M
arch 25, 2015http://nar.oxfordjournals.org/
Dow
nloaded from
Nucleic Acids Research, 2014 13
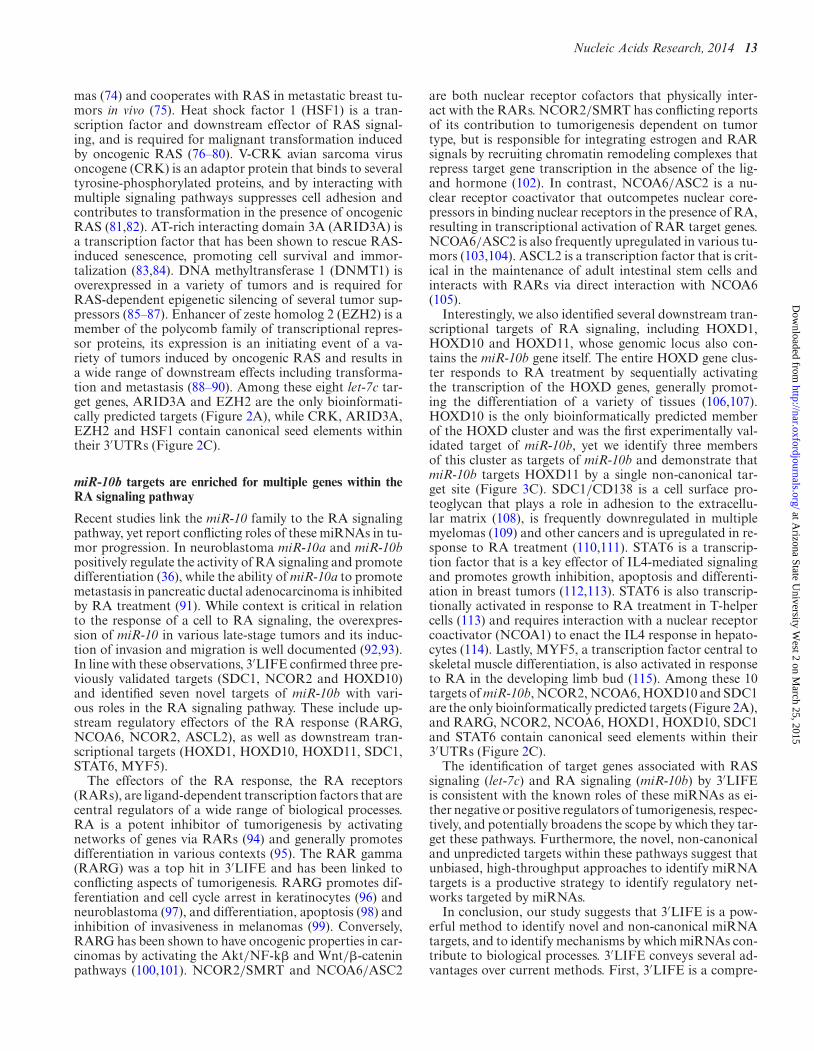
mas (74) and cooperates with RAS in metastatic breast tu-mors in vivo (75). Heat shock factor 1 (HSF1) is a tran-scription factor and downstream effector of RAS signal-ing, and is required for malignant transformation inducedby oncogenic RAS (76–80). V-CRK avian sarcoma virusoncogene (CRK) is an adaptor protein that binds to severaltyrosine-phosphorylated proteins, and by interacting withmultiple signaling pathways suppresses cell adhesion andcontributes to transformation in the presence of oncogenicRAS (81,82). AT-rich interacting domain 3A (ARID3A) isa transcription factor that has been shown to rescue RAS-induced senescence, promoting cell survival and immor-talization (83,84). DNA methyltransferase 1 (DNMT1) isoverexpressed in a variety of tumors and is required forRAS-dependent epigenetic silencing of several tumor sup-pressors (85–87). Enhancer of zeste homolog 2 (EZH2) is amember of the polycomb family of transcriptional repres-sor proteins, its expression is an initiating event of a va-riety of tumors induced by oncogenic RAS and results ina wide range of downstream effects including transforma-tion and metastasis (88–90). Among these eight let-7c tar-get genes, ARID3A and EZH2 are the only bioinformati-cally predicted targets (Figure 2A), while CRK, ARID3A,EZH2 and HSF1 contain canonical seed elements withintheir 3′UTRs (Figure 2C).
miR-10b targets are enriched for multiple genes within theRA signaling pathway
Recent studies link the miR-10 family to the RA signalingpathway, yet report conflicting roles of these miRNAs in tu-mor progression. In neuroblastoma miR-10a and miR-10bpositively regulate the activity of RA signaling and promotedifferentiation (36), while the ability of miR-10a to promotemetastasis in pancreatic ductal adenocarcinoma is inhibitedby RA treatment (91). While context is critical in relationto the response of a cell to RA signaling, the overexpres-sion of miR-10 in various late-stage tumors and its induc-tion of invasion and migration is well documented (92,93).In line with these observations, 3′LIFE confirmed three pre-viously validated targets (SDC1, NCOR2 and HOXD10)and identified seven novel targets of miR-10b with vari-ous roles in the RA signaling pathway. These include up-stream regulatory effectors of the RA response (RARG,NCOA6, NCOR2, ASCL2), as well as downstream tran-scriptional targets (HOXD1, HOXD10, HOXD11, SDC1,STAT6, MYF5).
The effectors of the RA response, the RA receptors(RARs), are ligand-dependent transcription factors that arecentral regulators of a wide range of biological processes.RA is a potent inhibitor of tumorigenesis by activatingnetworks of genes via RARs (94) and generally promotesdifferentiation in various contexts (95). The RAR gamma(RARG) was a top hit in 3′LIFE and has been linked toconflicting aspects of tumorigenesis. RARG promotes dif-ferentiation and cell cycle arrest in keratinocytes (96) andneuroblastoma (97), and differentiation, apoptosis (98) andinhibition of invasiveness in melanomas (99). Conversely,RARG has been shown to have oncogenic properties in car-cinomas by activating the Akt/NF-k� and Wnt/�-cateninpathways (100,101). NCOR2/SMRT and NCOA6/ASC2
are both nuclear receptor cofactors that physically inter-act with the RARs. NCOR2/SMRT has conflicting reportsof its contribution to tumorigenesis dependent on tumortype, but is responsible for integrating estrogen and RARsignals by recruiting chromatin remodeling complexes thatrepress target gene transcription in the absence of the lig-and hormone (102). In contrast, NCOA6/ASC2 is a nu-clear receptor coactivator that outcompetes nuclear core-pressors in binding nuclear receptors in the presence of RA,resulting in transcriptional activation of RAR target genes.NCOA6/ASC2 is also frequently upregulated in various tu-mors (103,104). ASCL2 is a transcription factor that is crit-ical in the maintenance of adult intestinal stem cells andinteracts with RARs via direct interaction with NCOA6(105).
Interestingly, we also identified several downstream tran-scriptional targets of RA signaling, including HOXD1,HOXD10 and HOXD11, whose genomic locus also con-tains the miR-10b gene itself. The entire HOXD gene clus-ter responds to RA treatment by sequentially activatingthe transcription of the HOXD genes, generally promot-ing the differentiation of a variety of tissues (106,107).HOXD10 is the only bioinformatically predicted memberof the HOXD cluster and was the first experimentally val-idated target of miR-10b, yet we identify three membersof this cluster as targets of miR-10b and demonstrate thatmiR-10b targets HOXD11 by a single non-canonical tar-get site (Figure 3C). SDC1/CD138 is a cell surface pro-teoglycan that plays a role in adhesion to the extracellu-lar matrix (108), is frequently downregulated in multiplemyelomas (109) and other cancers and is upregulated in re-sponse to RA treatment (110,111). STAT6 is a transcrip-tion factor that is a key effector of IL4-mediated signalingand promotes growth inhibition, apoptosis and differenti-ation in breast tumors (112,113). STAT6 is also transcrip-tionally activated in response to RA treatment in T-helpercells (113) and requires interaction with a nuclear receptorcoactivator (NCOA1) to enact the IL4 response in hepato-cytes (114). Lastly, MYF5, a transcription factor central toskeletal muscle differentiation, is also activated in responseto RA in the developing limb bud (115). Among these 10targets of miR-10b, NCOR2, NCOA6, HOXD10 and SDC1are the only bioinformatically predicted targets (Figure 2A),and RARG, NCOR2, NCOA6, HOXD1, HOXD10, SDC1and STAT6 contain canonical seed elements within their3′UTRs (Figure 2C).
The identification of target genes associated with RASsignaling (let-7c) and RA signaling (miR-10b) by 3′LIFEis consistent with the known roles of these miRNAs as ei-ther negative or positive regulators of tumorigenesis, respec-tively, and potentially broadens the scope by which they tar-get these pathways. Furthermore, the novel, non-canonicaland unpredicted targets within these pathways suggest thatunbiased, high-throughput approaches to identify miRNAtargets is a productive strategy to identify regulatory net-works targeted by miRNAs.
In conclusion, our study suggests that 3′LIFE is a pow-erful method to identify novel and non-canonical miRNAtargets, and to identify mechanisms by which miRNAs con-tribute to biological processes. 3′LIFE conveys several ad-vantages over current methods. First, 3′LIFE is a compre-
at Arizona State U
niversity West 2 on M
arch 25, 2015http://nar.oxfordjournals.org/
Dow
nloaded from
14 Nucleic Acids Research, 2014
hensive screen because it utilizes all functional elementspresent in each 3′UTR that are targeted by the querymiRNA. Second, 3′LIFE is unbiased, since it probes oneinteraction at a time and does not rely on prior assumptionsabout target genes. Third, the detection of an miRNA tar-get requires direct translational inhibition of the 3′UTR inthe presence of the miRNA, providing a functional mea-sure of targeting. Fourth, the sensitivity of the assay isgreatly improved by its high-throughput nature, revealingsubtle targeting of multiple genes within regulatory net-works. Lastly, 3′LIFE is flexible in that it can be adaptedto detect other functional elements in 3′UTRs targeted bynon-coding RNAs and RNA-binding proteins. Although3′LIFE is a powerful experimental tool to detect miRNAtargets in high-throughput, the complementary wet-lab andbioinformatic approaches described above are informativeto refine, validate and expand the results obtained by this as-say. While the biological relevance of miRNA targets identi-fied by 3′LIFE cannot be assigned, this assay provides rapiddetection and initial validation of direct miRNA/3′UTRtarget interaction at a scale not possible with current meth-ods.
SUPPLEMENTARY DATA
Supplementary Data are available at NAR Online, includ-ing [1–116].
ACKNOWLEDGMENTS
We thank John Chaput for providing initial vectors neededfor the experiments; Stephen Blazie, Cody Babb, CarineOtto, Karen Anderson, Josh LaBaer, John Chaput andYung Chang for advice and discussion; Karen Anderson,John Chaput and Josh LaBaer for sharing reagents and in-strumentation; and Michael Gaskin and Andrea Throopfor technical advice and protocols. Justin Wolter is a Ma-her scholar and thanks the Maher family for their generoussupport.
FUNDING
College of Liberal Arts and Science; Biodesign Institute atArizona State University. Funding for open access charge:College of Liberal Arts and Science, School of Life Sciencesat Arizona State University.Conflict of interest statement. None declared.
REFERENCES1. Bartel,D.P. (2004) MicroRNAs: genomics, biogenesis, mechanism,
and function. Cell, 116, 281–297.2. Lee,R.C., Feinbaum,R.L. and Ambros,V. (1993) The C. elegans
heterochronic gene lin-4 encodes small RNAs with antisensecomplementarity to lin-14. Cell, 75, 843–854.
3. Garzon,R., Marcucci,G. and Croce,C.M. (2010) TargetingmicroRNAs in cancer: rationale, strategies and challenges. Nat. Rev.Drug Discov., 9, 775–789.
4. Esquela-Kerscher,A. and Slack,F.J. (2006) Oncomirs––microRNAswith a role in cancer. Nat. Rev. Cancer, 6, 259–269.
5. Friedman,R.C., Farh,K.K., Burge,C.B. and Bartel,D.P. (2009) Mostmammalian mRNAs are conserved targets of microRNAs. GenomeRes., 19, 92–105.
6. Lewis,B.P., Shih,I.H., Jones-Rhoades,M.W., Bartel,D.P. andBurge,C.B. (2003) Prediction of mammalian microRNA targets.Cell, 115, 787–798.
7. Bartel,D.P. (2009) MicroRNAs: target recognition and regulatoryfunctions. Cell, 136, 215–233.
8. Krek,A., Grun,D., Poy,M.N., Wolf,R., Rosenberg,L., Epstein,E.J.,MacMenamin,P., da Piedade,I., Gunsalus,K.C., Stoffel,M. et al.(2005) Combinatorial microRNA target predictions. Nat. Genet.,37, 495–500.
9. Easow,G., Teleman,A.A. and Cohen,S.M. (2007) Isolation ofmicroRNA targets by miRNP immunopurification. RNA, 13,1198–1204.
10. Selbach,M., Schwanhausser,B., Thierfelder,N., Fang,Z., Khanin,R.and Rajewsky,N. (2008) Widespread changes in protein synthesisinduced by microRNAs. Nature, 455, 58–63.
11. Zhou,P., Xu,W., Peng,X., Luo,Z., Xing,Q., Chen,X., Hou,C.,Liang,W., Zhou,J., Wu,X. et al. (2013) Large-scale screens ofmiRNA-mRNA interactions unveiled that the 3’UTR of a gene istargeted by multiple miRNAs. PLoS ONE, 8, e68204.
12. Chi,S.W., Hannon,G.J. and Darnell,R.B. (2012) An alternative modeof microRNA target recognition. Nat. Struct. Mol. Biol., 19,321–327.
13. Baek,D., Villen,J., Shin,C., Camargo,F.D., Gygi,S.P. and Bartel,D.P.(2008) The impact of microRNAs on protein output. Nature, 455,64–71.
14. Azzouzi,I., Moest,H., Winkler,J., Fauchere,J.C., Gerber,A.P.,Wollscheid,B., Stoffel,M., Schmugge,M. and Speer,O. (2011)MicroRNA-96 directly inhibits gamma-globin expression in humanerythropoiesis. PLoS ONE, 6, e22838.
15. Cevec,M., Thibaudeau,C. and Plavec,J. (2010) NMR structure ofthe let-7 miRNA interacting with the site LCS1 of lin-41 mRNAfrom Caenorhabditis elegans. Nucleic Acids Res., 38, 7814–7821.
16. Chen,J., Zhang,X., Lentz,C., Abi-Daoud,M., Pare,G.C., Yang,X.,Feilotter,H.E. and Tron,V.A. (2011) miR-193b Regulates Mcl-1 inMelanoma. Am. J. Pathol., 179, 2162–2168.
17. Jiao,L.R., Frampton,A.E., Jacob,J., Pellegrino,L., Krell,J.,Giamas,G., Tsim,N., Vlavianos,P., Cohen,P., Ahmad,R. et al. (2012)MicroRNAs targeting oncogenes are down-regulated in pancreaticmalignant transformation from benign tumors. PLoS ONE, 7,e32068.
18. Lal,A., Navarro,F., Maher,C.A., Maliszewski,L.E., Yan,N.,O’Day,E., Chowdhury,D., Dykxhoorn,D.M., Tsai,P., Hofmann,O.et al. (2009) miR-24 Inhibits cell proliferation by targeting E2F2,MYC, and other cell-cycle genes via binding to “seedless” 3’UTRmicroRNA recognition elements. Mol. Cell, 35, 610–625.
19. Wu,L. and Belasco,J.G. (2005) Micro-RNA regulation of themammalian lin-28 gene during neuronal differentiation ofembryonal carcinoma cells. Mol. Cell. Biol., 25, 9198–9208.
20. Shin,C., Nam,J.W., Farh,K.K., Chiang,H.R., Shkumatava,A. andBartel,D.P. (2010) Expanding the microRNA targeting code:functional sites with centered pairing. Mol. Cell, 38, 789–802.
21. Hafner,M., Landthaler,M., Burger,L., Khorshid,M., Hausser,J.,Berninger,P., Rothballer,A., Ascano,M. Jr, Jungkamp,A.C.,Munschauer,M. et al. (2010) Transcriptome-wide identification ofRNA-binding protein and microRNA target sites by PAR-CLIP.Cell, 141, 129–141.
22. Majoros,W.H., Lekprasert,P., Mukherjee,N., Skalsky,R.L.,Corcoran,D.L., Cullen,B.R. and Ohler,U. (2013) MicroRNA targetsite identification by integrating sequence and binding information.Nat. Methods, 10, 630–633.
23. Dyer,B.W., Ferrer,F.A., Klinedinst,D.K. and Rodriguez,R. (2000) Anoncommercial dual luciferase enzyme assay system for reportergene analysis. Anal. Biochem., 282, 158–161.
24. Boutz,D.R., Collins,P.J., Suresh,U., Lu,M., Ramirez,C.M.,Fernandez-Hernando,C., Huang,Y., Abreu Rde,S., Le,S.Y.,Shapiro,B.A. et al. (2011) Two-tiered approach identifies a networkof cancer and liver disease-related genes regulated by miR-122. J.Biol. Chem., 286, 18066–18078.
25. Gaken,J., Mohamedali,A.M., Jiang,J., Malik,F., Stangl,D.,Smith,A.E., Chronis,C., Kulasekararaj,A.G., Thomas,N.S.,Farzaneh,F. et al. (2012) A functional assay for microRNA targetidentification and validation. Nucleic Acids Res., 40, e75.
26. Shell,S., Park,S.M., Radjabi,A.R., Schickel,R., Kistner,E.O.,Jewell,D.A., Feig,C., Lengyel,E. and Peter,M.E. (2007) Let-7
at Arizona State U
niversity West 2 on M
arch 25, 2015http://nar.oxfordjournals.org/
Dow
nloaded from
Nucleic Acids Research, 2014 15
expression defines two differentiation stages of cancer. Proc. NatlAcad. Sci. U.S.A., 104, 11400–11405.
27. Childs,G., Fazzari,M., Kung,G., Kawachi,N.,Brandwein-Gensler,M., McLemore,M., Chen,Q., Burk,R.D.,Smith,R.V., Prystowsky,M.B. et al. (2009) Low-level expression ofmicroRNAs let-7d and miR-205 are prognostic markers of head andneck squamous cell carcinoma. Am. J. Pathol., 174, 736–745.
28. Takamizawa,J., Konishi,H., Yanagisawa,K., Tomida,S., Osada,H.,Endoh,H., Harano,T., Yatabe,Y., Nagino,M., Nimura,Y. et al.(2004) Reduced expression of the let-7 microRNAs in human lungcancers in association with shortened postoperative survival. CancerRes., 64, 3753–3756.
29. Sakurai,M., Miki,Y., Masuda,M., Hata,S., Shibahara,Y.,Hirakawa,H., Suzuki,T. and Sasano,H. (2012) LIN28: a regulator oftumor-suppressing activity of let-7 microRNA in human breastcancer. J. Steroid Biochem. Mol. Biol., 131, 101–106.
30. Johnson,S.M., Grosshans,H., Shingara,J., Byrom,M., Jarvis,R.,Cheng,A., Labourier,E., Reinert,K.L., Brown,D. and Slack,F.J.(2005) RAS is regulated by the let-7 microRNA family. Cell, 120,635–647.
31. Papaioannou,G., Inloes,J.B., Nakamura,Y., Paltrinieri,E. andKobayashi,T. (2013) let-7 and miR-140 microRNAs coordinatelyregulate skeletal development. Proc. Natl Acad. Sci. U.S.A., 110,E3291–E3300.
32. Umemura,S., Shirane,M., Takekoshi,S., Kusakabe,T., Itoh,J.,Egashira,N., Tokuda,Y., Mori,K. and Osamura,Y.R. (2009)Overexpression of E2F-5 correlates with a pathological basalphenotype and a worse clinical outcome. Br. J. Cancer, 100, 764–771.
33. Han,H.B., Gu,J., Zuo,H.J., Chen,Z.G., Zhao,W., Li,M., Ji,D.B.,Lu,Y.Y. and Zhang,Z.Q. (2012) Let-7c functions as a metastasissuppressor by targeting MMP11 and PBX3 in colorectal cancer. J.Pathol., 226, 544–555.
34. Ma,L., Teruya-Feldstein,J. and Weinberg,R.A. (2007) Tumourinvasion and metastasis initiated by microRNA-10b in breastcancer. Nature, 449, 682–688.
35. Bourguignon,L.Y., Wong,G., Earle,C., Krueger,K. and Spevak,C.C.(2010) Hyaluronan-CD44 interaction promotes c-Src-mediated twistsignaling, microRNA-10b expression, and RhoA/RhoCup-regulation, leading to Rho-kinase-associated cytoskeletonactivation and breast tumor cell invasion. J. Biol. Chem., 285,36721–36735.
36. Foley,N.H., Bray,I., Watters,K.M., Das,S., Bryan,K., Bernas,T.,Prehn,J.H. and Stallings,R.L. (2011) MicroRNAs 10a and 10b arepotent inducers of neuroblastoma cell differentiation throughtargeting of nuclear receptor corepressor 2. Cell Death Differ., 18,1089–1098.
37. Gabriely,G., Teplyuk,N.M. and Krichevsky,A.M. (2011) Contexteffect: microRNA-10b in cancer cell proliferation, spread and death.Autophagy, 7, 1384–1386.
38. Nakata,K., Ohuchida,K., Mizumoto,K., Kayashima,T., Ikenaga,N.,Sakai,H., Lin,C., Fujita,H., Otsuka,T., Aishima,S. et al. (2011)MicroRNA-10b is overexpressed in pancreatic cancer, promotes itsinvasiveness, and correlates with a poor prognosis. Surgery, 150,916–922.
39. Sun,L., Yan,W., Wang,Y., Sun,G., Luo,H., Zhang,J., Wang,X.,You,Y., Yang,Z. and Liu,N. (2011) MicroRNA-10b induces gliomacell invasion by modulating MMP-14 and uPAR expression viaHOXD10. Brain Res., 1389, 9–18.
40. Hsu,S.D., Lin,F.M., Wu,W.Y., Liang,C., Huang,W.C., Chan,W.L.,Tsai,W.T., Chen,G.Z., Lee,C.J., Chiu,C.M. et al. (2011) miRTarBase:a database curates experimentally validated microRNA-targetinteractions. Nucleic Acids Res., 39, D163–D169.
41. Tian,Y., Luo,A., Cai,Y., Su,Q., Ding,F., Chen,H. and Liu,Z. (2010)MicroRNA-10b promotes migration and invasion through KLF4 inhuman esophageal cancer cell lines. J. Biol. Chem., 285, 7986–7994.
42. Paraskevopoulou,M.D., Georgakilas,G., Kostoulas,N., Vlachos,I.S.,Vergoulis,T., Reczko,M., Filippidis,C., Dalamagas,T. andHatzigeorgiou,A.G. (2013) DIANA-microT web server v5.0: serviceintegration into miRNA functional analysis workflows. NucleicAcids Res., 41, W169–W173.
43. Vergoulis,T., Vlachos,I.S., Alexiou,P., Georgakilas,G.,Maragkakis,M., Reczko,M., Gerangelos,S., Koziris,N.,Dalamagas,T. and Hatzigeorgiou,A.G. (2012) TarBase 6.0:
capturing the exponential growth of miRNA targets withexperimental support. Nucleic Acids Res., 40, D222–D229.
44. Seiler,C.Y., Park,J.G., Sharma,A., Hunter,P., Surapaneni,P.,Sedillo,C., Field,J., Algar,R., Price,A., Steel,J. et al. (2014) DNASUplasmid and PSI:Biology-Materials repositories: resources toaccelerate biological research. Nucleic Acids Res., 42, D1253–D1260.
45. Qiu,L., Wang,H., Xia,X., Zhou,H. and Xu,Z. (2008) A constructwith fluorescent indicators for conditional expression of miRNA.BMC Biotechnol., 8, 77.
46. Mangone,M., Manoharan,A.P., Thierry-Mieg,D., Thierry-Mieg,J.,Han,T., Mackowiak,S.D., Mis,E., Zegar,C., Gutwein,M.R.,Khivansara,V. et al. (2010) The landscape of C. elegans 3’UTRs.Science, 329, 432–435.
47. Takagaki,Y. and Manley,J.L. (1997) RNA recognition by the humanpolyadenylation factor CstF. Mol. Cell. Biol., 17, 3907–3914.
48. Larkin,M.A., Blackshields,G., Brown,N.P., Chenna,R.,McGettigan,P.A., McWilliam,H., Valentin,F., Wallace,I.M.,Wilm,A., Lopez,R. et al. (2007) Clustal W and Clustal X version2.0. Bioinformatics, 23, 2947–2948.
49. Crooks,G.E., Hon,G., Chandonia,J.M. and Brenner,S.E. (2004)WebLogo: a sequence logo generator. Genome Res., 14, 1188–1190.
50. Helwak,A., Kudla,G., Dudnakova,T. and Tollervey,D. (2013)Mapping the human miRNA interactome by CLASH revealsfrequent noncanonical binding. Cell, 153, 654–665.
51. Pollard,K.S., Hubisz,M.J., Rosenbloom,K.R. and Siepel,A. (2010)Detection of nonneutral substitution rates on mammalianphylogenies. Genome Res., 20, 110–121.
52. Qin,J.Y., Zhang,L., Clift,K.L., Hulur,I., Xiang,A.P., Ren,B.Z. andLahn,B.T. (2010) Systematic comparison of constitutive promotersand the doxycycline-inducible promoter. PLoS ONE, 5, e10611.
53. Grimson,A., Farh,K.K., Johnston,W.K., Garrett-Engele,P.,Lim,L.P. and Bartel,D.P. (2007) MicroRNA targeting specificity inmammals: determinants beyond seed pairing. Mol. Cell, 27, 91–105.
54. Farh,K.K., Grimson,A., Jan,C., Lewis,B.P., Johnston,W.K.,Lim,L.P., Burge,C.B. and Bartel,D.P. (2005) The widespread impactof mammalian MicroRNAs on mRNA repression and evolution.Science, 310, 1817–1821.
55. Nielsen,C.B., Shomron,N., Sandberg,R., Hornstein,E., Kitzman,J.and Burge,C.B. (2007) Determinants of targeting by endogenousand exogenous microRNAs and siRNAs. RNA, 13, 1894–1910.
56. Bhattacharyya,S.N., Habermacher,R., Martine,U., Closs,E.I. andFilipowicz,W. (2006) Relief of microRNA-mediated translationalrepression in human cells subjected to stress. Cell, 125, 1111–1124.
57. Fu,Y., Dominissini,D., Rechavi,G. and He,C. (2014) Geneexpression regulation mediated through reversible m(6)A RNAmethylation. Nat. Rev. Genet., 15, 293–306.
58. Shepard,P.J., Choi,E.A., Lu,J., Flanagan,L.A., Hertel,K.J. andShi,Y. (2011) Complex and dynamic landscape of RNApolyadenylation revealed by PAS-Seq. RNA, 17, 761–772.
59. Yan,J. and Marr,T.G. (2005) Computational analysis of 3’-ends ofESTs shows four classes of alternative polyadenylation in human,mouse, and rat. Genome Res., 15, 369–375.
60. Mayr,C. and Bartel,D.P. (2009) Widespread shortening of 3’UTRsby alternative cleavage and polyadenylation activates oncogenes incancer cells. Cell, 138, 673–684.
61. Sandberg,R., Neilson,J.R., Sarma,A., Sharp,P.A. and Burge,C.B.(2008) Proliferating cells express mRNAs with shortened 3’untranslated regions and fewer microRNA target sites. Science, 320,1643–1647.
62. Lin,Y., Li,Z., Ozsolak,F., Kim,S.W., Arango-Argoty,G., Liu,T.T.,Tenenbaum,S.A., Bailey,T., Monaghan,A.P., Milos,P.M. et al.(2012) An in-depth map of polyadenylation sites in cancer. NucleicAcids Res., 40, 8460–8471.
63. Ebert,M.S. and Sharp,P.A. (2012) Roles for MicroRNAs inconferring robustness to biological processes. Cell, 149, 515–524.
64. Pelaez,N. and Carthew,R.W. (2012) Biological robustness and therole of microRNAs: a network perspective. Curr. Top. Dev. Biol., 99,237–255.
65. Berezikov,E. (2011) Evolution of microRNA diversity andregulation in animals. Nat. Rev. Genet., 12, 846–860.
66. Xu,J., Zhang,R., Shen,Y., Liu,G., Lu,X. and Wu,C.I. (2013) Theevolution of evolvability in microRNA target sites in vertebrates.Genome Res., 23, 1810–1816.
at Arizona State U
niversity West 2 on M
arch 25, 2015http://nar.oxfordjournals.org/
Dow
nloaded from
16 Nucleic Acids Research, 2014
67. Chen,K. and Rajewsky,N. (2007) The evolution of gene regulationby transcription factors and microRNAs. Nat. Rev. Genet., 8,93–103.
68. Chin,L.J., Ratner,E., Leng,S., Zhai,R., Nallur,S., Babar,I.,Muller,R.U., Straka,E., Su,L., Burki,E.A. et al. (2008) A SNP in alet-7 microRNA complementary site in the KRAS 3’ untranslatedregion increases non-small cell lung cancer risk. Cancer Res., 68,8535–8540.
69. Medale-Giamarchi,C., Lajoie-Mazenc,I., Malissein,E., Meunier,E.,Couderc,B., Berge,Y., Filleron,T., Keller,L., Marty,C.,Lacroix-Triki,M. et al. (2013) RhoB modifies estrogen responses inbreast cancer cells by influencing expression of the estrogenreceptor. Breast Cancer Res., 15, R6.
70. Kazerounian,S., Gerald,D., Huang,M., Chin,Y.R., Udayakumar,D.,Zheng,N., O’Donnell,R.K., Perruzzi,C., Mangiante,L., Pourat,J.et al. (2013) RhoB differentially controls Akt function in tumor cellsand stromal endothelial cells during breast tumorigenesis. CancerRes., 73, 50–61.
71. Ridley,A.J. (2013) RhoA, RhoB and RhoC have different roles incancer cell migration. J. Microsc., 251, 242–249.
72. Shepelev,M.V. and Korobko,I.V. (2013) The RHOV gene isoverexpressed in human non-small cell lung cancer. Cancer Genet.,206, 393–397.
73. Pillai,S., Rizwani,W., Li,X., Rawal,B., Nair,S., Schell,M.J.,Bepler,G., Haura,E., Coppola,D. and Chellappan,S. (2011) ID1facilitates the growth and metastasis of non-small cell lung cancer inresponse to nicotinic acetylcholine receptor and epidermal growthfactor receptor signaling. Mol. Cell. Biol., 31, 3052–3067.
74. Kalas,W., Yu,J.L., Milsom,C., Rosenfeld,J., Benezra,R., Bornstein,P.and Rak,J. (2005) Oncogenes and Angiogenesis: down-regulation ofthrombospondin-1 in normal fibroblasts exposed to factors fromcancer cells harboring mutant ras. Cancer Res., 65, 8878–8886.
75. Swarbrick,A., Roy,E., Allen,T. and Bishop,J.M. (2008) Id1cooperates with oncogenic Ras to induce metastatic mammarycarcinoma by subversion of the cellular senescence response. Proc.Natl Acad. Sci. U.S.A., 105, 5402–5407.
76. Dai,C., Santagata,S., Tang,Z., Shi,J., Cao,J., Kwon,H.,Bronson,R.T., Whitesell,L. and Lindquist,S. (2012) Loss of tumorsuppressor NF1 activates HSF1 to promote carcinogenesis. J. Clin.Invest., 122, 3742–3754.
77. Dai,C., Whitesell,L., Rogers,A.B. and Lindquist,S. (2007) Heatshock factor 1 is a powerful multifaceted modifier of carcinogenesis.Cell, 130, 1005–1018.
78. Xi,C., Hu,Y., Buckhaults,P., Moskophidis,D. and Mivechi,N.F.(2012) Heat shock factor Hsf1 cooperates with ErbB2 (Her2/Neu)protein to promote mammary tumorigenesis and metastasis. J. Biol.Chem., 287, 35646–35657.
79. Stanhill,A., Levin,V., Hendel,A., Shachar,I., Kazanov,D., Arber,N.,Kaminski,N. and Engelberg,D. (2006) Ha-ras(val12) inducesHSP70b transcription via the HSE/HSF1 system, but HSP70bexpression is suppressed in Ha-ras(val12)-transformed cells.Oncogene, 25, 1485–1495.
80. Mivechi,N.F. and Giaccia,A.J. (1995) Mitogen-activated proteinkinase acts as a negative regulator of the heat shock response inNIH3T3 cells. Cancer Res., 55, 5512–5519.
81. Liu,Y., Hiraiwa,Y., Liu,E., Kurata,H., Thant,A.A., Matsuda,S. andHamaguchi,M. (2001) Suppression of cell spreading by v-Crkrequires Ras-MEK-MAP kinase signaling. Oncogene, 20,5908–5912.
82. Mochizuki,N., Ohba,Y., Kobayashi,S., Otsuka,N., Graybiel,A.M.,Tanaka,S. and Matsuda,M. (2000) Crk activation of JNK via C3Gand R-Ras. J. Biol. Chem., 275, 12667–12671.
83. Peeper,D.S., Shvarts,A., Brummelkamp,T., Douma,S., Koh,E.Y.,Daley,G.Q. and Bernards,R. (2002) A functional screen identifieshDRIL1 as an oncogene that rescues RAS-induced senescence. Nat.Cell Biol., 4, 148–153.
84. Fukuyo,Y., Takahashi,A., Hara,E., Horikoshi,N., Pandita,T.K. andNakajima,T. (2011) E2FBP1 antagonizes the p16(INK4A)-Rbtumor suppressor machinery for growth suppression and cellularsenescence by regulating promyelocytic leukemia protein stability.Int. J. Oral Sci., 3, 200–208.
85. Wajapeyee,N., Malonia,S.K., Palakurthy,R.K. and Green,M.R.(2013) Oncogenic RAS directs silencing of tumor suppressor genes
through ordered recruitment of transcriptional repressors. GenesDev., 27, 2221–2226.
86. Bechtel,W., McGoohan,S., Zeisberg,E.M., Muller,G.A.,Kalbacher,H., Salant,D.J., Muller,C.A., Kalluri,R. and Zeisberg,M.(2010) Methylation determines fibroblast activation and fibrogenesisin the kidney. Nat. Med., 16, 544–550.
87. Gazin,C., Wajapeyee,N., Gobeil,S., Virbasius,C.M. and Green,M.R.(2007) An elaborate pathway required for Ras-mediated epigeneticsilencing. Nature, 449, 1073–1077.
88. Fujii,S., Fukamachi,K., Tsuda,H., Ito,K., Ito,Y. and Ochiai,A.(2012) RAS oncogenic signal upregulates EZH2 in pancreaticcancer. Biochem. Biophys. Res. Commun., 417, 1074–1079.
89. Cai,H., Memarzadeh,S., Stoyanova,T., Beharry,Z., Kraft,A.S. andWitte,O.N. (2012) Collaboration of Kras and androgen receptorsignaling stimulates EZH2 expression and tumor-propagating cellsin prostate cancer. Cancer Res., 72, 4672–4681.
90. Min,J., Zaslavsky,A., Fedele,G., McLaughlin,S.K., Reczek,E.E., DeRaedt,T., Guney,I., Strochlic,D.E., Macconaill,L.E., Beroukhim,R.et al. (2010) An oncogene-tumor suppressor cascade drivesmetastatic prostate cancer by coordinately activating Ras andnuclear factor-kappaB. Nat. Med., 16, 286–294.
91. Weiss,F.U., Marques,I.J., Woltering,J.M., Vlecken,D.H.,Aghdassi,A., Partecke,L.I., Heidecke,C.D., Lerch,M.M. andBagowski,C.P. (2009) Retinoic acid receptor antagonists inhibitmiR-10a expression and block metastatic behavior of pancreaticcancer. Gastroenterology, 137, 2136–2145; e2131–2137.
92. Tehler,D., Hoyland-Kroghsbo,N.M. and Lund,A.H. (2011) ThemiR-10 microRNA precursor family. RNA Biol., 8, 728–734.
93. Ma,L. (2010) Role of miR-10b in breast cancer metastasis. BreastCancer Res., 12, 210.
94. Hua,S., Kittler,R. and White,K.P. (2009) Genomic antagonismbetween retinoic acid and estrogen signaling in breast cancer. Cell,137, 1259–1271.
95. Niederreither,K. and Dolle,P. (2008) Retinoic acid in development:towards an integrated view. Nat. Rev. Genet., 9, 541–553.
96. Chen,C.F., Goyette,P. and Lohnes,D. (2004) RARgamma acts as atumor suppressor in mouse keratinocytes. Oncogene, 23, 5350–5359.
97. Goranov,B.B., Campbell Hewson,Q.D., Pearson,A.D. andRedfern,C.P. (2006) Overexpression of RARgamma increases deathof SH-SY5Y neuroblastoma cells in response to retinoic acid butnot fenretinide. Cell Death Differ., 13, 676–679.
98. Spanjaard,R.A., Ikeda,M., Lee,P.J., Charpentier,B., Chin,W.W. andEberlein,T.J. (1997) Specific activation of retinoic acid receptors(RARs) and retinoid X receptors reveals a unique role forRARgamma in induction of differentiation and apoptosis of S91melanoma cells. J. Biol. Chem., 272, 18990–18999.
99. Zhao,X., Graves,C., Ames,S.J., Fisher,D.E. and Spanjaard,R.A.(2009) Mechanism of regulation and suppression of melanomainvasiveness by novel retinoic acid receptor-gamma target genecarbohydrate sulfotransferase 10. Cancer Res., 69, 5218–5225.
100. Huang,G.L., Luo,Q., Rui,G., Zhang,W., Zhang,Q.Y., Chen,Q.X.and Shen,D.Y. (2013) Oncogenic activity of retinoic acid receptorgamma is exhibited through activation of the Akt/NF-kappaB andWnt/beta-catenin pathways in cholangiocarcinoma. Mol. Cell.Biol., 33, 3416–3425.
101. Yan,T.D., Wu,H., Zhang,H.P., Lu,N., Ye,P., Yu,F.H., Zhou,H.,Li,W.G., Cao,X., Lin,Y.Y. et al. (2010) Oncogenic potential ofretinoic acid receptor-gamma in hepatocellular carcinoma. CancerRes., 70, 2285–2295.
102. Battaglia,S., Maguire,O. and Campbell,M.J. (2010) Transcriptionfactor co-repressors in cancer biology: roles and targeting. Int. J.Cancer., 126, 2511–2519.
103. Lee,S., Lee,D.K., Dou,Y., Lee,J., Lee,B., Kwak,E., Kong,Y.Y.,Lee,S.K., Roeder,R.G. and Lee,J.W. (2006) Coactivator as a targetgene specificity determinant for histone H3 lysine 4methyltransferases. Proc. Natl Acad. Sci. U.S.A., 103, 15392–15397.
104. Kong,H.J., Yu,H.J., Hong,S., Park,M.J., Choi,Y.H., An,W.G.,Lee,J.W. and Cheong,J. (2003) Interaction and functionalcooperation of the cancer-amplified transcriptional coactivatoractivating signal cointegrator-2 and E2F-1 in cell proliferation. Mol.Cancer Res., 1, 948–958.
105. Goo,Y.H., Sohn,Y.C., Kim,D.H., Kim,S.W., Kang,M.J., Jung,D.J.,Kwak,E., Barlev,N.A., Berger,S.L., Chow,V.T. et al. (2003)Activating signal cointegrator 2 belongs to a novel steady-state
at Arizona State U
niversity West 2 on M
arch 25, 2015http://nar.oxfordjournals.org/
Dow
nloaded from
Nucleic Acids Research, 2014 17
complex that contains a subset of trithorax group proteins. Mol.Cell. Biol., 23, 140–149.
106. Zha,Y., Ding,E., Yang,L., Mao,L., Wang,X., McCarthy,B.A.,Huang,S. and Ding,H.F. (2012) Functional dissection of HOXDcluster genes in regulation of neuroblastoma cell proliferation anddifferentiation. PLoS ONE, 7, e40728.
107. Merrill,R.A., Ahrens,J.M., Kaiser,M.E., Federhart,K.S., Poon,V.Y.and Clagett-Dame,M. (2004) All-trans retinoic acid-responsivegenes identified in the human SH-SY5Y neuroblastoma cell line andtheir regulated expression in the nervous system of early embryos.Biol. Chem., 385, 605–614.
108. Ishikawa,T. and Kramer,R.H. (2010) Sdc1 negatively modulatescarcinoma cell motility and invasion. Exp. Cell Res., 316, 951–965.
109. Yang,Y., Shi,J., Tolomelli,G., Xu,H., Xia,J., Wang,H., Zhou,W.,Zhou,Y., Das,S., Gu,Z. et al. (2013) RARalpha2 expression confersmyeloma stem cell features. Blood, 122, 1437–1447.
110. Barber,N., Belov,L. and Christopherson,R.I. (2008) All-transretinoic acid induces different immunophenotypic changes onhuman HL60 and NB4 myeloid leukaemias. Leuk. Res., 32,315–322.
111. Chen,Q., Mosovsky,K.L. and Ross,A.C. (2013) Retinoic acid andalpha-galactosylceramide regulate the expression of costimulatoryreceptors and transcription factors responsible for B cell activationand differentiation. Immunobiology, 218, 1477–1487.
112. Gooch,J.L., Christy,B. and Yee,D. (2002) STAT6 mediatesinterleukin-4 growth inhibition in human breast cancer cells.Neoplasia, 4, 324–331.
113. Dawson,H.D., Collins,G., Pyle,R., Key,M., Weeraratna,A.,Deep-Dixit,V., Nadal,C.N. and Taub,D.D. (2006) Direct andindirect effects of retinoic acid on human Th2 cytokine andchemokine expression by human T lymphocytes. BMC immunol., 7,27.
114. Litterst,C.M. and Pfitzner,E. (2001) Transcriptional activation bySTAT6 requires the direct interaction with NCoA-1. J. Biol. Chem.,276, 45713–45721.
115. Reijntjes,S., Francis-West,P. and Mankoo,B.S. (2010) Retinoic acidis both necessary for and inhibits myogenic commitment anddifferentiation in the chick limb. Int. J. Dev. Biol., 54, 125–134.
at Arizona State U
niversity West 2 on M
arch 25, 2015http://nar.oxfordjournals.org/
Dow
nloaded from