Embed Size (px)
Citation preview

20173-Monthly Report
Sales increase by 24 % to EUR 257 m (Q1 2016: EUR 208 m)European market leadership in online retailing expands further
Earnings before taxes (EBT) rise to EUR 3.4 m (Q1 2016: EUR 2.9 m)Figures include costs for expansion of logistics infrastructure and set up of additional IT development capacity
Company confirms sales and earnings targets for the full year 2017Sales of at least EUR 1.125 bn and EBT in the range of EUR 17 m to EUR 22 m expected
Highlights of the first three months 2017
To the Shareholders 2
The zooplus AG share 2
Table of contents
Interim Group management report 4
Business report 5
Subsequent events 14
Report on outlook, risksand opportunities 14
Consolidated interim financial statements 15
Consolidated balance sheet 16
Consolidated statement of comprehensive income
18
Consolidated statement of cash flows 19
Consolidated statement of changes in equity 20
Notes 21
Notes to the consolidated financial statements 22
Imprint 27

2
Konz
erna
nhan
gKo
nzer
njah
resa
bsch
luss
Konz
ernz
wis
chen
lage
beric
htTo
the
shar
ehol
ders
6.02 % compared to the last closing price of 2016. This increase compared to the DAXsubsector All Retail Internet industry index, which rose by only 0.80 %. zooplus shares were able to outperform both of these benchmark indices ending the quarter 13.29 % higher at EUR 137.65 on March 31, 2017 compared to their closing price of EUR 121.50 on December 30, 2016. The shares reached a low in the quarter of EUR 121.50 on January 9, 2017 and on March 29, 2017 marked a high of EUR 143.05, just a week following the publication of the zooplus financial results for the 2016 financial year.
The company’s market capitalization on the reporting date based on the outstanding number of shares on this date of 7,060,902 amounted to EUR 971.93 m.
Stock chart zooplus AG: January 2 to March 31, 2017
in EUR zooplus AG (XETRA)
DAXsubsector All Retail (XETRA) (relative)
SDAX (Perf.) (XETRA) (relative)
130
120
110
100
90
140
150
February 2017January 2017 March 2017
Trading volume in EUR m
rising prices falling prices
2.0
4.0
6.0
0
The sharezooplus AG shares were admitted for trading on the Frankfurt Stock Exchange’s Entry Standard segment on May 9, 2008. Almost one and a half years later, on October 22, 2009, the company successfully moved to the Prime Standard segment, which has the most stringent transparency and disclosure requirements in Germany. After an uninterrupted rise in the company’s market capitalization and trading volume, zooplus AG entered the SDAX on June 29, 2011.
At the beginning of the 2017 trading year, the leading indices in Germany continued their rise. Share price performance, however, continued to be influenced by political developments and central bank decisions as in the previous year. The SDAX index, which is the small cap index relevant for zooplus, increased in Xetra trading by
To the ShareholdersThe zooplus AG share

3
Konz
erna
nhan
gKo
nzer
njah
resa
bsch
luss
Konz
ernz
wis
chen
lage
beric
htTo
the
shar
ehol
ders
2017 financial calendarMay 31, 2017 2017 Ordinary Annual General Meeting
July 20, 2017 Preliminary sales figures for H1 2017
August 22, 2017 Publication of the 2017 Half-Year Report
October 19, 2017 Preliminary sales figures for Q3 2017
November 15, 2017 Publication of the 2017 9M Report
Analyst coverage
Institution Analyst Date
Recom-men-
dation
Price target (EUR)
Baader BankBosse, Volker 20 / 4 / 2017 Buy 150.00
BerenbergScheufler, Julia 29 / 3 / 2017 Hold 150.00
CommerzbankRiemann, Andreas 20 / 4 / 2017 Buy 158.00
Deutsche BankNaizer,Nizla 23 / 3 / 2017 Hold 135.00
Hauck & Aufhäuser
Dannenberg, Lars 24 / 4 / 2017 Hold 145.00
Kepler Cheuvreux
Mauder, Nikolas 25 / 4 / 2017 Buy 191.00
Bankhaus Lampe
Schlienkamp, Christoph 20 / 4 / 2017 Hold 136.00
montegaBuss, Timo 24 / 3 / 2017 Buy 150.00
ODDO Securities
Decot, Martin 26 / 1 / 2017 Hold 137.00
quirin BankMarinoni, Ralf 12 / 1 / 2017 Sell 105.00
Warburg Research
Kleibauer, Thilo 20 / 4 / 2017 Hold 149.00
Shareholder structure
Ruane, Cunniff & Goldfarb: 9.00%
Others: 34.00 %*
Bestinver Gestión S.G.I.I.C. S.A.: 5.53%
Deutsche Asset & Wealth Management Investment: 6.83%
Capital Research and Management Company: 12.52%
Maxburg Beteiligungen GmbH & Co. KG: 13.51%
Foxhaven Asset Management: 3.31 %
Pelham Capital Ltd.: 3.31 %
Wasatch Advisors, Inc.: 3.18 %
Zooplus AG Management.: 5.00 %
Norges Bank Investment Management: 3.93 %**
As of May 2, 2017Share ownership according to the published voting rights notifications* Free float of 86.49 % according to the definition of Deutsche Börse** Including equity instruments
Disclaimer: The shareholder structure depicted is based on the published notifications of voting rights and company information. zooplus AG does not assume responsibility for the accuracy, completeness and timeliness of this information.
Key data WKN 511170
ISIN DE0005111702
Ticker symbol Z01
Trading segment Regulated market (Prime Standard)
Class of shares No par-value ordinary bearer shares
Share capital in EUR as of December 31, 2016 7,060,902.00
Share capital in EUR as of March 31, 2017 7,060,902.00
Number of shares as of March 31, 2017 7,060,902
Initial listing May 9, 2008
Initial issue price* EUR 13.00
Share price as ofDecember 30, 2016 EUR 121.50
Share price as ofMarch 31, 2017 EUR 137.65
Percentage change(since December 30, 2016)
+13.29 %
Period high EUR 143.05
Period low EUR 121.50
Closing prices in Deutsche Börse AG’s Xetra trading system * Taking into account capital increase from company resources
in July 2011

Interim Group management report
Business report 5
Subsequent events 14
Outlook, risks and opportunities 14

5
Konz
erna
nhan
gKo
nzer
njah
resa
bsch
luss
Inte
rim G
roup
man
agem
ent r
epor
tTo
the
shar
ehol
ders
The locations of the central warehouses enable the company to ensure fast and efficient deliveries and maintain a high degree of general product availability for its customers across Europe. "Final-mile" deliveries to end customers are made using national and international parcel service providers.
From a customer perspective, zooplus sets itself apart from the competition by means of its business model, which combines a broad product range, attractive prices and an efficient flow of goods with simple and convenient handling.
ii. Markets
zooplus operates in 30 countries across Europe through a variety of localized and cross-national online shops. The company estimates that the gross total market volume in the European pet supplies segment in 2016 was roughly EUR 26 bn. According to the company’s proprietary estimates, zooplus AG is the clear online market leader in terms of sales and active customer base by a wide margin in both the European high-volume markets of Germany, France, the Netherlands, Spain and Italy and across Europe as a whole. The company also estimates that it is the fastest growing company in its sector.
As of May 2017, zooplus operated a total of 25 localized online shops. In addition to the five high-volume markets mentioned above, the company also operates online shops in the United Kingdom, Belgium, Denmark, Finland, Ireland, Croatia, Austria, Poland, Romania, Slovakia, Switzerland, Slovenia, Sweden, the Czech Republic, Hungary, Portugal, Bulgaria, Norway, Greece and Turkey. This effectively makes zooplus the sector’s dominant provider in the online segment across Europe by a substantial margin compared to smaller local and national competitors.
Next to its zooplus brand, the Group also operates under its bitiba brand, which is a discount concept with a limited range of products already available in 14 countries.
1. Business report
A. Business performance and economic environment
a. Group structure and business activities
i. Business divisions
zooplus AG, the parent company of the Group, was founded in Munich in 1999. The Group ("zooplus") operates in the e-commerce segment as a web-based retailer of pet supplies to private end consumers. The zooplus Group is the distinct market leader in Europe in this segment measured in terms of sales and active customer base.
The overriding business objectives are sustained growth, the systematic penetration of existing markets and the further expansion of the company’s online market leadership in Europe. zooplus is working to achieve these objectives by continually expanding its infrastructure so that it can maintain its technological edge in the segment.
Altogether, zooplus offers customers roughly 8,000 different food and accessory products for dogs, cats, small animals, birds, fish and horses. These products include everyday staples such as brand name foods generally available at specialty retailers, zooplus’s private labels, specialty articles like toys, care and hygiene products, and other accessories. zooplus also offers a wide range of free content and information on its websites, including veterinary and other animal-related advice and interactive features such as discussion forums and blogs.
zooplus generates sales from selling products out of its central fulfillment centers located in Hörselgau, Germany; Tilburg, Netherlands; Wroclaw, Poland; and Chalon-sur-Saône, France. In addition, a smaller fulfillment center in Strasbourg processes certain types of orders for the French and German markets. The Group began operating a fulfillment center in Antwerp, Belgium, in the fourth quarter of 2016 and a smaller fulfillment center in Coventry, Great Britain, in the first quarter of 2017. This expansion in capacity provides zooplus a logistical infrastructure it needs to achieve its planned future growth.
Interim group management report as of March 31, 2017
6
Konz
erna
nhan
gKo
nzer
njah
resa
bsch
luss
Inte
rim G
roup
man
agem
ent r
epor
tTo
the
shar
ehol
ders
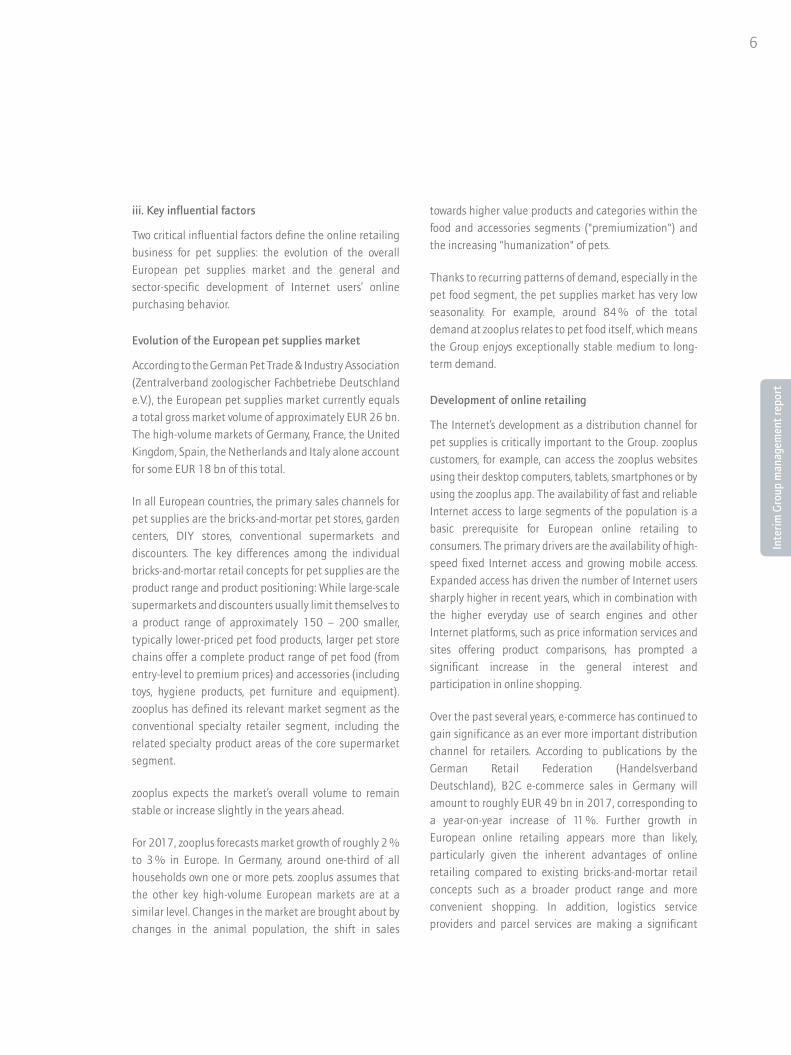
towards higher value products and categories within the food and accessories segments ("premiumization") and the increasing "humanization" of pets.
Thanks to recurring patterns of demand, especially in the pet food segment, the pet supplies market has very low seasonality. For example, around 84 % of the total demand at zooplus relates to pet food itself, which means the Group enjoys exceptionally stable medium to long-term demand.
Development of online retailing
The Internet’s development as a distribution channel for pet supplies is critically important to the Group. zooplus customers, for example, can access the zooplus websites using their desktop computers, tablets, smartphones or by using the zooplus app. The availability of fast and reliable Internet access to large segments of the population is a basic prerequisite for European online retailing to consumers. The primary drivers are the availability of high-speed fixed Internet access and growing mobile access. Expanded access has driven the number of Internet users sharply higher in recent years, which in combination with the higher everyday use of search engines and other Internet platforms, such as price information services and sites offering product comparisons, has prompted a significant increase in the general interest and participation in online shopping.
Over the past several years, e-commerce has continued to gain significance as an ever more important distribution channel for retailers. According to publications by the German Retail Federation (Handelsverband Deutschland), B2C e-commerce sales in Germany will amount to roughly EUR 49 bn in 2017, corresponding to a year-on-year increase of 11 %. Further growth in European online retailing appears more than likely, particularly given the inherent advantages of online retailing compared to existing bricks-and-mortar retail concepts such as a broader product range and more convenient shopping. In addition, logistics service providers and parcel services are making a significant
iii. Key influential factors
Two critical influential factors define the online retailing business for pet supplies: the evolution of the overall European pet supplies market and the general and sector-specific development of Internet users’ online purchasing behavior.
Evolution of the European pet supplies market
According to the German Pet Trade & Industry Association (Zentralverband zoologischer Fachbetriebe Deutschland e.V.), the European pet supplies market currently equals a total gross market volume of approximately EUR 26 bn. The high-volume markets of Germany, France, the United Kingdom, Spain, the Netherlands and Italy alone account for some EUR 18 bn of this total.
In all European countries, the primary sales channels for pet supplies are the bricks-and-mortar pet stores, garden centers, DIY stores, conventional supermarkets and discounters. The key differences among the individual bricks-and-mortar retail concepts for pet supplies are the product range and product positioning: While large-scale supermarkets and discounters usually limit themselves to a product range of approximately 150 – 200 smaller, typically lower-priced pet food products, larger pet store chains offer a complete product range of pet food (from entry-level to premium prices) and accessories (including toys, hygiene products, pet furniture and equipment). zooplus has defined its relevant market segment as the conventional specialty retailer segment, including the related specialty product areas of the core supermarket segment.
zooplus expects the market’s overall volume to remain stable or increase slightly in the years ahead.
For 2017, zooplus forecasts market growth of roughly 2 % to 3 % in Europe. In Germany, around one-third of all households own one or more pets. zooplus assumes that the other key high-volume European markets are at a similar level. Changes in the market are brought about by changes in the animal population, the shift in sales

7
Konz
erna
nhan
gKo
nzer
njah
resa
bsch
luss
Inte
rim G
roup
man
agem
ent r
epor
tTo
the
shar
ehol
ders
development, logistics, technology, customer service and marketing is the basis for zooplus’s confidence in its competitive position. Other relative advantages such as brand recognition and the Group’s financial strength also play a role.
In addition, the company’s existing base of active European customers also helps ensure that there is substantial momentum for acquiring new customers through word-of-mouth recommendations.
Advantages over bricks-and-mortar competitors
zooplus’s business model is based on a lean, technologically efficient, and scalable value creation chain combined with an outstanding shopping experience in terms of selection, price and convenience and particularly in terms of convenient home delivery.
zooplus does not operate any physical stores or outlets. Instead, from seven fulfillment centers, it supplies customers throughout Europe with a significantly larger product range than existing bricks-and-mortar retailers. At the same time, the Group’s centralized structure and related efficiency advantages combined with predominantly automated business processes help offset certain size-based advantages still enjoyed by the larger bricks-and-mortar pet store chains, particularly in product procurement. zooplus assumes that it is already today’s cost leader in the online retailing of pet supplies.
zooplus’s goal is and will continue to be to solidify and expand its lead in the online segment while strengthening its position in the overall online and bricks-and-mortar markets and profiting substantially from the continued high growth of online retailing.
effort to make their services more flexible and further improve their quality of service for end customers, which will also provide an added boost to the online market’s growth momentum. Based on these trends, independent market observers such as Statista expect online retailing to continue to enjoy annual double-digit percentage growth rates in the years to come.
The share of products sold over the Internet in the pet supply segment is still relatively low compared to other product categories and largely driven by the sales zooplus itself generates across Europe. The company’s internal estimates show that until now only around 7 % of the total European pet market has migrated online.
This means zooplus, as the market leader, is in a unique position to benefit from these lasting shifts in the existing distribution and retailing structures.
iv. Competitive position
Advantage over online competitors
Generally, there are lower barriers to market entry in online retail than in bricks-and-mortar retail. As a result, zooplus not only faces international (online) retailers in the European market but also a number of mostly regional providers such as independent pet stores with their own web shops and local delivery alternatives. A growing number of larger bricks-and-mortar retailers are also setting up online retail infrastructure while other local online retailers are entering new countries. These trends increase the number of retailers coming into direct competition with zooplus.
In contrast to both of these groups, zooplus has the advantage that its size and market leadership in Europe give it the structural capacity to reap crucial benefits from higher efficiency and economies of scale that are not equally available to smaller providers. This structural advantage in areas such as purchasing, private label

8
Konz
erna
nhan
gKo
nzer
njah
resa
bsch
luss
Inte
rim G
roup
man
agem
ent r
epor
tTo
the
shar
ehol
ders
zooplus AG was managed by the following Management Board members during the 2017 financial year and as of March 31, 2017:
• Dr. Cornelius Patt, CEO (Corporate Management, overall responsibility for Business Development & System Development, IT, Logistics, Supply Chain Management and HR)
• Andrea Skersies (Sales & Marketing, Category Management)
• Andreas Grandinger (Finance, Controlling, Legal, Investor Relations, Internal Audit and Procurement)
The Management Board is advised and controlled by the Supervisory Board. During the 2017 financial year and as of March 31, 2017, the Supervisory Board consisted of the following members:
• Christian Stahl (Chairman of the Supervisory Board), freelance entrepreneur in the investment business, London, United Kingdom
• Moritz Greve, Partner and Managing Director of Maxburg Capital Partners GmbH, Munich, Germany (Deputy Chairman)
• Dr. Norbert Stoeck, freelance corporate consultant, Munich, Germany
• Henrik Persson, founder and manager of Sprints Capital Management Ltd., London, United Kingdom
• Karl-Heinz Holland, freelance business consultant, Oberstenfeld, Germany
• Ulric Jerome, Director of MatchesFashion Limited (MatchesFashion.com), London, United Kingdom
b. Corporate strategy – Sustainable and profitable pan-European growth
The Group’s aim is to maintain and significantly expand its market leadership in the European online pet supplies segment and, thereby, dramatically increase the company’s medium and long-term earnings potential. From the company’s standpoint, both the Internet and Internet retailing in Europe continue to offer excellent growth opportunities. This is the reason it is important that the Group set up the necessary structures and position itself today to generate significant medium- and long-term positive returns by virtue of its size and market leadership.
v. Group structure
As of March 31, 2017, the Group’s scope of fully consolidated companies included zooplus AG, Munich, and the following subsidiaries:
Subsidiary Interest in share capital
Business activity
MATINA GmbH, Munich, Germany
100 %Private label
business
BITIBA GmbH, Munich, Germany
100 %Secondary brand
business
zooplus services Ltd., Oxford, Great Britain
100 %Service company for Great Britain
zooplus italia s.r.l., Genoa, Italy
100 %Service company
for Italy
zooplus polska Sp. z o.o., Krakow, Poland
100 %Service company
for Poland
zooplus services ESP S.L., Madrid, Spain
100 %Service company
for Spain
zooplus france s.a.r.l., Strasbourg, France
100 %Service company
for France
zooplus Nederland B.V., Tilburg, the Netherlands
100 %Service company
for the Netherlands
zooplus Pet Supplies Import and Trade ltd., Istanbul, Turkey
100 %Sales company
for Turkey
The following companies are not included in the consolidated financial statements:
• the wholly owned subsidiary zooplus EE TOV, Kiev, Ukraine, founded in the second quarter of 2011 with share capital of kEUR 10
• the wholly owned subsidiary zooplus d.o.o., Zagreb, Croatia, founded in February 2013 with share capital of kEUR 3
• the wholly owned subsidiary Tifuve GmbH, Munich, Germany, founded in May 2013 with share capital of kEUR 25
These three companies did not conduct any business activities during the financial year and were not included in the consolidated financial statements because of their minor importance.
9
Konz
erna
nhan
gKo
nzer
njah
resa
bsch
luss
Inte
rim G
roup
man
agem
ent r
epor
tTo
the
shar
ehol
ders
c. Technology and developmentzooplus views itself first and foremost as a technology-driven Internet retailing group. The new and ongoing development of the core processes and key components of the company’s business model is usually initiated and executed internally. External partners are brought in when they can make a meaningful contribution to the company’s internal expertise and implementation capacity.
In the past, proprietary systems and highly specialized software solutions in all key company segments have played a decisive role in the success of zooplus AG and the zooplus Group. From today’s perspective, these systems and solutions will remain a fundamental building block to reaching the company’s goals. The existing proprietary systems will be enhanced using standardized systems to meet the Group’s specific
requirements at all times.
With this in mind, the following goals stand at the core of the company’s activities:
• Continuing sales growth in all European markets
• Further penetrating existing regional markets
• Defending and expanding market leadership
• Expanding the customer base and securing high customer loyalty in all European markets
• Further improving the total cost ratio
The overriding priority is to continue generating high growth while maintaining and increasing lasting operating profitability. Management sees this as the most logical strategy for the long-term appreciation in the company’s value in the quarters and years to come based on the excellent growth opportunities for the Group still available throughout Europe.
Targets are managed and monitored in all areas using key performance indicators that are reviewed regularly and modified over the short- to medium-term when necessary. The company places special importance on clearly communicating its goals to employees and the public.
Employees play a key role in the company’s success. Regular internal training and widespread participation in external training courses have improved employees’ work quality and their potential to create added value.

10
Konz
erna
nhan
gKo
nzer
njah
resa
bsch
luss
Inte
rim G
roup
man
agem
ent r
epor
tTo
the
shar
ehol
ders
business in the future. It is also not yet clear how protectionist tendencies will affect the international trade in goods and, consequently, overall economic growth and consumer purchasing power. The management believes that the development of the specific industry and online retailing environment in the respective individual markets will still have a much stronger influence on zooplus AG than the general economic environment described above.
ii. Performance of the zooplus Group in the reporting period
The Management Board is pleased with the ongoing positive performance of the zooplus Group in the first three months of 2017 and expects the Group to achieve its 2017 financial year targets for sales and earnings before taxes (EBT) set out at the beginning of the year. The Group continued further on its growth path achieving 24 % higher sales in the first three months of 2017 compared to the previous year. The Group was also able to gain market share versus its competitors.
After the first three months of 2017, the Management Board confirms its forecast for sales of at least EUR 1,125 m and earnings before taxes (EBT) in the range of EUR 17 to 22 m.
zooplus was also able to maintain a very high level of customer loyalty in the first three months of 2017. The ratio for measuring customer loyalty remained at the level of the previous year. Reductions in expenses for logistics and fulfillment, marketing, payment transactions, as well as in other costs, were also achieved as a result of efficiency gains and economies of scale. In addition, zooplus was able to generate an improvement in other operating income in the form of higher refunds for marketing. As a result of these effects, zooplus generated earnings before taxes (EBT) of EUR 3.4 m in the first three months of 2017 (Q1 2016: EUR 2.9 m), which is equivalent to a year-on-year increase of EUR 0.5 m.
B. Net assets, financial position and results of operations
a. Financial and non-financial performance indicators
i. Financial performance indicators
The zooplus Group analyzes sales, gross margins, fulfillment costs and marketing costs to manage and monitor the earnings situation.
The yardstick for gauging the Group’s growth and business success is sales. The key earnings indicator for measuring the Group’s success is earnings before taxes (EBT).
The performance indicator for the financial position is the equity ratio. The key ratios are calculated at the Group level in accordance with IFRS.
ii. Non-financial performance indicators
In addition to financial performance indicators, the Group also steers its activities using non-financial performance indicators. The key non-financial performance indicator is the company’s degree of market leadership in the European online pet supplies segment.
Two other key performance indicators are the sales retention rate and the number of new customers – both of which have an influence on zooplus AG’s sustained growth and stand at the center the company’s corporate management.
b. Business performance Q1 2017
i. The economy and overall market
There continues to be a risk that the euro debt crisis and currency exchange risks within and outside of Europe will have a considerable adverse impact on Europe’s real economy. It is also not yet clear what the additional risks and consequences might be from the Brexit vote and its aftermath. Although the German economy has largely been able to decouple from the rest of the eurozone, it cannot be ruled out that negative economic developments may have an impact on zooplus AG’s

11
Konz
erna
nhan
gKo
nzer
njah
resa
bsch
luss
Inte
rim G
roup
man
agem
ent r
epor
tTo
the
shar
ehol
ders
ii. Expense items
Expense items are shown in relation to sales, which is the company’s key performance indicator.
Cost of materials
The company’s cost of materials in the reporting period increased only slightly compared to the previous year. In the first three months of the 2017 financial year, the cost of materials ratio of 74.7 % increased by 0.3 percentage points year-on-year (Q1 2016: 74.4 %). This in turn resulted in a gross margin (sales less cost of materials) for the company of 25.3 % in the first three months of 2017 compared to 25.6 % in the same period in 2016. The development of the gross margin was caused by the continued rise in the share of the lower margin pet food business versus total sales and persistent intense competition in the field of e-commerce. The decline in the gross margin was fully offset by an improvement in other operating income from higher refunds for marketing and a decline in operating expense items within other expenses.
Personnel costs
Personnel costs in the first three months of 2017 increased to EUR 9.0 m compared to EUR 6.7 m in the same period of 2016. This rise resulted in an increase in the personnel cost ratio of 0.3 percentage points to 3.5 % (in relation to sales). This increase resulted from the expansion in proprietary IT development capacity, which mainly occurred in the second half of 2016. The rise in personnel costs was also a result of higher non-cash expenses related to the 2016 stock option program.
Depreciation and amortization
Scheduled depreciation / amortization in the first three months of 2017 increased to EUR 1.0 m compared to EUR 0.2 m in the same period of 2016. This rise resulted from the scheduled amortization for modules of the new ERP system that were brought into operation at the start of the financial year, as well as depreciation caused by the capitalization of property, plant and equipment resulting from a finance lease.
c. Results of operations
i. Development of sales and other operating income
As the European market leader according to the company’s own assessment, zooplus was able to continue to increase its sales in the first three months of 2017 by 23.6 % to a total of EUR 256.9 m compared to EUR 207.8 m in the same period in 2016.
The drivers of this development were primarily the continued expansion in the customer base in all of the Group’s geographic regions and the high level of customer loyalty (sales retention rate for existing customers). zooplus generated higher sales both in its business with existing customers and new customers. Both trends highlight and provide evidence of the sustainability of the company’s business model.
The share of sales generated abroad amounts to 73 %.
Other operating income in the first three months of 2017 increased to EUR 11.6 m compared to EUR 8.9 m in the same period of the previous year and represented a share of sales of 4.5 % compared to 4.3 % in the first three months of 2016. Sales consist solely of merchandise sales, whereas other operating income consists mainly of customary industry refunds for marketing and other compensation.
Sales of pet supplies are largely immune to seasonal fluctuations.
The trend in sales and other operating income clearly shows that zooplus, as the market leader, is profiting disproportionately more from the continuous migration of demand from the traditional bricks-and-mortar sales channels to online retailing. The company’s continued double-digit growth in all regional markets has further solidified its strategic market position.

12
Konz
erna
nhan
gKo
nzer
njah
resa
bsch
luss
Inte
rim G
roup
man
agem
ent r
epor
tTo
the
shar
ehol
ders
Other expenses
During the reporting period, other expenses increased year-on-year from EUR 52.1 m to EUR 63.3 m. Other expenses mostly consist of logistics / fulfillment, marketing and payment transaction costs. Their percentage share of sales in the first three months of 2017 declined to 24.6 % compared to 25.1 % in the first three months of financial year 2016. This change is largely due to the efficiency gains and economies of scale achieved in the areas of logistics, marketing, customer acquisition, payment transactions and other costs.
Logistics and fulfillment costs
Logistics and fulfillment costs in the first three months of 2017 reached a level of 19.5 % based on sales compared to 19.6 % in the same period of the previous year. Thus, the company achieved an improvement in this cost ratio despite opening a new fulfillment center in Coventry, Great Britain, in the first quarter of 2017 and the continuation of the start-up phase of the fulfillment center opened in Antwerp, Belgium, in the fourth quarter of 2016. zooplus was also able to continue improving the efficiency of the existing logistics centers, including enhancements throughout the entire logistics network.
Marketing expenses
Despite a year-on-year rise in sales of 23.6 % in the first quarter, expenses related to customer acquisition and marketing declined to 1.4 % of sales in the first three months of 2017 compared to 1.6 % in the same period in the prior year. The company was able to increase its sales in its business with existing as well as new customers. This is further confirmation of the high effectiveness of the company’s marketing efforts.
Payment transaction expenses
Total payment transaction expenses in the first three months totaled EUR 2.5 m compared to EUR 2.2 m in the same period of the prior year, which equals a ratio to sales of 1.0 % and is slightly below the previous year’s level of 1.1 %.
Others expenses
In addition to the expenses for logistics and fulfillment, marketing and payment transactions described above, other expenses in the reporting period included customer relationship service, office rentals, general administrative expenses, technology and other expenses incurred as part of the ordinary operating activities. Other expenses as a percentage of sales in the first three months of 2017 were 2.7 % compared to 2.8 % in the same period of 2016.
iii. Earnings development
In the first three months of 2017, zooplus generated earnings before taxes (EBT) of EUR 3.4 m (Q1 2016: EUR 2.9 m) by a year-on-year increase of EUR 0.5 m. The solid earnings performance was driven primarily by operating efficiency improvements, the continued effectiveness of the marketing strategy, ongoing strong sales growth and the rise in other operating income described above.
The consolidated net profit in the first three months of 2017 amounted to EUR 2.0 m (Q1 2016: EUR 1.8 m). Total comprehensive income amounted to EUR 1.1 m (Q1 2016: EUR 2.6 m) and differed from the consolidated net profit due to the hedge reserve of EUR – 0.8 m and currency translation differences of EUR – 0.1 m.
d. Net assetsNon-current assets as of March 31, 2017 amounted to a total of EUR 24.5 m compared to EUR 25.0 m as of December 31, 2016. The main components of this item are property, plant and equipment of EUR 15.4 m and intangible assets of EUR 9.1 m. Property, plant and equipment contains non-current assets resulting from the finance lease in the fulfillment center in Wroclaw, Poland.

13
Konz
erna
nhan
gKo
nzer
njah
resa
bsch
luss
Inte
rim G
roup
man
agem
ent r
epor
tTo
the
shar
ehol
ders
Current assets as of the March 31, 2017 reporting date amounted to EUR 181.4 m compared to EUR 182.6 m at the end of 2016. This change is mainly the result of the combination of the significant rise in cash and cash equivalents from EUR 54.9 m to EUR 70.5 million, the increase in advance payments from EUR 1.6 m to EUR 4.6 m and the rise in accounts receivable from EUR 19.2 m to EUR 19.6 m. This rise was partially offset by the decline in other current assets from EUR 25.6 m to EUR 14.6 m, the drop in inventory from EUR 78.8 m to EUR 70.7 m and the decline in derivative financial instruments from EUR 2.5 m to EUR 1.4 m.
Equity as of March 31, 2017 was higher than the level as of the December 31, 2016 reporting date and amounted to EUR 109.4 m. This resulted in an equity ratio of 53 % as of March 31, 2017, which was higher than the level at the end of 2016.
Accounts payable were lower as of March 31, 2017 declining to EUR 42.1 m compared to EUR 47.0 m at the end of 2016. Other liabilities increased from EUR 22.9 m to EUR 25.8 m and mainly consist of VAT liabilities.
Provisions as of March 31, 2017 were close to their level in the previous year and mainly consisted of provisions for bonus points from the customer loyalty program that were issued but not yet redeemed as well as from provisions for outstanding invoices and employee bonuses. One provision in the amount of EUR 1.7 m is long-term in nature.
Finance lease liabilities totaling EUR 12.6 m are related to future lease payments for leased items at the fulfillment center in Wroclaw, Poland. A total of EUR 10.4 m of these liabilities is long-term in nature.
As in the previous year, financial liabilities did not exist as of March 31, 2017. The company continues to have access to flexible credit lines totaling EUR 40.0 m. zooplus AG is not required to provide any collateral for these credit lines.
Total assets as of March 31, 2017 totaled EUR 205.9 m and were slightly lower than their level of EUR 207.6 m as of December 31, 2016, allowing the company to maintain solid balance sheet ratios despite the growth in sales.
e. Financial positionCash flows from operating activities in the reporting period reached a level of EUR 16.8 m compared to EUR 11.4 m in the first three months of 2016. Operating cash flow was mainly affected by earnings before taxes in the reporting period and the changes in working capital. Cash flows from investing activities amounted to EUR – 0.5 m in the first three months of 2017 compared to EUR – 1.1 m in the comparable period in 2016.
Free cash flow in the first three months of 2017 reached EUR 16.2 m compared to EUR 10.4 m in the same period in 2016.
A total of EUR – 0.6 m in cash flows from financing activities was generated in the reporting period and was mainly the result of repayments of finance lease liabilities.
As a retail company, zooplus is subject to a considerable volatility when it comes to balance sheet and cash flow related items such as inventories, liabilities and VAT. This fact results in a much higher natural fluctuation in these figures throughout the year compared to the earnings figures presented.
f. Overall statement on the financial situationWith sales growth of 24 % to EUR 257 m in the reporting period coupled with a year-on-year improvement in earnings before taxes of EUR 0.5 m to EUR 3.4 m, the performance in the first three months of 2017 can be considered as very positive. It is also important to point out that the equity ratio as of the March 31, 2017 reporting date was at a level of 53 %.

14
Konz
erna
nhan
gKo
nzer
njah
resa
bsch
luss
Inte
rim G
roup
man
agem
ent r
epor
tTo
the
shar
ehol
ders
zooplus expects the following in terms of the year-on-year development of the key factors influencing the net assets, financial position and results of operations:
• a slight decline in the 2017 gross margin (in relation to sales)
• logistics and fulfillment costs as a percentage of sales in 2017 to remain at the prior year’s level
• marketing expenses related to customer acquisitions remain stable in 2017 as a percentage of sales
• an equity ratio of between 40 % and 60 %
• another year in which the company maintains its leading market position in the online retailing of pet supplies
• a stable sales retention rate.
As in previous years, growth will be the priority in 2017. Sustainable positive earnings development will also remain a key element of the Group’s strategy.
B. Risk report
The risk outlook for zooplus AG has not changed materially from the outlook described in the 2016 Annual Report (pages 61 to 66).
C. Opportunity report
The opportunities outlook for zooplus AG has not changed materially from the outlook described in the 2016 Annual Report (pages 66 to 67).
2. Subsequent eventsAfter the end of the first three months of 2017, no events of particular importance occurred that impact the net assets, financial position and results of operations.
3. Report on outlook, risks and opportunities
A. Outlook
In view of the latest forecasts, the underlying economic conditions are not expected to change materially in 2017. It remains to be seen what impact the Brexit decision will have on the EU member states and companies operating across Europe. Furthermore, it is impossible at this time to foresee the effect of protectionist tendencies on international trade in goods and therefore on overall economic growth and the purchasing power of consumers.
Irrespective of these factors, the company anticipates that the Internet will continue to grow in its importance as a sales channel (e-commerce) in the years ahead and expand at a faster rate than the market overall. zooplus will benefit substantially from these trends. The expectation for our pet supply segment is for slightly higher sales overall in 2017.
In summary, the company expects to achieve the following financial targets in the 2017 financial year:
• An increase in sales growth up to a level of at least EUR 1.125 bn
• Earnings before taxes (EBT) in a range of EUR 17 m to EUR 22 m

Consolidated interim financial statements
Consolidated balance sheet 16
Consolidated statement of comprehensive income 18
Consolidated statement of cash flows 19
Consolidated statement of changes in equity 20

16
Konz
erna
nhan
gCo
nsol
idat
ed in
terim
fina
ncia
l sta
tem
ents
Konz
ernz
wis
chen
lage
beric
htTo
the
shar
ehol
ders
Assets
in EUR 31 / 03 / 2017 31 / 12 / 2016
A. NON-CURRENT ASSETS
I. Property, plant and equipment 15,435,031.70 15,908,695.76
II. Intangible assets 9,053,677.05 9,026,342.57
III. Other financial assets 37,708.71 37,708.71
Non-current assets, total 24,526,417.46 24,972,747.04
B. CURRENT ASSETS
I. Inventories 70,724,602.04 78,781,088.50
II. Advance payments 4,594,816.36 1,622,257.78
III. Accounts receivable 19,569,228.62 19,177,730.94
IV. Other current assets 14,577,849.15 25,642,573.18
V. Derivative financial instruments 1,366,921.10 2,455,023.80
VI. Cash and cash equivalents 70,537,145.60 54,923,661.37
Current assets, total 181,370,562.87 182,602,335.57
205,896,980.33 207,575,082.61
Consolidated balance sheet as of March 31, 2017 according to IFRS
17
Konz
erna
nhan
gCo
nsol
idat
ed in
terim
fina
ncia
l sta
tem
ents
Konz
ernz
wis
chen
lage
beric
htTo
the
shar
ehol
ders
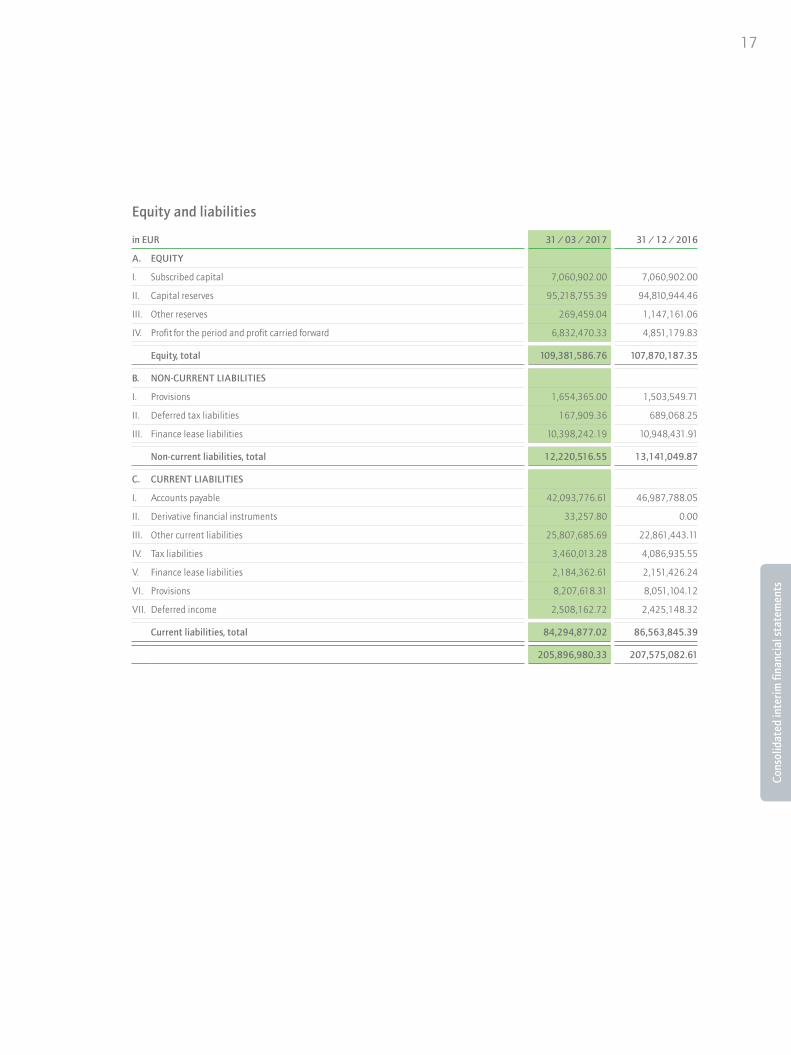
Equity and liabilities
in EUR 31 / 03 / 2017 31 / 12 / 2016
A. EQUITY
I. Subscribed capital 7,060,902.00 7,060,902.00
II. Capital reserves 95,218,755.39 94,810,944.46
III. Other reserves 269,459.04 1,147,161.06
IV. Profit for the period and profit carried forward 6,832,470.33 4,851,179.83
Equity, total 109,381,586.76 107,870,187.35
B. NON-CURRENT LIABILITIES
I. Provisions 1,654,365.00 1,503,549.71
II. Deferred tax liabilities 167,909.36 689,068.25
III. Finance lease liabilities 10,398,242.19 10,948,431.91
Non-current liabilities, total 12,220,516.55 13,141,049.87
C. CURRENT LIABILITIES
I. Accounts payable 42,093,776.61 46,987,788.05
II. Derivative financial instruments 33,257.80 0.00
III. Other current liabilities 25,807,685.69 22,861,443.11
IV. Tax liabilities 3,460,013.28 4,086,935.55
V. Finance lease liabilities 2,184,362.61 2,151,426.24
VI. Provisions 8,207,618.31 8,051,104.12
VII. Deferred income 2,508,162.72 2,425,148.32
Current liabilities, total 84,294,877.02 86,563,845.39
205,896,980.33 207,575,082.61

18
Konz
erna
nhan
gCo
nsol
idat
ed in
terim
fina
ncia
l sta
tem
ents
Konz
ernz
wis
chen
lage
beric
htTo
the
shar
ehol
ders
in EUR Q1 2017 Q1 2016
Sales 256,909,147.22 207,792,298.24
Other income 11,649,147.56 8,928,006.56
Cost of materials – 191,838,024.53 – 154,682,371.43
Personnel costs – 8,996,993.39 – 6,740,978.61
of which cash (– 8,589,182.46) (– 6,597,488.57)
of which stock-based and non-cash (– 407,810.93) (– 143,490.04)
Depreciation and amortization – 975,109.15 – 242,988.97
Other expenses – 63,251,684.88 – 52,080,436.44
of which logistics / fulfillment expenses (– 50,188,922.23) (– 40,748,989.35)
of which marketing expenses (– 3,515,673.42) (– 3,322,046.46)
of which payment transaction expenses (– 2,514,523.83) (– 2,210,800.25)
of which other expenses (– 7,032,565.40) (– 5,798,600.38)
Earnings before interest and taxes 3,496,482.83 2,973,529.35
Financial income 14.25 158.25
Financial expenses – 108,146.18 – 36,677.25
Earnings before taxes 3,388,350.90 2,937,010.35
Taxes on income – 1,407,060.40 – 1,173,226.77
Consolidated net result 1,981,290.50 1,763,783.58
Other gains and losses (after taxes)
Differences from currency translation – 126,110.15 – 80,496.81
Hedge reserve – 751,591.87 956,293.99
Items subsequently reclassified to profit or loss – 877,702.02 875,797.18
Total comprehensive income 1,103,588.48 2,639,580.76
Earnings per share
basic (EUR / share) 0.28 0.25
diluted (EUR / share) 0.28 0.25
Consolidated statement of comprehensive income from January 1 to March 31, 2017 according to IFRS

19
Konz
erna
nhan
gCo
nsol
idat
ed in
terim
fina
ncia
l sta
tem
ents
Konz
ernz
wis
chen
lage
beric
htTo
the
shar
ehol
ders
in EUR Q1 2017 Q1 2016
Cash flows from operating activities
Earnings before taxes 3,388,350.90 2,937,010.35
Adjustments for:
Depreciation and amortization 975,109.15 242,988.97
Non-cash personnel costs 407,810.93 143,490.04
Other non-cash business transactions – 132,069.72 – 80,496.81
Interest and similar expenses 108,146.18 36,677.25
Interest and similar income – 14.25 – 158.25
Changes in:
Inventories 8,056,486.46 5,087,982.28
Advance payments – 2,972,558.58 – 1,844,092.98
Accounts receivable – 391,497.68 – 2,734,194.62
Other current assets 11,064,724.03 5,124,468.77
Accounts payable – 4,894,011.44 2,295,768.40
Other liabilities 2,946,242.58 – 528,863.78
Provisions 156,514.19 858,176.31
Non-current liabilities 150,815.29 0.00
Deferred income 83,014.40 147,771.18
Income taxes paid – 2,190,055.93 – 254,292.56
Interest received 14.25 158.25
Cash flows from operating activities 16,757,020.76 11,432,392.80
Cash flows from investing activities
Payments for property, plant and equipment / intangible assets – 528,240.46 – 1,065,789.71
Cash flows from investing activities – 528,240.46 – 1,065,789.71
Cash flows from financing activities
Payments for the redemption of finance lease liabilities – 517,253.35 0.00
Interest paid – 108,146.18 – 36,677.25
Cash flows from financing activities – 625,399.53 – 36,677.25
Currency effects on cash and cash equivalents 10,103.46 18,223.08
Net change of cash and cash equivalents 15,613,484.23 10,348,148.92
Cash and cash equivalents at the beginning of the period 54,923,661.37 45,530,788.75
Cash and cash equivalents at the end of the period 70,537,145.60 55,878,937.67
Composition of cash and cash equivalents at the end of the period
Cash on hand, bank deposits 70,537,145.60 55,878,937.67
Consolidated statement of cash flows from January 1 to March 31, 2017 according to IFRS

20
Konz
erna
nhan
gCo
nsol
idat
ed in
terim
fina
ncia
l sta
tem
ents
Konz
ernz
wis
chen
lage
beric
htTo
the
shar
ehol
ders
in EUR
Subscribed capital
Capital reserves
Other reserves
Net profit / loss for the period
and profit / loss carried forward
Total
As of January 1, 2017 7,060,902.00 94,810,944.46 1,147,161.06 4,851,179.83 107,870,187.35
Increase from stock options 0.00 407,810.93 0.00 0.00 407,810.93
Currency translation differences 0.00 0.00 – 126,110.15 0.00 – 126,110.15
Net profit for Q1 / 2017 0.00 0.00 0.00 1,981,290.50 1,981,290.50
Hedge reserve 0.00 0.00 – 751,591.87 0.00 – 751,591.87
As of March 31, 2017 7,060,902.00 95,218,755.39 269,459.04 6,832,470.33 109,381,586.76
As of January 1, 2016 6,995,182.00 92,769,312.66 5,868.77 – 6,543,888.23 93,226,475.20
Increase from stock options 0.00 143,490.04 0.00 0.00 143,490.04
Currency translation differences 0.00 0.00 – 80,496.81 0.00 – 80,496.81
Net profit for Q1 / 2016 0.00 0.00 0.00 1,763,783.58 1,763,783.58
Hedge reserve 0.00 0.00 956,293.99 0.00 956,293.99
As of March 31, 2016 6,995,182.00 92,912,802.70 881,665.95 – 4,780,104.65 96,009,546.00
Consolidated statement of changes in equity as of March 31, 2017 according to IFRS
Notes
Notes 22
Imprint 27
22
Not
esKo
nzer
njah
resa
bsch
luss
Konz
ernz
wis
chen
lage
beric
htTo
the
shar
ehol
ders
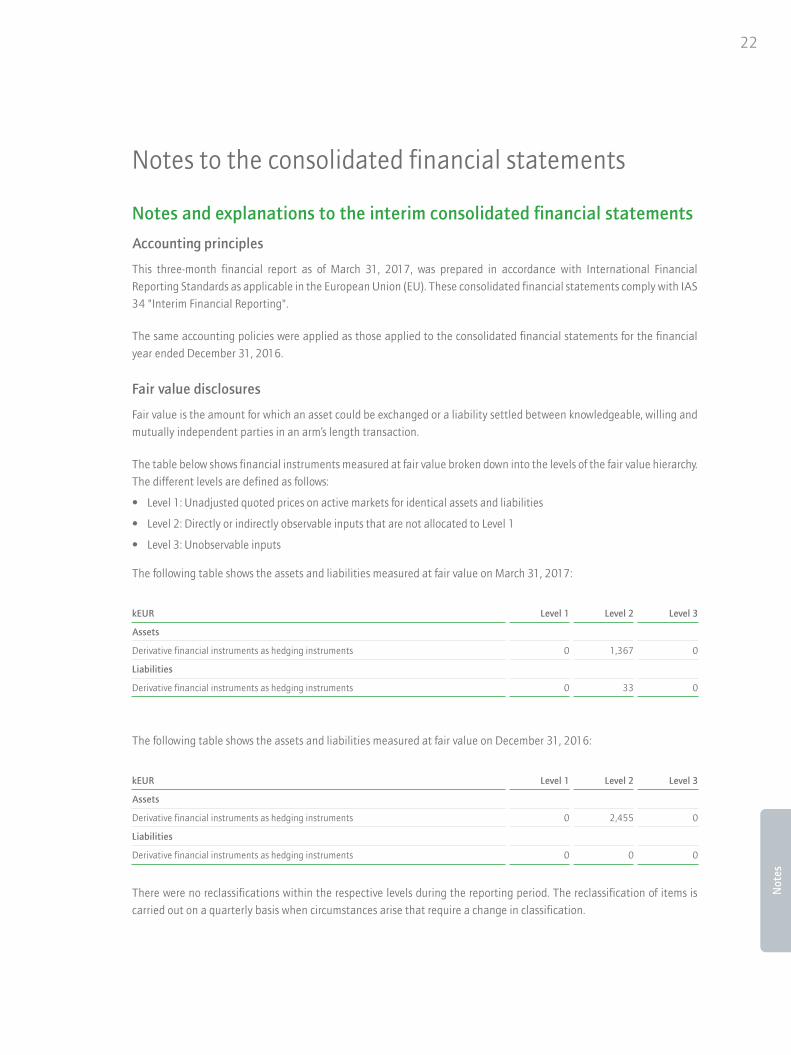
Notes and explanations to the interim consolidated financial statements
Accounting principles
This three-month financial report as of March 31, 2017, was prepared in accordance with International Financial Reporting Standards as applicable in the European Union (EU). These consolidated financial statements comply with IAS 34 "Interim Financial Reporting".
The same accounting policies were applied as those applied to the consolidated financial statements for the financial year ended December 31, 2016.
Fair value disclosures
Fair value is the amount for which an asset could be exchanged or a liability settled between knowledgeable, willing and mutually independent parties in an arm’s length transaction.
The table below shows financial instruments measured at fair value broken down into the levels of the fair value hierarchy. The different levels are defined as follows:
• Level 1: Unadjusted quoted prices on active markets for identical assets and liabilities
• Level 2: Directly or indirectly observable inputs that are not allocated to Level 1
• Level 3: Unobservable inputs
The following table shows the assets and liabilities measured at fair value on March 31, 2017:
kEUR Level 1 Level 2 Level 3
Assets
Derivative financial instruments as hedging instruments 0 1,367 0
Liabilities
Derivative financial instruments as hedging instruments 0 33 0
The following table shows the assets and liabilities measured at fair value on December 31, 2016:
kEUR Level 1 Level 2 Level 3
Assets
Derivative financial instruments as hedging instruments 0 2,455 0
Liabilities
Derivative financial instruments as hedging instruments 0 0 0
There were no reclassifications within the respective levels during the reporting period. The reclassification of items is carried out on a quarterly basis when circumstances arise that require a change in classification.
Notes to the consolidated financial statements

23
Not
esKo
nzer
njah
resa
bsch
luss
Konz
ernz
wis
chen
lage
beric
htTo
the
shar
ehol
ders
The fair value of financial instruments that are traded on an active market is based on the quoted market price on the reporting date. A market is considered to be active if quoted prices are easily and regularly available on a stock exchange or from a dealer, broker, industry group, pricing service or regulatory authority, and if these prices represent current and regularly occurring market transactions at arm’s length conditions. For assets held by the Group, the appropriate quoted market price corresponds to the bid price offered by the buyer.
The fair value of financial instruments that are not traded on an active market (e.g. over-the-counter derivatives) is determined using valuation methods based as much as possible on market data and as little as possible on company-specific data. If all data required to determine the fair value are observable, the instrument is assigned to Level 2. If one or more important data are not based on observable market data, the instrument is assigned to Level 3.
Specific valuation methods used to measure financial instruments include net present value models based on market data applicable on the reporting date.
Additional information on financial instruments
The following table shows the carrying amounts and fair values of all financial instruments recognized in the consolidated financial statements and the allocation of assets, liabilities and some of the balance sheet items to measurement categories in accordance with IAS 39:
kEUR
Measurementcategory
Carrying amount Fair value
31 / 03 / 2017 31 / 12 / 2016 31 / 03 / 2017 31 / 12 / 2016
Financial assets
Accounts receivable LaR 19,569 19,178 19,569 19,178
Other financial assets AfS 38 38 n / a n / a
Other current assetsof which financial instruments pursuant to IFRS 7
LaR 13,082 22,487 13,082 22,487
Derivative financial instruments n / a 1,367 2,455 1,367 2,455
Cash and cash equivalents LaR 70,537 54,924 70,537 54,924
Total 104,593 99,082 104,555 99,044
Financial liabilities
Accounts payable FLaC 42,094 46,988 42,094 46,988
Other liabilitiesof which financial liabilities pursuant to IFRS 7
FLaC 5,077 4,474 5,077 4,474
Finance lease liabilities n / a 12,583 13,100 12,583 13,100
Derivative financial instruments n / a 33 0 33 0
Total 59,787 64,562 59,787 64,562
LaR (Loans and Receivables)AfS (Available for Sale)FLaC (Financial Liability at amortized Cost)

24
Not
esKo
nzer
njah
resa
bsch
luss
Konz
ernz
wis
chen
lage
beric
htTo
the
shar
ehol
ders
The market values of the cash and cash equivalents, accounts receivable, current assets, accounts payable and other current liabilities reported as of March 31, 2017 and December 31, 2016, correspond to their carrying amounts. This is mainly due to the short-term maturities of such instruments.
The measurement of other financial assets (interests in non-consolidated Group companies) cannot be based on an active market or a quoted price, and the fair value cannot be determined by other means. Therefore, the disclosure of fair value has been omitted. The company does not intend to sell these instruments.
All of the Group’s financial liabilities are of a short-term nature with maturities of up to one year. Existing financial liabilities are repaid out of operating cash flows.
Aggregated by IAS 39 measurement categories, the Group’s financial assets and liabilities are as follows:
kEUR
Measurementcategory
Carrying amount Fair value
31 / 03 / 2017 31 / 12 / 2016 31 / 03 / 2017 31 / 12 / 2016
Financial assets
Loans and receivables LaR 103,188 96,589 103,188 96,589
Available for sale AfS 38 38 n / a n / a
Financial liabilities
Financial liability at amortized cost FLaC 47,171 51,462 47,171 51,462
Scope of consolidation
As of March 31, 2017, the Group’s scope of fully consolidated companies comprised zooplus AG, Munich, and the following subsidiaries:
Subsidiary Interest in share capital
Business activity
MATINA GmbH, Munich, Germany 100 % Private label business
BITIBA GmbH, Munich, Germany 100 % Secondary brand business
zooplus services Ltd., Oxford, Great Britain 100 % Service company for Great Britain
zooplus italia s.r.l., Genoa, Italy 100 % Service company for Italy
zooplus polska Sp. z o.o., Krakow, Poland 100 % Service company for Poland
zooplus services ESP S.L., Madrid, Spain 100 % Service company for Spain
zooplus france s.a.r.l., Strasbourg, France 100 % Service company for France
zooplus Nederland B.V., Tilburg, the Netherlands 100 % Service company for the Netherlands
zooplus Pet Supplies Import and Trade ltd., Istanbul, Turkey 100 % Sales company for Turkey
25
Not
esKo
nzer
njah
resa
bsch
luss
Konz
ernz
wis
chen
lage
beric
htTo
the
shar
ehol
ders
The following companies are not included in the consolidated financial statements:
• the wholly owned subsidiary zooplus EE TOV, Kiev, Ukraine, founded in the second quarter of 2011, with share capital of kEUR 10
• the wholly owned subsidiary zooplus d.o.o., Zagreb, Croatia, founded in February 2013, with share capital of kEUR 3
• the wholly owned subsidiary Tifuve GmbH, Munich, Germany, founded in May 2013, with share capital of kEUR 25
These three companies did not conduct any business activities during the financial year and were not included in the consolidated financial statements because of their minor importance.
Segment reporting
The zooplus Group operates in only one business segment – the distribution and sale of pet supplies in the EU and other European countries. The products sold by the company are homogeneous and cannot be sub-divided. As an online retailer, the company offers its products centrally from one location irrespective of the end customers’ geographic location. Consequently, there are no geographical segments as defined by IFRS. There is also no internal reporting by segment at present and, for this reason, the Group does not prepare segment reporting.
Earnings per share
Basic earnings per share is computed using the net profit for the period attributable to parent company shareholders divided by the weighted average number of ordinary shares outstanding during the reporting period. Consolidated net profit for the first three months of 2017 amounted to EUR 2.0 m (Q1 2016: EUR 1.8 m). The average number of shares outstanding in the first three months of 2017 was 7,060,902, resulting in basic earnings per share of EUR 0.28 (Q1 2016: EUR 0.25).
Diluted earnings per share is computed using the net profit for the period attributable to parent company shareholders divided by the weighted average number of ordinary shares outstanding during the reporting period plus any share equivalents that could lead to dilution. This computation results in notional earnings per share of EUR 0.28 (Q1 2016: EUR 0.25).
Information in accordance with Section 37w (5) of the WpHG
As with all of the company’s regular interim reports, these interim financial statements and the interim management
report have not been reviewed by an auditor.

26
Not
esKo
nzer
njah
resa
bsch
luss
Konz
ernz
wis
chen
lage
beric
htTo
the
shar
ehol
ders
German Corporate Governance Code
zooplus Aktiengesellschaft has submitted the declaration on the German Corporate Governance Code that is required under Section 161 of the German Stock Corporation Act (Aktiengesetz) and has made this declaration available to its shareholders on its website at http://investors.zooplus.com/en/corporate-governance/corporategovernancestatement.html.
Munich, May 18, 2017
The Management Board
Dr. Cornelius Patt Andrea Skersies Andreas Grandinger

Imprint
Publisherzooplus AG Sonnenstraße 15 80331 Munich Germany Tel.: +49 (0) 89 95 006 – 100 Fax: +49 (0) 89 95 006 – 500
Email: [email protected] www.zooplus.com
Investor Relationscometis AG Unter den Eichen 7 65195 Wiesbaden Germany Tel.: +49 611 20 58 55 – 0 Fax: +49 611 20 58 55 – 66
Email: [email protected] www.cometis.de
Concept, editing, layout and typesettingcometis AG
Photoszooplus AG
The 3-Monthly report is also available in German. In case of discrepancies the German version prevails.
A digital version of this zooplus AG 3-Monthly report as well as the annual reports can be downloaded from the Investor Relations section of www.zooplus.com.
Forward-looking statementsThis report contains forward-looking statements. These statements are based on current experience, estimates and projections of the management and currently available information. They are not guarantees for the realization of the future developments and results stated. The future developments and results are dependent on a wide range of factors. They encompass various risks and uncertainties, and are based upon assumptions as to future events that may not be accurate. Such factors include those discussed in the report on risks on page 14. We do not assume any obligation to update the forward-looking statements contained in this report.

zooplus AGSonnenstraße 1580331 MunichGermany