Embed Size (px)
Citation preview

3rd In
ternatio
nal W
ork
shop
on
Flu
oro
sis & D
efluorid
atio
n IS
FR
, En
DeC
o, IC
OH
Proceedings of the
3rd International Workshop
on
Fluorosis Prevention and Defluoridation of Water
Chiang Mai, Thailand
November 20-24, 2000
Edited by: Published by:
Eli Dahi
Sunsanee Rajchagool &
Nipaphan Osiriphan
ISFR
EnDeCo
& ICOH

Proceedings of the
3rd International Workshop
on
Fluorosis Prevention and Defluoridation of Water
Chiang Mai, Thailand
November 20-24, 2000
Edited by:
Eli Dahi
Sunsanee Rajchagool
& Nipaphan Osiriphan
Published by:
ISRF, EnDeCo & ICOH
ISBN
974-292-073-7
2
Proceeding of The 3rd International Workshop on Fluorosis Prevention and Defluoridation of Water
November 20-24, 2000, Chiang Mai, Thailand
Edited by
Eli Dahi, Sunsanee Rajchagool and Nipaphan Osiriphan
Published by
The International Society for Fluoride Research (ISFR)
Editorial Office:
17 Pioneer Crescent, Dunedin, New Zealand
URL: http://www.fluoride-journal.com/
E-mail: [email protected]
Environmental Development Co-operation Group (EnDeCo)
Ngongongare,
Usa River, P.O.B. 215, Tanzania
URL: http://De-Fluoride.net/
E-mail: [email protected]
And
Intercountry Centre for Oral Health (ICOH)
548 Chiang Mai-Lamphun Rd, Nong Hoi, Muang, Chiang Mai
Thailand 50000
URL: http://www.icoh.org/
E-mail: [email protected]
ISBN 974-292-073-7
ISFR, EnDeCo & ICOH 2002
Printed in Thailand by
Chiang Mai B. S. Publishing, Chiang Mai, Thailand 48 Santidhama Rd, Chang Puak, Muang Chiang Mai, Thailand 50200
3
Published by: ISFR, EnDeCo & ICOH
PREFACE
The following Proceedings represent the main outcome of The 3rd
International
Workshop on Fluorosis Prevention and Defluoridation of Water that took place in Chiang Mai, Thailand, on November 20
th – 24
th, year 2000. Ninety-six
participants from 13 countries, out of which 10 developing countries, were presented in the Workshop. The Workshop was a follow up of The 1
st International
Workshop that took place in Ngurdoto, Arusha Region, Tanzania October 18th-22, 1995 and The 2
nd International Workshop that took place in Nazreth, Ethiopia,
November 19th-25th 1997. On the contrary to previous workshops, the participants of the present arranged for their sponsorship on individual basis.
The final session of this 3rd Workshop was arranged as a study of the recently published World Health Organization Monograph on Fluoride: “WHO draft
publication WSH/DRAFT/99.9 Fluoride in Drinking Water”. Recognising the special environmental health conditions in fluorotic areas, as found mainly in developing countries, a lively discussion followed the presentation of the Monograph. During the discussion, it was decided to work out a response to WHO expressing the participant’s shared consensus on certain issues as mentioned in the Draft Publication. The response was then sent to WHO and a copy of it can be seen as the final proceeding in this publication.
The Proceedings of this Workshop, as well as the previous Workshops, are made available at non-profit costs. Further information is made available at the indicated homepages: http://De-Fluoride.net/ and http://www.icoh.org/
On the behalf of the International Organising Committee I would like to address thanks to The Intercountry Centre for Oral Health, ICOH, The National
Organising Committee and especially its Chairperson Director Sunsanee
Rajchagool for the perfectly sat up and masterly managed Workshop. Also special thanks to Dr. Nipaphan Osiriphan for her effective and careful handling of the paper manuscripts and to Dr. Wuttichai Choompolkul for his patience IT assistance in the editorial processing.
Eli Dahi,
Chairman of the International Committee
4
International Organising Committee:
Kjell Bjorvatn, Professor [email protected] Eli Dahi, Professor, Chairman [email protected] David Kennedy, Dr. [email protected] Sunsanee Rajchagool, Director, Vice Chairperson [email protected] A. K. Susheela, Professor [email protected] Wim van Palenstein Helderman, Professor [email protected]
Advisory Committee:
Vallop Thaineua, Dr., Director of Department of Health Wirat Pattanaporn, Dr. Prathip Phuntumvanit, Assoc. Prof. Rawadee Taupradist, Dr. Pakarat Nitisiri, Dr. Suvit Kattiyavong
National Organising Committee:
Sasitorn Chaiprasitti Chalermpong Chittaisong Wuttichai Choompolkul Kaneong Chuprathet Amporn Detpithak Thitiporn Kahatta Monton Kongpun Nirut Koonphol Kamol Laohakul Punnipa Laohapensang Patcharin Lekswat Somsak Lertjerajaras Nipaphan Osiriphan Jumpol Promsakha Na Sakolnakorn Pattama Promtrut Wimolsri Puangpinyo, Secretary Puangtong Pukrittayakamee Sunsanee Rajchagool, Director,
Chairperson Numpueng Ratanapiboon Oranuch Ritchitpian Nitraporn Rujanawisan, Assist. Secretary
Tipaporn Satiensakpong
Pacharawan Srisilapanan Wilai Tansukanun Chantana Ungchusak Chalermchai Vuttipitayamongkol Boonaur Yongvanichakorn
5
Editors: Eli Dahi, Sunsanee Rajchagool & Nipaphan Osiriphan
TABLE OF CONTENTS
Session 1: Epidemiology
Dental Fluorosis in the Deciduous Dentition of Ethiopian Children
K Bjorvatn*, F Wondwossen, G Shifara, A Bårdsen, R Tekle-Haimanot, MM Atashgahy and L Skartveit ...................................................................... 9-13
Community Perception on Fluoride and Related Health Problems in a Fluorotic Area in Ethiopia
Z Melaku, S Ismail, A Nordrehaug and R Tekle-Haimanot ......................... 14-21
Occurrence of Fluorosis due to Geothermal Sources in a Northern Thailand Subdistrict
W Noppakun, B Ratanasthein, T Prapamontol, P Asanchinda, K Obsuwan, J Na Suwan J and M Promputha ...................................................................... 22-29
Relation between Clinical and Perceived Dental Fluorosis among Adolescents in Arusha, Tanzania
K Mashoto, A N Åstrøm and A Bårdsen ...................................................... 30-41
Session 2: Methods and Occurrence
Correlation of Fluoride and Iron Concentrations in Rift Valley Aquifer of Jimma, Ethiopia
S. Tsewa Meskel ........................................................................................... 45-50
Experiences on Combating Fluorosis Cases in India
A.K. Susheela and M Bhatnagar ................................................................... 51-60
Bone Char Quality and Defluoridation Capacity in Contact Precipitation
J. AlbertusH. Bregnhøj* and M. Kongpun** ............................................... 61-72
Nomograph for Defluoridation of Water in Batch using Fish Bone Char D S Bhargava ............................................................................................... 73-79
Comparative Study of Fluoride Sorption Behaviour on Activated Carbon and Bone Char
R Watanesk and S Watanesk ........................................................................ 80-83
Sorption Study for Defluoridation by Bone Char S Watanesk and R. Watanesk ....................................................................... 84-88
6
3rd Int. Workshop on Fluorosis Prevention and Defluoridation of Water ISFR, EnDeCo & ICOH
Session 3: Field: Defluoridation & Management
Effectiveness of Domestic Defluoridator in Preventing Fluorosis in Kekirawa, Sri Lanka
J. P. Padmasiri ............................................................................................. 91-96
A Case Study of Fluorosis Mitigation in Dungarpur District, Rajasthan, India
A. K. Vaish & P Vaish .............................................................................. 97-104
Key Factors for Sustainability of Fluoride Management Programme with Special Reference to Rajasthan, India
P Vaish & A. K. Vaish ............................................................................ 105-110
Demand Responsive Fluorosis Prevention in a village in Thailand
A Bravo, H Bregnhøj, J P N Sakolnakorn, N Rattanapibool ................... 111-120
Decentralization and Community Participation in Dealing with Fluorosis in Lampang Province, Thailand
C Vuttipitayamongkol .............................................................................. 120-124
A Case study on Community Decision Making to Combat Fluorosis in Mae–Son, Thailand
W Tansukanun ......................................................................................... 125-130
Session 4: Guidelines
On the Standard Setting of Fluoride in Water: From Cookbook to Bible
S Rajchagool, C Rajchagool ..................................................................... 133-140
The State of Art of Small Community Defluoridation of Drinking Water Eli Dahi .................................................................................................... 141-170
Workshop Responsum to WHO
Participants’ Comments on WHO Draft Publication WSH/DRATFT/99.9 Fluoride in Drinking Water ............................................. Fel! Bokmärket är inte definierat.3-177

7
Editors: Eli Dahi, Sunsanee Rajchagool & Nipaphan Osiriphan
Session 1:
Epidemiology

8
3rd Int. Workshop on Fluorosis Prevention and Defluoridation of Water ISFR, EnDeCo & ICOH
3rd International Workshop on Fluorosis Prevention and Defluoridation of Water 9
Editors: Eli Dahi, Sunsanee Rajchagool & Nipaphan Osiriphan
Dental Fluorosis in the Deciduous Dentition of Ethiopian
Children
K Bjorvatn*, F Wondwossen, G Shifara, A Bårdsen, R Tekle-Haimanot,
MM Atashgahy and L Skartveit Bergen, Norway and Addis Ababa, Ethiopia
SUMMARY: While the problem of dental fluorosis in the permanent dentition has been
extensively studied, fluorosis in the deciduous teeth is less well known.
The purpose of the present study was to assess the prevalence and severity in newly shed
teeth, collected from school children in two areas with different fluoride contents in drinking
water; Addis Ababa, with 0.2 - 0.7 mgF/L, and Wonji-Shoa, with 1.7 -17.7 mgF/L. A total of
405 teeth were collected and screened according to tooth-type.
The teeth were examined for dental fluorosis, as well as caries, calculus and attrition.
Among the fluorotic teeth, 18 were selected for further inspection: the teeth were sectioned,
and thin specimens were studied by the use of micro-radiography and microscopy.
According to western standards, relatively little caries was found in the examined teeth.
However, 10%, respectively 25% of deciduous molars in Wonji-Shoa and Addis Ababa had
caries, mostly in the fissures. Attrition was found in practically all teeth. Dental fluorosis
was diagnosed in 49 teeth, while 26 teeth were characterised as "possibly fluorotic".
Most of the fluorotic teeth showed low-grade fluorosis. Only a few cases were severe, i.e.
with pitting of the enamel. No fluorosis was found in anterior teeth, a few cases were
diagnosed in the canines, while the highest prevalence and degree of fluorosis was seen in
deciduous molars. Thus, there is a clear relationship between the enamel damage and the
onset and duration of mineralisation of the teeth. Similarly, a strong relation was found
between the fluoride contents of the drinking water and the prevalence and severity of
dental fluorosis.
Key Words: Dental fluorosis, drinking water, deciduous dentition, Ethiopia.
INTRODUCTION
Fluoride is classified as a trace element, but is, in fact ubiquitous, and may rank among the more common elements in the biosphere1. As far as oral health is concerned, it is also one of the most interesting. Fluoride may enter the human body through solid food, through various beverages, and even through the air. The predominant fluoride source is, however, drinking water. Most surface waters contain less than 0.1 mg F/L, while ground waters may, depending upon the local base rock, contain rather high concentrations of fluoride.
* School of Dentistry, University of Bergen, 5009 Norway. E-mail: [email protected]
10 K Bjorvatn et al.
3rd Int. Workshop on Fluorosis Prevention and Defluoridation of Water ISFR, EnDeCo & ICOH
Igneous rock, which has an average fluoride content of 715 mg/kg, often contains high-fluoride water 2. Bårdsen et al. (1999) 3 found fluoride concentrations as high as 9.5 mg/L in ground water in very old granite and gneisses in Western Norway. Extremely high fluoride concentrations may be found in lakes and wells in areas with volcanic bedrock of relatively recent origin, e.g. in the African Rift Valley. Fluoride contents of 5000-6000 mg/L have been reported in acid spring waters located close to volcanic activity 1.
Potable water: According to WHO, the recommended upper limit for fluoride in drinking water should be 1.5 mg/L 3. In hot climates, where water intake is higher, the fluoride concentration should be even lower. Adequate drinking water is, however, scarce in many hot regions, and health authorities have had to accept water with higher fluoride concentrations. This is the case in certain areas of the African Rift Valley.
Rift Valley is known for endemic fluorosis. Dental fluorosis is caused by long-term, high intake of fluoride during childhood, especially during the first 6-7 years of life. The ameloblasts, which are highly specialised cells responsible for the production of enamel, are particularly susceptible to fluoride. Therefore, the most obvious harmful effect of prolonged excessive fluoride intake, is a faulty mineralisation of, and morphological changes in hard tissues such as enamel.
The degree of enamel damage depends on the amount of fluoride being ingested 4. Mild dental fluorosis is seen as thin white lines in the enamel, while, in serious cases, the whole tooth appears chalky white or, after a while, brownish, with brittle enamel that may break apart during mastication. Contra-lateral teeth are equally affected; i.e. the enamel changes are symmetric, which makes diagnosis easier. Dental fluorosis is used as a biomarker for excessive intake of fluoride during the period of enamel formation; roughly the first 7-8 years of life.
While fluoride is the cause of fluorosis, factors such as the quality of food may influence the degree of enamel changes. In most cases the severity of fluorosis is closely correlated with fluoride concentration in the drinking water.
Dental fluorosis may affect both dentition, but, as pointed out e.g. by Fejerskov et al. 5, primary teeth exhibit less dental fluorosis than their permanent successors. Most studies, consequently, have concentrated on fluorosis in the permanent dentition. The objective of the present study was to assess, macroscopically and microscopically, dental fluorosis, dental caries and dental abrasion in newly shed deciduous teeth.
MATERIAL AND METHOD
The deciduous teeth donors were primary school children, aged 5-14 years, living in two different areas in Ethiopia:
Addis Ababa, a big, highly polluted city, served with low-fluoride drinking water, 0.2 –0.7 mg/L; mostly from surface water reservoirs in the mountains.
Dental fluorosis in the deciduous dentition of Ethiopian children 11
Editors: Eli Dahi, Sunsanee Rajchagool & Nipaphan Osiriphan
Wonji-Shoa, a sugar estate in rural Rift Valley, with various villages, approximately 100 km south of the capital. The villages depend on sub-surface water sources, the fluoride concentrations of which vary from approximately 2 to 15 mg/L.
After the approval of the proper authorities, an Ethiopian research assistant approached the children, offering pencils and notebooks in exchange for newly shed deciduous teeth. The offer was well received, and a total of more than a thousand teeth were collected. The present material consists of 405 teeth.
After listing name, age and hometown as well as identifying the tooth according to the WHO system, the exfoliated teeth were placed in small plastic envelopes that were labelled, and closed. The teeth were brought to Norway, sterilised by heating, and examined for abrasion, caries and dental fluorosis by a team of dental students and experienced dentists.
RESULTS
According to western standards, relatively little caries was found in the examined teeth. However, 10 %, respectively 25 % of deciduous molars in Wonji-Shoa and Addis Ababa had caries, mostly in the fissures. Attrition was found in practically all teeth.
As compared to standards in Northern Europe, the exfoliation of deciduous teeth (tooth shedding), and thereby tooth eruption, took place earlier in the Ethiopian material, and children in rural Wonji-Shoa seemed to shed their teeth at a slightly lower age than their counterparts in Addis Ababa.
In the whole material, dental fluorosis was diagnosed in 49 teeth; 44 in Wonji-Shoa, and 5 in Addis, while 37 teeth were characterised as “possibly fluorotic”; 28 and 9 in WS and AA, respectively (Table 2). Deciduous incisors showed no signs of fluorosis, neither in Addis Ababa nor in Wonji-Shoa. With the exception of two doubtful findings, also canines in Addis Ababa were without dental fluorosis. Deciduous molars seemed to be most susceptible to fluorotic damage. Most of the fluorotic teeth showed low-grade fluorosis. Only a few cases were severe, i.e. with pitting of the enamel.
Among the fluorotic teeth, 18 were selected for further inspection: These teeth were sectioned, and thin specimens were studied by the use of microradiography and microscopy. The microradiographs showed light degrees of dental fluorosis manifested by hypo-mineralised sub-surface areas in the enamel. The microradiographic picture of mild degree of fluorosis is similar to what is seen in early stages of dental caries, but the differential diagnosis can normally be made based on the localisation of the lesion; intra-orally also by the symmetrical appearance of dental fluorosis.
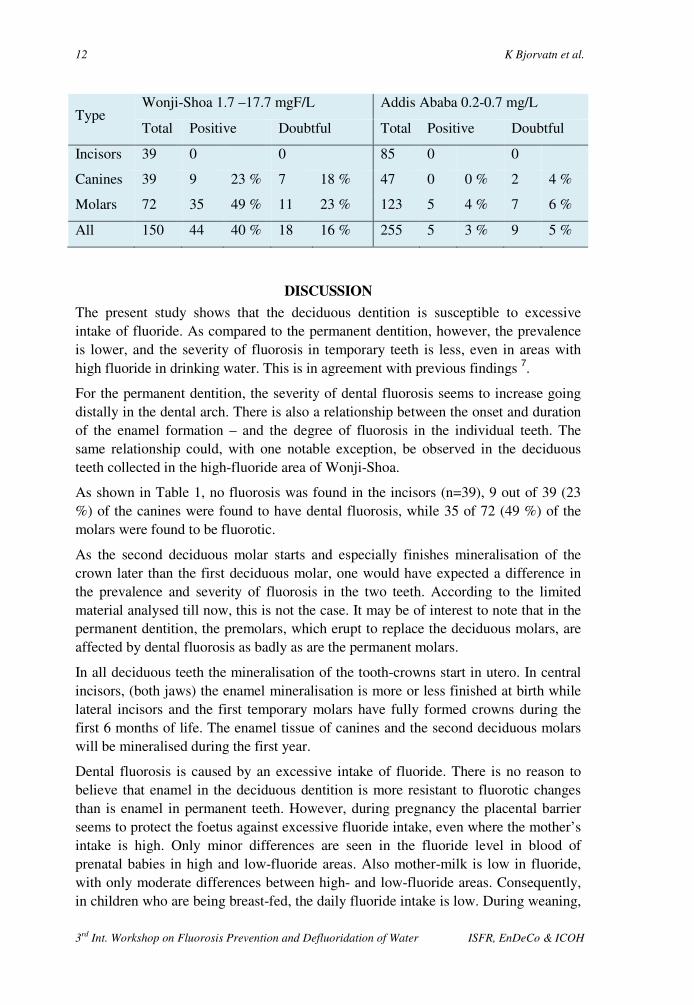
TABLE 1. Number of deciduous teeth with fluorosis.
12 K Bjorvatn et al.
3rd Int. Workshop on Fluorosis Prevention and Defluoridation of Water ISFR, EnDeCo & ICOH
Type Wonji-Shoa 1.7 –17.7 mgF/L Addis Ababa 0.2-0.7 mg/L
Total Positive Doubtful Total Positive Doubtful
Incisors 39 0 0 85 0 0
Canines 39 9 23 % 7 18 % 47 0 0 % 2 4 %
Molars 72 35 49 % 11 23 % 123 5 4 % 7 6 %
All 150 44 40 % 18 16 % 255 5 3 % 9 5 %
DISCUSSION
The present study shows that the deciduous dentition is susceptible to excessive intake of fluoride. As compared to the permanent dentition, however, the prevalence is lower, and the severity of fluorosis in temporary teeth is less, even in areas with high fluoride in drinking water. This is in agreement with previous findings 7.
For the permanent dentition, the severity of dental fluorosis seems to increase going distally in the dental arch. There is also a relationship between the onset and duration of the enamel formation – and the degree of fluorosis in the individual teeth. The same relationship could, with one notable exception, be observed in the deciduous teeth collected in the high-fluoride area of Wonji-Shoa.
As shown in Table 1, no fluorosis was found in the incisors (n=39), 9 out of 39 (23 %) of the canines were found to have dental fluorosis, while 35 of 72 (49 %) of the molars were found to be fluorotic.
As the second deciduous molar starts and especially finishes mineralisation of the crown later than the first deciduous molar, one would have expected a difference in the prevalence and severity of fluorosis in the two teeth. According to the limited material analysed till now, this is not the case. It may be of interest to note that in the permanent dentition, the premolars, which erupt to replace the deciduous molars, are affected by dental fluorosis as badly as are the permanent molars.
In all deciduous teeth the mineralisation of the tooth-crowns start in utero. In central incisors, (both jaws) the enamel mineralisation is more or less finished at birth while lateral incisors and the first temporary molars have fully formed crowns during the first 6 months of life. The enamel tissue of canines and the second deciduous molars will be mineralised during the first year.
Dental fluorosis is caused by an excessive intake of fluoride. There is no reason to believe that enamel in the deciduous dentition is more resistant to fluorotic changes than is enamel in permanent teeth. However, during pregnancy the placental barrier seems to protect the foetus against excessive fluoride intake, even where the mother’s intake is high. Only minor differences are seen in the fluoride level in blood of prenatal babies in high and low-fluoride areas. Also mother-milk is low in fluoride, with only moderate differences between high- and low-fluoride areas. Consequently, in children who are being breast-fed, the daily fluoride intake is low. During weaning,

Dental fluorosis in the deciduous dentition of Ethiopian children 13
Editors: Eli Dahi, Sunsanee Rajchagool & Nipaphan Osiriphan
however, a child may be exposed to special weaning food that may be prepared mixed with local, high fluoride drinking water. Alternatively, children may be fed “adult food” which may also be high in fluoride; especially if high-fluoride salts or tenderisers (trona) have been added to the food.
A previous examination in Wonji-Shoa8 found that practically all maxillary permanent incisors in children born and bred in these high-fluoride villages, were fluorotic. This is in stark contrast to the 0 % found in the deciduous front teeth.
CONCLUSION
The deciduous dentition may develop dental fluorosis, though the prevalence and severity of the fluorotic damage is less than what is seen in the permanent dentition in the same area/same persons. A strong relation has been found between the fluoride contents of the drinking water and the prevalence and severity of the fluorosis. In the present material no fluorosis was found in the deciduous incisors. On the average, more severe fluorosis was observed in the “distal” than in the “anterior” teeth. This is probably related to an increasing intake of fluoride in a child that is being weaned.
REFERENCES
1. Smith FA, Ekstrand J. The occurrence and the chemistry of fluoride. In: Fluoride in dentistry, Second ed. Munksgaard, Copenhagen, 1996.
2. Bricker OP, Jones BF. Main Factors Affecting the Composition of Natural Waters. In: Trace Elements in Natural Waters. Ed. Salbu B, Steinnes E. CRC Press Boca Raton, Florida 1995.
3. Bårdsen A, Bjorvatn K, Selvig KA. Variability in fluoride contents of subsurface water reservoirs. Acta Odontol. Scand. 1996; 54; 343-7.
4. World Health Organization. Fluorides and Oral Health. Report of a WHO expert committee on oral health status and fluoride use. Geneva: WHO; 1994.
5. Fejerskov O, Manji MJ, Baelum V. The nature and mechanisms of dental fluorosis in man. J Dent Res 1990; 69: 692-700.
6. Fejerskov O, Kragstrup J, Richards A. Fluorosis of teeth and bone. In: Fluoride in Dentistry, Ed: Fejerskov J, Ekstrand J, Burt BB. Munksgaard, Copenhagen, 1988.
7. Thylstrup A. Distribution of dental fluorosis in the primary dentition. Community Dent Oral Epidemiol 1978; 6: 329-39.
8. Fantaye W, Shifera G, Tekle-Haimanot R. Prevalence of dental fluorosis in the Wonji-Shoa sugar estate. In: Proceedings of the 2nd International Workshop on Fluorosis and Defluoridation of Water. Ed. Dahi E and Nielsen JM. Internat Soc Fluoride Res 1999: 39-43.
14 3rd International Workshop on Fluorosis Prevention and Defluoridation of Water
Editors: Eli Dahi, Sunsanee Rajchagool & Nipaphan Osiriphan
Community Perception on Fluoride and Related Health
Problems in a Fluorotic Area in Ethiopia
Z Melaku*, S Ismail, A Nordrehaug and R Tekle-Haimanot
Addis Ababa, Ethiopia and Bergen, Norway.
SUMMARY: An exploratory qualitative survey was conducted to describe the knowledge,
attitude and perception of the community regarding fluoride and related health problems in
an area with endemic fluorosis. The study was carried out in Wonji-Shoa Sugar Estate, an
agro-industrial community in southeastern Ethiopia.
To this effect, six Focus Groups were identified, each of 8-10 participants, to represent the
various segments of the population in the area. Then a series of six Focus Groups
Discussions were carried out in a community setting led by the investigators.
The results showed that the health consequences of consuming untreated water are fairly
understood. However, there is still a knowledge gap and a wrong perception concerning
fluoride and its health consequences particularly among. This study has also showed a
positive attitude of the community towards taking an active part in future efforts in
providing the community with a safe water supply. It is recommended to provide health
education to the community with emphasis to the women from the lower socioeconomic
segment of the community and to address the perception issues further in future large-scale
studies using a combination of qualitative and quantitative methods.
Key words: Fluoride, community perception, Ethiopia, Wonji-Shoa area, focus group discussions, health education.
INTRODUCTION
Chronic exposure to excessive fluoride may cause toxic damage to osseous tissues, which manifests as dental and skeletal fluorosis. The toxic effects interfere with the mineralisation process and the defects that result are in general irreversible. In the majority of affected communities, fluorosis is attributed to ingestion of excessive fluoride from drinking water1.
In Ethiopia by 1990, about 150 communities and natural water bodies had been tested for fluoride levels by the Ethiopian Water Supply and Sewerage Authority and several other institutions and individual researchers2-7. Of the 65 localities studied in the Rift Valley, 47 had fluoride levels above 1.5 mg/L, 31 of them with concentrations of 5 mg/L and above, and 7 between 20 mg/L and 177 mg/L. Of the 85 localities in lowlands outside the rift system and in the Ethiopian highlands, 11 had concentrations
* Faculty of Medicine, Addis Ababa University , Ethiopia E-mail: [email protected]
Community perception on fluoride and related health problems in a fluorotic area in Ethiopia 15
Editors: Eli Dahi, Sunsanee Rajchagool & Nipaphan Osiriphan
above 1.5 mg/L, 3 of them, all in the high lands above 1,800 m elevation, around 5 mg/L.
In view of the increased emphasis on safety of drinking water, public health and water managers are confronted with an important question relating to the priority of fluorosis in the perspective of other complex life threatening problems that are common in the less developed countries. Moreover, if the WHO recommendation of 1.5 mg/L as the maximum permissible concentration of fluoride in drinking water8 is to be used as a standard, most of the boreholes in the affected regions would be closed down. The problem is further aggravated by limited budgets, which renders the feasibility of established defluoridation technologies or provision of alternative waters uncertain in the majority of the areas. In addition, since the economic cost of endemic fluorosis to human beings is largely indirect, the possibility of recognition as an area of immediate need by the governments in the less developed countries seem unlikely.
However, given that endemic fluorosis is an important public health concern in the area7,9,10 as in the planning of public heath strategies one should explore the possibility of mobilising the community at risk to use possible less technical methods to protect themselves. For this to be feasible, some understanding of the knowledge, attitude and perception of the affected communities is required.
The objective of this study is, therefore, to assess the knowledge, attitude and perception of the community about fluoride and fluoride related health problems with a view of identifying entry points for preventive intervention.
METHODS
The study was conducted in the Wonji-Shoa Sugar Estate (WSSE) in the Rift Valley region of Ethiopia. The region has a number of agro-industrial establishments the most important are the WSSE and the Metahara Sugar Estates. WSSE is an agro-industrial community situated 10 km from south of Nazareth City and 110 km southeast of the capital Addis Ababa. At present the estate stretches over an area of 50 square km. The WSSE community has an estimated population of around 20,000 organised in sixteen villages, two factory villages and fourteen plantation villages. The community of the estate has largely depended on well water with high fluoride contents ranging from 1.7 mg/L to 17.7 mg/L. Both dental fluorosis and skeletal fluorosis has been reported from WSSE 7,9,10.
Six Focus Groups were identified representing the various segments of the population in the area, cf. Table 1. Participants were invited to take part on a voluntary basis. In each focus group, 8 - 10 persons participated. Qualitative research technique was used, as a series of six Focus Group Discussions (FGDs). The FGDs were conducted among men (3 groups) and women (3 groups). The two groups of women and two groups of men were from plantation sites representing the low socio-economic segments of the community, while one group of women and one group of men were

16 Authors: Z Melaku, S Ismail, A Nordrehaug & R Tekle-Haimanot
3rd Int. Workshop on Fluorosis Prevention and Defluoridation of Water ISFR, EnDeCo & ICOH
representing the higher socio-economic or educated segment of the community. The study was carried out in June 2000.
TABLE 1 Grouping of in the Focus Group Discussions.
Focus Group
I
II III IV V
VI
Higher/Lower socioeconomy & education L L
H
L
L
H
Gender Men/Women W W W M M M
Table 2 Focus Group Discussion Guide – discussion themes
9. What are the major and priority health problems in your locality? 10. How do you assess the sources, adequacy, safety and quality of the water
supply in your locality? 11. What health related problems do exist due to the water that you use in the
locality, particularly dental and skeletal complications? 12. Knowledge, perceptions and attitude of the community regarding dental and
skeletal problems due to the water use? 13. Discuss any health, social and economic consequences due to the dental and
skeletal problems as a result of the water consumption. 14. Did any of you hear about the term “fluoride”? Explain what it does to your
health. 15. Have you ever been taught or informed about fluoride-related problems and
their consequences here in the locality? 16. What do you think should be done to solve fluoride-related problems? How far
are you ready to participate in any endeavour to find solutions for these problems?
The discussions took place in community settings, where the participants were comfortable. Quiet and private locations were selected for this purpose. The co-principal investigators of the study moderated the discussions. Participants were maximally stimulated to express their opinions freely. The discussions were conducted in the local language, Amharic.
A pre-structured discussion guide was used to lead the discussion cf. Table 2. All discussions were tape-recorded and later transcribed and analysed manually by the investigators. The transcribed information was categorised and summarised for presentation in the narrative form.

Community perception on fluoride and related health problems in a fluorotic area in Ethiopia 17
Editors: Eli Dahi, Sunsanee Rajchagool & Nipaphan Osiriphan
RESULTS
Major and priority health problems in the locality. Across all the groups malaria stood as the most important health problem. This was then followed by other water born parasitic diseases i.e. amoebiasis, bilharziasis, giardiasis, and by respiratory problems. The men groups and the women from the higher socio-economic segment of the community mentioned teeth discoloration and bowing and stiffness of the back, stiffness of the joints as next priority health problems. The women groups from the plantation villages failed spontaneously to consider teeth discoloration, bowing of the back and difficulty in turning the head as important health problems.
Community perception towards drinking water. All groups mentioned three types of water: a) treated borehole water supplied in pipe for drinking, b) untreated borehole water supplied in pipe for other domestic purposes and c) raw river water flowing in irrigation canals. It was emphasised that the supply of treated water, type a, was often discontinued and people are forced to consume mainly water b and to less extend c. The discontinuation sometimes lasts for months and even years in some camps.
When available, the treated water supply was considered to be adequate. Women groups from the plantation sites particularly emphasised that water was not at all a mention-worthy problem in their locality. They went to such an extent and said that “one can never choose water like one can not choose his-her mother”. Whereas women from the higher socio-economic segment of the community have complained about the unavailability of treated and safe water continuously. They incriminated the water types b and c cause diarrhoeal diseases. They also attributed the teeth problem and bowing of the back to the use of the untreated pipe water, type b, and not to the use of water a or c.
The two groups from higher socio-economic segment of the community said that in order to protect their children from teeth discoloration they, whenever possible, bring water from Addis Ababa.
Perceived health problems of water use. Across all groups it was felt that the treated pipe water, in the contrary to the two other water types, was very safe for consumption. The water type c, coming along the irrigation canals from the Awash River was assumed to cause bilharziasis, and malaria. The water type b, piped untreated borehole water, was assumed to cause giardiasis, amoebiasis and other intestinal problems as well as discoloration, fragility and loosing of teeth and bowing and stiffness of the back.
All, except the women from the plantation sites, were quite knowledgeable about the existence of the dental and skeletal problems arising due to drinking water from the untreated sources. The women from the plantation sites were clearly ignorant regarding the fluorosis problems.
There was a consensus in most groups from the plantation sites that tooth discoloration is so rampant that it has never been considered as something abnormal in their communities. The teeth problems were reported to start at early ages and are
18 Authors: Z Melaku, S Ismail, A Nordrehaug & R Tekle-Haimanot
3rd Int. Workshop on Fluorosis Prevention and Defluoridation of Water ISFR, EnDeCo & ICOH
extremely widely prevalent. Yet, it is not commonly perceived as a major problem because of the wide spread prevalence to the extent that it has become the identity of being a resident of Wonji in other parts of the country. Their only concern was in those severely affected the teeth were weak and fragile and this creates difficulty in chewing hard food. On the other hand those groups from the higher socio-economic segment of the community had a clear concern and worry that theirs and their children’s teeth were discoloured and anaesthetically looking. That is why some of the residents particularly those with a higher socio-economic status brought water from places as far as Addis Ababa for drinking purposes. These are the few households who can afford. For most this was just unthinkable. Concerning functionality, all agreed that healthy teeth should be able to chew “anything edible”, be it soft or hard food like dry bread, sugar cane and the like.
It was also mentioned by most groups that prolonged consumption of the untreated pipe water led to the bowing of the back, stiffness of the joints in the later ages of life. These were said to be very much prevalent among the factory workers and among the old.
Fluoride and fluorosis: Though water was ascribed to be the cause of the teeth and skeletal problems described by most of the discussants, when a question was raised about the exact etiologic agent, the opinions were diverse. Some said that this is due to the rusting of the pipes, others said it is just due to the nature of the untreated pipe water, many said that they had no idea at all. A few of them mentioned that it might be because some “minerals” which are found in water in large amount. The word “fluoride” was hardly known among the various participants, particularly the women and also the men from the plantation sites. The well-off men were very much knowledgeable on this issue. Discussants from the plantations particularly the women were completely ignorant. They were repeatedly probed for it, yet they were not able respond. Most men and women from the higher socio-economic group were well conversant about the term fluoride, problems related to very high levels of it in the water and about its health consequences.
Health workers from the hospital as well as others have carried out several campaigns on health education. The topics were mainly about malaria, environmental health, tuberculosis, vaccination and so on. But most of the FGD participants said that the fluoride related problems have either been avoided or mentioned shortly. Almost none of the discussion groups mentioned to have been actively taught about fluoride related problem at all.
Health and socioeconomic consequences: Most of the participants did not think that the teeth discoloration is a problem. Yet the younger ones said that, when going to other areas, they were singled out as people from Wonji. The girls particularly felt a bit ashamed of having such discoloured teeth. They often had to cover their mouth while laughing. There were also many who could not eat hard foods and their teeth were often foul smelling, very fragile and painful. Older people were reported to be at
Community perception on fluoride and related health problems in a fluorotic area in Ethiopia 19
Editors: Eli Dahi, Sunsanee Rajchagool & Nipaphan Osiriphan
risk of bowing and stiffness of the back and the joints and this interferes with their day to day activities.
There was some difference among the seasonal workers and the permanent ones regarding their dental health. The seasonal ones said that they were laid-off for some time during summer and hence they went to their families in the countryside where they consumed clean spring water and hence were less likely to develop the teeth and skeletal problems.
Economically, bowing and stiffness of the back and joints resulted in early retirement for some individuals. Weak and fragile teeth interfered with chewing, particularly hard food that is essential part of the diet in the plantation villages.
Preventive measures: Concerning possible solutions some groups suggested that the water from the river is relatively safe and that water should be pumped, treated and distributed for consumption. Some families are bringing drinking water from remote places like Addis Ababa, however, it was agreed, this could not solve the problem of the community. All the discussants expressed willingness to participate in any public health activity intended to provide the community with a safe water supply in a continuous basis.
DISCUSSION
This study is exploratory in nature and a statistically representative sample was not intended. Hence, the findings should be interpreted with this limitation in mind. However, since the various focus groups are selected in such a way that they represent the different age groups, genders, and socio-economic segment of the community studied, we believe that the study gives a realistic impression of the issues addressed.
To our knowledge so far, there are no studies reported describing knowledge perception, attitude and health seeking behaviour of inhabitants residing in fluorotic areas. It was also very difficult to obtain international literature dealing with similar issue. Hence, it was not possible to compare and contrast the finding of this study with others.
In our study dental fluorosis was not considered as a major and priority health problem by most of the groups. This may be due to its developmental nature and the fact that often it is painless and non-life threatening. Also this may be due to the fact that it affects the majority of people at such a large scale that discoloration of the teeth being considered as a community norm. Nevertheless, it was viewed by some as an embarrassing public health problem particularly for girls, and it became a concern for everybody when it causes pain and interferes with feeding.
The groups from the higher socioeconomic segment of the community were fairly knowledgeable about fluoride and its health consequences. On the other hand, the lack of knowledge concerning fluoride and its health consequences in women from the lower socio-economic segment of the community deserves due attention and action. Since most of these women are in the childbearing age, education would have

20 Authors: Z Melaku, S Ismail, A Nordrehaug & R Tekle-Haimanot
3rd Int. Workshop on Fluorosis Prevention and Defluoridation of Water ISFR, EnDeCo & ICOH
a great impact. This should be incorporated to the routine health education given in the villages. Another concern coming out of this study is that health workers seem to have avoided teaching about fluorosis and what do about it. Many respondents said that they were told nothing about fluorosis from professionals. This may have happened out of the frustration of the health workers themselves, because most of the defluoridation attempts have been either not fully successful or not sustainable.
The reported economic consequences to persons affected by skeletal fluorosis should also be of concern. From the discussions of the study one can learn that those who have lived for long time in the locality do develop severe skeletal fluorosis and as a consequence are either put on low payment jobs or laid-off. It is therefore, not difficult to understand the consequences in the family and the community at large. Most of the discussants, particularly plantation workers, expressed frustration and helplessness saying that they are going to end in such situations.
All groups expressed willingness to participate in activities directed at improving the provision of safe water to the community. This, supplemented by health education, will be an important asset for future defluoridation programmes.
In conclusion, this study indicates that the health consequences of consuming untreated water are fairly understood. However, still there is a knowledge gap and wrong perception concerning fluoride and its health consequences, particularly among women from the lower socioeconomic segment of the community. Hence health education should be given to the community with emphasis to this group. This study has also showed a positive attitude of the community towards taking an active part in future efforts in providing the community with safe water. To address these issues further future large-scale studies using a combination of qualitative and quantitative methods are recommended.
ACKNOWLEDGEMENTS
This study was supported by a grant from NUFU Project 61/96. The authors gratefully acknowledge the assistance received from Dr. Fekadu Adugna and Dr. Neway Gessese, Medical Director and Physician of Wonji Hospital respectively.
REFERENCES
1. Environmental Health Criteria 36. Fluorine and Fluorides. WHO, Geneva, 1984. 2. Water Supply and Sewerage Authority (WSSA). Department of Water Quality,
Addis Ababa, unpublished data for 1985-1990. 3. Chernet T. Hydrology of lake regions of Ethiopia. Addis Ababa: Ethiopian
Institute of Geological Surveys. , 1982. 4. Zewde F, Ecclestom BL, Giacometti L. The fluoride problem in the Ethiopian
Rift Valley. Awash Valley Authority. Addis Ababa, 1977. 5. Talling JF, Talling JB. The chemical composition of the African lake waters. Int
Revue Gesamnt. Hydrobiologie ,50;421-463, 1965. 6. Water Supply and Sewerage Authority (WSSA). 34 towns water feasibility study.
Report prepared by German Water Engineering for WASSA, Addis Ababa, 1983.
Community perception on fluoride and related health problems in a fluorotic area in Ethiopia 21
Editors: Eli Dahi, Sunsanee Rajchagool & Nipaphan Osiriphan
7. Tekle-Haimanot R, Asmerom F, Bushra B. Endemic fluorosis in the Ethiopian Rift Valley. Trop. Geogr. Med. 1987; 39: 209-217.
8. Guidelines for Drinking Water Quality. Health Criteria and other supporting information. WHO, Geneva, 1984.
9. B. Belachew. The occurrence and distribution of fluoride and fluorosis in Wonji-Shoa Sugar Estate and adjacent areas. M.A. thesis, Department of Geography, Addis Ababa University, 1990
10. Tekle-Haimanot R. Neurological complications of endemic skeletal fluorosis, with special emphasis on radiculo-myelopathy. Paraplegia 1990; 28: 244-251.
22 3rd International Workshop on Fluorosis Prevention and Defluoridation of Water
Editors: Eli Dahi, Sunsanee Rajchagool & Nipaphan Osiriphan
Occurrence of Fluorosis due to Geothermal Sources in a
Northern Thailand Subdistrict
W Noppakun*, B Ratanasthein, T Prapamontol, P Asanchinda, K Obsuwan, J Na Suwan J and M Promputha
Chiang Mai and Chiang Rai, Thailand
SUMMARY: In northern Thailand, more than 40 hot springs are known and are commonly
associated with fluorite deposits. A geological study indicated that the high fluoride
concentrations in domestic drinking water originated from geothermal sites and their
activities. The purpose of this study was to assess the occurrence of dental fluorosis due to
the geothermal sources in the Doi Hang Sub-district, Muang District, Chiang Rai Province
in northern Thailand.
Mottled enamel was assessed according to the Deans Index in 304 primary school children,
age 6-15 years. In parallel the water quality, including fluoride concentration, was
determined for environmental waters and for drinking water. For the analysis quality
control the ion balance was checked. Furthermore, the fluoride concentration in affected
children was measured.
Environmental waters contained from 0.2 to 18.9 mg F/L. The fluoride concentration
appears to be related to the concentration of sodium. The drinking water samples contained
from 0.1 to 2.3 mg F/L. The Dean’s Community Fluorosis Index was found for the studied
area in total to be 0.25. This demonstrates that fluorosis occurs, but not as a major public
health problem. However, the most serious cases was found at Ban Pong Na Kham nearby
geothermal sources, where the fluoride levels in drinking water and ground water were also
high.
Thus the study indicates that occurring fluorosis is related the geothermal sources.
Key words: Dental fluorosis, geothermal site, Chiang Rai province, Thailand, Dean’s Index.
INTRODUCTION
Dental Fluorosis. The chronic toxic effect of fluoride ion can be seen in children’s teeth. Fluorotoxicosis was reported in Nakorn Chiang Mai Hospital 6. In the affected area, the concentration of fluoride ion is generally high in the deeper wells. This suggests that the concealed underground fractures or faults, covered by the alluvium are controlling the fluoride ion distribution. Fluoride concentration was also used as a chemical indicator for the direction of concealed fractures in the area 5.
Dental fluorosis is a diffuse symmetric hypo-mineralisation deficiency (irregular calcification) and disorder of ameloblasts (enamel-forming cells). Fluorosis is irreversible and only occurs with exposure to fluoride when the enamel is developing. Secondary incisor teeth start forming as a babies 3-6 months old, molars are
* Toxicology Section Consumer Protection Groups, Chiang Rai Regional Medical Science
center, Muang, Chiang Rai, Thailand, 57100 E-mail: [email protected]
Occurrence of fluorosis due to geothermal sources in a northern Thailand subdistrict 23
Editors: Eli Dahi, Sunsanee Rajchagool & Nipaphan Osiriphan
developed at six to eight years of age and wisdom teeth are formed by 12 years of age 7.
The urinary fluoride level is widely regarded as one of the best indices of fluoride intake. The significance of urinary fluoride concentration varies with individuals and circumstances of intake. Urinary fluoride concentration may fluctuate with variable amounts consumed 8.
Geothermal waters. A geological study indicated that the high concentration of fluoride in the domestic drinking water in northern Thailand was resulted from the intrusion of geothermal water into the groundwater resources. Thus and earthquake could effect the release of fluoride and consequently, could increase the fluoride contents in the groundwater –based domestic water 5.
Man has used geothermal waters since earliest time for a variety of purposes. Hot spring, fumarole and geyser have been known in areas of high geothermal heat flow from underneath. In northern Thailand, more than 40 hot springs have been studied and are known to occur scattered throughout the region 4.
MacDonald et al (1977) 1 discussed that fluorite mineralisation is commonly related to the hot springs, and this has been interpreted to be further evidence for a tertiary granitic intrusion events. Numerous hot springs in northern Thailand are commonly associated with the margins of granitic intrusions and/or with major fault zones.
In Muang District Chiang Rai province, the level of fluoride of water in the geothermal well at Ban Pong Na Khum was 37 mg/L 6. Tambon Doi Hang, Amphoe Muang, Changwat Chiang Rai is in the risk area of geothermal sources and faults. Water resources may therefore be contaminated with fluoride and cause fluorotoxicosis.
Study objective. The objective of the study is to assess the dental fluorosis and the pollution of environmental as well as drinking water with fluoride, probably due geothermal sources.
MATERIALS AND METHOD
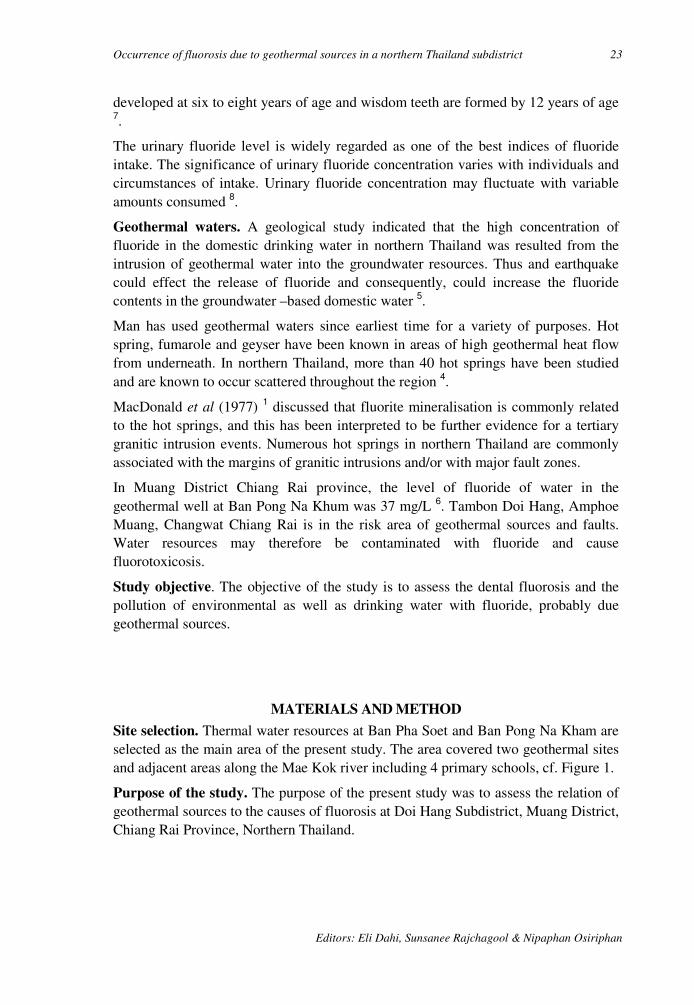
Site selection. Thermal water resources at Ban Pha Soet and Ban Pong Na Kham are selected as the main area of the present study. The area covered two geothermal sites and adjacent areas along the Mae Kok river including 4 primary schools, cf. Figure 1.
Purpose of the study. The purpose of the present study was to assess the relation of geothermal sources to the causes of fluorosis at Doi Hang Subdistrict, Muang District, Chiang Rai Province, Northern Thailand.
24 Authors: W Noppakun et al.
3rd Int. Workshop on Fluorosis Prevention and Defluoridation of Water ISFR, EnDeCo & ICOH
Sampling. Water samples were collected in the rainy season during June- September 1999 and in the dry season during November-December 1999. For the cation analyses Approximately 500 mL water samples for detecting cation elements were preserved with 1 % nitric acid. Another 1000 mL sample was taken without acid preservation for anion analysis. School children drinking water samples were collected only from drinking water of positive mottled enamel children.
The investigation of mottled enamel among school children age 6-15 years old from 4 primary schools was performed by a dentist with the assistance of the Chiang Rai Dental Health Center. The presence of mottled enamel of all permanent incissors and first molars, using FI (fluorosis index of Dean,1934)
Analysis. Cations viz. Ca, Mg, Na, K, Fe, and Mn were measured using an atomic absorption spectrophotometer (AAS, PE 2830). Alkalinity and acidity were measured by titration. Fluoride was measured using an ion selective electrode. pH and conductivity were measured by pH meter and conductivity meter respectively. Sulphate and nitrate were analysed using spectrophotometer with reagent power pillows. The determination of chloride was performed by argentometric titration. All analyses were carried out in the Geochemical Laboratory at the Geological Science Department, Faculty of Science, Chiang Mai University. In all cases the procedures of the Standard Method for the Examination of Water and Wastewater (APHA, 1992) were followed.
0 1 2 3 km
0 - 0.3
0.3 - 0.5
0.5 - 1.0
1.0 - 1.5
1.5 - 2.0
> 2.0
3
41
2
Geothermal SiteN
FIGURE 1. Map of the studied Doi Hang sub-district, indicating the fluoride
concentrations in mg/L of the drinking water consumed by the school children.
Occurrence of fluorosis due to geothermal sources in a northern Thailand subdistrict 25
Editors: Eli Dahi, Sunsanee Rajchagool & Nipaphan Osiriphan
Data analysis and interpretation. The interpretation of samples that determined by AAS using “ AF. EXE” according to Prewett and Promphutha, 1999 2.
Quality control. The ion balance was checked as a quality control of the data. The difference between the sum of cation equivalents and the sum of anion equivalents was tolerated at a level of maximum 5 %. The formula being as follow is:
� Σ m eqv Anions � Σ m eqv Cations � � 100
Σ m eqv Anions � Σ m eqv Cations � 10 %
RESULTS
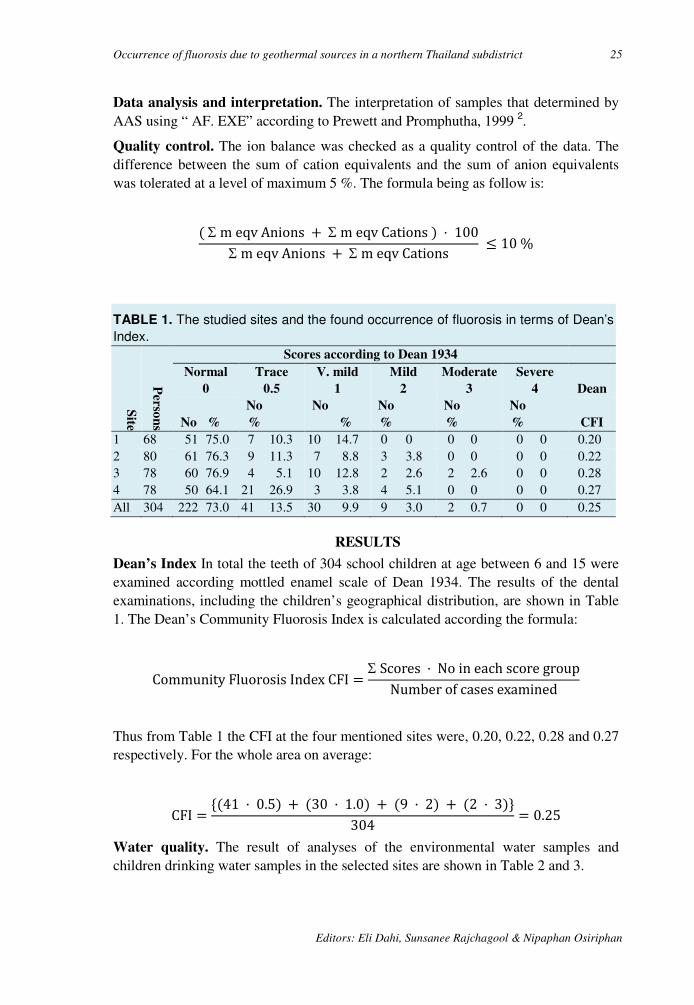
Dean’s Index In total the teeth of 304 school children at age between 6 and 15 were examined according mottled enamel scale of Dean 1934. The results of the dental examinations, including the children’s geographical distribution, are shown in Table 1. The Dean’s Community Fluorosis Index is calculated according the formula:
Community Fluorosis Index CFI �Σ Scores � No in each score group
Number of cases examined
Thus from Table 1 the CFI at the four mentioned sites were, 0.20, 0.22, 0.28 and 0.27 respectively. For the whole area on average:
CFI �'�41 � 0.5� � �30 � 1.0� � �9 � 2� � �2 � 3�.
304� 0.25
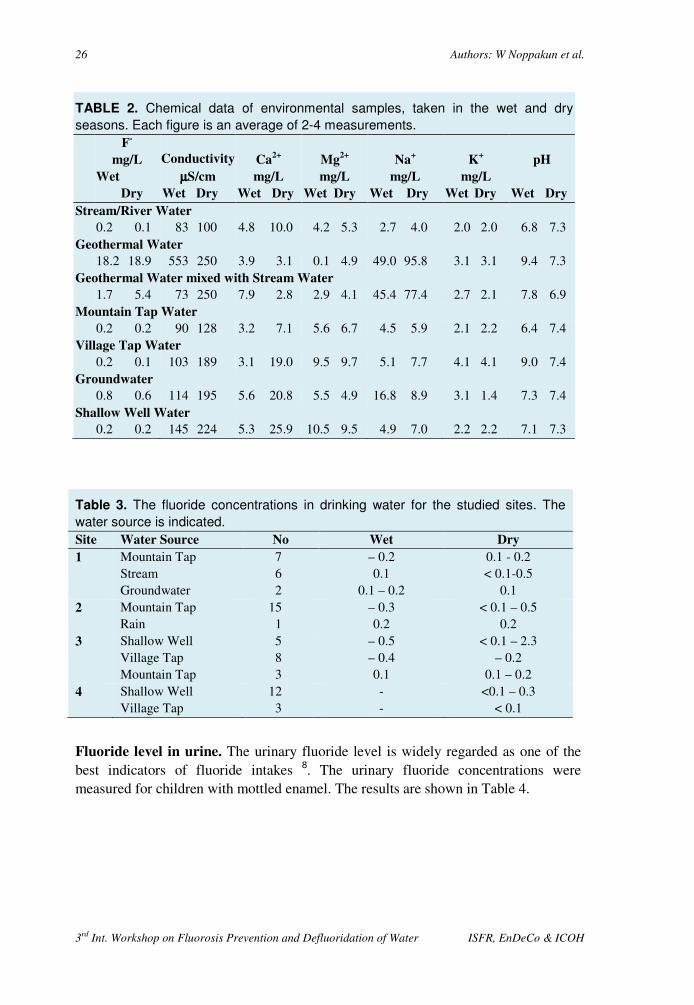
Water quality. The result of analyses of the environmental water samples and children drinking water samples in the selected sites are shown in Table 2 and 3.
TABLE 1. The studied sites and the found occurrence of fluorosis in terms of Dean’s
Index.
Site
Perso
ns
Scores according to Dean 1934
Normal
0
Trace
0.5
V. mild
1
Mild
2
Moderate
3
Severe
4 Dean
No %
No
%
No
%
No
%
No
%
No
% CFI
1 68 51 75.0 7 10.3 10 14.7 0 0 0 0 0 0 0.20 2 80 61 76.3 9 11.3 7 8.8 3 3.8 0 0 0 0 0.22 3 78 60 76.9 4 5.1 10 12.8 2 2.6 2 2.6 0 0 0.28 4 78 50 64.1 21 26.9 3 3.8 4 5.1 0 0 0 0 0.27 All 304 222 73.0 41 13.5 30 9.9 9 3.0 2 0.7 0 0 0.25
26 Authors: W Noppakun et al.
3rd Int. Workshop on Fluorosis Prevention and Defluoridation of Water ISFR, EnDeCo & ICOH
Table 3. The fluoride concentrations in drinking water for the studied sites. The
water source is indicated.
Site Water Source No Wet Dry
1 Mountain Tap Stream Groundwater
7 6 2
– 0.2 0.1
0.1 – 0.2
0.1 - 0.2 < 0.1-0.5
0.1 2 Mountain Tap
Rain 15 1
– 0.3 0.2
< 0.1 – 0.5 0.2
3 Shallow Well Village Tap Mountain Tap
5 8 3
– 0.5 – 0.4 0.1
< 0.1 – 2.3 – 0.2
0.1 – 0.2 4 Shallow Well
Village Tap 12 3
- -
<0.1 – 0.3 < 0.1
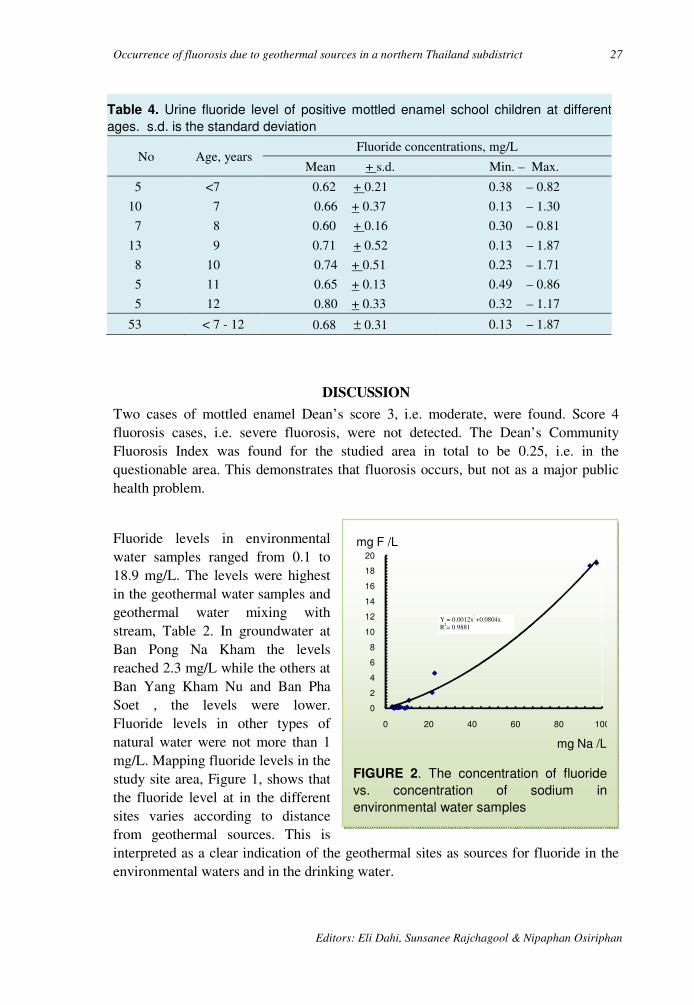
Fluoride level in urine. The urinary fluoride level is widely regarded as one of the best indicators of fluoride intakes 8. The urinary fluoride concentrations were measured for children with mottled enamel. The results are shown in Table 4.
TABLE 2. Chemical data of environmental samples, taken in the wet and dry
seasons. Each figure is an average of 2-4 measurements.
F-
mg/L
Wet
Dry
Conductivity
µµµµS/cm
Wet Dry
Ca2+
mg/L
Wet Dry
Mg2+
mg/L
Wet Dry
Na+
mg/L
Wet Dry
K+
mg/L
Wet Dry
pH
Wet Dry
Stream/River Water
0.2 0.1 83 100 4.8 10.0 4.2 5.3 2.7 4.0 2.0 2.0 6.8 7.3 Geothermal Water
18.2 18.9 553 250 3.9 3.1 0.1 4.9 49.0 95.8 3.1 3.1 9.4 7.3 Geothermal Water mixed with Stream Water
1.7 5.4 73 250 7.9 2.8 2.9 4.1 45.4 77.4 2.7 2.1 7.8 6.9 Mountain Tap Water
0.2 0.2 90 128 3.2 7.1 5.6 6.7 4.5 5.9 2.1 2.2 6.4 7.4 Village Tap Water
0.2 0.1 103 189 3.1 19.0 9.5 9.7 5.1 7.7 4.1 4.1 9.0 7.4 Groundwater
0.8 0.6 114 195 5.6 20.8 5.5 4.9 16.8 8.9 3.1 1.4 7.3 7.4 Shallow Well Water
0.2 0.2 145 224 5.3 25.9 10.5 9.5 4.9 7.0 2.2 2.2 7.1 7.3
Occurrence of fluorosis due to geothermal sources in a northern Thailand subdistrict 27
Editors: Eli Dahi, Sunsanee Rajchagool & Nipaphan Osiriphan
Table 4. Urine fluoride level of positive mottled enamel school children at different
ages. s.d. is the standard deviation
No Age, years Fluoride concentrations, mg/L
Mean + s.d. Min. – Max.
5
10
7
13
8
5
5
<7
7
8
9
10
11
12
0.62 + 0.21
0.66 + 0.37
0.60 + 0.16
0.71 + 0.52
0.74 + 0.51
0.65 + 0.13
0.80 + 0.33
0.38 – 0.82
0.13 – 1.30
0.30 – 0.81
0.13 – 1.87
0.23 – 1.71
0.49 – 0.86
0.32 – 1.17
53 < 7 - 12 0.68 ± 0.31 0.13 – 1.87
DISCUSSION
Two cases of mottled enamel Dean’s score 3, i.e. moderate, were found. Score 4 fluorosis cases, i.e. severe fluorosis, were not detected. The Dean’s Community Fluorosis Index was found for the studied area in total to be 0.25, i.e. in the questionable area. This demonstrates that fluorosis occurs, but not as a major public health problem.
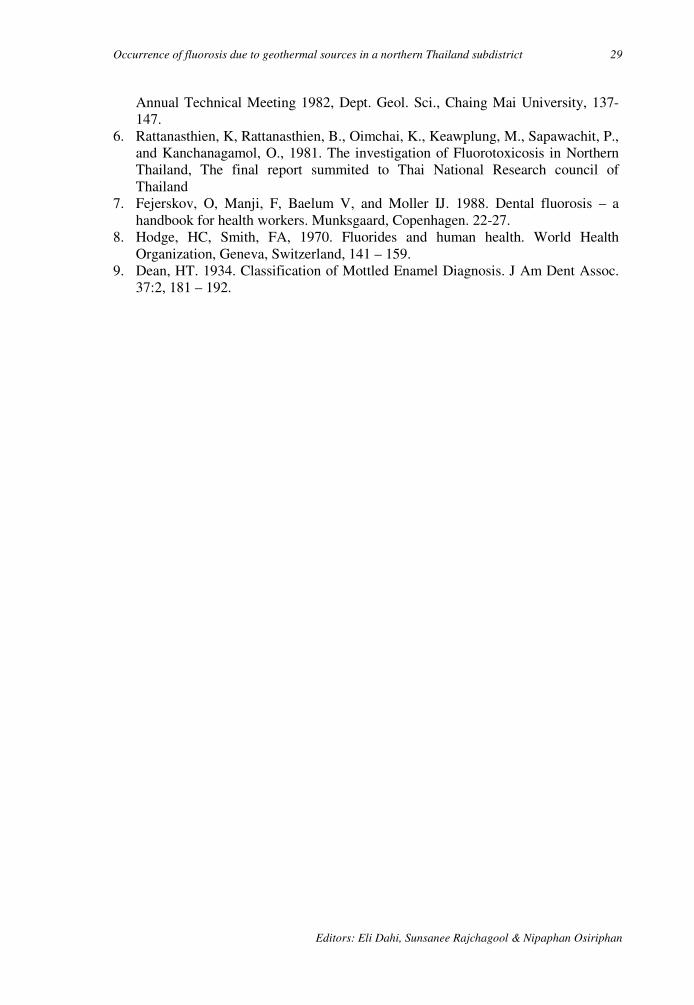
Fluoride levels in environmental water samples ranged from 0.1 to 18.9 mg/L. The levels were highest in the geothermal water samples and geothermal water mixing with stream, Table 2. In groundwater at Ban Pong Na Kham the levels reached 2.3 mg/L while the others at Ban Yang Kham Nu and Ban Pha Soet , the levels were lower. Fluoride levels in other types of natural water were not more than 1 mg/L. Mapping fluoride levels in the study site area, Figure 1, shows that the fluoride level at in the different sites varies according to distance from geothermal sources. This is interpreted as a clear indication of the geothermal sites as sources for fluoride in the environmental waters and in the drinking water.
FIGURE 2. The concentration of fluoride
vs. concentration of sodium in
environmental water samples
0
2
4
6
8
10
12
14
16
18
20
0 20 40 60 80 100
mg F /L
mg Na /L
Y = 0.0012x2+0.0804x R2= 0.9881

28 Authors: W Noppakun et al.
3rd Int. Workshop on Fluorosis Prevention and Defluoridation of Water ISFR, EnDeCo & ICOH
Another indication of the relationship is the fluoride concentration in the environmental samples seems to be related to the salinity in general and sodium concentration in particular, cf. figure 2. Unfortunately the data are too few to allow for derivation of a reliable correlation.
Fluoride levels in drinking water samples ranged from < 0.1 to 2.3 mg/L. The highest fluoride levels was in site 3 (Rong Rian Ban Pong Na Kham) which is in an area of geothermal activity, where two cases of mottled enamel (Dean score 4) were found. This is interpreted as a clear indication of a relation between the geothermal sites and the occurrence of fluorosis.
The mottled enamel pattern found in the study area seems to be closely related to the use of the different water types for drinking. Those, in the area, who used mountain and village tap water for drinking, were less affected by fluorotoxicosis. The investigation of mottled enamel in school children aged 6-15 years old was performed in 4 primary schools.
Hodge et al. (1970) 8 reported that the fluoride concentration in urine varies with the age group, increasing from age 1 to12 years. The fluoride levels in the urine samples of this study ranged from 0.6 to 0.8 mg/L. However, the observed biological variation as compared to the few numbers of tested children does not allow for a similar conclusion.
ACKNOWLEDGEMENTS
For their help and co-operation, the authors would like to thank: Chamnong Kingkeow, James F. Maxwell, the Director and staff of the Chiang Rai Regional Medical Science Center, Research Institute for Health Sciences, the school teachers and volunteers school childrenHang, Geochemical Laboratory, Department of Geology, Faculty of Science, Chiang Mai University and W. G. Prewett.
REFERENCES
1. MacDonald, S. B., Ratanasthein, B., Breen, D., Ramingwong, T., and Sertsrivanit, S., 1977. Hotsprings and geothermal gradients in Northern Thailand, J. Sci, Fac. Chiang Mai University, 4:1-2, 63-67.
2. Prewett, W., and Promphutha. M., 1999. reviewuation of an algorithm for interpreting atomic absorption data. Spectrochimica Acta B, 54, 571-580.
3. Puangpinyo, W., 1995. Situation of Dental Fluorosis in Community of Ban Sankayom Tambon Makuachae Amphoe Muang Changwat Lumphun. Independent study, Graduate School, Chiang Mai University; 23-35.
4. Ramingwong, T., Ratanasthien, B., Wattananikorn, K., Tantisukrit, C., Lerdthusnee, S., Thanasuthipitak, T., Pitragool, S., 1980. Phase I Final Report on geothermal resources of Northern Thailand, San Kamphaeng, Fang and Mae Chan geothermal systems. Unpub. Report submitted to EGAT, 244p.
5. Ratanasthien, B., and Ramingwong, T., 1982. The instrusion of thermal water into domestic groundwater system in the area of San Kamphaeng and Lamphun : Proc.
Occurrence of fluorosis due to geothermal sources in a northern Thailand subdistrict 29
Editors: Eli Dahi, Sunsanee Rajchagool & Nipaphan Osiriphan
Annual Technical Meeting 1982, Dept. Geol. Sci., Chaing Mai University, 137-147.
6. Rattanasthien, K, Rattanasthien, B., Oimchai, K., Keawplung, M., Sapawachit, P., and Kanchanagamol, O., 1981. The investigation of Fluorotoxicosis in Northern Thailand, The final report summited to Thai National Research council of Thailand
7. Fejerskov, O, Manji, F, Baelum V, and Moller IJ. 1988. Dental fluorosis – a handbook for health workers. Munksgaard, Copenhagen. 22-27.
8. Hodge, HC, Smith, FA, 1970. Fluorides and human health. World Health Organization, Geneva, Switzerland, 141 – 159.
9. Dean, HT. 1934. Classification of Mottled Enamel Diagnosis. J Am Dent Assoc. 37:2, 181 – 192.

30 3rd International Workshop on Fluorosis Prevention and Defluoridation of Water
Relation between Clinical and Perceived Dental Fluorosis
among Adolescents in Arusha, Tanzania
K Mashoto*, A N Åstrøm and A Bårdsen Bergen, Norway
SUMMARY: It has been indicated that dental fluorosis constitutes a public health problem
aesthetically as well as functionally in the East African Rift Valley. This study explores the
relationship between clinically observed dental fluorosis and self- assessed oral health
among secondary school children in Arusha town, where the fluoride contents in drinking
water is 3.6 mg/L. A total of 478 students, age 12-20, completed a questionnaire. Clinical
photos of the upper and lower incisors were taken under field conditions. A total of 477
slides were rated under laboratory conditions. Dental fluorosis in the permanent maxillary
central incisors was scored according to the Thylstrup-Fejerskov Index (TFI). The
prevalence of dental fluorosis at TF score ≥≥≥≥ 2 among lifetime residents and not lifetime
residents in Arusha was 83 % and 55 % respectively. An agreement, in terms of Cohen’s
Kappa of 0.44, was obtained between dental fluorosis (TFI ≥≥≥≥ 2) and self-reported
discoloration of the right maxillary central incisor. Binary logistic regression analyses
revealed that, when having dental fluorosis at TFI score ≥≥≥≥ 2, the risk, in terms of Odds
Ratio, of reporting bad oral condition and dissatisfaction with dental appearance was OR =
3.4 95 and OR = 4.8 respectively. In addition, the ORs of reporting oral symptoms of
bleeding gums, bad breath and toothache were 1.5, 1.4 and 1.9 respectively. The results
indicate that having dental fluorosis at TFI score ≥≥≥≥ 2, impacts significantly on oral quality of
life among adolescents resident in an area where dental fluorosis is endemic.
Key words: Dental fluorosis, TFI, Arusha, Tanzania, oral health, community perception, questionnaire method. Odds Ratio, statistical analysis.
INTRODUCTION
East African Rift Valley: It has been reported that dental fluorosis constitutes functionally and aesthetically a public health problem in the East African Rift Valley. Several studies have demonstrated the prevalence and severity of dental fluorosis in different regions of Tanzania 1-3. To date, relatively few studies have investigated the social importance of dental fluorosis. Whereas information about normative needs in populations at risk is available from large-scale epidemiological studies, knowledge of peoples’ demand patterns in terms of how they perceive fluoride related dental
* Centre for International Health, University of Bergen, Norway E-mail: [email protected]

3rd International Workshop on Fluorosis Prevention and Defluoridation of Water 31
problems is still lacking. This is notable since matching interventions with the felt need of the population concerned is a key to intervention success and sustainability4.
Literature background: Traditionally, oral disease has been assessed using purely clinical parameters, such as the Decayed-Missed-Filled-Teeth, DMFT Index, and the Thylstrup-Fejerskov Index, TFI 5. Recently, a development has taken place, from strictly clinical investigations of oral diseases, to an examination of the functional, social and psychological impacts of oral conditions. Interest in oral disease specific outcome measures is reflected in the number of subjective oral health indicators, developed to assess self-perceived oral health such as ability to chew, pain, discomfort, appearance and relationship with others 6. The rationale underlying these indicators is based on the WHO International Classification of Impairments, Disabilities and Handicaps, ICIDH 7. According to the theoretical propositions implicit in this model, there is an ongoing process from disease via impairments to disability.
Subjective oral health indicators have been used successfully with populations comprising a range of socio-economic levels and dental conditions. It is evident, for instance, that oral disease results in substantial levels of loss of work and days of school within the US population 8. More specific impacts such as pain, impaired speech, taste and appearance, are commonly cited in surveys of oral health status and needs for dental care 9-12. Studies of the association between subjective oral health and clinical indicators, such as the number of missing teeth, the number of decayed missed and filled teeth and periodontal attachment loss, commonly show weak, but in many cases significant associations 12. Considering that the relationship between disease and its social and psychological consequences might vary greatly with different oral conditions and according to personal and socio-cultural circumstances, there are reasons for the frequent statement of a relative independence between self-perceived and clinically defined indicators of oral health. At the same time there are arguments for a certain amount of congruence between the two types of measures. The most prevalent situation is that disease causes malfunctions and symptoms of various kinds experienced as compromised well being. Thus, pain and dissatisfaction with dental appearance have been found to be positively associated with higher mean scores of tooth decay and two or more missing teeth, respectively 12.
A number of studies, conducted predominantly in industrialised countries with extensive water fluoridation, have reported on the aesthetic impact of different levels of dental fluorosis. Osuji et al 13 concluded that dental fluorosis at TF index 1 and 2 was not a public health problem of any significance. Accordingly, Ripa 14 argued that an increase in mild forms of dental fluorosis did not constitute and public health problem. Clarkson and O’Mullane 15 in a national study, asked 15 years olds subjects whether they had noticed brown or white marks on the front teeth. They found that the agreement with the clinical observations made by the dentist was rather poor. Nevertheless, results from recent studies using the TF index indicate that scores above 2 may be of aesthetic concern; for review see 16. Hawley et al 16 investigated adolescents’ acceptability with respect to a range of dental fluorosis scores. They and
32 Authors: Mashoto, A N Åstrøm & A Bårdsen
3rd Int. Workshop on Fluorosis Prevention and Defluoridation of Water ISFR, EnDeCo & ICOH
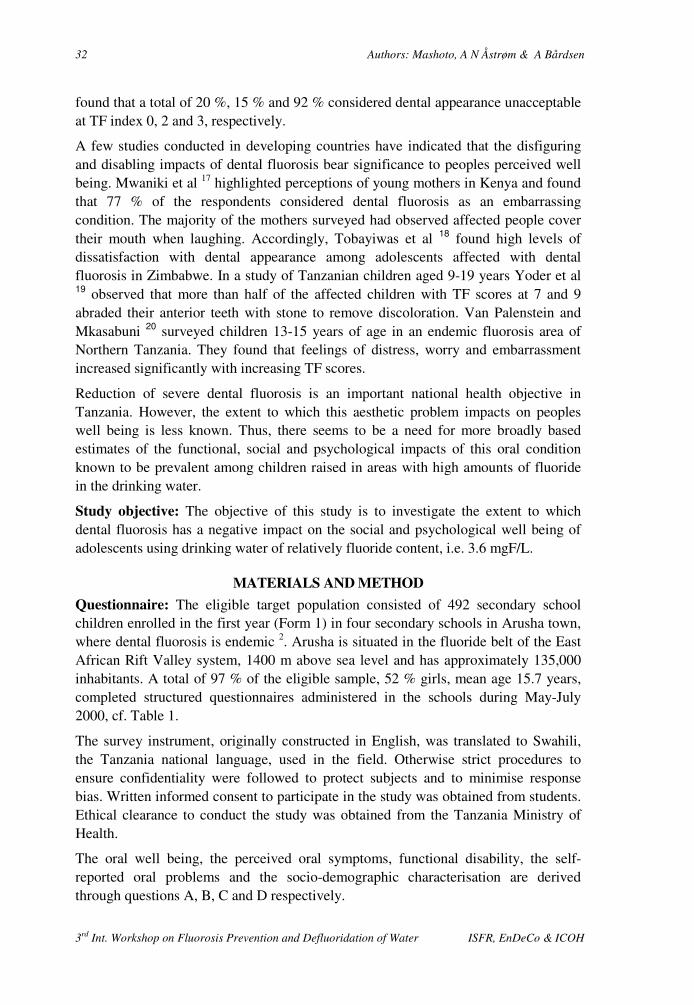
found that a total of 20 %, 15 % and 92 % considered dental appearance unacceptable at TF index 0, 2 and 3, respectively.
A few studies conducted in developing countries have indicated that the disfiguring and disabling impacts of dental fluorosis bear significance to peoples perceived well being. Mwaniki et al 17 highlighted perceptions of young mothers in Kenya and found that 77 % of the respondents considered dental fluorosis as an embarrassing condition. The majority of the mothers surveyed had observed affected people cover their mouth when laughing. Accordingly, Tobayiwas et al 18 found high levels of dissatisfaction with dental appearance among adolescents affected with dental fluorosis in Zimbabwe. In a study of Tanzanian children aged 9-19 years Yoder et al 19 observed that more than half of the affected children with TF scores at 7 and 9 abraded their anterior teeth with stone to remove discoloration. Van Palenstein and Mkasabuni 20 surveyed children 13-15 years of age in an endemic fluorosis area of Northern Tanzania. They found that feelings of distress, worry and embarrassment increased significantly with increasing TF scores.
Reduction of severe dental fluorosis is an important national health objective in Tanzania. However, the extent to which this aesthetic problem impacts on peoples well being is less known. Thus, there seems to be a need for more broadly based estimates of the functional, social and psychological impacts of this oral condition known to be prevalent among children raised in areas with high amounts of fluoride in the drinking water.
Study objective: The objective of this study is to investigate the extent to which dental fluorosis has a negative impact on the social and psychological well being of adolescents using drinking water of relatively fluoride content, i.e. 3.6 mgF/L.
MATERIALS AND METHOD
Questionnaire: The eligible target population consisted of 492 secondary school children enrolled in the first year (Form 1) in four secondary schools in Arusha town, where dental fluorosis is endemic 2. Arusha is situated in the fluoride belt of the East African Rift Valley system, 1400 m above sea level and has approximately 135,000 inhabitants. A total of 97 % of the eligible sample, 52 % girls, mean age 15.7 years, completed structured questionnaires administered in the schools during May-July 2000, cf. Table 1.
The survey instrument, originally constructed in English, was translated to Swahili, the Tanzania national language, used in the field. Otherwise strict procedures to ensure confidentiality were followed to protect subjects and to minimise response bias. Written informed consent to participate in the study was obtained from students. Ethical clearance to conduct the study was obtained from the Tanzania Ministry of Health.
The oral well being, the perceived oral symptoms, functional disability, the self-reported oral problems and the socio-demographic characterisation are derived through questions A, B, C and D respectively.
3rd International Workshop on Fluorosis Prevention and Defluoridation of Water 33
A sum score was constructed from the two dummy variables for use in multiple logistic regression analyses. For questions A1 and A2: Response 1-3 ≈ 1 “symptom confirmed” and Response 4-5 ≈ 0 symptom not confirmed. For question C2: Response 1 & 2 ≈ 0 or “no” and response 2 & 3 ≈ 1 or “yes”.
Clinical examination: Clinical photos of the maxillary central incisors were taken under field conditions, using a dental eye camera and Kodak colour slides, EPN 200. A total of 477 slides and one refusal were rated under laboratory conditions by the primary investigator. The severity of dental fluorosis on the buccal surfaces of the right and left maxillary central incisors was assessed according to the Thylstrup/Fejerskov Index 5.
RESULTS
As shown in Table 2 the mean TF scores were 3.9 with respect to the right and left maxillary central incisors. Also the prevalence of dental fluorosis among the respondents, at TF score ≥ 2 was 74 % for both right and left maxillary incisors. At TFI score ≥ 5 the prevalence was 42 % and 43 % with respect to the right and left maxillary incisor, respectively.
Table 3 depicts adolescents’ mean TF score with respect to the right maxillary central incisor, according to socio-demographic characteristics. The mean TF score was significantly higher among respondents being lifetime residents in Arusha as compared to those who were not (4.5 versus 2.8, p < 0.001).
Table 4 shows the percentage distribution of adolescents’ self-perceived oral impacts according to gender. In general there were minor gender differences across the oral impacts. However, a significant higher proportion of females than males reported that they were dissatisfied with their dental appearance (68 % versus 58 %, p < 0.05). Contrary, males confirmed bad breath more frequently than did females (42 % versus 27 %, p < 0.001). As shown in Table 4, a total of 70 % confirmed that their upper anterior teeth were seriously discoloured and 69 % reported to be dissatisfied with their dental appearance. The proportion of students who confirmed experience with oral impairments (perceived symptoms) varied considerably from 35% (bad breath) to 80 % (stagnation of food particles).
Table 5 shows the percentage distribution of adolescents with dental fluorosis at TF scores ≥ 2 according to self-reported discoloration. The kappa values were in the range 0.15 to 0.44, indicating low to moderate agreement between the two types of measures.
34 Authors: Mashoto, A N Åstrøm & A Bårdsen
3rd Int. Workshop on Fluorosis Prevention and Defluoridation of Water ISFR, EnDeCo & ICOH
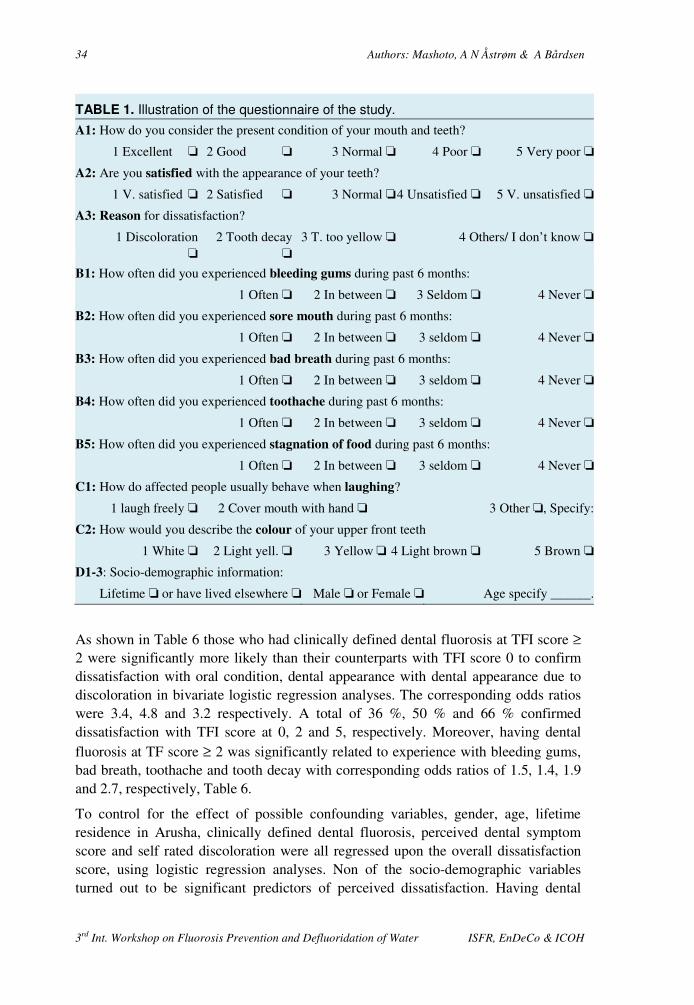
TABLE 1. Illustration of the questionnaire of the study.
A1: How do you consider the present condition of your mouth and teeth?
1 Excellent ‘ 2 Good ‘ 3 Normal ‘ 4 Poor ‘ 5 Very poor ‘
A2: Are you satisfied with the appearance of your teeth?
1 V. satisfied ‘ 2 Satisfied ‘ 3 Normal ‘4 Unsatisfied ‘ 5 V. unsatisfied ‘
A3: Reason for dissatisfaction?
1 Discoloration ‘
2 Tooth decay ‘
3 T. too yellow ‘ 4 Others/ I don’t know ‘
B1: How often did you experienced bleeding gums during past 6 months:
1 Often ‘ 2 In between ‘ 3 Seldom ‘ 4 Never ‘
B2: How often did you experienced sore mouth during past 6 months:
1 Often ‘ 2 In between ‘ 3 seldom ‘ 4 Never ‘
B3: How often did you experienced bad breath during past 6 months:
1 Often ‘ 2 In between ‘ 3 seldom ‘ 4 Never ‘
B4: How often did you experienced toothache during past 6 months:
1 Often ‘ 2 In between ‘ 3 seldom ‘ 4 Never ‘
B5: How often did you experienced stagnation of food during past 6 months:
1 Often ‘ 2 In between ‘ 3 seldom ‘ 4 Never ‘
C1: How do affected people usually behave when laughing?
1 laugh freely ‘ 2 Cover mouth with hand ‘ 3 Other ‘, Specify:
C2: How would you describe the colour of your upper front teeth
1 White ‘ 2 Light yell. ‘ 3 Yellow ‘ 4 Light brown ‘ 5 Brown ‘
D1-3: Socio-demographic information:
Lifetime ‘ or have lived elsewhere ‘ Male ‘ or Female ‘ Age specify ______.
As shown in Table 6 those who had clinically defined dental fluorosis at TFI score ≥ 2 were significantly more likely than their counterparts with TFI score 0 to confirm dissatisfaction with oral condition, dental appearance with dental appearance due to discoloration in bivariate logistic regression analyses. The corresponding odds ratios were 3.4, 4.8 and 3.2 respectively. A total of 36 %, 50 % and 66 % confirmed dissatisfaction with TFI score at 0, 2 and 5, respectively. Moreover, having dental fluorosis at TF score ≥ 2 was significantly related to experience with bleeding gums, bad breath, toothache and tooth decay with corresponding odds ratios of 1.5, 1.4, 1.9 and 2.7, respectively, Table 6.
To control for the effect of possible confounding variables, gender, age, lifetime residence in Arusha, clinically defined dental fluorosis, perceived dental symptom score and self rated discoloration were all regressed upon the overall dissatisfaction score, using logistic regression analyses. Non of the socio-demographic variables turned out to be significant predictors of perceived dissatisfaction. Having dental

3rd International Workshop on Fluorosis Prevention and Defluoridation of Water 35
fluorosis at score ≥ 2 confirming discoloration of upper anterior teeth and perceiving at least one oral symptom were significantly related to self-perceived dissatisfaction. Self-reported discoloration was by far the strongest predictor of dissatisfaction with oral health (OR = 4.6) followed in descending order by perceived oral symptoms (OR = 2.8) and clinically defined dental fluorosis at TF score ≥ 2 (OR = 1.8). The regression model explained 26 % of the variance in overall dissatisfaction score.
TABLE 2. The distribution of adolescents according to TF score on upper right and left
permanent incisors.
TF scores Maxillary right central incisor
No %
Maxillary left central Incisor
No %
0
2
3
4
5
6
7
8
9
119
6
20
116
77
20
50
30
22
25.9
1.3
4.3
25.2
16.7
4.3
10.9
6.5
4.8
119
7
19
118
67
30
46
32
22
25.9
1.5
4.1
25.7
14.6
6.5
10.0
7.0
4.8
TF scores Mean Standard deviation Mean Standard deviation
0 -9 3.9 2.7 3.9 2.8
TABLE 3. Socioeconomic grouping of tested human subjects in and the observed
dental fluorosis expressed as mean TFI score on right maxillary central incisor.
Socioeconomic grouping criteria Mean Standard deviation
Grown up in rural area
Grown up in urban area
Lifetime resident in Arusha
Not lifetime resident in Arusha
12-14 years of age
15-20 years of age
Males
Females
Main source of drinking: water tap
Main source of drinking: rain water, river water, others
3.9
4.0
4.5
2.8
4.2
3.8
3.8
4.0
4.1
3.8
2.7
2.8
2.6
2.9
2.7
2.8
2.8
2.7
2.7
3.0

36 Authors: Mashoto, A N Åstrøm & A Bårdsen
3rd Int. Workshop on Fluorosis Prevention and Defluoridation of Water ISFR, EnDeCo & ICOH
TABLE 4. Distribution of adolescents’ subjectively defined oral health indicators
according to gender.
Indicator No
Male
225
Female
245
Total
450
Self-reported oral problems % % %
Upper front teeth yellow to brown
Upper front teeth discoloured
Upper front teeth seriously discoloured
67
58
70
70
65
70
69
62
70
Perceived oral well being
Poor oral condition
Dissatisfied with dental appearance
Dissatisfied due to discoloration
47
58
66
47
68
71
47
63
69
Perceived oral symptoms
Bleeding gums
Bad breath
Toothache
Sore mouth
Stagnation of food particles
42
42
60
38
78
36
27
60
36
82
40
35
61
37
80
Hindered smiling 56 66 61
TABLE 5. Dental fluorosis at score on maxillary right incisor of adolescents and
corresponding self-reports on tooth discoloration.
Self-report: Upper front teeth yellow to brown?
Yes No
Clinical examination No % No %
Dental fluorosis (TF score > 2) 274 87 62 44 No dental fluorosis (TF score = 0) 41 13 76 55 Statistical analysis: Crude agreement CA: 77%. Chi square: p < 0.001. Kappa: 0.44.
Self-report: Upper front teeth seriously discoloured?
Yes No
Clinical examination: No % No %
Dental fluorosis (TF score > 2) 197 88 69 575 No dental fluorosis (TF score = 0) 27 12 23 25 Statistical analysis: Crude agreement CA: 0.69. Chi square: p < 0.05. Kappa: 0.15

3rd International Workshop on Fluorosis Prevention and Defluoridation of Water 37
TABLE 6. Oral well being among adolescents in terms of dissatisfaction with given
parameters as compared to clinical examination; TFI > 2 versus TFI = 0.
From the bivariant logistic analysis:
R is regression coefficient, OD is odds ratio and CI is 95% confident interval
Perception r OR 95 % CI
Poor oral condition 1.23 3.4 2.1 – 5.4
Dissatisfied with appearance 1.56 4.8 3.1 – 7.4
Dissatisfied with appearance 1.2 3.2 1.8 – 5.8
Bleeding gums 0.42 1.5 1.0 – 2.4
Bad breath 0.35 1.4 0.9 – 2.2
Toothache 0.66 1.9 1.3 – 2.9
Tooth decay 0.96 2.7 1.6 – 4.3
TABLE 7. Overall dissatisfaction with oral health as compared to indicated
parameters. From the bivariant logistic analysis:
OD is odds ratio and CI is 95 % confident interval.
Nagelkerkes R squared: 0.26 (26%).
OR 95 % CI
Male versus female 0.8 0.5 – 1.3
Lifetime resident in Arusha versus not 1.5 1.1 – 2.5
15 – 20 years old versus 12 – 14 years 1.1 0.6 – 1.9
TFI score > 2 versus TF score = 0 1.8 1.1 – 3.0
Perceived discoloration versus no discoloration 4.6 2.7 – 7.9
At least one symptom versus no symptoms 2.8 1.1 – 7.1
DISCUSSION
The present results indicate a weak to moderate correspondence between self-reported and clinically assessed dental fluorosis. Thus, the agreement between self-reported discoloration of upper anterior teeth and clinically defined dental fluorosis at TF scores ≥ 2, as measured in terms of Cohen’s kappa, ranged from 0.15 to 0.44. This observation accords with previous studies of adolescents conducted in industrialised countries (15). Stephen et al (21) reported in a Scottish study that lay people were more concerned with dental fluorosis than were the dentists. We consider the deviation from good or perfect correspondence to be due to possible misunderstanding of the questionnaire. An alternative and obvious explanation to the
38 Authors: Mashoto, A N Åstrøm & A Bårdsen
3rd Int. Workshop on Fluorosis Prevention and Defluoridation of Water ISFR, EnDeCo & ICOH
observed disagreement is that much of the disease detected upon clinical examination was less serious and thus likely to be unknown by the individuals concerned.
The present results showed significant but only moderately strong bivariate associations between adolescents’ clinically defined dental fluorosis status and perceived impacts of oral problems in terms of symptoms and satisfaction with oral condition and dental appearance. In other words, students having dental fluorosis at TF scores ≥ 2 were significantly more likely to confirm dissatisfaction with their oral condition, dissatisfaction with their dental appearance, bleeding gums, bad breath and toothache, than were their counterparts having no dental fluorosis (TF score at 0). A total of 36 % 50 % and 66 % confirmed dissatisfaction at TFI scores 0, 2 and 5, respectively. Similar results have been reported previously in studies of Tanzanian children and adolescents, Yoder et al (19) found that children and adolescents affected with dental fluorosis at TF score 7 and 9 abraded their teeth with a stone to remove disturbing discoloration. Moreover, Van Palenstein (20) in a study of children resident in Kibosho, Northern Tanzania provided evidence that the worse the clinically defined oral health status in terms of increasing TF scores, the worse the subjective oral health indicators in terms of feelings of distress, worry and embarrassment.
Even when potential confounding effects were controlled in multivariate analysis, the clinically defined indicator turned out to be the weakest significant predictor of the overall dissatisfaction score. The explanatory power of the regression model increased markedly when self-reported discoloration and the perceived symptom score were included. Self-reported discoloration and perceived impacts were the most consistent predictors of dissatisfaction with oral condition. This seems to imply that those adolescents who are aware the disturbing impairments of dental fluorosis are those most likely to be dissatisfied. This evidence accords with those of most previous investigations focusing on satisfaction with oral health status and other subjectively defined oral health indicators in that clinical measures of disease are often weak predictors of self-perceived oral health status.
The results of the multivariate analysis also tend to support the theoretical proposition implicit in the International Classification of Impairments, Disabilities and Handicaps, ICIDH 7, proposed by WHO and amended for dentistry by Locker 22. According to this model, it has been argued, there is a good reason for the weak relationship commonly observed between clinically and subjectively defined oral health indicators. Following the ICIDH model, disease and its socio-psychological impacts represent dimensions of human experience that conceptually and often empirically distinct. Moreover, functional and socioeconomic issues mediate the link between clinical conditions and their social and psychological consequences so that not all people whose lives are compromised by oral disorders are necessarily dissatisfied. A possible explanation for the stronger relationship observed between dissatisfaction score and other subjective oral health indicators is the fact that both measures were questionnaire based and thus might share common method variance.
3rd International Workshop on Fluorosis Prevention and Defluoridation of Water 39
This means that the measurement method itself might have given rise to spurious associations 23.
A total of 74 % of the adolescent population investigated was affected with dental fluorosis at TF score ≥ 2, whereas 42 % had severe dental fluorosis at TF score ≥ 5. In a previous study of Arusha children, Awadia et al (1992) 4 found that the prevalence of dental fluorosis at TFI score ≥ 1 and TF scores ≥ 5 was respectively, 67 % and 21 % among vegetarians and 95 % and 35 % among non-vegetarians. Considering that the adolescents investigated were members of a community with endemic fluorosis, an unexpectedly high proportion confirmed compromised psychological well-being in some way. Although the majority of adolescents were satisfied with their oral condition, a total of 63 %, and girls more frequently than boys confirmed dissatisfaction with their dental appearance, Of those who confirmed dissatisfaction with dental appearance, 74 % said it was because of discoloration. Moreover a total of 80 %, 61% and 61% reported problems with food impact, toothache and hindered smiling. Thus, the present findings indicate that the quality of life of a substantial proportion of these young people is compromised in some way by their oral condition. It should be noted that adolescents enrolled in secondary school comprise a selected group of highly educated in Tanzania. Since it is almost always the case that there is an inverse relationship between education and oral health, the prevalence of subjectively reported oral health problems found in this survey might be an underestimate. Although there were on significant gender difference with respect to TF score, females scored more highly on some subjectively defined indicators, males more highly on others and on many measures there was no gender difference. Concepts of health, expectations and attitudes concerning health and body awareness might differ according to gender and lead to differences in the subjective awareness and reporting of oral health status 24.
CONCLUSION
The present results indicate that dental fluorosis is perceived as an oral health problem by secondary school children in Arusha. Having dental fluorosis at TF scores ≥ 2 seem to impact differently on people’s well-being. This seems to imply that both clinically and subjectively defined indicators of oral health should be assessed whenever dental care needs are considered. To what extent adolescents who are discontent with their dental condition want and actually seek dental treatment is an important issue for future research. Further studies based on qualitative research is also needed to improve our understanding of why some adolescents are satisfied with their oral condition despite having a diagnosis of dental fluorosis at TF ≥ 2.
40 Authors: Mashoto, A N Åstrøm & A Bårdsen
3rd Int. Workshop on Fluorosis Prevention and Defluoridation of Water ISFR, EnDeCo & ICOH
REFERENCES
1. Mosha HJ. Endemic dental fluorosis and the possibilities of de-fluoridation and fluoridation of water supplies in Tanzania. Odonto Stomatol Trop 1984; 7:89-96.
2. Kisanga P,Lyamuya V. The prevalence of dental and skeletal fluorosis and the role of diet and nutritional status in determining its development: The case of Kitefu village, Maji ya chai-Arusha, Tanzania, Tanzanian Food and Nutrition Center Report no. 1072,1987.
3. Awadia A.K. Haugejorden O, Bjorvath K & Birkeland JM. Vegetarianism and dental fluorosis among children in a high fluoride area of northern Tanzania, International fluoridation. J Dent Res 1992; 9:3-11.
4. Bawden JW. Changing patterns of fluoride intake. Workshop report Group l. Water fluoridation. J Dent Res 1992; 71:1218-20.
5. Thylstrup A. Fejerskov. Clinical appearance of dental fluorosis in permanent teeth in relation to histological changes. Community Dent Oral Epidemiol 1978;6:315-328.
6. Weintraub JA. Uses of oral health related quality of life measures in public health. Community Dent Health 1998;15:8-12.
7. Locker D. Measuring oral health: A conceptual framework, Community Dent health 1088; 5:3-18.
8. Gift HC, Reisine ST, Larach DC., The social impacts of dental problems and visits. Am J Public Health 1992; 82:1663-1668.
9. Locker D, Grushka M. Prevalence of oral and facial pain and discomfort: preliminary results of a mail survey. Community dent Oral Epidemiol 1987; 15; 169-172.
10. Adulyanon S, Vourapukjaru J Sheiham A. Oral impacts affecting daily performance in a low dental disease Thai population. Community Dent Oral Epidermiol 1996; 24:385-389.
11. Locker D, Miller J.Evaluation of subjective oral health indicators. Public Health Dent 1994;54:167-176.
12. Leao A, Sheiham A. Relation between clinical dental status and subjective impacts on daily living. J Dent Res 1995; 74:1408-1413.
13. Osuji OO, Leake JL, Chipman ML, Nikifouruk G, Locker D. Levin N. Risk factors for dental fluorosis in a fluoridated community. J Dent Res 1988; 67:1488-1492.
14. Ripa LW. A critique of topical fluoride methods in an area of decreased and increased dental fluorosis prevalence, J Public Health Dent 1991; 51:23-40.
15. Clarkson JJ, O’Mullane DM. Prevalence of enamel defects/fluorosis in fluoridated and non-fluoridated areas in Ireland. Community Dent Oral Epidemiol 1992; 20:196-199.
16. Hawley GM, Ellwood RP, Davies RM. Dental caries, fluorosis and the cosmetic implications of different TF scores in 14 – year-old adolescents. Community Dent Health 1996; 13:189-192.
17. Mwaniki DL, Coutney JM, Gaylor JD. An analysis of needs and possibilities based on case studies in Kenya. Soc Sci Med 1994; 39:807-813.
3rd International Workshop on Fluorosis Prevention and Defluoridation of Water 41
18. Tobayiwa C, Musiyambili M, Chironga L, Mazorodze O, Saphala S. Fluoride levels and dental fluorosis in two districts in Zimbabwe, Cent Afr Med 1991;37:253-361.
19. Yoder KM, mabelya L, Robinson VA, Dunipace AJ, Brizendine EJ, Stookey GK. Severe dental fluorosis in a Tanzanian population consuming water with negligible fluoride concentration. Community dent oral Epidemiol 1998; 26:382-392.
20. van Palenstein Helderman WH, Mkasabuni E. Impact of dental fluorosis on the perception of well-being in an endemic fluorosis area in Tanzania. Community Dent Oral Epidermiol 1993; 21:243-244.
21. Stephen KW, Mc Call DR, Gilmour WH. Incisor enamel mottling prevalence in child cohorts which had or had not taken fluoride supplements from 0-12 years of age. Proc Finn dent Soc 1991;87:595-605.
22. Jokovic A, Locker D. Dissatisfaction with oral health status in an older population, J Public health dent 1997; 57:40-47.
23. Spector P. Method variance as an artifact in self-reported affect and perceptions at work: myth or significant problem? J Appl Psychol 1987;72:438-443.
24. Bowling A. measuring health: a review of quality of life measurement scales. Milton Keynes: Open University press, 19

42
3rd Int. Workshop on Fluorosis Prevention and Defluoridation of Water ISFR, EnDeCo & ICOH

43
Editors: Eli Dahi, Sunsanee Rajchagool & Nipaphan Osiriphan
Session 2
Methods and Occurrence

44
3rd Int. Workshop on Fluorosis Prevention and Defluoridation of Water ISFR, EnDeCo & ICOH
3rd International Workshop on Fluorosis Prevention and Defluoridation of Water 45
Correlation of Fluoride and Iron Concentrations in Rift
Valley Aquifer of Jimma, Ethiopia
S. Tsewa Meskel*
Ethiopia
SUMMARY: Three test wells were drilled in Jimma town as part of water source
identification for the town water supply project. Water quality parameters and the
lithologic profiles were determined for depth specific samples taken during drilling.
Furthermore, depth integrated samples at subsequent pumping test operations were
analysed in details.
The Examination of the integrated samples indicates a reciprocal relationship between the
contents of iron and contents of fluoride. From the wells lithology it appears that the
fluoride to iron concentration ratio in the attached water is significantly lower in the clay
based depths; 0.6 towards 1.4 in non-clay based depths.
Ion balance considerations on the integrated depth samples show that the groundwater is
sodium-bicarbonate water type, as typically found in the Rift Valley basin.
Key words: Fluoride, iron, correlation, Rift Valley, Ethiopia, drilling logs, lithology.
INTRODUCTION
Fluorine accounts for about 0.3 g/kg of earth crust 7. According to Arnold et al 1 fluoride concentration of approximately 1.0 mg/L in drinking water reduces dental caries without harmful effects on health. However, excessive fluoride in groundwater is the most serious water quality problem in Ethiopia and many people are being affected by both dental and skeletal fluorosis 6. Therefore, water supply development projects in Ethiopia usually include close examinations and verifications of fluoride contents of the available water source potentials.
Iron is one of the most abundant metals in the earth crust. It is an essential element in human nutrition 5. Some ground waters may contain considerable concentrations of iron. Because groundwater is often anoxic, any soluble iron in ground water is usually in ferrous state Fe2+ and its concentration is controlled by the carbonate concentration. A bittersweet astringent taste is detectable by some persons at levels above 1 mg/L 1.
Because of the frequent need for iron removal and aesthetic and technical water quality, the determination of iron concentration in drinking water is very important.
With the increased demand for drinking water and with the intensification of water utilisation for different purposes, the quality problems become the limiting factor in the development of water resources. During water resources identification for Jimma
* Faculty of Medicine, Addis Ababa University, Ethiopia
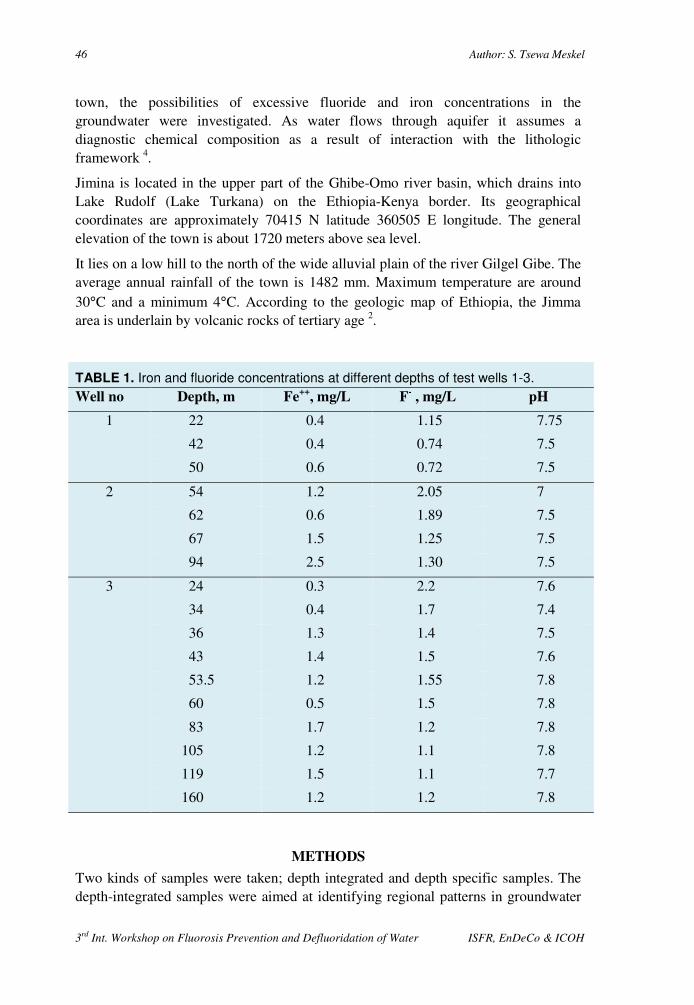
46 Author: S. Tsewa Meskel
3rd Int. Workshop on Fluorosis Prevention and Defluoridation of Water ISFR, EnDeCo & ICOH
town, the possibilities of excessive fluoride and iron concentrations in the groundwater were investigated. As water flows through aquifer it assumes a diagnostic chemical composition as a result of interaction with the lithologic framework 4.
Jimina is located in the upper part of the Ghibe-Omo river basin, which drains into Lake Rudolf (Lake Turkana) on the Ethiopia-Kenya border. Its geographical coordinates are approximately 70415 N latitude 360505 E longitude. The general elevation of the town is about 1720 meters above sea level.
It lies on a low hill to the north of the wide alluvial plain of the river Gilgel Gibe. The average annual rainfall of the town is 1482 mm. Maximum temperature are around 30°C and a minimum 4°C. According to the geologic map of Ethiopia, the Jimma area is underlain by volcanic rocks of tertiary age 2.
TABLE 1. Iron and fluoride concentrations at different depths of test wells 1-3.
Well no Depth, m Fe++
, mg/L F- , mg/L pH
1 22 0.4 1.15 7.75
42 0.4 0.74 7.5
50 0.6 0.72 7.5
2 54 1.2 2.05 7
62 0.6 1.89 7.5
67 1.5 1.25 7.5
94 2.5 1.30 7.5
3 24 0.3 2.2 7.6
34 0.4 1.7 7.4
36 1.3 1.4 7.5
43 1.4 1.5 7.6
53.5 1.2 1.55 7.8
60 0.5 1.5 7.8
83 1.7 1.2 7.8
105 1.2 1.1 7.8
119 1.5 1.1 7.7
160 1.2 1.2 7.8
METHODS
Two kinds of samples were taken; depth integrated and depth specific samples. The depth-integrated samples were aimed at identifying regional patterns in groundwater
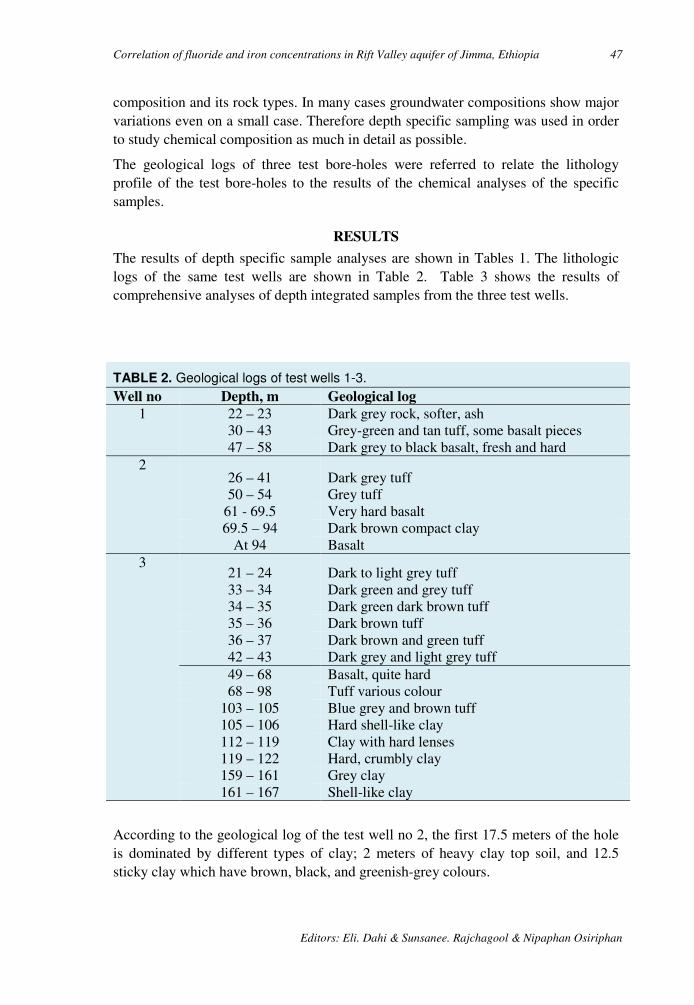
Correlation of fluoride and iron concentrations in Rift Valley aquifer of Jimma, Ethiopia 47
Editors: Eli. Dahi & Sunsanee. Rajchagool & Nipaphan Osiriphan
composition and its rock types. In many cases groundwater compositions show major variations even on a small case. Therefore depth specific sampling was used in order to study chemical composition as much in detail as possible.
The geological logs of three test bore-holes were referred to relate the lithology profile of the test bore-holes to the results of the chemical analyses of the specific samples.
RESULTS
The results of depth specific sample analyses are shown in Tables 1. The lithologic logs of the same test wells are shown in Table 2. Table 3 shows the results of comprehensive analyses of depth integrated samples from the three test wells.
TABLE 2. Geological logs of test wells 1-3.
Well no Depth, m Geological log
1 22 – 23 Dark grey rock, softer, ash 30 – 43 Grey-green and tan tuff, some basalt pieces 47 – 58 Dark grey to black basalt, fresh and hard
2 26 – 41 Dark grey tuff 50 – 54 Grey tuff
61 - 69.5 Very hard basalt 69.5 – 94 Dark brown compact clay
At 94 Basalt 3
21 – 24 Dark to light grey tuff 33 – 34 Dark green and grey tuff 34 – 35 Dark green dark brown tuff 35 – 36 Dark brown tuff 36 – 37 Dark brown and green tuff 42 – 43 Dark grey and light grey tuff 49 – 68 Basalt, quite hard 68 – 98 Tuff various colour
103 – 105 Blue grey and brown tuff 105 – 106 Hard shell-like clay 112 – 119 Clay with hard lenses 119 – 122 Hard, crumbly clay 159 – 161 Grey clay 161 – 167 Shell-like clay
According to the geological log of the test well no 2, the first 17.5 meters of the hole is dominated by different types of clay; 2 meters of heavy clay top soil, and 12.5 sticky clay which have brown, black, and greenish-grey colours.
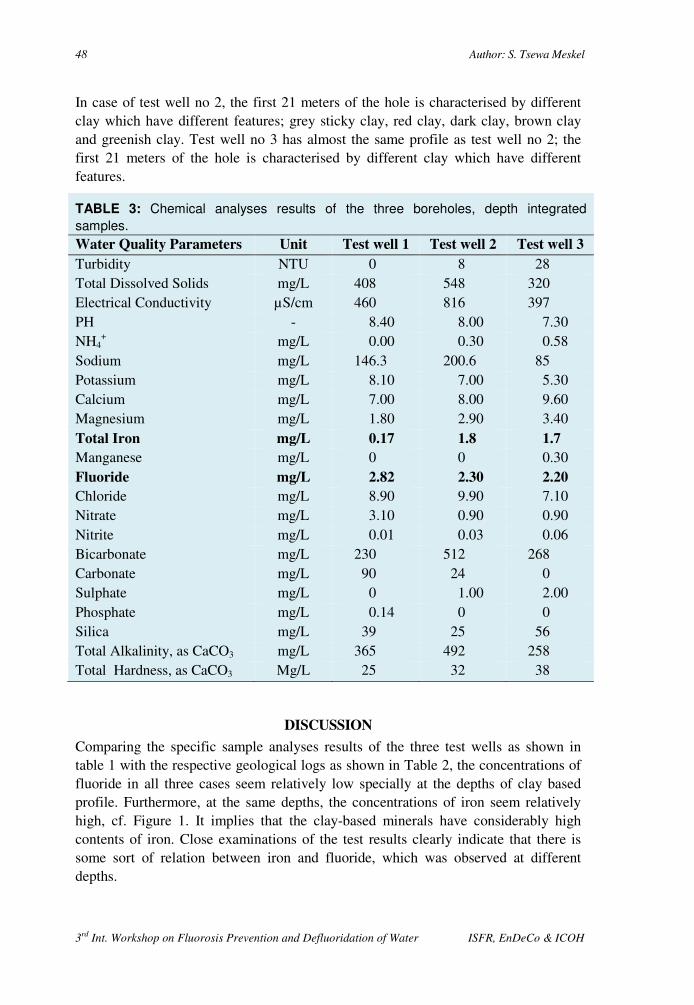
48 Author: S. Tsewa Meskel
3rd Int. Workshop on Fluorosis Prevention and Defluoridation of Water ISFR, EnDeCo & ICOH
In case of test well no 2, the first 21 meters of the hole is characterised by different clay which have different features; grey sticky clay, red clay, dark clay, brown clay and greenish clay. Test well no 3 has almost the same profile as test well no 2; the first 21 meters of the hole is characterised by different clay which have different features.
TABLE 3: Chemical analyses results of the three boreholes, depth integrated
samples. Water Quality Parameters Unit Test well 1 Test well 2 Test well 3
Turbidity NTU 0 8 28 Total Dissolved Solids mg/L 408 548 320 Electrical Conductivity µS/cm 460 816 397 PH - 8.40 8.00 7.30 NH4
+ mg/L 0.00 0.30 0.58 Sodium mg/L 146.3 200.6 85 Potassium mg/L 8.10 7.00 5.30 Calcium mg/L 7.00 8.00 9.60 Magnesium mg/L 1.80 2.90 3.40 Total Iron mg/L 0.17 1.8 1.7
Manganese mg/L 0 0 0.30 Fluoride mg/L 2.82 2.30 2.20
Chloride mg/L 8.90 9.90 7.10 Nitrate mg/L 3.10 0.90 0.90 Nitrite mg/L 0.01 0.03 0.06 Bicarbonate mg/L 230 512 268 Carbonate mg/L 90 24 0 Sulphate mg/L 0 1.00 2.00 Phosphate mg/L 0.14 0 0 Silica mg/L 39 25 56 Total Alkalinity, as CaCO3 mg/L 365 492 258 Total Hardness, as CaCO3 Mg/L 25 32 38
DISCUSSION
Comparing the specific sample analyses results of the three test wells as shown in table 1 with the respective geological logs as shown in Table 2, the concentrations of fluoride in all three cases seem relatively low specially at the depths of clay based profile. Furthermore, at the same depths, the concentrations of iron seem relatively high, cf. Figure 1. It implies that the clay-based minerals have considerably high contents of iron. Close examinations of the test results clearly indicate that there is some sort of relation between iron and fluoride, which was observed at different depths.

Correlation of fluoride and iron concentrations in Rift Valley aquifer of Jimma, Ethiopia 49
Editors: Eli. Dahi & Sunsanee. Rajchagool & Nipaphan Osiriphan
´
FIGURE 2. Conc. of Fe2+
and F- in the
integrated samples of the three test
wells. Trendline and equation
indicated.
y = -0.356x + 2.876R² = 0.958
2
2.1
2.2
2.3
2.4
2.5
2.6
2.7
2.8
2.9
0 0.5 1 1.5 2
mg F-/L
mg Fe++ /L
FIGURE 1 Average Fe2+ and F-
concentrations in mg/L in the depth
specific logs without and with clay.
Non-clay Clay
Fe++ 0.96 1.90
F- 1.36 1.22
0.00
0.20
0.40
0.60
0.80
1.00
1.20
1.40
1.60
1.80
2.00
mg
/L
Fe++
F-
As can be seen from the chemical analyses results of integrated sample of the three test bore-holes, Table 3, the concentrations of iron and fluoride have shown some sort of relationships; when the concentration of iron is relatively low, the relative concentration of fluoride is low. On the other hand, when the concentration iron is relatively high, the concentration of fluoride is relatively low. Figure 2 shows that the fluoride to iron concentration ratio in the attached water is significantly lower in the clay based depths; 0.6 towards 1.4 in the non-clay based depths. This phenomenon is probably due to adsorption of fluoride on iron rich minerals. The aquifers, i.e. the water bearing strata of the three test wells are of are in the same regime.
The results of the chemical analyses given in Table 3 show the major cations and anions contents in the integrated samples. It is seen from the data that the groundwater of this specific aquifer is exclusively categorised as sodium-bicarbonate type water. The data illustrate that the rock composition of the well field is almost uniform.
CONCLUSION
The examination of the groundwater quality of Jirnma area indicates a relationship between the contents of iron and fluoride in this specific aquifer. A correlation is established tentatively, subject to confirmation upon further testing. From the study of the lithology of the test well, it appears that iron rich clay based minerals are attached to lower fluoride concentrations in the groundwater. Ion balance considerations on the integrated depth samples show that the groundwater is sodium-bicarbonate water type, as typically found in the Ethiopian Rift Valley basin.
ACKNOWLEDGMENTS
50 Author: S. Tsewa Meskel
3rd Int. Workshop on Fluorosis Prevention and Defluoridation of Water ISFR, EnDeCo & ICOH
The author would like to thank all members of “Fluoride in food and water project” for their suggestions and inputs on this preliminary investigation. Special thanks to Kjell Bjorvatn, Redda Tekle-Haimanot and Zenebe Melaku for valuable suggestions.
REFERENCE
1. Arnold E.G et al (eds.). 1992. Standard Methods for the examination of water and wastewater, 18th edition. American Public Health, Association, American Water Works Association and Water Environment Federation.
2. Chernet T. 1986. Hydrogeology of Ethiopia. Report of Ethiopian Institute for Geological Survey (EIGS).
3. Dominico P.A. and Franklin W.S. 1990. Physical and Chemical Hydrogeology. John Willey & sons.
4. Fefter C.W. 1992. Applied Hydrogeology, third edition. Prentice Hall, Eaglewood Cliffs, NJ 07632.
5. Lenore S.C et al (eds.). 1998. Standard Methods for the examination of water and wastewater, 20th edition. American Public Health, Association, American Water Works Association and Water Environment Federation.
6. Tsewameskel S. 1999. Excessive Fluoride Removal from Groundwater of Ethiopian Rift Valley. Individual study, International Institute for Infrastructural, Hydraulic and Environmental Engineering. Delft, the Netherlands.
7. World Health Organization. 1993. Guidelines for drinking water quality second edition, volume 1, recommendations. WHO, Geneva.
.

3rd International Workshop on Fluorosis Prevention and Defluoridation of Water 51
Experiences on Combating Fluorosis Cases in India
A.K. Susheela* and M Bhatnagar India
Summary: India is one among the 23 nations around the globe where health problems occur
due to excess ingestion of fluoride. Fluorosis being an untreatable disease, prevention is the
solution to mitigate the disease. Two major interventions i.e. safe water and nutritional
supplementation are practised for combating the health problems arising due to fluoride
poisoning.
Present study has been designed to assess the impact of interventions on fluorosis patients.
The essential tests were conducted for diagnosing the disease and confirmed cases of
fluorosis were selected for the interventions. The source of fluoride of the patient was
withdrawn, provided with safe water and were counselled for nutritional supplementation.
After introducing interventions, the patients were monitored up to 12 months.
Complete recovery / improvement in the health status with decline in fluoride levels in body
fluids and no recurrence was observed. The procedure of monitoring of the interventions is
dealt with.
Key Words: Fluorosis, intervention, impact assessment, control, mitigation, India, fluoride, blood, serum, urine.
INTRODUCTION:
Fluoride contamination of drinking water, fluorosis and associated health problems arising as a result are on the increase in India and 23 other countries around the globe. Excess ingestion of fluoride is the basic cause for fluorosis. An estimated 67 million people in India, which includes 6 million children in 17 out of the 35 states, and Union Territories are affected with a variety of health problems due to fluoride poisoning in the form of dental, skeletal and non-skeletal fluorosis.
It is known that deficiencies in protein, vitamin C, calcium and poor nutrition in general aggravate fluoride toxicity 1, 2, 3. Data obtained from dietary surveys, suggest that inadequate ascorbic acid and calcium are related to severity of fluorosis 4. Earlier studies reported that toxic effects of fluoride are reversible and could be effectively reversed by withdrawal of the fluoride source and subsequent supplementation of calcium, vitamin C, E and D 5, 6, 7. The extent of reversal observed was more pronounced and highly beneficial by combined supplementation of calcium and vitamin C on the recovery of the fluoride induced alterations on structure and
* Fluoride Research & Rural Development Foundation, Delhi, India E-mail: [email protected]
52 Authors: A.K. Susheela & M Bhatnagar
3rd Int. Workshop on Fluorosis Prevention and Defluoridation of Water ISFR, EnDeCo & ICOH
metabolism of soft tissues 6, 7. Fluoride inhibited enzymatic activities in epididymal sperms 8, 9, and on testicular and cauda epididymal metabolism in fluoride exposed animals10.
The treatment with calcium, vitamin C and D showed a significant improvement in the skeletal fluorosis and biochemical parameters in children consuming water containing 4.5 mg/L of fluoride 11. A protective role of β carotene and superoxide dismutase was observed on impaired growth and poor antioxidant state of the rat due to fluoride toxicity 12.
Fluorosis, being an untreatable disease, can only be mitigated through prevention and control. If the disease is diagnosed early, it is easily preventable. Two major interventions: 1) safe water and 2) nutritional supplementation are now practised in India for combating with the health complaints arising due to fluorosis 13. The interventions have been widely field-tested both in hospital and field based patients. The present communication is reporting on the protocol that need to be followed for fluorosis management.
MATERIALS AND METHODS
Fluorosis diagnosis. This study focus on fluorosis diagnosis and management for mitigation of the disease in hospital based patients, where monitoring of the health improvement and data reporting were possible.
The suspected cases of fluorosis referred for diagnosis of the disease from hospitals in Delhi were selected for the study. A detailed history was recorded, radiographs of affected regions of the body and forearm were taken and fluoride content in serum, urine and water was estimated using ion selective electrode technology. After confirming diagnosis of the disease, the patients were diverted to safer source of water for consumption (fluoride as low as possible but not to exceed 1.0 mg / L ) and counselled for nutritional supplementation.
A pre-coded pro forma was designed to collect the background information of the patients. Information on dental, skeletal and non-skeletal manifestations were sought through interview. The procedure adopted for assessing the health complaints involves administering certain physical tests, radiological evaluation and history taking for ascertaining, fluoride toxicity manifestations 13.
• The 3 simple physical tests administered to check the rigidity and pain in the neck, back, knee and shoulder joints are revealed in Figure 1 14.
• Radiological evaluation of bone density and calcification of interosseous membrane of forearm were assessed as evidence of fluorosis 15.
• Chronic and persistent headache if experienced were recorded.

Experiences on combating fluorosis cases in India 53
Editors: Eli. Dahi & Sunsanee. Rajchagool & Nipaphan Osiriphan
•
FIGURE 1. The physical test used in the study as a part of the diagnosis of
fluorosis.
Healthy Affected
Can bend body and touch floor & toes
Can touch the chest with chin
Can stretch hands and fold arms to touch the back of the head
Unable to bend without folding knees
Unable to bend neck to touch chest with chin
Unable to stretch and fold arms to touch the back of the head
54 Authors: A.K. Susheela & M Bhatnagar
3rd Int. Workshop on Fluorosis Prevention and Defluoridation of Water ISFR, EnDeCo & ICOH
• Gastro-intestinal complains, in the form of nausea, loss of appetite, pain in the stomach, gas formation, constipation followed by intermittent diarrhoea (Non-ulcer dyspeptic complaints) were recorded to assess early warning signs of Fluoride toxicity manifestations 16-21.
• Muscular manifestations i.e. muscle weakness, fatigue were recorded 22. • Anaemia was assessed by finding the haemoglobin level of the individual 23. • Polyurea, i.e. the tendency to urinate more often though the volume of urine may
or may not be high, was also recorded. • Polydypsea, i.e. the feeling of excessive thirst, was also assessed. • Information on the use of fluoride contaminated food and other items as black and
red rock salts, canned food items and black tea, tobacco, aracnut were recorded 24. • Discoloration of teeth suggestive of dental fluorosis, if present is also made note
off.
The response of each patient was ascertained in terms of “Yes” or “No” for the above complaints in a pre-coded specially designed proforma which can be evaluated using optical mark reader.
Fluoride in drinking water. Approximately 50 ml of drinking water of the patient was collected directly from the source in a plastic container. Fluoride in drinking water was estimated with the help of Ion 85 Ion analyser by potentiometric method according to the User’s handbook of Radiometer, Copenhagen 25.
Fluoride in serum. Blood, 5 ml, was drawn from anticubital vein and allowed to coagulate at room temperature. Serum was separated by centrifugation and stored in plastic vials in a refrigerator. The fluoride concentration determined by the method of Hall et al 26 using the ion selective electrode as above.
Fluoride in urine. Spot samples of urine were collected in plastic bottles, pH adjusted between 5.2 – 5.5 with 30 % perchloric acid and each sample diluted with acetate buffer 26. The fluoride concentration was determined as above.
Interventions: For complete recovery from fluoride poisoning the patients were advised to go through or practice two interventions 1) safe drinking water 2) nutritional supplementation with diet rich in calcium, vitamin C & E and anti-oxidants. Provision for safe water through existing safe sources was recommended and the patients are followed up at certain intervals for impact assessment.
Nutritional supplementation. Nutritional supplementation requires counselling of the patients and to educate the female members of the household who are responsible for cooking and serving the food for the families. They are informed on the locally grown / available food items which are rich in calcium, vitamin C, E and anti-oxidants that they need to be consumed on a daily basis, through breakfast, lunch and dinner. Before counselling the patient, the status of the diet that the family consumes, food habits and way of cooking the food were assessed. Then they are advised to consume food rich in calcium, vitamin C, E and anti-oxidants and the different
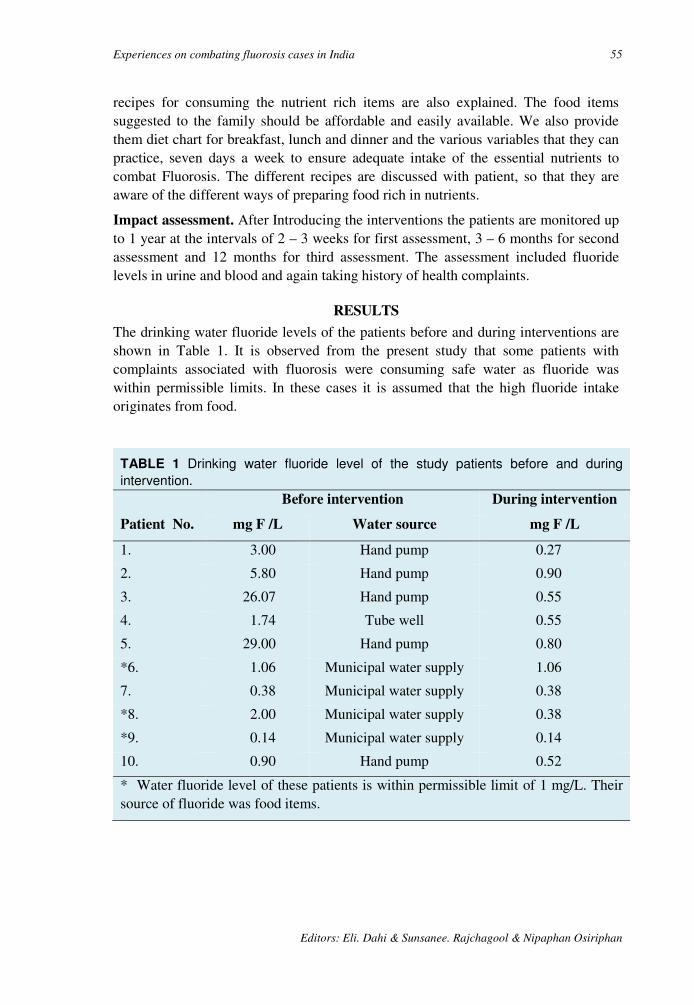
Experiences on combating fluorosis cases in India 55
Editors: Eli. Dahi & Sunsanee. Rajchagool & Nipaphan Osiriphan
recipes for consuming the nutrient rich items are also explained. The food items suggested to the family should be affordable and easily available. We also provide them diet chart for breakfast, lunch and dinner and the various variables that they can practice, seven days a week to ensure adequate intake of the essential nutrients to combat Fluorosis. The different recipes are discussed with patient, so that they are aware of the different ways of preparing food rich in nutrients.
Impact assessment. After Introducing the interventions the patients are monitored up to 1 year at the intervals of 2 – 3 weeks for first assessment, 3 – 6 months for second assessment and 12 months for third assessment. The assessment included fluoride levels in urine and blood and again taking history of health complaints.
RESULTS
The drinking water fluoride levels of the patients before and during interventions are shown in Table 1. It is observed from the present study that some patients with complaints associated with fluorosis were consuming safe water as fluoride was within permissible limits. In these cases it is assumed that the high fluoride intake originates from food.
TABLE 1 Drinking water fluoride level of the study patients before and during
intervention.
Patient No.
Before intervention During intervention
mg F /L Water source mg F /L
1. 3.00 Hand pump 0.27
2. 5.80 Hand pump 0.90
3. 26.07 Hand pump 0.55
4. 1.74 Tube well 0.55
5. 29.00 Hand pump 0.80
*6. 1.06 Municipal water supply 1.06
7. 0.38 Municipal water supply 0.38
*8. 2.00 Municipal water supply 0.38
*9. 0.14 Municipal water supply 0.14
10. 0.90 Hand pump 0.52
* Water fluoride level of these patients is within permissible limit of 1 mg/L. Their source of fluoride was food items.
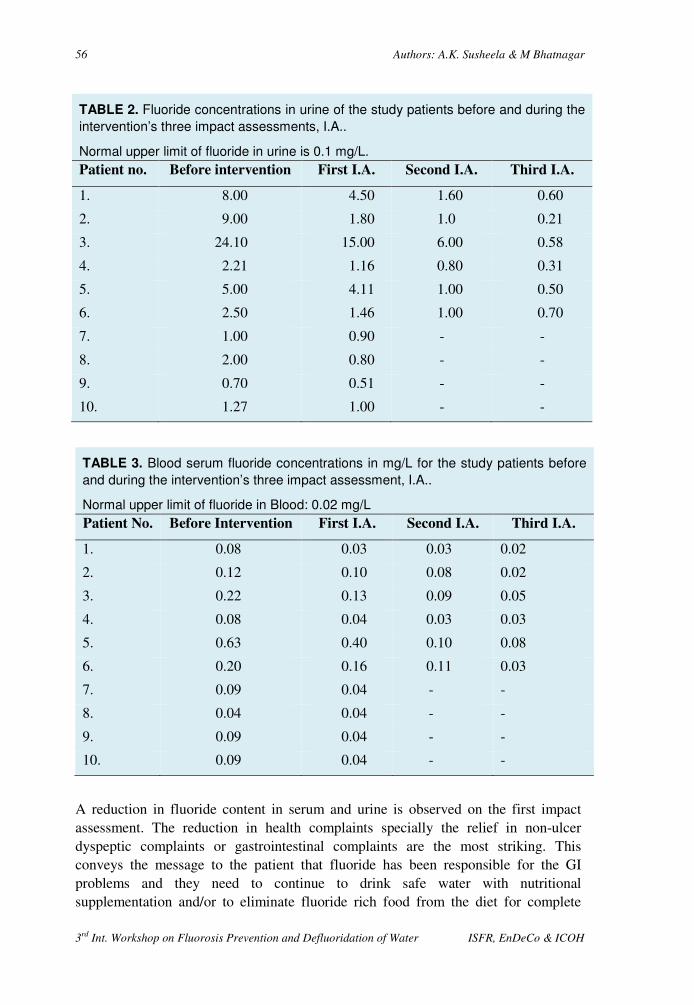
56 Authors: A.K. Susheela & M Bhatnagar
3rd Int. Workshop on Fluorosis Prevention and Defluoridation of Water ISFR, EnDeCo & ICOH
TABLE 2. Fluoride concentrations in urine of the study patients before and during the
intervention’s three impact assessments, I.A..
Normal upper limit of fluoride in urine is 0.1 mg/L.
Patient no. Before intervention First I.A. Second I.A. Third I.A.
1. 8.00 4.50 1.60 0.60
2. 9.00 1.80 1.0 0.21
3. 24.10 15.00 6.00 0.58
4. 2.21 1.16 0.80 0.31
5. 5.00 4.11 1.00 0.50
6. 2.50 1.46 1.00 0.70
7. 1.00 0.90 - -
8. 2.00 0.80 - -
9. 0.70 0.51 - -
10. 1.27 1.00 - -
TABLE 3. Blood serum fluoride concentrations in mg/L for the study patients before
and during the intervention’s three impact assessment, I.A..
Normal upper limit of fluoride in Blood: 0.02 mg/L
Patient No. Before Intervention First I.A. Second I.A. Third I.A.
1. 0.08 0.03 0.03 0.02
2. 0.12 0.10 0.08 0.02
3. 0.22 0.13 0.09 0.05
4. 0.08 0.04 0.03 0.03
5. 0.63 0.40 0.10 0.08
6. 0.20 0.16 0.11 0.03
7. 0.09 0.04 - -
8. 0.04 0.04 - -
9. 0.09 0.04 - -
10. 0.09 0.04 - -
A reduction in fluoride content in serum and urine is observed on the first impact assessment. The reduction in health complaints specially the relief in non-ulcer dyspeptic complaints or gastrointestinal complaints are the most striking. This conveys the message to the patient that fluoride has been responsible for the GI problems and they need to continue to drink safe water with nutritional supplementation and/or to eliminate fluoride rich food from the diet for complete

Experiences on combating fluorosis cases in India 57
Editors: Eli. Dahi & Sunsanee. Rajchagool & Nipaphan Osiriphan
recovery. The first impact assessment is also a confidence building exercise for the patient to consume safe drinking water and practice nutritional supplementation.
TABLE 4. Health complaints elicited by the patients before the study interventions
and during the interventions three impact assessments I.A..
No Manifestations Before, % 1st I A, % 2
nd I.A., % 3
rd I.A., %
1. Gastro-intestinal 100 70 100 -
2. Muscular 60 40 50 Complete recovery
3. Polyurea 30 20 30 Complete recovery
5. Polydypsea 50 20 40 10
6. Pain and rigidity in the joint
90 30 Complete recovery
During the second impact assessment, a significant reduction in fluoride levels in urine and serum is observed. The patient also felt relief in joint pains. After third impact assessment, the patient reported complete recovery from gastrointestinal problems and pain in the joints. After each impact assessment certain minor changes needed to be introduced to the diet chart for obtaining better results. The reduction in fluoride levels in urine and serum of patients during impact assessment are shown in the Table 2 & 3.The percent reduction in health complains during impact assessment are shown in Table 4. Figure 2 shows the reduction of the fluoride concentrations as observed on an average (geometric means).
FIGURE 2. Mean concentration of fluoride in urine, serum
and drinking water among the study persons used before
and during the 1st, 2nd and 3rd impact assessment (IA).
0
2
4
6
8
10
12
Before 1st IA 2nd IA 3rd IA
Drinking Water
Urine
Blood
mgF/L

58 Authors: A.K. Susheela & M Bhatnagar
3rd Int. Workshop on Fluorosis Prevention and Defluoridation of Water ISFR, EnDeCo & ICOH
DISCUSSION
The results of the present study reveals that after introducing interventions for prevention and control of fluorosis, the improvement in health status was observed as decrease in fluoride levels in serum and urine and a great relief to the patient. As evident from earlier animal studies that the fluoride induced changes were transient and reversible by withdrawal of sodium fluoride treatment 6 and by feeding ascorbic acid and calcium during the withdrawal period.27, 28.
The supplementation of ascorbic acid has been observed markedly to reduce fluoride retention in the bones of mice 2. It is also observed that vitamin C administration prevented the development of severe bone fluorosis29 and diminished the toxic effects of fluoride in bones of monkeys 3. Parker et al 30 investigated that the interaction of dietary vitamin C, protein and calcium with fluoride and observed an increased accumulation of fluoride in the group maintained on low protein diet.
The present study substantiates the concept that fluorosis management and mitigation are achieved, by early diagnosis and practising interventions with safe water and nutritional supplementation, over a period of 15 days to 12 months. The patients recover rather well and get back to normal. The patients need to be closely monitored by introducing new food items and recipes for the daily diet. This ensures that the patients continue to practice nutritional supplements with the new items and recipes, as the food prepared would be tasty and acceptable to the family.
Present study indicates that calcium, vitamin C, E and antioxidants have a significant beneficial role in mitigating the fluoride induced toxicity. Therefore these nutrients are recommended to be used for preventing and combating fluorosis in endemic areas for fluorosis.
REFERENCES
1. Siddiqui TH. Fluorosis in Nalgonda District, Hyderabad, Deccan, British Medical Journal 1955; 2: 1408.
2. Yu MH, Hwang HS. Effect of protein and ascorbic acid on fluoride induced change in blood composition and skeletal fluoride deposition in mice. In: Fluoride Research: Studies in Environmental Science 27, Eds. Tsunoda H, Yu MH. Elsevier, Amsterdam 1985; 203 – 210.
3. Krishnamachari KAVR, Krishnaswamy K. Indian J. Med. Res. 1974; 62: 1415 – 1423.
4. Srirangareddy G, Srikantia SG. Effects of dietary calcium, vitamin C and protein in development of experimental Fluorosis. I. Growth, serum chemistry and changes in composition and radiological appearance of bones. Metabolism 1971; 20: 642 – 649.
5. Chinoy NJ and Sharma A. Amelioration of fluoride toxicity by vitamin E and D in reproductive functions of male mice. Fluoride 1998; 31(4): 203 – 216.

Experiences on combating fluorosis cases in India 59
Editors: Eli. Dahi & Sunsanee. Rajchagool & Nipaphan Osiriphan
6. Chinoy NJ, Sharma M. and Michael M. Beneficial effects of ascorbic acid and calcium on reversal of fluoride toxicity in male rats. Fluoride 1993; 26 (1): 45 – 56.
7. Chinoy NJ, Walimbe AS, Vyas HA, Mamgla P. Transient and reversible fluoride toxicity in some soft tissues of female mice. Fluoride 1994; 27(4): 204 – 214.
8. Chinoy NJ. Effect of fluoride on physiology of some animals and human beings. Indian Journal of Environmental Toxicology 1994; 1(1): 17 – 32.
9. Narayana MV, Chinoy NJ. Reversible effect of sodium fluoride ingestion on spermatozoa of the rate. International Journal of Fertility and Menopausal Studies 1994; 39 (6): 337 – 346.
10. Chinoy NJ, Sukla S, Walimbe AS and Bhattacharya S. Fluoride toxicity on rat testis and cauda epididymal tissue components and is reversal. Fluoride 1997; 30 (1): 41 – 50.
11. Gupta SK. Gupta RC, Seth AK and Gupta R. Reversal of Fluorosis in children. Acta Paediatrica Japonica 1996; 385: 513 – 519.
12. Wang ZC, Fu D, Wang YP, Gugn DH, LI XD, Yan JL, Wu Y. Effects of free radical on the development of fluorosis and the protective effects by SOD and Vit. E. Proceedings of the XXth Conference of the International Society for Fluoride Research 1994; 5 – 9, Sept Beijing, China P. 145.
13. Susheela AK. Fluorosis Management Programme in India. Current Science 1999; 77 (10).
14. Susheela AK, Kumar A, Bhatnagar M and Bahadur R. Prevalence of endemic fluorosis with gastro-intestinal manifestations in people living in some North-Indian villages. Fluoride 1993; 26 (2): 97-104
15. Jolly SS, Prasad S, Sharma R. Endemic fluorosis in India. J. Assoc. Physician India 1970; 18: 459 – 471.
16. Susheela AK and Das K. Chronic fluoride toxicity: A scanning electron microscopic study of duodenal mucosa. Clinical Toxicology 1988; 26 (7): 467 – 476.
17. Susheela AK, Das TK, Gupta IP, Tandon BK, Kackar SK, Ghosh P and Deka RC. Fluoride ingestion and its correlation with gastrointestinal discomfort. Fluoride 1992; 25 (1): 5 – 22.
18. Gupta IP, Das TK , Susheela AK , Dasarathy S and Tandan R.K. Alimentary tract and poncreas: Fluoride as possible etiological factor in non-ulcer dyspepsia. J. Gastroenterology and hepatology 1992; 353 – 359.
19. Das TK, Susheela AK, Gupta, IP, Dasarathy S and Tandan RK. Toxic effects of chronic fluoride ingestion on this upper gastrointestinal tract. J. Clin. Gastro 1994; 18(3): 194 – 199.
20. Susheela, A.K. Epidemiological studies of health risks from naturally contaminated with fluoride: In proceedings of Rome Symposium: Assessing and managing health risks from drinking water contamination: Approaches and applications, ed: Eric G. Richard and Giovanni A. Zapponi,: IAHS publication No. 233, 1995: 123 – 124.
21. Dasrathy S, Das TK, Gupta IP, Susheela AK and Tandan RK. Gastroduodenal manifestations in patients with skeletal Fluorosis. J. Gastro. 1996; 31: 333 – 337.
22. Kaul RD and Susheela AK. The muscle. In Symposium on the Non-skeletal Manifestations of Chronic Toxicity. Fluoride 1976; 9: 9.

60 Authors: A.K. Susheela & M Bhatnagar
3rd Int. Workshop on Fluorosis Prevention and Defluoridation of Water ISFR, EnDeCo & ICOH
23. Susheela AK and Jain SK Fluoride toxicity: Erythrocyte membrane abnormalities and echonocyte formation.In: Fluoride Research , Studies on environmental sciences. Ed.Tsunoda H and Yu MH. Elsevier, Amsterdam, 1985; 27 :231-239
24. UNICEF, Desk Review: Impact of Nutrition on Fluorosis. Industrial toxicology Research Centre, Lucknow, 1998.
25. Application: Fluoride in water. User’s hand book Radiometer, Copenhagen, 1998. 26. Hall l L, Smith FA, Delopezo H , Gardner DF. Direct potentiometric
determination of total ionic fluoride in biological fluids. Clin. Chem. 1972; 18: 1455 – 1458.
27. Chinoy NJ, Sequeira E, Narayana MV. Effect of Vitamin C and Calcium on the reversibility of fluoride induced alternations in spermatozoa of rabbit. Fluoride 1991; 24 (1): 29 – 39.
28. Chinoy NJ, Reddy VVPC and Michael M. Beneficial effects of ascorbic acid and calcium on reproductive functions of sodium fluoride treated prepubertal male rats. Fluoride 1994 ; 27 (2): 67 – 75.
29. Wadhwani TK. Ind. J. Med. Res. 1955 ; 45: 377 – 386. 30. Parker CM, Sharma RP, Shupe SL. Clin. Toxicology 1979; 15: 301 – 311.
3rd International Workshop on Fluorosis Prevention and Defluoridation of Water 61
Bone Char Quality and Defluoridation Capacity in Contact
Precipitation
J. Albertus* H. Bregnhøj* and M. Kongpun** Denmark and Thailand
SUMMARY: Samples from six different brands of bone char are tested for their capacity to
remove fluoride from water in batch. Initial concentrations of 10 mg/L and contact times of
6 hours are used. The removal capacities observed are 0.6 –1.1 mg/g, 0.9 mg/g on an
average, s.d. being 0.16. In agreement with previous data the carbon-rich black-coloured
bone char is on the higher end of this range.
Addition of calcium and phosphate compounds to the jar experiments results in more than
doubling of these capacities, on an average 1.9 mg/g, s.d. being 0.14.
One of bone char products is setup in columns and fed with fluoride water, 100 mg/L, for
saturation. Hereafter the columns are fed with water of 10 mgF/L where calcium and
phosphate are added as in the contact precipitation process. The results show that the
columns are able to remove up to 700 bed volumes, before the concentration of fluoride in
the effluent water breaks through, above 1.5 mg/L. The operational removal capacities
observed are 7 and 9 mg/L, depending on contact time and the dosage of chemicals.
It is discussed that longer contact time and higher dosage of calcium and phosphate may
result in longer operation periods in the contact precipitation columns.
Key words: Bone char, contact precipitation, sorption, batch experiment, flow-experiment, defluoridation, jar test, pyrolysis, calcination, operational removal capacity, dynamic removal capacity.
INTRODUCTION
One of the appropriate methods for defluoridation of drinking water in developing countries is adsorption of fluoride on bone char in columns. The bone char needs to be of a quality that may be difficult to produce locally in developing countries and the lifetime of the defluoridation filters is limited due to saturation of the bone char. Contact precipitation has therefore been introduced as an alternative method for defluoridation. Contact precipitation is an addition of calcium and phosphate that leads to precipitation of fluoride when the solution is in contact with bone char. The bone char is a necessary catalyst in order to precipitate the fluoride 1.
Charring of bones for bone char can basically be done in two ways: As calcination where bones are heated in the presence of continuous supply of oxygen from the atmospheric air or as pyrolysis where no oxygen is present during the heating. In calcination the organic carbon is converted to CO2 that is stripped off while in pyrolysis the organic carbon is converted to inorganic carbon that remains in the bone char. Pyrolysed bones are therefore always totally black while calcined bones are * Department of Environmental Science and Engineering, Technical University of Denmark E-mail:[email protected]

62 Authors: J. Albertus, H. Bregnhøj & M. Kongpun
3rd Int. Workshop on Fluorosis Prevention and Defluoridation of Water ISFR, EnDeCo & ICOH
brown -grey - white, depending of the access of oxygen and thereby degree of charring 2. Pyrolysis is much more fuel demanding and therefore more expensive.
Investigations of bone char for fluoride adsorption has revealed that calcined bone char produced at high temperatures inhibits the adsorption process 2. It has though been found that bone char produced by partly calcination are suitable for adsorption provided that the charring temperatures do not exceed 500 °C and the charring time is sufficient 3. White types of bone char produced with a high degree of calcination are therefore regarded as unsuitable for adsorption purposes. The adsorption capacity is however unimportant in connection with contact precipitation and it has never been investigated how calcined bone char influence the processes of contact precipitation. It is therefore possible that the manufacture of good quality bone char for contact precipitation is less complicated and cheaper to manufacture than bone char for adsorption.
The processes of uptake of fluoride on bone char are complicated to describe, consisting of more than one process. Direct adsorption in empty sites on the bone char surface seems to be an important reaction for fluoride binding on bone char. Also re-crystallisation, where hydroxyapatite is dissolved and fluorapatite is precipitated, is considered to be important in the process [4]. The following model has been developed for the kinetics of fluoride uptake on bone char in batch:
S �/01 · 34,6 · 78
X:; · f<,=
S8· e>�?@A·BC,DEFG� H 1
Eq. 1
Where fluoride concentration is characterised for a given dosage of bone char (XBC) and a given initial fluoride concentration (So) by the means of the parameters: dynamic capacity (fm,b) and reaction rate (k).
The exact chemical process of contact precipitation are not known, but it is assumed that it is basically a combination of precipitation of fluorapatite, Ca10(P04)6F2, and fluorite, CaF2. Precipitation of fluorite can occur if there already are precipitated compounds to initiate the process e.g. bone char. Precipitation of fluorapatite will only occur in contact with the apatite structure in the bone char and is dependent of the pore water velocity and contact time in the filter 5.
Calcium and fluoride concentrations will decrease due to precipitation of both fluorite and fluorapatite as parallel reactions. The precipitation products depend on the concentrations of phosphate and calcium. At high concentrations both fluorapatite and fluorite will precipitate while at lower concentrations the solubility constant for fluorite will be reached and further removal of fluoride must be due to precipitation of fluorapatite alone 6.
Objective. The aim of these investigations was A) to compare different bone char products with respect to ability to adsorb fluoride, B) to investigate the influence of bone char quality in contact precipitation and C) to investigate possible limitations in the defluoridation capacity by contact precipitation.
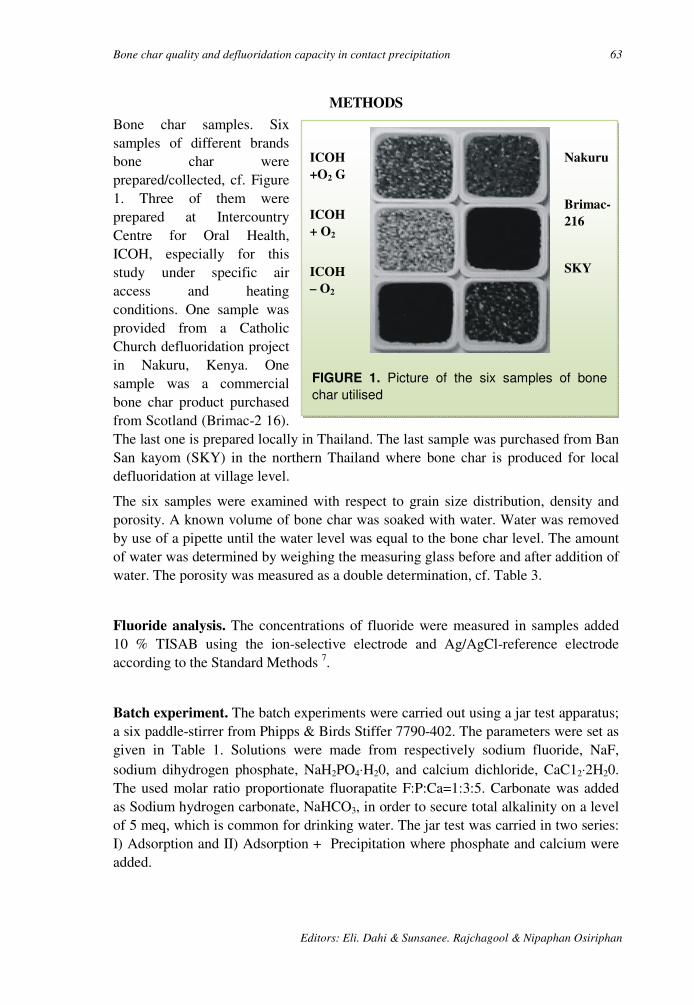
Bone char quality and defluoridation capacity in contact precipitation 63
Editors: Eli. Dahi & Sunsanee. Rajchagool & Nipaphan Osiriphan
METHODS
Bone char samples. Six samples of different brands bone char were prepared/collected, cf. Figure 1. Three of them were prepared at Intercountry Centre for Oral Health, ICOH, especially for this study under specific air access and heating conditions. One sample was provided from a Catholic Church defluoridation project in Nakuru, Kenya. One sample was a commercial bone char product purchased from Scotland (Brimac-2 16). The last one is prepared locally in Thailand. The last sample was purchased from Ban San kayom (SKY) in the northern Thailand where bone char is produced for local defluoridation at village level.
The six samples were examined with respect to grain size distribution, density and porosity. A known volume of bone char was soaked with water. Water was removed by use of a pipette until the water level was equal to the bone char level. The amount of water was determined by weighing the measuring glass before and after addition of water. The porosity was measured as a double determination, cf. Table 3.
Fluoride analysis. The concentrations of fluoride were measured in samples added 10 % TISAB using the ion-selective electrode and Ag/AgCl-reference electrode according to the Standard Methods 7.
Batch experiment. The batch experiments were carried out using a jar test apparatus; a six paddle-stirrer from Phipps & Birds Stiffer 7790-402. The parameters were set as given in Table 1. Solutions were made from respectively sodium fluoride, NaF, sodium dihydrogen phosphate, NaH2PO4⋅H20, and calcium dichloride, CaC12⋅2H20. The used molar ratio proportionate fluorapatite F:P:Ca=1:3:5. Carbonate was added as Sodium hydrogen carbonate, NaHCO3, in order to secure total alkalinity on a level of 5 meq, which is common for drinking water. The jar test was carried in two series: I) Adsorption and II) Adsorption + Precipitation where phosphate and calcium were added.
ICOH
+O2 G
ICOH
+ O2
ICOH
– O2
Nakuru
Brimac-
216
SKY
FIGURE 1. Picture of the six samples of bone
char utilised

64 Authors: J. Albertus, H. Bregnhøj & M. Kongpun
3rd Int. Workshop on Fluorosis Prevention and Defluoridation of Water ISFR, EnDeCo & ICOH
TABLE 1. Specification of experimental conditions for the jar test utilised.
Parameter SYMBOL UNIT VALUE
Bone char dosage at t = 0 XBC g/L 4
Volume of batch V0 L 1
Grain size of medium GZ mm 0.2 - 0.85
Stirring rate - RPM 60
Fluoride concentration, initial SF,O mg/L 10
Fluoride concentration, initial mM 0.526
Phosphate concentration (series II) SP,O mM 1.58
Calcium concentration (series II) SCa,O mM 2.63
Molar ratio F:P:Ca - 1:3:5
The solutions were prepared in each jar and the bone char was added at time zero. Samples of ## mL volumes were collected for fluoride analysis every 30 minutes. Each experiment series was carried out in duplicate.
TABLE 2. Specification of parameters in the column experiment for contact
precipitation.
Parameter Symbol Unit CP I CP II CP III
Fluoride concentration SF,O mg/L 10 10 10
Grain size GZ mm 0.2 - 1.41 0.2 - 1.41 0.2 - l.41
Porosity ε - 0.80 0.80 0.80
Bone char MBC g 150 150 75
Flow Q L/h 0.35 0.35 0.35
Diameter of column ØBC cm 0.34 0.34 0.34
Height of bone char HBC cm 26 26 13
Bedvolume VBC L 0.24 0.24 0.12
Retention time, VBC/Q Th min 40 40 20
Contact time, tc=VBC ε/Q.
tc min 32 32 16
Molar ratio F:P:Ca - 1:1.5:2.8 1:2.3:3.9 1:2.3:3.9
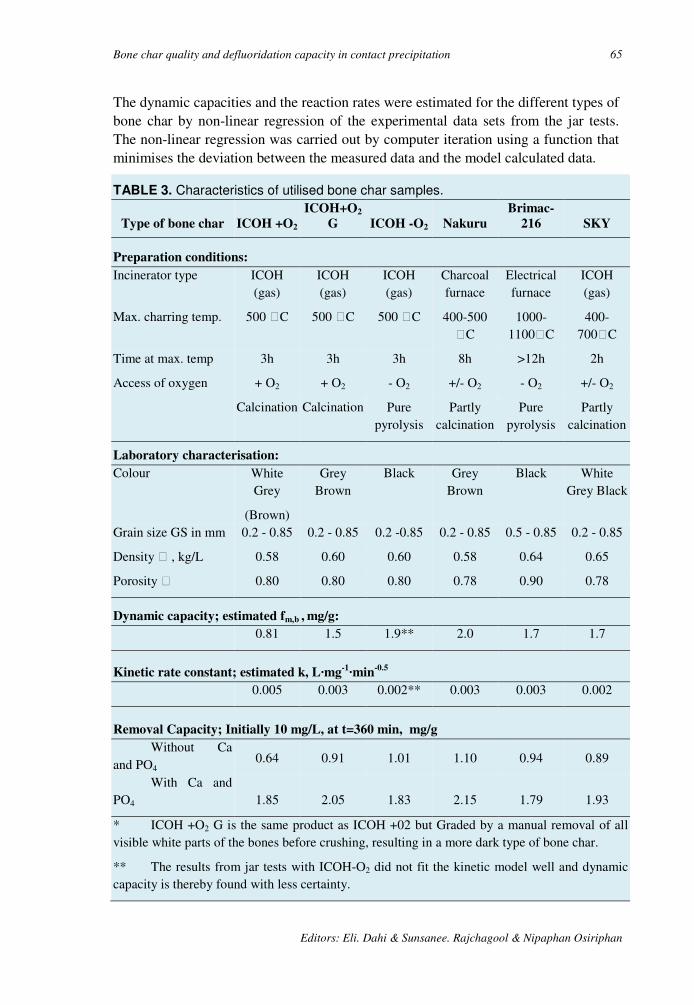
Bone char quality and defluoridation capacity in contact precipitation 65
Editors: Eli. Dahi & Sunsanee. Rajchagool & Nipaphan Osiriphan
The dynamic capacities and the reaction rates were estimated for the different types of bone char by non-linear regression of the experimental data sets from the jar tests. The non-linear regression was carried out by computer iteration using a function that minimises the deviation between the measured data and the model calculated data.
TABLE 3. Characteristics of utilised bone char samples.
Type of bone char ICOH +O2
ICOH+O2
G ICOH -O2 Nakuru
Brimac-
216 SKY
Preparation conditions:
Incinerator type ICOH (gas)
ICOH (gas)
ICOH (gas)
Charcoal furnace
Electrical furnace
ICOH (gas)
Max. charring temp. 500 C 500 C 500 C 400-500 C
1000-1100C
400-700C
Time at max. temp 3h 3h 3h 8h >12h 2h
Access of oxygen + O2 + O2 - O2 +/- O2 - O2 +/- O2
Calcination Calcination Pure pyrolysis
Partly calcination
Pure pyrolysis
Partly calcination
Laboratory characterisation:
Colour White Grey
(Brown)
Grey Brown
Black Grey Brown
Black White Grey Black
Grain size GS in mm 0.2 - 0.85 0.2 - 0.85 0.2 -0.85 0.2 - 0.85 0.5 - 0.85 0.2 - 0.85
Density , kg/L 0.58 0.60 0.60 0.58 0.64 0.65
Porosity 0.80 0.80 0.80 0.78 0.90 0.78
Dynamic capacity; estimated fm,b , mg/g:
0.81 1.5 1.9** 2.0 1.7 1.7
Kinetic rate constant; estimated k, L·mg-1·min
-0.5
0.005 0.003 0.002** 0.003 0.003 0.002
Removal Capacity; Initially 10 mg/L, at t=360 min, mg/g
Without Ca and PO4
0.64 0.91 1.01 1.10 0.94 0.89
With Ca and PO4 1.85 2.05 1.83 2.15 1.79 1.93
* ICOH +O2 G is the same product as ICOH +02 but Graded by a manual removal of all visible white parts of the bones before crushing, resulting in a more dark type of bone char.
** The results from jar tests with ICOH-O2 did not fit the kinetic model well and dynamic capacity is thereby found with less certainty.
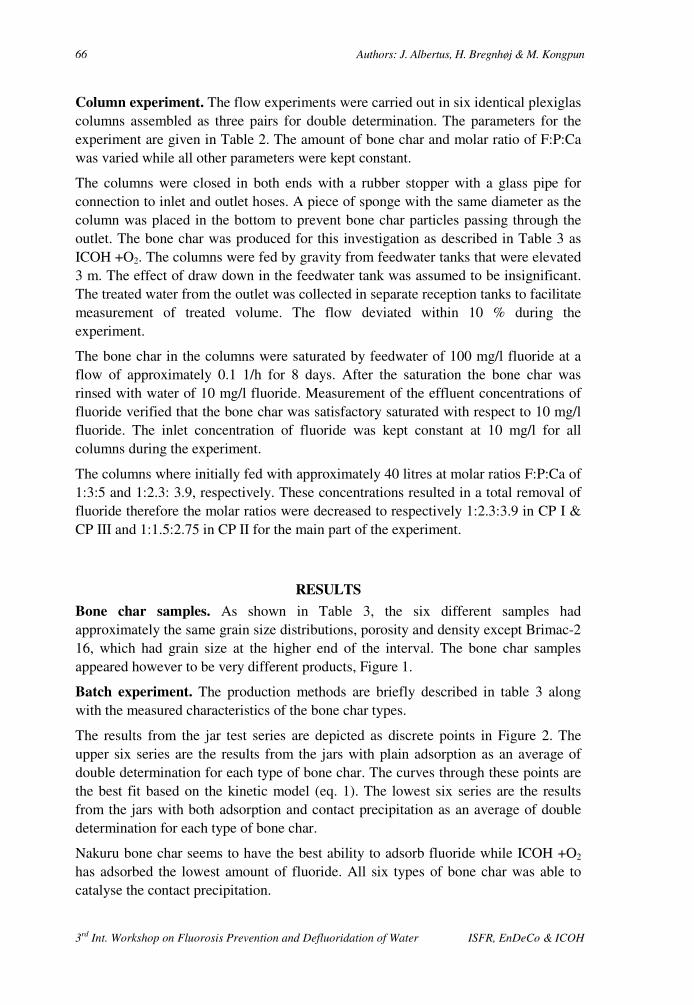
66 Authors: J. Albertus, H. Bregnhøj & M. Kongpun
3rd Int. Workshop on Fluorosis Prevention and Defluoridation of Water ISFR, EnDeCo & ICOH
Column experiment. The flow experiments were carried out in six identical plexiglas columns assembled as three pairs for double determination. The parameters for the experiment are given in Table 2. The amount of bone char and molar ratio of F:P:Ca was varied while all other parameters were kept constant.
The columns were closed in both ends with a rubber stopper with a glass pipe for connection to inlet and outlet hoses. A piece of sponge with the same diameter as the column was placed in the bottom to prevent bone char particles passing through the outlet. The bone char was produced for this investigation as described in Table 3 as ICOH +O2. The columns were fed by gravity from feedwater tanks that were elevated 3 m. The effect of draw down in the feedwater tank was assumed to be insignificant. The treated water from the outlet was collected in separate reception tanks to facilitate measurement of treated volume. The flow deviated within 10 % during the experiment.
The bone char in the columns were saturated by feedwater of 100 mg/l fluoride at a flow of approximately 0.1 1/h for 8 days. After the saturation the bone char was rinsed with water of 10 mg/l fluoride. Measurement of the effluent concentrations of fluoride verified that the bone char was satisfactory saturated with respect to 10 mg/l fluoride. The inlet concentration of fluoride was kept constant at 10 mg/l for all columns during the experiment.
The columns where initially fed with approximately 40 litres at molar ratios F:P:Ca of 1:3:5 and 1:2.3: 3.9, respectively. These concentrations resulted in a total removal of fluoride therefore the molar ratios were decreased to respectively 1:2.3:3.9 in CP I & CP III and 1:1.5:2.75 in CP II for the main part of the experiment.
RESULTS
Bone char samples. As shown in Table 3, the six different samples had approximately the same grain size distributions, porosity and density except Brimac-2 16, which had grain size at the higher end of the interval. The bone char samples appeared however to be very different products, Figure 1.
Batch experiment. The production methods are briefly described in table 3 along with the measured characteristics of the bone char types.
The results from the jar test series are depicted as discrete points in Figure 2. The upper six series are the results from the jars with plain adsorption as an average of double determination for each type of bone char. The curves through these points are the best fit based on the kinetic model (eq. 1). The lowest six series are the results from the jars with both adsorption and contact precipitation as an average of double determination for each type of bone char.
Nakuru bone char seems to have the best ability to adsorb fluoride while ICOH +O2 has adsorbed the lowest amount of fluoride. All six types of bone char was able to catalyse the contact precipitation.
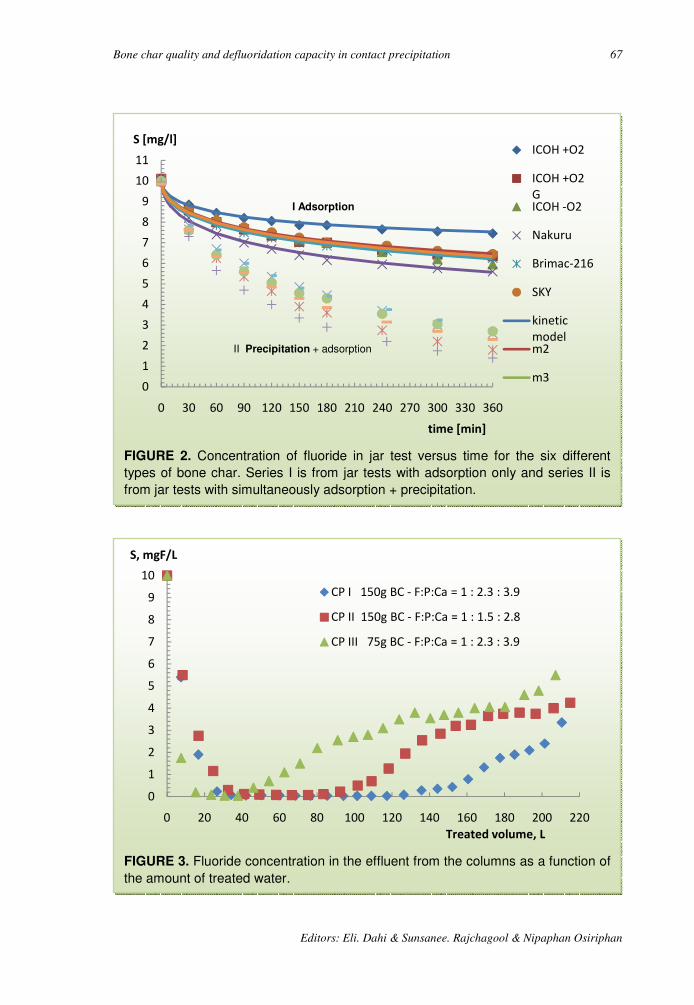
Bone char quality and defluoridation capacity in contact precipitation 67
Editors: Eli. Dahi & Sunsanee. Rajchagool & Nipaphan Osiriphan
FIGURE 3. Fluoride concentration in the effluent from the columns as a function of
the amount of treated water.
0
1
2
3
4
5
6
7
8
9
10
0 20 40 60 80 100 120 140 160 180 200 220
S, mgF/L
Treated volume, L
CP I 150g BC - F:P:Ca = 1 : 2.3 : 3.9
CP II 150g BC - F:P:Ca = 1 : 1.5 : 2.8
CP III 75g BC - F:P:Ca = 1 : 2.3 : 3.9
FIGURE 2. Concentration of fluoride in jar test versus time for the six different
types of bone char. Series I is from jar tests with adsorption only and series II is
from jar tests with simultaneously adsorption + precipitation.
0
1
2
3
4
5
6
7
8
9
10
11
0 30 60 90 120 150 180 210 240 270 300 330 360
S [mg/l]
time [min]
ICOH +O2
ICOH +O2
GICOH -O2
Nakuru
Brimac-216
SKY
kinetic
modelm2
m3
II Precipitation + adsorption
I Adsorption

68
3rd Int. Workshop on Fluorosis Prevention and Defluori
Flow experiment. The results from the column experiments are depicted as discrete points in figure 3. The results are shown as average for the double determination in each pair of columns.
DISCUSSION
Bone char characteristics. The six different samples of bone char were examined with respect to grain size distribution, density and porosity. This was done in order to detect other possible reasons for the difference in adsorption capacity and ability to catalyse contact precipitation than the production methods. The bone char all had approximately the same grain size distributions, porosity and density except Brimac16, which had grain size at the higher end of the interval. Because of the higher uniformity of the grains the porosity is also higher. Slightly larger grains result in lower adsorption capacity 2.
The picture in Figure 1 is in black and white colours and does therefore not reflect other colour nuances as for example brown. ICOH pyrolysis are totally black without any grey or white parts. Nakuru and SKY are also dark with only a few white grains due to a partly calcination. The graded bone char produced at ICOH (ICOH +O2 G) is mainly dark grey and brown but with more white grains than Nakuru and SKY. ICOH +02 is the most white bone char of the 6 types.
FIGURE 4. Precipitated fluoride versus time in jar test for the six different types of
bone char.
0.0
0.2
0.4
0.6
0.8
1.0
1.2
0 20 40 60 80 100 120 140 160
ICOH +O2
ICOH +O2 G
ICOH -O2
Nakuru
Brimac-216
SKY
Authors: J. Albertus, H. Bregnhøj & M. Kongpun
Int. Workshop on Fluorosis Prevention and Defluoridation of Water ISFR, EnDeCo & ICOH
column experiments are depicted as discrete points in figure 3. The results are shown as average for the double determination in
DISCUSSION
The six different samples of bone char were examined with respect to grain size distribution, density and porosity. This was done in order to detect other possible reasons for the difference in adsorption capacity and ability to
tion than the production methods. The bone char all had approximately the same grain size distributions, porosity and density except Brimac-2 16, which had grain size at the higher end of the interval. Because of the higher
osity is also higher. Slightly larger grains result in
The picture in Figure 1 is in black and white colours and does therefore not reflect other colour nuances as for example brown. ICOH - O2 and Brimac216 produced by
is are totally black without any grey or white parts. Nakuru and SKY are also dark with only a few white grains due to a partly calcination. The graded bone char
G) is mainly dark grey and brown but with more white kuru and SKY. ICOH +02 is the most white bone char of the 6 types.
Precipitated fluoride versus time in jar test for the six different types of
160 180 200 220 240 260 280 300 320 340 360
time, min
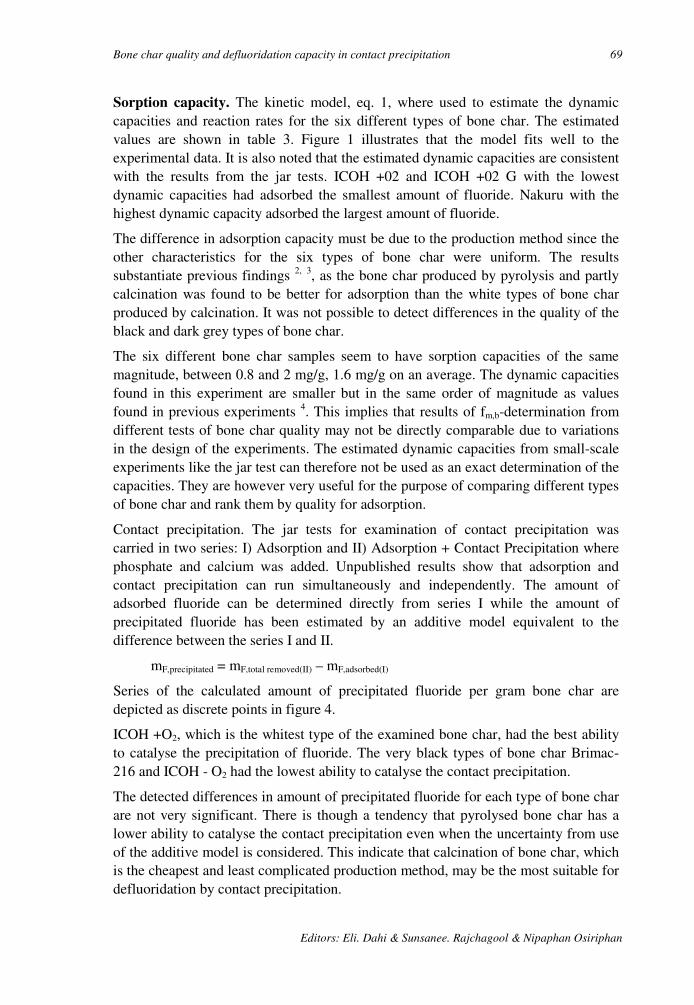
Bone char quality and defluoridation capacity in contact precipitation 69
Editors: Eli. Dahi & Sunsanee. Rajchagool & Nipaphan Osiriphan
Sorption capacity. The kinetic model, eq. 1, where used to estimate the dynamic capacities and reaction rates for the six different types of bone char. The estimated values are shown in table 3. Figure 1 illustrates that the model fits well to the experimental data. It is also noted that the estimated dynamic capacities are consistent with the results from the jar tests. ICOH +02 and ICOH +02 G with the lowest dynamic capacities had adsorbed the smallest amount of fluoride. Nakuru with the highest dynamic capacity adsorbed the largest amount of fluoride.
The difference in adsorption capacity must be due to the production method since the other characteristics for the six types of bone char were uniform. The results substantiate previous findings 2, 3, as the bone char produced by pyrolysis and partly calcination was found to be better for adsorption than the white types of bone char produced by calcination. It was not possible to detect differences in the quality of the black and dark grey types of bone char.
The six different bone char samples seem to have sorption capacities of the same magnitude, between 0.8 and 2 mg/g, 1.6 mg/g on an average. The dynamic capacities found in this experiment are smaller but in the same order of magnitude as values found in previous experiments 4. This implies that results of fm,b-determination from different tests of bone char quality may not be directly comparable due to variations in the design of the experiments. The estimated dynamic capacities from small-scale experiments like the jar test can therefore not be used as an exact determination of the capacities. They are however very useful for the purpose of comparing different types of bone char and rank them by quality for adsorption.
Contact precipitation. The jar tests for examination of contact precipitation was carried in two series: I) Adsorption and II) Adsorption + Contact Precipitation where phosphate and calcium was added. Unpublished results show that adsorption and contact precipitation can run simultaneously and independently. The amount of adsorbed fluoride can be determined directly from series I while the amount of precipitated fluoride has been estimated by an additive model equivalent to the difference between the series I and II.
mF,precipitated = mF,total removed(II) – mF,adsorbed(I)
Series of the calculated amount of precipitated fluoride per gram bone char are depicted as discrete points in figure 4.
ICOH +O2, which is the whitest type of the examined bone char, had the best ability to catalyse the precipitation of fluoride. The very black types of bone char Brimac-216 and ICOH - O2 had the lowest ability to catalyse the contact precipitation.
The detected differences in amount of precipitated fluoride for each type of bone char are not very significant. There is though a tendency that pyrolysed bone char has a lower ability to catalyse the contact precipitation even when the uncertainty from use of the additive model is considered. This indicate that calcination of bone char, which is the cheapest and least complicated production method, may be the most suitable for defluoridation by contact precipitation.
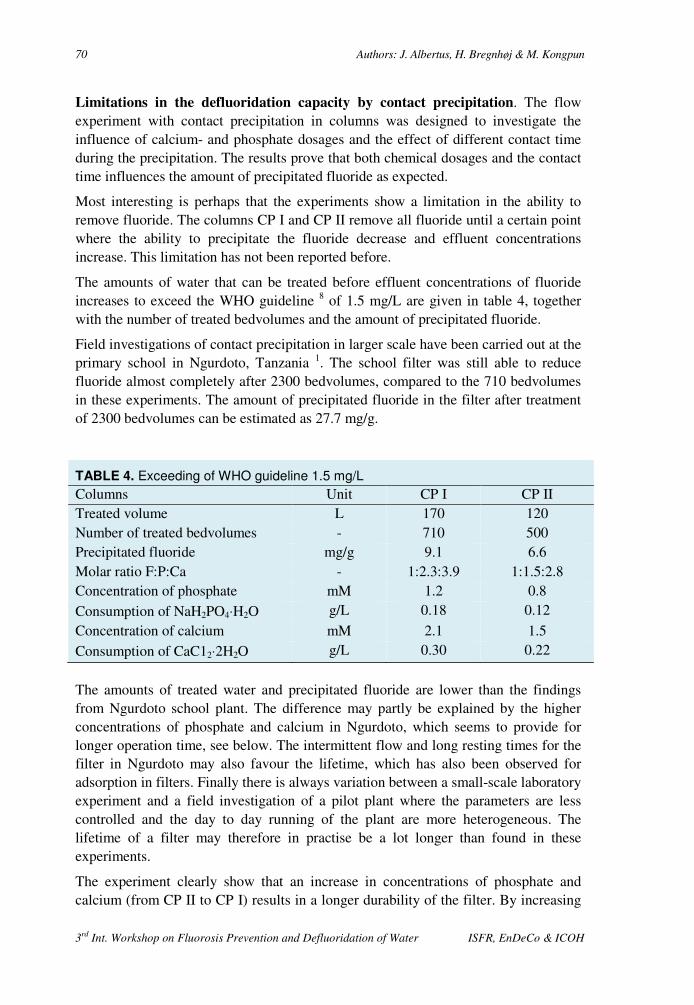
70 Authors: J. Albertus, H. Bregnhøj & M. Kongpun
3rd Int. Workshop on Fluorosis Prevention and Defluoridation of Water ISFR, EnDeCo & ICOH
Limitations in the defluoridation capacity by contact precipitation. The flow experiment with contact precipitation in columns was designed to investigate the influence of calcium- and phosphate dosages and the effect of different contact time during the precipitation. The results prove that both chemical dosages and the contact time influences the amount of precipitated fluoride as expected.
Most interesting is perhaps that the experiments show a limitation in the ability to remove fluoride. The columns CP I and CP II remove all fluoride until a certain point where the ability to precipitate the fluoride decrease and effluent concentrations increase. This limitation has not been reported before.
The amounts of water that can be treated before effluent concentrations of fluoride increases to exceed the WHO guideline 8 of 1.5 mg/L are given in table 4, together with the number of treated bedvolumes and the amount of precipitated fluoride.
Field investigations of contact precipitation in larger scale have been carried out at the primary school in Ngurdoto, Tanzania 1. The school filter was still able to reduce fluoride almost completely after 2300 bedvolumes, compared to the 710 bedvolumes in these experiments. The amount of precipitated fluoride in the filter after treatment of 2300 bedvolumes can be estimated as 27.7 mg/g.
TABLE 4. Exceeding of WHO guideline 1.5 mg/L
Columns Unit CP I CP II Treated volume L 170 120 Number of treated bedvolumes - 710 500 Precipitated fluoride mg/g 9.1 6.6 Molar ratio F:P:Ca - 1:2.3:3.9 1:1.5:2.8 Concentration of phosphate mM 1.2 0.8 Consumption of NaH2PO4⋅H2O g/L 0.18 0.12 Concentration of calcium mM 2.1 1.5 Consumption of CaC12⋅2H2O g/L 0.30 0.22
The amounts of treated water and precipitated fluoride are lower than the findings from Ngurdoto school plant. The difference may partly be explained by the higher concentrations of phosphate and calcium in Ngurdoto, which seems to provide for longer operation time, see below. The intermittent flow and long resting times for the filter in Ngurdoto may also favour the lifetime, which has also been observed for adsorption in filters. Finally there is always variation between a small-scale laboratory experiment and a field investigation of a pilot plant where the parameters are less controlled and the day to day running of the plant are more heterogeneous. The lifetime of a filter may therefore in practise be a lot longer than found in these experiments.
The experiment clearly show that an increase in concentrations of phosphate and calcium (from CP II to CP I) results in a longer durability of the filter. By increasing
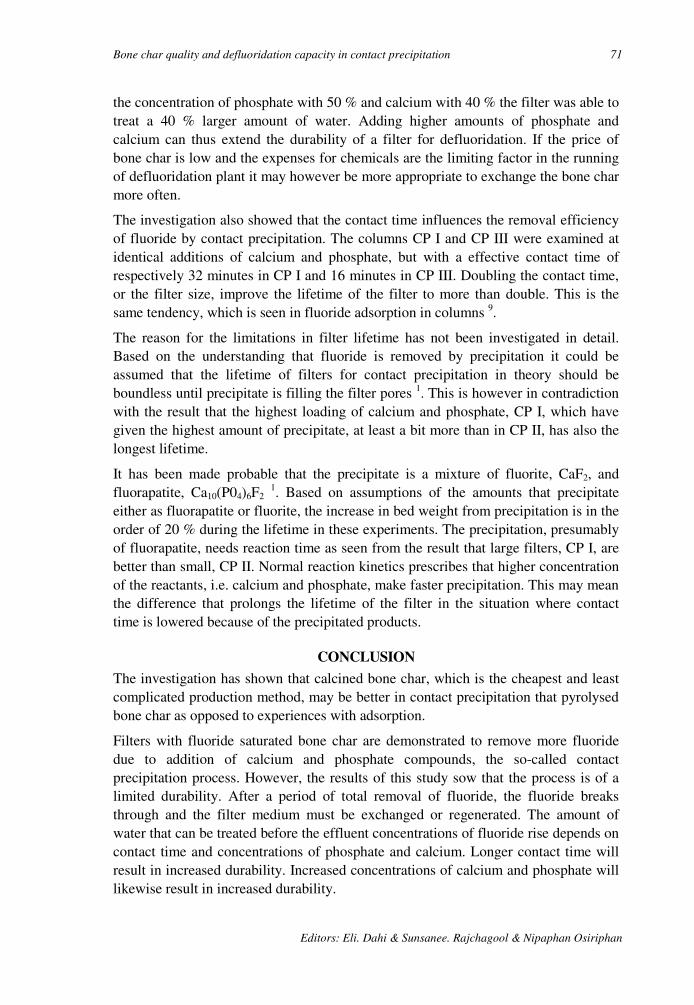
Bone char quality and defluoridation capacity in contact precipitation 71
Editors: Eli. Dahi & Sunsanee. Rajchagool & Nipaphan Osiriphan
the concentration of phosphate with 50 % and calcium with 40 % the filter was able to treat a 40 % larger amount of water. Adding higher amounts of phosphate and calcium can thus extend the durability of a filter for defluoridation. If the price of bone char is low and the expenses for chemicals are the limiting factor in the running of defluoridation plant it may however be more appropriate to exchange the bone char more often.
The investigation also showed that the contact time influences the removal efficiency of fluoride by contact precipitation. The columns CP I and CP III were examined at identical additions of calcium and phosphate, but with a effective contact time of respectively 32 minutes in CP I and 16 minutes in CP III. Doubling the contact time, or the filter size, improve the lifetime of the filter to more than double. This is the same tendency, which is seen in fluoride adsorption in columns 9.
The reason for the limitations in filter lifetime has not been investigated in detail. Based on the understanding that fluoride is removed by precipitation it could be assumed that the lifetime of filters for contact precipitation in theory should be boundless until precipitate is filling the filter pores 1. This is however in contradiction with the result that the highest loading of calcium and phosphate, CP I, which have given the highest amount of precipitate, at least a bit more than in CP II, has also the longest lifetime.
It has been made probable that the precipitate is a mixture of fluorite, CaF2, and fluorapatite, Ca10(P04)6F2
1. Based on assumptions of the amounts that precipitate either as fluorapatite or fluorite, the increase in bed weight from precipitation is in the order of 20 % during the lifetime in these experiments. The precipitation, presumably of fluorapatite, needs reaction time as seen from the result that large filters, CP I, are better than small, CP II. Normal reaction kinetics prescribes that higher concentration of the reactants, i.e. calcium and phosphate, make faster precipitation. This may mean the difference that prolongs the lifetime of the filter in the situation where contact time is lowered because of the precipitated products.
CONCLUSION
The investigation has shown that calcined bone char, which is the cheapest and least complicated production method, may be better in contact precipitation that pyrolysed bone char as opposed to experiences with adsorption.
Filters with fluoride saturated bone char are demonstrated to remove more fluoride due to addition of calcium and phosphate compounds, the so-called contact precipitation process. However, the results of this study sow that the process is of a limited durability. After a period of total removal of fluoride, the fluoride breaks through and the filter medium must be exchanged or regenerated. The amount of water that can be treated before the effluent concentrations of fluoride rise depends on contact time and concentrations of phosphate and calcium. Longer contact time will result in increased durability. Increased concentrations of calcium and phosphate will likewise result in increased durability.

72 Authors: J. Albertus, H. Bregnhøj & M. Kongpun
3rd Int. Workshop on Fluorosis Prevention and Defluoridation of Water ISFR, EnDeCo & ICOH
ACKNOWLEDGEMENTS
We express our gratitude to the staff of ICOH who hosted this investigation in autumn 1999. The authors acknowledge the sponsorship from DUCED-I&UA for support of the travel expenses to Thailand.
REFERENCES
1. Dahi E. Development of the Contact Precipitation Method for Appropriate Defluoridation of Water. Proceedings of the 2nd International Workshop on Fluorosis and Defluoridation of Water, Nazreth, Ethiopia 1997
2. Dahi E, Bregnhøj, H. Significance of Oxygen in Processing of Bone Char for Defluoridation of Water. Proceedings of the 1st International Workshop on Fluorosis and Defluoridation of Water, Ngurdoto, Tanzania 1995
3. Jacobsen P, Dahi E. Charcoal Packed Furnace for Low-tech Charring of Bone. Proceedings of the 2nd International Workshop on Fluorosis and Defluoridation of Water, Nazreth, Ethiopia 1997
4. Bregnhøj H, Dahi E. Kinetics of Uptake of Fluoride on Bone Char in Batch. Proceedings of the 1st International Workshop on Fluorosis and Defluoridation of Water, Ngurdoto, Tanzania 1995
5. Bregnhøj H. Processes and Kinetics of Defluoridation of Drinking Water Using Bone Char. Ph.D. Thesis. IMT, DTU 1995
6. Bregnhøj H. Review of Practical Experiences with Control of Fluoride and Fluorosis through Community and/or Domestic Defluoridation in Rural Water Supply Programmes, Part 2, COWI Consulting 1998
7. Standard Methods for the Examination of Water and Wastewater, 20. edition, Clesceri, L.S. Greenberg, A.E. Eaton, A.D, Eds. American Public Health Association, Washington, DC, 1998.
8. World Health Organization. Guidelines for Drinking Water Quality, 2. edition, WHO, Geneva, 1996
9. Bregnhøj H, Dahi E, Jensen, M. Modelling Defluoridation of Water in Bone Char Columns. Proceedings of the 1st International Workshop on Fluorosis and Defluoridation of Water, Ngurdoto, Tanzania, 1995
10. Nomograph for Defluoridation of Water in Batch using Fish Bone Char
3rd International Workshop on Fluorosis Prevention and Defluoridation of Water 73
Nomograph for Defluoridation of Water in Batch using
Fish Bone Char
D S Bhargava*
India
SUMMARY: Based on literature data on laboratory studies on batch defluoridation of
water using fishbone charcoal, a nomograph is established. It concludes removal capacities
between 0.05 and 0.65 mg/g.
The nomograph can be used for handy estimation of dose of fish bone char and stirring time
required to defluoridate water containing up to 30 mgF/L down to acceptable level of 1.5
mg/L.
Key words: Defluoridation, nomograph, batch, fish bone char, removal capacity.
INTRODUCTION
In many parts of the world, particularly in the Indian and African regions, water contaminated with high concentrations of fluoride are the only source of drinking water. Internationally, a drinking water is not supposed to contain fluorides beyond a level of 1.5 mg/L. This limit is however, locally varied depending on the local situations, availability of alternatives, economy of the region, etc. For example, Indian standards limit a fluoride concentration of less than 1.0 mg/L, but in some African locations, a fluoride level of as high a concentration as 5 to 8 mg/L is forced upon the general public.
It is next to impossible to make treatment for fluoride removal at a municipal scale. It is however, possible to bring down a water’s fluoride level to acceptable levels for the field, domestic or isolated situations. Several materials have been used as adsorbents for fluoride removal. The treatment modes could include systems such as the batch1-
20, column21-22, counter-current23-39, etc.
This paper presents nomographs for determining the adsorbent dose and time of contact required for bringing down the level of fluoride concentration to less than 1.5 mg/L. The stated nomographs have been prepared on the basis of laboratory data collected during a batch mode of study for fluoride removal using indigenously prepared fishbone charcoal as the adsorbent material. The handy nomographs are conveniently used for instantly evaluating the series of steps necessary to handle waters containing fluoride of concentrations as high as 30 mg/L.
* Environmental Engineering and Pollution Control, Civil Engineering Dept. Rookee
University, India E-mail: [email protected]

74 Author: D S Bhargava
3rd Int. Workshop on Fluorosis Prevention and Defluoridation of Water ISFR, EnDeCo & ICOH
MATERIALS AND METHODS
Literature review. The methods for excess fluoride removal from waters include the adsorption, ion-exchange and precipitation methods employing various materials such as activated carbon, activated alumina, bone charcoals, phosphatic compounds, cation and anion exchangers, lime, alum, etc. The extensive works include those from Boruff 40, Smith and Smith 41, Maier 42-43, Savinelli and Black 44, Harmon and Kalichman 45, Rubel and Wooslay 46, Wu and Nitya 47, Hao and Huang 48, Weber 49, Dahi et al. 50, Bhargava 1-39, and many others. A comprehensive review was presented elsewhere 2,
3.
Charring of fishbone. The fishbone charcoal was prepared by carbonising the cleaned and pulverised fishbone in an electric furnace in a closed retort at 1000o C for 2 hours. The cooled material was sieved to get the required size(s). The bulk density and specific surface area of the material was determined to be 1.8 g/cm3 and 85 m2/g respectively. The material was thoroughly washed with distilled water, oven dried at 103o C, desiccated and stored in airtight containers.
Fluoride water. The test fluoride solutions of different initial fluoride concentrations were prepared by adding appropriate amounts of sodium fluoride to the tap water9. The various experimental runs were conducted at room temperature of 20 0C ± 2 0C with the test fluoride solution placed in glass beakers to which the different doses of the adsorbent material were added. The stirring in the beakers was done at 100 rpm (revolutions per minute) through the paddles of the jar test apparatus. The samples were collected at predetermined times and were analysed for residual fluoride concentration by Orion Ion Analyser Model 901 (M/S ORION Research Mfg. Co., USA) by using a specific ion electrode.
RESULTS
Observed data. For preparing the nomographs, the laboratory data 4, 7-9 has been selectively summarised in Table 1. The reported data pertain to the indicated values of temperature, pH, stirring rate, adsorbent size, and efficiency.
Preparation of nomograph. The batch treatment data available in Table 1 and the original sources of such data have been processed to establish relationships between the adsorbent dose and contact times in respect of the various initial fluoride concentration levels in the water that are reduced to a level of 1.5 mg/L or less. In situations where the initial fluoride concentration is extraordinarily high, similar relationships have been determined to bring down the fluoride level to indicated values, and the process can be repeated in one or more steps in series for achieving the final fluoride concentration at the desired acceptable level. The plots of these stated relationships in respect of the various initial fluoride concentrations make the nomograph as presented in Figure 1.
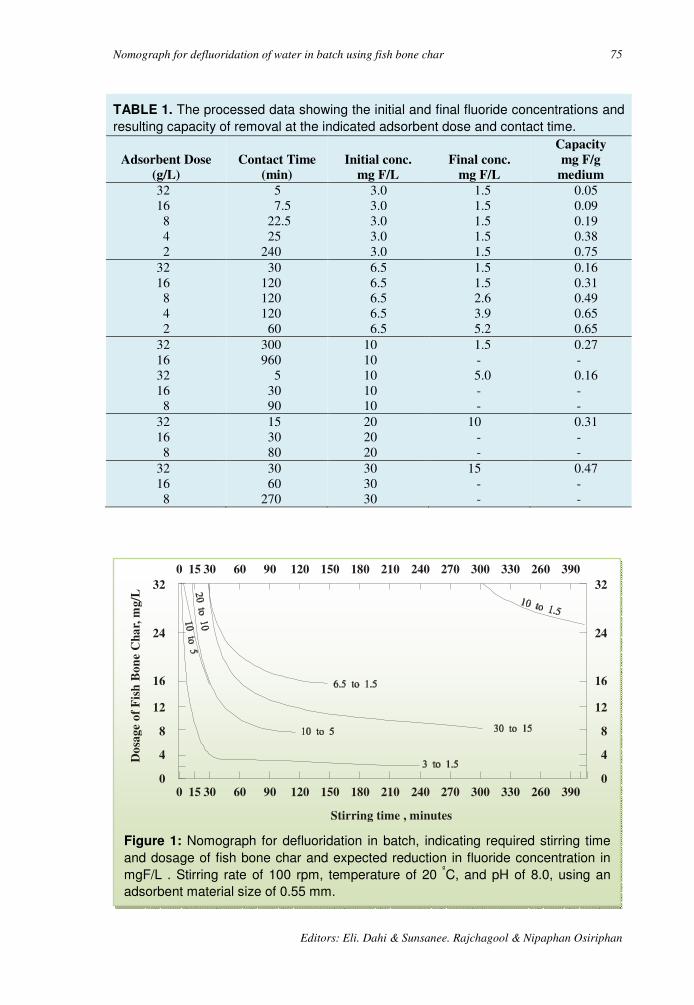
Nomograph for defluoridation of water in batch using fish bone char 75
Editors: Eli. Dahi & Sunsanee. Rajchagool & Nipaphan Osiriphan
TABLE 1. The processed data showing the initial and final fluoride concentrations and
resulting capacity of removal at the indicated adsorbent dose and contact time.
Adsorbent Dose
(g/L)
Contact Time
(min)
Initial conc.
mg F/L
Final conc.
mg F/L
Capacity
mg F/g
medium
32 16 8 4 2
5 7.5
22.5 25
240
3.0 3.0 3.0 3.0 3.0
1.5 1.5 1.5 1.5 1.5
0.05 0.09 0.19 0.38 0.75
32 16 8 4 2
30 120 120 120
60
6.5 6.5 6.5 6.5 6.5
1.5 1.5 2.6 3.9 5.2
0.16 0.31 0.49 0.65 0.65
32 16 32 16 8
300 960
5 30 90
10 10 10 10 10
1.5 - 5.0 - -
0.27 - 0.16 - -
32 16 8
15 30 80
20 20 20
10 - -
0.31 - -
32 16 8
30 60
270
30 30 30
15 - -
0.47 - -
Figure 1: Nomograph for defluoridation in batch, indicating required stirring time
and dosage of fish bone char and expected reduction in fluoride concentration in
mgF/L . Stirring rate of 100 rpm, temperature of 20 ºC, and pH of 8.0, using an
adsorbent material size of 0.55 mm.
00
4
8
12
16
24
32
0
4
8
12
16
24
32
15 30 60 90 120 150 180 210 240 270 300 330 260 390
0 15 30 60 90 120 150 180 210 240 270 300 330 260 390
Stirring time , minutes
Do
sag
e o
f F
ish
Bo
ne
Ch
ar,
mg
/L
76 Author: D S Bhargava
3rd Int. Workshop on Fluorosis Prevention and Defluoridation of Water ISFR, EnDeCo & ICOH
The nomograph have been constructed for an adsorbent material size of 0.55 mm (the geometric mean size of a mix varying between the sizes of 355 µ and 855µ) (the adsorption was found to increase with decreasing adsorbent sizes), temperature of
20 0C (the adsorption was found to increase with increasing temperatures), pH of 8.0 (the adsorption was found to increase with decreasing pH values) and the stirring rate of 100 rpm (revolutions per minute) (the adsorption was found to increase with increasing rates of stirring) 1-39.
DISCUSSION Practical applicability. The nomograph can appropriately be manipulated (inter- or extrapolated) for initial fluoride concentration values other than the indicated ones. The adsorbent dose can be easily worked out for an assumed convenient contact time in a given situation of the initial fluoride concentration. Similarly, the contact time for treatment can be worked out for an assumed allowable dose of the adsorbent. The nomographs are thus most useful in both the situations, that is, when the allowable time at hand is limited and also when only a limited total amount of the adsorbent material is readily available.
REFERENCES
1. Bhargava DS, Killedar DJ. Batch studies of water defluoridation using fishbone charcoal. Wat Polln Control Fed, USA, 1991; 63:848-58.
2. Killedar DJ, Bhargava DS. An overview of defluoridation methods (Part I). J Ins Pub Hlth Engrs, India, 1987; 1987:1-13.
3. Killedar DJ, Bhargava DS. An overview of defluoridation methods (Part II). J Ins Pub Hlth Engrs, India, 1988; 1988:37-44.
4. Killedar DJ, Bhargava DS. Feasibility of fluoride adsorption on bone charcoal. J Env Engg Div, Ins Engrs, India, 1990; 70:47-49.
5. Bhargava DS, Killedar DJ. Judgement of equilibrium time during adsorption – a rational approach. Ind J Env Hlth, 1991; 33:464-80.
6. Bhargava DS, Killedar DJ. Comparison of fluoride removal efficiencies of fishbone and animalbone charcoals. J Env Engg Div, Ins Engrs, India, 1991; 72:9-11.
7. Bhargava DS, Killedar DJ. Water defluoridation with fishbone charcoal. J Env Engg Div, Ins Engrs, India, 1993; 73:59-64.
8. Killedar DJ, Bhargava DS. Effects of stirring rate and temperature on fluoride removal by fishbone charcoal. Indian J Env Hlth, 1993; 35:81-7.
9. Bhargava DS, Killedar DJ. Relationship in fluoride adsorption on fishbone charcoal. Indian J Engg & Mat Sc, 1995; 2:157-62.
10. Sheldarkar SB, Shrihari S, Bhargava DS. Low cost phosphorous removal by TNSAC. Proceedings of the National Seminar on Environmental Pollution and Strategies for Pollution Control. 1991 Dec 29-31; Ujjain, India. Abst 32-34.

Nomograph for defluoridation of water in batch using fish bone char 77
Editors: Eli. Dahi & Sunsanee. Rajchagool & Nipaphan Osiriphan
11. Bhargava DS, Sheldarkar SB. Effects of adsorbent dose and size on phosphate removal from wastewaters. Envtl Polln, England, 1992; 76:51-60.
12. Bhargava DS, Sheldarkar SB. Use of TNSAC in phosphate adsorption studies and relationships. Literature,experimental methodology, justification and effects of process variables. Wat Res, UK, 1993; 27:303-12.
13. Bhargava DS, Sheldarkar SB. Use of TNSAC in phosphate adsorption studies and relationships. Effects of adsorption operating variables and related relationships. Wat Res, UK, 1993; 27:313-24.
14. Bhargava DS, Sheldarkar SB. Use of TNSAC in phosphate adsorption studies and relationships. Isotherm relationships and utility in the field. Wat Res, UK, 1993; 27:325-35.
15. Bhargava DS, Sheldarkar SB. Phosphate adsorption on the termind nutshell based activated carbon. J Env Engg Div, Ins Engrs, India, 1994; 75:1-6.
16. Gupta MS, Bhargava DS, Varshney BS. Removal of hexavalent chromium concentration (lower range) from industrial waste by adsorption. Proceedings of the National Seminar on Status and Growth Strategies of Chemical and Allied Industries. 1986 Dec 22-24, Lucknow, India; IV.61-4.
17. Gupta MS, Bhargava DS, Varshney BS. Removal of chromium through adsorption on sawdust. J Env Engg Div, Ins Engrs, India, 1987; 67:64-9.
18. Gupta MS, Bhargava DS. Removal of lead through adsorption on sawdusts of different woods. Res J Nat Soc Polln Free Env, Rampur, India, 1987; 1:14-9.
19. Gupta MS, Bhargava DS, Varshney BS. Removal of cadmium from wastes through adsorption on sawdust. J Env Engg Div, Ins Engrs, India, 1988; 68:69-72.
20. Bhargava DS, Gupta MS, Varshney BS. Use of sawdust for the adsorption of heavy metals. Asn Env, Philippines, 1987; 9:29-37.
21. Bhargava DS, Killedar DJ. Defluoridation and empirical models in column studies using fishbone charcoal. Indian J Engg & Mat Sc, 1997; 4:237-44.
22. Bhargava DS. Economical technology of fluoride removal using fishbone charcoal column at domestic level. Proceedings of the 2nd International Workshop on Fluorosis and Defluoridation of Water. 1997 Nov 19-25, Nazreth, Ethiopia, 118-22 (The International Society for Fluotride Research, Auckland, New Zealand).
23. Bhargava DS, Killedar DJ. Optimal sorbent mass input rates during adsorption in a moving mrdia reactor. Wat Res, UK, 1991; 25:953-8.
24. Bhargava DS, Killedar DJ. Fluoride adsorption on fishbone charcoal through moving media adsorber. Wat Res, UK, 1992; 26:781-8.
25. Bhargava DS, Killedar DJ. Effect of variation in sorbate f;ow rate and sorbate concentration on fluoride removal by fishbone charcoal in a moving media reactor. J Env Engg Div, Ins Engrs, India, 1992; 73:11-4.
26. Bhargava DS, Killedar DJ. Effect of sorbent mass-input rate on fluoride removal by fishbone charcoal in a moving media reactor. J Ins Engrs, India, Env Engg Div, 1994; 75:13-6.
27. Bhargava DS. Optimum operation of counter-current water defluoridation system. Proceedings of the 1st International Workshop on Fluorosis and Defluoridation of Water. 1995 Oct 18-22, Ngurdoto, Tanzania, 50-4 (The International Society for Fluoride Research, Auckland, New Zealand).

78 Author: D S Bhargava
3rd Int. Workshop on Fluorosis Prevention and Defluoridation of Water ISFR, EnDeCo & ICOH
28. Bhatt DJ, Bhargava DS, Panesar PS. Removal of phenol in moving media reator. Proceedings of the International Symposium on Water Resources Conservation Pollution and Abatement. 1981 Dec 11-13, Roorkee,India, 311-8.
29. Bhatt DJ, Bhargava DS, Panesar PS. Physico chemical treatment for phenol removal in heavily polluted effluents. J Ins Pub Hlth Engrs, India, 1981; 1981:437-45.
30. Bhatt DJ, Bhargava DS, Panesar PS. Sorbent size and sorbate input rates variation in a moving media reactor. J Env Engg Div, Ins Engrs, India, 1982; 63:33-5.
31. Bhatt DJ, Bhargava DS, Panesar PS. Full utilization of sorbent capacity in a moving media reactor. J Inst Pub Hlth Engrs, India, 1982; 1982:61-4.
32. Bhatt DJ, Bhargava DS, Panesar PS. Treatment of low concentration phenolic wastes in a moving media reactor. J Env Engg Div, Ins Engrs, India, 1983, 63:74-7.
33. Bhargava DS, Bhatt DJ, Panesar PS. Isotherm for moving media reactor. J Env Engg Div, Am Soc Civ Engrs, 1983, 109:369-82.
34. Bhatt DJ, Bhargava DS, Panesar PS. Effect of pH on phenol removal in moving media reactors. Indian J Env Hlth, 1983; 25:261-7.
35. Bhatt DJ, Bhargava DS, Panesar PS. Comparative study of static and dynamic (moving media reator) system of phenol adsorption. J Env Engg Div, Ins Engrs, India, 1984; 64:67-9.
36. Bhatt DJ, Bhargava DS, Panesar PS. Effect of the ratio of reactor diameter to particle size on the performance of a moving media reactor. Asn Env, Philippines, 1984; 6:21-3.
37. Bhargava DS, Bhatt DJ. Model for moving media reactor performance. J Env Engg, Am Soc Civ Engrs, 1985; 111:618-33.
38. Bhatt DJ, Bhargava DS, Panesar PS. Comparative performance of activated carbon v/s charcoal for phenol removal in a moving media reactor. J Ins Pub Hlth Engrs, India, 1985; 1985:78-82.
39. Bhatt DJ, Bhargava DS, Panesar PS. Removal of phenol from a refinery waste. Proceedings of the National Seminar on Pollution Control of Industrial Effluents. 1987 Jan 16-18, Morbi (Gujrat), India, 179-87.
40. Boruff CS. Removal of fluoride for drinking water. Ind Engg Chem, 1934; 26:69-73.
41. Smith HV, Smith MC. Bone contact removes fluorine. Wat Wks Engg, 1937; 90:600-7.
42. Maier FJ. Methods of removing fluorides from water. Am J Pub Hlth, 1947; 37:1559-67.
43. Maier FJ. Defluoridation of municipal water supplies. J Am Wat Wks Assn, 1953; 45:879-83.
44. Savinelli, Black. Defluoridation of water with activated alumina. J Am Wat Wks Assn, 1958; 50:33-8.
45. Harmon JA, Kalichman SC. Defluoridation of drinking water in Southern California. J Am Wat Wks Assn, 1965; 57:245-51.
46. Rubel, Woosley. The removal of excess fluoride from drinking water by activated alumina. J Am Wat Wks Assn,. 1979; 71:45-52.
47. Wu YC, Nitya A. Water defluoridation with activated alumina. J Env Engg Div, Am Soc Civ Engrs, 1979; 105:357-68.
Nomograph for defluoridation of water in batch using fish bone char 79
Editors: Eli. Dahi & Sunsanee. Rajchagool & Nipaphan Osiriphan
48. Hao OJ, Huang CP. Adsorption characteristics of fluoride onto hydrous alumina. J Env Engg Div, Am Soc Civ Engrs, 1986; 112:1054-68.
49. Weber WJ. Physico-chemical processes for water quality control. Wiley-Interscience, New York, 1972.
50. Dahi E, Bregnhoj H, Orio L. Sorption isotherms of fluoride on flocculated alum. Proceedings of the 1st International Workshop on Fluorosis and Defluoridation of Water. 1995 Oct 18-22, Ngurdoto, Tanzania, 35-9 (The International Society for Fluoride Research, New Zealand).
80 3rd International Workshop on Fluorosis Prevention and Defluoridation of Water
Comparative Study of Fluoride Sorption Behaviour on
Activated Carbon and Bone Char
R Watanesk and S Watanesk* Chiang Mai, Thailand.
SUMMARY : Sorption behaviour of fluoride on acid washed activated carbon and deionised
water washed bone char were comparatively studied in laboratory batch experiments. The
experimental conditions for sorption were determined by varying the pH in the range of 3-8
and the take-up times. Both activated carbon and bone char seem to exhibit sorption
behaviour independent of pH within the range 3-8. The observed saturation time was found
to be 15 minutes for activated carbon, while the bone char was not at saturation even after 5
hours of contact time. At initial concentration levels of up to 1.6 mg F/L the fluoride removal
is almost proportional to the dosage of sorbents. The obtained removal capacities were 0.1
and 0.4 mg/g respectively.
Key words: Activated carbon, bone char, fluoride, sorption, batch experiment.
INTRODUCTION
In general, substances with high porosity characteristics e.g. activated carbon, silica gel etc. have been used as sorbents for trapping other substances in various states. The efficiency of sorption has been widely investigated via measuring the up-taken sorbate left in solution through various techniques 1-4. Defluoridation of water using activated alumina as a sorbent is one of sorption processes that has been used in many countries 5, while in Thailand trapping of trace pollutants from water has been done by filtering water through the activated carbon. In this work, comparative study of fluoride sorption behaviour on activated carbon and bone char were carried out for the aim of substituting bone char, a low cost and a common material from animals, to activated carbon for defluoridation of natural water for daily use in some fluorotic areas.
MATERIALS AND METHODS
All chemicals used were of analytical grade. Stock solution of 10.0 mg/L NaF was prepared in deionised water. The SPADNS, a colour-forming reagent was used for light absorption measurement 6. Activated carbon and bone char were obtained from Carbokarn Company, Bangkok and the Intercountry Centre of Oral Health, ICOH, Chiang Mai, Thailand, respectively.
* Department of Chemistry, Faculty of Science, Chiang Mai University, Chiang Mai 50200, Thailand. E-mail address : [email protected]

Comparative study of fluoride sorption behaviour on activated carbon and bone char
Editors: Eli. Dahi & Sunsanee. Rajchagool & Nipaphan Osiriphan
FIGURE 1
remaining in the solution after being
by activated carbon (AC) and bone char
(BC) at various times.
sorbent/L.
The study of fluoride sorption behaviour was carried out on acid washed (6 M) activated carbon and deionised water washed bone char. The experimental conditions such as the saturation time and the pH that affectinvestigated by measuring the concentration of the residual fluoride spectrophotometrically (UV/VIS spectrophotometer; Hitachi Model Uby potentiometric measurement with fluoride ioncombined electrode; Cole-Parmer Model 27502the range of 3-8 for the fluoride solution before equilibration was done by using acetic acid and ammonia. The fluoride sorption behaviour on activated carbon and bone char were then investigated by equilibrating 0.100 g of each sorbent in 50 mL NaF solutions ranging from 0.2-1.6 mg/L at the selected condition. The grain sizes of both activated carbon and bone char were in the range of 0.3-1 mm. The equilibration was normally done in a series of conical flask containing the reaction mixture. After an appropriate equilibrating time, the solution was then filtered and the residual fluoride concentration was determined.
RESULTS
After 0.100 g of each sorbent was separately equilibrated with 50 mL of 1.20 mg/L NaF solution at different periods of time, the residual fluoride concentration was determined. The reduction of fluoride in the solution as a function of time was shown in Figure 1. The effect of pH on the fluoride sorption by both sorbents were monitored. The result presented in Figure 2 sorbents was independent on pH. The pH of 7.5 was selected for the sorption study. Then 0.100 g each of activated carbon and bone char was equilibrated with 50 mL of NaF solution at different initial concentrationsrespectively. The amount of fluoride sorbed in milligram per gram of sorbent was then plotted against the initial concentration of fluoride as in Figure 3.
Comparative study of fluoride sorption behaviour on activated carbon and bone char 81
Editors: Eli. Dahi & Sunsanee. Rajchagool & Nipaphan Osiriphan
FIGURE 1. Concentration of fluoride
remaining in the solution after being sorbed
by activated carbon (AC) and bone char
(BC) at various times. Dosage = 2.0 g
sorbent/L.
0.0
0.2
0.4
0.6
0.8
1.0
1.2
1.4
0 1 2 3 4 5 6 7Time (hrs)
AC
BC
A
The study of fluoride sorption behaviour was carried out on acid washed (6 M) activated carbon and deionised water washed bone char. The experimental conditions such as the saturation time and the pH that affected the sorption of fluoride were investigated by measuring the concentration of the residual fluoride spectrophoto-metrically (UV/VIS spectrophotometer; Hitachi Model U-2000, Japan) and confirmed by potentiometric measurement with fluoride ion-selective electrode (Fluoride
Parmer Model 27502-19, U.S.A.). The pH adjustment in
residual fluoride concentration was determined.
RESULTS
After 0.100 g of each sorbent was separately equilibrated with 50 mL of 1.20 mg/L of time, the residual fluoride concentration was
determined. The reduction of fluoride in the solution as a function of time was shown in Figure 1. The effect of pH on the fluoride sorption by both sorbents were monitored. The result presented in Figure 2 showed that the fluoride sorption on both sorbents was independent on pH. The pH of 7.5 was selected for the sorption study. Then 0.100 g each of activated carbon and bone char was equilibrated with 50 mL of NaF solution at different initial concentrations for 15 minutes and 5 hours, respectively. The amount of fluoride sorbed in milligram per gram of sorbent was then plotted against the initial concentration of fluoride as in Figure 3.

82 S Watanesk &R Watanesk
3rd Int. Workshop on Fluorosis Prevention and Defluoridation of Water ISFR, EnDeCo & ICOH
FIGURE 2. The residual fluoride
concentration in the solution as a function of
controlled pH after being sorbed by each
sorbent. Initial concentration = 1.0 mg F/L.
Dosage 2.0 g/L.
0.0
0.2
0.4
0.6
0.8
1.0
1.2
3 4 5 6 7 8 9
mg F/L
pH
AC
BC
FIGURE 3. The amount of fluoride sorbed on each sorbent at different initial concentrations. Contact time = 15 minutes for AC and 5 hrs. for BC. Dosage = 2 g sorbent /L.
-0.1
0.0
0.1
0.2
0.3
0.4
0.5
0.6
0.2 0.4 0.6 0.8 1 1.2 1.4 1.6
Initial concentration, mg/L
AC
BC
mg F/g sorbent
DISCUSSION
From the study of fluoride sorption behaviour on activated carbon and bone char, the amount of fluoride left in solution after equilibrating 0.100 g of each sorbent separately in 50.0 mL of 1.0 mg/L NaF solution at various times were determined spectrophotometrically. For the activated carbon the sorption at about 15 minutes was sufficient to obtain equilibrium, whereas in case of bone char the sorption was found to continue changing without reaching saturation even at 5 hrs. of contact time. The difference between these sorption behaviours could be rationalised simply due to the fact that bone char possessed more cavities inside the structure. In such case these pores would allow fluoride ions to wander in by diffusion. The greater the amounts of the pores present, the longer time for sorption that occurred inside the cavities would take place.Figure 2 revealed the effect of pH on the fluoride sorption measured spectrophotometrically and potentiometrically. In case of the spectrophotometric method, the colour arises from Zr-SPADNS complex formation. The presence of fluoride would fade out the colour through the competitive formation of Zr-F complex. Therefore, the fading of the colour would indicate, for both sorbents, the amount of fluoride present in the solution. In case of activated carbon, the removal of fluoride
Comparative study of fluoride sorption behaviour on activated carbon and bone char 83
Editors: Eli. Dahi & Sunsanee. Rajchagool & Nipaphan Osiriphan
from the solution occurred simply by physisorption. No matter what forms of fluoride present at the pH studied, the sorption would depend only on the availability of the active sites. Therefore, the amount of fluoride being sorbed on the activated carbon is independent of the pH of solution. But in case of bone char, because the removal of fluoride is often believed to be an ion exchange process 7, the fluoride must be in an anionic form. However, at pH in the range of 3-5, the amount of residual fluoride tended to decrease slightly due to the molecular HF form that existed at the low pH began to dissociate. Considering the pKa value of 3.17 for HF; at pH above 5, the dissociation of HF would lead the ion exchange process to proceed and the decrease of fluoride in the solution caused the absorbance to increase. Nevertheless, the pH effect on fluoride sorption studied by potential measurement only showed slightly noticeable change in the sorption also with the bone char. So, the maximum sorption of fluoride was found to occur at the working pH in the region of pH 7-8. The sorption behaviour of fluoride, at room temperature, on activated carbon and bone char were studied through the potential measurement of fluoride solution after equilibrating each sorbent in various concentrations of NaF solutions at the optimal condition. It was observed from Figure 3 that fluoride sorption on activated carbon reached a certain degree of saturation if the initial fluoride concentration was higher than 0.8 mg/L, whereas the sorption on bone char was not conclusive to be a monolayer type. However, the amount of sorbed fluoride on activated carbon was found from this Figure to be about five times to that of bone char at the initial concentration of 1.6 mg/L fluoride solution.
ACKNOWLEDGEMENT This work was partly funded by the Faculty of Science, Chiang Mai University under the Surface Modification and Colloids Research Laboratory. Thanks also for the Intercountry Centre of Oral Health, Chiang Mai, Thailand, for providing bone char used in this research.
REFERENCES 1. Lu HB, Campbell CT, Graham DJ, Ratner B. Anal Chem. 2000; 72: 2886-2894. 2. Cheung CW. Sepn Pur Technol. 2000; 19: 55-64. 3. Kerdpin U, Arquero O, Watanesk R, Sriyotha UJ Sci Soc Thailand 1998;24:73-80. 4. Monks CD, Nacapricha D, Taylor CG. Analyst 1993; 118: 623. 5. Karthikeyan G, Apparao BV, Meenakshi S. In: Dahi E and Neilsen JM, editors.
The International Society for Fluoride Research. Proceedings of the 2nd International Workshop on Fluorosis and Defluoridation of Water; 1997 Nov 19-22; Nazreth, Ethiopia; Dunedin: New Zealand; 1998.
6. Bellack E, Schouboe PJ. Anal Chem 1958; 30: 2032-2034. 7. Williams RAD, Elliott JCE. Basic and Applied Dental Biochemistry. 2nd ed.
Longman: Singapore; 1989.
3rd International Workshop on Fluorosis Prevention and Defluoridation of Water 84
Sorption Study for Defluoridation by Bone Char
S Watanesk* and R. Watanesk Chiang Mai, Thailand.
SUMMARY: The sorption of fluoride by bone char for defluoridation purpose was studied
in laboratory batch experiments. The sorption isotherm at a low concentration range of
fluoride tended to be a momentarily sorption type. In addition, the sorption of fluoride was
found not to increase significantly with the increase in temperature. Some ions such as
halide and alkali posed only no or slight effect on the sorption of fluoride but calcium ion
did probably due to precipitation of calcium fluoride. The defluoridation of 10-13 mg
fluoride/L water samples from the districts of San Kamphaeng and Fang in Chiang Mai,
was attempted by single batch equilibration treatment. The fluoride level could be reduced
with the efficiency of about 65 % after equilibrating with 0.100 g of bone char at pH 7 for 9
hours.
Key words: Bone char, defluoridation, fluoride sorption, batch experiment, Thailand.
INTRODUCTION
Bone char has been widely used for various purposes in many industries i.e. the discoloration and refining of sugar, making pottery and glass and also in cleaning jewellery. Due to the porous structure of bone char with specific area of about 600-1,000 m2 g-1, this characteristic makes bone char be a good sorbent. In Thailand and elsewhere also, bone char has been used to reduce the level of fluoride in drinking water. Defluoridation of water has also been investigated by various methods such as electrocoagulation1, dialysis2, coprecipitation3, etc. The characteristics of bone char related to the efficacy of fluoride removal was also carried out by x-ray diffraction and infrared absorption spectroscopy4.
In this work, sorption study of fluoride on bone char was reconfirmed and the effects of temperature and coexisting ions on the sorption were investigated. Single batch equilibration treatment for defluoridation of highly fluoridated water from some natural sources in Chiang Mai Province was then followed at the optimum sorption condition.
MATERIALS AND METHODS
All chemicals used were of analytical grade. Stock solution of 1000 mg/L NaF was prepared in de-ionised water. Bone char, obtained from the Intercountry Centre of Oral Health, ICOH, Chiang Mai, Thailand, was crushed and sieved to the range of 20-50 mesh (0.3 – 1 mm).
* Department of Chemistry, Faculty of Science, Chiang Mai University, Chiang Mai 50200, Thailand. E-mail address : [email protected]
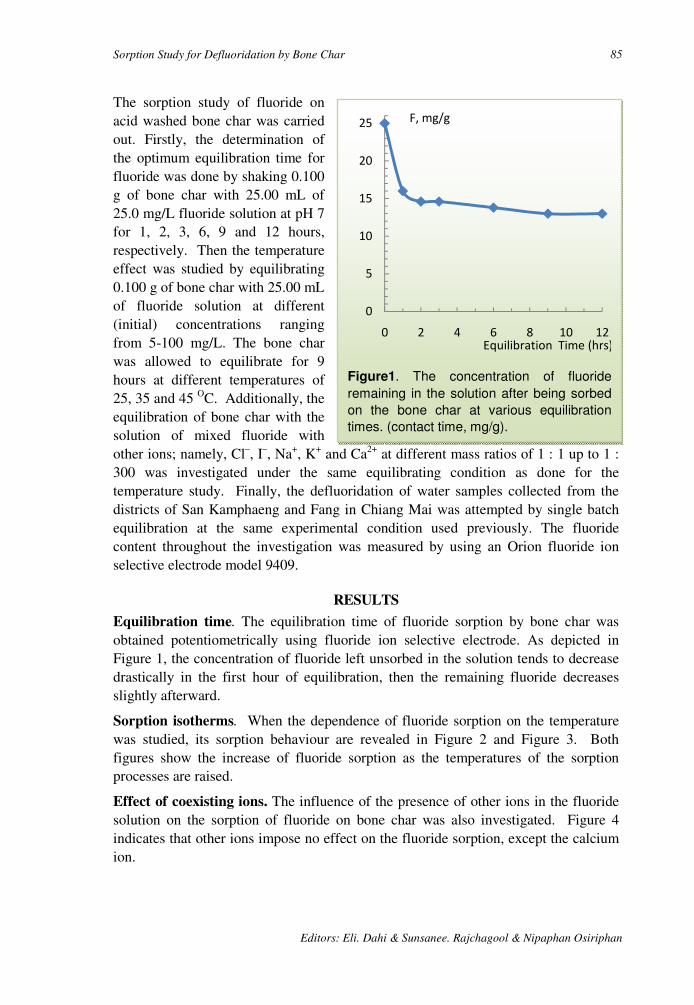
Sorption Study for Defluoridation by Bone Char 85
Editors: Eli. Dahi & Sunsanee. Rajchagool & Nipaphan Osiriphan
Figure1. The concentration of fluoride
remaining in the solution after being sorbed
on the bone char at various equilibration
times. (contact time, mg/g).
0
5
10
15
20
25
0 2 4 6 8 10 12Equilibration Time (hrs)
F, mg/g
The sorption study of fluoride on acid washed bone char was carried out. Firstly, the determination of the optimum equilibration time for fluoride was done by shaking 0.100 g of bone char with 25.00 mL of 25.0 mg/L fluoride solution at pH 7 for 1, 2, 3, 6, 9 and 12 hours, respectively. Then the temperature effect was studied by equilibrating 0.100 g of bone char with 25.00 mL of fluoride solution at different (initial) concentrations ranging from 5-100 mg/L. The bone char was allowed to equilibrate for 9 hours at different temperatures of 25, 35 and 45 OC. Additionally, the equilibration of bone char with the solution of mixed fluoride with other ions; namely, Cl–, I–, Na+, K+ and Ca2+ at different mass ratios of 1 : 1 up to 1 : 300 was investigated under the same equilibrating condition as done for the temperature study. Finally, the defluoridation of water samples collected from the districts of San Kamphaeng and Fang in Chiang Mai was attempted by single batch equilibration at the same experimental condition used previously. The fluoride content throughout the investigation was measured by using an Orion fluoride ion selective electrode model 9409.
RESULTS
Equilibration time. The equilibration time of fluoride sorption by bone char was obtained potentiometrically using fluoride ion selective electrode. As depicted in Figure 1, the concentration of fluoride left unsorbed in the solution tends to decrease drastically in the first hour of equilibration, then the remaining fluoride decreases slightly afterward.
Sorption isotherms. When the dependence of fluoride sorption on the temperature was studied, its sorption behaviour are revealed in Figure 2 and Figure 3. Both figures show the increase of fluoride sorption as the temperatures of the sorption processes are raised.
Effect of coexisting ions. The influence of the presence of other ions in the fluoride solution on the sorption of fluoride on bone char was also investigated. Figure 4 indicates that other ions impose no effect on the fluoride sorption, except the calcium ion.
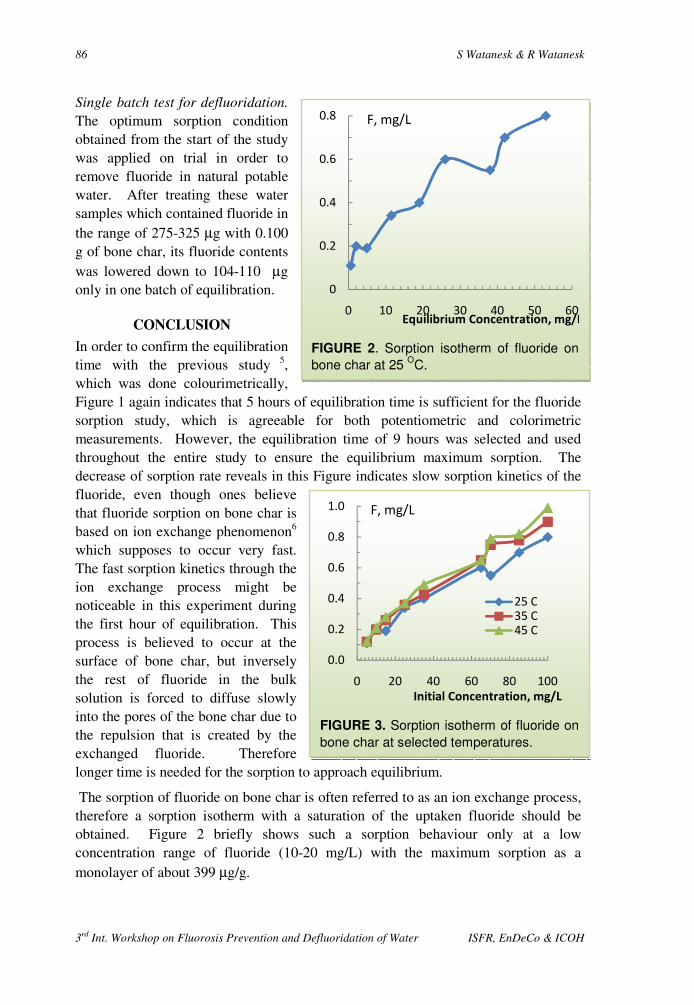
86 S Watanesk & R Watanesk
3rd Int. Workshop on Fluorosis Prevention and Defluoridation of Water ISFR, EnDeCo & ICOH
FIGURE 2. Sorption isotherm of fluoride on
bone char at 25 OC.
0
0.2
0.4
0.6
0.8
0 10 20 30 40 50 60Equilibrium Concentration, mg/L
F, mg/L
FIGURE 3. Sorption isotherm of fluoride on
bone char at selected temperatures.
0.0
0.2
0.4
0.6
0.8
1.0
0 20 40 60 80 100
Initial Concentration, mg/L
25 C35 C45 C
F, mg/L
Single batch test for defluoridation. The optimum sorption condition obtained from the start of the study was applied on trial in order to remove fluoride in natural potable water. After treating these water samples which contained fluoride in the range of 275-325 µg with 0.100 g of bone char, its fluoride contents was lowered down to 104-110 µg only in one batch of equilibration.
CONCLUSION
In order to confirm the equilibration time with the previous study 5, which was done colourimetrically, Figure 1 again indicates that 5 hours of equilibration time is sufficient for the fluoride sorption study, which is agreeable for both potentiometric and colorimetric measurements. However, the equilibration time of 9 hours was selected and used throughout the entire study to ensure the equilibrium maximum sorption. The decrease of sorption rate reveals in this Figure indicates slow sorption kinetics of the fluoride, even though ones believe that fluoride sorption on bone char is based on ion exchange phenomenon6 which supposes to occur very fast. The fast sorption kinetics through the ion exchange process might be noticeable in this experiment during the first hour of equilibration. This process is believed to occur at the surface of bone char, but inversely the rest of fluoride in the bulk solution is forced to diffuse slowly into the pores of the bone char due to the repulsion that is created by the exchanged fluoride. Therefore longer time is needed for the sorption to approach equilibrium.
The sorption of fluoride on bone char is often referred to as an ion exchange process, therefore a sorption isotherm with a saturation of the uptaken fluoride should be obtained. Figure 2 briefly shows such a sorption behaviour only at a low concentration range of fluoride (10-20 mg/L) with the maximum sorption as a monolayer of about 399 µg/g.
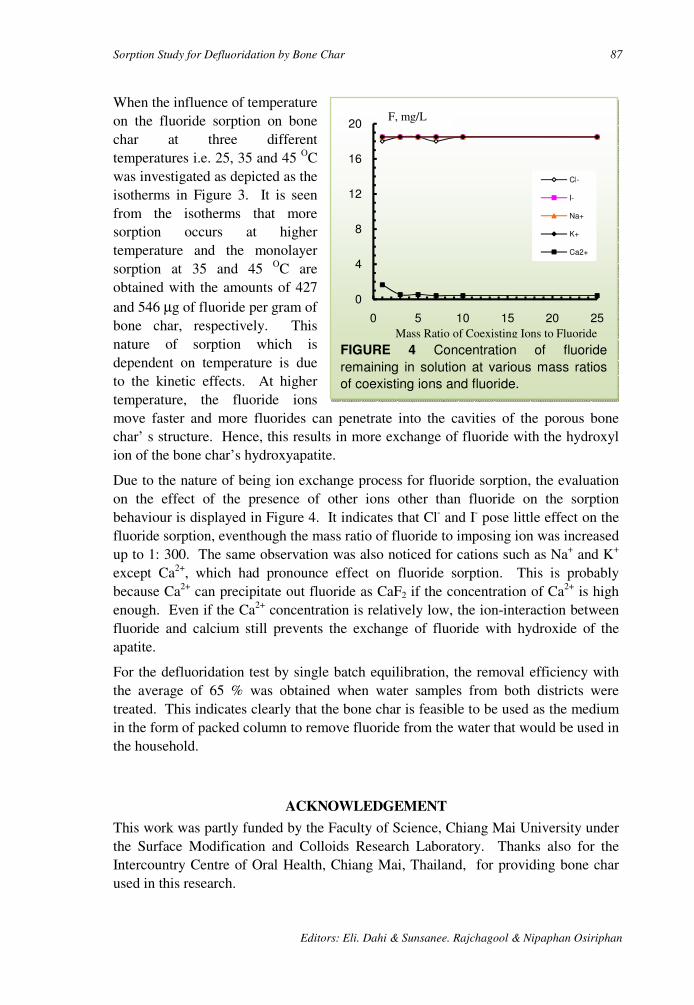
Sorption Study for Defluoridation by Bone Char 87
Editors: Eli. Dahi & Sunsanee. Rajchagool & Nipaphan Osiriphan
FIGURE 4 Concentration of fluoride
remaining in solution at various mass ratios
of coexisting ions and fluoride.
0
4
8
12
16
20
0 5 10 15 20 25
Cl-
I-
Na+
K+
Ca2+
Mass Ratio of Coexisting Ions to Fluoride
When the influence of temperature on the fluoride sorption on bone char at three different temperatures i.e. 25, 35 and 45 OC was investigated as depicted as the isotherms in Figure 3. It is seen from the isotherms that more sorption occurs at higher temperature and the monolayer sorption at 35 and 45 OC are obtained with the amounts of 427 and 546 µg of fluoride per gram of bone char, respectively. This nature of sorption which is dependent on temperature is due to the kinetic effects. At higher temperature, the fluoride ions move faster and more fluorides can penetrate into the cavities of the porous bone char’ s structure. Hence, this results in more exchange of fluoride with the hydroxyl ion of the bone char’s hydroxyapatite.
Due to the nature of being ion exchange process for fluoride sorption, the evaluation on the effect of the presence of other ions other than fluoride on the sorption behaviour is displayed in Figure 4. It indicates that Cl- and I- pose little effect on the fluoride sorption, eventhough the mass ratio of fluoride to imposing ion was increased up to 1: 300. The same observation was also noticed for cations such as Na+ and K+ except Ca2+, which had pronounce effect on fluoride sorption. This is probably because Ca2+ can precipitate out fluoride as CaF2 if the concentration of Ca2+ is high enough. Even if the Ca2+ concentration is relatively low, the ion-interaction between fluoride and calcium still prevents the exchange of fluoride with hydroxide of the apatite.
For the defluoridation test by single batch equilibration, the removal efficiency with the average of 65 % was obtained when water samples from both districts were treated. This indicates clearly that the bone char is feasible to be used as the medium in the form of packed column to remove fluoride from the water that would be used in the household.
ACKNOWLEDGEMENT
This work was partly funded by the Faculty of Science, Chiang Mai University under the Surface Modification and Colloids Research Laboratory. Thanks also for the Intercountry Centre of Oral Health, Chiang Mai, Thailand, for providing bone char used in this research.
F, mg/L

88 S Watanesk & R Watanesk
3rd Int. Workshop on Fluorosis Prevention and Defluoridation of Water ISFR, EnDeCo & ICOH
REFERENCES
1. Mameri N, Yeddou AR, Lounici H, Belhocine D, Grib H, Bariou B. Water Research 1998; 32: 1604-1612.
2. Hichor M, Persin, F, Molenat J, Sandeaux J, Gavach C. Sepn Pur Technol. 1999; 18: 1-11.
3. He JL, Cao SR. Fluoride. 1996; 29: 212. 4. Phantumvanit P, LeGeros RZ. Fluoride. 1997; 30(4): 207-218. 5. Watanesk R, Watanesk S. In Proceedings of 3rd International Workshop on
Fluorosis and Defluoridation of Water, Chiang Mai, Thailand, November 20-24, 2000 (in press).
6. Dahi E. State of Art of Defluoridation of Water. Environmental Development Cooperation: Soborg; 1998.

89
Editors: Eli Dahi, Sunsanee Rajchagool & Nipaphan Osiriphan
SESSION 3:
FIELD DEFLUORIDATION & MANAGEMENT

90
3rd Int. Workshop on Fluorosis Prevention and Defluoridation of Water ISFR, EnDeCo & ICOH

3rd International Workshop on Fluorosis Prevention and Defluoridation of Water 91
Effectiveness of Domestic Defluoridator in Preventing
Fluorosis in Kekirawa, Sri Lanka
J. P. Padmasiri * Sri Lanka
SUMMARY: Low cost domestic defluoridators based on freshly burnt brick chips as a
sorption medium were distributed to 25 households having fluoride rich water in their wells
in 1994-1995. The beneficiaries were belonging to middle class income group consisting of
farmers, teachers and office workers. The fluoride removal and the occurrence of the
fluorosis were monitored for about five years, up to 1999-2000.
During this period the fluoride levels in wells was 2.14 mg F /L. The treated water contained
1.20 mg F/L. The defluoridators thus were operated with an average removal efficiency of
57 %.
In 1994 17 children in the households were having mottled teeth. In 1999-2000 15 children in
the households got permanent teeth. None of these children had dental fluorosis. It is
discussed that his is an indicator of effectiveness of the program in preventing dental
fluorosis.
Key words: Domestic defluoridator, brick chips, Sri Lanka, sorption, clay, preventing fluorosis, permanent teeth.
INTRODUCTION
A survey of April 1994, carried out in Kekirawa, North Central Province, Sri Lanka, revealed that the village Olukradagama had fluoride rich wells, cf. Figure 1. The highest fluoride content of 3.5 mg/L was found in the well at Olukaradagama Vidyalaya. In the two hand-pump wells in the village the fluoride contents were 2.4 and 1.2 mg/L. In addition nearly 60 percent of the children of the age group of 10-18 years attending this school had ugly stained teeth. There was a well with a fluoride content of 5.1 mg/L in the village Thibbatuwewa, at the border of Olukarada village. Taking into consideration the above facts 25 low cost domestic defluoridators, described in details in a previous publications 1-3, were introduced in to this village in 1994 - 1995. The beneficiaries were farmers, teachers, clerks, drivers, soldiers etc. with different educational backgrounds. In this village most of the mothers of 20-30 years age group had dental fluorosis.
METHODOLOGY
* National Water Supply and Drainage Board, Sri Lanka E-mail: [email protected]

92 Author: J. P. Padmasiri
3rd Int. Workshop on Fluorosis Prevention and Defluoridation of Water ISFR, EnDeCo & ICOH
Selection of beneficiaries. The domestic defluoridators were prepared locally and given to households with wells having fluoride content of more than 1.0 mg/L. In addition households having children of 0-3 years age were given priority. The filter medium utilised was freshly burnt broken pieces of bricks of sizes 10-15 mm. The bricks were available in the village more freely due to construction of the houses. Several awareness programmes were carried out to educate villagers to operate and maintain the filters.
Sample collection. The households were requested to collect two sets of water samples, untreated water and water from the outlet of the filter, in plastic bottles. The sample bottles were provided to the households on weekly basis. A record book was maintained in each household indicating the dates of collection of water samples. Staff from the National Water Supply and Drainage Board staff visited the households once a month in the first year of operation of the filters. Subsequently in the second and third years of operation the households were visited once every three months. Finely they were visited once every half-year in the fourth and fifth years.
Fluoride analysis. The samples were collected in acid washed plastic bottles. A programmable spectrophotometer, DR/2000, was used in determination of the fluoride concentrations using the SPANDS reagent. Occasionally some of the results were cross-checked with fluoride ion specific electrode available at the Biochemistry Department of the Faculty of Medicine, University of Peradeniya.
RESULTS
Table 1 shows a list of the monitored households in Kekirawa who used the filter units for more than five years. The table indicates the filters' operational performances. Table 2 shows the occurrence of dental fluorosis in families in 1994 and 2000.
DISCUSSION
From Table 1 it can be seen that most of the households changed the filter medium in time while some took their own time to do so. On an average the brick chips filters removed 1.22 mg /L of the household drinking water. This is corresponding to about 57 % removal of the raw water fluoride.
At the beginning 1994 - 1998 the operations of the filters were carried out systematically but in later years 1999 - 2000 the operations were unsatisfactory. There are various reasons given by them such as difficulty in obtaining bricks, damaged to the outlet pipe of the filter, other sicknesses in the household, due to curtailing of our visits etc. The maintenance problem of the filters was related to the damage to the outlet pipe. On their own they never made an attempt to repair it although it was a very easy job. They always wait for our arrivals to get it repaired. The fluoride content of the filtered water of these units was good and kept below 1.0 mg/L as shown in Table 1. On several occasions the fluoride content has gone above 1.0 mg/L due to delayed action of the changing the filter medium by the beneficiaries.

Effectiveness of domestic defluoridator in preventing fluorosis in Kekirawa, Sri Lanka 93
Editors: Eli. Dahi & Sunsanee. Rajchagool & Nipaphan Osiriphan
TABLE 1. Average fluoride concentrations of the raw water and the defluoridator water No Average fluoride content of the well (mg/L) Treated water, mg F /L
1994 1995 1996 1997 1998 1999 2000 1994 1995 1996 1997 1998 1999 2000
1 2.28 2.95 2.91 2.24 2.21 2.45 2.61 1.08 0.93 1.42 1.60 1.30 1.41 1.50
5 2.40 1.76 2.95 2.42 2.16 - - 1.00 0.85 1.49 1.21 1.10 - -
10 1.54 1.63 1.70 1.55 1.30 1.45 - 0.69 0.63 0.73 0.44 0.62 0.52 -
11 2.10 1.72 1.91 1.92 1.65 1.85 2.05 0.95 1.00 1.20 1.50 1.00 0.80 1.30
12 1.95 1.75 1.70 1.86 1.90 1.80 - 1.00 0.85 0.50 0.60 0.80 0.75 -
13 2.25 1.48 1.50 1.25 1.45 1.50 - 0.85 0.70 0.75 0.81 0.75 0.60 -
14 1.64 1.42 2.18 1.72 1.68 1.82 - 0.75 0.82 0.90 0.95 0.50 0.85 -
15 1.44 1.15 1.72 2.06 2.18 1.98 - 0.78 0.43 1.20 0.97 1.16 1.20 -
20 2.42 2.06 1.52 1.60 1.52 1.80 - 1.20 1.08 0.84 0.97 0.87 0.78 -
21 1.96 1.93 1.92 1.95 1.50 1.85 - 0.86 0.72 0.64 0.87 0.95 0.90 -
26 2.22 1.74 2.05 1.86 1.25 1.62 - 1.18 0.63 1.27 1.40 1.00 1.10 -
42 4.78 4.25 4.20 2.84 3.35 3.80 4.10 0.85 0.99 1.35 1.00 1.20 1.15 1.20
44 2.90 0.75 2.25 1.23 1.80 2.60 2.70 0.45 0.40 0.70 0.35 0.62 1.00 0.85
60 - 2.43 2.90 2.22 2.37 2.48 - - 0.72 0.85 0.47 0.85 1.00 -
74 - 1.65 2.24 2.42 1.80 1.85 1.95 - 0.75 1.20 0.50 0.70 0.65 0.80
In 1994, when the filter units were issued, most of the families had children of age group 0-3 years. By the year 2000 their permanent teeth were erupted and did not show ugly stained brown colour. They were milky white. Those who used the filter units with lot of understandings showed good results. It can be concluded that dental fluorosis has decreased in the year 2000 in comparison with the year 1994. In the house hold no. 26 the mother and the elder child had ugly stained teeth. The mother was born and bred in Olukaradagama. At the time of introduction of the filter unit to this household the purpose of the introduction of the filter was explained in detail as to other households in the village. In some of our visits it was observed that changing of the filter medium was not carried out on required time intervals. In short she was not that keen to use the filter on her own. By the end of the year 1999 her second child too ended up with dental fluorosis. The youngest child is three years old in year 2000 but filter was withdrawn due to her lethargic attitude.
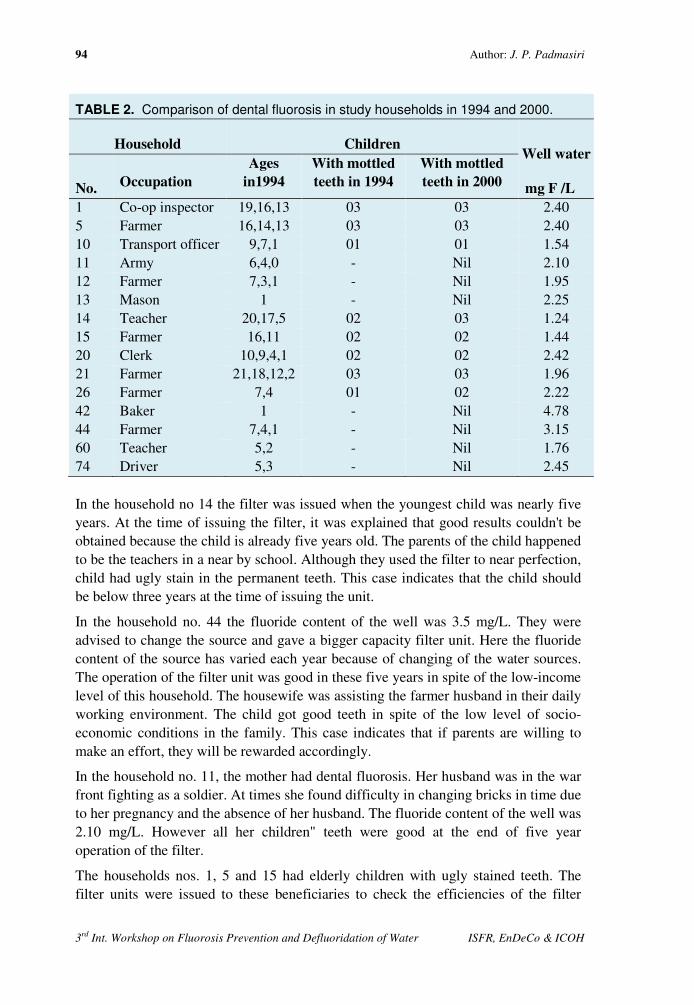
94 Author: J. P. Padmasiri
3rd Int. Workshop on Fluorosis Prevention and Defluoridation of Water ISFR, EnDeCo & ICOH
TABLE 2. Comparison of dental fluorosis in study households in 1994 and 2000.
Household Children Well water
mg F /L No. Occupation
Ages
in1994
With mottled
teeth in 1994
With mottled
teeth in 2000
1 Co-op inspector 19,16,13 03 03 2.40 5 Farmer 16,14,13 03 03 2.40 10 Transport officer 9,7,1 01 01 1.54 11 Army 6,4,0 - Nil 2.10 12 Farmer 7,3,1 - Nil 1.95 13 Mason 1 - Nil 2.25 14 Teacher 20,17,5 02 03 1.24 15 Farmer 16,11 02 02 1.44 20 Clerk 10,9,4,1 02 02 2.42 21 Farmer 21,18,12,2 03 03 1.96 26 Farmer 7,4 01 02 2.22 42 Baker 1 - Nil 4.78 44 Farmer 7,4,1 - Nil 3.15 60 Teacher 5,2 - Nil 1.76 74 Driver 5,3 - Nil 2.45 In the household no 14 the filter was issued when the youngest child was nearly five years. At the time of issuing the filter, it was explained that good results couldn't be obtained because the child is already five years old. The parents of the child happened to be the teachers in a near by school. Although they used the filter to near perfection, child had ugly stain in the permanent teeth. This case indicates that the child should be below three years at the time of issuing the unit.
In the household no. 44 the fluoride content of the well was 3.5 mg/L. They were advised to change the source and gave a bigger capacity filter unit. Here the fluoride content of the source has varied each year because of changing of the water sources. The operation of the filter unit was good in these five years in spite of the low-income level of this household. The housewife was assisting the farmer husband in their daily working environment. The child got good teeth in spite of the low level of socio-economic conditions in the family. This case indicates that if parents are willing to make an effort, they will be rewarded accordingly.
In the household no. 11, the mother had dental fluorosis. Her husband was in the war front fighting as a soldier. At times she found difficulty in changing bricks in time due to her pregnancy and the absence of her husband. The fluoride content of the well was 2.10 mg/L. However all her children" teeth were good at the end of five year operation of the filter.
The households nos. 1, 5 and 15 had elderly children with ugly stained teeth. The filter units were issued to these beneficiaries to check the efficiencies of the filter

Effectiveness of domestic defluoridator in preventing fluorosis in Kekirawa, Sri Lanka 95
Editors: Eli. Dahi & Sunsanee. Rajchagool & Nipaphan Osiriphan
units. The fluoride contents of the wells were in the range 2.0-2.5 mg/L. The fluoride contents of the defluoridated waters were in the range 1.0-1.6 mg/L.
In the household nos. 10 and 12 the elder children had dental fluorosis at the time of issuing the filter units. The young children of these households got milky white teeth at the end of five years. They have operated and maintained the filter units well as shown in table 1 where fluoride content of defluoridated water was maintained around 1.0 mg/L.
Household no. 20, the filter operation was carried out to near perfection as shown in the record sheet. She is a housewife and was able to get her young children with good-looking teeth. The two elder children had ugly stained teeth at the time of issuing the filter.
Household no. 60, the mother is a teacher in a nearby school. Because of her education level she understood the importance of the filter and carried out the operations well. In addition her farmer husband supported her by supplying and changing bricks in time. She too got good results.
In the household no.74, the father is a driver and the mother carried out farming in her leisure hours. The filter O & M was good in spite of their low income and educational levels, and the results were good.
In the year 2000, ten house hold units where children got permanent teeth does not have dental fluorosis in this village thus showing the effectiveness of the defluoridation programme in this village.
CONCLUSIONS
• The filter unit could be used for more than five years if handled carefully because maintenance requirements are almost non-existence.
• The beneficiaries could repair breakage in the outlet pipe, if proper training is provided.
• The 4th and 5th year of operation of the filter unit continuously is an important issue to be highlighted to the beneficiaries.
• It is important to change the filter medium at the correct time for the defluoridation of water to be more effective.
• For fluoride content of 3.0 mg/L: with a withdrawing capacity mentioned at 15 liters/day, the defluoridated water could be kept below a fluoride content of 1.0 mg/L in this filter unit.
• There is low incidence of dental fluorosis in the new generation who reached 7-8 years in 2000 in this village.
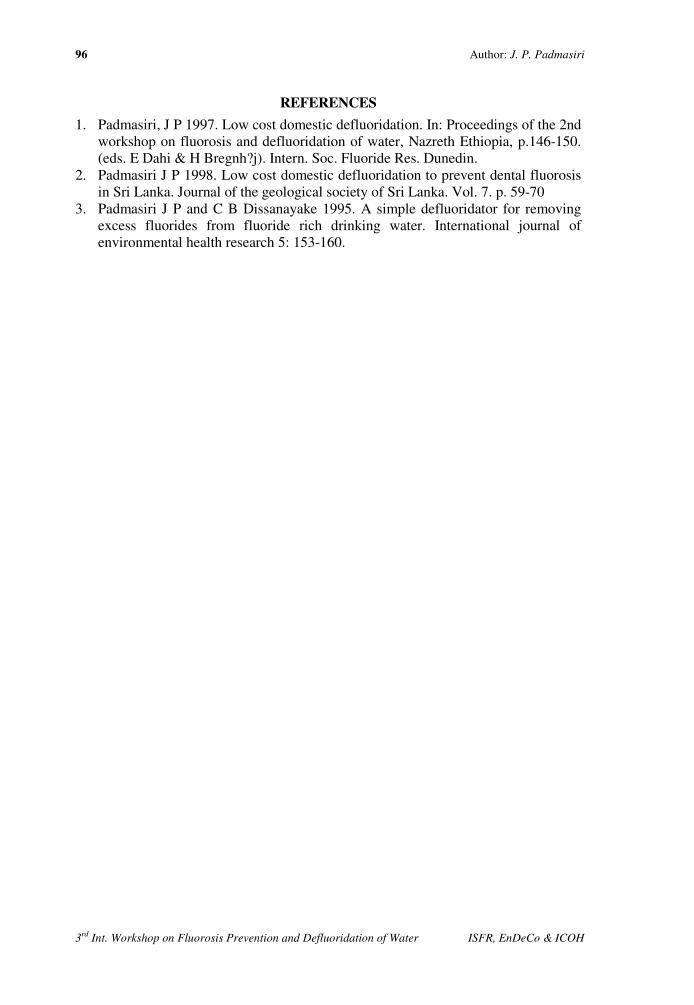
96 Author: J. P. Padmasiri
3rd Int. Workshop on Fluorosis Prevention and Defluoridation of Water ISFR, EnDeCo & ICOH
REFERENCES
1. Padmasiri, J P 1997. Low cost domestic defluoridation. In: Proceedings of the 2nd workshop on fluorosis and defluoridation of water, Nazreth Ethiopia, p.146-150. (eds. E Dahi & H Bregnh?j). Intern. Soc. Fluoride Res. Dunedin.
2. Padmasiri J P 1998. Low cost domestic defluoridation to prevent dental fluorosis in Sri Lanka. Journal of the geological society of Sri Lanka. Vol. 7. p. 59-70
3. Padmasiri J P and C B Dissanayake 1995. A simple defluoridator for removing excess fluorides from fluoride rich drinking water. International journal of environmental health research 5: 153-160.
3rd International Workshop on Fluorosis Prevention and Defluoridation of Water 97
A Case Study of Fluorosis Mitigation in Dungarpur
District, Rajasthan, India
A. K. Vaish * & P Vaish
India
SUMMARY: India is among the many countries in the world, where fluoride contaminated
groundwater is creating health problems. Safe drinking water in rural areas of India is pre
dominantly dependent on groundwater sources, which are highly contaminated with
fluoride, the concentration in 17 States being 1 to 48 mg/L. About 62 million people
including 6 million children are affected with dental, skeletal and non-skeletal fluorosis.
In Rajasthan, 18 out of 32 districts are fluorotic and 11 millions of the population are at risk.
In the absence of perennial rivers, surface and canal system, groundwater remains the main
source of drinking water. It contains 2 to 20 mg/L of fluoride.
Defluoridation at household level has been popularised under the sponsorship of UNICEF.
Few villages of Dungarpur district of Rajasthan are covered adopting both techniques of
activated alumina and the Nalgonda technique. 800 defluoridation units were distributed in
six villages. People are daily using the units for last four years and they felt significant relief
in non-skeletal fluorosis manifestations.
The ongoing fluorosis mitigation programme appears sustainable due to active community
participation. It is recommended for replication of in other fluorosis endemic regions of the
world, with increased Information-Education-Communication, IEC, activities and
involvement of Non-Government Organisations, NGOs.
Key words : Fluoride contamination, fluorosis, domestic level, defluoridation, community participation, IEC activities.
INTRODUCTION
High concentration of fluoride has been detected in the underground water in many countries, e.g. Kenya, Nigeria, South Africa, Tanzania, USA, China, India, Japan, Korea and Australia. Besides, 33 other countries have been reported to have high fluoride levels in the ground water 15.
Fluoride in excess of 1.0 mg per litre causes dental fluorosis if ingested regularly. It can also result in skeletal fluorosis and non-skeletal manifestations i.e. loss of appetite, joint pain, stiffness of neck and back pain, gas formation, laziness in routine life, increased urination etc, as commonly reported in fluorotic regions 16.
* SARITA (NGO), India E-mail: [email protected]
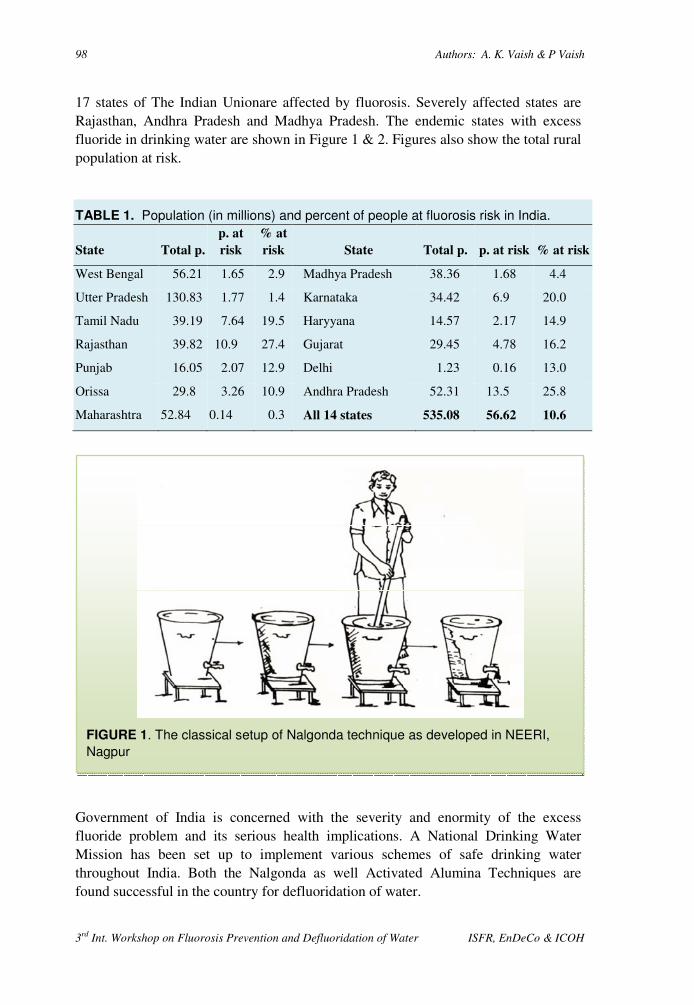
98 Authors: A. K. Vaish & P Vaish
3rd Int. Workshop on Fluorosis Prevention and Defluoridation of Water ISFR, EnDeCo & ICOH
17 states of The Indian Unionare affected by fluorosis. Severely affected states are Rajasthan, Andhra Pradesh and Madhya Pradesh. The endemic states with excess fluoride in drinking water are shown in Figure 1 & 2. Figures also show the total rural population at risk.
TABLE 1. Population (in millions) and percent of people at fluorosis risk in India.
State Total p.
p. at
risk
% at
risk State Total p. p. at risk % at risk
West Bengal 56.21 1.65 2.9 Madhya Pradesh 38.36 1.68 4.4
Utter Pradesh 130.83 1.77 1.4 Karnataka 34.42 6.9 20.0
Tamil Nadu 39.19 7.64 19.5 Haryyana 14.57 2.17 14.9
Rajasthan 39.82 10.9 27.4 Gujarat 29.45 4.78 16.2
Punjab 16.05 2.07 12.9 Delhi 1.23 0.16 13.0
Orissa 29.8 3.26 10.9 Andhra Pradesh 52.31 13.5 25.8
Maharashtra 52.84 0.14 0.3 All 14 states 535.08 56.62 10.6
Government of India is concerned with the severity and enormity of the excess fluoride problem and its serious health implications. A National Drinking Water Mission has been set up to implement various schemes of safe drinking water throughout India. Both the Nalgonda as well Activated Alumina Techniques are found successful in the country for defluoridation of water.
FIGURE 1. The classical setup of Nalgonda technique as developed in NEERI,
Nagpur
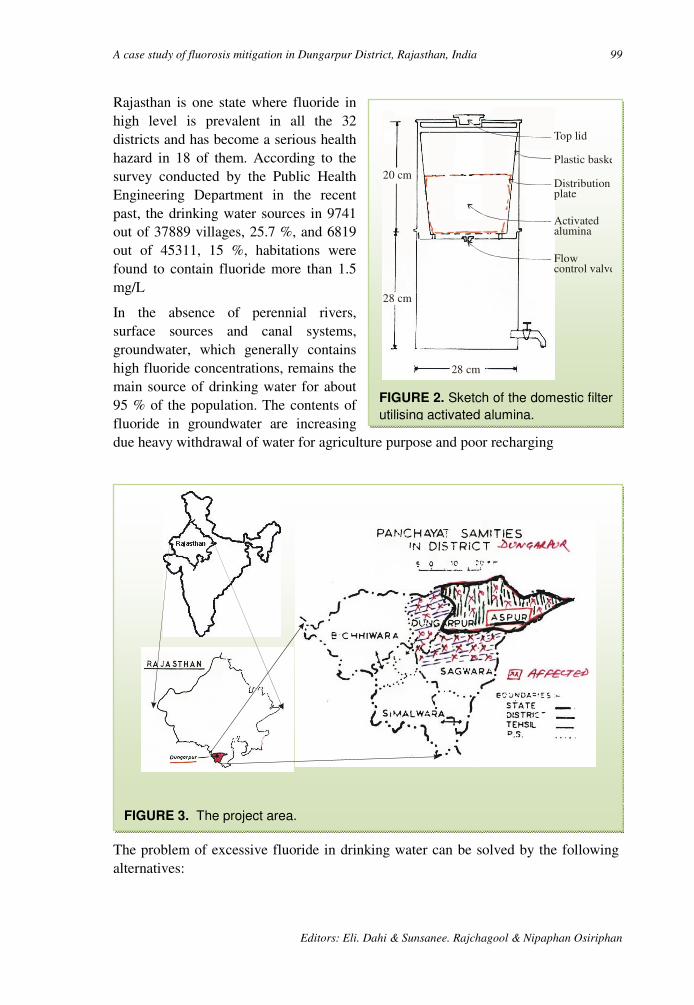
A case study of fluorosis mitigation in Dungarpur District, Rajasthan, India 99
Editors: Eli. Dahi & Sunsanee. Rajchagool & Nipaphan Osiriphan
Rajasthan is one state where fluoride in high level is prevalent in all the 32 districts and has become a serious health hazard in 18 of them. According to the survey conducted by the Public Health Engineering Department in the recent past, the drinking water sources in 9741 out of 37889 villages, 25.7 %, and 6819 out of 45311, 15 %, habitations were found to contain fluoride more than 1.5 mg/L
In the absence of perennial rivers, surface sources and canal systems, groundwater, which generally contains high fluoride concentrations, remains the main source of drinking water for about 95 % of the population. The contents of fluoride in groundwater are increasing due heavy withdrawal of water for agriculture purpose and poor recharging
The problem of excessive fluoride in drinking water can be solved by the following alternatives:
FIGURE 3. The project area.
FIGURE 2. Sketch of the domestic filter
utilising activated alumina.
Top lid
Plastic basket
Distributionplate
Activatedalumina
Flow control valve
20 cm
28 cm
28 cm

100 Authors: A. K. Vaish & P Vaish
3rd Int. Workshop on Fluorosis Prevention and Defluoridation of Water ISFR, EnDeCo & ICOH
• Bringing fluoride free water from distance sources by pumping and lying long pipelines.
• Installation of defluoridation plants at water sources, and • Defluoridation at domestic level.
The first two alternatives not only require high capital investments but also heavy expenditure on O & M, high level of close supervision and operation by trained and skilled persons.
In view of the above constraints and poor capacity of the beneficiaries to pay the cost of production of water, defluoridation of water at domestic level is the most appropriate solution. It is simple, cost effective and sustainable, being community based and community managed.
MATERIALS AND METHODS
Two proven techniques are utilised in the project:
Nalgonda Technique. The process is simple, technically sound and cost effective. It involves mixing of alum and line. Flocs, when formed by gentle mixing, absorb fluoride from raw water and decanted water will have fluoride in negligible amounts, Figure 1. It is recommended for treating water with total dissolved solids and total hardness not more than 1500 mg/L and 250 mg as CaCO3/L, respectively. Proper stirring required in this process. Total cost of one drum set is around US $ 15. Monthly recurring cost per family is meagre.
A A Technique. A company, Indian Institute of Technology in Kanpur carried out studies over the activated alumina technique for the last 7 years. The studies revealed that the filter with activated alumina is efficient in removal of fluoride at domestic level. The filter consists of a container having the plastic / steel bucket with activated alumina, Figure 2. The activated alumina needs regeneration once in 3-4 months. This can be carried out locally by the communities. The activated alumina can be regenerated at least 28 times over the course of its lifetime. Total cost of a filter is around US $ 30-35. Quarterly recurring cost is around 1/2 dollar. Sometimes there is slight increase in sulphate value during periodic regeneration but it is not harmful to human health.
Project area. In Dungarpur district, fluorite mineralization spread over to 200 sq. km. Area. More over, rocks like granite, granite - gneisses are exposed due to which ground water have excess quantity of fluoride ion. The potable water sources of more than 150 villages out of 827 villages contain 1.5 to 8.5 ppm of fluoride. Since February 1996 an action research pilot project (Fluorosis Mitigation Programme) was launched by SARITA in four villages of Dungarpur district of Rajasthan under the sponsorship of UNICEF. Later on after two years, due to active community involvement and cost sharing by the users, two additional villages were added in the ongoing programme.
Programme components. The key-components of this programme are:
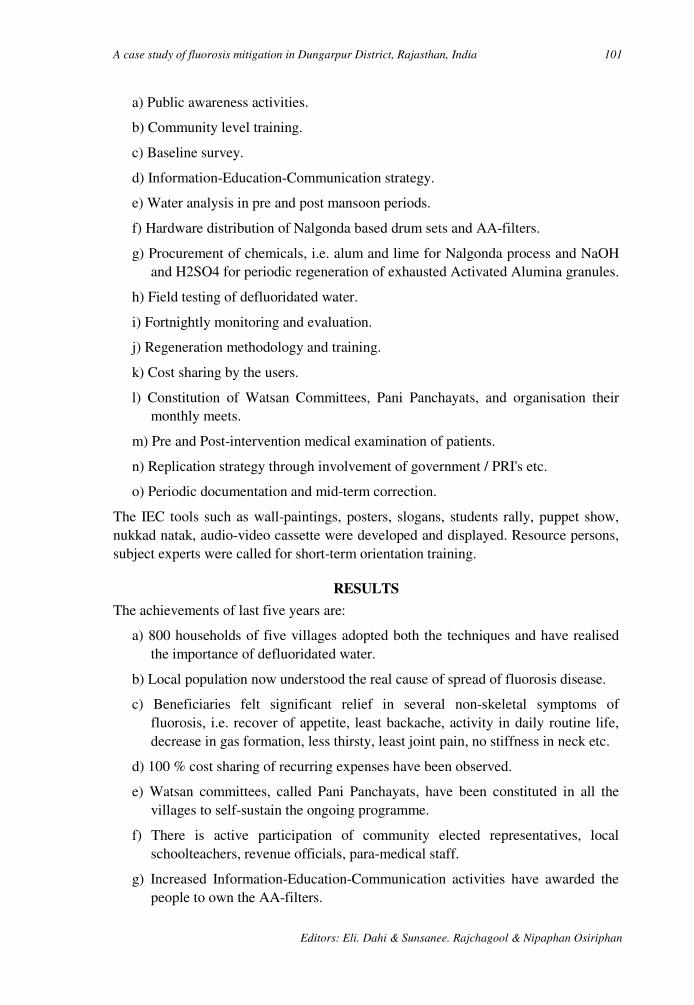
A case study of fluorosis mitigation in Dungarpur District, Rajasthan, India 101
Editors: Eli. Dahi & Sunsanee. Rajchagool & Nipaphan Osiriphan
a) Public awareness activities.
b) Community level training.
c) Baseline survey.
d) Information-Education-Communication strategy.
e) Water analysis in pre and post mansoon periods.
f) Hardware distribution of Nalgonda based drum sets and AA-filters.
g) Procurement of chemicals, i.e. alum and lime for Nalgonda process and NaOH and H2SO4 for periodic regeneration of exhausted Activated Alumina granules.
h) Field testing of defluoridated water.
i) Fortnightly monitoring and evaluation.
j) Regeneration methodology and training.
k) Cost sharing by the users.
l) Constitution of Watsan Committees, Pani Panchayats, and organisation their monthly meets.
m) Pre and Post-intervention medical examination of patients.
n) Replication strategy through involvement of government / PRI's etc.
o) Periodic documentation and mid-term correction.
The IEC tools such as wall-paintings, posters, slogans, students rally, puppet show, nukkad natak, audio-video cassette were developed and displayed. Resource persons, subject experts were called for short-term orientation training.
RESULTS
The achievements of last five years are:
a) 800 households of five villages adopted both the techniques and have realised the importance of defluoridated water.
b) Local population now understood the real cause of spread of fluorosis disease.
c) Beneficiaries felt significant relief in several non-skeletal symptoms of fluorosis, i.e. recover of appetite, least backache, activity in daily routine life, decrease in gas formation, less thirsty, least joint pain, no stiffness in neck etc.
d) 100 % cost sharing of recurring expenses have been observed.
e) Watsan committees, called Pani Panchayats, have been constituted in all the villages to self-sustain the ongoing programme.
f) There is active participation of community elected representatives, local schoolteachers, revenue officials, para-medical staff.
g) Increased Information-Education-Communication activities have awarded the people to own the AA-filters.
102 Authors: A. K. Vaish & P Vaish
3rd Int. Workshop on Fluorosis Prevention and Defluoridation of Water ISFR, EnDeCo & ICOH
h) Local social workers have been trained to undertake periodic regeneration at village level;
i) Close liaison between UNICEF, State PHED, SARITA and local authorities observed in the programme.
j) Proposed need base replication strategy stress for effective involvement of users and the government.
k) Special schedules developed for house-to-house survey, pre and post intervention medical examination of fluorosis patients and for fortnightly monitoring.
DISCUSSION
Technology. From the last five years experience, it has been felt that due to scarcity of water and daily disposal of sludge, the Nalgonda technique was less preferred. Still there is need to invent low-cost, easy operational and adaptable AA-filter or other defluoridation units for its replication in all the 16560 affected villages of Rajasthan State, India. Technology option should be popularised. As per their purchase capacity, people will purchase defluoridation units, e. g. Nalgonda based drum set, Terricota AA-filter, plastic AA-filter, steel made AA-filter, defluoridation brick etc. For this purpose, sanitary marts should be opened at villages. The chemicals should also be available in such local shops. Installation of community based (AA-technology) defluoridation plants in affected localities and their proper maintenance. Implementation of regional water supply schemes from safe surface water sources is needed in affected localities.
Motivation. Continue motivation and awareness building are essential to make the programme successful. High level of awareness towards the disease and health benefits gained by the users is reflected in discussions. There is demand for more AA-filters among left-out families.
Finance. The financial and local man power assistance should be given by state Public Health Engineering Department / Panchayats to make the programme sustainable in long term. Presently there is no financial assistance from the Central / State govt. for subsidising partial capital cost of filters. The villagers of adjacent affected localities also showed willingness to own such units and to share full O & M costs.
Quality of medium. None of the households voiced any complaints about the defluoridation kits or regarding the taste of the treated water. The quality grade AA granules are not easily available in the market. The AA-granules of few manufacturing companies be approved by the government. Availability of quality grade but commercial NaOH, H2SO4, alum and lime be ensured through Public Health Engineering Department at local level.
Health achievements. Users informed that their health had improved considerably. Proper records of fluorosis patients should be maintained by State Medical and Health
A case study of fluorosis mitigation in Dungarpur District, Rajasthan, India 103
Editors: Eli. Dahi & Sunsanee. Rajchagool & Nipaphan Osiriphan
Department. Research and development proper treatment of fluorosis should be encouraged.
Management. NGO's should be involved in the implementation of domestic defluoridation programme in affected localities. It is high time to concentrate over different aspects of this public health related problem to help the millions of the people from this crippling disease. The international donor agencies and other related institutions in association with government should grant funds to take up defluoridation at both community and household level and proper cure of disease be invented.
ACKNOWLEDGEMENT
The authors are thankful to UNICEF for sponsoring this ongoing programme and to Public Health Engineering Department and RNT Medical College, Udaipur (India) for periodic guidance in the programme.
REFERENCES
1. Agarwal V, Vaish A K and Vaish P 1997. Ground water quality: Focus on fluoride and fluorosis in Rajasthan. Current Science , Vol.73, no.99. pp.743-746.
2. Bulusu, K R and Nawlakhe, W G 1990. Defluoridation , NEERI, Publ. Nagpur (India).
3. India Institute of Technology 1996. Defluoridation of water using Activated Alumina, Kanpur (U.P.) India 48p.
4. India Institute of Technology 1998. Comprehensive report on Defluoridation using Activated Alumina, Kanpur (UP) India, 76p.
5. Keller. E. (1976) : Environmental Geology. C. Merill, Pub. Ohio, 489p. 6. PHED 1993. Survey of Status of Drinking Water supply in Rural Habitation,
unpub. Reports, Public Health Engineering Department, Government of Rajasthan, Jaipur, India.
7. RGNDWM 1993. prevention and Control of fluorosis, Health Aspects, vol.1., Ministry of Rural Development, Rajiv Gandhi National Drinking Water Mission, Govt. of India, New Delhi, 89p.
8. RGNDWM 1993. Water Quality and Defluoridation Techniques, GOI, New Delhi, 58p.
9. SARITA 1995. Severity of Fluoride pollution in drinking water of the rural sector of Dungarpur district of Rajasthan, Final Project Report (unpub)104 pp.
10. WELL (1999) : Study of Fluoride Treatment, Andhra Pradesh Water and Environmental Sanitation Project, task No.: 41, for DFID, 48p.
11. UNICEF 1995. WATSON India 2000, 48p. 12. UNICEF 1997. Fluorosis, Health and epidemiological survey of some high
fluoride villages of Dungarpur district, Rajasthan (unpub.), Department of Community Medicine, RNT Medical College, Udaipur, 49p.
13. WHO 1970 & 1994. Fluorosis and Human Health booklets. 14. UNICEF 1995. Plan of Action, UNICEF assisted pilot project for fluoride control
in Dungarpur district of Rajasthan, Rajasthan Field Office, Jaipur (unpub.); 11p.
104 Authors: A. K. Vaish & P Vaish
3rd Int. Workshop on Fluorosis Prevention and Defluoridation of Water ISFR, EnDeCo & ICOH
15. PHED, M. P. 2000. Booklet on International Workshop on fluoride in Drinking Water, strategies, Management & Mitigation, Public Health Engineering Department, Govt of Madhya Pradesh, Bhopal (22-24 January, 2001), 27p.
16. Susheela A K 1999. Fluorosis Management Programme in India, Current Science, vol. 77. No. 10, November, 1999, pp 1250-1255.
17. Department of Community Medicine, RNT Medical College, Udaipur (2000): Health and epidemilogical survey of some high fluoride villages of Dungarpur and Rajsamand districts, conducted for UNICEF, Jaipur, India, 38p.
18. SARITA 2000. Fluorosis Mitigation Programme in Aspur Block of Dungarpur district of Rajasthan, India, Review and Recommendation (unpubl.) Report. May, 2000, 9p.

3rd International Workshop on Fluorosis Prevention and Defluoridation of Water 105
Key Factors for Sustainability of Fluoride Management
Programme with Special Reference to Rajasthan, India
P Vaish* & A. K. Vaish India
SUMMARY : It is know recognized that the objective of supplying safe water cannot be
achieved unless the community is mobilised to manage the water system. Government
programmes for water cannot fructify unless the community is mobilised to won and sustain
these programmes and to become an active partner in their promotion.
Participatory techniques are effective in the management of defluoridation programmes.
Various types of IEC materials can be developed to support campaigns, training and
communication activities. Key factors for sustainability of 'Fluorosis Mitigation
Programme' are awareness campaign, motivation, training, development and display of
posters, slogans, wall paintings, street play, puppet show, development of audio, video
cassette in local dialect and based on local folk dance tune.
Such type of active community mobilisation scenario has been observed in the ongoing
fluorosis mitigation programme which in underway at Aspur Block of Dungarpur district of
Rajasthan, India. Cost sharing by the users, active functioning of Pani Panchayats has made
the pilot project a success.
Key words: IEC material, Fluorosis Mitigation Community Mobilisation, Pani Panchayats, cost sharing, awareness campaign, training.
INTRODUCTION
Drinking water of acceptable quality and required quantity is a basic need for humans, yet it is not within the reach of a large number of rural populations in the third world countries. Planning, implementation and management of water supply programmes in an area involve a complex formalised interactions among organisations, institutions and operation and maintenance, O & M, resources to carry out water resource assessment and supply and maintenance operations.
The communication among the three main groups involved is very essential. The consumers, i.e. the present and prospective local population, the producers i.e. the parastatal national organisation, and the donors, i.e. national, state and external financing authorities and agencies. Fluorosis management could be effective if we
* SARITA (NGO), India E-mail: [email protected]
106 Authors: A. K. Vaish & P Vaish
3rd Int. Workshop on Fluorosis Prevention and Defluoridation of Water ISFR, EnDeCo & ICOH
follow various Information, Education, Communication, IEC, activities. These would automatically involve the community to actively participate in the ongoing programme. Besides, orientation and training programmes would significantly add to the success of such extension programme.
Fluorosis poses a grave public health problem in India and in some other developed and developing countries in the world. In Rajasthan State, India, 18 out of 32 districts confront with the problem of high fluoride concentrations in potable water sources, affecting more than 10 millions of its population. A pilot project for the control of fluorosis has been launched by a Non-Government Organisation SARITA NGO in Aspur Block of Dungarpur district of Rajasthan, since 1996 under the sponsorship of UNICEF. The programme aims to impart constant awareness to the target groups, short-term orientation training to the grass root level functionaries and active involvement of village level governmental machinery, i.e. revenue officials, schoolteachers and para-medical stall. The objectives have been achieved in last four years period and the ongoing programme appears sustainable, as the community has been educated and motivated to operate the programme within specified parameters.
METHODS
Seven types of activities are launched to ensure the sustainability of fluorosis mitigation programme:
Capacity Building. The local population does generally not know the real cause of groundwater quality problems. Therefore, there is need of capacity building among local population, including teachers, sarpanchs, shopkeepers, para-medical staff, patwari, Public Health Engineering Department PHED helpers / lineman, social workers, village level animator etc. This can be done through constant motivation / awareness generation, to ensure self-sustained programme operation, even after completion of the programme. Capacity building may be attempted by:
• Organisation of district / block level meets of 1 to 2 days duration, before the commencement of the programme. In such meets, programme appraisal be attended including examination on the problems and the likely benefits accrued.
• Orientation training for grassroots level workers. Five persons from each village is considered for 2 days duration. Village level workers, Govt. school teachers, Sarpanchs, Panches, PHED officials, Patwari and local social workers be trained about the problem and likely remedial measures.
• Village level 'Mahila Groups' is constituted, as the drinking water issue is taken care of by ladies. In their fortnightly meetings, the contents of programme is discussed and queries are replied through demonstration / charts / brain storming practices etc.
• Communication, Education and Participation, CEP, meets of one day duration in each village, Village Contact Drive, VCD's of one day duration and 'Awareness Camps' should be organised periodically, e.g. twice in a year, to gear up the local capacities. Such an activity shall also reflect feed back of the performance.
Key factors for sustainability of fluoride management programme.... 107
Editors: Eli. Dahi & Sunsanee. Rajchagool & Nipaphan Osiriphan
• Cost sharing in terms of 'token money' at the time of delivery of defluoridation kits, subsequent cost sharing for maintenance of the programme, cost of chemicals and honorarium to local social workers who will carry out the job related to the programme is be adopted by villagers.
• 'Exposure Trips' is arranged to other areas where similar programme has already been implemented.
Institutional framework. It is necessary to collect details about the institution looking after the schemes of water supply, Gram Panchayats, NGO's etc involved in the execution of the programme, government set-up efficiency in handling service delivery inputs, particularly procurement and distribution of contingent items. Local NGOs can be entrusted the task of popularising Information Education and Communication IEC or software activities. Private sector may also be considered partly for O & M of the pipelines, equipment, tanks, procurement of quality chemicals etc. Local health sector functionaries are considered as reliable resource persons. Therefore, every step should be taken to gather information about local health sector structure and capacities of persons working in the project area. Active involvement of these personnel is a pre-requisite for a successful campaign.
Watsan committees. Water and Sanitation Committees, constituted by village Panchayat / Gram Sabha, comprises members of the Gram Sabha or leaders of the villages or hamlets. The members of this committee must represent the entire community in the whole village including sub-villages, irrespective of cast, status and religion. Formulation of such a committee be made in a general village meeting in which Sarpanches, Up-sarpanches, Ward Panches and other people of the village should be invited. At this meeting, the purpose, the scope and the function of the watsan committee should be placed before the group for discussion and decision.
A watsan committee member should be: 1) A resident of the particular hamlet / village / ward. 2) A respectable person. 3) Willing for voluntarism. 4) Willing to attend training sessions; and 5) Willing to organise water and sanitation programme.
After formation of the watsan committee, the village Panchayat must take initiative to organise campaigns to create awareness about the importance of safe water supply. Periodic meetings of the committee be organised by Panchayat Raj Institution, head in the village PRIs. The PRIs can prepare plan of action for safe drinking water supply; choose technology suitable to them and execute centrally sponsored water management programme; can create awareness about hygiene practices; can organise training for masons etc. and can take the responsibility of boring wells.
The PRIs may also be involved in organising Jaths / Prabhat pheries in the village, in contacting local folk artists to include message of quality or other problems of available water for drinking purpose and in Providing feed-back to the Gram Sabha and the Panchayat Samiti.
Willingness to pay. O & M of the water supply facility by the village community (through local Gram Panchayat) are very important aspects of management
108 Authors: A. K. Vaish & P Vaish
3rd Int. Workshop on Fluorosis Prevention and Defluoridation of Water ISFR, EnDeCo & ICOH
considerations for judging the sustainability of water supply programme. If such a facility has been installed by the PHED, the PHED staff may be involved for such purpose. If water supply has been executed by NGOs, then the responsibility of O & M campaign lies on Panchayat. The PRIs must impart training to local men and women through standard training modules to manage the programme.
Willingness to pay for such costs may be developed among local population, through constant awareness and by stressing about importance of the programme. This helps not only in terms of the actual functioning of the facilities but also is an important step by the community towards self-reliance. The responsibilities for the O & M of these facilities can be accepted by the community, formally through a resolution passed by the village Panchayat and subsequently approved by the higher Panchayat Raj Bodies. Proper record of recovery of O & M cost by the beneficiaries be maintained for keeping the transparency of the system.
A few tasks for effective O & M could be as follows:
a) Defining the normal operating schedule.
b) Defining the preventive maintenance schedule.
c) Setting up the procedures for procurement of spare parts, chemical etc.
d) Identified agencies / persons to carry out repairs as and when needed.
e) Employing operating staff and ensuring training.
f) Establishing back up support systems.
g) Monitoring of performance.
h) Arranging for collection of revenue / resources.
Management of financial sources. While formulating a water supply programme, it is very essential to frame out requirements of fund, mobilisation of funds and financial sources. Besides, government grants being received from the funding organisation, planning should be made for mobilisation of funds from the beneficiaries. The funds may be raised in the form of realisation of 'token money', monthly / yearly contribution of every household for O&M / recurring costs. PRIs may also be motivated to mobilize financial sources through local population. Under the presidentship of a 'Sarpanch', a committee of 2-3 members be constituted and a bank savings account be opened, from which money be withdrawn only by joint signatures of two members. Beneficiaries be asked to annually deposit their share / contributions in it. The community can elect a representative of 'Pani Panchayat', to play a leading role in the process of cost-recovery. A competent NGO would be of use in devising programme and workshop, as well as effective communication material to explain the situation to the community.
Financial source mobilisation (cost recovery by community) for O&M costs has three important implications:
Key factors for sustainability of fluoride management programme.... 109
Editors: Eli. Dahi & Sunsanee. Rajchagool & Nipaphan Osiriphan
• By having a financial stake in the water facility, a sense of ownership is created, which contribute to better O & M;
• The original sense of dependence, both financial and psychological, on the government ends and replaced by a feeling of partnership; and
• A sense of confidence is created in the community about the ability to make important financial decisions, based on a more complete understanding of these decisions.
Besides street play, nukkad natak, audio-vidio cassette display, puppet show, slogan writing, student rally, quiz, essay competition , posters, flip book, wall-paintings shall add in passing of the message regarding objective and importance of the programme being implemented.
Application of IEC activities in the ongoing fluorosis mitigation programme in Aspur block of the Dungarpur district of Rajasthan : The above referred IEC strategy has been adopted in a ongoing programme of fluorosis control sponsored by UNICEF. About 4 1/2 years have been passed and now local tribal population is actively involved in the programme alongwith PRIs, school teachers and para-medical staff. Due to regular IEC activities, the ongoing programme appears sustainable. Authors strongly believed that key to the success of fluorosis management programme is active community involvement and building up of the local capacities.
RESULT AND DISCUSSION
Groundwater is the primary source of potable water supply in rural India. Deforestation and resulting soil erosion hamper the recharging of the groundwater. Hence, in India groundwater levels are decreasing. In Rajasthan, in the absence of perennial rivers, surface sources and canal systems, groundwater remains the main source of drinking water for about 95% of the population and it contain high fluoride content (2 to 20 ppm). Frequent (drought-prone situations, overpumping of groundwater and poor recharging) are significantly affecting the availability and quality of groundwater. Therefore there in need to properly manage this precious natural resource. Active community involvement through local NGO's is must in managing the groundwater resources and in supply of safe potable water.
Following measures shall go long way in the success of a fluorosis mitigation management programme :
• Inculcate awareness; • Increased IEC / HRD activities be attended by PHED/ Medical and Health and
Groundwater Departments for active people's participation; • Urging villagers to use water from safe water sources, unsafe water sources be
sign-posted; • Installation of community based filters houses by Govt. so that excess quantities of
fluoride, nitrate, TDS, chlorides and bacteria free water could be provided;
110 Authors: A. K. Vaish & P Vaish
3rd Int. Workshop on Fluorosis Prevention and Defluoridation of Water ISFR, EnDeCo & ICOH
• NGO's be funded for service delivery systems at local level. They should be entrusted with the task of awareness generation, constitution of Pani Panchayat, mobilizing people's to involve in the implemented programme etc.
REFERENCE
1. Susheela A. K. (1991): Technical information for training cum awareness camp for doctors, Public Health Engineers and other officers on prevention and Control of Fluorosis. Rajiv Gandhi National Drinking Water Mission, New Delhi.
2. Prerana Vaish & A. K. Vaish (1999) : Extension Programme through IEC activities in ground water management. Nat. Sem. on Ground Water Management Strategies in arid and semi-arid regions, (paper presented), organised by State PHED, Jaipur between 23-24 June, 2000.
3. Vaish A.K., Gyani K.C. & Vaish Prerana (1999): Fluoride, Fluorosis and Defluoridation Techniques, booklet, Environ & Health, 99, SARITA (NGO), Udaipur, February, 1999, 39p.
4. Gyani K.C., Vaish A.K. & Vaish Prerana (1999): Fluoride, Fluorosis and Defluoridation Techniques, Proce. of the Nat. Seminar Environ & Health' 99, 146p.
5. UNICEF, Jaipur (1995): Plan of Action, UNICEF assisted Pilot Project for fluoride control in Dungarpur district of Rajasthan, (unpubl.) 10p.
6. Deptt. of Community Medicine, R.N.T. Medical College, Udaipur (1999): Report for the Health and Epidemiological Survey of some high fluoride villages of Dungarpur and Rajsamand districts, Dr. Rekha Bhatnagar & Dr. Rahul Prakash (Unpubl.) May, 1999, conducted for UNICEF, Jaipur, 29p.
7. Deptt. of Community Medicine, R.N.T. Medical College, Udaipur (2000): Health and Epidemiological Survey of some high fluoride villages of Dungarpur and Rajsamand districts, (unpubl), conducted for UNICEF, Jaipur in association with SARITA (NGO), Udaipur, 38 p.
8. PHED, M.P. (2000): Booklet on International Workshop on Fluoride in Drinking Water: Strategy, Management & Mitigation, Public Health Engineering Department, Govt. of Madhya Pradesh, Bhopal (22-24 January, 2000), 27p.
9. Susheela A. K. (2000) : Fluorosis Management Programme in India, Current Science, vol. 77, No. 10, November, 1999, pp 1250-1255.
10. SARITA (2000): Fluorosis Mitigation Programme in Aspur Block of Dungarpur district of Rajasthan, India, Review and Recommendations, unpubl. Report, May, 2000; 9..
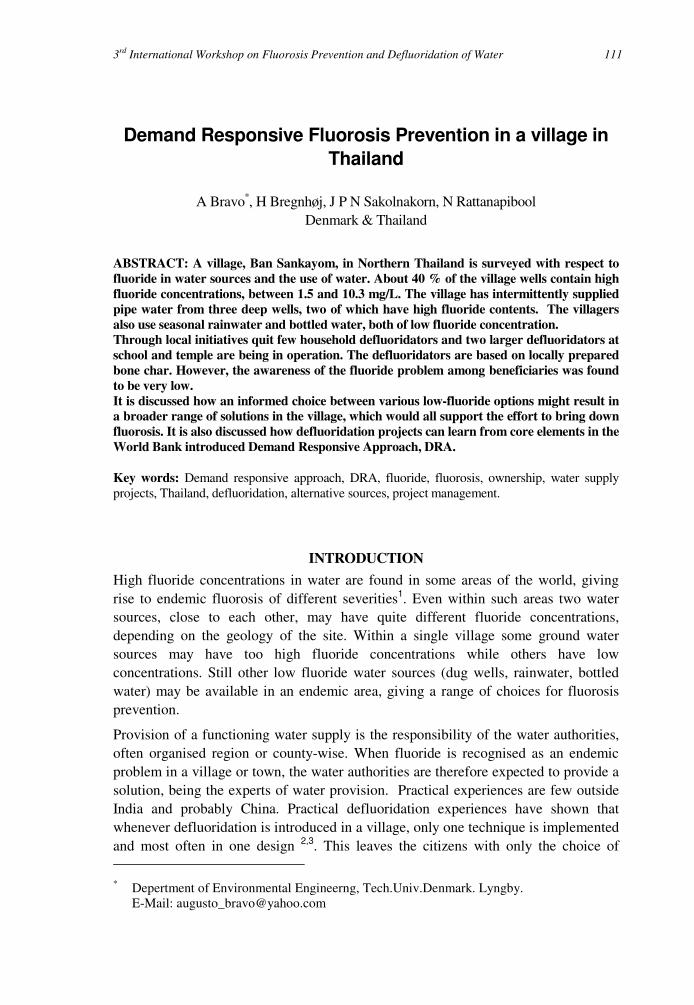
3rd International Workshop on Fluorosis Prevention and Defluoridation of Water 111
Demand Responsive Fluorosis Prevention in a village in
Thailand
A Bravo*, H Bregnhøj, J P N Sakolnakorn, N Rattanapibool Denmark & Thailand
ABSTRACT: A village, Ban Sankayom, in Northern Thailand is surveyed with respect to
fluoride in water sources and the use of water. About 40 % of the village wells contain high
fluoride concentrations, between 1.5 and 10.3 mg/L. The village has intermittently supplied
pipe water from three deep wells, two of which have high fluoride contents. The villagers
also use seasonal rainwater and bottled water, both of low fluoride concentration.
Through local initiatives quit few household defluoridators and two larger defluoridators at
school and temple are being in operation. The defluoridators are based on locally prepared
bone char. However, the awareness of the fluoride problem among beneficiaries was found
to be very low.
It is discussed how an informed choice between various low-fluoride options might result in
a broader range of solutions in the village, which would all support the effort to bring down
fluorosis. It is also discussed how defluoridation projects can learn from core elements in the
World Bank introduced Demand Responsive Approach, DRA.
Key words: Demand responsive approach, DRA, fluoride, fluorosis, ownership, water supply projects, Thailand, defluoridation, alternative sources, project management.
INTRODUCTION
High fluoride concentrations in water are found in some areas of the world, giving rise to endemic fluorosis of different severities1. Even within such areas two water sources, close to each other, may have quite different fluoride concentrations, depending on the geology of the site. Within a single village some ground water sources may have too high fluoride concentrations while others have low concentrations. Still other low fluoride water sources (dug wells, rainwater, bottled water) may be available in an endemic area, giving a range of choices for fluorosis prevention.
Provision of a functioning water supply is the responsibility of the water authorities, often organised region or county-wise. When fluoride is recognised as an endemic problem in a village or town, the water authorities are therefore expected to provide a solution, being the experts of water provision. Practical experiences are few outside India and probably China. Practical defluoridation experiences have shown that whenever defluoridation is introduced in a village, only one technique is implemented and most often in one design 2,3. This leaves the citizens with only the choice of * Depertment of Environmental Engineerng, Tech.Univ.Denmark. Lyngby. E-Mail: [email protected]

112 Authors: A Bravo, H Bregnhøj, J P N Sakolnakorn, & N Rattanapibool
3rd Int. Workshop on Fluorosis Prevention and Defluoridation of Water ISFR, EnDeCo & ICOH
saying yes or no. Responsibilities for maintenance of the defluoridation system – and small water supply systems, in general in the 90’s - are most often given to the villagers.
This is far from the leading paradigm in water service delivery to villages the third world: Demand Responsive Approach, DRA. The background for DRA is plenty of failures. Formerly water service delivery was supply driven; the water authorities, often with help from the international aid organisations, decided which villages should be supplied and designed and implemented the “appropriate” system. The result was water supply systems that were not properly maintained and was abandoned after the first breakdown. An important reason was the lack of ownership with the villagers. This is also the case of most of the defluoridation plants implemented in India 3.
DRA is not a well-defined approach, but it may be shaped by the following characteristics4,5:
Demand driven. Communities have to come forward and apply for the service. The project or authority informs broadly about the rules for eligibility.
Informed choice. An overview of the water quality/quantity situation is provided to those communities to apply for help. A range of technologies and service levels is presented to each community together with clear information about their costs and continuing financial or management implications for the community. The community selects a technology based on the amount it is willing and able to pay.
Cost-sharing for implementation/construction. The community should pay part of the capital costs. Contribution can be symbolic compared to total costs if the population is poor.
Local management and self-payment of maintenance. A local organisation manages the water supply system and collects fees for maintenance from the users.
Government is the facilitator through policy making and creation of an enabling environment for e.g. private providers of goods and services.
These measures intend to create ownership and community development through the active participation of all stakeholders in the society in all phases of the project. There is no reason why fluorosis prevention projects with defluoridation could not learn from these experiences.
In this paper, we have examined a fluoride-affected village in Northern Thailand. We will use this as an example for a discussion of how the DRA can be used in fluorosis prevention projects.

Demand responsive fluorosis prevention in a village in Thailand 113
Editors: Eli. Dahi & Sunsanee. Rajchagool & Nipaphan Osiriphan
METHODS
Sampling and analysis. Fluoride content was measured in water from dug wells, distributed groundwater and effluent from defluoridators. Fluoride analyses of the samples were made using a fluoride electrode and pH-meter Orion, model 720A with auto-calibration, and standard 5.00 mgF/L, containing TISAB, 10 % by volume. Methodology for preparation and analyses of the samples were made according to Standard Methods 7.
Water use survey. The water sources and water use were surveyed. The survey sampled randomly 32 % of the households (39 % of the inhabitants) by individual, closed, quantitative interviews. The interviews were conducted on a single day, sampling all areas of the village. There has not been any kind of pre-selection concerning the interviewees.
Water prices. Prices for bottled water was collected at different grocers in the village; piped water prices were informed by the Water Supply Committee; the defluoridated water was estimated with the help of Mr. Lai, the producer of the school defluoridator. Prices for rainwater harvesting tanks and spare parts were also found locally.
RESULTS
Village of study. Ban Sankayom is village located 28 km South of Chiang Mai city, Northern Thailand. It has a population of 1,043 people, 325 households. There is a primary and junior high school in the village. The Community Administration Committee is responsible for the village administration. Besides, the chief of the village plays an important role in the community’s affairs. Other committees are Treasury, Public Health, Social Welfare, Water Supply, and Culture Committees. The village economic status spans from high middle-class to poor.
The village uses many sources of drinking water for daily consumption: virtually one dug well for every household, rainwater, bottled water and two deep wells are in use – one at the school and one for the water distribution system in the village. Dug wells are sometimes supplied with a small pump that delivers pressurised water for the house. The distribution system serves a large area of the village, and is available for people who have bought a house connection.
Bone char defluoridators have been introduced in a few public places and in some households the last couple of years. Bone char and defluoridators are produced in the village by a local water consultant, Mr. Lai. The Intercountry Centre for Oral Health, ICOH, has supported the bone char production and investigated the fluorosis situation in the village 6.
Fluoride mapping. Fluoride measurements from the year of 1999 were used to build a fluoride map, see Figure 1.
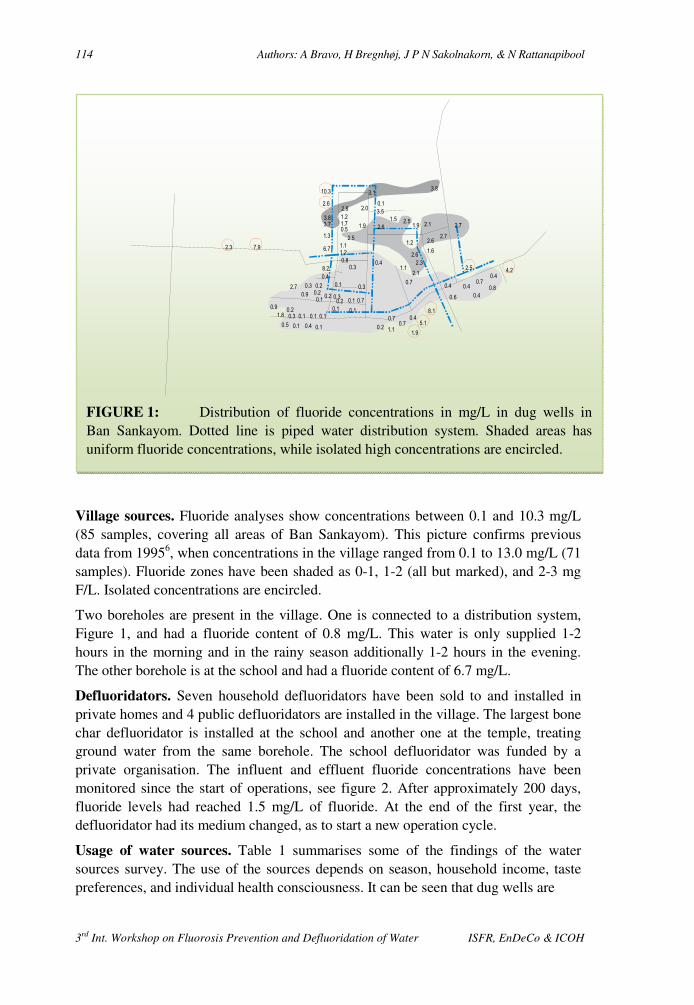
114 Authors: A Bravo, H Bregnhøj, J P N Sakolnakorn, & N Rattanapibool
3rd Int. Workshop on Fluorosis Prevention and Defluoridation of Water ISFR, EnDeCo & ICOH
Village sources. Fluoride analyses show concentrations between 0.1 and 10.3 mg/L (85 samples, covering all areas of Ban Sankayom). This picture confirms previous data from 19956, when concentrations in the village ranged from 0.1 to 13.0 mg/L (71 samples). Fluoride zones have been shaded as 0-1, 1-2 (all but marked), and 2-3 mg F/L. Isolated concentrations are encircled.
Two boreholes are present in the village. One is connected to a distribution system, Figure 1, and had a fluoride content of 0.8 mg/L. This water is only supplied 1-2 hours in the morning and in the rainy season additionally 1-2 hours in the evening. The other borehole is at the school and had a fluoride content of 6.7 mg/L.
Defluoridators. Seven household defluoridators have been sold to and installed in private homes and 4 public defluoridators are installed in the village. The largest bone char defluoridator is installed at the school and another one at the temple, treating ground water from the same borehole. The school defluoridator was funded by a private organisation. The influent and effluent fluoride concentrations have been monitored since the start of operations, see figure 2. After approximately 200 days, fluoride levels had reached 1.5 mg/L of fluoride. At the end of the first year, the defluoridator had its medium changed, as to start a new operation cycle.
Usage of water sources. Table 1 summarises some of the findings of the water sources survey. The use of the sources depends on season, household income, taste preferences, and individual health consciousness. It can be seen that dug wells are
2.3 7.9
8.2
6.7
1.3
3.7
3.8
2.6
10.3
2.8
1.2
1.7
0.5
2.5
1.1
1.2
0.8
1.9
2.0
3.1
0.1
3.5
2.6
1.5 2.51.9
0.41.1
0.7
0.7
1.2
2.6
2.3
2.1
0.3
0.4
0.10.20.3
0.20.9 0.20.1
2.7
0.90.2
1.8 0.3 0.1 0.1 0.1
0.5 0.1 0.4 0.1
0.30.10.2 0.7
0.3
0.1 0.1
0.2 1.1
0.7
0.4
1.9
5.1
8.1
0.6
0.40.7
0.4
4.2
0.4
0.80.4
2.5
2.6
1.6
2.7
2.1 2.7
3.8
FIGURE 1: Distribution of fluoride concentrations in mg/L in dug wells in Ban Sankayom. Dotted line is piped water distribution system. Shaded areas has uniform fluoride concentrations, while isolated high concentrations are encircled.
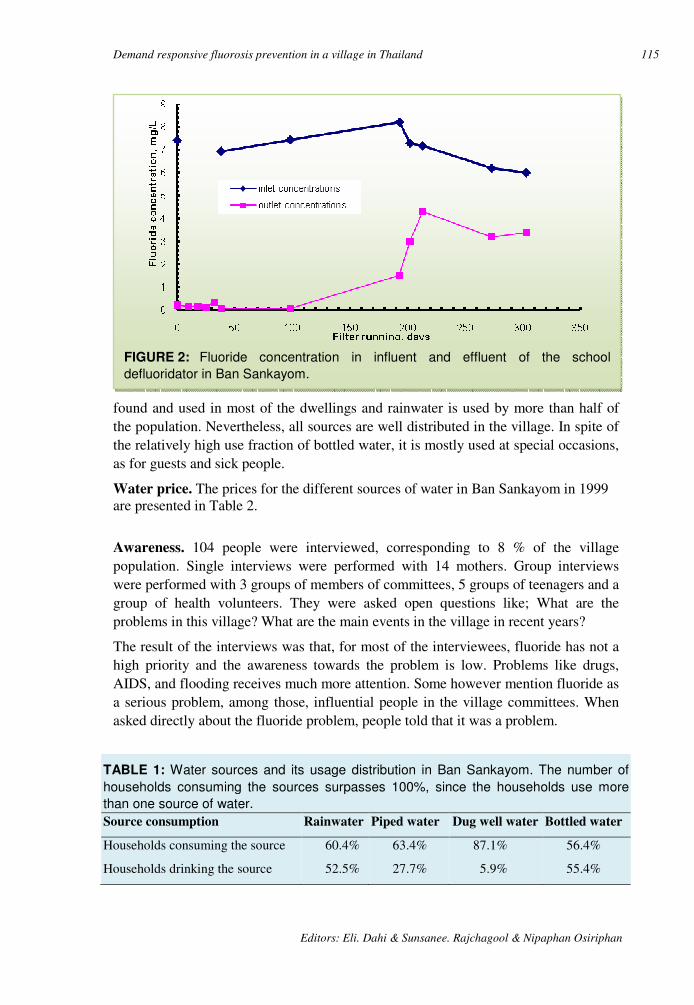
Demand responsive fluorosis prevention in a village in Thailand 115
Editors: Eli. Dahi & Sunsanee. Rajchagool & Nipaphan Osiriphan
found and used in most of the dwellings and rainwater is used by more than half of the population. Nevertheless, all sources are well distributed in the village. In spite of the relatively high use fraction of bottled water, it is mostly used at special occasions, as for guests and sick people.
Water price. The prices for the different sources of water in Ban Sankayom in 1999 are presented in Table 2.
Awareness. 104 people were interviewed, corresponding to 8 % of the village population. Single interviews were performed with 14 mothers. Group interviews were performed with 3 groups of members of committees, 5 groups of teenagers and a group of health volunteers. They were asked open questions like; What are the problems in this village? What are the main events in the village in recent years?
The result of the interviews was that, for most of the interviewees, fluoride has not a high priority and the awareness towards the problem is low. Problems like drugs, AIDS, and flooding receives much more attention. Some however mention fluoride as a serious problem, among those, influential people in the village committees. When asked directly about the fluoride problem, people told that it was a problem.
TABLE 1: Water sources and its usage distribution in Ban Sankayom. The number of
households consuming the sources surpasses 100%, since the households use more
than one source of water.
Source consumption Rainwater Piped water Dug well water Bottled water
Households consuming the source 60.4% 63.4% 87.1% 56.4%
Households drinking the source 52.5% 27.7% 5.9% 55.4%
FIGURE 2: Fluoride concentration in influent and effluent of the school
defluoridator in Ban Sankayom.
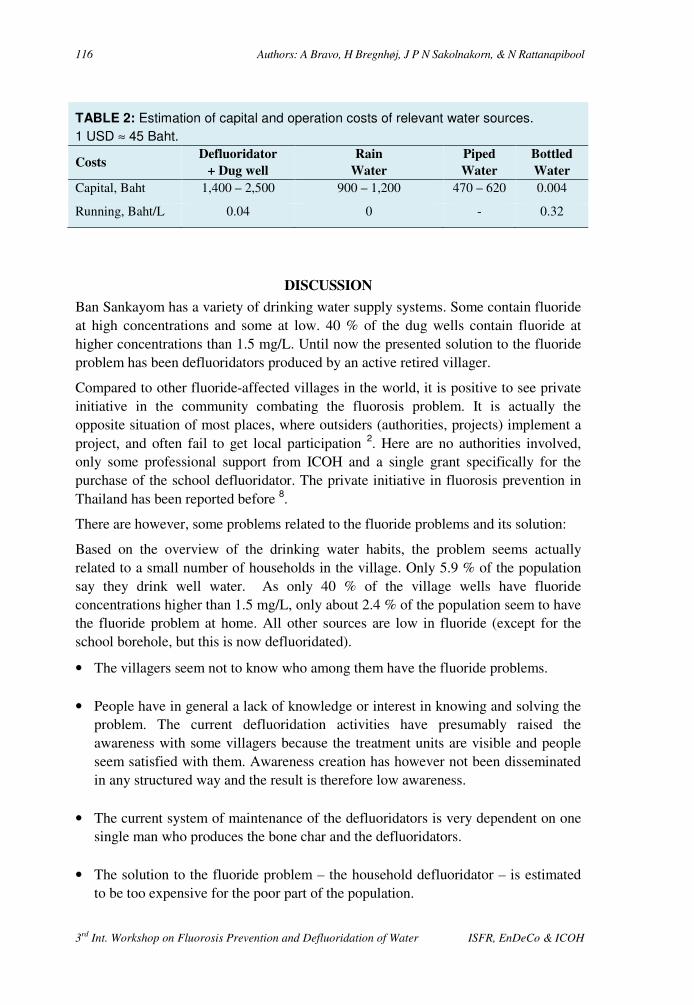
116 Authors: A Bravo, H Bregnhøj, J P N Sakolnakorn, & N Rattanapibool
3rd Int. Workshop on Fluorosis Prevention and Defluoridation of Water ISFR, EnDeCo & ICOH
DISCUSSION
Ban Sankayom has a variety of drinking water supply systems. Some contain fluoride at high concentrations and some at low. 40 % of the dug wells contain fluoride at higher concentrations than 1.5 mg/L. Until now the presented solution to the fluoride problem has been defluoridators produced by an active retired villager.
Compared to other fluoride-affected villages in the world, it is positive to see private initiative in the community combating the fluorosis problem. It is actually the opposite situation of most places, where outsiders (authorities, projects) implement a project, and often fail to get local participation 2. Here are no authorities involved, only some professional support from ICOH and a single grant specifically for the purchase of the school defluoridator. The private initiative in fluorosis prevention in Thailand has been reported before 8.
There are however, some problems related to the fluoride problems and its solution:
Based on the overview of the drinking water habits, the problem seems actually related to a small number of households in the village. Only 5.9 % of the population say they drink well water. As only 40 % of the village wells have fluoride concentrations higher than 1.5 mg/L, only about 2.4 % of the population seem to have the fluoride problem at home. All other sources are low in fluoride (except for the school borehole, but this is now defluoridated).
• The villagers seem not to know who among them have the fluoride problems.
• People have in general a lack of knowledge or interest in knowing and solving the problem. The current defluoridation activities have presumably raised the awareness with some villagers because the treatment units are visible and people seem satisfied with them. Awareness creation has however not been disseminated in any structured way and the result is therefore low awareness.
• The current system of maintenance of the defluoridators is very dependent on one single man who produces the bone char and the defluoridators.
• The solution to the fluoride problem – the household defluoridator – is estimated to be too expensive for the poor part of the population.
TABLE 2: Estimation of capital and operation costs of relevant water sources.
1 USD ≈ 45 Baht.
Costs Defluoridator
+ Dug well
Rain
Water
Piped
Water
Bottled
Water
Capital, Baht 1,400 – 2,500 900 – 1,200 470 – 620 0.004
Running, Baht/L 0.04 0 - 0.32

Demand responsive fluorosis prevention in a village in Thailand 117
Editors: Eli. Dahi & Sunsanee. Rajchagool & Nipaphan Osiriphan
• What could an approach based on DRA have done? First of all, a DRA needs an agency to implement the approach. This should ideally be the water authority, which is often responsible for ensuring an uncontaminated source of water. In principle, external funding is not necessary, as is the case of Sri Lanka 9.
• Through information about the potential problem of fluorosis in the village and the possibilities to get some support, the village as such would initially have committed itself to look closer at the problem. It is the impression that the village has engaged leaders and activists that would commit themselves if they had the possibility.
• An overview of the fluoride situation would be presented to the villagers. Together with some general information about fluorosis and its prevention, and which water sources are fluoride free, it would demystify the problem and every household would know its own risk.
• A range of possibilities to solve the problem would be presented, first, those who had the fluoride problem (single households and the school and temple). Solutions will include the alternative low-fluoride sources, like rainwater, distributed water and bottled water, as well as various defluoridation solutions. Other parameters like faecal contamination would however have to be investigated for some of the alternative sources. From the range of solutions, they would choose the one they prefer and that is the most appropriate solution for them. In the comparison in Table 2 it is obvious that the defluoridation solution is quite expensive compared to other solutions (but other defluoridation solutions could also be included) and some people would presumably prefer some of the other solutions. By actively selecting ones own device, the interest in maintaining it is assumed to be higher.
• In this case payment of full capital costs would presumably be affordable for all households, especially for the cheaper solutions. Own payment also supports the sense of ownership and interest in performing maintenance. In poorer communities (e.g. in Africa or India) subsidy to capital costs would often be necessary to involve the poorest groups.
• The solutions to provide low-fluoride water would be managed locally and people would cover full payment of maintenance. For community defluoridators, a local institution should usually be in charge (it could be private), while service to household defluoridation may be done by the private providers. This is basically the same situation as today.
• The government could, with the help of e.g. NGO’s and fluoride research institutions facilitate the creation of private providers to supply various solutions for especially a selection of defluoridation devices. Since the fluoride problem is

118 Authors: A Bravo, H Bregnhøj, J P N Sakolnakorn, & N Rattanapibool
3rd Int. Workshop on Fluorosis Prevention and Defluoridation of Water ISFR, EnDeCo & ICOH
often scattered, defluoridator producers should be able to sell their products more widely. This is for the benefit of the consumers that would have a broader selection of methods to choose from.
CONCLUSION
It has been discussed how central elements in the World Bank introduced Demand Responsive Approach could be applied to defluoridation projects. This approach is designed to ensure feeling of ownership that is often lacking in defluoridation projects. The idea has been discussed using the case of Ban Sankayom as an example, and suggests that, due to personal perspectives, sustainability can be enhanced if DRA projects offer multiple technical solutions for the same community.
ACKNOWLEDGEMENTS
The authors would like to express our gratitude to villagers and informants in Ban Sankayom, especially Mr. Lai, for good collaboration during collection of information. We also thank the staff of ICOH who hosted this investigation in autumn 1999. The authors acknowledge the sponsorship from DUCED-I & UA for support of the travel expenses to Thailand.
REFERENCES
1. Rajiv Ghandi National Drinking Water Mission. Prevention and Control of Fluorosis in India, volume 1, New Delhi, 1993.
2. Bregnhøj, H 1997 Critical sustainability parameters in defluoridation of drinking water. In: Proceedings of the 2nd International Workshop on Fluorosis and Defluoridation of Water Nazreth, Ethiopia (eds. E Dahi & JM Nielsen). Intern. Soc. Fluoride Res. Dunedin.
3. Evaluation of the activities of the sub-mission "Control of fluorosis" and fluorosis control cell (Draft). Harcharan Singh Committee Report, 1995.
4. International Reference Centre. Demand Responsive Programming and Equity. First electronic conference on demand responsive approaches. http://www.mailbase.ac.uk/lists/dra, 1999.
5. Sara J. Background note. First electronic conference on demand responsive approaches. http://www.mailbase.ac.uk/lists/dra, 1999.
6. Puangpinyo W. Situation of dental fluorosis in community of Ban Sankayom, Timbon (subdistrict) Makuachae, Amphoe (district) Muang, Changwat (provincee) Lamphun, ICOH, internal publication (in Thai), 1995.
7. Standard Methods for the Examination of Water and Wastewater, 20. edition, Clesceri, L.S. Greenberg, A.E. Eaton, A.D, Eds. American Public Health Association, Washington, DC, 1998.
8. Rajchagool S, Rajchagool C. 1997. Solving the fluorosis problem in a developing country. Proceedings of the 2nd International Workshop on Fluorosis and Defluoridation of Water Nazreth, Ethiopia. (eds. E Dahi & JM Nielsen). Intern. Soc. Fluoride Res. Dunedin.
Demand responsive fluorosis prevention in a village in Thailand 119
Editors: Eli. Dahi & Sunsanee. Rajchagool & Nipaphan Osiriphan
9. Padmasiri JP. Low cost domestic defluoridation. Proceedings of the 2nd International Workshop on Fluorosis and Defluoridation of Water Nazreth, Ethiopia, 1997. (eds. E Dahi & JM Nielsen). Intern. Soc. Fluoride Res. Dunedin.
3rd International Workshop on Fluorosis Prevention and Defluoridation of Water 120
Decentralization and Community Participation in Dealing
with Fluorosis in Lampang Province, Thailand
C Vuttipitayamongkol∗ Thailand
SUMMARY: Mottled enamel or dental fluorosis is an abnormality due to excessive fluoride
intake mainly from drinking water. The provincial survey carried out in 1995 showed that
10 % of children, age of 12, suffered from dental fluorosis. Changing sources of drinking
water or improving the quality of water are two ways to prevent fluorosis. This needs high
budget and is time consuming, especially if the projects are carried out by the central
government. With the concept of decentralisation, according to Thailand’s new constitution,
Lampang Provincial Health Office launched a pilot project in 3 areas (communities).
Conceptualising the government officers was the starting point of the project. The
government officers were only technical supporters of the communities while the people in
the communities were the decision-makers. Once they had made their own decisions they
themselves implemented it. Government officers only provided them with technical
information. This pilot project showed the potential of the communities in solving their own
problems. Nevertheless, it will be a long time before the results are seen in dental health.
Key words: Dental fluorosis, water quality, Lampang, Thailand, fluorosis control, case study.
INTRODUCTION
Lampang is a province in the northern part of Thailand. It has geological character of mountains and forests with plenty of mineral resources such as lignite, kaolinite, tin and, of course, fluoride. Lampang Provincial Health Office surveyed the fluoride in drinking water in 1998. The survey showed that 20 % of the drinking water sources contained more than 0.5 mgF/L. A dental health survey from 1995 showed that about 10 % of children aged 12 had dental fluorosis. The problem has been known for many years, but with the old bureaucratic model of country management, all community problems should be dealt with through the central government. The feasibility of solving the fluorosis problem was very poor. Due to budget constraints, the fluorosis problem was given very low priority. The awareness and community concern were increased with the higher literacy rate of the population, so the Provincial Health Office raised this problem to reconsider it in 1997.
CONCEPTS
Lampang Provincial Health Office, Thailand.
Decentralization and community participation in dealing with fluorosis in Lampang 121
Editors: Eli. Dahi & Sunsanee. Rajchagool & Nipaphan Osiriphan
After the economic crisis in 1997, the World Bank and the International Monetary Fund, IMF, suggested several methods to the Royal Thai Government to improve the socio-economic and political situation of the country. The new constitution in 1997 induced the concept of reformation in both the government and private sectors. In the governmental sectors, decentralisation is the main concept in the reformation process. Local administration was giving more autonomy. Accordingly, the Ministry of Public Health, MOPH, changed their role from implementer to supporter, downsized the ministry sectors and allocated more budget to the local administration. MOPH followed the concept of the new constitution, that consider health human rights as follows:
• The right to choose the kind of service. • The right to receive correct information. • The right to receive health promotion. In agreement with the old concept of solving the dental fluorosis problem, the community did nothing but wait for the government officers to solve the problem for them. The community expected construction of water supply systems or rainwater harvesting tanks, activities that demand high budget and time if all target areas are to be covered. This model lacked community involvement and participation. In the long run, there would be no maintenance. After problem analysis was done with assistance from the Dental Health Division in Bangkok, Lampang Provincial Health Office found new vision to solve the problem, as follows: • Allow the community to participate in solving their own problems. • Equip the community with all essential information • Leave the decision-making process to the community
PROCEDURES
According to the concepts mentioned above, Lampang Provincial Health Office, LP.P.H.O., formulated the following strategies:
1. To select the target areas by prevalence and severity of the fluorosis problems. 2. To define the role and responsibilities of all related government health personnel. 3. To gather and analyse all essential information. 4. To present the information and alternatives to the communities. 5. To leave the decision making and the implementation of the same to the
communities. 6. To monitor and support the communities actions.
1. Target areas. The data of fluoride level in drinking water from 1998 LP.P.H.O. Survey showed that there were 116 areas with excess fluoride level, i.e. more than 0.5 mg/L. However, the fluoride drinking water concentrations that causes moderate to severe fluorosis were believed to be more than 1.5 mg/L. LP.P.H.O set the areas with fluoride levels of more than 1.5 mg/L as target areas in the 2-year project, 2000-2001. Thus only 27 areas in 9 out of 13 districts of Lampang were set as target areas. A pilot
122 Author: C Vuttipitayamongkol
3rd Int. Workshop on Fluorosis Prevention and Defluoridation of Water ISFR, EnDeCo & ICOH
project was launched to include 3 areas, with the hope that the experience gained from the this project would benefit the implementation in the other areas.
2. Responsibilities. As a new concept project, LP.P.H.O. had to define a clear coordination and a line of command of the whole project. It was done as follows:
2.1 Sub- district level. Roles of health personnel in health stations who are directly responsible for the health of the people in the community are:
• mediators, • data collectors, • essential information providers and • community supporters.
2.2 District level. The personnel at this level are dental personnel, dentists and dental nurses, in the district hospital and the district health officers who are responsible for the quality of community drinking water. Their roles are;
technical consultants for the Sub-district level and
coordination within and between Districts
2.3 Provincial level The personnel in this level are sanitarians who are responsible for providing safe water and dental personnel. Their roles are:
• project manager. • technical supporter to all levels. • organiser of the workshop for exchanging experience.
3. Essential information. In making a good decision, the community need correct, complete and up to date information. The needed information is as follows:
• number and location of water sources, • fluoride concentration and other water quality • prevalence and severity of dental fluorosis in the community.
Personnel at the provincial level technically supported by technocrat from the Ministry of Public Health in Bangkok to make questionnaires, survey forms and calibrated the district and sub-district survey teams. District health personnel under the supervision of provincial personnel were responsible for the analysis of all data.
4. Presentation of options. District health personnel presented all information to the community in order to increase community awareness and recognition. This process also motivated the community to solve their own problems. The district health personnel also proposed alternatives in problem solving which included the information of cost-benefit, advantage-disadvantage of each alternative to the communities.
5. Community decision and implementation. After receiving all information, the community discussed their solutions in their groups with technical assistants from the health workers until they found their own way to solve the problem based on
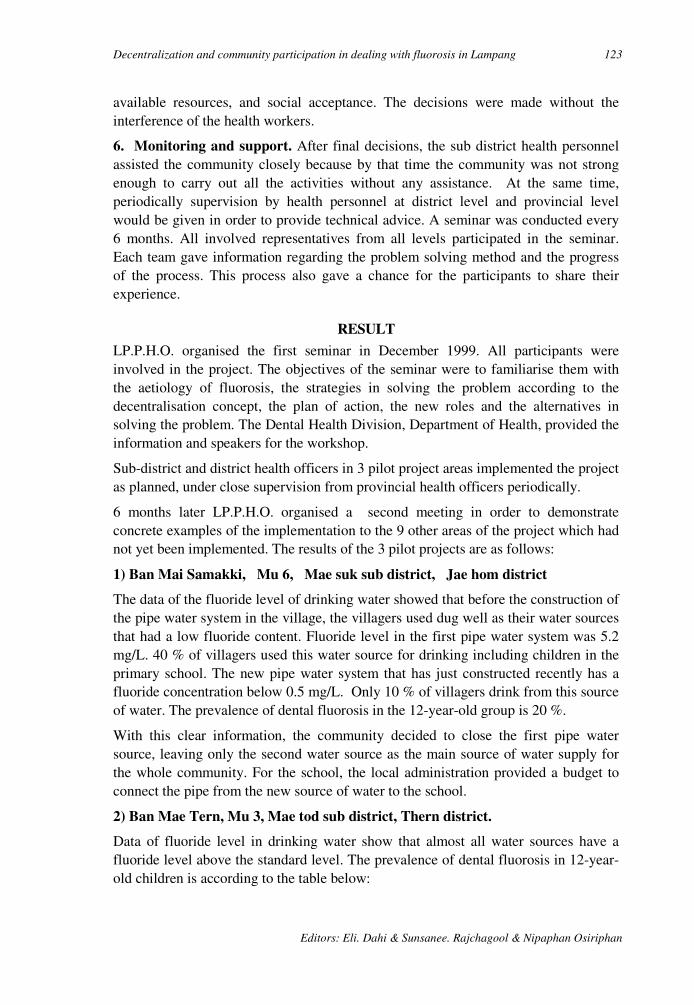
Decentralization and community participation in dealing with fluorosis in Lampang 123
Editors: Eli. Dahi & Sunsanee. Rajchagool & Nipaphan Osiriphan
available resources, and social acceptance. The decisions were made without the interference of the health workers.
6. Monitoring and support. After final decisions, the sub district health personnel assisted the community closely because by that time the community was not strong enough to carry out all the activities without any assistance. At the same time, periodically supervision by health personnel at district level and provincial level would be given in order to provide technical advice. A seminar was conducted every 6 months. All involved representatives from all levels participated in the seminar. Each team gave information regarding the problem solving method and the progress of the process. This process also gave a chance for the participants to share their experience.
RESULT
LP.P.H.O. organised the first seminar in December 1999. All participants were involved in the project. The objectives of the seminar were to familiarise them with the aetiology of fluorosis, the strategies in solving the problem according to the decentralisation concept, the plan of action, the new roles and the alternatives in solving the problem. The Dental Health Division, Department of Health, provided the information and speakers for the workshop.
Sub-district and district health officers in 3 pilot project areas implemented the project as planned, under close supervision from provincial health officers periodically.
6 months later LP.P.H.O. organised a second meeting in order to demonstrate concrete examples of the implementation to the 9 other areas of the project which had not yet been implemented. The results of the 3 pilot projects are as follows:
1) Ban Mai Samakki, Mu 6, Mae suk sub district, Jae hom district
The data of the fluoride level of drinking water showed that before the construction of the pipe water system in the village, the villagers used dug well as their water sources that had a low fluoride content. Fluoride level in the first pipe water system was 5.2 mg/L. 40 % of villagers used this water source for drinking including children in the primary school. The new pipe water system that has just constructed recently has a fluoride concentration below 0.5 mg/L. Only 10 % of villagers drink from this source of water. The prevalence of dental fluorosis in the 12-year-old group is 20 %.
With this clear information, the community decided to close the first pipe water source, leaving only the second water source as the main source of water supply for the whole community. For the school, the local administration provided a budget to connect the pipe from the new source of water to the school.
2) Ban Mae Tern, Mu 3, Mae tod sub district, Thern district.
Data of fluoride level in drinking water show that almost all water sources have a fluoride level above the standard level. The prevalence of dental fluorosis in 12-year-old children is according to the table below:
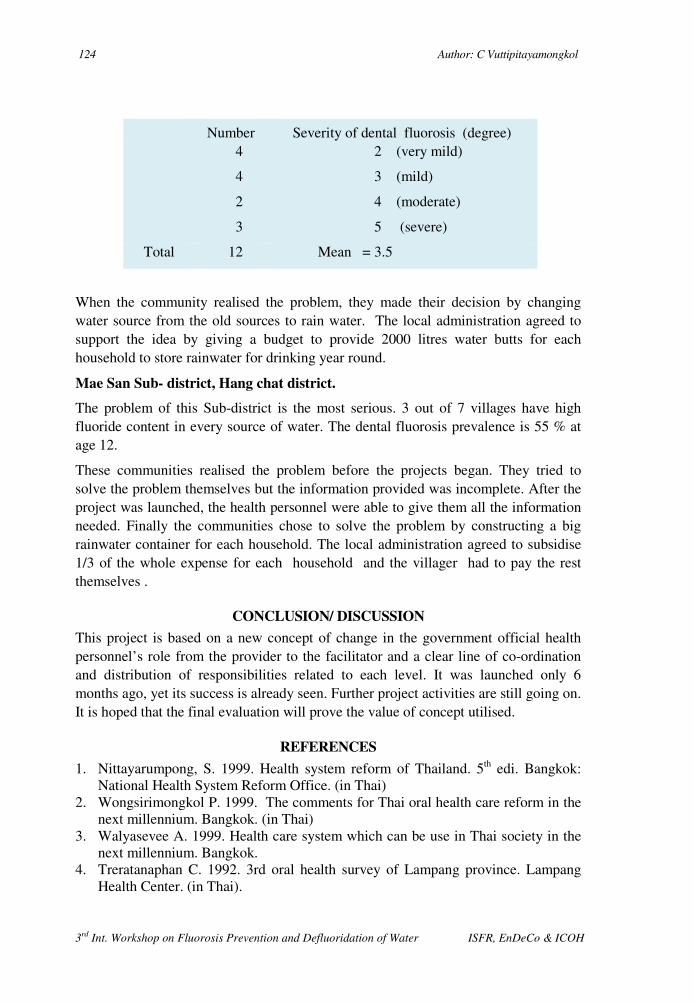
124 Author: C Vuttipitayamongkol
3rd Int. Workshop on Fluorosis Prevention and Defluoridation of Water ISFR, EnDeCo & ICOH
Number Severity of dental fluorosis (degree) 4
4
2
3
2 (very mild)
3 (mild)
4 (moderate)
5 (severe)
Total 12 Mean = 3.5
When the community realised the problem, they made their decision by changing water source from the old sources to rain water. The local administration agreed to support the idea by giving a budget to provide 2000 litres water butts for each household to store rainwater for drinking year round.
Mae San Sub- district, Hang chat district.
The problem of this Sub-district is the most serious. 3 out of 7 villages have high fluoride content in every source of water. The dental fluorosis prevalence is 55 % at age 12.
These communities realised the problem before the projects began. They tried to solve the problem themselves but the information provided was incomplete. After the project was launched, the health personnel were able to give them all the information needed. Finally the communities chose to solve the problem by constructing a big rainwater container for each household. The local administration agreed to subsidise 1/3 of the whole expense for each household and the villager had to pay the rest themselves .
CONCLUSION/ DISCUSSION
This project is based on a new concept of change in the government official health personnel’s role from the provider to the facilitator and a clear line of co-ordination and distribution of responsibilities related to each level. It was launched only 6 months ago, yet its success is already seen. Further project activities are still going on. It is hoped that the final evaluation will prove the value of concept utilised.
REFERENCES
1. Nittayarumpong, S. 1999. Health system reform of Thailand. 5th edi. Bangkok: National Health System Reform Office. (in Thai)
2. Wongsirimongkol P. 1999. The comments for Thai oral health care reform in the next millennium. Bangkok. (in Thai)
3. Walyasevee A. 1999. Health care system which can be use in Thai society in the next millennium. Bangkok.
4. Treratanaphan C. 1992. 3rd oral health survey of Lampang province. Lampang Health Center. (in Thai).
3rd International Workshop on Fluorosis Prevention and Defluoridation of Water 125
A Case study on Community Decision Making to Combat
Fluorosis in Mae–Son, Thailand
W Tansukanun* Thailand
SUMMARY: Mae–Son subdistrict, is a fluorosis area in the northern part of Thailand. In
March 1999, a dental health team from the Intercountry Centre for Oral Health, ICOH,
checked the fluorosis occurrence in the area and introduced education materials for the
community. The people began to learn how to prevent fluorosis by consuming low fluoride
drinking water and wanted to solve their problem. Some villagers went to ICOH to study
how to build a bone–char kiln and how to reduce the high fluoride concentration in the
drinking water by using the bone char filter. Then they learned about alternative options
including long term hydrogeological provision of remote water sources. Finally they decided
to go for immediate building of household rainwater tanks.
Key words: Community, decision making, fluorosis, problem solving, Thailand, rainwater collection, bottled water, remote sources.
INTRODUCTION
Study area. Mae-Son is a Subdistrict in the Hang-Chat district, Lampang Province, Thailand. It is about 8 km on the eastern side of the Chiangmai–Lamgpang road. Most of the land is paddy. Some areas are hilly and wooded. There is a hot spring about 2 km from Mae–Son. There are 7 villages in Mae-Son populated by 4,486 people in 1,153 households1. Most of the Mae-Son native people are farmers. 40 % of the population are poor. The average income is 18,000 baht per household per year2. One of the Mae-Son villages has been affected by fluorosis for a long time. At that time they used to drink water from shallow wells. During 1983–1985 the government set up 6 pipe-water systems for 7 villages. Then people stopped using the shallow wells and started using the pipe-water, which they trusted was more pure and comfortable in use.
Affected children. In the past five years, dental fluorosis was observed increasingly in children in 3 villages. A boy, 15 years old, did not drink the pipe-water and had normal teeth. His sister, 12 years old, has been drinking the pipe-water but got dental fluorosis. Many children, about 45 %, had moderate to severe degree of dental-fluorosis. They called the dental fluorosis Kiaw-Lai, which means the striped teeth. In March 1999, dental health staff from the Intercountry Center for Oral Health, ICOH, came to the subdistrict and introduced new educational material about fluorosis3.
* Health Promotion Centre, Region 10, Chiang Mai, Thailand. E-mail: [email protected]
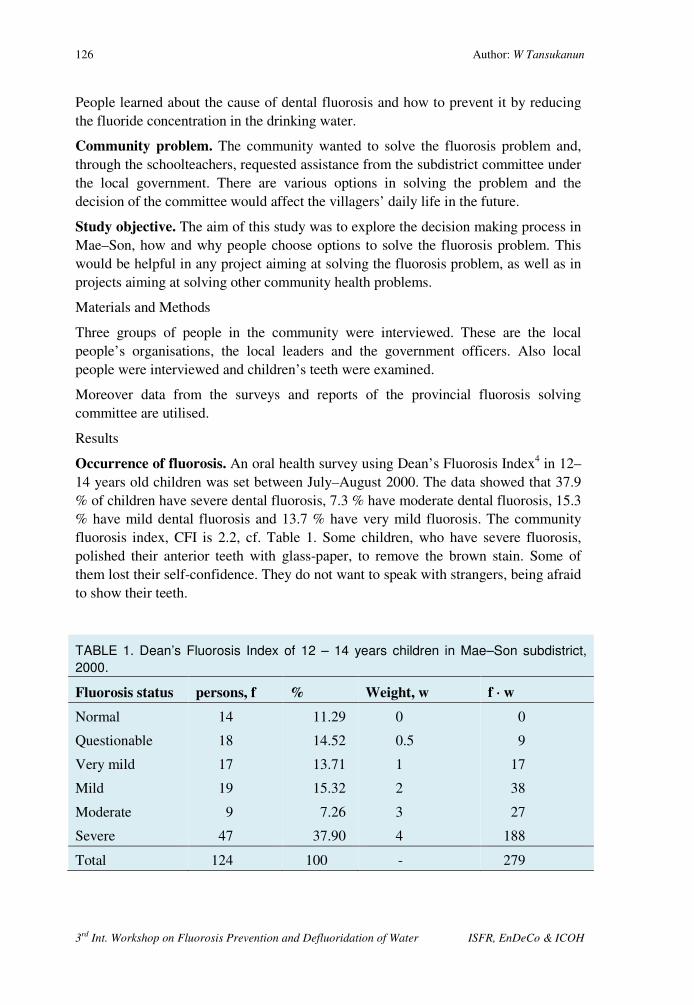
126 Author: W Tansukanun
3rd Int. Workshop on Fluorosis Prevention and Defluoridation of Water ISFR, EnDeCo & ICOH
People learned about the cause of dental fluorosis and how to prevent it by reducing the fluoride concentration in the drinking water.
Community problem. The community wanted to solve the fluorosis problem and, through the schoolteachers, requested assistance from the subdistrict committee under the local government. There are various options in solving the problem and the decision of the committee would affect the villagers’ daily life in the future.
Study objective. The aim of this study was to explore the decision making process in Mae–Son, how and why people choose options to solve the fluorosis problem. This would be helpful in any project aiming at solving the fluorosis problem, as well as in projects aiming at solving other community health problems.
Materials and Methods
Three groups of people in the community were interviewed. These are the local people’s organisations, the local leaders and the government officers. Also local people were interviewed and children’s teeth were examined.
Moreover data from the surveys and reports of the provincial fluorosis solving committee are utilised.
Results
Occurrence of fluorosis. An oral health survey using Dean’s Fluorosis Index4 in 12–14 years old children was set between July–August 2000. The data showed that 37.9 % of children have severe dental fluorosis, 7.3 % have moderate dental fluorosis, 15.3 % have mild dental fluorosis and 13.7 % have very mild fluorosis. The community fluorosis index, CFI is 2.2, cf. Table 1. Some children, who have severe fluorosis, polished their anterior teeth with glass-paper, to remove the brown stain. Some of them lost their self-confidence. They do not want to speak with strangers, being afraid to show their teeth.
TABLE 1. Dean’s Fluorosis Index of 12 – 14 years children in Mae–Son subdistrict,
2000.
Fluorosis status persons, f % Weight, w f ⋅⋅⋅⋅ w
Normal
Questionable
Very mild
Mild
Moderate
Severe
14
18
17
19
9
47
11.29
14.52
13.71
15.32
7.26
37.90
0
0.5
1
2
3
4
0
9
17
38
27
188
Total 124 100 - 279

A case study on community decision making to combat fluorosis in Mae–Son, Thailand 127
Editors: Eli. Dahi & Sunsanee. Rajchagool & Nipaphan Osiriphan
Fluoride in water. In February 2000, the Environmental Health Center Region 10, reported that 3 out of 6 village pipe-water systems in Mae–Son had a high fluoride content5, cf. Table 2. Furthermore, all villages operated the pipe-water systems with poor revenue. Most of the equipment in the systems, e.g. water pumps, filters, etc, needed repair. Also there was a lack of personnel to maintain the schemes.
TABLE 2. Village Pipe–water system in Mae–Son subdistrict, in February 2000.
Village Size Source
Capacity,
m3/hr Households mg F/L
1
2
3
4
5
6
Large
Medium
Large
Medium
Medium
Large
Artesian well
Artesian well
Artesian well
Artesian well
Shallow well
Shallow well
12.0
10.0
10.0
7.3
7.0
7.2
156
129
270
185
132
149
10.0
4.6
0.2
8.5
0.3
0.14
Not only the village pipe-water had a high fluoride content, also the school pipe-water had fluoride concentration of 11 mg/L. The principal of Mae-Son secondary school observed that many students suffered from dental fluorosis. She informed the subdistrict committee and the committee agreed that fluorosis is their community’s problem. They knew many of their children had mottle enamel or brown stained teeth. They tried to find ways of solving this problem. In April 1999 the subdistrict committee, teachers and some villagers visited ICOH in Chiang Mai to learn more about fluorosis and defluoridation of water. They also visited some villages in Chiang Mai and Lamphoon to see how they had solved the problem there.
Defluoridators. The villagers then set up a plan to build a bone-char kiln costing 100,000 baths. They also planned to make household defluoridators to supply people in three villages. They thought that bone-char defluoridators were the best answer to their problem. They asked for funds from the subdistrict health office. This office forwarded the request to the Provincial Health Office, which then asked for technical assistance from the Health Department in Bangkok. This resulted in involvement of several groups and several discussions on how to attack the problem. In September 1999 it was proposed to the subdistrict committee to focus on alternative ways to solve the problem through people’s participation. The subdistrict committee abandoned the original plan to build a bone-char kiln for three reasons: A) Lack of funds B) Lack of personnel to work with the kiln and C) Experiences on bad odour from the kiln during operation.
Pipe schemes. An alternative plan was set, based on development of the village 3 pipe–water system to sell low fluoride water to other villages. The subdistrict

128 Author: W Tansukanun
3rd Int. Workshop on Fluorosis Prevention and Defluoridation of Water ISFR, EnDeCo & ICOH
committee wanted to sell union water shares to people in village 3 and villages 1, 2 and 5. People in village 3 should hold most of the shares. The other villages would hold less. The profit from selling pipe–water would be distributed to everyone who held share at the end of the year. When the committee purposed this plan to the village 3, the community did not agree. They were afraid that the water supply would not be enough for all villages. They set up water collection sites with meter for each neighbouring village. The neighbouring villagers could collect the water and pay according to recorded consumption. But only few people came to fetch the water.
The subdistrict leader discussed with the chairman of the subdistrict committee and the subdistrict health worker to ask other government offices for help. The Geological– Resources Department came to sink 4 artesian wells in three of the villages. All four wells had high fluoride content. Their hope to get a safe water supply vanished, but they did not give up. They asked the Irrigation Department to sink another three wells. Two of these wells had a low fluoride content, but one well was remote, 0.5 km from the system. The other was about 1.5 km from the system, and the electricity did not extend to this area. So they needed funds to make a pipeline and a water pump. The Provincial Health Office suggested that they could draw up a budget for the pipeline for the next year, 2001.
Rainwater tanks. When the subdistrict committee found that constructing the pipe–water system was a long-term plan, they started to think that household rainwater tanks might be a better option. A rainwater tank costs 5,000 baht or US$ 200, thus unaffordable to some villagers. The committee agreed to provide 1,000 baht for every household that built a rain–water tank, but the government officer in Hang-Chat district said that the law does not permit for such arrangements.
Different households in village 1, 2 and 5 took immediate action and installed rainwater tanks on their own. 74 household rainwater tanks were set up within 3 months. This corresponds to only 16.7 % of households. The subdistrict committee planned to build 99 m3 water tanks for each village in 2001. These tanks can store rainwater or water from other sources for the villages. It is hoped that this would solve the problem for the other 83.3 % households. The committee also asked the owner of shallow wells that have low fluoride water to
FIGURE 1. Number of household with rainwater
tanks in the fluorosis villages before and after
presenting the rainwater tank concept in August-
October 1999.
0
10
20
30
40
50
60
70
80
Village 1 Village 2 Village 5
No
of
rain
wate
r ta
nks
Before
After

A case study on community decision making to combat fluorosis in Mae–Son, Thailand 129
Editors: Eli. Dahi & Sunsanee. Rajchagool & Nipaphan Osiriphan
clean their wells and share with other people. Because people believe that generosity with water brings health, wealth and happiness, the owners of the wells were happy to share their water with their neighbours. But water from shallow wells is microbially contaminated. The health worker advised the people to boil the water before drinking. But people did not like to drink boiled water they preferred raw water, which they thought tastes better.
Bottled water. While the subdistrict committee planned to build a community water tank for each village in 2001, people started to help themselves. Some of them bought a cement jar. Some of them bought bottled water for daily drinking, because they can buy bottled–water easily and pay a small price at a time, even if it is more costly in the long run, compared with both pipe–water and rainwater. The Thai standard fluoride level in bottled water is 1.5 mg/L in agreement with the WHO guidelines of 19847. There was a study showed that the optimum level of fluoride content in water for Thais was 0.5 mg/L, which would not create Dental Fluorosis8.Previous investigations have shown that 11.72 % of the bottled water in this area is above 0.5 mg/L9, so people are still at fluoride risk when using the bottled water.
CONCLUSION Multiple options. There are many alternative ways of solving the problem of high fluoride content in drinking water. People make their own decision, depending on their affords, their knowledge, their values and their culture. The subdistrict committee may not be able to make the most suitable decisions for the villagers. It is the responsibility of the health teams to inform the people as much as possible about the options so they can select their own ways to deal with the problem. The technology to detect and to reduce the fluoride in drinking water should be simple enough to be handled by the villagers and easy to find in the market. The national standard of fluoride in drinking water should be low enough to protect people from fluoride toxicity.
ACKNOWLEDGEMENTS Thanks to the Dental Health Staff of Lampang Provincial Health Office, the Environmental Health Center Region 10, Hang-Chat health team, the Mae–Son health team, Dr. Sunsanee Rajchagool and her staff for their help and useful suggestions. Any benefit from this paper should be declared to all Mae-son people.
FIGURE 2. Type of drinking water for household in the fluorosis villages, Mae - Son subdistrict, Lumpang, Thailand.
0
10
20
30
40
50
60
70
Rain water
Pipe -water
Surface well
Bottled water
%
March
September

130 Author: W Tansukanun
3rd Int. Workshop on Fluorosis Prevention and Defluoridation of Water ISFR, EnDeCo & ICOH
REFERENCES
1. Mae–Son Subdistrict Committee: Annual Report 1998. (in Thai) (in Thai) 2. Hang–Chat District Socio–economic Report 1998. (in Thai) 3. ICOH 1999. Teeth without Dental Fluorosis, Klang-veing Publishers, Chiangmai,
Thailand 4. WHO 1993. Oral Health Survey Basic method, 4th Edition.. 5. Environmental Health Centre Region 10 : Village Pipe–water System in Mae–
Son Subdistrict, Situation Analysis Report . February 2000. (in Thai) 6. Lumpang Provincial Health Office 2000. Reports of high fluoride problem
solving committee meeting. (in Thai). 7. WHO 1984. Guidelines for Drinking Water Quality. Vol. 2. World Health
Organization; Geneva 8. Phantumvanish, P,et.al.: The relationship of Fluoride in drinking water and
Dental Fluorosis in Chiangmai,10th Science and Technology meeting , Chiangmai University 1984. (in Thai)
9. ICOH 1997. Fluoride in Bottled water and Consumers Protection, Klang-veing Publishers, Chiangmai, Thailand. p 32 – 33. (in Thai)

131
Editors: Eli Dahi, Sunsanee Rajchagool & Nipaphan Osiriphan
Session 4:
Guidelines

132
3rd Int. Workshop on Fluorosis Prevention and Defluoridation of Water ISFR, EnDeCo & ICOH
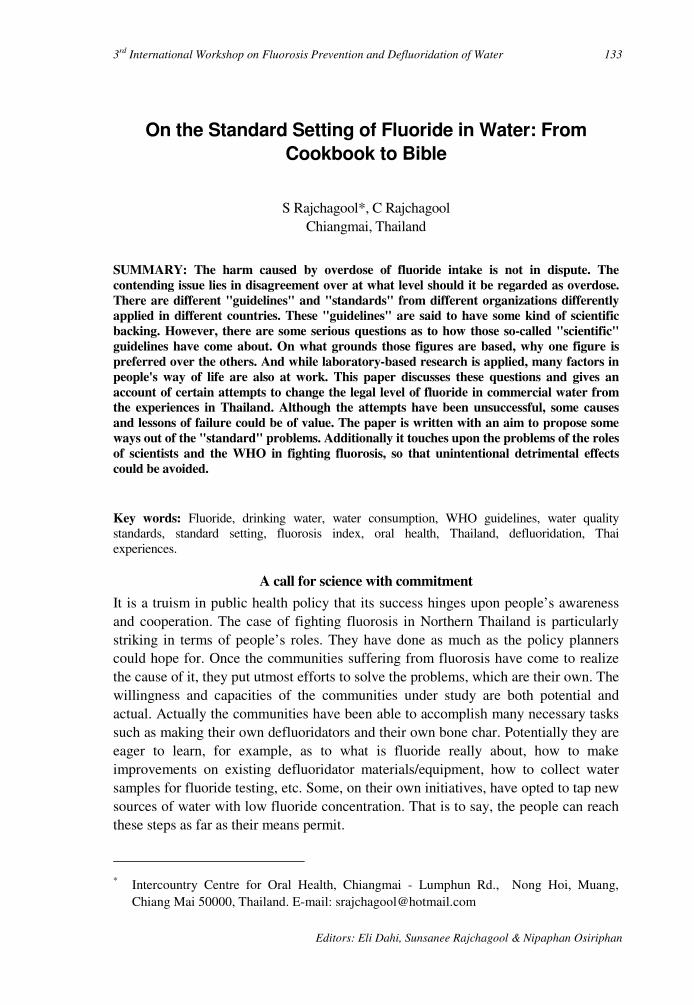
3rd International Workshop on Fluorosis Prevention and Defluoridation of Water 133
Editors: Eli Dahi, Sunsanee Rajchagool & Nipaphan Osiriphan
On the Standard Setting of Fluoride in Water: From
Cookbook to Bible
S Rajchagool*, C Rajchagool Chiangmai, Thailand
SUMMARY: The harm caused by overdose of fluoride intake is not in dispute. The
contending issue lies in disagreement over at what level should it be regarded as overdose.
There are different "guidelines" and "standards" from different organizations differently
applied in different countries. These "guidelines" are said to have some kind of scientific
backing. However, there are some serious questions as to how those so-called "scientific"
guidelines have come about. On what grounds those figures are based, why one figure is
preferred over the others. And while laboratory-based research is applied, many factors in
people's way of life are also at work. This paper discusses these questions and gives an
account of certain attempts to change the legal level of fluoride in commercial water from
the experiences in Thailand. Although the attempts have been unsuccessful, some causes
and lessons of failure could be of value. The paper is written with an aim to propose some
ways out of the "standard" problems. Additionally it touches upon the problems of the roles
of scientists and the WHO in fighting fluorosis, so that unintentional detrimental effects
could be avoided.
Key words: Fluoride, drinking water, water consumption, WHO guidelines, water quality standards, standard setting, fluorosis index, oral health, Thailand, defluoridation, Thai experiences.
A call for science with commitment
It is a truism in public health policy that its success hinges upon people’s awareness and cooperation. The case of fighting fluorosis in Northern Thailand is particularly striking in terms of people’s roles. They have done as much as the policy planners could hope for. Once the communities suffering from fluorosis have come to realize the cause of it, they put utmost efforts to solve the problems, which are their own. The willingness and capacities of the communities under study are both potential and actual. Actually the communities have been able to accomplish many necessary tasks such as making their own defluoridators and their own bone char. Potentially they are eager to learn, for example, as to what is fluoride really about, how to make improvements on existing defluoridator materials/equipment, how to collect water samples for fluoride testing, etc. Some, on their own initiatives, have opted to tap new sources of water with low fluoride concentration. That is to say, the people can reach these steps as far as their means permit.
* Intercountry Centre for Oral Health, Chiangmai - Lumphun Rd., Nong Hoi, Muang,
Chiang Mai 50000, Thailand. E-mail: [email protected]

134 Authors: S. Rajchagool & C. Rajchagool
3rd Int. Workshop on Fluorosis Prevention and Defluoridation of Water ISFR, EnDeCo & ICOH
However, there are problems beyond the efforts of people themselves. One essential among them is the question: "how do we know what is the safe limit of fluoride intake? Or, to put it in another manner, what is the maximum permissible level of fluoride concentration beyond which is overdose? This is a very perplexing question for both the people as well as the professionals. If the unsafe level remains (at 1.5 mg/L1 in Thailand, in Tanzania even at 82), it naturally preempts all other needful preventive measures. If it could be adjusted, it would raise public awareness to a new level. The prospect of action will bring out health organizations and personnel. Their concerns will directly affect the awareness of the people. The more compatible they are, the more forceful development efforts from the people will be.
From the people’s standpoint, naturally, the communities which are exposed to the danger of fluoride are not in a position to engage in a debate of a highly scientific nature. This role is a challenge to the professionals representing them. In this regard people’s health largely depend upon professional assistance. On the path of development the people need fellow-travellers, be they professionals, state agents, or even politicians, as their allies.
Although there are two camps of thinking on the effects of fluoride among professionals, be they dentists, chemists, orthopedists, etc., one common ground of communication among them is what should be the maximum level of fluoride in water. It is known as the maximum level question. As to another question known as the optimal level question is rather contentious. The question specifically comes from those who see the benefits of water fluoridation that ask: "what is the optimal level of fluoride in water? Whereas those who are against water fluoridation see it as non-question. Given the absence of general consensus regarding the usefulness and harmfulness of systemic fluoride intake+, the question of the optimal level lies outside the scope of this paper.
THE PLURALITY AND UNRELIABILITY OF "THE STANDARDS"
IN THAILAND Results from research carried out by the ICOH during 1981 - 1983 (P. Punthumvanit et. al. ,1984 )
2 indicate that the narrow range between 0.4-0.65 mg/L is the borderline above which community dental fluorosis occurs. However it does not mean that the dental fluorosis is absent under the borderline. It still does occur, but among limited number of individuals. Hence, as far as the community fluorosis is concerned, the research team is of the opinion that 0. 5 mg/L should be set as the maximum tolerable level of fluoride.
+ The authors agree absolutely with those who find water fluoridation, which results in systemic absorption in the whole body, could bring more harm than gain. More effective and safe usage of fluoride for dental health could be better achieved by means of topical application.
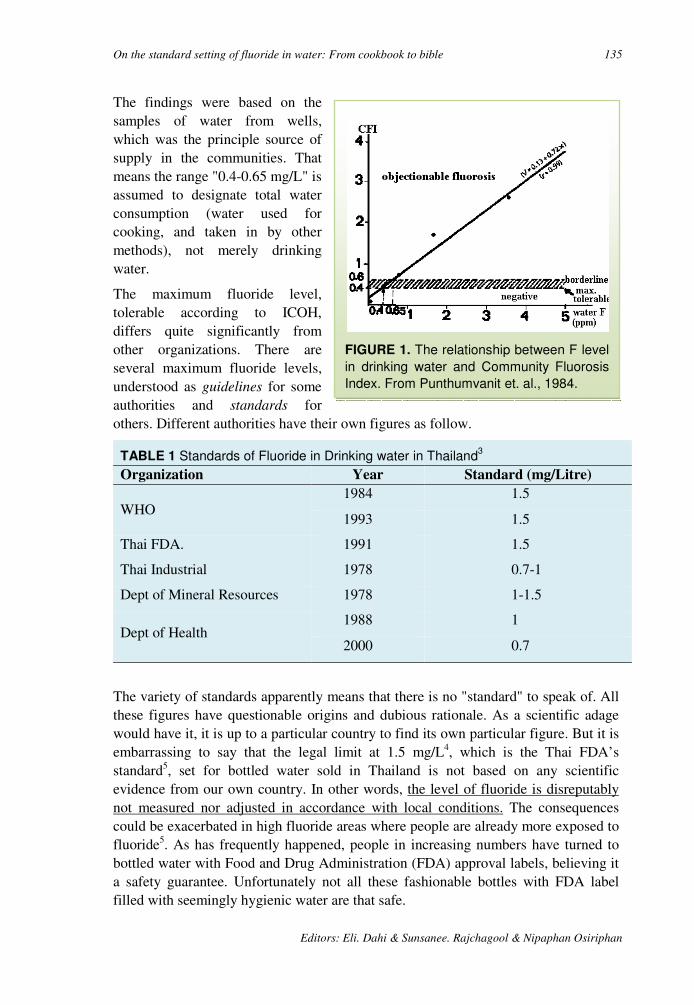
On the standard setting of fluoride in water: From cookbook to bible 135
Editors: Eli. Dahi & Sunsanee. Rajchagool & Nipaphan Osiriphan
FIGURE 1. The relationship between F level
in drinking water and Community Fluorosis
Index. From Punthumvanit et. al., 1984.
The findings were based on the samples of water from wells, which was the principle source of supply in the communities. That means the range "0.4-0.65 mg/L" is assumed to designate total water consumption (water used for cooking, and taken in by other methods), not merely drinking water.
The maximum fluoride level, tolerable according to ICOH, differs quite significantly from other organizations. There are several maximum fluoride levels, understood as guidelines for some authorities and standards for others. Different authorities have their own figures as follow.
TABLE 1 Standards of Fluoride in Drinking water in Thailand3
Organization Year Standard (mg/Litre)
WHO 1984 1.5
1993 1.5
Thai FDA. 1991 1.5
Thai Industrial 1978 0.7-1
Dept of Mineral Resources 1978 1-1.5
Dept of Health 1988 1
2000 0.7
The variety of standards apparently means that there is no "standard" to speak of. All these figures have questionable origins and dubious rationale. As a scientific adage would have it, it is up to a particular country to find its own particular figure. But it is embarrassing to say that the legal limit at 1.5 mg/L4, which is the Thai FDA’s standard5, set for bottled water sold in Thailand is not based on any scientific evidence from our own country. In other words, the level of fluoride is disreputably not measured nor adjusted in accordance with local conditions. The consequences could be exacerbated in high fluoride areas where people are already more exposed to fluoride5. As has frequently happened, people in increasing numbers have turned to bottled water with Food and Drug Administration (FDA) approval labels, believing it a safety guarantee. Unfortunately not all these fashionable bottles with FDA label filled with seemingly hygienic water are that safe.
136 Authors: S. Rajchagool & C. Rajchagool
3rd Int. Workshop on Fluorosis Prevention and Defluoridation of Water ISFR, EnDeCo & ICOH
Since around 1977 due to growing health consciousness of the middle class and growing demand from tourists, bottled water has increasingly become a common item in the market. To avoid fluoride-containing water in the backyard, bottled water, for some, is the remedy. The changed consumers’ behaviour makes WHO guidelines for drinking-water quality, (1996)6 relevant and problematic at the same time. Its relevance springs from the industrial regulation of standard setting. The WHO publication provides a certain amount of fluoride to be referred to as a guideline, or often understood as a standard. The problematic side is related to two points ensued from this new consuming practice. First, a distinction is made between drinking water and water consumed by other means, and the amounts of fluoride therein. Secondly, the level of fluoride, meant as guidelines for some authorities and standards for others, is generally understood to be concerned with drinking water, and not water consumed by non-drinking methods. As a result attention is paid exclusively to drinking water consumption, in spite of the fact that, for some people’s way of life, non-drinking water consumption exceeds it.
Statistically put, around 90% of bottled drinking water of various attractive brands lucratively marketed, have a fluoride concentration not exceeding 0.5 mg/L which is, we strongly believe, the tolerable level of fluoride in drinking water for Thailand. The rest (around 10%) has a higher level. And around 1.5%7of this latter group has a fluoride content even higher than the legal limit. Thus a percentage of the bottled water in the market, some of which are officially approved, could well be a misleading health alternative measure.
The 10% portion does not seem to be very high. But things are not what they seem. This portion has its water resources and is usually manufactured in high fluoride areas. The story takes a tragico-comedy mode. High fluoride-containing water is bottled and sold to customers who must be spared from fluoride5. This is especially acute for those who already suffer from fluorosis. A common Thai saying "Escaping from a tiger, but running into a crocodile" - analogous to the English "Out of the frying pan into the fire" - is appropriate for this context.
ATTEMPTS TO STANDARDIZE THE "STANDARDS"
Against this background the ICOH published Fluoride in Bottled Water and Consumers' Protection, (1997) based on research results from high fluoride areas. A seminar on the same theme was organized in July 1997 to discuss the danger of fluoride and the need to reset the tolerable level of fluoride in bottled water. For this is particularly pressing for people in northern Thailand which the fluoride belts cross. The publication and the seminar were expected to sensitize the authorities and to bring the necessary change in the tolerable levels. The objectives were half realized. The Department of Health issued a new figure of tolerable fluoride quantity in bottled water (from 1 to 0.7 mg/L), but the FDA has not so far been persuadable.
Additionally the Dental Health Division, Department of Health held another seminar in March 2000. However, no subsequent outcome has been promising. In spite of a

On the standard setting of fluoride in water: From cookbook to bible 137
Editors: Eli. Dahi & Sunsanee. Rajchagool & Nipaphan Osiriphan
formal submission to reconsider the figure, there has been no indication that the FDA will change it.
THE MYSTERIOUS FIGURE "1.5"
It is customary in many countries that the value 1.5 mg/L is set as the maximum level for drinking water. For good or bad those countries have adopted the figure from WHO guidelines for drinking-water quality, (1996). It is a useful role for WHO, performing a function taking the benefit of the economy of scale, to provide a certain guideline figure for countries bereft of sufficient research capacities of their own. The WHO publication in question is well aware of the importance of the specificity in each locality and a particular context. It is explicit that the figure (1.5 mg/L) is in essence a guideline, and not a recommendation, nor a standard. The publication also gives an additional explanation of the level 1.5 mg/L:
“ In setting national standards for fluoride, it is particularly important to consider climatic conditions, water intake, and intake of fluoride from other sources (e.g. from food and air)”.(p236 )
The addendum is nicely stated as a precaution. In effect, however, the figure "1.5" mg/L has been prominent, and the caveat marginal in the general understanding. Over years, the former has become an idée reçue if not idée fixe, and the latter 'lost and not found'. It is understandable why they have turned into what they are now. The countries that have adopted the WHO guideline are, by and large, underdeveloped countries. Their inadequate resources for research have compelled them to accept the guideline in the first place. To advise them to find their own figures according to their own circumstances is to urge them to conduct their own research. That is not a realistic assumption. The situation is something of paradox. By way of analogy, a teacher of mathematics gave a ready-made, albeit incomplete, answer to a student who is not quite capable of a calculation. Later the same teacher still insists that the student should come up with his own calculation. One perhaps cannot but ask why the answer of that nature is given in the first place?
Being not sufficiently well equipped right at the beginning, hence following the guideline is naturally the easy way out for the developing countries. There should be no surprise why no research to find their own levels has really been carried out. In retrospect one can clearly see the process of metamorphosis of a hypothetical number from being simple proposition to being sacred principle. The guideline is not simply a guideline, but it has attained the status of standard. It has even become "the international standard", as the Thai FDA has put it. Their reasoning is that since it is the WHO, as an international organization, that has issued the figure. Therefore the figure should be regarded as the international standard. The WHO, in the eyes of many in the underdeveloped world, denotes a high degree of authority. Unfortunately or otherwise their publications, though titled as guidelines, carry the weight of credentials. "The international standard" could then even eventually become orthodoxy.

138 Authors: S. Rajchagool & C. Rajchagool
3rd Int. Workshop on Fluorosis Prevention and Defluoridation of Water ISFR, EnDeCo & ICOH
With a prior knowledge of the consequences, should the WHO not then be more thoughtful about its publications? Admittedly, the WHO cannot be held responsible for the actions and rules of its member countries. Certainly the WHO could justifiably affirm that Guidelines are merely guidelines, and not laws to be religiously followed. Nevertheless, once it is known that developing countries have their own misguided ways of making sense of the Guidelines, and the resulting detrimental effects are alarming, an international organization with noble aims such as the WHO may have second thoughts.
Granted the figure "1.5" mg/L is subject to local modification, the followers of the guidelines could argue that the figure certainly does not come from thin air, but must have been well thought out. It should therefore be normatively acceptable. A response can be in the form of question, i.e., from where does the figure come? What is the logic behind it? Not being a research institution as such, the WHO usually makes studies of and disseminates available data and information. That is to say the figure was derived from a study somewhere. But since no reference was made, the origin remains a mystery. Hence the adoptive countries have not firm grounds to stand on. It is highly probable that they might just follow the footsteps trailed along by feet of clay.
Nevertheless to give credit where it is due, the WHO has also stated the occurrence of fluorosis even at a point lower than 1.5 mg/L.
"Fluoride may give rise to mild dental fluorosis (prevalence: 12-33%) at drinking-water concentrations between 0.9 and 1.2 mg/litre. This has been confirmed in numerous studies, including a recent large-scale survey carried out in China, which showed that, with drinking-water containing 1 mg of fluoride per litre, dental fluorosis was detectable in 46% of the population examined." (p. 235)
This point in fact repeats earlier findings raised in another WHO document (1994)8. To let it see the light of day, it is opportune here to quote it at length:
“Hong Kong, for example, has adjusted the fluoride concentration in its drinking-water several times since water fluoridation began there in 1961, using different levels in the hot and cooler seasons and the endeavouring to find an appropriate year-long concentration. According the United States Public Health Service guidelines, the most appropriate concentration for Hong Kong would be around 0.8 mg/l. However, fluorosis in children was found to be still unacceptably high at that level. The concentration was reduced in several stages to 0.5 mg/l in 1988.
It can be stated that the recommended levels of fluoride in drinking –
water according to annual temperature, as listed in the United States
Public Health Service guidelines of 1962 ,are not appropriate for use in
tropical and subtropical areas of the world .Because higher -than -expected
levels of fluorosis have followed their application ,it seems that the
recommended range is too high for these areas, the level of 1.0 mg/l
On the standard setting of fluoride in water: From cookbook to bible 139
Editors: Eli. Dahi & Sunsanee. Rajchagool & Nipaphan Osiriphan
should be seen as and absolute upper limit, even in a cold climate, and 0.5
mg/l, now used in Hong Kong and recommended in the Gulf States, may
be an appropriate lower limit. “) p18)
Even with all these qualifications the Thai FDA just adhere to the high figure (1.5 mg/L). The figure, as the Thai FDA see it, comes from the book WHO guidelines for drinking-water quality, (1996). The book runs to almost 1,000 pages, a careful study of it (and other related WHO publications) would be extremely useful. It could save the FDA and other organizations time-consuming and hair-splitting debates.
To emphasize the earlier points once more, there can be no such thing as one-size-fit-all formula. No organization, and certainly not the WHO, has ever proclaimed a standard. If there were to be a standard, it needs to be a local standard, not an international one. But the process of changing the standard, legally stipulated by the FDA, is scientifically and bureaucratically very complicated. It requires a risk assessment according to Codex Guidelines (a joint FAO/WHO expert consultation). That means a great amount of an expensive endeavour and of a specific kind of research, the span of which takes not less than five consecutive years, to propose a new one.
The value of this high-sounding goal, complex and expensive in its execution, could be justifiable or even beyond reasonable doubt. But what can be questioned is the easy way in which the status quo was established in the first place. It is very simple to adopt the simplistic notion, but extremely complicated to change it. We all know that Thailand has limited resources to carry out her research to meet the Codex requirements. This is, however, not the worse case. There are many more developing countries that are in an even more difficult situation than Thailand.
It seems, for a bureaucratic authority, that apparent evidence in anthropological terms do not carry as much weight as results carried out in the name of science. At this juncture perhaps it is useful to remind ourselves that one of the criteria for public health policy is the promotion of people’s self-care. Since the policy wants people to find their own practical ways to advance their self-regulated well-being, it is imperative for the authorities to care about the standard.
To reiterate, in solving the fluorosis problem, a group of terminologies - standard, guideline, and tolerable, optimal, maximum, recommended level - need to be made intelligible more widely. Oftentimes they are used interchangeably, and occasionally loosely. But they have far reaching implications. It is very necessary, for both the professionals and the general public alike, to make distinction among them. And since each country must find its own tolerable fluoride level, in addition to ample available data, one practical and realistic way is to seriously take people's experiences into consideration. This alternative to the "bureaucratic-scientific method" can be achieved by means of anthropological field research. From this standpoint the professionals in alliance with the people can better identify the magnitude of the problems together with the ways and the means of solving them.

140 Authors: S. Rajchagool & C. Rajchagool
3rd Int. Workshop on Fluorosis Prevention and Defluoridation of Water ISFR, EnDeCo & ICOH
REFERENCES
1. Office of the Secretary of the Cabinet. Food and Drug Administration’s standard of bottled drinking water (in Thai). Rajakijanubeksa (State Gazette) September 1987, 58(154).
2. Gumbo FJ and Mkongo G. Water Defluoridation for Rural Fluoride Affected Communities in Tanzania. In: Dahi E and Bregnhøj H, editors. The International Society for Fluoride Research. Proceedings of the First International Workshop on Fluorosis and Defluoridation of Water; 1995 Oct 18-22; Ngurdoto, Tanzania. Auckland: New Zealand; 1997.
3. Phantumvanit P, Songpaisan Y, Hansawat S, Lekswat P and Shamshula RG. The relationship between fluoride in drinking water and community fluorosis index in Chiangmai, Thailand (in Thai). The program and abstracts of the 10th Meeting on Science and Technology of Thailand, Chiangmai University, Chiang Mai; 1990: p. 456, . (1984),
4. The Intercountry Centre for Oral Health, Fluoride in bottled drinking water and consumer protection, Intercountry Centre for Oral Health, Chiang Mai, 1997, (in Thai).
5. Promsahakha Na Sakolnakorn J. Fluoride content in bottled drinking water in high fluoride areas. In: Intercountry Centre for Oral Health. Fluoride in bottled drinking water and consumer protection (in Thai). Chieng Mai: Klang Wieng; 1997: p.52. .
6. Prasertsom P. The used of Fluoride in caries prevention (in Thai). In: The Department of Health. Health and environment situation. May 1998; 3(8).
7. World Health Organization. Guidelines for drinking-water quality (2ndedition) vol. 2: Health criteria and other supporting information. WHO: Geneva; 1996.
8. World Health Organization. Fluorides and oral health. World Health Organization Technical Report Series 846; 1994.
1. .
3rd International Workshop on Fluorosis Prevention and Defluoridation of Water 141
Editors: Eli Dahi, Sunsanee Rajchagool & Nipaphan Osiriphan
The State of Art of Small Community Defluoridation of
Drinking Water
Eli Dahi* Arusha, Tanzania & Copenhagen, Denmark
Summary: Numerous naturally occurring media and products are known to be capable to
remove fluoride from water. These can be categorised into three main groups; A) The bone
char, activated alumina, clay and similar compounds are sorption media, which are
normally packed in columns to be used for a certain operation period. The columns end up
saturated, subject to renewal or regeneration. B) Alum and lime in the Nalgonda technique,
polyaluminium chloride, lime and similar compounds resemble co-precipitation chemicals,
which are normally added batch wise. This precipitation technique produces a daily amount
of sludge. C) The calcium and phosphate compounds are the so-called contact precipitation
chemicals to be added to the water upstream a catalytic filter bed. In this contact
precipitation there is no sludge and no well-defined saturation of bed. However the bed
accumulates the precipitate and has to be rejuvenated.
Apart from the contact precipitation all the methods have been known already in the mid-
thirties, where fluoride was discovered as the agent behind "The Colorado Stain". There is
no universal method that can be sustained under all kinds of social, financial, environmental
and technical constraints. On the other hand all the methods mentioned do have advantages
and have shown to be capable of removing fluoride at certain conditions. These include: A)
The appropriate selection of the method. B) The utilisation of an appropriate design. C) The
provision of infrastructural support, and D) The continues motivation and training of users.
This paper provides guidelines examples of design of household and small community
defluoridation units.
Key words: Defluoridation of water, design, bone char, alum, alumina, clay,
contact precipitation, domestic defluoridation, community unit, column filters,
bucket filters, drum filters, Nalgonda, advantages, disadvantages,
rejuvenation, regeneration, bath treatment, plug flow, breakthrough, taboo
limitation, removal capacity, removal efficiency, cost.
Introduction
Occurrence of fluoride at too high levels in drinking water in developing countries is a serious health problem, closely related to the fluoride properties. In the drinking water, fluoride is tasteless, odourless, colourless and totally soluble, i. e. it does not produce any turbidity. Its detection demands analytical grade chemicals and laboratory equipment and skills. Its effects on health are delayed and, to a large extent, commutative and irreversible.
* Environmental Development Engineering Gourp (EnDeCo), Denmark. & Tanzania E-mail: [email protected]
142 Author: E Dahi
3rd Int. Workshop on Fluorosis Prevention and Defluoridation of Water ISFR, EnDeCo & ICOH
Similarly, the prevention of fluorosis through treatment of drinking water is a difficult task, which requires favourable socio-economical conditions of knowledge, motivation, prioritisation, discipline and technical and organisational set-ups. Many media and several water treatment methods are known to remove fluoride from water. However, due to lack of such favourable conditions, many initiatives on defluoridation of water have resulted in failures and frustrations 9. Therefore, in any attempt to mitigate the fluoride problem for an affected community, the provision of safe low fluoride water from alternative sources must be investigated as the first option.
In cases where alternative sources are not available, defluoridation of water is the only measure remaining to prevent fluorosis. However, the defluoridation methods are several and differ from each other. What may work in one community may not work in another. What may be appropriate at a certain time and stage of urbanisation, may not be in another. It is therefore most important to select appropriate defluoridation method very carefully, if a sustainable solution to the fluorosis problem is to be achieved.
This document introduces the basic characterisation of the removal methods. Then the most promising defluoridation methods are presented one by one: bone char, contact precipitation, Nalgonda, activated alumina and clay. Finely the methods presented are compared using indicators, which may be appropriate in developing countries.
Methods of high tech characteristics, e.g. reverse osmosis, electrodialysis and distillation, plus methods based on patented media and natural media of only theoretical interest are left out of the scope of this document. Reference is given to e. g. Heidewiller 199018 and Bulusu et al. 1993 7.
METHOD CHARACTERISATION
Scale & decentralisation. Conventional water treatment, as carried out in both rural and urban areas in industrialised countries, takes place:
• At large scale. • In a water works without direct involvement of the users. • Under the supervision of skilled operators. • Where the treatment affordability is taken for granted.
In such cases the method of treatment is sufficiently characterised by the utilised medium or the process in use. Such a setup may have serious limitations or disadvantages in less-developed countries. Especially in rural areas, where the water supply is scattered or does not exist, treatment may only be feasible at a decentralised level e. g. at community village level or at household level, cf. Table 1.
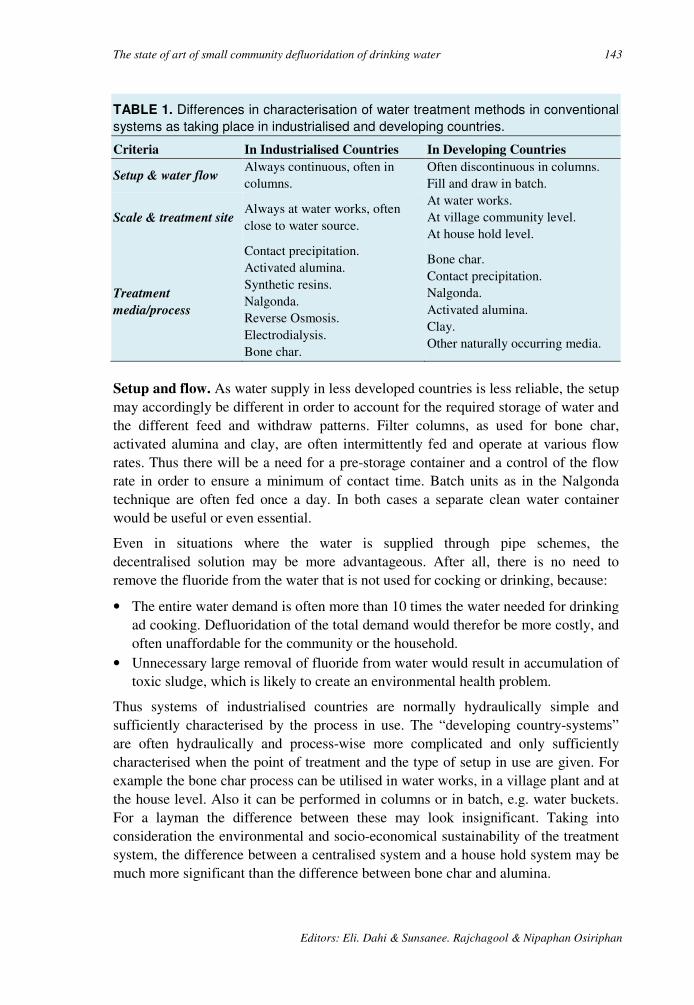
The state of art of small community defluoridation of drinking water 143
Editors: Eli. Dahi & Sunsanee. Rajchagool & Nipaphan Osiriphan
TABLE 1. Differences in characterisation of water treatment methods in conventional
systems as taking place in industrialised and developing countries.
Criteria In Industrialised Countries In Developing Countries
Setup & water flow Always continuous, often in columns.
Often discontinuous in columns. Fill and draw in batch.
Scale & treatment site Always at water works, often close to water source.
At water works. At village community level. At house hold level.
Treatment
media/process
Contact precipitation. Activated alumina. Synthetic resins. Nalgonda. Reverse Osmosis. Electrodialysis. Bone char.
Bone char. Contact precipitation. Nalgonda. Activated alumina. Clay. Other naturally occurring media.
Setup and flow. As water supply in less developed countries is less reliable, the setup may accordingly be different in order to account for the required storage of water and the different feed and withdraw patterns. Filter columns, as used for bone char, activated alumina and clay, are often intermittently fed and operate at various flow rates. Thus there will be a need for a pre-storage container and a control of the flow rate in order to ensure a minimum of contact time. Batch units as in the Nalgonda technique are often fed once a day. In both cases a separate clean water container would be useful or even essential.
Even in situations where the water is supplied through pipe schemes, the decentralised solution may be more advantageous. After all, there is no need to remove the fluoride from the water that is not used for cocking or drinking, because:
• The entire water demand is often more than 10 times the water needed for drinking ad cooking. Defluoridation of the total demand would therefor be more costly, and often unaffordable for the community or the household.
• Unnecessary large removal of fluoride from water would result in accumulation of toxic sludge, which is likely to create an environmental health problem.
Thus systems of industrialised countries are normally hydraulically simple and sufficiently characterised by the process in use. The “developing country-systems” are often hydraulically and process-wise more complicated and only sufficiently characterised when the point of treatment and the type of setup in use are given. For example the bone char process can be utilised in water works, in a village plant and at the house level. Also it can be performed in columns or in batch, e.g. water buckets. For a layman the difference between these may look insignificant. Taking into consideration the environmental and socio-economical sustainability of the treatment system, the difference between a centralised system and a house hold system may be much more significant than the difference between bone char and alumina.
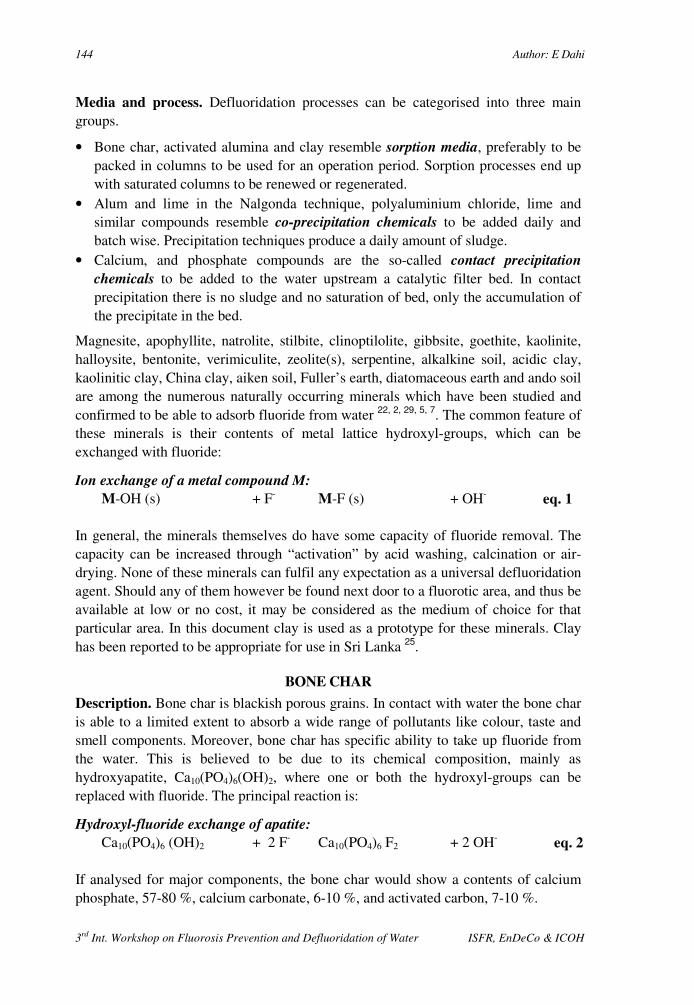
144 Author: E Dahi
3rd Int. Workshop on Fluorosis Prevention and Defluoridation of Water ISFR, EnDeCo & ICOH
Media and process. Defluoridation processes can be categorised into three main groups.
• Bone char, activated alumina and clay resemble sorption media, preferably to be packed in columns to be used for an operation period. Sorption processes end up with saturated columns to be renewed or regenerated.
• Alum and lime in the Nalgonda technique, polyaluminium chloride, lime and similar compounds resemble co-precipitation chemicals to be added daily and batch wise. Precipitation techniques produce a daily amount of sludge.
• Calcium, and phosphate compounds are the so-called contact precipitation
chemicals to be added to the water upstream a catalytic filter bed. In contact precipitation there is no sludge and no saturation of bed, only the accumulation of the precipitate in the bed.
Magnesite, apophyllite, natrolite, stilbite, clinoptilolite, gibbsite, goethite, kaolinite, halloysite, bentonite, verimiculite, zeolite(s), serpentine, alkalkine soil, acidic clay, kaolinitic clay, China clay, aiken soil, Fuller’s earth, diatomaceous earth and ando soil are among the numerous naturally occurring minerals which have been studied and confirmed to be able to adsorb fluoride from water 22, 2, 29, 5, 7. The common feature of these minerals is their contents of metal lattice hydroxyl-groups, which can be exchanged with fluoride:
Ion exchange of a metal compound M: M-OH (s) + F- M-F (s) + OH- eq. 1
In general, the minerals themselves do have some capacity of fluoride removal. The capacity can be increased through “activation” by acid washing, calcination or air-drying. None of these minerals can fulfil any expectation as a universal defluoridation agent. Should any of them however be found next door to a fluorotic area, and thus be available at low or no cost, it may be considered as the medium of choice for that particular area. In this document clay is used as a prototype for these minerals. Clay has been reported to be appropriate for use in Sri Lanka 25.
BONE CHAR
Description. Bone char is blackish porous grains. In contact with water the bone char is able to a limited extent to absorb a wide range of pollutants like colour, taste and smell components. Moreover, bone char has specific ability to take up fluoride from the water. This is believed to be due to its chemical composition, mainly as hydroxyapatite, Ca10(PO4)6(OH)2, where one or both the hydroxyl-groups can be replaced with fluoride. The principal reaction is:
Hydroxyl-fluoride exchange of apatite: Ca10(PO4)6 (OH)2 + 2 F- Ca10(PO4)6 F2 + 2 OH- eq. 2
If analysed for major components, the bone char would show a contents of calcium phosphate, 57-80 %, calcium carbonate, 6-10 %, and activated carbon, 7-10 %.
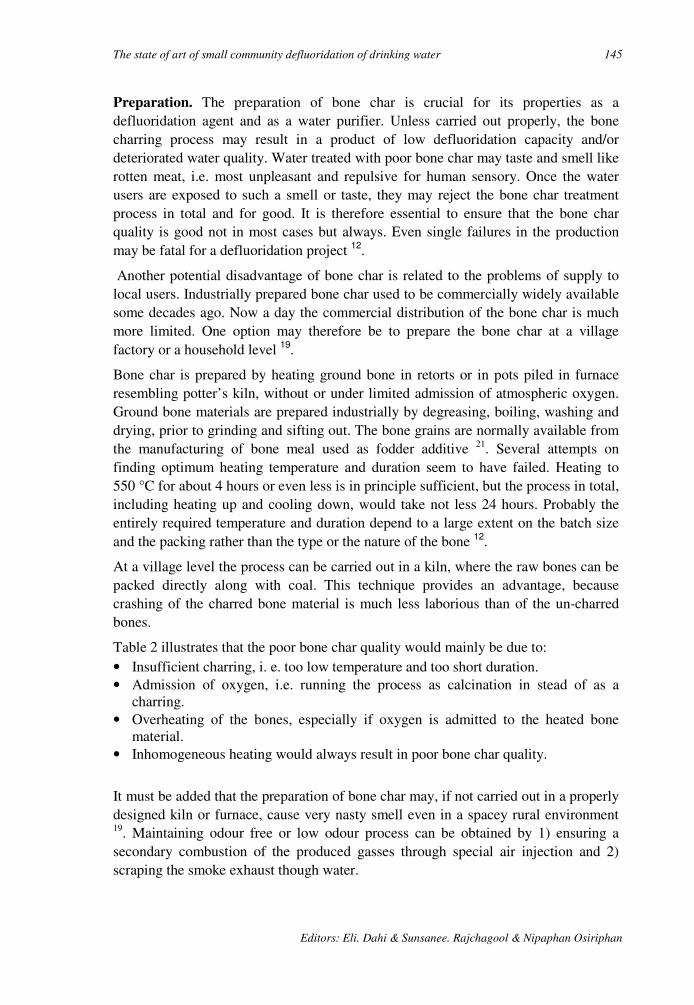
The state of art of small community defluoridation of drinking water 145
Editors: Eli. Dahi & Sunsanee. Rajchagool & Nipaphan Osiriphan
Preparation. The preparation of bone char is crucial for its properties as a defluoridation agent and as a water purifier. Unless carried out properly, the bone charring process may result in a product of low defluoridation capacity and/or deteriorated water quality. Water treated with poor bone char may taste and smell like rotten meat, i.e. most unpleasant and repulsive for human sensory. Once the water users are exposed to such a smell or taste, they may reject the bone char treatment process in total and for good. It is therefore essential to ensure that the bone char quality is good not in most cases but always. Even single failures in the production may be fatal for a defluoridation project 12.
Another potential disadvantage of bone char is related to the problems of supply to local users. Industrially prepared bone char used to be commercially widely available some decades ago. Now a day the commercial distribution of the bone char is much more limited. One option may therefore be to prepare the bone char at a village factory or a household level 19.
Bone char is prepared by heating ground bone in retorts or in pots piled in furnace resembling potter’s kiln, without or under limited admission of atmospheric oxygen. Ground bone materials are prepared industrially by degreasing, boiling, washing and drying, prior to grinding and sifting out. The bone grains are normally available from the manufacturing of bone meal used as fodder additive 21. Several attempts on finding optimum heating temperature and duration seem to have failed. Heating to 550 °C for about 4 hours or even less is in principle sufficient, but the process in total, including heating up and cooling down, would take not less 24 hours. Probably the entirely required temperature and duration depend to a large extent on the batch size and the packing rather than the type or the nature of the bone 12.
At a village level the process can be carried out in a kiln, where the raw bones can be packed directly along with coal. This technique provides an advantage, because crashing of the charred bone material is much less laborious than of the un-charred bones.
Table 2 illustrates that the poor bone char quality would mainly be due to: • Insufficient charring, i. e. too low temperature and too short duration. • Admission of oxygen, i.e. running the process as calcination in stead of as a
charring. • Overheating of the bones, especially if oxygen is admitted to the heated bone
material. • Inhomogeneous heating would always result in poor bone char quality.
It must be added that the preparation of bone char may, if not carried out in a properly designed kiln or furnace, cause very nasty smell even in a spacey rural environment 19. Maintaining odour free or low odour process can be obtained by 1) ensuring a secondary combustion of the produced gasses through special air injection and 2) scraping the smoke exhaust though water.
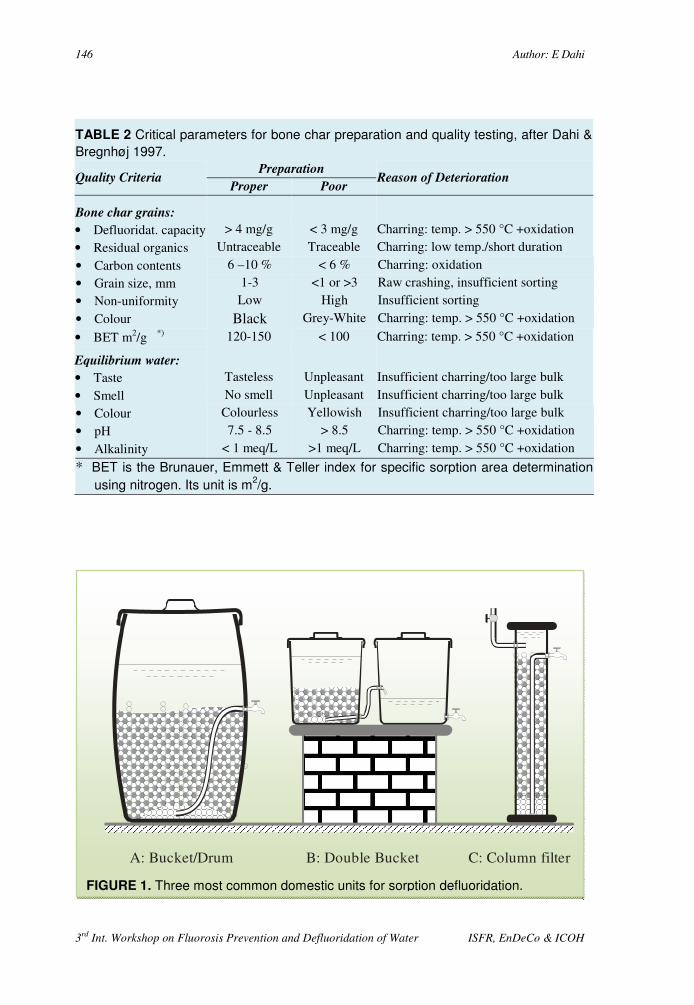
146 Author: E Dahi
3rd Int. Workshop on Fluorosis Prevention and Defluoridation of Water ISFR, EnDeCo & ICOH
TABLE 2 Critical parameters for bone char preparation and quality testing, after Dahi &
Bregnhøj 1997.
Quality Criteria Preparation
Reason of Deterioration Proper Poor
Bone char grains:
• Defluoridat. capacity > 4 mg/g < 3 mg/g Charring: temp. > 550 °C +oxidation • Residual organics Untraceable Traceable Charring: low temp./short duration
• Carbon contents 6 –10 % < 6 % Charring: oxidation • Grain size, mm 1-3 <1 or >3 Raw crashing, insufficient sorting • Non-uniformity Low High Insufficient sorting
• Colour Black Grey-White Charring: temp. > 550 °C +oxidation
• BET m2/g *) 120-150 < 100 Charring: temp. > 550 °C +oxidation
Equilibrium water:
• Taste Tasteless Unpleasant Insufficient charring/too large bulk
• Smell No smell Unpleasant Insufficient charring/too large bulk • Colour Colourless Yellowish Insufficient charring/too large bulk • pH 7.5 - 8.5 > 8.5 Charring: temp. > 550 °C +oxidation
• Alkalinity < 1 meq/L >1 meq/L Charring: temp. > 550 °C +oxidation
* BET is the Brunauer, Emmett & Teller index for specific sorption area determination
using nitrogen. Its unit is m2/g.
A: Bucket/Drum B: Double Bucket C: Column filter
FIGURE 1. Three most common domestic units for sorption defluoridation.
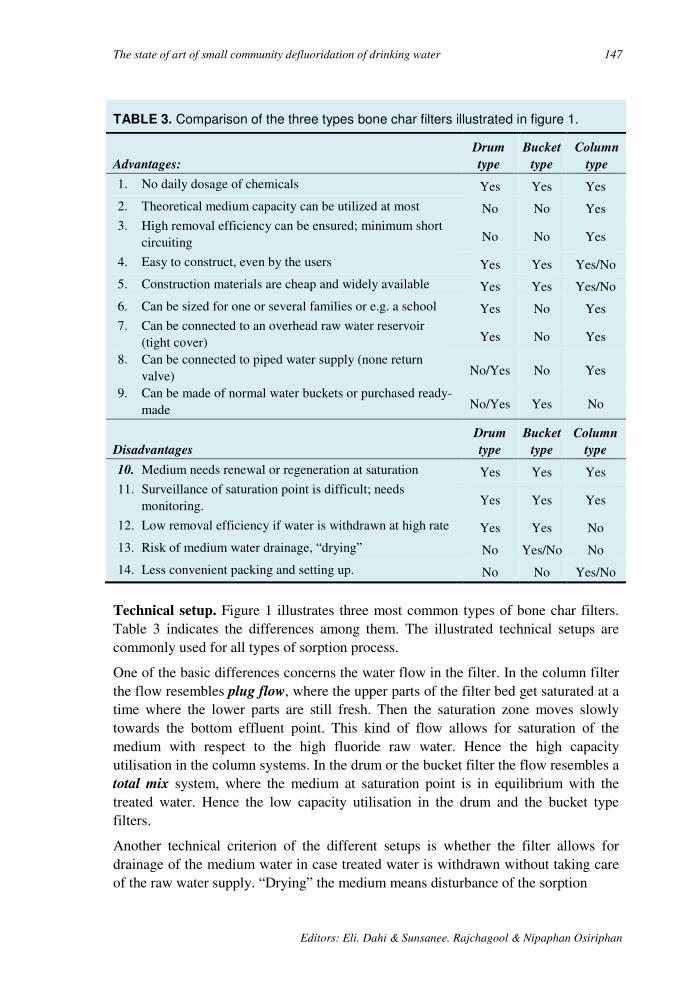
The state of art of small community defluoridation of drinking water 147
Editors: Eli. Dahi & Sunsanee. Rajchagool & Nipaphan Osiriphan
Technical setup. Figure 1 illustrates three most common types of bone char filters. Table 3 indicates the differences among them. The illustrated technical setups are commonly used for all types of sorption process.
One of the basic differences concerns the water flow in the filter. In the column filter the flow resembles plug flow, where the upper parts of the filter bed get saturated at a time where the lower parts are still fresh. Then the saturation zone moves slowly towards the bottom effluent point. This kind of flow allows for saturation of the medium with respect to the high fluoride raw water. Hence the high capacity utilisation in the column systems. In the drum or the bucket filter the flow resembles a total mix system, where the medium at saturation point is in equilibrium with the treated water. Hence the low capacity utilisation in the drum and the bucket type filters.
Another technical criterion of the different setups is whether the filter allows for drainage of the medium water in case treated water is withdrawn without taking care of the raw water supply. “Drying” the medium means disturbance of the sorption
TABLE 3. Comparison of the three types bone char filters illustrated in figure 1.
Advantages:
Drum
type
Bucket
type
Column
type
1. No daily dosage of chemicals Yes Yes Yes
2. Theoretical medium capacity can be utilized at most No No Yes 3. High removal efficiency can be ensured; minimum short
circuiting No No Yes
4. Easy to construct, even by the users Yes Yes Yes/No
5. Construction materials are cheap and widely available Yes Yes Yes/No
6. Can be sized for one or several families or e.g. a school Yes No Yes 7. Can be connected to an overhead raw water reservoir
(tight cover) Yes No Yes
8. Can be connected to piped water supply (none return valve) No/Yes No Yes
9. Can be made of normal water buckets or purchased ready-made No/Yes Yes No
Disadvantages
Drum
type
Bucket
type
Column
type
10. Medium needs renewal or regeneration at saturation Yes Yes Yes 11. Surveillance of saturation point is difficult; needs
monitoring. Yes Yes Yes
12. Low removal efficiency if water is withdrawn at high rate Yes Yes No
13. Risk of medium water drainage, “drying” No Yes/No No
14. Less convenient packing and setting up. No No Yes/No

148 Author: E Dahi
3rd Int. Workshop on Fluorosis Prevention and Defluoridation of Water ISFR, EnDeCo & ICOH
TABLE 4. Examples of design of the bone char filters illustrated in figure 1. For
simplification the filters are designed assuming the same daily water consumption,
raw water and bone char quality.
Parameters: Design Examples
Filter Type
Given Parameters: Unit
Dru
m
Bu
cket
Co
lum
n
D Daily personal water demand L/(c•d)
3 3 3
N Number of users p 6 6 6 OP Operation period months months 12 3 6
ΓO Operational sorption capacity g/kg 2 2 4
σ Bulk density of medium kg/L 0.83 0.83 0.83 Fi Raw water fluoride conc. mg/L 10 10 10 Ft Treated water average fluoride conc. mg/L 1 1 1 VRSW/M Volume ratio supernatant water/medium - 2 2.5 0.2 VRCW/M Volume ratio clean water container/medium - 0 3.5 0
Derived Parameters:
Q = D • N Daily water treatment L/d 18 18 18 VT = OP • Q Total volume of water treated in a filter
period L 6500 1600 3200 FT = VT • ( Fi – Ft ) / 1000 Total fluoride removal during a period g 60 15 30 M = FT / ΓO Amount of medium required for renewal kg 30 7 7 VM = M / σ Volume of medium in the filter L 35 9 9 BV = VT / VM Number of bed volumes treated in a filter
period - 185 185 370 VSW = VRSW/ M / VM Volume capacity of supernatant water L 70 22 2 VCW = VRCW/ M / VM Volume capacity of clean water container L 0 31 0 VF = VM + VSW + VCW Total Volume of filter L 105 62 11
Corresponding dimensions: Ø Filter diameter (selected as available) cm 42 32 12 HF = VF / [ π • (Ø/2)2 ] Total height of the filter cm 75 75 92

The state of art of small community defluoridation of drinking water 149
Editors: Eli. Dahi & Sunsanee. Rajchagool & Nipaphan Osiriphan
process and more contact time would be required for reestablishment. Unfortunately this point is overseen in many household filter designs.
Regeneration. Upon saturation with fluoride, it is feasible to regenerate bone char. This can be done by allowing equilibrium with 1 % solution of sodium hydroxide and after-wash or neutralisation of the caustic soda surplus 1. Probably the regeneration is only cost effective at a large scale water works level or in case of constrains in availability of the medium. At village-community and household levels, it is easier and environmentally acceptable to discard the saturated bone char as fertiliser and soil conditioner.
Design Criteria. Apart from the daily water demand, i.e. the load, and the raw water fluoride concentration, the main key parameter of all designs would be the bone char theoretical defluoridation capacity, Γ. Γ is expressed as the amount of fluoride absorbed by one gram of bone char at saturation. Unfortunately it is often seen in laboratory studies that Γ is estimated with respect to unrealistically high fluoride concentrations. In water treatment one should use the operational defluoridation
capacity, with reference to the given fluoride concentration and experimental setup. Obviously, saturation with respect to the raw water fluoride concentration, as in column filters, would result in much larger utilisation of a bone char medium than saturation with respect to the effluent concentration at the end of a filter period, as in bucket filters (drum or bucket filters).
Thus at operational level, Γ depends on the loading pattern, i.e. the variation of water flow through the filter medium, and the back mix pattern, i.e. to what extent the water flow resembles a plug flow through the filter medium. Different sorption models are developed to simulate the operation of bone char filters and thus to create a rational background for the design of these filters 6.
As a role of thumb it is assumed that:
Operational Defluoridation Capacity in
column filters
≈≈≈≈ 2/3 Theoretical defluoridation
Capacity
Operational Defluoridation Capacity in
bucket filters
≈≈≈≈ 1/3 Theoretical defluoridation
Capacity
Examples of design of bone char filters are given in Table 4. Assuming the theoretical bone char defluoridation capacity is 6 mg/g, the operational capacity would then be 4 mg/g for column filters and 2 mg/g for bucket filters. Table 4 demonstrates how the dosage equivalent is 2 and 4 g/L for respectively column filter and bucket & drum filters. If the same dosage is added as in batch the residual concentration will be less than average in the filters.
Cost. All three types of bone char filters can be made locally using cheap locally available robust and corrosion resistant materials like plastic, concrete, ferrocement or

150 Author: E Dahi
3rd Int. Workshop on Fluorosis Prevention and Defluoridation of Water ISFR, EnDeCo & ICOH
galvanised iron sheets. In such cases the unit price would be affordable to most motivated communities.
The price of bone char on the other hand may be significant, depending on the fabrics. F. ex. in 1995 quotations were collected for large scale delivery of bone char ab fabric from UK, China and Tanzania. The prices given were 2280, 333 and 167 US$/ton respectively. Finally it was found out that the bone char could be prepared in a low cost locally made kiln out of free collected bones in the Arusha region in Tanzania by using about 120 kg of charcoal per ton.
Experiences. Bone char is the oldest known water defluoridation agent. It has been used in USA in the 1940’s through 1960’s, where bone char was commercially widely available, because of its use at large scale in the sugar industry 1.
The first domestic defluoridators were developed in the early 60ies as column filters similar to the one shown in Figure 1c 15, 28. In 1988 the ICOH filter type was launched by WHO 27 and has since been tested both in and outside Thailand. In the contrary to the filter described by 28, the ICOH type filter is enriched with charcoal, and thus has the capacity of removal of impurities in case the raw water quality is poor or in case the of insufficient bone charring. Furthermore the water flow in the ICOH defluoridator occurs by siphoning the raw water from an overhead container. This arrangement allows for manual adjustment of the water flow by using tube clamps, but the unit would need supervision and training in order to avoid the column to run dry and the clean water jar to overflow.
Today the bone char defluoridation in waterworks is replaced by the use of ion exchange resins and activated alumina. At domestic level the bone char defluoridation seems to function in Thailand and Africa, but no wide scale implementation has been experienced yet.
It is experienced that filters are launched commercially at a relatively high price, as packages of medium and a modification of the candle type domestic filters of stainless steel.
Taboos. One of the constraints of the bone char defluoridation is related to possible conviction among some users that any use of animal bones is unethical. In such cases the use of bone char must be avoided.
However, it has been experienced that many users only take aversion to the use of bone char originating from certain animals, like caws among Hindus, pigs among Muslims and Jews, and hyena and dogs among Africans. From a scientific point of view all types of bones are equally good as raw materials for bone char, but in such cases the problem would be solved through information and production of the bone char in accordance with local acceptability.
Irrespective the users conviction, the microbiological, esthetical and psychological complications would be fatal for the acceptability of the bone char defluoridation, if drinking water is allowed to percolate a medium containing organic residuals from animals. It has therefore to be emphasised that this would only happen in case of
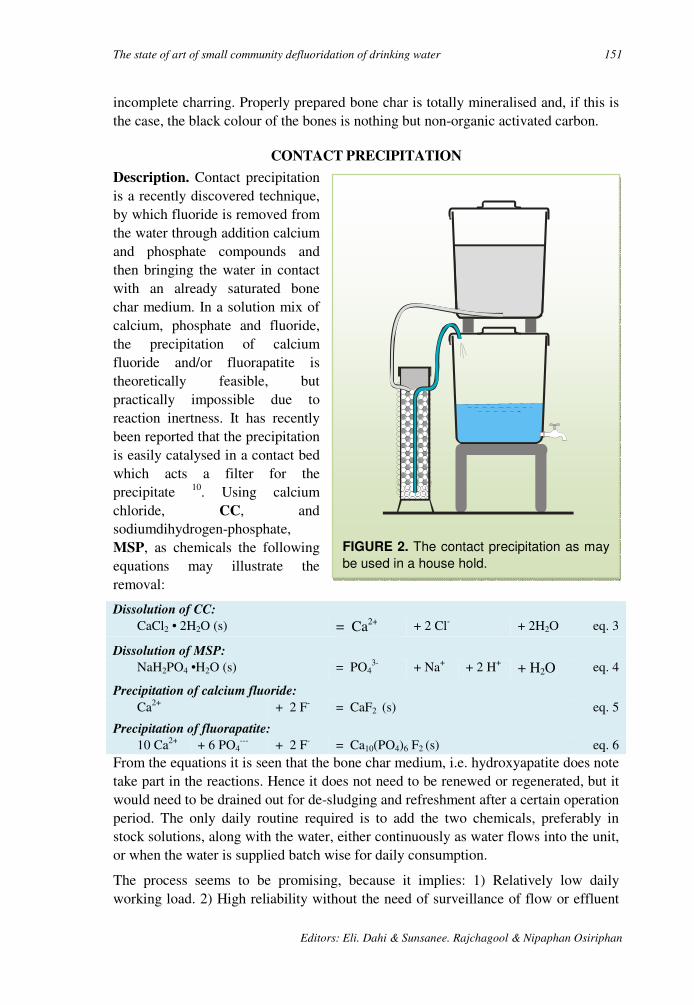
The state of art of small community defluoridation of drinking water 151
Editors: Eli. Dahi & Sunsanee. Rajchagool & Nipaphan Osiriphan
FIGURE 2. The contact precipitation as may
be used in a house hold.
incomplete charring. Properly prepared bone char is totally mineralised and, if this is the case, the black colour of the bones is nothing but non-organic activated carbon.
CONTACT PRECIPITATION
Description. Contact precipitation is a recently discovered technique, by which fluoride is removed from the water through addition calcium and phosphate compounds and then bringing the water in contact with an already saturated bone char medium. In a solution mix of calcium, phosphate and fluoride, the precipitation of calcium fluoride and/or fluorapatite is theoretically feasible, but practically impossible due to reaction inertness. It has recently been reported that the precipitation is easily catalysed in a contact bed which acts a filter for the precipitate 10. Using calcium chloride, CC, and sodiumdihydrogen-phosphate, MSP, as chemicals the following equations may illustrate the removal:
Dissolution of CC:
CaCl2 • 2H2O (s) = Ca2+ + 2 Cl- + 2H2O eq. 3
Dissolution of MSP:
NaH2PO4 •H2O (s) = PO43- + Na+ + 2 H+ + H2O eq. 4
Precipitation of calcium fluoride: Ca2+ + 2 F- = CaF2 (s) eq. 5
Precipitation of fluorapatite:
10 Ca2+ + 6 PO4--- + 2 F- = Ca10(PO4)6 F2 (s) eq. 6
From the equations it is seen that the bone char medium, i.e. hydroxyapatite does note take part in the reactions. Hence it does not need to be renewed or regenerated, but it would need to be drained out for de-sludging and refreshment after a certain operation period. The only daily routine required is to add the two chemicals, preferably in stock solutions, along with the water, either continuously as water flows into the unit, or when the water is supplied batch wise for daily consumption.
The process seems to be promising, because it implies: 1) Relatively low daily working load. 2) High reliability without the need of surveillance of flow or effluent
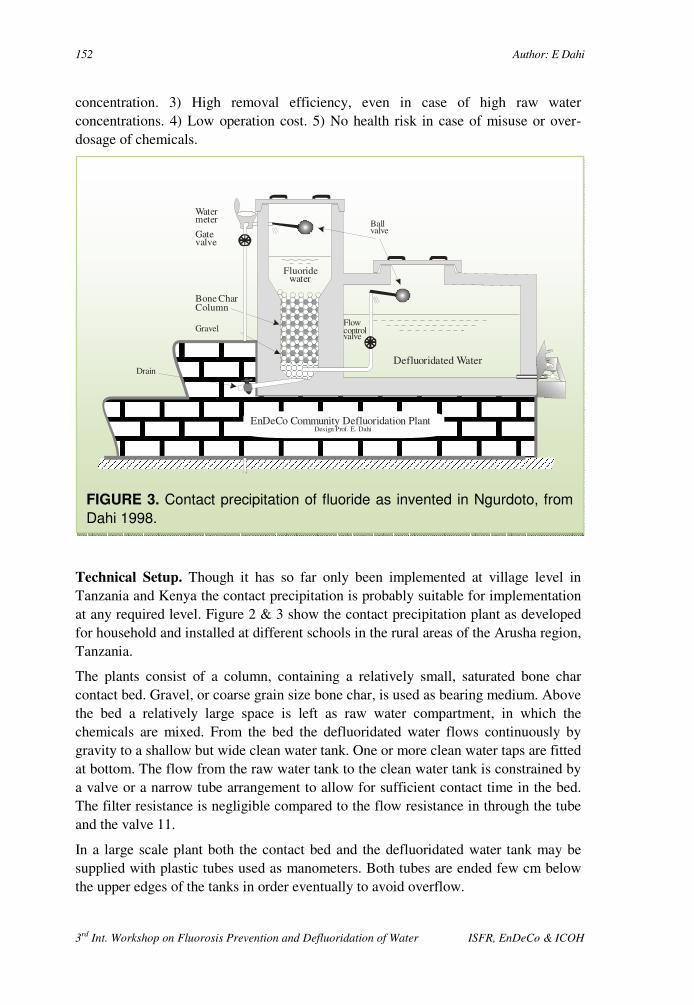
152 Author: E Dahi
3rd Int. Workshop on Fluorosis Prevention and Defluoridation of Water ISFR, EnDeCo & ICOH
concentration. 3) High removal efficiency, even in case of high raw water concentrations. 4) Low operation cost. 5) No health risk in case of misuse or over-dosage of chemicals.
Technical Setup. Though it has so far only been implemented at village level in Tanzania and Kenya the contact precipitation is probably suitable for implementation at any required level. Figure 2 & 3 show the contact precipitation plant as developed for household and installed at different schools in the rural areas of the Arusha region, Tanzania.
The plants consist of a column, containing a relatively small, saturated bone char contact bed. Gravel, or coarse grain size bone char, is used as bearing medium. Above the bed a relatively large space is left as raw water compartment, in which the chemicals are mixed. From the bed the defluoridated water flows continuously by gravity to a shallow but wide clean water tank. One or more clean water taps are fitted at bottom. The flow from the raw water tank to the clean water tank is constrained by a valve or a narrow tube arrangement to allow for sufficient contact time in the bed. The filter resistance is negligible compared to the flow resistance in through the tube and the valve 11.
In a large scale plant both the contact bed and the defluoridated water tank may be supplied with plastic tubes used as manometers. Both tubes are ended few cm below the upper edges of the tanks in order eventually to avoid overflow.
EnDeCo Community Defluoridation PlantDesign Prof. E. Dahi
Bone CharColumn
Watermeter
Gatevalve
Gravel
DrainDefluoridated Water
Fluoridewater
Flowcontrolvalve
Ballvalve
Drain
FIGURE 3. Contact precipitation of fluoride as invented in Ngurdoto, from
Dahi 1998.

The state of art of small community defluoridation of drinking water 153
Editors: Eli. Dahi & Sunsanee. Rajchagool & Nipaphan Osiriphan
Chemical Dosage in Stock Solutions: Any calcium and phosphate compounds can be used. It is however important to bring the chemicals in solution prior to mixing with the water. As a calcium compound calcium chloride, CC, may be used. As a phosphate compound sodiumdihydrogenphosphate, also called monosodium phosphate or MSP, may be used. Both compounds are easily dissolved, quite cheap and widely used. CC is fabricated as technical grade flakes containing 77-80 % calcium chloride. One MSP product is fabricated as Bolifor Granular containing 24 % P and 20 % Na. The bulk density of the chemicals may be 1.04 for CC and 0.95 for MSP.
The chemicals are preferably prepared as stock solutions to be used in aliquots. The two stock solutions may be prepared, e.g. once every month, but should not be mixed before treatment in order to avoid the precipitation of calcium phosphate. Two special measuring cups may be used for volumetric portioning of the chemicals. It is advisable to check the bulk density as it may vary for different brands. The stock solutions Jerry cans, along with the respective chemical bags and the measuring cups and cylinders may be coloured respectively in red and green in order to minimise the risk of exchange and failure dosage.
Operation of the Domestic Unit: Initially the raw water bucket would be empty. The plant caretaker starts closing the flow control valve completely and one and half liters of each of the stock solutions are added to be mixed with a part of the raw water fetched to the raw water column. As the residual raw water is filled into the raw water column, the supernatant water is completely mixed. The flow control valve is then opened, but only to allow slow flow through the contact bed, the average filtration velocity not exceeding 0.5 m/h.
Operation of the Community Plant: Initially the raw water column would be empty. The plant care taker starts closing the flow control valve completely and each of the two stock solution aliquots are added to be mixed with a part of the raw water fetched to the raw water column. As the residual raw water is filled into the raw water column, the supernatant water would be completely mixed. The flow control valve is then opened, but only to allow slow flow through the contact bed, the average filtration velocity not exceeding 0.5 m/h or about 0.5 cm/min.
Design Criteria. The construction of the contact precipitation plants is simple, but the theoretical background for doing it is not. Probably both reactions 5 and 6 play important roles, but it is not well known to what extent each of them does. In the calcium fluoride precipitation, the Ca/F weigh ratio is about 1, equivalent to a CC/F ratio of about 4. In the fluorapatite precipitation, the Ca/F is 11 and the PO4/F ratio is 15, equivalent to a CC/F ratio of about 39 and a MSP/F ratio of about 23.
Thus the more fluoride is precipitated as calcium fluoride the lower is the required dosage of chemicals. Probably the calcium fluoride precipitation is more dominant the higher the fluoride concentration in the raw water. Long term operation of the contact precipitation technique in Tanzania, where the fluoride concentration is about 10 mg/L, have shown that the process functions perfectly when the dosage ratios are 30
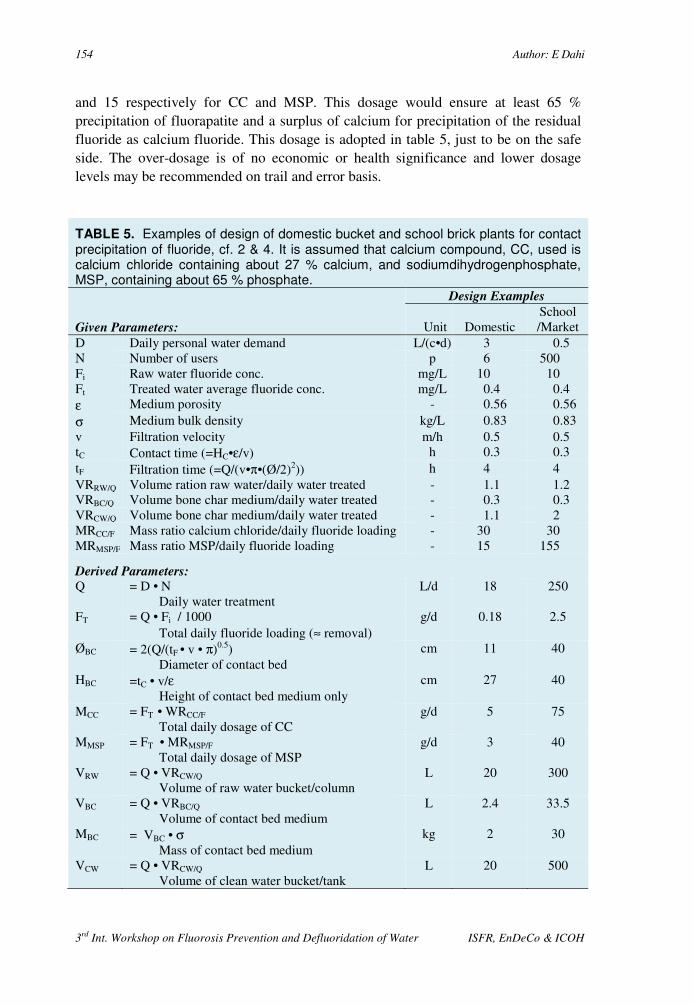
154 Author: E Dahi
3rd Int. Workshop on Fluorosis Prevention and Defluoridation of Water ISFR, EnDeCo & ICOH
and 15 respectively for CC and MSP. This dosage would ensure at least 65 % precipitation of fluorapatite and a surplus of calcium for precipitation of the residual fluoride as calcium fluoride. This dosage is adopted in table 5, just to be on the safe side. The over-dosage is of no economic or health significance and lower dosage levels may be recommended on trail and error basis.
TABLE 5. Examples of design of domestic bucket and school brick plants for contact precipitation of fluoride, cf. 2 & 4. It is assumed that calcium compound, CC, used is calcium chloride containing about 27 % calcium, and sodiumdihydrogenphosphate, MSP, containing about 65 % phosphate.
Given Parameters:
Design Examples
Unit Domestic School /Market
D Daily personal water demand L/(c•d) 3 0.5 N Number of users p 6 500 Fi Raw water fluoride conc. mg/L 10 10 Ft Treated water average fluoride conc. mg/L 0.4 0.4 ε Medium porosity - 0.56 0.56 σ Medium bulk density kg/L 0.83 0.83 v Filtration velocity m/h 0.5 0.5 tC Contact time (=HC•ε/v) h 0.3 0.3 tF Filtration time (=Q/(v•π•(Ø/2)2)) h 4 4 VRRW/Q Volume ration raw water/daily water treated - 1.1 1.2 VRBC/Q Volume bone char medium/daily water treated - 0.3 0.3 VRCW/Q Volume bone char medium/daily water treated - 1.1 2 MRCC/F Mass ratio calcium chloride/daily fluoride loading - 30 30 MRMSP/F Mass ratio MSP/daily fluoride loading - 15 155
Derived Parameters: Q = D • N
Daily water treatment L/d 18 250
FT = Q • Fi / 1000 Total daily fluoride loading (≈ removal)
g/d 0.18 2.5
ØBC = 2(Q/(tF • v • π)0.5) Diameter of contact bed
cm 11 40
HBC =tC • v/ε Height of contact bed medium only
cm 27 40
MCC = FT • WRCC/F Total daily dosage of CC
g/d 5 75
MMSP = FT • MRMSP/F Total daily dosage of MSP
g/d 3 40
VRW = Q • VRCW/Q Volume of raw water bucket/column
L 20 300
VBC = Q • VRBC/Q
Volume of contact bed medium
L 2.4 33.5
MBC = VBC • σ Mass of contact bed medium
kg 2 30
VCW = Q • VRCW/Q Volume of clean water bucket/tank
L 20 500

The state of art of small community defluoridation of drinking water 155
Editors: Eli. Dahi & Sunsanee. Rajchagool & Nipaphan Osiriphan
TABLE 5. Continued.
Corresponding Parameters:
Design Examples
Unit Domestic School /Market
WRW ≈ (VRW)1/3
Width of raw water column cm - 65
LRW ≈ WRW Length of raw water column
cm - 65
HRW = VRW / (WRW • LRW) Height of raw water column
cm - 70
ØCB = ØBC Diameter of contact bed compartment
cm - 40
HCB = HCW
Height of contact bed compartment cm - 65
WCW = WRW
Width of clean water tank cm - 65
HCW = HCB Height of clean water tank
cm - 65
LCW = VCW /(BCW • HCW) Length of clean water tank
cm - 120
Cost. Quotations were collected in 1996 for calcium chloride and sodium dihydrogen phosphate ab fabric whole sale. The figures given were 283 and 780 US$/ton respectively.
Experiences. Experiences from the Arusha region have shown that construction of a plant need skilled supervision, at least until a bricklayer team has been through the construction of few plants. The critical points seem to be:
1. Water tight cement or plastic plastering. 2. Proper installation of fittings and 3. Adjustment of the flow rate to meet the given demands of contact time and
filtration time.
Once these issues are taken care of, it has been demonstrated that a young school pupil can easily operate the plant satisfactorily.
No bacterial growth or disturbance in the efficiency of the plant has been observed during standing still in a rain season or a summer vacation.
The length of the operation period seems to be different in different setups. More field experiences are needed in order to establish guidelines about the de-sludging procedure.

156 Author: E Dahi
3rd Int. Workshop on Fluorosis Prevention and Defluoridation of Water ISFR, EnDeCo & ICOH
AlumLime
Mixing device
DefluoridatedWater
FluorideWater
Screen&
ClothFilter
FIGURE 4. The Nalgonda defluoridation as
adopted for domestic use in Tanzania.. From
Dahi et al. 1996.
NALGONDA
Description. The Nalgonda process is the aluminium sulphate based coagulation-flocculation sedimentation, where the dosage is designed to ensure appropriate fluoride removal from the water. Aluminium sulphate, Al2 (SO4)3, 18H2O, is dissolved and added to the water under efficient stirring in order to ensure initial total mix. Rapidly aluminium hydroxide micro-flocs are produced and gathered into larger easily settling flocs. Hereafter the mixture is allowed to settle. During this flocculation process all kinds of micro-particles and negatively charged ions including fluoride are partially removed by electrostatic attachment to the flocs, eq. 7 -10.
Alum dissolution: Al2 (SO4)3• 18H2O = 2Al3+ + 3SO4
2- + 18H2O eq. 7
Aluminium precipitation (Acidic): 2Al3+ + 6 H2O = 2Al(OH)3 + 6 H+ eq. 8
Co-precipitation (None stoichiometric, not defined product):
F- + Al(OH)3 = Al-F complex + ? eq. 9
pH adjustment: 6Ca(OH)2 + 12 H+ = 6 Ca2+ + 12H2O eq. 10
Compared to normal water flocculation, much larger dosage of alum is normally required in the defluoridation process. As the alum solution is acidic, simultaneous
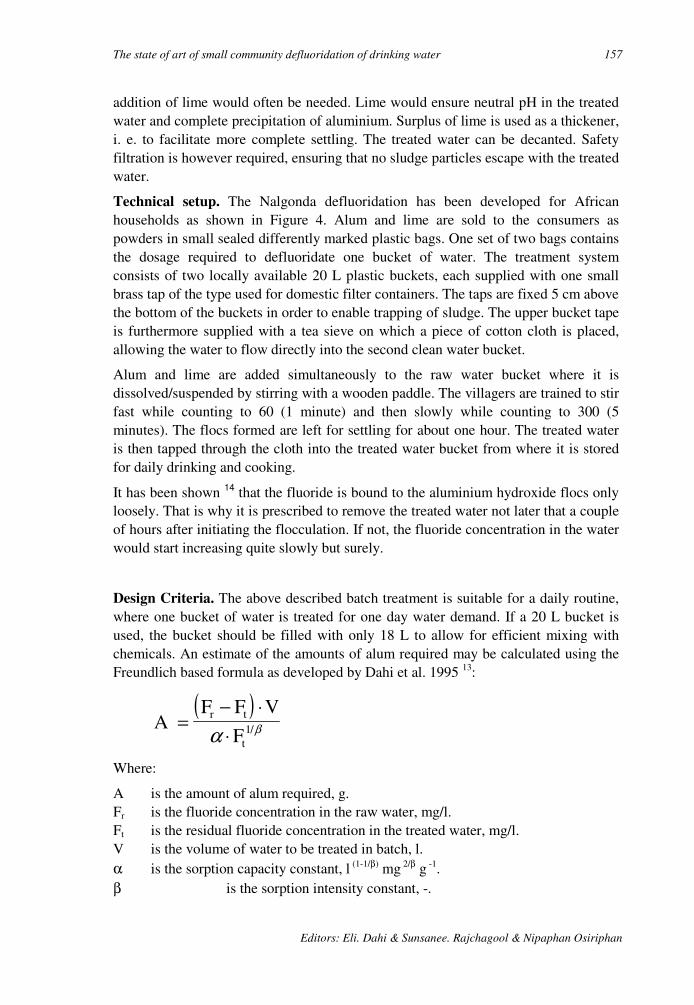
The state of art of small community defluoridation of drinking water 157
Editors: Eli. Dahi & Sunsanee. Rajchagool & Nipaphan Osiriphan
addition of lime would often be needed. Lime would ensure neutral pH in the treated water and complete precipitation of aluminium. Surplus of lime is used as a thickener, i. e. to facilitate more complete settling. The treated water can be decanted. Safety filtration is however required, ensuring that no sludge particles escape with the treated water.
Technical setup. The Nalgonda defluoridation has been developed for African households as shown in Figure 4. Alum and lime are sold to the consumers as powders in small sealed differently marked plastic bags. One set of two bags contains the dosage required to defluoridate one bucket of water. The treatment system consists of two locally available 20 L plastic buckets, each supplied with one small brass tap of the type used for domestic filter containers. The taps are fixed 5 cm above the bottom of the buckets in order to enable trapping of sludge. The upper bucket tape is furthermore supplied with a tea sieve on which a piece of cotton cloth is placed, allowing the water to flow directly into the second clean water bucket.
Alum and lime are added simultaneously to the raw water bucket where it is dissolved/suspended by stirring with a wooden paddle. The villagers are trained to stir fast while counting to 60 (1 minute) and then slowly while counting to 300 (5 minutes). The flocs formed are left for settling for about one hour. The treated water is then tapped through the cloth into the treated water bucket from where it is stored for daily drinking and cooking.
It has been shown 14 that the fluoride is bound to the aluminium hydroxide flocs only loosely. That is why it is prescribed to remove the treated water not later that a couple of hours after initiating the flocculation. If not, the fluoride concentration in the water would start increasing quite slowly but surely.
Design Criteria. The above described batch treatment is suitable for a daily routine, where one bucket of water is treated for one day water demand. If a 20 L bucket is used, the bucket should be filled with only 18 L to allow for efficient mixing with chemicals. An estimate of the amounts of alum required may be calculated using the Freundlich based formula as developed by Dahi et al. 1995 13:
Where:
A is the amount of alum required, g. Fr is the fluoride concentration in the raw water, mg/l. Ft is the residual fluoride concentration in the treated water, mg/l. V is the volume of water to be treated in batch, l. α is the sorption capacity constant, l (1-1/β) mg 2/β g -1. β is the sorption intensity constant, -.
( )A
F F V
Fr t
t
=− ⋅
⋅α β1/
158 Author: E Dahi
3rd Int. Workshop on Fluorosis Prevention and Defluoridation of Water ISFR, EnDeCo & ICOH
Any resulting pH between 6.2 and 7.6 is close to optimum. For pH = 6.7 and required residual fluoride between 1 and 1.5 mg/l, α = 6 and β = 1.33. The amount of lime required to achieve optimum pH is difficult to estimate theoretically as it depends on the quality of lime, the alkalinity and pH of the raw water and the fluoride removal itself. Lime addition may be 20-50 % of the alum dosage.
Cost. According to COWI 1998 9 the price of one of the above buckets in Tanzania is about 3000 TZS or about 3.3 US$ in 1995 prices. The tap would cost about 1.7 US$. Seven pairs of alum and lime bags could be made available for 0.15 US$. In this price 20 % represent the purchase of chemicals. Alum is purchased at a tax free whole sale scale as normally for water works.
Sludge Problem. Discarding the sludge from the Nalgonda process is often thought of as a serious environmental heath problem. The sludge is quite toxic as it contains the removed fluoride in a concentrated form. The sludge retained in the empty raw water bucket is to be discarded in a pit or a soak away:
• Inaccessible to children • Inaccessible to animals • Remote from kitchen garden and • Remote from wells which may be used for drinking.
In nature the fluoride would be expected to immobilize rapidly due to weathering processes. The free fluoride ion would then be subject to infiltration to underground or rain run off.
Once these precautions are taken, the sludge would be of low or no environmental health significance, as far as only drinking and cooking water is treated.
Experiences. The alum and lime process was proposed for defluoridation of water as soon as the fluoride occurrence in water became known in US as the agent behind mottling of teeth 4. Four decades later the process was adopted by NEERI as the Nalgonda technique and developed for low cost use at all levels in India 24. Figure 5 & 6 illustrate setups of the Nalgonda technique at village community and water works levels.
Raw waterChemical Feed
Manual mixing
Drain
To stand posts
To stand posts
FIGURE 5. The fill and draw type Nalgonda
technique for domestic and community
defluoridation. From Bulusu et al. 1993.
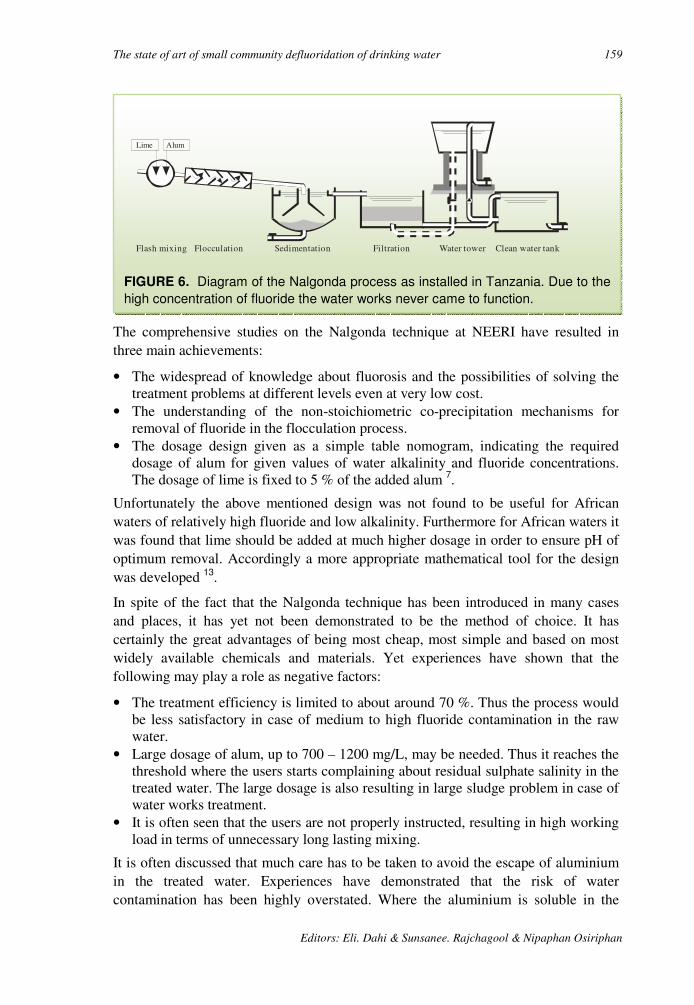
The state of art of small community defluoridation of drinking water 159
Editors: Eli. Dahi & Sunsanee. Rajchagool & Nipaphan Osiriphan
The comprehensive studies on the Nalgonda technique at NEERI have resulted in three main achievements:
• The widespread of knowledge about fluorosis and the possibilities of solving the treatment problems at different levels even at very low cost.
• The understanding of the non-stoichiometric co-precipitation mechanisms for removal of fluoride in the flocculation process.
• The dosage design given as a simple table nomogram, indicating the required dosage of alum for given values of water alkalinity and fluoride concentrations. The dosage of lime is fixed to 5 % of the added alum 7.
Unfortunately the above mentioned design was not found to be useful for African waters of relatively high fluoride and low alkalinity. Furthermore for African waters it was found that lime should be added at much higher dosage in order to ensure pH of optimum removal. Accordingly a more appropriate mathematical tool for the design was developed 13.
In spite of the fact that the Nalgonda technique has been introduced in many cases and places, it has yet not been demonstrated to be the method of choice. It has certainly the great advantages of being most cheap, most simple and based on most widely available chemicals and materials. Yet experiences have shown that the following may play a role as negative factors:
• The treatment efficiency is limited to about around 70 %. Thus the process would be less satisfactory in case of medium to high fluoride contamination in the raw water.
• Large dosage of alum, up to 700 – 1200 mg/L, may be needed. Thus it reaches the threshold where the users starts complaining about residual sulphate salinity in the treated water. The large dosage is also resulting in large sludge problem in case of water works treatment.
• It is often seen that the users are not properly instructed, resulting in high working load in terms of unnecessary long lasting mixing.
It is often discussed that much care has to be taken to avoid the escape of aluminium in the treated water. Experiences have demonstrated that the risk of water contamination has been highly overstated. Where the aluminium is soluble in the
Lime Alum
Flash mixing Flocculation Sedimentation Filtration Water tower Clean water tank
FIGURE 6. Diagram of the Nalgonda process as installed in Tanzania. Due to the
high concentration of fluoride the water works never came to function.
160 Author: E Dahi
3rd Int. Workshop on Fluorosis Prevention and Defluoridation of Water ISFR, EnDeCo & ICOH
water, pH would be so extreme that the water would be undrinkable. Practically speaking it is only needed to avoid the escape of flocs. This is easy done by a careful drain of the supernatant water in combination of simple filtration as a second barrier.
ACTIVATED ALUMINA
Description. Activated alumina is aluminium oxide, Al2O3, grains prepared in a way that they have sorptive surface. When the water passes through a packed column of activated alumina, pollutants and other components in the water are adsorbed to the surface of the grains, cf. equation 1. Eventually the column becomes saturated, first at its upstream zone. Later, as more water is passed through, the saturated zone moves down streams and in the end the column gets totally saturated.
The total saturation means that the concentration of fluoride in the effluent water increases to the same value as the influent water. The total saturation of the column must be avoided. The column is only operated to a certain break point, where the effluent concentration is e.g. 1.5 mg/L at normal saturation. The time between the start of operation and the break point of the column is presented by V; the accumulated volume of treated water. When dividing V by the bulk volume of the activated alumina packed, a standard operational parameter is obtained; i. e. the number of Bed Volumes, BV. BV is an expression of the capacity of treatment before the column medium needs to be renewed or regenerated. BV is highly dependent on the raw water fluoride concentration.
Technical setup. The activated alumina process is carried out in sorption filters as shown in Figure 1. A user-friendly unit, cf. figure 7, is made commercially available in Scandinavia through the HOH-Water Technology LTD. In order to avoid the monitoring of the water quality, the unit is supplied with a water meter allowing for direct indication of the cumulative water flow. After treatment of e.g. 2000 L equivalent to 250 BV of water containing about 5 mg/L, the unit is opened for renewal of the 8 kg medium. Alternatively the unit is dismounted for regeneration by the dealer.
Regeneration. Regeneration of the saturated alumina is carried out by exposing the medium to 4 % caustic soda, NaOH, either in batch or by flow through the column, resulting in a few BV of caustic, high-fluoride contaminated wastewater. Residual caustic soda is then washed out and the medium is neutralised with a 2 % solution of sulphuric acid rinse.
During this process about 5-10 % alumina are lost, and the capacity of residual medium is significantly reduced, 30-40 %. After only 3-4 regenerations the media has to be replaced. Alternatively, in order to avoid on site regeneration, the saturated alumina can be recycled to a dealer, who can take care of standardising the capacity of the activated alumina using an appropriate mixture of fresh and regenerated media.
In development water supply projects where the process is operated at domestic level, the regeneration can not be left to the users. Instead, a central chemical store is set up

The state of art of small community defluoridation of drinking water 161
Editors: Eli. Dahi & Sunsanee. Rajchagool & Nipaphan Osiriphan
in each village, where the users can get the regeneration done along with motivation and encouragement to continue the fluorosis prevention.
It has to be mentioned that the regeneration may result in escape of aluminium and pollution of the drinking water, > 0.2 mg/L, in case pH is not fully readjusted to normal.
Design Criteria. The alumina process is designed as a sorption process according to same principle as bone char, cf. Table 4. Similar considerations about the flow and the mix are valid. Also in the case of alumina the key design parameter is the operational defluoridation capacity, which may deviate from the theoretical.
According to Hao et al. 17, the fluoride removal capacity of alumina is between 4 and 15 mg/g. Experiences from the field however, show that the removal capacity is often about 1 mg/g 9. Thus there seems to be a waste difference in the degree of
Cold Water
Flow controller&
water meter
Cartridgetextile filter
Drinkingwater
Municipalsupply
Activatedalumina
filter
Maxflow2 L/min
Warm Water
FIGURE 7. A user-friendly and technically advanced setup of the sorption
defluoridation. After HOH-Water Technology LTD as recommended for activated
alumina.
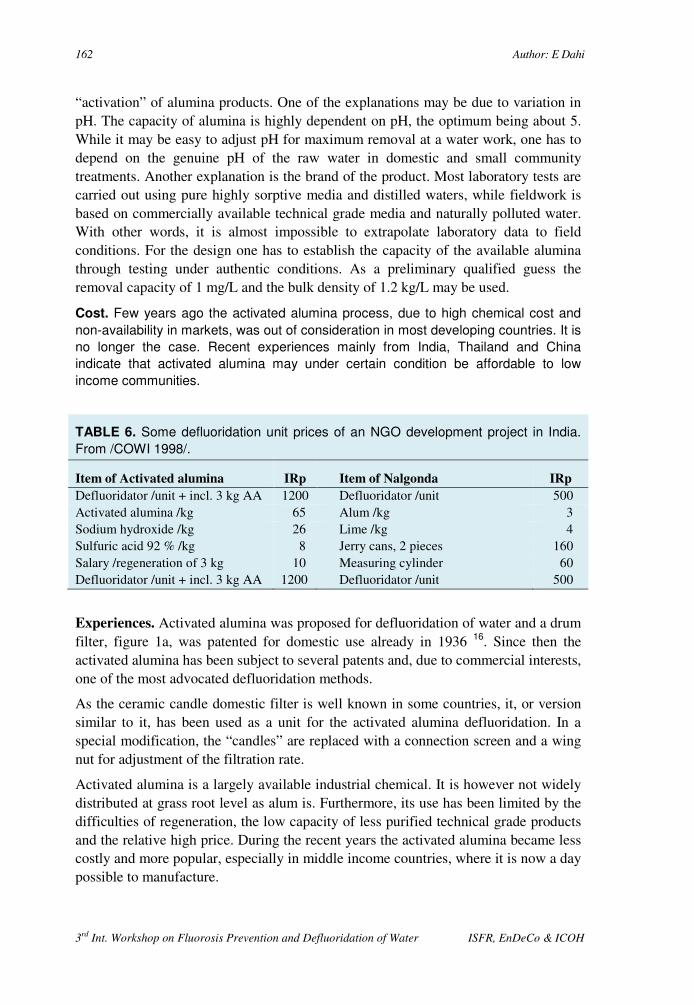
162 Author: E Dahi
3rd Int. Workshop on Fluorosis Prevention and Defluoridation of Water ISFR, EnDeCo & ICOH
“activation” of alumina products. One of the explanations may be due to variation in pH. The capacity of alumina is highly dependent on pH, the optimum being about 5. While it may be easy to adjust pH for maximum removal at a water work, one has to depend on the genuine pH of the raw water in domestic and small community treatments. Another explanation is the brand of the product. Most laboratory tests are carried out using pure highly sorptive media and distilled waters, while fieldwork is based on commercially available technical grade media and naturally polluted water. With other words, it is almost impossible to extrapolate laboratory data to field conditions. For the design one has to establish the capacity of the available alumina through testing under authentic conditions. As a preliminary qualified guess the removal capacity of 1 mg/L and the bulk density of 1.2 kg/L may be used.
Cost. Few years ago the activated alumina process, due to high chemical cost and
non-availability in markets, was out of consideration in most developing countries. It is
no longer the case. Recent experiences mainly from India, Thailand and China
indicate that activated alumina may under certain condition be affordable to low
income communities.
TABLE 6. Some defluoridation unit prices of an NGO development project in India.
From /COWI 1998/.
Item of Activated alumina IRp Item of Nalgonda IRp
Defluoridator /unit + incl. 3 kg AA 1200 Defluoridator /unit 500 Activated alumina /kg 65 Alum /kg 3 Sodium hydroxide /kg 26 Lime /kg 4 Sulfuric acid 92 % /kg 8 Jerry cans, 2 pieces 160 Salary /regeneration of 3 kg 10 Measuring cylinder 60 Defluoridator /unit + incl. 3 kg AA 1200 Defluoridator /unit 500
Experiences. Activated alumina was proposed for defluoridation of water and a drum filter, figure 1a, was patented for domestic use already in 1936 16. Since then the activated alumina has been subject to several patents and, due to commercial interests, one of the most advocated defluoridation methods.
As the ceramic candle domestic filter is well known in some countries, it, or version similar to it, has been used as a unit for the activated alumina defluoridation. In a special modification, the “candles” are replaced with a connection screen and a wing nut for adjustment of the filtration rate.
Activated alumina is a largely available industrial chemical. It is however not widely distributed at grass root level as alum is. Furthermore, its use has been limited by the difficulties of regeneration, the low capacity of less purified technical grade products and the relative high price. During the recent years the activated alumina became less costly and more popular, especially in middle income countries, where it is now a day possible to manufacture.
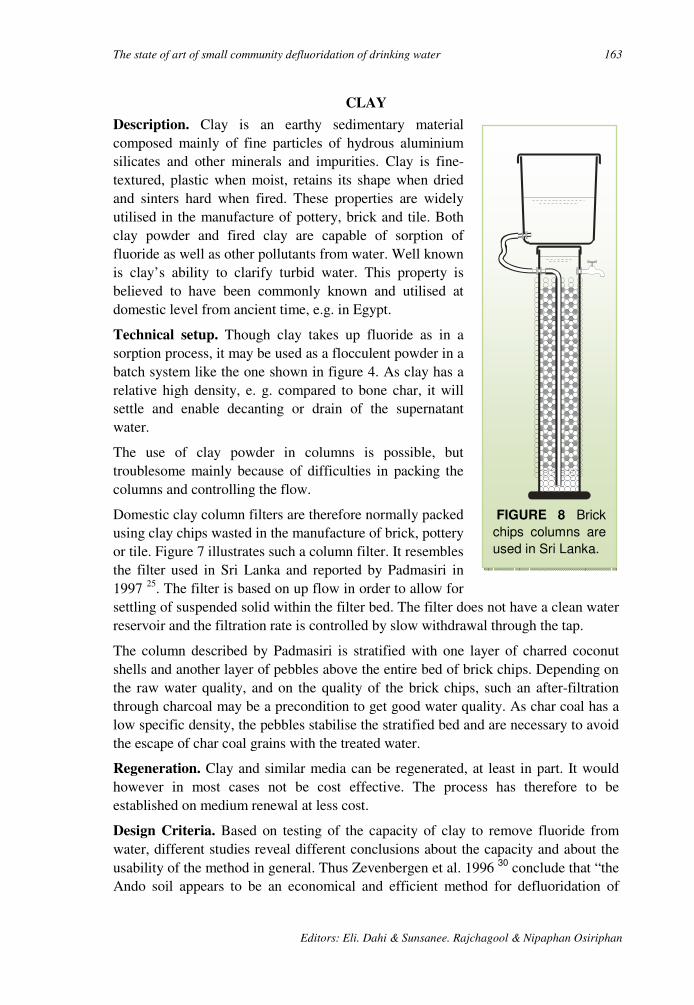
The state of art of small community defluoridation of drinking water 163
Editors: Eli. Dahi & Sunsanee. Rajchagool & Nipaphan Osiriphan
FIGURE 8 Brick
chips columns are
used in Sri Lanka.
CLAY
Description. Clay is an earthy sedimentary material composed mainly of fine particles of hydrous aluminium silicates and other minerals and impurities. Clay is fine-textured, plastic when moist, retains its shape when dried and sinters hard when fired. These properties are widely utilised in the manufacture of pottery, brick and tile. Both clay powder and fired clay are capable of sorption of fluoride as well as other pollutants from water. Well known is clay’s ability to clarify turbid water. This property is believed to have been commonly known and utilised at domestic level from ancient time, e.g. in Egypt.
Technical setup. Though clay takes up fluoride as in a sorption process, it may be used as a flocculent powder in a batch system like the one shown in figure 4. As clay has a relative high density, e. g. compared to bone char, it will settle and enable decanting or drain of the supernatant water.
The use of clay powder in columns is possible, but troublesome mainly because of difficulties in packing the columns and controlling the flow.
Domestic clay column filters are therefore normally packed using clay chips wasted in the manufacture of brick, pottery or tile. Figure 7 illustrates such a column filter. It resembles the filter used in Sri Lanka and reported by Padmasiri in 1997 25. The filter is based on up flow in order to allow for settling of suspended solid within the filter bed. The filter does not have a clean water reservoir and the filtration rate is controlled by slow withdrawal through the tap.
The column described by Padmasiri is stratified with one layer of charred coconut shells and another layer of pebbles above the entire bed of brick chips. Depending on the raw water quality, and on the quality of the brick chips, such an after-filtration through charcoal may be a precondition to get good water quality. As char coal has a low specific density, the pebbles stabilise the stratified bed and are necessary to avoid the escape of char coal grains with the treated water.
Regeneration. Clay and similar media can be regenerated, at least in part. It would however in most cases not be cost effective. The process has therefore to be established on medium renewal at less cost.
Design Criteria. Based on testing of the capacity of clay to remove fluoride from water, different studies reveal different conclusions about the capacity and about the usability of the method in general. Thus Zevenbergen et al. 1996 30 conclude that “the Ando soil appears to be an economical and efficient method for defluoridation of
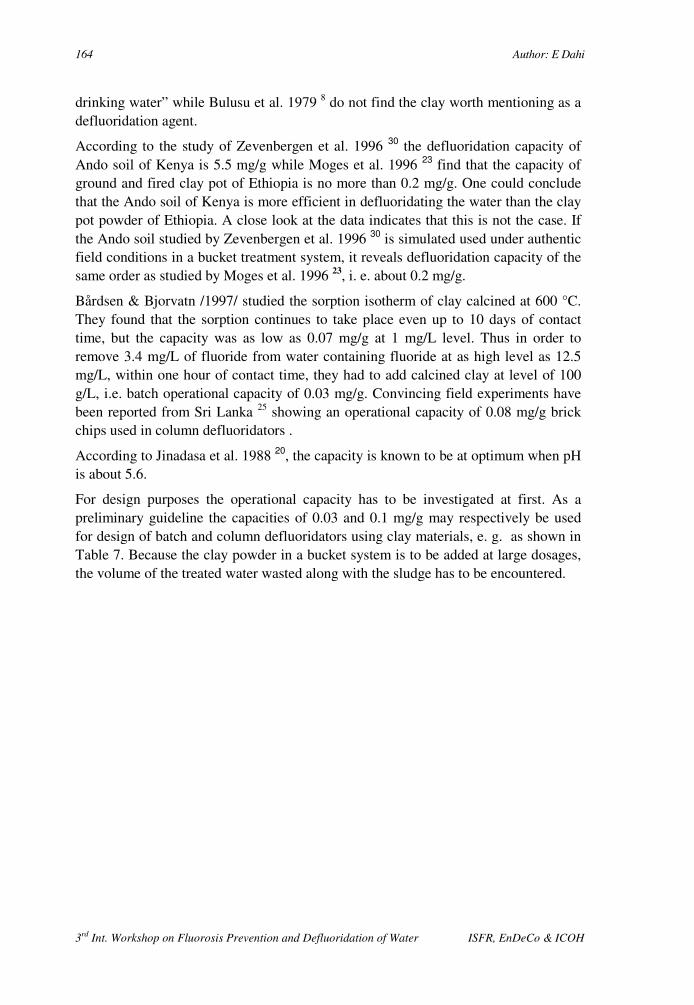
164 Author: E Dahi
3rd Int. Workshop on Fluorosis Prevention and Defluoridation of Water ISFR, EnDeCo & ICOH
drinking water” while Bulusu et al. 1979 8 do not find the clay worth mentioning as a defluoridation agent.
According to the study of Zevenbergen et al. 1996 30 the defluoridation capacity of Ando soil of Kenya is 5.5 mg/g while Moges et al. 1996 23 find that the capacity of ground and fired clay pot of Ethiopia is no more than 0.2 mg/g. One could conclude that the Ando soil of Kenya is more efficient in defluoridating the water than the clay pot powder of Ethiopia. A close look at the data indicates that this is not the case. If the Ando soil studied by Zevenbergen et al. 1996 30 is simulated used under authentic field conditions in a bucket treatment system, it reveals defluoridation capacity of the same order as studied by Moges et al. 1996 23, i. e. about 0.2 mg/g.
Bårdsen & Bjorvatn /1997/ studied the sorption isotherm of clay calcined at 600 °C. They found that the sorption continues to take place even up to 10 days of contact time, but the capacity was as low as 0.07 mg/g at 1 mg/L level. Thus in order to remove 3.4 mg/L of fluoride from water containing fluoride at as high level as 12.5 mg/L, within one hour of contact time, they had to add calcined clay at level of 100 g/L, i.e. batch operational capacity of 0.03 mg/g. Convincing field experiments have been reported from Sri Lanka 25 showing an operational capacity of 0.08 mg/g brick chips used in column defluoridators .
According to Jinadasa et al. 1988 20, the capacity is known to be at optimum when pH is about 5.6.
For design purposes the operational capacity has to be investigated at first. As a preliminary guideline the capacities of 0.03 and 0.1 mg/g may respectively be used for design of batch and column defluoridators using clay materials, e. g. as shown in Table 7. Because the clay powder in a bucket system is to be added at large dosages, the volume of the treated water wasted along with the sludge has to be encountered.
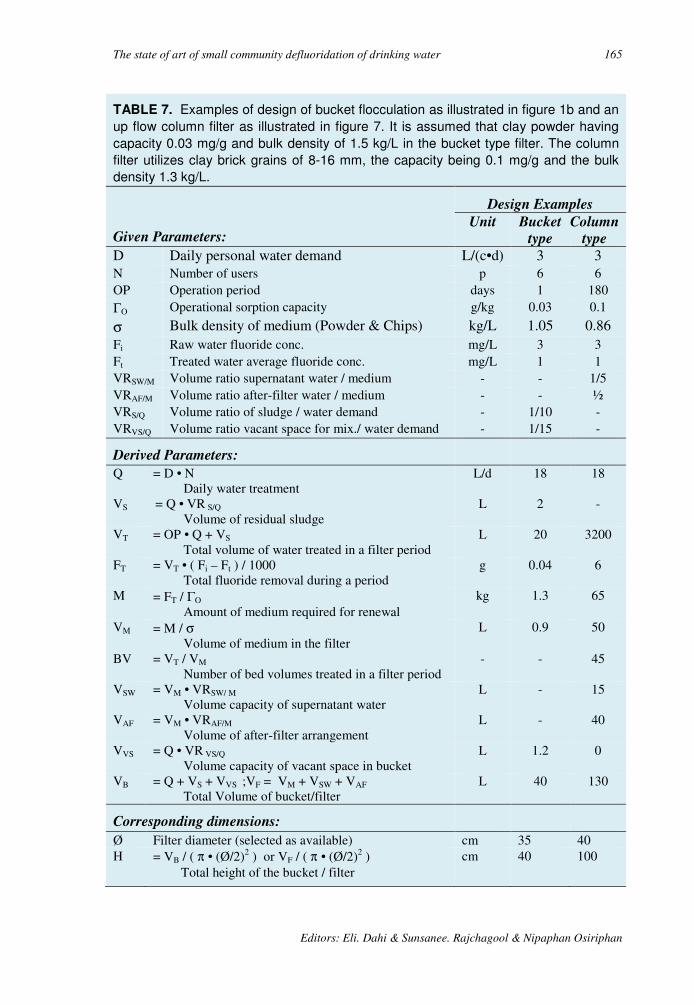
The state of art of small community defluoridation of drinking water 165
Editors: Eli. Dahi & Sunsanee. Rajchagool & Nipaphan Osiriphan
TABLE 7. Examples of design of bucket flocculation as illustrated in figure 1b and an
up flow column filter as illustrated in figure 7. It is assumed that clay powder having
capacity 0.03 mg/g and bulk density of 1.5 kg/L in the bucket type filter. The column
filter utilizes clay brick grains of 8-16 mm, the capacity being 0.1 mg/g and the bulk
density 1.3 kg/L.
Given Parameters:
Design Examples Unit Bucket
type Column
type D Daily personal water demand L/(c•d) 3 3 N Number of users p 6 6 OP Operation period days 1 180 ΓO Operational sorption capacity g/kg 0.03 0.1
σ Bulk density of medium (Powder & Chips) kg/L 1.05 0.86 Fi Raw water fluoride conc. mg/L 3 3 Ft Treated water average fluoride conc. mg/L 1 1 VRSW/M Volume ratio supernatant water / medium - - 1/5 VRAF/M Volume ratio after-filter water / medium - - ½ VRS/Q Volume ratio of sludge / water demand - 1/10 - VRVS/Q Volume ratio vacant space for mix./ water demand - 1/15 -
Derived Parameters:
Q = D • N Daily water treatment
L/d 18 18
VS = Q • VR S/Q Volume of residual sludge
L 2 -
VT = OP • Q + VS Total volume of water treated in a filter period
L 20 3200
FT = VT • ( Fi – Ft ) / 1000 Total fluoride removal during a period
g 0.04 6
M = FT / ΓO Amount of medium required for renewal
kg 1.3 65
VM = M / σ Volume of medium in the filter
L 0.9 50
BV = VT / VM Number of bed volumes treated in a filter period
- - 45
VSW = VM • VRSW/ M
Volume capacity of supernatant water
L - 15
VAF = VM • VRAF/M Volume of after-filter arrangement
L - 40
VVS = Q • VR VS/Q Volume capacity of vacant space in bucket
L 1.2 0
VB = Q + VS + VVS ;VF = VM + VSW + VAF Total Volume of bucket/filter
L 40 130
Corresponding dimensions:
Ø Filter diameter (selected as available) cm 35 40 H = VB / ( π • (Ø/2)2 ) or VF / ( π • (Ø/2)2 )
Total height of the bucket / filter cm 40 100

166 Author: E Dahi
3rd Int. Workshop on Fluorosis Prevention and Defluoridation of Water ISFR, EnDeCo & ICOH
From the design examples shown in table 7 it may be seen that the dosages required are estimated to be 73 and 20 g/L respectively. Thus the dosage is much higher than in the other methods, even though the raw water fluoride is as low as 3 mg/L. Furthermore the removal efficiencies are expected to be low i. e. 67 %. Probably the clay process would be of no or at least much less use if the water contains higher concentrations of fluoride or if better removal efficiencies are demanded.
Hygienic precautions. It is well known that clay and most other soil minerals, which demonstrate defluoridation capacities, primarily are cation-exchangers. It is also well known that especially toxic heavy metals and a wide range of other pollutants may be retained in the clay strata when rainwater percolates the soil. Furthermore it is well known that clay is efficient to retain bacteria and virus and most other infectious pathogens. Care has therefore to be taken in order to ensure that any soil material to be used in a defluoridation process:
• The medium should be calcined and stored hygienically. • The medium looses its defluoridation capacity if calcined to dead burnt
temperatures, e. g. 1200 °C. • The medium should be tested for potential dissolution of toxic materials. • The medium should not allow for microbial growth due to contents of organic
carbon.
Cost. It has been stated by Padmasiri 1997 25, that the clay process is only cost effective if the freshly burnt broken bricks of good quality are available on site or next door to the users and if the filter is prepared using low cost locally available materials.
Experiences. According to Padmasiri 1997 25, nearly 80 % of 600 clay columns defluoridators installed in house holds in Sri Lanka were found in operating conditions after being monitored in different periods from 2 years to date. The described technology was found to be sustainable, but only if the uses were motivated through information and motivation campaigns 9.
EVALUATION AND SELECTION OF METHOD
The above reporting on the methods of defluoridation reveals that we do not have a universal method that can be sustained under all kinds of social, financial, environmental and technical constraints. This is in agreement with the fact that none of methods has been implemented successfully at a large scale in many parts of the world. This is quite remarkable, especially when taking into consideration, that several defluoridation methods have been studied in details and even reported as appropriate methods, for quite a number of years 7, 8, 18, 24, 27, 30. Apart from the contact precipitation all the methods have been known already in the mid-thirties, where the agent behind “the Colorado stain”, fluoride, was discovered.
This oddity is probably due to the fact that the available defluoridation methods do have disadvantages. Some of these are what may be designated as killer disadvantages, in the sense that the method turn out to be unsustainable under the
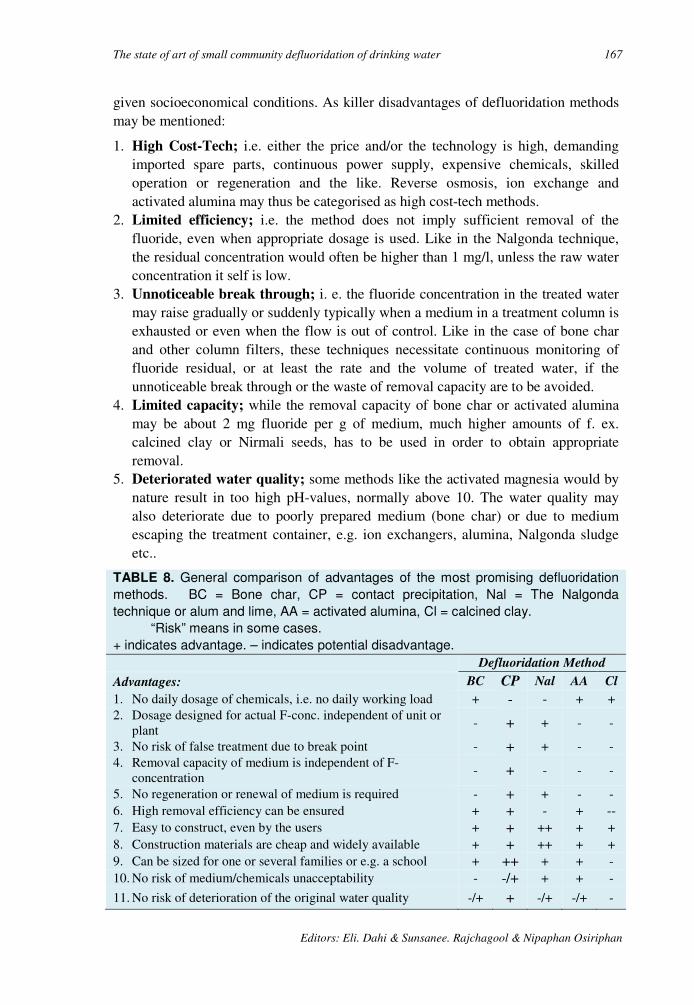
The state of art of small community defluoridation of drinking water 167
Editors: Eli. Dahi & Sunsanee. Rajchagool & Nipaphan Osiriphan
given socioeconomical conditions. As killer disadvantages of defluoridation methods may be mentioned:
1. High Cost-Tech; i.e. either the price and/or the technology is high, demanding imported spare parts, continuous power supply, expensive chemicals, skilled operation or regeneration and the like. Reverse osmosis, ion exchange and activated alumina may thus be categorised as high cost-tech methods.
2. Limited efficiency; i.e. the method does not imply sufficient removal of the fluoride, even when appropriate dosage is used. Like in the Nalgonda technique, the residual concentration would often be higher than 1 mg/l, unless the raw water concentration it self is low.
3. Unnoticeable break through; i. e. the fluoride concentration in the treated water may raise gradually or suddenly typically when a medium in a treatment column is exhausted or even when the flow is out of control. Like in the case of bone char and other column filters, these techniques necessitate continuous monitoring of fluoride residual, or at least the rate and the volume of treated water, if the unnoticeable break through or the waste of removal capacity are to be avoided.
4. Limited capacity; while the removal capacity of bone char or activated alumina may be about 2 mg fluoride per g of medium, much higher amounts of f. ex. calcined clay or Nirmali seeds, has to be used in order to obtain appropriate removal.
5. Deteriorated water quality; some methods like the activated magnesia would by nature result in too high pH-values, normally above 10. The water quality may also deteriorate due to poorly prepared medium (bone char) or due to medium escaping the treatment container, e.g. ion exchangers, alumina, Nalgonda sludge etc..
TABLE 8. General comparison of advantages of the most promising defluoridation
methods. BC = Bone char, CP = contact precipitation, Nal = The Nalgonda
technique or alum and lime, AA = activated alumina, Cl = calcined clay.
“Risk” means in some cases.
+ indicates advantage. – indicates potential disadvantage.
Defluoridation Method
Advantages: BC CP Nal AA Cl
1. No daily dosage of chemicals, i.e. no daily working load + - - + + 2. Dosage designed for actual F-conc. independent of unit or
plant - + + - -
3. No risk of false treatment due to break point - + + - - 4. Removal capacity of medium is independent of F-
concentration - + - - -
5. No regeneration or renewal of medium is required - + + - - 6. High removal efficiency can be ensured + + - + -- 7. Easy to construct, even by the users + + ++ + + 8. Construction materials are cheap and widely available + + ++ + + 9. Can be sized for one or several families or e.g. a school + ++ + + - 10. No risk of medium/chemicals unacceptability - -/+ + + -
11. No risk of deterioration of the original water quality -/+ + -/+ -/+ -

168 Author: E Dahi
3rd Int. Workshop on Fluorosis Prevention and Defluoridation of Water ISFR, EnDeCo & ICOH
6. Taboo limitations; especially the bone char method is culturally not acceptable to Hindus. The bone char origin from pigs may be questioned by Muslims. Even the charring of bones have be reported to be repulsive to villagers in North Thailand.
On the other hand all the methods mentioned do have advantages and have shown to be capable of removing fluoride at certain conditions. Four criteria are essential and may contribute to the success of fluorosis prevention through treatment of drinking water at decentralised level:
The most appropriate method has to be selected to deal with given water quality and social acceptability. Table 8 may be useful in selection of method.
Proper design and process understanding are required at least among the surveillance officers.
Media and unit spare parts have to be made available though an infrastructural setup, like village communities and social and health workers.
Motivation and training of users has to be continued through the same or a similar infrastructure.
ACKNOWLEDGEMENT
The Danish International Development Agency, Danida, has kindly provided financial support for the preparation of this paper.
LITERATURE
1. AWWA 1971. Defluoridation of Water. In: Water Quality and Treatment, p. 436-440, 3. edition, McGraw-Hill.
2. Bårdsen, A.; Björvatn, K. 1997. Fluoride Sorption in Fired Clay. In: Proceedings of the First International Workshop on Fluorosis and Defluoridation of Water, October 18-22 1995, Tanzania, p. 46-49, The International Society for Fluoride Research, Auckland.
3. Björvatn, K.; Bårdsen, A. 1997. Use of Activated Clay for Defluoridation of Water. In: Proceedings of the First International Workshop on Fluorosis and Defluoridation of Water, October 18-22 1995, Tanzania, p. 40-45, The International Society for Fluoride Research, Auckland.
4. Boruff, C.S. 1934. Removal of Fluorides from Drinking Waters. Industrial and Engineering Chemistry, vol. 25:(Jan), p. 69-71.
5. Bower, C.A.; Hatcher, J.T. 1967. Adsorption of fluoride by soils and minerals. Soil Science, vol 103:3, p. 151-154.
6. Bregnhøj, H.; Dahi, E.; Jensen, M. 1997. Modelling Defluoridation of Water in Bone Char Columns. In: Proceedings of the First International Workshop on Fluorosis and Defluoridation of Water, October 18-22 1995, Tanzania, p. 72-83, The International Society for Fluoride Research, Auckland.

The state of art of small community defluoridation of drinking water 169
Editors: Eli. Dahi & Sunsanee. Rajchagool & Nipaphan Osiriphan
7. Bulusu, K.R.; Nawlakhe, W.G.; Patil, A.R.; Karthikeyan, G. 1993. Water Quality and Defluoridation Techniques. Vol II of Prevention and Control of Fluorosis, Rajiv Gandhi National Drinking Water Mission, Ministry of Rural Development, New Delhi.
8. Bulusu, K.R.; Sundaresan, B.B.; Pathak, B.N.; Nawlakhe, W.G. et al. 1979. Fluorides in Water, Defluoridation Methods and Their Limitations. Journal of the Institution of Engineers (India), vol. 60, p. 1-25.
9. COWI 1998 Review of Practical experiences with defluoridation in rural water supply programmes Part II 73 pp. Ministry of Foreign Affairs, Danida, Copenhagen.
10. Dahi, E. 1996. Contact Precipitation for Defluoridation of Water. Paper presented at 22nd WEDC Conference, New Delhi, 9-13 September, 1996.
11. Dahi, E. 1998. Small Community Plants for Low Cost Defluoridation of Water by Contact precipitation. In: Proceedings of the 2nd International Workshop on Fluorosis and Defluoridation of Water, Nazareth, November 19-22 1997, In Press; The International Society for Fluoride Research, Auckland.
12. Dahi, E.; Bregnhøj, H. 1997. Significance of Oxygen in Processing of Bone Char for Defluoridation of Water. In: Proceedings of the First International Workshop on Fluorosis and Defluoridation of Water, October 18-22 1995, Tanzania, p. 84-90, The International Society for Fluoride Research, Auckland.
13. Dahi, E.; Bregnhøj, H.; Orio, L. 1997. Sorption Isotherms of Fluoride on Flocculated Alumina. In: Proceedings of the First International Workshop on Fluorosis and Defluoridation of Water, October 18-22 1995, Tanzania, p. 35-39, The International Society for Fluoride Research, Auckland.
14. Dahi, E.; Mtalo, F.; Njau, B.; Bregnhøj, H. 1996. Defluoridation Using the Nalgonda Technique in Tanzania. Paper presented at the 22nd WEDC Conference, India, New Delhi, 1996.
15. Dunckley, G. G. & Malthus, R. S. 1961. Removal of fluoride from fluoridated water. NZ Jour. Sci. 4; 504.
16. Fink, G. J.; Lindsay F.K. 1936. Activated Alumina for Removing Fluorides from Drinking Water. Industrial and Engineering, vol. 28:9, p. 947-948.
17. Hao, O. J.; Huang, C.P. 1986. Adsorption characteristics of fluoride onto hydrous alumina. Journal of Environmental Engineering, vol. 112:6, p. 1054-1069.
18. Heidweiller, V.M.L. 1992. Fluoride Removal Methods. In: Endemic Fluorosis In Developing Countries: Causes, Effects and Possible Solutions, chap. 6, (ed. Frencken, J.E.), Report of a Symposium held in Delft, the Netherlands, NIPG-TNO, Leiden.
19. Jacobsen, P. & Dahi 1998. Low Cost Domestic Defluoridation of Drinking Water by means of Locally Charred Bone. In: Proceedings of the 2nd International Workshop on Fluorosis and Defluoridation of Water, Nazareth, November 19-22 1997, In Press; The International Society for Fluoride Research, Auckland.
20. Jinadasa, K.B.P.N.; Weerasooriya, S.W.R.; Dissanayake, C.B. 1988. A rapid method for the defluoridation of fluoride-rich drinking waters at village level. International Journal of Environmental Studies, vol. 31, p. 305-312.
21. Mantell, C.L. 1968. Bone char. In: Carbone and Graphite Handbook, chapter 10, Interscience Publishers, New York, 538 pp., SBN 470 56779.
22. Maruthamuthu, M.; Venkatanarayana, R. 1987. A native index of defluoridation by serpentine. Fluoride, vol. 20:2, p. 64-67.
170 Author: E Dahi
3rd Int. Workshop on Fluorosis Prevention and Defluoridation of Water ISFR, EnDeCo & ICOH
23. Moges, G.; Zwenge, F.; Socher, M. 1996. Preliminary Investigations on the Defluoridation of Water Using Fired Clay Chips. Journal of African Earth Science, vol. 21:4, p. 479-482.
24. Nawlakhe, W.G.; Kulkarni, D.N.; Pathak, B.N.; Bulusu, K.R. 1975. Defluoridation of Water by Nalgonda Technique. Indian Journal of Environmental Health, vol. 17:1, p. 26-65.
25. Padmasiri, J. P. 1998 Low Cost Defluoridation of Drinking Water by means of Brick Chips. In: Proceedings of the 2nd International Workshop on Fluorosis and Defluoridation of Water, Nazareth, November 19-22 1997, In Press; The International Society for Fluoride Research, Auckland.
26. Padmasiri, J.P.; Dissanayake, C.B. 1995. A Simple Defluoridator for Removing Excess Fluorides from Fluoride-Rich Drinking Water. International Journal of Environmental Health Research, vol. 5, p. 153-160.
27. Phantumvanit, P.; Songpaisan, Y.; Møller, I.J. 1988. A Defluoridator for Individual Households. World Health Forum, vol. 9:4, p. 555-558.
28. Roche, E.H. 1968. A Fluoride Filter for Domestic Use. New Zealand Dental Journal, vol. 64, p. 18-22.
29. Singano, J.J.; Mashauri, D.A.; Dahi, E.; Mtalo, F.W. 1997. Effect of pH on Defluoridation of Water by Magnesite. In: Proceedings of the First International Workshop on Fluorosis and Defluoridation of Water, October 18-22 1995, Tanzania, p. 30-34, The International Society for Fluoride Research, Auckland.
30. Zevenbergen, C.; van Reeuvijk, L.P.; Louws, R.J.; Schuiling, R.D. 1996. A Simple Method for Defluoridation of Drinking Water at Village Level by Adsorption on Ando Soil in Kenya. The Science of the Total Environment, vol. 188, p. 225-232.
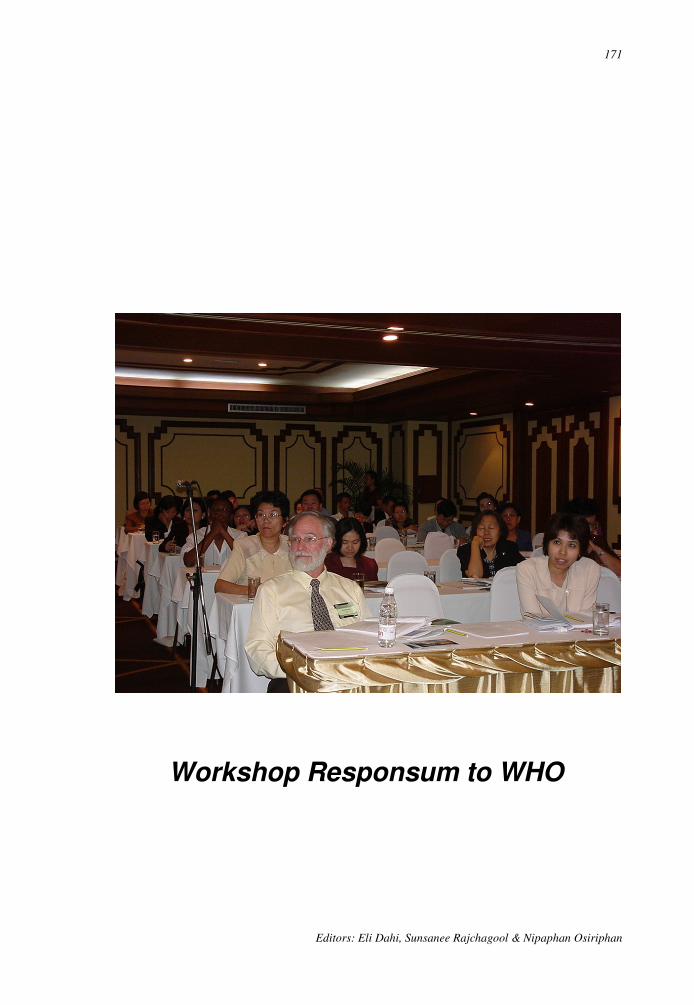
171
Editors: Eli Dahi, Sunsanee Rajchagool & Nipaphan Osiriphan
Workshop Responsum to WHO

172
3rd Int. Workshop on Fluorosis Prevention and Defluoridation of Water ISFR, EnDeCo & ICOH
173
Editors: Eli Dahi, Sunsanee Rajchagool & Nipaphan Osiriphan
Dear Madam Director-General,
This letter is written as an outcome of 3rd International Workshop on Fluorosis and Defluoridation of Water, November 20-24, 2000, Chiangmai, Thailand. The participants agreed that their shared consensus should be presented to WHO as a basis to seriously reconsider certain parts of WHO draft publication WSH/DRAFT/99.9 Fluoride in Drinking Water before its mass publication.
As you might be well aware, about one hundred millions of people, by a conservative estimate, suffer from fluorosis, all dental, skeletal and none-skeletal. The main cause of the problem of this magnitude is the fluoride contamination in water for organic consumption. The question of fluoride body intake has therefore been a matter of serious concern among affected populations and among professionals in various fields of expertise. A group of the latter - comprising individuals and institutions from chemistry, dentistry, medicine, chemical engineering, health administration and social works – has been organizing workshops on an international basis every two to three years since 1995. The proceedings based on selected papers from the first and the second workshops (organized in Ngurdoto, Tanzania in 1995 and in Nazreth, Ethiopia in 1997 respectively) are herewith enclosed for your information.
The aforementioned 3rd workshop was jointly organized by the Intercountry Centre for Oral Health (in collaboration with WHO) Thailand, International Society for Fluoride Research and Danish Environmental Development Co-operation Group. It was attended by professionals from 13 countries. The proceedings, based on the presentation of thirty-one papers, are under preparation and will be made available in due course.
3rd
International Workshop
On
Fluorosis Prevention
and
Defluoridation of Drinking Water
Participants Comments
on
WHO Draft Publication
WSH/DRATFT/99.9
Fluo
ride in Drinking Water
World Health Organisation
WHO Head Quarter
1211 Geneva 27
Switzerland.
Chiang Mai 24 Nov. 2000
174 Participants comments on WHO draft publication
3rd Int. Workshop on Fluorosis Prevention and Defluoridation of Water ISFR, EnDeCo & ICOH
In addition to several topics related to the preventive measures of fluorosis and the techniques of defluoridation, the participants had a full session devoted to reviewing WHO draft publication WSH/DRAFT/99.9 Fluoride in Drinking Water (hereafter WSH/DRAFT/99.9). The review was initiated by the authors’ invitation for comments as well as by our position regarding the problems of fluorosis. The discussion was conducted in a seminar-like fashion. Every participant had a copy of the monograph in question for thorough reading prior to the final session. Following an introductory part of a special presentation of the state of the art of the defluoridation technology, the session examined WSH/DRAFT/99.9 in detail.
As we all know the utilization of groundwater resources has been increasingly more extensive. On the other side of the coin, however, the problems of fluorosis and its severity have increased. The participants are therefore highly appreciative of WHO efforts in providing useful information and in updating previous WHO publications and its Guidelines on fluoride in drinking water. These works are potentially and particularly beneficial to the developing countries where most of the fluorotic areas happen to be covered, and where the research capacities to set their own standards for fluoride body consumption are poor, if not altogether absent. This unfortunate situation, in spite of the availability of high standard of scientific works through information technology, will remain with us for the foreseeable future. Consequently, it raises the important status, and the advantage of the economy of scale, of WHO publications. In this context the WSH/DRAFT/99.9 monograph, regardless of its intent as “guidelines” will well be regarded as authoritative, if not as “a Bible”. It has often happened that the authorities in many developing countries merely follow the recommendations and even guidelines of WHO. This situation is double-edged. Likewise WSH/DRAFT/99.9 could provide great service to a large section of humanity, providing the monograph proves to be of high scientific value.
Admirably, in the foreword the monograph states that its purpose is “the removal of excessive fluoride from drinking water”. Coincidentally and fortunately the majority of our workshop participants happened to fall into the target group of readers. They, owing to their field experiences of fighting fluorosis, paid particular attention to Chapter 6. There is a high degree of consensus regarding the chapter in particular and the monograph in general. A number of important and agreed points are here summarized and raised for your deliberation.
1. The Monograph's Title "Fluoride in Drinking Water" is uninformative. A reader is at a loss as to what to expect from the monograph. The monograph in general does not seem to pursue a specific thesis in a coherent manner. It is rather like a collection of essays, each of which is completed only in reference to itself. The heart of the problem is with the monograph’s conceptual framework, which is not crystallized, and its objectives, which are not apparent. The title is indicative of this overall lack of clearly stated goals.
2. On Chapter 5 "Guidelines and Standards" The figure "1.5" mg/L being associated with the WHO guideline, of which its advocacy is "a level at which
Participants comments on WHO draft publication 175
Editors: Eli. Dahi & Sunsanee. Rajchagool & Nipaphan Osiriphan
dental fluorosis should be minimal", has been puzzling us for over the past ten years. Why is it “1.5”?; what scientific data is the figure based on? Theoretically as well as empirically, the figure seems to be far above the proven safety level. There is already ample evidence that the so-called recommendation level of 1.5 mg/L could cause dental fluorosis for an entire community in a number of developing countries. Additionally if this chapter is read in conjunction with Chapter 3 "Human Health Risks", its meanings are immediately nullified. The amount of fluoride by itself is inconsequential to the occurrence of skeleton fluorosis. The comparison between the cases of the U.S. and of Senegal, argued at the end of chapter 3, is a good illustration. It is a matter of common sense that the difference is due to the level of water consumption, to diet cultures, or in short, to people's ways of life. The figure of fluoride alone cannot determine the severity of fluorosis, unless it is considered in the context of specific local conditions. Notwithstanding this point occasionally has also sensibly been pointed out by WHO, one can often notice that, as far as the issues of fluoride are concerned, different publications and different chapters within a publication of WHO seem to go in different directions. In another publication "Fluoride and Oral Health" (1994), WHO has propounded the concept of "optimum concentration" of fluoride in drinking water, and the figure is set at 0.5-0.7 mg/L. The concept and its related figures subsequently invite at least two questions, namely, (i) how are they related to the figure "1.5", of which its conceptual base itself is ambiguous; (ii) which figure is more sensible than others? All other factors being equal, the recommended figure of “1.5” should be reduced as far down as “0.5” which is the figure that many of us ethically found to be the maximum tolerable range. With all these shortcomings and ambiguities contained in the chapter, it is very necessary that it should be rewritten in a more scientific manner rather than as a series of unsupported statements.
3. On Chapter 6 "Removal of Excessive Fluoride" If the monograph is to be true to its stated objective, this chapter should be at its heart. The value of the monograph should lie in the provision of an overview of simple methods for the defluoridation of water, together with their conceptual basis and detailed information on the rationale behind the given designs. It would be highly useful if the chapter on defluoridation dealt more extensively with appropriate technology – that is, knowledge that works well in local contexts and is answerable to local problems with the consideration on the application scale. It should include well-tried methods such as the Alumina and resin techniques. It could even consider reverse osmosis which, although more expensive, is now available in many countries. There are other techniques that have gone through experimentation and research in different scientific centres and communities, which WSH/DRAFT/99.9 could well take into account and benefit from. Moreover though Chapter 6 gives the impression of being sophisticated and offers techniques of and information about defluoridation, it is far from being comprehensive enough for practical use. It lacks a detailed discussion on the problems of applications, which are essential for field projects.
176 Participants comments on WHO draft publication
3rd Int. Workshop on Fluorosis Prevention and Defluoridation of Water ISFR, EnDeCo & ICOH
4. On Chapter 3 "Human Health Risks" The majority of the participants, who are knowledgeable about fluorotic areas, are of the opinion that the information could completely misinform uninitiated readers. In addition to being an academic sketch and hence unsound, it principally looks at the danger of fluoride from the fluoridated water resources. That is why it stresses on the points such as "…the acute affects of fluoride exposure following fluoridation overdosing", "Crippling skeletal fluororsis is extremely rare in the US…", etc. Bearing in mind that millions and millions of people in China, India, East Africa and elsewhere have been suffering from fluorosis, this chapter totally misses the whole point. The problems of fluorosis are far more severe than they seem to be perceived by the author of this chapter. It is highly deplorable that the severity of the problem is being diluted as much as to an insignificant level. For the general readership, the chapter could be utterly misleading. For a population whose health is already at great risk by natural fluoride, it can be of little use, if any.
5. On Chapter 4 "Beneficial Use" and on Chapter 7 "Artificial Fluoridation" It is strongly suggested that these two chapters should be omitted. This is not only because they do not conform to the main purpose of the monograph but also because the information is already amply and easily available elsewhere. If WSH/DRAFT/99.9 is to be of greater use for those who suffer or will suffer from fluorosis, the focus needs to be on the toxicity of fluoride. The strategies for combating the problem are to publicize the danger of fluoride and to address the question of how we can ideally get rid of, or realistically reduce, fluoride quantity in water consumption. But the monograph tries instead to advocate the benefits of fluoride and justify artificial water fluoridation. Therefore, for any population acutely threatened by excessive fluoride, the information on the use of fluoride is irrelevant. It is ironic that while WSH/DRAFT/99.9 could be more useful for the developing countries that cover the largest portion of the world fluorotic regions, the text seems to adopt a developed-country perspective, and for those inhabitants in fluoride-free areas. For them the chapters are redundant. Taken as a whole the monograph is not helpful to people who suffer from fluorosis, nor does it really serve those who do not encounter the problem anyway. If the benefits of fluoride need to be mentioned, substantial recent research are available for studies and consultation. In principle they try to demonstrate that the use of fluoride, as a preventive measure for dental health, has impacts only on post-eruptive effects. The application of fluoride, regardless of its methods, is by no means effectual as a preventive measure aiming at pre-eruptive effects. Therefore the systemic application of fluoride, by means of water fluoridation for example, is medically as well as economically an unworthy undertaking. It could rarely bring the positive desired results. More importantly it can be seen as (i) spreading fluoride throughout one’s body and (ii) giving fluoride throughout the whole population, be it a community or a city, which is tantamount to mass medication. Weighting the advantages and disadvantages of the use of fluoride, we should call for brushing teeth with fluoridated toothpaste as an alternative to putting fluoride in consumed water. It is beyond dispute that this topical application of fluoride directly to the teeth is an efficient and fairly safe measure to prevent caries. An easy question then is: "why do WHO not advocate this
Participants comments on WHO draft publication 177
Editors: Eli. Dahi & Sunsanee. Rajchagool & Nipaphan Osiriphan
simple, logical and highly sensible method, in stead of the controversial water fluoridation?"
6. On the Overall Picture The monograph, in its professed focus, has a variety of themes. It tries to incorporate mutually incompatible themes of defluoridation and artificial fluoridation in a limited quantity of pages. Different portions assume different levels of simplicity and sophistication on the part of readers. It is difficult enough to satisfy the curiosity of people who seek knowledge and judgement beyond the elementary level. The monograph even contains some serious factual errors as some participants pointed out. Substantial improvement could therefore be made to the text. This includes the style of writing and the way the text is conceptually organized. Although the monograph is in the form of a scientific treatise, the flow of prose and the choice of words, such as unnecessary euphemisms, should not be left aside, for they have a direct impact on the messages conveyed.
7. If all these suggestions cannot be accommodated for whatever reasons, be they scientific or otherwise, it would be highly appreciated if WHO could issue another publication primarily aimed at the mitigation of fluoride in water consumption. Such a publication would directly serve a great number of people in poor countries.
For reason of space, these comments are compressed and concerned only with the gist of the problems. The whole Workshop including the detailed discussion of WSH/DRAFT/99.9, is recorded on video and can be made available upon request.
On the behalf of the participants we would like to assure you of our gratitude for your initiative and efforts. We have learned much from the monograph and we all strongly felt that our deliberations have proved to be a valuable scientific exercise. It encourages us to venture into what we consider to be an attempt to make a substantive contribution, and we are very grateful for your generous stand in welcoming comments on the draft. We look forward now to ongoing discussion of these serious matters.
Yours sincerely,
Eli Dahi, Chairperson,
International Organising Committee
Sunsanee Rajchagool, Chairperson
3rd International Organising Committee