Embed Size (px)
Citation preview

ASIACereal productionforecast 2017 (%)
-3.3
2600
2400
2200
200020182014 20162012
PRODUCTION UTILIZATION
#3
SEPTEMBER 2018
CROP PROSPECTS and Quarterly Global Report
FOOD SITUATION
GIEWS - Global Information and Early Warning System on Food and Agriculture
Countries in need of external assistance
for food
39
WORLDCereal production 2018 over 2017
Asia -0.2
Africa -4.0
Central America and the Caribbean -1.3
South America -8.8
North America +1.2
Europe -7.9
Oceania -0.1
World -2.4
-2.4%
REGIONAL HIGHLIGHTSAFRICA Unfavourable weather conditions curbed Southern African cereal outputs in 2018, heightening food insecurity, while abundant rains in East Africa boosted production prospects although resulting in localized flooding. Favourable spring weather instigated an upturn in production in North Africa, while in West Africa, harvests are expected to revert back to average levels. Conflicts in several countries of the region continue to acutely impact agricultural capacities.
ASIA Cereal harvests in 2018 are anticipated at below-average levels in the Near East and CIS Asia, on account of rainfall deficits, while ongoing conflicts in parts of the Near East continue to impede agricultural activities. Cereal output in the Far East is forecast to rise slightly, driven by a larger paddy output.
LATIN AMERICA AND THE CARIBBEAN Dry weather conditions in South America have lowered 2018 cereal outputs relative to last year’s record, particularly maize. In Central America and the Caribbean, unfavourable rains affected 2018 maize production, except in Mexico.
COUNTRIES REQUIRING EXTERNAL ASSISTANCE FOR FOOD FAO assesses that globally 39 countries continue to be in need of external assistance for food. Persisting conflicts are the dominant factor driving the high level of severe food insecurity, as well as climate-related shocks which have also adversely impacted food availability and access.
LIFDC Cereal production 2018
over 2017
- 0.2%
(rice in milled terms)
470
480
490
500
-0.2%
2016 2017
492.1
478.8
491.4
(million tonnes)
2018forecast

The designations employed and the presentation of material in this information product do not imply the expression of any opinion whatsoever on the part of the Food and Agriculture Organization of the United Nations (FAO) concerning the legal or development status of any country, territory, city or area or of its authorities, or concerning the delimitation of its frontiers or boundaries. The mention of specific companies or products of manufacturers, whether or not these have been patented, does not imply that these have been endorsed or recommended by FAO in preference to others of a similar nature that are not mentioned.
The views expressed in this information product are those of the author(s) and do not necessarily reflect the views or policies of FAO.
ISBN 978-92-5-130948-3
© FAO, 2018
Some rights reserved. This work is made available under the Creative Commons Attribution-Non-Commercial-ShareAlike 3.0 IGO license (CC BY-NC-SA 3.0 IGO; https://creativecommons.org/licenses/by-nc-sa/3.0/igo).
Under the terms of this license, this work may be copied, redistributed and adapted for non-commercial purposes, provided that the work is appropriately cited. In any use of this work, there should be no suggestion that FAO endorses any specific organization, products or services. The use of the FAO logo is not permitted. If the work is adapted, then it must be licensed under the same or equivalent Creative Commons license. If a translation of this work is created, it must include the following disclaimer along with the required citation: “This translation was not created by the Food and Agriculture Organization of the United Nations (FAO). FAO is not responsible for the content or accuracy of this translation. The original [Language] edition shall be the authoritative edition."
Any mediation relating to disputes arising under the license shall be conducted in accordance with the Arbitration Rules of the United Nations Commission on International Trade Law (UNCITRAL) as at present in force.
Third-party materials. Users wishing to reuse material from this work that is attributed to a third party, such as tables, figures or images, are responsible for determining whether permission is needed for that reuse and for obtaining permission from the copyright holder. The risk of claims resulting from infringement of any third-party-owned component in the work rests solely with the user.
Sales, rights and licensing. FAO information products are available on the FAO website (www.fao.org/publications) and can be purchased through [email protected]. Requests for commercial use should be submitted via: www.fao.org/contact-us/licence-request. Queries regarding rights and licensing should be submitted to: [email protected].

GIEWS CROP PROSPECTS AND FOOD SITUATION #3
SEPTEMBER 2018
CONTENTS
COUNTRIES REQUIRING EXTERNAL ASSISTANCE FOR FOOD 2
GLOBAL CEREAL OVERVIEW 6
LOW-INCOME FOOD-DEFICIT COUNTRIES’ FOOD SITUATION OVERVIEW 9
REGIONAL REVIEWS
AFRICA - Overview 11 NORTH AFRICA 12
WEST AFRICA 13
CENTRAL AFRICA 14
EAST AFRICA 15
SOUTHERN AFRICA 18
ASIA - Overview 20 FAR EAST 21
NEAR EAST 23
CIS IN ASIA 24
LATIN AMERICA AND THE CARIBBEAN - Overview 26 CENTRAL AMERICA AND THE CARIBBEAN 27
SOUTH AMERICA 28
NORTH AMERICA, EUROPE AND OCEANIA - Overview 30 NORTH AMERICA 31
EUROPE 31
OCEANIA 32
STATISTICAL APPENDIX
Table A1. Global cereal supply and demand indicators 33
Table A2. World cereal stocks 34
Table A3. Selected international prices of wheat and coarse grains 35
Table A4a. Estimated cereal import requirements of Low-Income Food-Deficit Countries in 2017/18 or 2018 36
Table A4b. Estimated cereal import requirements of Low-Income Food-Deficit Countries in 2017/18 or 2018 37
Table A5. Estimated cereal import requirements of Low-Income Food-Deficit Countries in 2018/19 38

2
GIEWS CROP PROSPECTS AND FOOD SITUATION #3
SEPTEMBER 2018
COUNTRIES REQUIRING EXTERNAL ASSISTANCE FOR FOOD
AFRICA (31 COUNTRIES)
EXCEPTIONAL SHORTFALL IN AGGREGATE FOOD PRODUCTION/SUPPLIES
Central African Republic Conflict, displacements and food supply constraints• The Internally Displaced People (IDP) caseload
in July 2018 was estimated at about 615 000, a 10 percent decrease since March 2018. About 2 million people (43 percent of the total population) are estimated to be in need of urgent assistance for food due to the persisting widespread insecurity, several consecutive years of reduced agricultural production and poorly functioning markets, especially for displaced persons, host families and returnees.
• Violent clashes and inter-communal tensions persist, fueling the massive displacements, with severe negative impacts on food security.
WIDESPREAD LACK OF ACCESS
Burundi Civil insecurity, economic downturn and localized crop production shortfalls• Disruptions to markets, farming activities and
livelihoods, coupled with limited humanitarian assistance and declining food import capacity, continue to seriously affect food security conditions.
• About 1.67 million people are estimated to be severely food insecure, and the most affected area is the western Ruyigi Province.
Chad Civil insecurity, internal displacements and deterioration of pastoral conditions• According to the “Cadre Harmonisé”, about
990 000 were projected to be food insecure during June to August, due to the serious deterioration of pastoral conditions in the Sahel.
• Nearly 1.9 million people remained internally displaced, almost entirely on account of the insurgency in the northeast, and in addition the country hosts about 450 000 refugees.
Democratic Republic of the Congo Conflict and displacements in eastern and southern areas as well as an influx of refugees straining resources of host communities• The country hosts 176 000 refugees from the
Central African Republic, 94 000 from South Sudan, and 47 000 from Burundi. The total IDP caseload is estimated at 4.5 million.
• An outbreak of the Ebola Virus Disease (EVD) has been reported and as of 26 August, 111 cases have been confirmed, more than double the level since May.
Djibouti Impact of consecutive unfavourable rainy seasons on pastoral livelihoods• About 197 000 people are severely food insecure,
mainly concentrated in pastoral areas north of Obock City and in southeastern border areas, which were affected by consecutive unfavourable rainy seasons.
Eritrea Economic constraints have increased the population’s vulnerability to food insecurity
AFRICA (31 countries)- Burkina Faso
- Burundi- Cabo Verde
- Cameroon
- Central African Republic
- Chad
- Congo
- Democratic Republic of Congo
- Djibouti
- Eritrea
- Eswatini
- Ethiopia
- Guinea
- Kenya
- Lesotho
- Liberia
- Libya
- Madagascar
- Malawi
- Mali
- Mauritania
- Mozambique
- Niger
- Nigeria- Senegal
- Sierra Leone
- Somalia
- South Sudan
- Sudan
- Uganda
- Zimbabwe
ASIA (7 countries)- Afghanistan
- Democratic People’s Republic of Korea
- Iraq
- Myanmar
- Pakistan
- Syrian Arab Republic
- Yemen
LATIN AMERICA AND THE CARIBBEAN (1 country)- Haiti
Source: GIEWS

3
GIEWS CROP PROSPECTS AND FOOD SITUATION #3
SEPTEMBER 2018
Ethiopia Impact of drought on local livelihood systems• An estimated 7.88 million people were
affected by food insecurity, mainly in southeastern agro pastoral areas, due to the lingering effects of severe drought conditions between mid-2016 and late 2017.
• About 1 million people have been displaced since June 2018 in Somali, Oromia and SNNP regions resulting from inter-communal conflict.
Malawi Decline in cereal production• The number of people assessed to be
food insecure in 2018 more than doubled on a yearly basis to 3.3 million people.
• The sharp increase mostly results from a decline in cereal production, with the 2018 output estimated to be below average.
Niger Civil conflict and pastoral deficit hinder food security conditions• According to the last “Cadre Harmonisé”
analysis, about 800 000 in the June August period were assessed to be in need of immediate assistance.
• Due to the civil conflict in neighbouring countries, more than 166 000 people reside as refugees, of which 108 000 are from Nigeria and 57 000 are from Mali.
Nigeria Persisting conflict results in population displacements, market disruptions and limited access to food aid in northern areas• According to the “Cadre Harmonisé”
analysis, about 5.3 million people were assessed to be in need of assistance between June and August
• Market functionality and livelihood activities remain disturbed by the ongoing civil insecurity, limiting food access to vulnerable households. The areas inaccessible to humanitarian interventions are facing the worse food security conditions.
South Sudan Conflict, civil insecurity and severe economic downturn• Despite sustained humanitarian
assistance, food insecurity still affects large segments of the population. The number of severely food insecure people for the June-July period was estimated at 6 million. The significantly high numbers are a result of persisting insecurity,
economic constraints, trade disruptions and high food prices.
Zimbabwe Food access constraints• An estimated 2.4 million people were
assessed to be food insecure in 2018, mostly due to a reduced cereal output in 2018 and food access constraints, stemming from low incomes and liquidity challenges.
SEVERE LOCALIZED FOOD INSECURITY
Burkina Faso Tight supplies and high prices• According to the last “Cadre Harmonisé”
analysis, the number of people in need of food assistance was projected at 950 000 for the June-August period, mainly due to localized production shortfalls.
• About 25 000 refugees, most of them from Mali, are estimated to be living in the country.
Cabo Verde Poor performance of the 2017 agro-pastoral cropping season caused significant loss of livelihoods• According to the last “Cadre Harmonisé”
analysis, about 21 000 people (approximately 4 percent of the total population) were estimated to be in Phase 3: “Crisis” and above.
Cameroon Influx of refugees putting strain on host communities and displacements • The number of refugees from the Central
African Republic was estimated at 261 000 as of end-July 2018. Insecurity along the borders with Nigeria also led to the internal displacement of 238 000 individuals.
• An ongoing crisis since October 2016 due to perceived marginalization and resistance to the assimilation of the English-speaking minority to the French speaking majority, has negatively affected populations in the Northwest and Southwest regions.
Congo Influx of refugees straining the already limited resources of host communities • As of end-January 2018, about 32 000
refugees from the Central African Republic are sheltering in the country.
Eswatini Reduced crop production• About 122 000 people were assessed to
be affected by food insecurity in 2018, mainly located in the east and south of the country, where unfavourable weather resulted in localized production shortfalls.
Guinea Localized production shortfalls • About 34 000 people are estimated to
be in need of food assistance.
Kenya Consecutive unfavourable rainy seasons affect crop and livestock production• About 2.35 million people are severely
food insecure, mainly located in eastern, southeastern and coastal areas as a result of the lingering effects of severe drought conditions between mid-2016 and late 2017.
LesothoDecrease in cereal production• An estimated 309 000 people are
affected by food insecurity in 2018. • This year’s estimate is slightly higher than
in 2017, reflecting a drop in the 2018 cereal output.
Liberia Localized production shortfalls and influx of refugees• About 29 000 people are estimated to
be in need of food assistance.
Libya Civil insecurity• The number of people in need of food
assistance is estimated at 0.4 million, with refugees, asylum seekers and internally displaced among the most vulnerable.
• Food shortages are reported mostly in the south and east where basic food items are in short supply. Access to subsidized food among the affected population is limited.
Madagascar Dry spells and impact of cyclones• The number of people affected by food
insecurity increased to 1.3 million in southern regions, due to unfavourable weather conditions that kept cereal production in 2018 at below-average levels, while record high prices earlier in the year negatively impinged on food access.

4
GIEWS CROP PROSPECTS AND FOOD SITUATION #3
SEPTEMBER 2018
• At the national level, rice production is estimated to have increased in 2018, mostly reflecting improved outputs in central and northern regions, bolstering food availability.
Mali Civil insecurity in northern areas and limited access due to falling income from pastoral production• The country is hosting approximately
20 000 refugees, while 50 000 internally displaced people and 64 000 returnees, also mainly depend on humanitarian assistance.
• About 933 000 people were estimated to be in need of food assistance between June and August, according to the last “Cadre Harmonisé” analysis, as a result of the persisting civil conflict.
Mauritania Declines in agricultural and pastoral production result in unfavourable food security outcomes • According to the March 2018 “Cadre
Harmonisé” analysis, about 538 000 people were assessed to be in need of assistance from June to August, given their below average cereal supplies and reduced purchasing power.
• About 58 000 refugees, mostly from Mali, reside in the country.
Mozambique Weather shocks and localized production shortfalls• Dry conditions and pest infestations
caused localized production shortfalls in southern province and some areas of the centre. As a result, an estimated 891 000 people are food insecure, with the majority located in central Tete and southern Gaza provinces.
• At the national level, cereal production is estimated to have increased in 2018.
SenegalStressed pastoral conditions• According to the last “Cadre Harmonisé”
analysis, about 750 000 people were estimated to be in need of assistance between June and August.
• An estimated 15 000 refugees, mostly from Mauritania, are residing in the country.
Sierra Leone Floods and localized production shortfalls• About 12 000 people are estimated to
be severely food insecure.
Somalia Conflict, civil insecurity and widespread drought conditions• About 1.56 million people are
estimated to be in need of emergency assistance, mainly IDPs and agro-pastoral communities affected by the lingering effects of the severe drought conditions between mid-2016 and late 2017.
SudanConflict and civil insecurity • The number of severely food insecure
people for the period May-July was estimated at 6.2 million, mainly IDPs and host communities in conflict-affected areas. Vulnerable households affected by soaring food prices and production shortfalls during the 2017 season are also of concern.
Uganda Localized crop production shortfalls and refugee influx• In the northeastern Karamoja Region,
the lean season ended in September 2017, about one month later than normal, as harvests were delayed. In addition, crop production is estimated at a below-average level and households are expected to deplete their food stocks from own production by December 2018, thus facing an early start of the next lean season.
• About 1.1 million refugees from South Sudan and about 316 000 refugees from the Democratic Republic of the Congo are hosted in camps and depend on humanitarian assistance.
ASIA (7 COUNTRIES)
EXCEPTIONAL SHORTFALL IN AGGREGATE FOOD PRODUCTION/SUPPLIES
Syrian Arab Republic Civil conflict and weather related events• About 6.5 million people are food
insecure and 4 million are at risk of food insecurity.
• Domestic cereal production in 2018 is forecast to decrease significantly, as a result of unfavourably distributed rains.
• Although some international food assistance is being provided, Syrian refugees are also straining host communities' resources in neighbouring countries.
WIDESPREAD LACK OF ACCESS
Democratic People’s Republic of Korea Localized production shortfalls for 2018 main crop and economic downturn• Reflecting expectations of a reduced
2018 main season cereal output, most households are anticipated to continue to experience borderline or poor food consumption rates.
Yemen Conflict, poverty and high food and fuel prices• An estimated 17.8 million people
are food insecure and require urgent humanitarian assistance, a 5 percent increase over 2017 estimates.
SEVERE LOCALIZED FOOD INSECURITY
Afghanistan Continuing conflict and population displacement• Almost 2.2 million people were
considered to be chronically food insecure, of which 1.4 million people are at risk of acute food insecurity due to drought. Continuing conflict, natural hazards and limited economic opportunities have increased the vulnerability of the poorest households, including subsistence farmers.
Iraq Civil conflict• As of January 2018, about 2.6 million
people were internally displaced.• About 800 000 people were in
need of food security assistance in December 2017.
Myanmar Conflict in parts of Kachin, Shan and resurgence of violence in Rakhine• According to the latest data from
the International Organization for Migration (June 2018), the estimated number of refugees from Myanmar in Bangladesh increased slightly to 919 000. In addition 241 000 people were internally displaced in Kachin, Kayin, Shan and Rakhine states due to ongoing conflict.
• These populations rely mainly on humanitarian assistance to cover their basic needs.

5
GIEWS CROP PROSPECTS AND FOOD SITUATION #3
SEPTEMBER 2018
Pakistan Population displacement and localized cereal production shortfalls• In Tharparkar District and the
surrounding areas of Sindh Province, the drought-affected cereal production in 2018 and significant losses of livestock have aggravated food insecurity and caused acute malnutrition.
• The country hosts close to 1.4 million registered and unregistered Afghan refugees. Most of these people are in need of humanitarian assistance.
LATIN AMERICA AND THE CARIBBEAN (1 COUNTRY)
SEVERE LOCALIZED FOOD INSECURITY
Haiti Hurricane damage• The food security situation has generally
improved, with no departments classified under IPC crisis phases. However, there are 386 050 people who are in need of humanitarian assistance after the shock of Hurricane Matthew in 2016.
Terminology
Countries requiring external assistance for food are expected to lack the resources to deal with reported critical problems of food insecurity. Food crises are nearly always due to a combination of factors but for the purpose of response planning, it is important to establish whether the nature of food crises is predominantly related to lack of food availability, limited access to food, or severe but localized problems. Accordingly, the list of countries requiring external assistance is organized into three broad, not mutually exclusive, categories:• Countries facing an exceptional
shortfall in aggregate food production/supplies as a result of crop failure, natural disasters, interruption of imports, disruption of distribution, excessive post-harvest losses, or other supply bottlenecks.
• Countries with widespread lack of access, where a majority of the population is considered to be unable to procure food from local markets, due to very low incomes, exceptionally high food prices, or the inability to circulate within the country.
• Countries with severe localized food insecurity due to the influx of refugees, a concentration of internally displaced persons, or areas with combinations of crop failure and deep poverty.
* Unfavourable Production Prospects Countries facing unfavourable crop production prospects are countries where forecasts point to a decrease in the cereal output compared to the five-year average, as a result of a reduction of the area planted and/or yields due to adverse weather conditions, plant pests and diseases, conflicts and other negative factors. This list does not include countries where production declines are mainly driven by deliberate/predetermined economic and/or policy decisions (see Regional Reviews pages:
page 11 (Africa)
page 20 (Asia)
page 26 (Latin America and the Caribbean)
page 30 (North America, Europe and Oceania)

6
GIEWS CROP PROSPECTS AND FOOD SITUATION #3
SEPTEMBER 2018
Cereal Supply and Demand Overview1
World cereal production forecast for 2018 raised, but still below last year’s record high levelFAO’s latest forecast for global cereal production in 2018 is pegged at a three-year low of 2 587 million tonnes, despite a small (1.2 million tonnes) upward revision since July. This forecast puts global cereal production at 64.5 million tonnes, or 2.4 percent, below last year’s record high level.
FAO’s forecast for world wheat production in 2018 has been lowered by 14 million tonnes (1.9 percent) compared to the forecast made in July and now stands at almost 722 million tonnes, the smallest crop since 2013. Most of the month-on-month
downward revision stems from developments in the European Union, where dry and hot weather during the summer months intensified yield reductions in northern countries, resulting in a cut to the production forecast by 6 percent (9 million tonnes); the European Union wheat output is now forecast at 138 million tonnes, the lowest level since 2012. Production forecasts for Australia, China (Mainland) and the Russian Federation have also been lowered, mostly on account of unfavourable weather, while upward revisions were made for Argentina and the United States of America.
World production of coarse grains in 2018 is forecast by FAO at nearly 1 354 million tonnes, 15 million tonnes (1.1 percent) up from the forecast made in July, but still 36.4 million tonnes (2.6 percent) below the previous year’s level. The recent upturn
GLOBAL CEREAL OVERVIEW
Table 1. World cereal production1 (million tonnes)
20162017
estimate2018
forecastChange:
2018 over 2017 (%)
Asia 1 131.8 1 152.3 1 150.4 -0.2
Far East 1 028.3 1 048.3 1 049.6 0.1
Near East 66.6 68.4 66.6 -2.6
CIS in Asia 36.9 35.6 34.1 -4.2
Africa 170.3 186.8 179.3 -4.0
North Africa 30.8 36.3 36.2 -0.2
West Africa 57.2 59.3 56.9 -4.0Central Africa 5.0 4.5 4.5 -0.6East Africa 52.7 48.3 49.3 2.1
Southern Africa 24.7 38.4 32.3 -15.9
Central America and the Caribbean 45.1 44.0 43.4 -1.3
South America 174.2 216.4 197.3 -8.8
North America 531.8 493.9 499.9 1.2
Europe 508.1 524.1 482.8 -7.9
European Union 299.4 310.1 289.2 -6.7
CIS in Europe 192.9 202.5 179.9 -11.2
Oceania 51.4 34.5 34.4 -0.1
World 2 612.7 2 652.0 2 587.5 -2.4
Developing countries 1 464.9 1 535.3 1 511.2 -1.6
Developed countries 1 147.8 1 116.7 1 076.2 -3.6
- wheat 756.5 756.7 721.8 -4.6
- coarse grains 1 355.0 1 390.2 1 353.8 -2.6
- rice (milled) 501.2 505.0 511.8 1.3
Note: Totals and percentage change computed from unrounded data.1 Includes rice in milled terms.
1 Based on the FAO Cereal Supply and Demand Brief released on 6 September 2018.

7
GIEWS CROP PROSPECTS AND FOOD SITUATION #3
SEPTEMBER 2018
in production prospects since July mostly reflect improved outlooks for maize in China (Mainland), Ukraine and the United States of America, where improved weather has lifted yield forecasts. Expected output increases in these countries more than offset reductions in forecasts for the European Union and the Russian Federation, where moisture deficits have curbed yield expectations. The outlook for global barley production in 2018 has been lowered slightly, mostly on account of lower than previously expected yields in the European Union, due to dry and warm weather conditions, while the forecast for world sorghum production remains virtually unchanged since July.
Following a small upward adjustment since July, FAO’s new forecast of world rice production in 2018 stands at 511.8 million tonnes, up 1.3 percent from 2017 and representing an all-time high. At the country level, improved yield prospects are now anticipated to translate into larger output recoveries in Bangladesh and Viet Nam than earlier anticipated, whilst planting estimates also point to stronger area rebounds than previously foreseen in Sri Lanka and the United States of America. By contrast, the outlook is down for Egypt, where official efforts to preserve water and competition with cotton are estimated to have cut rice plantings more steeply.
Modest increase projected for total cereal utilization in 2017/18, driven by higher feed and industrial use of maize in particularThe forecast of world cereal utilization has been raised since July by 7 million tonnes (0.3 percent) to 2 648 million tonnes, up 30 million tonnes (1.2 percent) from 2017/18. The bulk of the latest monthly revision, as well as the anticipated expansion from the previous season, relates to maize. Larger maize feeding and higher industrial use are expected to raise total maize utilization to 1 105 million tonnes, nearly 14 million tonnes (1.3 percent) over the July forecast and 30 million tonnes (2.8 percent) higher than in 2017/18. The expected higher use of maize for feed in 2018/19 is seen to more than offset the anticipated reductions in feed use of other major cereals, in particular barley, wheat and sorghum. Rice utilization in 2018/19 is forecast to grow by 1.1 percent to 509.6 million tonnes, a level sufficient to maintain global per capita food intake of rice largely stable at around 53.9 kg.
Global cereal stocks to dip to a four-year lowSince July, the forecast of global cereal stocks by the close of the seasons ending in 2019 has been lowered by 7.1 million tonnes, to a four-year low of 741.8 million tonnes, down as much
Table 2. Basic facts of world cereal situation (million tonnes)
2016/17 2017/18 estimate
2018/19 forecast
Change: 2018/19 over 2017/18 (%)
Production 1 2 612.7 2 652.0 2 587.5 -2.4Developing countries 1 464.9 1 535.3 1 511.2 -1.6Developed countries 1 147.8 1 116.7 1 076.2 -3.6
Trade 2 405.3 420.3 413.9 -1.5Developing countries 117.1 139.5 133.8 -4.1Developed countries 288.2 280.8 280.0 -0.3
Utilization 2 570.8 2 618.2 2 648.5 1.2Developing countries 1 661.5 1 705.6 1 736.5 1.8Developed countries 909.3 912.6 912.1 -0.1Per caput cereal food use (kg per year) 147.9 148.4 148.4 0.0
Stocks 3 781.7 807.0 741.8 -8.1Developing countries 574.8 599.2 572.1 -4.5Developed countries 206.9 207.9 169.7 -18.4World stock-to-use ratio (%) 29.9 30.5 27.3 -10.3
Note: Totals and percentage change computed from unrounded data.1 Data refer to calendar year of the first year shown and includes rice in milled terms.2 For wheat and coarse grains, trade refers to exports based on July/June marketing season. For rice, trade refers to exports based on the calendar year of the second year shown. 3 Data are based on an aggregate of carryovers level at the end of national crop years and, therefore, do not represent world stock levels at any point in time.

8
GIEWS CROP PROSPECTS AND FOOD SITUATION #3
SEPTEMBER 2018
as 65 million tonnes, or 8 percent, from their record high opening levels. This would result in the global cereal stock-to-use ratio sliding to 27.3 percent, the lowest since 2013/14. Most of the projected decline in 2018/19 is the result of reductions foreseen in China (Mainland), the European Union and the Russian Federation. This recent downward revision in projected wheat production has prompted a significant revision to the forecast of wheat stocks, now pegged at 252 million tonnes, which would be down nearly 12 million tonnes from July and 21.4 million tonnes (7.8 percent) from their all-time high opening levels. At the current forecast level, the ratio of major wheat exporters’ closing stocks to their total disappearance (defined as domestic utilization plus exports), which is considered a good measure of availability in global markets, would drop to a six-year low of 15.3 percent, well below the 20.8 percent estimated for 2017/18. By contrast, the FAO forecast for maize inventories has been lifted since July by almost 7 million tonnes. However, despite this increase, global maize reserves would still fall significantly (by 13.6 percent) below their opening levels, dropping to 267 million tonnes, which would make them
hit their lowest level in six years. By contrast, global rice reserves at the close of 2018/19 are expected to expand for the third successive season to 173.4 million tonnes, owing to replenishments in importing countries, China (Mainland) and Indonesia in particular, and in major exporters, such as India and the United States of America.
World cereal trade in 2018/19 heading for a moderate decline from the 2017/18 record levelFAO’s forecast of world trade in cereals in 2018/19 has been increased to nearly 414 million tonnes, 1.7 million tonnes more than was reported in July. The upward revision largely reflects an increased trade forecast for maize, more than offsetting a downsizing of trade prospects for wheat, rice and sorghum. Nonetheless, at the current forecast level, world trade in cereals in 2018/19 would still be some 6.4 million tonnes (1.5 percent) below the previous season, which was a record. Among the individual cereals, trade in wheat in the current marketing season is seen heading for a 1.8-percent contraction (3.2 million tonnes), while sorghum trade is likely to decline by 14.4 percent (1.1 million tonnes) and rice by 1.1 percent (518 000 tonnes).

9
GIEWS CROP PROSPECTS AND FOOD SITUATION #3
SEPTEMBER 2018
Adverse weather conditions drive down production in CIS Asia and Southern African countriesThe aggregate cereal production of Low-Income Food-Deficit Countries (LIFDCs) in 2018 is forecast at 491.4 million tonnes, fractionally lower than the output of 2017 although still 19 million tonnes above the five-year average. The near-unchanged aggregate production mainly reflects weather-reduced outputs in Southern Africa, CIS Asia and the Near East, which are expected to offset production gains in Far East Asia and Eastern Africa.
In Southern Africa, despite beneficial weather conditions towards the end of the cropping season, rainfall deficits at key cropping stages curbed the 2018 cereal outputs, with the largest reductions estimated in Malawi and Zimbabwe. While in West Africa, notably Nigeria and Côte d’Ivoire, cereal harvests are forecast to revert back to average levels from the bumper highs of 2017. In CIS Asian countries, insufficient precipitation resulted in reduced outputs in Tajikistan and Uzbekistan. Similarly, in the Near East, poor weather conditions are also forecast to have caused a reduction in Afghanistan’s cereal output. Moreover, in the Syrian Arab Republic, in addition to poorly distributed seasonal rains particularly in the main cereal-growing areas, the effects of the conflict continue to acutely degrade agricultural capacities, resulting in a sharply reduced production forecast for 2018.
LOW-INCOME FOOD-DEFICIT COUNTRIES’ FOOD SITUATION OVERVIEW2
Table 4. Cereal production1 of LIFDCs(million tonnes)
20162017
estimate2018
forecastChange:
2018 over 2017 (%)
Africa (37 countries) 123.1 123.7 121.5 -1.8East Africa 52.7 48.3 49.3 2.1Southern Africa 8.3 11.7 10.9 -7.1West Africa 57.2 59.3 56.9 -4.0Central Africa 4.9 4.5 4.4 -0.6
Asia (11 countries) 354.5 367.2 368.8 0.4CIS in Asia 11.3 11.0 9.5 -14.2Far East 333.2 347.7 352.4 1.4 - India 243.9 256.6 259.5 1.1Near East 10.0 8.5 6.9 -19.2
Central America and the Caribbean (2 countries) 1.2 1.2 1.1 -6.7
Oceania (2 countries) 0.0 0.0 0.0 0.0
LIFDC (52 countries) 478.8 492.1 491.4 -0.2
Note: Totals and percentage change computed from unrounded data.1 Includes rice in milled terms. 2 The inclusion of a country in the Low-Income
Food-Deficit Countries (LIFDCs) group is based on three criteria: 1) the level of the annual per capita Gross National Income (GNI); 2) the net food trade position; and 3) self exclusion (when countries that meet the first two criteria request to be excluded from the category). The current (2016) list of the LIFDCs includes 52 countries, two less than in the 2015 list but with some changes. For full details see: www.fao.org/countryprofiles/lifdc
Table 3. Basic facts of Low-Income Food-Deficit Countries (LIFDCs) cereal situation(million tonnes, rice in milled basis)
2016/17 2017/18 estimate
2018/19 forecast
Change: 2018/19 over 2017/18 (%)
Cereal production1 478.8 492.1 491.4 -0.2 excluding India 235.0 235.5 231.9 -1.5
Utilization 527.5 528.2 533.9 1.1Food use 411.2 419.2 425.1 1.4 excluding India 216.3 221.6 224.9 1.5Per caput cereal food use (kg per year) 146.7 147.0 146.5 -0.3 excluding India 146.2 146.5 145.3 -0.8Feed 43.4 45.9 44.8 -2.2 excluding India 27.2 28.1 27.1 -3.6
End of season stocks2 90.8 97.8 94.7 -3.2 excluding India 56.3 57.1 51.1 -10.4
1 Data refer to calendar year of the first year shown.2 May not equal the difference between supply and utilization because of differences in individual country marketing years.

10
GIEWS CROP PROSPECTS AND FOOD SITUATION #3
SEPTEMBER 2018
In Far East Asia, cereal production in 2018 is forecast to rise, primarily driven by gains estimated in Bangladesh and India. In India, the largest producing LIFDC, a record wheat output is the main reason for this year’s production upturn, mostly reflecting bumper yields on account of beneficial weather conditions. Similarly, in Bangladesh, favourable weather conditions, as well as prospects of remunerative prices, instigated an expansion in paddy plantings that drove up cereal production in 2018 compared to the weather-reduced harvest of 2017. Countries in Eastern Africa are also expected to gather larger cereal harvests in 2018, following the reduced outputs in 2017. The projected increases mostly reflect beneficial weather, however, torrential rains earlier in the year and more recently in August triggered floods that caused localized crop losses, capping the production forecast. Notable year-on-year production increases are forecast for Kenya, Somalia and
the United Republic of Tanzania. The production outlook in Central Africa and Central America point to a mostly unchanged harvest in 2018 compared to the near-average levels of the previous year.
Contraction in import forecasts in Far East Asia, while reduced harvests in parts of Africa increase import needsFAO’s forecast for cereal imports by LIFDCs in the 2017/18 marketing year stands at 64.3 million tonnes, down by about 4 percent from the previous year. Most of the decrease results from lower import requirements in the Far East, mainly pertaining to Bangladesh and India. Similarly, the import forecast was cut for Madagascar, on the back of a rebound in rice production. These declines offset expected rises in imports of cereals in CIS Asia, as well as Southern African and West African countries, on account of reduced supplies from domestic production.
Table 5. Cereal imports of LIFDCs(thousand tonnes)
2016/17 or 2017 2017/18 or 2018 2018/19 or 2019
Actual importsImport
forecastof which food aid
Import requirement 1
of which food aid
Africa (37 countries) 35 867 35 432 1 043 35 391 829East Africa 11 211 11 869 733 10 955 528Southern Africa 3 870 2 907 15 2 723 13West Africa 18 470 18 397 134 19 397 134Central Africa 2 317 2 259 161 2 316 154
Asia (11 countries) 29 061 29 837 826 26 838 824CIS in Asia 4 648 4 819 0 4 882 0Far East 14 260 14 275 199 10 824 197Near East 10 152 10 742 627 11 132 627
Central America and the Caribbean (2 countries) 1 484 1 399 10 1 492 10
Oceania (2 countries) 483 504 0 534 0
LIFDC (52 countries) 66 895 67 172 1 878 64 255 1 663
Note: Totals computed from unrounded data.1 The import requirement is the difference between utilization (food, feed, other uses, exports plus closing stocks) and domestic availability (production plus opening stocks).

11
GIEWS CROP PROSPECTS AND FOOD SITUATION #3
SEPTEMBER 2018
Africa Production OverviewCereal production in Africa is forecast to decline by 4 percent from the previous year’s high output to 179.3 million tonnes in 2018. The yearly decline mainly reflects sharply reduced cereal harvests in Southern Africa, due to mid-season rainfall deficits. Smaller production decreases are also expected in West African countries, where 2018 outputs are forecast to revert back to average levels after the bumper highs of 2017.
Mostly favourable rains are foreseen to result in a production upturn in East Africa, however, torrential rains earlier in the year, and more recently in August, caused localized crop losses, capping further production gains. In North Africa, an above-average output is forecast, reflecting improved rains at the start of this year that alleviated early seasonal water deficits. In Central Africa, persisting conflicts in several countries continue to impede agricultural production, despite mostly favourable weather conditions.
Cereal production(million tonnes)
REGIONAL REVIEWS
AFRICANORTH AFRICACoarse grains: HarvestingRice: MaturingWEST AFRICA
Coastal countries Cereals (main season): HarvestingCereals (secondary season): Planting
SahelCereals: Maturing
CENTRAL AFRICANorthern partsMaize (main season): HarvestingMillet: HarvestingRice: HarvestingSorghum: Harvesting
Democratic Republic of Congo Maize (main season): PlantingMillet: HarvestingSorghum: Harvesting
EAST AFRICAEritrea, EthiopiaGrains (main season): Maturing
South Sudan, SudanGrains (main season): Maturing
UgandaCereals (main season): HarvestingCereals (secondary season): Planting
Kenya, SomaliaCereals (main season): HarvestingCereals (secondary season): Land preparation
Burundi, RwandaCereals (secondary season): Planting
SOUTHERN AFRICACrops (main season): Land preparationWinter cereals (secondary season): Reaching maturity
Unfavourable 2018 production prospects*
Cameroon: Conflict
Central African Republic: Conflict
Democratic Republic of the Congo: Conflict, pests and floods
+
South Sudan: Conflict
* See Terminology (page 5) + New Entry
Note: Situation as of AugustSubregional borders
Source: GIEWS
0
10
20
30
40
50
60
70
20182017201620152014
NORTH
EAST
WEST
CENTRAL
SOUTHERN
f’cast

12
GIEWS CROP PROSPECTS AND FOOD SITUATION #3
SEPTEMBER 2018
NORTH AFRICA
Cereal production in 2018 above average and close to the previous year’s levelThe 2018 wheat and barley harvest was completed in mid-August. Maize and rice crops in Egypt will be harvested from early October.
With the exception of Egypt, which produces the bulk of the subregional cereal output mostly on irrigated lands, and Libya (where production is negligible), crop production in the rest of the subregion varies markedly from year to year because of significant rainfall variations.
Although early season rainfall deficits across the subregion delayed plantings in some parts until December 2017, favourable conditions in the spring generally eliminated pockets of winter dryness and improved yield prospects. The major production increases were estimated in Morocco and Algeria, where abundant and well-distributed rains, coupled with favourable temperatures in the spring,
boosted yields. In Morocco, at 10.5 million tonnes, the 2018 cereal production exceeded last year’s harvest by about 6 percent and the five-year average by almost 25 percent. In Algeria, the 2018 cereal production is expected to reach a record high, exceeding the average by over 50 percent. By contrast, the spring rains in central Tunisia were not sufficient to prompt a recovery in crop conditions following the early seasonal dryness and, as a result, production in these areas is estimated to have decreased compared to the previous year’s average level. However, moisture deficits in the main cereal-producing areas in the north were eliminated, averting a larger production decline at the national level; the 2018 national cereal output was estimated at 1.45 million tonnes, about 10 percent below average last year's level. In Egypt, the cereal harvest will continue until October 2018 and production is expected to be equal to last year's output and the five-year average. The cereal harvest in Libya is expected at a below-average level of 219 000 tonnes, reflecting limited availability of inputs.
The subregion’s aggregate wheat output is preliminarily forecast at about 20 million tonnes and barley production is estimated at about 5.4 million tonnes, both above last year’s outputs and the averages. At 7.4 million tonnes, the maize crop, produced primarily in Egypt, is virtually unchanged on a yearly basis. Total cereal
production is preliminary forecast at 38 million tonnes in 2018, close to the previous year and above average; however, the production figure is expected to rise pending confirmation of Algeria’s record output.
The subregion’s aggregate cereal import requirement (of which wheat accounts for about 60 percent) for the 2018/19 marketing year (July/June) is estimated at approximately 49 million tonnes, 1.8 million more than the previous five-year average and close to the previous year, reflecting steady population growth in the area.
Food inflation rates eased following the end of RamadanFollowing the end of Ramadan in June, food prices in July 2018 declined seasonally. The highest food inflation rate continues to be reported in Libya, supported by insecurity-induced supply chain disruptions and shortages of foreign currencies. Although easing from a record level of 50 percent in December 2017, the food inflation rate remained high at 18 percent in April 2018 (latest available estimate). Food inflation rates eased in Egypt in July, the cost of food increased by 9.6 percent on a yearly basis, down from its peak of over 40 percent a year ago. Decreases were also reported in Tunisia (8.3 percent in July, down from 8.6 percent in June), Algeria (4 percent in July, down from 7 percent in June) and Morocco (1.8 percent in July, down from 2.6 percent in June).
Table 6. North Africa cereal production (million tonnes)
Wheat Coarse grains Rice (paddy) Total cereals
20162017 estim.
2018 f'cast 2016
2017 estim.
2018 f'cast 2016
2017 estim.
2018 f'cast 2016
2017 estim.
2018 f'cast
Change: 2018/2017 (%)
North Africa 15.3 19.5 19.9 11.1 12.3 12.9 6.4 6.4 5.0 32.7 38.3 37.8 -1.4Egypt 9.0 8.8 8.8 8.9 8.1 8.3 6.3 6.4 4.9 24.2 23.2 22.0 -5.5Morocco 2.7 7.1 7.3 0.8 2.7 3.1 0.1 0.1 0.1 3.6 9.8 10.5 6.3Tunisia 0.9 1.1 1.1 0.4 0.5 0.4 0.0 0.0 0.0 1.3 1.6 1.4 -10.1
Note: Totals and percentage change computed from unrounded data.

13
14000
16000
18000
20000
22000
24000
26000
28000
AJJMAMFJDNOSAJJMAMFJDNOSA
Source: Afrique Verte.
2016 2017 2018
Millet prices in selected West African markets(CFA Franc BCEAO (XOF)/100kg)
BURKINA FASOOuagadougou
MALIBamako
NIGERNiamey
GIEWS CROP PROSPECTS AND FOOD SITUATION #3
SEPTEMBER 2018
WEST AFRICA
Favourable production prospects for 2018 cropsThe 2018/19 cropping season across the Sahel started on time with the onset of the rains in mid-June. Early planted cereal crops are close to full maturity, while the later sown crops are at the vegetative stage and conditions of both are mostly favourable, reflecting generally beneficial rains. Weather conditions have also favoured the development of natural pastures and helped replenish water reserves to satisfactory levels. To successfully complete the crop cycle, additional rains are needed until the end of September in the eastern Sahel, mid-October in the western Sahel, late October in the Sudanian Zone and the end of November in the bi-modal zone of the Gulf of Guinea. Pockets of torrential downpours in July and August resulted in flooding and localized crop damage, mainly affecting western areas of the subregion.
The pest and disease situation is generally normal, with localized outbreaks of Fall Armyworm being reported in most countries. Overall, early prospects for the 2018 cereal production are mostly favourable.
Cereal prices remained mostly stable, except in areas affected by insecurityCereal prices are generally stable compared to previous months, mostly reflecting adequate supplies and, in part, reduced seasonal demand, as households increase consumption of newly harvested legumes. In Burkina Faso and Niger, prices of cereals have also been stable and even declined in some markets, on account of lower demand and subsidized sales by the Government. In Chad, although cereal prices were below their year-earlier levels due to low demand, most markets remain disrupted in the Lake Chad area due to recent attacks by Boko Haram. In Senegal, prices remained stable with a few minor increases, mainly for maize, on account of strong demand for poultry feed. In Nigeria, prices of cereals and tubers remained at high levels particularly in northeast areas where market activities have been disrupted by insurgency.
Persisting conflict continues to degrade food security conditionsThe conflict in northeast Nigeria continues to affect millions of people across the region and prevent many households from engaging in their typical livelihoods, leading to continued displacement and disruption of economic activities. According to the United Nations Office for the Coordination of Humanitarian Affairs (UN-OCHA), as of June 2018, about 2.2 million people have been internally displaced in the Lake
Chad Basin Region, including 1.76 million people in northern Nigeria. The majority of the displaced households are heavily dependent on humanitarian assistance as market disruptions, restricted agricultural activities and above-average staple prices have severely limited their coping strategies. According to the March 2018 "Cadre Harmonisé" analysis, about 2.7 million people were affected by severe food insecurity (Phase: 3 "Crisis" to Phase: 5 "Famine") in the area, with 2.3 million people estimated to be severely food insecure in Borno, Yobe and Adamawa states in Nigeria, around 133 000 people in Chad, 91 000 people in Niger and 170 000 people in Far North Region in
Table 7. West Africa cereal production (million tonnes)
Coarse grains Rice (paddy) Total cereals 1
20162017 estim.
2018 f'cast 2016
2017 estim.
2018 f'cast 2016
2017 estim.
2018 f'cast
Change: 2018/2017 (%)
West Africa 46.3 47.8 45.2 17.0 18.0 18.3 63.4 65.9 63.7 -3.4Burkina Faso 4.4 4.2 4.2 0.4 0.3 0.4 4.8 4.5 4.6 2.0Chad 2.6 2.5 2.8 0.3 0.3 0.3 2.9 2.7 3.0 11.0Ghana 2.1 2.4 2.1 0.7 0.7 0.8 2.8 3.1 2.9 -7.2Mali 6.0 6.5 6.3 2.8 2.9 2.9 8.8 9.5 9.2 -3.0Niger 5.7 5.7 5.1 0.1 0.1 0.1 5.9 5.9 5.2 -11.0Nigeria 18.9 19.0 18.0 6.5 7.0 7.2 25.5 26.1 25.3 -3.0
Note: Totals and percentage change computed from unrounded data.1 Total cereals includes wheat, coarse grains and rice (paddy).

14
GIEWS CROP PROSPECTS AND FOOD SITUATION #3
SEPTEMBER 2018
Table 8. Central Africa cereal production (million tonnes)
Coarse grains Rice (paddy) Total cereals 1
20162017 estim.
2018 f'cast 2016
2017 estim.
2018 f'cast 2016
2017 estim.
2018 f'cast
Change: 2018/2017 (%)
Central Africa 4.6 4.1 4.0 0.7 0.7 0.7 5.3 4.8 4.8 -0.5Cameroon 3.1 2.7 2.6 0.4 0.4 0.4 3.5 3.0 3.0 -0.7Central African Republic 0.1 0.1 0.1 0.0 0.0 0.0 0.1 0.1 0.1 -6.3Democratic Republic of the Congo 1.2 1.2 1.2 0.3 0.3 0.3 1.6 1.5 1.6 0.5
Note: Totals and percentage change computed from unrounded data.1 Total cereals includes wheat, coarse grains and rice (paddy).
Cameroon. This number was projected to increase up to 3.5 million people during the peak of the lean season (June-August 2018) as households' food stocks are being exhausted earlier than usual due to below-average crop production in 2017. In addition, the number of refugees and returnees increased in Chad due to the ongoing civil insecurity in the Sudan, the Central African Republic and Libya.
Although localized, torrential rains in the previous months (July-August) triggered flooding that caused damage to cropped areas and resulted in the loss of some animals. In Niger, over 17 000 people are estimated to have been affected by the floods and over 24 000 animals killed, notably in Maradi, Diffa and Agadez regions. Similarly, floods have affected Nigeria, Benin, Togo, Burkina Faso, Senegal, Guinea, Guinea-Bissau, Liberia, Sierra Leone and, particularly, in Côte d’Ivoire.
In the areas not affected by conflict and/or heavy rains, the start of the early harvests of fresh maize, yams, peanuts and beans is expected to lead improvements in food security conditions. However, food insecurity persists among pastoral households due to the lingering impact of the pastoral crisis in 2017.
In aggregate, based on the results of the "Cadre Harmonisé" analysis, the number of people in Phase 3: “Crisis” and above was estimated at about 7.1 million people, mostly pastoralists and agro-pastoralists, due to difficult pastoral conditions in 2017 and persistent civil insecurity in the Lake Chad Basin, the Liptako-Gourma Loop (Burkina Faso, Mali and Niger) and in central Mali.
CENTRAL AFRICA
Agricultural production affected by floods, pests and persisting conflictIn Cameroon and the Central African Republic, harvesting of the 2018 main maize crop in central and southern bi-modal rainfall areas is underway, while in the northern uni-modal rainfall areas, harvesting of millet and sorghum crops has recently started. In Cameroon, crop growing conditions in most central and southern areas benefitted from adequate rainfall since the onset of the cropping season in March. However, the ongoing conflict in the Northwest and Southwest regions has caused severe shortages of inputs, while also resulting in losses of households’ productive assets. Similarly, in the Far North Region, agricultural operations continued to be disrupted by civil unrest that had spread from neighbouring Nigeria since late 2014. As a result, there are concerns over the performance of the 2018 agricultural season.
In the Central African Republic, despite generally favourable weather conditions, conflict and population movements continue to have a negative impact on crop production. The persisting civil insecurity has resulted in a significant reduction in the 2018 area planted as a substantial number of farms have been abandoned. Furthermore,
the widespread conflict has also resulted in a severe depletion of household's productive assets, particularly seeds and farming tools, further reducing productive capacities.
In the Democratic Republic of the Congo, the 2018 main season maize crop was sown in July/August in northern Equateur and Oriental provinces and the harvest is expected to start in October. According to remote sensing data, rainfall in the eastern and southern parts of the country were above average. Heavy rainfall, particularly in North Kivu, South Kivu and Tanganyika regions, resulted in flooding and consequently damage to crops. Weather conditions were generally favourable in the rest of the country. Infestations of Fall Armyworm throughout the country have reportedly caused significant losses, particularly in maize-growing regions. Moreover, ongoing conflicts in Kasai, North Kivu, South Kivu, Ituri and Tanganyika regions continued to disrupt agricultural activities and limited the available crop-growing areas. Despite generally favourable rainfall levels, the cereal output in 2018 is expected to be average to slightly below average due to the impact of floods, pests and conflict. In the Republic of the Congo and Gabon, the second season 2018 maize crop was harvested in June-July. Both countries had favourable weather conditions during the cropping season and preliminary estimates point to a 2018 cereal production similar to the average level of 2017.
Inflation rates remain low in 2018 in most countries except in the Democratic Republic of the CongoIn the Central African Republic, the average annual inflation rate declined in recent years and it is expected to continue
15
GIEWS CROP PROSPECTS AND FOOD SITUATION #3
SEPTEMBER 2018
its downward trend in 2018. The inflation rate is forecast to fall to 3.5 percent in 2018 compared to 3.8 percent in 2017. The general decline in prices is mostly demand driven, as disrupted livelihoods and reduced employment opportunities have severely curtailed households’ purchasing power. In the Democratic Republic of the Congo, the annual inflation rate in 2018 is forecast to decline to about 26 percent, well below the 42 percent registered in 2017, but still high due in part to extensive Government spending. Moreover, the local currency has depreciated by about 45 percent since the end of 2016, putting pressure on domestic food supplies due to reduced imports, while also increasing import prices. In Cameroon, by contrast, the inflation rate in 2018 is forecast at 1.1 percent, in part due to the implementation of a tighter monetary policy, as well as the adoption of the CFA Franc currency, which has helped to anchor prices. In the Far North, an increase in households’ dependence on markets, following the depletion of household stocks during the lean season, is putting upward pressure on sorghum prices. Similarly, in the Republic of the Congo and Gabon, the annual inflation rates are forecast at low levels, below 3 percent.
Dire food security situationConflict in the Democratic Republic of Congo, the Central African Republic and Cameroon continues to cause widespread disruption of agricultural and marketing activities, as well as result in massive population displacements. Consequently, both food availability and access have been affected significantly. Immediate food assistance is required to help avert a nutritional and food security crisis for the affected population, as well
as host communities. In the Democratic Republic of the Congo, the conflict in Kasai and Tanganyika regions remain tense resulting in massive displacement of people fleeing the violence. The total Internally Displaced People (IDP) caseload in the country is estimated at 4.5 million people. Most IDPs have lost their productive assets and face extremely limited access to livelihoods with a significant portion of them putting additional strain on host communities. The country also hosts more than 541 000 refugees from Burundi, the Central African Republic, Rwanda and South Sudan. Moreover, there has been an outbreak of the Ebola Virus Disease (EVD) and as of 26 August 2018 a total of 111 cases have been confirmed. These factors have contributed to a dire food security situation particularly for the most vulnerable groups. Similarly, in the Central African Republic, insecurity remains the leading cause affecting households’ access to food and their livelihoods, making it difficult to conduct agricultural and livestock activities. The latest Integrated Food Security Phase Classification (IPC), valid for the period from March to August 2018, estimated that about 2 million people (43 percent of the total population) were in need of urgent assistance (IPC Phase 3: “Crisis” and IPC Phase 4: “Emergency”) of which more than 686 000 people face IPC Phase 4: “Emergency”. According to UNHCR, as of end-June 2018, the IDP caseload was estimated at about 608 000 people. The conflicts are also restricting humanitarian access and disrupting agricultural activities. In Cameroon, an ongoing crisis erupted in October 2016 in the Northwest and Southwest regions, due to perceived marginalization and resistance to the integration of the English-speaking
minority to the French-speaking majority. Moreover, civil unrest continues to aggravate the food insecurity situation particularly in Adamaoua, East, North and Far North regions. The widespread conflict within Cameroon and in the neighbouring countries has resulted in the displacement of about 238 000 Cameroonians and an estimated 261 000 refugees from the Central African Republic.
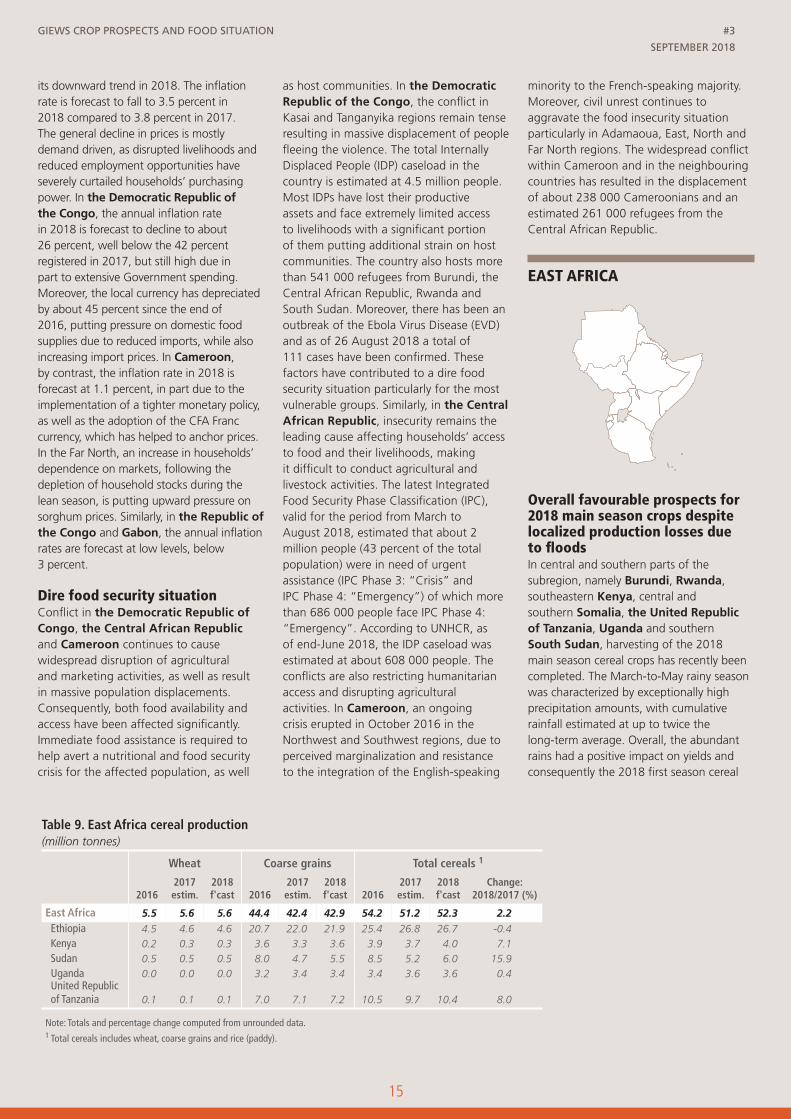
EAST AFRICA
Overall favourable prospects for 2018 main season crops despite localized production losses due to floods In central and southern parts of the subregion, namely Burundi, Rwanda, southeastern Kenya, central and southern Somalia, the United Republic of Tanzania, Uganda and southern South Sudan, harvesting of the 2018 main season cereal crops has recently been completed. The March-to-May rainy season was characterized by exceptionally high precipitation amounts, with cumulative rainfall estimated at up to twice the long-term average. Overall, the abundant rains had a positive impact on yields and consequently the 2018 first season cereal
Table 9. East Africa cereal production (million tonnes)
Wheat Coarse grains Total cereals 1
20162017 estim.
2018 f'cast 2016
2017 estim.
2018 f'cast 2016
2017 estim.
2018 f'cast
Change: 2018/2017 (%)
East Africa 5.5 5.6 5.6 44.4 42.4 42.9 54.2 51.2 52.3 2.2Ethiopia 4.5 4.6 4.6 20.7 22.0 21.9 25.4 26.8 26.7 -0.4Kenya 0.2 0.3 0.3 3.6 3.3 3.6 3.9 3.7 4.0 7.1Sudan 0.5 0.5 0.5 8.0 4.7 5.5 8.5 5.2 6.0 15.9Uganda 0.0 0.0 0.0 3.2 3.4 3.4 3.4 3.6 3.6 0.4United Republic of Tanzania 0.1 0.1 0.1 7.0 7.1 7.2 10.5 9.7 10.4 8.0
Note: Totals and percentage change computed from unrounded data.1 Total cereals includes wheat, coarse grains and rice (paddy).

16
GIEWS CROP PROSPECTS AND FOOD SITUATION #3
SEPTEMBER 2018
outputs are estimated at above-average levels in most countries. However, heavy rains triggered widespread floods, mainly in central and southern Somalia, southeastern Ethiopia, northeastern Uganda, Kenya and lowlands of Rwanda and Burundi. These floods resulted in the loss of lives, population displacements, livestock deaths and caused localized production shortfalls, especially of pulses which are particularly vulnerable to excessive moisture levels. In Somalia, the April-June “gu” season rains were the heaviest in nearly two decades and resulted in significant flood-induced crop damages in most riverine irrigated areas along the Shabelle River in Hiran, Middle and Lower Shabelle and Middle Juba regions. At the same time, the high moisture levels boosted yields in rainfed areas and the off-season harvest, currently underway in riverine areas, is expected at above-average levels. The increase in off-season production also reflects an expansion in plantings, as an enlarged area for recession agriculture, due to the widespread floods, induced farmers to expand plantings. As a result, the 2018 aggregated “gu” cereal production in Somalia is estimated at 147 000 tonnes, almost 60 percent above the average of the previous five years. In southern bi-modal rainfall areas of South Sudan, harvesting of the first season crops was recently completed. Seasonal rains were adequate over most cropping areas, notably in the “green belt” in former Central and Western Equatoria states. By contrast, in the Kapoeta Region in former East Equatoria State, maize and groundnut crops were affected by prolonged dry spells in July. Crop production is expected to partially recover from the record low levels of 2017, as localized security improvements allowed some refugees to return and engage in farming activities. However, insecurity still prevails in most areas and continues to constrain access to fields. Therefore, despite the likely year-on-year output increase, crop production is still expected at below-average levels.
In northern parts of the subregion, including central and western Kenya, the northeastern Karamoja Region in Uganda, Ethiopia, Eritrea, the Sudan, and central and northern South Sudan, the main
season cereal crops are at vegetative or maturing stages. In key growing areas of the Rift Valley and Western provinces of Kenya, “long-rain” crops, for harvest from October, benefitted from exceptionally abundant seasonal rains and, despite some localized crop losses due to floods, production is expected to be 10-15 percent above average. In Uganda, the cereal harvest in agro-pastoral areas of the Karamoja Region started about one month later than normal, as excessive rains between April and June disrupted planting operations. The heavy early season rainfall also resulted in flooding and waterlogging in lowland areas, where approximately half of the region’s crops are grown. As a result, cereal production in 2018 is estimated at below-average levels in the Karamoja Region. In western and central main cropping areas of Ethiopia, the June-September “kiremt” rainy season was characterized by an early onset in mid-May and by average to above-average precipitations until mid-July, benefitting crop development. Despite some rainfall deficits between mid-July and mid-August, prospects for the major “meher” harvest, expected to commence in October, are generally favourable. By contrast, in the southwestern SNNP Region and in central parts of Oromia Region adequate rains in June were followed by severe rainfall deficits in July and August, which affected crop conditions and are expected to result in reduced yields. In Eritrea, the June-September “kiremt” rains had a timely onset, with abundant and well-distributed rains over most key-cropping areas in central and western Anseba, Debub, Maekel and Gash Barka regions, which resulted in above-average vegetation conditions. In the Sudan, the rainy season, after an early onset, has been characterized by above-average precipitations over most cropping areas. However, reduced yields are expected on account of fuel shortages that disrupted agricultural operations and by the low availability and very high prices of agricultural inputs, due to high inflation rates and dwindling foreign currency reserves constraining import availability and access. In addition, flooding over West Kordofan, Kassala, Gezira, Sennar and Northern States may result in localized crop
losses. In northern and central uni-modal rainfall areas of South Sudan, seasonal rains were generally adequate, except in former Northern Bahr el Gazal and Jonglei states, where recurrent dry spells in late June and in July affected the germination of sorghum crops and forced farmers to replant up to three times. Despite some localized security improvements, agricultural activities continue to be severely affected by the conflict, which is constraining access to fields and continues to cause large scale and recurrent displacement of people, as well as damage to households’ productive assets. In addition, Fall Armyworm outbreaks are likely to further constrain yields.
In pastoral and agro-pastoral areas, seasonally dry conditions prevail. However, vegetation conditions are generally above average as the abundant rains received during the March-May rainy season caused a substantial regeneration of rangeland resources and resulted in a slower-than-normal depletion during the ongoing dry season. Notably, in northern and eastern Kenya, southeastern Ethiopia and central and northern Somalia, which were affected by severe drought between mid-2016 and late 2017, heavy rains during the last rainy season resulted in marked improvements in vegetation and livestock body conditions that, despite the current seasonal decline, are still well above average. By contrast, current vegetation conditions are poor in several northern pastoral areas of Afar and Northern Somali regions in Ethiopia, as the “karan/karma” July-September rains were below-average.
According to the latest Greater Horn of Africa Climate Outlook Forum (GHACOF) weather forecast, the October-December rains are likely to be average to above average over most cropping areas of the subregion, benefitting the 2018 second season crops and rangelands. Rainfall is forecast at above-average levels over Somalia, Uganda, Burundi and Rwanda, where the second season harvests account for 35-50 percent of the annual outputs. By contrast, seasonal rainfall is likely to be below average over southern United Republic of Tanzania, potentially affecting

17
100
200
300
400
500
600
700
AJJMAMFJDNOSAJJMAMFJDNOSA2016 2017 2018
Maize prices in selected East African markets
Source: Regional Agricultural Trade Intelligence Network; Ethiopian Grain Trade Enterprise.
(USD/tonne)
U.R. TANZANIADar-es-Salaam
ETHIOPIAAddis Ababa UGANDA
Kampala
KENYANairobi
GIEWS CROP PROSPECTS AND FOOD SITUATION #3
SEPTEMBER 2018
planting and establishment of “msimu” crops to be harvested from May 2019.
Food prices declining in South Sudan In South Sudan, prices of maize, sorghum, wheat, cassava and groundnuts, after having continued their sustained upward trend in the first semester of 2018, decreased by 10 to 25 percent between June and August in the capital, Juba. The price declines were mainly driven by a substantial appreciation of the local currency on the parallel market from SSP 300 per US dollar in May to SSP 215 per US dollar in mid-August. The strengthening of the local currency is likely due to renewed speculator and investor confidence over the improved political stability and the resumption of oil production following the signing of a peace agreement in late June. The first season harvest in southern bi-modal rainfall areas and in neighbouring Uganda, which resulted in increased availabilities and reduced prices of imports, exerted additional downward pressure on food prices. Prices of maize and sorghum in August were 10 and 6 percent lower than one year earlier, respectively, but still about twice their levels in the corresponding period two years earlier, driven by
widespread insecurity, a tight supply situation, hyper-inflation and a still significantly depreciated local currency.
In Uganda, Kenya, Somalia, the United Republic of Tanzania, Burundi and Rwanda prices of maize declined by 15 to 40 percent between May and August, and were up to 50 percent below their year-earlier levels on account of the good performance of the first season harvests. In Ethiopia, prices of maize increased seasonally by 10 to 25 percent between February and July, when they were around or below their year-earlier levels. In the Sudan, prices of sorghum, millet and wheat reached new record highs in August, when they were three times higher than their year-earlier levels. These exceptionally elevated levels follow a sustained upward trend that began in late 2017, driven by the removal of wheat subsidies in the 2018 budget, which also increased demand for millet and sorghum as substitute foods and by a strong
depreciation of the local currency that triggered a significant rise in the general inflation rate. High fuel prices that increased transport costs and localized but substantial crop production shortfalls in 2017 provided further support.
Food security situation improved in Somalia The lean season is peaking in Ethiopia, Eritrea, the Sudan, western Kenya, central and northern uni-modal rainfall areas of South Sudan and in the Karamoja Region in Uganda. By contrast, food security conditions are generally improving in Somalia, southeastern Kenya, Uganda, Rwanda, Burundi and the United Republic of Tanzania, where recently-harvested crops are available for consumption. The aggregate number of people in need of humanitarian assistance is estimated at about 26 million,
with the largest caseloads in Ethiopia (7.9 million), the Sudan (6.2 million) and South Sudan (6 million). In Somalia, the food security situation has steadily improved since early 2018 and according to the latest multi-agency assessment, about 1.56 million people (approximately 13 percent of the total population) are estimated to be severely food insecure (IPC Phases 3 and 4). This estimate is about half the caseload of the previous year’s level, mainly due to the improved “gu” production, increased labour and income opportunities, and the sustained provision of large-scale humanitarian assistance. However, humanitarian needs still remain substantial, with the current caseload about 40 percent higher than the estimate of mid-2016, mostly reflecting the lingering effects of prolonged and severe drought conditions between mid-2016 and late 2017. The current food insecurity is also driven by livelihood losses caused by floods in April-May 2018 and by the large-scale displacements resulting from conflicts and natural hazards, with IDPs representing nearly 60 percent of the food insecure caseload. The areas of major concern are the agro-pastoral areas in southern Lower Juba Region and in northern Awdal, Sanag and Sool and Bari regions. In South Sudan,
0
50
100
150
200
250
AJJMAMFJDNOSAJJMAMFJDNOSA2016 2017 2018
Retail prices of selected cereals in Juba, South Sudan
Source: Crop & Livestock Market Information System (CLIMIS).
(South Sudanese pound (SSP) /kg)
Maize (white)
Sorghum (feterita)
Wheat Flour

18
GIEWS CROP PROSPECTS AND FOOD SITUATION #3
SEPTEMBER 2018
Table 10. Southern Africa cereal production (million tonnes)
Wheat Coarse grains Rice (paddy) Total cereals
20162017 estim.
2018 f'cast 2016
2017 estim.
2018 f'cast 2016
2017 estim.
2018 f'cast 2016
2017 estim.
2018 f'cast
Change: 2018/2017 (%)
Southern Africa 2.2 1.8 2.0 19.6 34.1 27.4 4.3 3.7 4.4 26.1 39.7 33.8 -14.8 - excl. South Africa 0.3 0.3 0.2 10.9 16.0 13.1 4.3 3.7 4.4 15.5 20.1 17.7 -11.8Madagascar 0.0 0.0 0.0 0.3 0.3 0.3 3.8 3.1 3.8 4.1 3.4 4.1 19.7Malawi 0.0 0.0 0.0 2.4 3.6 2.9 0.1 0.1 0.1 2.5 3.7 3.0 -18.5Mozambique 0.0 0.0 0.0 2.1 2.6 2.7 0.3 0.4 0.4 2.4 3.0 3.2 4.0South Africa 1.9 1.5 1.8 8.7 18.1 14.3 0.0 0.0 0.0 10.6 19.6 16.1 -17.9Zambia 0.3 0.2 0.1 2.9 3.7 2.4 0.0 0.0 0.0 3.2 3.9 2.6 -33.8Zimbabwe 0.0 0.1 0.1 0.6 2.5 1.9 0.0 0.0 0.0 0.6 2.5 1.9 -23.6
Note: Totals and percentage change computed from unrounded data.
the sharply reduced cereal production in 2017 resulted in an earlier-than-normal depletion of households' food stocks. In July, the peak of the lean season, the severely food insecure caseload was estimated at 6 million individuals (nearly 60 percent of the total population), about 20 percent higher on a yearly basis, due to persistent conflict, large-scale displacements, poor economic conditions and severe constraints to humanitarian access and assistance. The food security situation in Leer and Mayendit counties in former Unity State is of particular concern, as the local population has been facing recurrent violence and displacements, and has been cut off from humanitarian assistance between mid-April and mid-July due to severe insecurity.
SOUTHERN AFRICA
Dry conditions cut cereal production in 2018The main 2018 summer season cereal crops were harvested by August, while winter crops, mainly wheat, are expected to be harvested in October. The forecast for the aggregate cereal output in 2018 stands
at 33.8 million tonnes, 5.9 million tonnes lower than the 2017 record level but still 1.8 million tonnes higher than the previous five-year average. A reduced maize output, which on average accounts for about 76 percent of the total cereal production, is the main driver of this year’s decline, while small production declines are also estimated for millet and sorghum. By country, the decrease in South Africa’s maize output accounts for the bulk of the subregional contraction, where the harvest is estimated at 13.8 million tonnes, 3.8 million tonnes lower than the record high of 2017. Large annual production decreases of 1.3 million tonnes in Zambia and 0.7 million tonnes in Malawi also contributed to the declines and pushed harvests to below-average levels in both countries. Maize outputs in the remaining countries were close to or slightly above average, except in Zimbabwe which is estimated to have harvested a maize crop of 50 percent above the average, despite a 0.5 million tonnes year-on-year decrease. For rice, aggregate production in 2018 is estimated to have increased compared to the previous year. The rise is almost entirely on account of a recovery in production in Madagascar, where beneficial rains boosted production in the main producing central and northern regions.
This year’s production decline mainly reflects below-average rains and above-average temperatures in January and early February, which generally correspond to the flowering and yield formation stage of maize. At these stages, maize is most sensitive to water deficits. Outbreaks of Fall Armyworm
had localized impacts, however, the precise extent of the damage has not been quantified.
Land preparation and planting for the 2018/19 cropping season is expected to begin in October. Weather forecasts for the last quarter of the year point to an increased likelihood of below-average rains across large parts of the subregion, which could negatively impact on the extent of the planted area and early crop establishment. These predictions take into consideration the likely occurrence of an El Niño event, which historically tends to suppress rainfall in the subregion.
Maize supplies remain satisfactory owing to ample stocksOn account of the record and bumper 2017 harvests, almost all countries registered above-average opening maize stocks for the 2018/19 marketing year (generally April/March), which have helped to mitigate the impact of reduced outputs in 2018. Consequently, aggregate supplies are estimated at an above-average level. These supplies are expected to be sufficient to cover subregional import needs, which are estimated at approximately 1.1 million tonnes, slightly above the previous year but below the average.
Similar to previous years, maize exports from South Africa are expected to satisfy most of the subregion’s import needs. South African exports are forecast at around 2.4 million tonnes in 2018/19, an above-average level, with a large proportion of the volume forecast to be shipped to Asia.

19
GIEWS CROP PROSPECTS AND FOOD SITUATION #3
SEPTEMBER 2018
Adequate supplies temper price increases Prices of maize were stable or increased seasonally in recent months and, overall, were close to their year-earlier levels as of July/August. In South Africa, prices of maize have strengthened moderately since June, as a weakening Rand and higher international quotations pressured domestic price levels. These gains were, however, limited by a favourable supply outlook, due to large stocks and the above-average 2018 harvest. Small price increases were observed in Malawi for maize, due mostly to the impact of a below-average harvest. However in Zambia and Zimbabwe, prices of maize grain continued to remain comparatively stable, in part reflecting the significant carryover stocks that buttressed supplies, lessening the impact of lower 2018 outputs. Prices of maize grain in Mozambique declined slightly since May, as new supplies from the above-average 2018 harvest augmented market availabilities. In the import-dependent countries of Namibia and Eswatini, prices remained flat or fell slightly, as generally good maize outputs in 2018 have kept supplies at adequate levels. In Madagascar, prices of rice fell sharply from the record highs earlier in the year,
prompted by improved market supplies from the 2018 harvest.
Reduced harvests aggravate food securityThe aggregate number of people affected by food insecurity, based on evaluations by the Vulnerability Assessment Committees (VAC), is estimated at 8.3 million people in 20183, nearly 80 percent above the previous year and the third highest estimate in the last ten years. The largest year-on-year increases in 2018 were estimated in Malawi and Zambia, which both registered well below-average maize harvests, while in absolute terms Zimbabwe has the highest food insecure population, estimated at approximately 2.4 million. However, it should be noted that this year’s total food insecure estimate is almost half compared to 2016, when 16 million people were assessed to be in need of food assistance, which was caused by El Niño-induced dry weather conditions. The current conditions reflect the poor weather conditions and reduced
harvests, while structural challenges continue to underpin the high food insecure numbers.
3 Based on the 2017 Vulnerability Assessment Committees’ evaluation. This figure excludes Angola (official estimates are not available) and South Africa (figures are not directly comparable with data from other countries) and Mauritius.
0.0
0.1
0.2
0.3
0.4
AJJMAMFJDNOSAJJMAMFJDNOSA2017 20182016
White maize prices in selected Southern African markets
Sources: Central Statistical Office, Zambia; Sistema De Informação De Mercados Agrícolas De Moçambique, Mozambique; SAFEX Agricultural Products Division, South Africa.
(USD/kg)
* Wholesale prices, all others retail prices
ZAMBIANational Average
MOZAMBIQUENampula
SOUTH AFRICA*Randfontein

20
GIEWS CROP PROSPECTS AND FOOD SITUATION #3
SEPTEMBER 2018
Asia Production OverviewTotal cereal production is forecast at 1 150 million tonnes in 2018, marginally below the above-average output in 2017. Production declines are mainly associated with CIS Asia countries, where unfavourable rains curbed harvests, and the Near East on account of the persisting conflicts that acutely impeded agricultural activities as well as moisture deficits that constrained yields.
By contrast, production in the Far East is forecast to rise on a yearly basis, supported by government initiatives and remunerative producer prices for the paddy crop, which drove up the planted area and consequently production.
Cereal production(million tonnes)
NEAR EAST ASIAGrains (winter): Land preparation
FAR EAST ASIAChina (Mainland)Early rice: HarvestingMaize (north): HarvestingSoybeans: HarvestingWheat (winter): Planting
Southeastern Far East AsiaMaize: PlantingRice (main): Reproductive to maturing to harvesting
CIS IN ASIACrops (winter): Land preparation to plantingMaize: HarvestingWheat: Mostly harvested
REGIONAL REVIEWS
ASIA
FAR EAST ASIASouthern Far East AsiaCoarse grains: HarvestingRice (main): Maturing to harvesting
IndiaMaize and millet (kharif): Reproductive to maturingRice (kharif): Harvesting begins Rice and wheat (rabi): Land preparation to planting
Unfavourable 2018 production prospects*
Afghanistan: Dry weather conditions
Yemen: Conflict
* See Terminology (page 5)
Source: GIEWS
Note: Situation as of AugustSubregional borders
700
800
900
1000
1100
1200
1300
201820172016201520140
20
40
60
80
100
120
f’cast
CIS in ASIA (secondary axis)
NEAR EAST (secondary axis)
FAR EAST (primary axis)

21
GIEWS CROP PROSPECTS AND FOOD SITUATION #3
SEPTEMBER 2018
Table 11. Far East cereal production (million tonnes)
Wheat Coarse grains Rice (paddy) Total cereals
20162017 estim.
2018 f'cast 2016
2017 estim.
2018 f'cast 2016
2017 estim.
2018 f'cast 2016
2017 estim.
2018 f'cast
Change: 2018/2017 (%)
Far East 251.2 259.1 252.9 328.2 336.1 337.5 676.6 683.0 692.6 1 255.9 1 278.2 1 283.0 0.4Bangladesh 1.3 1.3 1.3 2.5 3.0 3.2 52.1 51.4 53.6 55.9 55.7 58.1 4.4Cambodia 0.0 0.0 0.0 0.7 1.2 1.2 10.0 10.5 10.7 10.6 11.7 11.9 1.3China (Mainland) 128.8 129.8 122.5 229.0 225.9 226.3 207.1 208.6 206.3 564.9 564.2 555.1 -1.6India 92.3 98.5 99.7 41.9 46.6 46.3 164.5 167.3 170.3 298.7 312.4 316.3 1.2Japan 0.8 0.9 0.9 0.2 0.2 0.2 10.9 10.8 10.8 11.9 11.9 11.9 -0.4Myanmar 0.1 0.1 0.1 2.3 2.5 2.7 28.6 29.5 30.4 31.1 32.1 33.2 3.5Nepal 1.7 1.8 1.9 2.7 2.9 2.9 5.2 5.2 5.3 9.6 9.9 10.2 2.9Pakistan 25.5 26.4 26.0 6.7 6.6 6.8 10.3 11.2 11.4 42.4 44.1 44.2 0.1Philippines 0.0 0.0 0.0 7.2 7.9 8.2 18.5 19.4 19.7 25.8 27.3 27.9 2.0Republic of Korea 0.0 0.0 0.0 0.2 0.2 0.2 5.6 5.3 5.2 5.9 5.5 5.4 -1.6Thailand 0.0 0.0 0.0 4.7 5.0 5.1 32.4 33.7 34.5 37.2 38.7 39.5 2.2Viet Nam 0.0 0.0 0.0 5.3 5.1 4.9 43.2 42.8 44.6 48.4 48.0 49.5 3.3
Note: Totals and percentage change computed from unrounded data.
FAR EAST
Aggregate cereal production in 2018 forecast close to previous year’s record highIn most Northern Hemisphere countries, harvesting of the 2018 main rice and maize crops recently started, while the 2018 secondary season crops are being harvested in Southern Hemisphere countries. The 2018 wheat harvest was finalized in June 2018.
Overall, the subregion’s aggregate cereal output in 2018 is forecast at 1 283 million tonnes, virtually unchanged from the previous year’s record level. Most countries are expected to harvest above-average cereal crops, reflecting generally abundant
and well-distributed rains across the main producing areas that also boosted irrigation water supplies and adequate availability of fertilizers. However, the above-average rains also triggered localized floods in parts of Bangladesh, China (Mainland), Cambodia, Thailand, India and Myanmar. Similarly, localized floods were reported in central and southern parts of the Lao People’s Democratic Republic, instigated by heavy rains in July. The torrential downpours also caused the collapse of a
major dam in the southeastern province of Attapeu, flooding surrounding villages and forcing many farmers to replant paddy fields. In the Democratic People’s Republic of Korea, high temperatures, coupled with below-average rains between mid-July and mid-August, a critical period for crops, affected 8 percent of the average area cultivated to the main season crops, including paddy, maize and potatoes.
Production of paddy rice, the major staple in the subregion, is forecast at 692.6 million tonnes in 2018, marginally above the previous year's record high. The bumper paddy output mostly
reflects area expansions, prompted by more remunerative producer prices and continued Government support measures. However, for Sri Lanka a below-average paddy output is forecast for the second consecutive year, due to recurrent periods of below-average rains and low water levels in major reservoirs, which prevented plantings from fully recovering from last year's drought reduced level. A below-average output is also projected in the Republic of Korea, reflecting the Government’s efforts to curb plantings and avoid over-supply problems.
FAO’s latest forecast for the 2018 maize output in the subregion stands at about 307 million tonnes, close to 2017’s record high. Most countries are expected to gather bumper maize crops, mainly on account of area expansions, reflecting strong demand from the feed industry.
Based on the latest official data, the 2018 subregion’s aggregate wheat production is estimated at 253 million tonnes, slightly below the previous year’s record high. The yearly decline is mainly associated with China (Mainland), where a combination of drought conditions during the growing period and heavy rains at harvest time in the main producing areas reduced yields. As a result, wheat production declined by 6 percent (about 7 million tonnes) in the 2018 compared with 2017’s near-record level, putting this year's harvest at 4 percent below the five-year average.

22
GIEWS CROP PROSPECTS AND FOOD SITUATION #3
SEPTEMBER 2018
Table 12. Far East cereal production and anticipated trade in 2018/19 1 (thousand tonnes)
Avg 5-yrs (2013/14 to
2017/18) 2017/18 2018/19
2018/19 over 2017/18
(%)
2018/19 over 5-yr avg
(%)
Coarse grainsExports 3 761 2 866 3 020 5.4 -19.7Imports 64 783 66 800 65 183 -2.4 0.6Production 328 460 336 081 337 491 0.4 2.7
Rice (millled) Exports 37 627 39 896 39 717 -0.4 5.6Imports 14 971 15 783 13 362 -15.3 -10.7Production 446 127 453 041 459 262 1.4 2.9
WheatExports 4 081 2 319 2 645 14.0 -35.2Imports 47 115 53 366 52 319 -2.0 11.0Production 250 765 259 140 252 873 -2.4 0.8
1 Marketing year July/June for most countries. Rice trade figures are for the second year shown.
Cereal imports in 2018/19 to remain high, while exports forecast close to previous year’s low levelAggregate cereal imports in the 2018/19 marketing year are forecast at about 133 million tonnes, slightly below the previous year’s high level, but still above the five-year average. Wheat imports in 2018/19 are forecast to remain at a near record level of 52.3 million tonnes reflecting strong demand in most countries. The exception is India, where wheat imports are projected to decrease considerably from the previous year’s high level, reflecting the record output and consequently improved domestic availabilities.
Aggregate imports of coarse grains, mostly maize, are forecast to remain at a high level of 65.2 million tonnes in 2018/19. Strong demand for feed supplies is a primary reason for the sustained high import volumes. In contrast to the general subregional trend, China (Mainland) is projected to reduce cereal imports for feed, including barley and sorghum, for the third consecutive year in 2018/19, reflecting the Government’s directive to diminish the large national maize inventories through increased sales from State reserves.
Imports of rice in 2019 are forecast at 13.4 million tonnes, 15 percent below the previous year’s above-average level. Exports of cereals consist mostly of rice. Aggregate rice exports in 2019 are forecast
to remain close to the previous year’s high level, reflecting bumper outputs in the main exporting countries.
Domestic prices of rice decreased in the main exportersPrices of rice showed mixed trends between June and August and were generally higher than their year-earlier levels in most countries of the subregion. Among the main exporting countries, prices decreased since June in Viet Nam, reflecting adequate market supplies from the 2018 winter/spring harvest and a slowdown in export demand. Similarly, in Thailand, bumper supplies from the 2017/18 secondary crop, weighed on markets in June and July, but domestic prices of rice stabilized in August, instigated by anticipated Government-to-Government sales to China (Mainland) and strengthening export demand. In Myanmar, prices increased during the last three months reaching record highs in August in some markets, mostly driven by strong export demand. In India, prices of rice remained generally stable between June and August as downward supply pressure due to the record 2018
secondary harvest was offset by the impact of the Government purchases. In the importing countries, domestic prices of rice decreased in Bangladesh and Sri Lanka, amid improved market supplies from the 2018 harvests. In the Philippines, prices reached record levels in August after steady increases since the beginning of 2018, mostly due to upturns in fuel and electricity prices
0.2
0.3
0.4
0.5
0.6
0.7
0.8
0.9
AJJMAMFJDNOSAJJMAMFJDNOSA2017 20182016
Rice retail prices in selected Far East countries
Sources: Department of Census and Statistics, Sri Lanka; Ministry of Consumer Affairs, India; Bureau of Agriculture Statistics, the Philippines; Agroinfo, Viet Nam.
(USD/kg)
VIET NAMwholesale 25% broken milled, An Giang
INDIANew Delhi
SRI LANKAwhite rice, Colombo
PHILIPPINES regular milled rice, national average
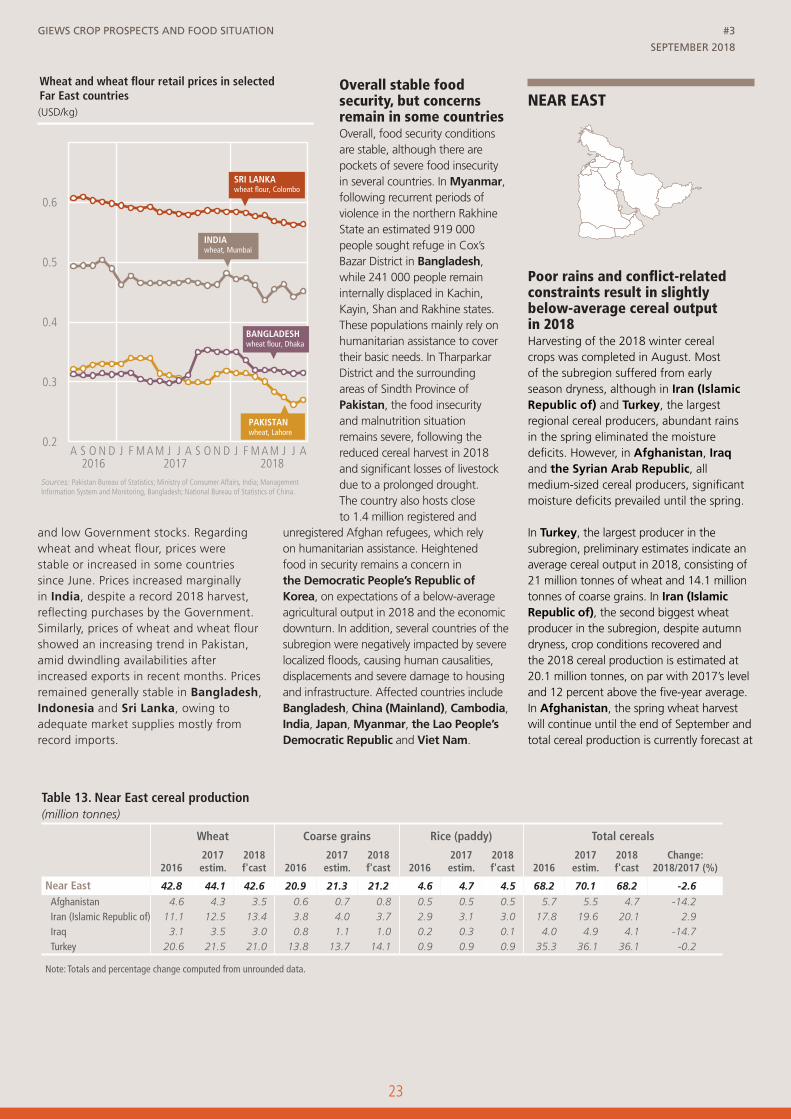
23
GIEWS CROP PROSPECTS AND FOOD SITUATION #3
SEPTEMBER 2018
and low Government stocks. Regarding wheat and wheat flour, prices were stable or increased in some countries since June. Prices increased marginally in India, despite a record 2018 harvest, reflecting purchases by the Government. Similarly, prices of wheat and wheat flour showed an increasing trend in Pakistan, amid dwindling availabilities after increased exports in recent months. Prices remained generally stable in Bangladesh, Indonesia and Sri Lanka, owing to adequate market supplies mostly from record imports.
Overall stable food security, but concerns remain in some countriesOverall, food security conditions are stable, although there are pockets of severe food insecurity in several countries. In Myanmar, following recurrent periods of violence in the northern Rakhine State an estimated 919 000 people sought refuge in Cox’s Bazar District in Bangladesh, while 241 000 people remain internally displaced in Kachin, Kayin, Shan and Rakhine states. These populations mainly rely on humanitarian assistance to cover their basic needs. In Tharparkar District and the surrounding areas of Sindth Province of Pakistan, the food insecurity and malnutrition situation remains severe, following the reduced cereal harvest in 2018 and significant losses of livestock due to a prolonged drought. The country also hosts close to 1.4 million registered and
unregistered Afghan refugees, which rely on humanitarian assistance. Heightened food in security remains a concern in the Democratic People’s Republic of Korea, on expectations of a below-average agricultural output in 2018 and the economic downturn. In addition, several countries of the subregion were negatively impacted by severe localized floods, causing human causalities, displacements and severe damage to housing and infrastructure. Affected countries include Bangladesh, China (Mainland), Cambodia, India, Japan, Myanmar, the Lao People’s Democratic Republic and Viet Nam.
NEAR EAST
Poor rains and conflict-related constraints result in slightly below-average cereal output in 2018Harvesting of the 2018 winter cereal crops was completed in August. Most of the subregion suffered from early season dryness, although in Iran (Islamic Republic of) and Turkey, the largest regional cereal producers, abundant rains in the spring eliminated the moisture deficits. However, in Afghanistan, Iraq and the Syrian Arab Republic, all medium-sized cereal producers, significant moisture deficits prevailed until the spring.
In Turkey, the largest producer in the subregion, preliminary estimates indicate an average cereal output in 2018, consisting of 21 million tonnes of wheat and 14.1 million tonnes of coarse grains. In Iran (Islamic Republic of), the second biggest wheat producer in the subregion, despite autumn dryness, crop conditions recovered and the 2018 cereal production is estimated at 20.1 million tonnes, on par with 2017’s level and 12 percent above the five-year average. In Afghanistan, the spring wheat harvest will continue until the end of September and total cereal production is currently forecast at
Table 13. Near East cereal production (million tonnes)
Wheat Coarse grains Rice (paddy) Total cereals
20162017 estim.
2018 f'cast 2016
2017 estim.
2018 f'cast 2016
2017 estim.
2018 f'cast 2016
2017 estim.
2018 f'cast
Change: 2018/2017 (%)
Near East 42.8 44.1 42.6 20.9 21.3 21.2 4.6 4.7 4.5 68.2 70.1 68.2 -2.6Afghanistan 4.6 4.3 3.5 0.6 0.7 0.8 0.5 0.5 0.5 5.7 5.5 4.7 -14.2Iran (Islamic Republic of) 11.1 12.5 13.4 3.8 4.0 3.7 2.9 3.1 3.0 17.8 19.6 20.1 2.9Iraq 3.1 3.5 3.0 0.8 1.1 1.0 0.2 0.3 0.1 4.0 4.9 4.1 -14.7Turkey 20.6 21.5 21.0 13.8 13.7 14.1 0.9 0.9 0.9 35.3 36.1 36.1 -0.2
Note: Totals and percentage change computed from unrounded data.
0.2
0.3
0.4
0.5
0.6
AJJMAMFJDNOSAJJMAMFJDNOSA2017 20182016
Wheat and wheat flour retail prices in selected Far East countries
Sources: Pakistan Bureau of Statistics; Ministry of Consumer Affairs, India; Management Information System and Monitoring, Bangladesh; National Bureau of Statistics of China.
(USD/kg)
BANGLADESHwheat flour, Dhaka
PAKISTANwheat, Lahore
INDIAwheat, Mumbai
SRI LANKAwheat flour, Colombo

24
GIEWS CROP PROSPECTS AND FOOD SITUATION #3
SEPTEMBER 2018
4.7 million tonnes, about 24 percent below the five-year average, reflecting reduced precipitation during the winter and spring months.
In the Syrian Arab Republic, rains started during the first decade of January 2018, about three months later than normal and paused in early March affecting the crucial stages of crop development, greatly limiting yields. The cropping season finished with torrential rains from the second decade of April to the first decade of May, making many areas unsuitable for harvesting. The uneven rainfall distribution, coupled with the ongoing conflict, lack of inputs, damage to agricultural machinery, irrigation systems and storage facilities resulted in a very significant decrease in wheat production. A Crop and Food Security Assessment Mission (CFSAM), fielded jointly by FAO and WFP, visited the country from June to July 2018 and its report, including the final production estimates, will be released in early autumn.
Overall, preliminary estimates indicate an aggregate subregional cereal production of about 68.2 million tonnes, below last year’s output as well as the previous five-year average.
At subregional level, wheat imports in the 2018/19 (July/ June) marketing year are estimated at an average 29 million tonnes. Imports of coarse grains are estimated at 35 million tonnes, 17 percent above the last five-year average, supported by strong demand for animal feed in most Arab countries.
Persisting conflicts continue to worsen food security of large numbers of people In Yemen, according to the 2018 Humanitarian Needs Overview, approximately 17.8 million people are estimated to be food insecure, a 5 percent increase over the 2017 estimate. This figure includes 8.4 million people who are severely food insecure and at risk of starvation, about 24 percent more than in 2017. Any disruption of trade flows threatens the continuity of market supplies and, consequently, the food security of large numbers of people. Prices across the country are generally well above the pre-crisis levels (February 2015), in some cases have even doubled, while significant price differences also persist among markets.
In the Syrian Arab Republic, as of September 2017 (latest available figures), about 6.5 million people faced large food consumption gaps or the accelerated depletion of livelihood assets. An additional 4 million people are at risk of food insecurity.
In Afghanistan, in spring 2018, almost 2.2 million people were considered to be chronically food insecure, of which 1.4 million people are at risk of acute food insecurity due to drought. Continuing conflict, natural hazards and limited economic opportunities have increased the vulnerability of the poorest households, including subsistence farmers.
CIS IN ASIA4
Cereal production in 2018 forecast close to the five-year average The 2018 harvest of winter cereals was finalized at the end of August, while spring cereals are currently being harvested. The total subregional cereal output, mainly wheat, is expected to reach 33.9 million tonnes, 6 percent below the 2017 output but close to the five-year average. The anticipated yearly decline rests on expectations of reduced wheat outputs in several countries, reflecting insufficient precipitation throughout the season. In Tajikistan and Uzbekistan, dry weather conditions during the winter and spring periods negatively affected yields, resulting in wheat production declines of 22 and 13 percent, respectively. Excessive precipitations in Kyrgyzstan, just before the start of the harvest, had a moderate negative impact on winter cereals, but the national output is still expected to be close to the five-year average. Harvesting of the wheat crop in Kazakhstan is ongoing
Table 14. CIS in Asia cereal production (million tonnes)
Wheat Coarse grains Total cereals 1
20162017 estim.
2018 f'cast 2016
2017 estim.
2018 f'cast 2016
2017 estim.
2018 f'cast
Change: 2018/2017 (%)
CIS in Asia 27.4 26.4 24.8 8.9 8.6 8.1 37.2 36.0 33.9 -5.8Armenia 0.4 0.3 0.4 0.2 0.2 0.2 0.6 0.5 0.6 5.9Azerbaijan 1.8 1.7 1.8 1.2 1.2 1.2 3.0 2.9 3.0 3.9Georgia 0.1 0.1 0.1 0.3 0.2 0.3 0.4 0.3 0.4 40.3Kazakhstan 15.0 14.8 14.2 4.5 4.6 4.4 20.0 19.9 19.1 -3.9Kyrgyzstan 0.7 0.7 0.7 1.1 1.1 1.0 1.8 1.8 1.7 -3.2Tajikistan 0.9 0.9 0.7 0.4 0.4 0.3 1.4 1.4 1.1 -19.6Turkmenistan 1.6 1.0 1.0 0.1 0.1 0.1 1.8 1.2 1.2 -0.7Uzbekistan 6.9 6.9 6.0 1.1 0.9 0.6 8.3 8.1 6.8 -15.4
Note: Totals and percentage change computed from unrounded data.1 Total cereals includes wheat, coarse grains and rice (paddy).
4 Georgia is no longer a member of CIS but its inclusion in this group is maintained for the time being.

25
GIEWS CROP PROSPECTS AND FOOD SITUATION #3
SEPTEMBER 2018
under favourable weather conditions. However, the forecast for aggregate wheat production points to a 4 percent yearly decline to 14.2 million tonnes, due to a contraction in the area planted as farmers switched to more profitable oilseed crops.
Planting of 2019 winter cereal crops, to be harvested next year, started at the end of August under generally favourable weather conditions.
Cereal imports projected to remain high for a second consecutive yearTotal subregional imports are forecast at 7.7 million tonnes (of which wheat accounts for 6.9 million tonnes) in the 2018/19 marketing year (July/June), virtually unchanged from the high level of the previous year. The expected continuation of high import volumes reflects below-average outputs in several countries and the ample availability of competitively priced wheat flour on the international markets.
Aggregate subregional exports are forecast at 10.4 million tonnes, slightly below the record level of the previous year. The decrease is mainly due to a projected decrease in barley shipments from Kazakhstan, forecast at 1.1 million tonnes, about 20 percent below the 2017 level but still well above the five-year average. Wheat exports (wheat grain and wheat flour in grain equivalent) are forecast at
8.3 million tonnes, virtually unchanged from the previous year.
Domestic prices of wheat flour remained mostly stableIn Kazakhstan, export prices of wheat were mostly stable in the preceding months, as strong competition for export markets with the Russian Federation suppressed demand for Kazakhstan wheat. Domestic wholesale prices of wheat flour in Kazakhstan remained unchanged over the last three months and, in August, they were close to their values of one year ago, reflecting adequate domestic supplies and a stable national currency.
In the importing countries, domestic prices of wheat flour remained unchanged since May, reflecting stable export quotations from Kazakhstan, the main subregional supplier of wheat. In Azerbaijan and Kyrgyzstan, prices in August were close to their values of one year ago, while in Armenia, Georgia and Tajikistan prices declined on a yearly basis, depressed by relatively cheaper imported wheat flour. In Uzbekistan, as of August prices of wheat flour were stable during
the previous months, but approximately 7 percent higher than their year-earlier values, mainly due to the depreciation of the local currency since September 2017 following the implementation of a free floating exchange rate system.
0.3
0.4
0.5
0.6
0.7
0.8
0.9
AJJMAMFJDNOSAJJMAMFJDNOSA2017 20182016
Retail wheat flour prices in selected CIS in Asia countries (national averages)
Source: National Statistical Service of Republic of Armenia; National Statistical Committee of the Kyrgyz Republic; State Committee on Statistics, Republic of Tajikistan; National Statistics Office of Georgia.
ARMENIA
GEORGIA
KYRGYZSTAN
(USD/kg)
TAJIKISTAN

26
GIEWS CROP PROSPECTS AND FOOD SITUATION #3
SEPTEMBER 2018
Latin America and the Caribbean Production OverviewCereal production in Latin America and the Caribbean in 2018 is forecast at 249.8 million tonnes, an 7.3 percent decrease from the record output in 2017. This year’s foreseen production decline would mostly result from drought-reduced maize outputs in major producers, Argentina and Brazil.
Additionally, dry spells in Central America and the Caribbean were more intense and prolonged than previously forecast, resulting in a larger than previously anticipated production decline for maize.
By contrast, wheat production in South America is forecast to increase by 14 percent on an annual basis, reflecting the expected record output of Argentina. By contrast, the wheat harvest in Mexico, the major wheat producer in Central America, is estimated to have declined due to a contraction in the area sown.
REGIONAL REVIEWS
LATIN AMERICA AND THE CARIBBEAN
SOUTH AMERICABrazilMaize (main season): Planting
Centresouthern statesWheat (winter): Harvesting
UruguayBarley: VegetativeMaize (main season): PlantingWheat (winter): Vegetative
ArgentinaWheat (winter): VegetativeMaize (main season): Planting
CENTRAL AMERICA AND THE CARIBBEANMexicoCoarse grains (summer): Vegetative to maturingPaddy (summer): HarvestingWheat (winter): Land preparation
Central AmericaMaize (first season): Harvesting
Cereal production (million tonnes)
Source: GIEWS
Note: Situation as of AugustSubregional borders
Unfavourable 2018 production prospects*
Uruguay: Insufficient rains
* See Terminology (page 5)
0
40
80
120
160
200
240
20182017201620152014
SOUTH AMERICA
CENTRAL AMERICA & CARIBBEAN
f’cast

27
GIEWS CROP PROSPECTS AND FOOD SITUATION #3
SEPTEMBER 2018
CENTRAL AMERICA AND THE CARIBBEAN
Wheat production in 2018 anticipated at low levelsIn Mexico, virtually the only wheat producer in the subregion, harvesting of the 2018 main wheat crop concluded in August and production is estimated at 2.9 million tonnes, 20 percent below the average. This is mainly due to a contraction in the area sown as a result of low water levels in reservoirs of the major wheat-producing regions, which prompted farmers to switch to more drought-resistant crops.
Maize production in 2018 estimated lower than average Aggregate 2018 maize production is forecast at 31.8 million tonnes, slightly lower than the five-year average. The lower production mainly reflects a contraction in the area sown in Mexico and prolonged dry spells in Central America, particularly in the Dry Corridor area, that negatively affected the flowering and grain-filling phases of the crop.
In Mexico, harvesting of the winter season maize crop was completed in July, while the summer season harvest is still underway. The forecast for the 2018 maize production
is pegged at an above-average level of 27.6 million tonnes, as improved yields more than offset a slight contraction in the planted area. However, regarding the summer season output, reduced rainfall in Oaxaca and Michoacán departments dampened production prospects.
Prolonged dry spells from mid-June to early August, particularly in the Dry Corridor, caused crop losses during the main season, with the harvest ongoing. The drought is not as intense as in 2015, which was affected by an El Niño event, but it is severe enough to have a negative impact on agricultural production in several areas of El Salvador, Guatemala, Honduras and Nicaragua. From early August, increased rainfall was observed across most of the subregion, except southwestern parts of Honduras, central Guatemala and western Nicaragua. The improved rains reduced soil moisture deficits and boosted prospects for the 2018 minor season crop, to be harvested in the last quarter of 2018. However, despite a more positive outlook for the minor season output, the aggregate 2018 maize production, excluding Mexico, is forecast at a below-average level of 4.2 million tonnes, mainly reflecting the drought-affected main season harvest.
In the Caribbean, limited rainfall between mid-June and early August affected crops in Haiti and the Dominican Republic. In Haiti, despite an enlarged area sown, dry spells reduced maize outputs in Sud, Sud-Est, Centre and Ouest departments. However, the 2018 maize production is expected at a good level in irrigated areas and in the highlands, while the
paddy output is anticipated at an average level. In the Dominican Republic, the reduced precipitation lowered water levels in reservoirs in San Juan Valley and in the northeastern region, resulting in a contraction of rice crop plantings.
Cereal imports forecast at high levels in 2018/19Cereal imports in the 2018/19 marketing year (September/August) are forecast at a well above-average level of 37 million tonnes. These high import requirements reflect the sustained demand for yellow maize for feed use (import dependency for this crop is high) and the expected reduced output in 2018.
Prices of maize are well above their year-earlier levelsIn Central America, prices of white maize in the June-August period were well above their year-earlier levels due to seasonal trends exacerbated by higher import costs. In Guatemala, prices of white maize continued to increase in this period and were well above those of a year earlier. During this lean season, Guatemalan markets are supplied by maize imported from Mexico, where prices increased despite the recently completed winter season harvest, reflecting concerns over a reduced output. In El Salvador, Honduras and Nicaragua, prices of white maize increased seasonally between June and August, with monthly gains this year exacerbated by higher production costs, due to more costly imported inputs, and concerns over the drought-affected 2018 main maize crop. The increase in prices in Nicaragua particularly reflect the social unrest that has disrupted a normal market
Table 15. Latin America and the Caribbean cereal production (million tonnes)
Wheat Coarse grains Rice (paddy) Total cereals
20162017 estim.
2018 f'cast 2016
2017 estim.
2018 f'cast 2016
2017 estim.
2018 f'cast 2016
2017 estim.
2018 f'cast
Change: 2018/2017 (%)
Central America & Caribbean 3.9 3.5 2.9 39.3 38.6 38.5 2.9 3.0 3.1 46.1 45.1 44.6 -1.1El Salvador 0.0 0.0 0.0 1.0 1.0 0.9 0.0 0.0 0.0 1.1 1.0 1.0 -3.6Guatemala 0.0 0.0 0.0 1.9 1.9 1.8 0.0 0.0 0.0 2.0 2.0 1.9 -5.0Honduras 0.0 0.0 0.0 0.5 0.6 0.5 0.1 0.1 0.1 0.6 0.6 0.6 -9.6Mexico 3.9 3.5 2.9 34.3 33.7 33.9 0.2 0.3 0.3 38.5 37.5 37.1 -0.9Nicaragua 0.0 0.0 0.0 0.5 0.5 0.5 0.4 0.4 0.4 0.9 0.9 0.8 -1.5
South America 28.9 25.8 29.5 129.6 173.6 151.2 23.2 25.1 24.5 181.7 224.5 205.2 -8.6Argentina 18.6 18.5 21.0 47.0 56.4 49.7 1.4 1.3 1.4 67.0 76.2 72.1 -5.5Brazil 6.8 4.3 5.1 65.8 100.7 85.4 10.6 12.3 12.0 83.3 117.3 102.5 -12.6
Note: Totals and percentage change computed from unrounded data.

28
GIEWS CROP PROSPECTS AND FOOD SITUATION #3
SEPTEMBER 2018
functioning in the country. Prices of maize declined in Haiti and the Dominican Republic, sustained by improved supplies from the new harvests.
Prices of beans were also higher than their year-earlier levels, albeit to a lesser degree than maize prices. In August, prices generally stabilized with the beginning of the minor season harvest. In Guatemala, prices of black beans were well below their levels of a year earlier due to ample supplies from the 2017 crop and in August declined sharply with new supplies from the harvest in the major producing eastern regions. Prices of black beans in Mexico were generally lower than their year-earlier levels due to good supplies from the 2018 secondary season harvest. Prices of red beans were slightly higher on a yearly basis in El Salvador and Nicaragua, whereas they were well above those a year earlier in Honduras. In Costa Rica, prices of beans remained generally stable but were higher than a year earlier supported by the reduced 2018 harvest. In Haiti and the Dominican Republic, prices of black beans remained mostly stable and lower than their levels in the previous year, sustained by adequate imports and localized domestic production.
SOUTH AMERICA
Drought affected 2018 maize production estimated below previous year’s record highHarvesting of the 2018 main maize crop is almost complete in Argentina and Brazil, which together account for about 90 percent of the subregional output. The 2018 subregional maize output is estimated at an above-average 138.7 million tonnes, 14 percent lower than last year’s record due to the drought in early 2018.
In Argentina, the 2018 maize production is anticipated at 43.3 million tonnes, a
13 percent decrease from the record hight in 2017. The year-on-year decrease mostly results from drought conditions coupled with excessive rains during the harvest period that adversely affected yields. In Brazil, the area sown to maize contracted in both the first and second seasons in 2018. For the first season, the area declined for a tenth consecutive year, as farmers switch from maize to soybeans, seeking more remunerative crops. For the second season, which accounts for about 65 percent of the total annual production, the sown area declined for the first time in recent years, similarly due to lower maize prices at planting time. Production from the second season is forecast to fall reflecting lower yields on account of delayed planting and water stress in the major maize producing Centre-West and South regions. As a result,
the total 2018 maize output is estimated at 82.1 million tonnes, 16 percent less than last year’s record output.
The drought also affected 2018 maize outputs in several other countries of the subregion. In Uruguay, production is expected to decrease by 34 percent year-on-year, putting this year’s output at a well below-average level. In Paraguay, maize production is estimated to decline on a yearly basis by 8 percent to 4.7 million tonnes; this follows three consecutive years of good outputs. In Ecuador, maize production in 2018 is expected at 1.4 million tonnes, 11 percent down from the last five-year average. Elsewhere, maize production is anticipated to increase slightly. Colombia’s maize output was estimated to increase by 6 percent from last year, although recent excessive rainfall in August may diminish the year-on-year gain. In Peru, the 2018 maize production is anticipated at an above-average level of 1.8 million tonnes reflecting favourable weather conditions that resulted in improved yields.
Wheat production in 2018 forecast at record highThe forecast for the 2018 subregional wheat output is pegged at 29.5 million tonnes, an increase from last year and 22 percent higher compared to the five-year average. The increase mainly reflects an anticipated record output in Argentina, the major wheat producing country of the subregion, where the 2018 area sown is officially estimated to expand by 6 percent compared to last year. Combined with favourable weather conditions, wheat production in Argentina is officially forecast at 21 million tonnes. In Brazil, harvesting of the 2018 wheat crop commenced in September. The area planted is estimated to have increased by 6 percent year-on-year, after three consecutive years of contractions that reflected ample national availabilities. As a result, Brazil’s 2018 wheat production is forecast at 5 million tonnes, 20 percent up from last year’s output.
The main season rice harvest is virtually complete and the aggregate output is estimated at an average level of 24.4 million tonnes. In Brazil, the major rice producing country of the subregion, the 2018 paddy output is estimated at an average level of 12 million tonnes, 2 percent below last year’s output due to a reduced area sown.
200
250
300
350
400
450
500
550
600
AJJMAMFJDNOSAJJMAMFJDNOSA2016 2017 2018
Wholesale white maize prices in selected countriesin Central America
Sources: Secretaria de Agricultura y Ganaderia, Honduras; Ministerio de Agricultura, Ganadería y Alimentación, Guatemala; Ministerio agropecuario y forestal, Nicaragua, Dirección General de Economía Agropecuaria, El Salvador.
(USD/tonne)
NICARAGUAManagua oriental
EL SALVADORSan Salvador
GUATEMALAGuatemala City
HONDURASTegucigalpa

29
GIEWS CROP PROSPECTS AND FOOD SITUATION #3
SEPTEMBER 2018
Cereal exports in 2018/19 expected to remain highThe forecast for the aggregate cereal export volume in the 2018/19 marketing year stands at 77 million tonnes, of which maize accounts for about 70 percent. Despite a below-average maize output, weakening local currencies in Argentina and Brazil increased the countries’ competitiveness in the international market. As a result, exports of maize are forecast at 55 million tonnes, 17 percent higher than average, albeit lower than the record in 2017/18. Reflecting an expected larger wheat output in 2018, coupled with the depreciation of the local currencies, exports of wheat from the subregion, mainly originating from Argentina, are foreseen at a record level of 15.8 million tonnes.
Weakening domestic currencies sustain wheat and maize prices high in Argentina and BrazilIn most countries, prices of yellow maize continued to increase in the June-August period and were well above their year-earlier levels. In Argentina, new supplies from the recently-completed harvest had a minimal impact on price levels, as the expected production decrease and a sharply weaker currency discouraged farmers from selling. Consequently, as of August prices rose and were almost double their year-earlier levels. In Brazil, prices of yellow maize decreased in July
after ten consecutive months of increases, reflecting improved domestic availabilities from the recently-completed 2018 harvest. However, they increased again in August, underpinned by the weaker local currencies. In Bolivia (Plurinational State of), prices of yellow maize were below their levels in this period last year, on account of good supplies from the recently-completed harvest. In Peru, prices of yellow maize were higher than their levels a year earlier, underpinned by high demand from the poultry industry. Prices of yellow maize in Chile were slightly higher on a yearly basis mostly due to higher prices in Argentina, the country’s main supplier. In Ecuador and Colombia, prices of yellow maize were lower than the corresponding period last year. In Argentina, prices of wheat grain increased slightly during the June-August period and were higher on a yearly basis, sustained by the weaker currency and tighter domestic supplies. In Brazil, reflecting favourable production prospects, prices of wheat grain declined slightly, halting the sharp increasing trend of the past months. In Bolivia (Plurinational State of), prices
of imported wheat flour remained higher than their year-earlier levels due to elevated prices in Argentina, the country’s main supplier. Prices of wheat flour were stable in some importing countries, Ecuador and Peru due to adequate imports, while prices of wheat grain were above their year-earlier levels in Chile.
100
200
300
400
500
600
700
800
AJJMAMFJDNOSAJJMAMFJDNOSA2016 2017 2018
Wholesale wheat flour prices in selected countries in South America
Sources: Servicio Informativo de Mercados Agropecuarios, Bolivia; Instituto de Economía Agrícola, Brazil; Bolsa de Cereales, Argentina.
ARGENTINA (wheat)Buenos Aires
BOLIVIASanta Cruz
BRAZILSão Paulo
(USD/tonne)

30
GIEWS CROP PROSPECTS AND FOOD SITUATION #3
SEPTEMBER 2018
North America, Europe and Oceania Production OverviewIn North America, cereal production in 2018 is expected to expand moderately, mainly driven by a larger wheat output in the United States of America, while small increases have also been forecast for Canada.
In Europe, the aggregate cereal output is expected to fall in 2018 from the exceptional outputs of the previous year. Most of the year-on-year reduction pertains to the Russian Federation and the European Union, as unfavourably dry weather conditions constrained yields.
In Oceania, Australia’s 2018 wheat harvest is forecast to partially recover from the previous year’s drought-reduced level, but remain below average.
REGIONAL REVIEWS
NORTH AMERICA, EUROPE AND OCEANIA
Cereal production (million tonnes)
NORTH AMERICACanadaMaize: Reproductive Small grains: Maturing to harvesting
United States of AmericaMaize: Maturing to harvestingGrains (winter): Planting
EUROPENorthern EuropeGrains (winter): Planting to early development
Centre-Southern EuropeMaize: HarvestingGrains (winter): Land preparation to planting
CIS in Europe:Maize: Mostly harvestedSmall grains: Mostly harvestedGrains (winter): Land preparation
OCEANIAAustraliaCereals (winter): Vegetative to reproductive
Source: GIEWS
Note: Situation as of August
Unfavourable 2018 production prospects*
Australia (wheat): Dry weather conditions +
* See Terminology (page 5) + New Entry
0
100
200
300
400
500
600
20182017201620152014
NORTH AMERICA
EUROPE
OCEANIA
f’cast

31
GIEWS CROP PROSPECTS AND FOOD SITUATION #3
SEPTEMBER 2018
NORTH AMERICA
Wheat production in the United States of America is forecast to increase from the reduced level of 2017In the United States of America, harvesting of the winter wheat crop is complete, while the spring wheat crop is being harvested. Total wheat production is forecast at 51 million tonnes, 8 percent above the reduced level of 2017, but still below the five-year average. The year-on-year increase is on account of production gains for spring wheat, as result of an expansion in plantings and higher yields, which reflects generally beneficial weather conditions. The growth in spring production is expected to offset a decline in the winter wheat output, following dry weather in the southern Plains that curbed yields.
Regarding the 2018 maize crop which is currently being harvested, production is forecast at 371 million tonnes, virtually unchanged from the previous year’s high level. The stable year-on-year output reflects higher yields on account of exceptional weather conditions which are expected to compensate for a contraction in the area sown.
In Canada, harvesting of the 2018 spring wheat crop is expected to be finalized by the end of September and the aggregate output (including the minor winter wheat crop) is forecast at 30 million tonnes, almost at an equivalent level to last year’s average output. The unchanged year-on-year output reflects an expansion in the planted area that is anticipated to be offset by a decline in yields, following adverse weather conditions. By contrast, an enlargement in the area sown drove up production of barley and maize in 2018, forecast at 8.5 and 14.3 million tonnes respectively, putting this year’s outputs close to the five-year average.
EUROPE
EUROPEAN UNION
Aggregate cereal production at six-year low due to dry weather in northern EuropeIn the European Union, the 2018 wheat harvest is ongoing under mixed weather conditions. Hot and dry weather across northern and central European Union countries negatively affected yields,
while conditions were mostly favourable elsewhere. The latest estimates point to an aggregate 2018 wheat production of 138 million tonnes, a six-year low and about 10 percent below the bumper level of the previous year.
Similarly, production of coarse grains in 2018 is forecast at a below-average level of 150 million tonnes, due to excessive heat and low rainfall across northern parts of the European Union in recent months, which negatively affected yields of maize and barley crops. However, reductions in yields in northern European Union countries was partially offset by a good performance of crops in southeastern Europe, where
weather conditions were more favourable. As a result, the maize output is now forecast at an average level of 63.5 million tonnes, while production of barley is pegged at 56 million tonnes, slightly below average and about 5 percent down from the reduced output of 2017.
CIS IN EUROPE
Dry weather conditions negatively affected 2018 cereal production Harvesting of the 2018 cereal crops is underway and the aggregate cereal output is forecast at 180 million tonnes, 11 percent below the record of last year but still above the five-year average. The decrease mostly rests on a projected decline
Table 16. North America, Europe and Oceania cereal production (million tonnes)
Wheat Coarse grains Rice (paddy) Total cereals
20162017 estim.
2018 f'cast 2016
2017 estim.
2018 f'cast 2016
2017 estim.
2018 f'cast 2016
2017 estim.
2018 f'cast
Change: 2018/2017 (%)
North America 95.0 77.4 81.4 429.7 410.9 411.9 10.2 8.1 9.6 534.8 496.3 502.8 1.3Canada 32.1 30.0 30.3 26.7 26.3 26.8 0.0 0.0 0.0 58.9 56.3 57.1 1.5United States of America 62.8 47.4 51.1 403.0 384.6 385.0 10.2 8.1 9.6 476.0 440.0 445.7 1.3
Europe 252.0 271.9 238.7 253.6 249.8 241.7 4.1 3.9 3.9 509.7 525.6 484.2 -7.9Belarus 2.3 2.6 2.0 4.7 5.0 4.5 0.0 0.0 0.0 7.1 7.6 6.5 -14.4European Union 144.5 152.0 138.0 153.1 156.4 149.6 3.0 2.9 2.8 300.6 311.2 290.4 -6.7Russian Federation 73.3 85.9 69.0 43.4 44.3 38.0 1.1 1.0 1.0 117.7 131.1 107.9 -17.7Serbia 2.9 2.3 2.5 8.0 4.5 6.4 0.0 0.0 0.0 10.9 6.8 8.9 31.2Ukraine 26.1 26.2 24.1 39.4 34.6 38.5 0.1 0.1 0.1 65.6 60.8 62.7 3.0
Oceania 32.3 21.6 20.9 18.9 12.3 13.0 0.3 0.8 0.6 51.5 34.7 34.6 -0.3Australia 31.8 21.2 20.5 18.3 11.7 12.4 0.3 0.8 0.6 50.4 33.8 33.5 -0.7
Note: Totals and percentage change computed from unrounded data.

32
GIEWS CROP PROSPECTS AND FOOD SITUATION #3
SEPTEMBER 2018
in wheat production, forecast at 96 million tonnes, almost 19 million tonnes lower than 2017’s level. Similarly, the barley output is expected to decline to a below-average level of 19.5 million tonnes, while maize production, estimated at 43 million tonnes, is projected to increase from the below-average level of 2017.
In the Russian Federation, the aggregate cereal output is estimated at 108 million tonnes, about 18 percent below the record of 2017, mainly due to unfavourable weather conditions throughout the growing period that affected yields. The decline mostly relates to wheat production, which is forecast at 69 million tonnes, about 20 percent below the exceptionally high level of the previous year. Sowing of the winter crops, to be harvested in 2019, started at the end of August. According to official data, the total area planted under winter cereals is forecast at 17.2 million hectares, marginally below the high level of 2017.
By contrast, in Ukraine, cereal production is forecast to increase to a near-average level of 63 million tonnes. The year-on-year rise rests on a projected 18 percent increase in maize production, forecast at 29 million tonnes, which would put it at the highest level since 2013. The larger expected maize harvest is set to offset a reduction in wheat production, estimated at 24.1 million tonnes, 8 percent below the level of the previous year but still close to the five-year average. The reduction is mainly due to the impact of unfavourable weather conditions, which are anticipated to reduce the share of milling quality wheat.
In Belarus, most of the country experienced moderate precipitation deficits since the start of the growing season. Taking into account the year-on-year decline in yields, aggregate cereal production is estimated to have declined to a below-average level of 6.5 million tonnes, about 15 percent down from 2017’s output. Similarly, on account of adverse weather conditions, the 2018 cereal output in the Republic of Moldova is expected to decline to 3 million tonnes, 6 percent below the previous year, but still above average.
Exports in 2018/19 marketing year are forecast below the record of last yearAggregate cereal exports in the 2018/19 marketing year (July/June) are expected to decline from the record high of last year, based on expectations of reduced harvests. As a result, total cereal shipments from the subregion are forecast at 87 million tonnes, a 7 percent decrease compared to 2017/18. Most of this decrease stems from a lower forecast for wheat exports, reflecting reduced availability of milling quality grain in the Russian Federation and Ukraine. Poor quality grains, together with a sharp depreciation of the national currencies, could also lead to a return to more restrictive export practices, which could result in a further downgrading of the export forecast for 2018. Wheat exports from the Russian Federation are currently forecast at 35 million tonnes, 15 percent below the record level of last year but still above the five-year average. In Ukraine, wheat shipments are expected to reach just under 16 million tonnes, about 10 percent below the high level of 2017.
By contrast, maize shipments are forecast to increase by 22 percent to 21.7 million tonnes on account of higher exports from Ukraine, following the bumper domestic output.
Export prices of wheat increased from last year In the main exporting countries of the subregion, export prices of milling wheat rose sharply over the last three months, supported by concerns over crop quality, weakening domestic currencies and strong export demand. As a result, in August export prices in the Russian Federation and Ukraine were about 20 percent higher than a year earlier. Similarly, domestic prices in both countries increased by about 15-20 percent in the year to August 2018.
OCEANIA
Australian wheat lowest since 2007In Australia, the harvest of the wheat crop started in early September. Production in 2018 is forecast at 20.5 million tonnes, the lowest level since 2007. The anticipated decrease reflects expected year-on-year declines in yields in eastern Australia, following persistent dry conditions. Reduced outputs in eastern areas are only expected to be partially offset by larger year-on-year outputs in Western Australia, where rainfall in August benefitted crop development, boosting yield prospects.
160
170
180
190
200
210
220
230
AJJMAMFJDNOSAJJMAMFJDNOSA2016 2017 2018
Wheat export prices in Russian Federation and Ukraine
Source: International Grains Council.
RUSSIAN FEDERATION
UKRAINE
(USD/tonne)

33
GIEWS CROP PROSPECTS AND FOOD SITUATION #3
SEPTEMBER 2018
STATISTICAL APPENDIX
Table A1. Global cereal supply and demand indicators
Average 2013/14 - 2017/18 2014/15 2015/16 2016/17 2017/18 2018/19
Ratio of world stocks to utilization (%) Wheat 32.5 30.7 32.3 34.8 36.9 33.4Coarse grains 24.8 25.1 25.3 26.0 26.0 22.0Rice 33.6 34.1 33.4 33.3 33.4 33.6Total cereals 28.7 28.5 28.9 29.9 30.5 27.3
Ratio of major grain exporters' supplies to market requirements (%) 1 123.4 124.3 124.0 123.0 122.7 115.4
Ratio of major exporters' stocks to their total disappearance (%) 2 Wheat 18.5 18.2 17.9 20.1 20.8 15.3Coarse grains 13.3 14.3 12.5 14.1 14.6 11.9Rice 21.9 24.6 19.7 18.7 17.3 17.8Total cereals 17.9 19.0 16.7 17.6 17.6 15.0
Annual trendgrowth rate Change from previous year
2008-2017 2014 2015 2016 2017 2018
Changes in world cereal production (%) 1.6 1.8 -1.0 2.7 1.5 -2.4
Changes in cereal production in the LIFDCs (%) 2.0 3.2 -3.2 4.4 2.8 -0.2
Changes in cereal production in the LIFDCs excluding India (%) 2.2 6.0 -1.3 3.8 0.2 -1.5
Change 2018* over
2017* 2015 2016 2017 2018*
Selected cereal price indices3
Wheat 143.9 125.2 133.4 145.7 10.1%Maize 161.2 151.0 146.3 157.6 5.5%Rice 210.5 193.5 206.4 227.7 13.1%
Notes:
Utilization is defined as the sum of food use, feed and other uses.
Cereals refer to wheat, coarse grains and rice; grains refer to wheat and coarse grains (barley, maize, millet, sorghum and cereals NES).
1 Major wheat exporters are: Argentina, Australia, Canada, the European Union, Kazakhstan, the Russian Federation, Ukraine and the United States of America; major coarse grains exporters are Argentina, Australia, Brazil, Canada, the European Union, the Russian Federation, Ukraine and the United States of America; major rice exporters are India, Pakistan, Thailand, the United States of America and Viet Nam.2 Disappearance is defined as domestic utilization plus exports for any given season.3 Price indices: The Wheat Price Index has been constructed based on the International Grains Council Wheat Price Index, rebased to 2002-2004=100; for maize, the U.S. maize No.2 Yellow (delivered U.S. Gulf ports) with base 2002-2004=100; for rice, the FAO Rice Price Index, 2002-2004=100, is based on 16 rice export quotations.
*January-August average.

34
GIEWS CROP PROSPECTS AND FOOD SITUATION #3
SEPTEMBER 2018
Table A2. World cereal stocks1 (million tonnes)
2014 2015 2016 20172018
estimate2019
forecast
TOTAL CEREALS 639.2 715.1 742.2 781.7 807.0 741.8
Wheat 197.5 217.7 236.9 256.5 273.6 252.3held by: - main exporters2 57.4 68.5 69.7 80.7 83.9 61.3- others 140.1 149.2 167.2 175.8 189.7 191.0
Coarse grains 275.7 329.0 338.8 357.4 363.0 316.1held by: - main exporters2 84.6 111.3 99.6 113.6 121.2 98.8- others 191.1 217.7 239.2 243.8 241.8 217.3
Rice (milled basis) 166.1 168.5 166.5 167.8 170.4 173.4held by: - main exporters2 49.6 43.6 34.6 33.0 30.9 32.1- others 116.5 124.9 131.9 134.8 139.5 141.3
Developed countries 152.1 181.9 179.7 206.9 207.9 169.7Australia 7.8 7.8 6.6 9.2 8.0 5.9Canada 15.2 10.5 10.0 12.1 10.2 9.3European Union 32.7 40.0 36.4 33.2 40.9 29.2Japan 7.1 7.1 7.3 6.6 6.7 6.8Russian Federation 7.9 12.7 11.1 19.2 23.3 14.1South Africa 1.7 3.4 3.8 1.7 4.6 4.6Ukraine 11.0 12.5 9.2 7.0 5.4 4.5United States of America 51.4 69.0 76.1 95.8 86.3 73.3
Developing countries 487.0 533.2 562.5 574.8 599.2 572.1
Asia 403.0 430.8 460.4 470.0 478.0 460.1China (Mainland) 257.9 282.5 325.8 351.6 356.9 339.5India 49.6 48.9 41.9 34.5 40.8 43.5Indonesia 10.9 9.9 9.6 8.9 10.0 11.0Iran (Islamic Republic of) 6.0 9.9 10.4 8.4 5.7 5.5Korea, Republic of 3.7 3.9 4.3 3.7 2.9 2.9Pakistan 5.2 6.2 5.2 5.1 4.2 2.5Philippines 3.2 4.2 4.0 3.7 4.1 4.6Syrian Arab Republic 3.2 2.0 1.5 2.0 2.0 1.2Turkey 7.2 6.3 5.9 4.7 5.9 4.7
Africa 43.4 49.2 52.4 51.1 51.7 48.2Algeria 4.2 5.0 5.7 5.6 5.1 4.6Egypt 6.2 6.3 7.1 6.5 6.8 6.3Ethiopia 2.3 3.3 4.1 4.4 4.1 3.9Morocco 5.8 5.4 8.2 5.9 6.6 7.3Nigeria 1.8 3.4 3.6 3.0 2.3 2.1Tunisia 1.0 1.2 1.0 1.0 1.1 1.0
Central America 7.5 8.2 9.7 12.3 13.4 13.2Mexico 3.3 3.6 4.6 6.5 7.6 7.6
South America 32.7 44.6 39.6 41.0 55.6 50.2Argentina 6.5 11.6 7.7 8.5 13.4 10.0Brazil 12.5 17.5 14.2 12.7 19.7 16.7
Note: Based on official and unofficial estimates. Totals computed from unrounded data.1 Stocks data are based on an aggregate of carryovers at the end of national crop years and do not represent world stock levels at any point in time.2 Major wheat exporters are Argentina, Australia, Canada, the European Union, Kazakhstan, the Russian Federation, Ukraine and the United States of America; major coarse grains exporters are Argentina, Australia, Brazil, Canada, the European Union, the Russian Federation, Ukraine and the United States of America; major rice exporters are India, Pakistan, Thailand, the United States of America and Viet Nam.

35
GIEWS CROP PROSPECTS AND FOOD SITUATION #3
SEPTEMBER 2018
Table A3. Selected international prices of wheat and coarse grains(USD/tonne)
Wheat Maize Sorghum
US No.2 Hard Red Winter Ord.
Protein 1 US Soft Red
Winter No.2 2 Argentina Trigo Pan3
US No.2 Yellow2 Argentina3
US No.2 Yellow2
Annual (July/June) 2005/06 175 138 138 104 101 1082006/07 212 176 188 150 145 1552007/08 361 311 318 200 192 2062008/09 270 201 234 188 180 1702009/10 209 185 224 160 168 1652010/11 316 289 311 254 260 2482011/12 300 256 264 281 269 2642012/13 348 310 336 311 278 2812013/14 318 265 335 217 219 2182014/15 266 221 246 173 177 2102015/16 211 194 208 166 170 1742016/17 197 170 190 156 172 1512017/18 230 188 203 159 165 174
Monthly
2016 - August 188 157 215 150 177 1402016 - September 188 158 201 148 170 1412016 - October 193 164 184 152 174 1462016 - November 191 167 176 152 178 1432016 - December 187 162 168 154 181 1542017 - January 201 173 177 159 183 1552017 - February 210 180 186 163 179 1572017 - March 198 176 191 159 163 1502017 - April 191 173 189 157 164 1502017 - May 200 175 189 158 161 1582017 - June 226 182 190 158 155 1642017 - July 240 206 193 159 150 1732017 - August 201 173 190 148 149 1702017 - September 215 176 181 147 149 1692017 - October 214 177 182 148 149 1712017 - November 220 176 179 148 150 1672017 - December 219 171 178 149 158 1742018 - January 229 178 178 156 164 1782018 - February 240 191 189 164 177 1882018 - March 245 198 211 171 188 1812018 - April 240 198 229 175 189 1802018 - May 250 211 261 179 192 1652018 - June 241 205 268 166 170 1672018 - July 235 207 245 157 165 1472018 - August 250 215 242 162 168 165
Sources: International Grains Council and USDA.1 Delivered United States f.o.b. Gulf.2 Delivered United States Gulf.3 Up River f.o.b.

36
GIEWS CROP PROSPECTS AND FOOD SITUATION #3
SEPTEMBER 2018
Table A4a. Estimated cereal import requirements of Low-Income Food-Deficit Countries1 in 2017/18 or 2018(thousand tonnes)
2016/17 or 2017 2017/18 or 2018
Marketing yearCommercial purchases Food aid
Total imports (commercial and aid)
Total import requirements
(excl. re-exports)
AFRICA 34 872.9 994.3 35 867.2 35 432.0
East Africa 10 611.6 599.0 11 210.6 11 869.0 Burundi Jan/Dec 160.9 15.0 175.9 169.8 Comoros Jan/Dec 41.0 0.0 41.0 61.0 Djibouti Jan/Dec 81.0 4.0 85.0 85.0 Eritrea Jan/Dec 447.3 0.0 447.3 447.7 Ethiopia Jan/Dec 1 677.6 54.0 1 731.6 1 835.0 Kenya Oct/Sept 3 220.0 80.0 3 300.0 3 580.0 Rwanda Jan/Dec 195.0 0.0 195.0 200.0 Somalia Aug/Jul 695.0 170.0 865.0 950.0 South Sudan Nov/Oct 500.0 60.0 560.0 665.0 Sudan Nov/Oct 2 100.0 182.0 2 282.0 2 360.0 Uganda Jan/Dec 482.2 23.0 505.2 560.5 United Republic of Tanzania Jun/May 1 011.6 11.0 1 022.6 955.0
Southern Africa 3 776.3 93.2 3 869.5 2 906.8 Lesotho Apr/Mar 249.5 14.0 263.5 177.1 Madagascar Apr/Mar 467.4 17.1 484.5 1 023.6 Malawi Apr/Mar 540.0 6.0 546.0 167.0 Mozambique Apr/Mar 1 295.0 1.0 1 296.0 1 116.0 Zimbabwe Apr/Mar 1 224.4 55.1 1 279.5 423.1
West Africa 18 326.7 143.1 18 469.8 18 396.9Coastal Countries 13 224.9 44.5 13 269.4 13 573.5
Benin Jan/Dec 426.0 6.0 432.0 612.0 Côte d'Ivoire Jan/Dec 2 065.0 5.5 2 070.5 1 980.5 Ghana Jan/Dec 1 280.0 5.0 1 285.0 1 285.0 Guinea Jan/Dec 912.0 5.5 917.5 847.5 Liberia Jan/Dec 490.0 12.0 502.0 487.0 Nigeria Jan/Dec 7 390.0 0.0 7 390.0 7 710.0 Sierra Leone Jan/Dec 466.9 10.0 476.9 356.0 Togo Jan/Dec 195.0 0.5 195.5 295.5
Sahelian Countries 5 101.8 98.6 5 200.4 4 823.4 Burkina Faso Nov/Oct 683.0 10.0 693.0 678.0 Chad Nov/Oct 121.0 38.6 159.6 169.6 Gambia Nov/Oct 217.0 1.5 218.5 258.5 Guinea-Bissau Nov/Oct 158.0 6.3 164.3 119.3 Mali Nov/Oct 451.2 0.0 451.2 451.2 Mauritania Nov/Oct 589.7 16.1 605.8 578.8 Niger Nov/Oct 625.0 18.0 643.0 668.0 Senegal Nov/Oct 2 256.9 8.1 2 265.0 1 900.0
Central Africa 2 158.3 159.0 2 317.3 2 259.3 Cameroon Jan/Dec 1 335.0 10.0 1 345.0 1 270.0 Central African Republic Jan/Dec 61.0 23.0 84.0 86.0 Democratic Republic of the Congo Jan/Dec 745.0 125.0 870.0 885.0 Sao Tome and Principe Jan/Dec 17.3 1.0 18.3 18.3
Source: FAO1 The Low-Income Food-Deficit Countries (LIFDCs) group includes net food deficit countries with annual per caput income below the level used by the World Bank to determine eligibility for IDA assistance (i.e. USD 1 985 in 2013); for full details see http://www.fao.org/countryprofiles/lifdc

37
GIEWS CROP PROSPECTS AND FOOD SITUATION #3
SEPTEMBER 2018
Table A4b. Estimated cereal import requirements of Low-Income Food-Deficit Countries1 in 2017/18 or 2018(thousand tonnes)
2016/17 or 2017 2017/18 or 2018
Marketing yearCommercial purchases Food aid
Total imports (commercial and aid)
Total import requirements
(excl. re-exports)
ASIA 28 287.4 773.1 29 060.5 29 836.5
Cis in Asia 4 648.0 0.1 4 648.1 4 819.2 Kyrgyzstan Jul/Jun 615.0 0.1 615.1 617.2 Tajikistan Jul/Jun 1 147.0 0.0 1 147.0 1 032.0 Uzbekistan Jul/Jun 2 886.0 0.0 2 886.0 3 170.0
Far East 14 107.4 153.0 14 260.4 14 275.3 Bangladesh Jul/Jun 6 564.5 85.0 6 649.5 10 741.0 Democratic People's Republic of Korea Nov/Oct 390.0 66.0 456.0 641.0 India Apr/Mar 6 030.9 0.0 6 030.9 1 915.7 Nepal Jul/Jun 964.2 2.0 966.2 820.8 Pakistan May/Apr 157.8 0.0 157.8 156.8
Near East 9 532.0 620.0 10 152.0 10 742.0 Afghanistan Jul/Jun 2 882.0 100.0 2 982.0 3 002.0 Syrian Arab Republic Jul/Jun 2 650.0 290.0 2 940.0 3 430.0 Yemen Jan/Dec 4 000.0 230.0 4 230.0 4 310.0
CENTRAL AMERICA AND THE CARIBBEAN 1 474.2 10.1 1 484.3 1 399.1 Haiti Jul/Jun 864.6 10.1 874.7 802.1 Nicaragua Jul/Jun 609.6 0.0 609.6 597.0
OCEANIA 483.3 0.0 483.3 504.0 Papua New Guinea Jan/Dec 420.2 0.0 420.2 440.2 Solomon Islands Jan/Dec 63.1 0.0 63.1 63.8
TOTAL 65 117.8 1 777.5 66 895.3 67 171.6
Source: FAO1 The Low-Income Food-Deficit Countries (LIFDCs) group includes net food deficit countries with annual per caput income below the level used by the World Bank to determine eligibility for IDA assistance (i.e. USD 1 985 in 2013); for full details see http://www.fao.org/countryprofiles/lifdc

38
GIEWS CROP PROSPECTS AND FOOD SITUATION #3
SEPTEMBER 2018
Table A5. Estimated cereal import requirements of Low-Income Food-Deficit Countries1 in 2018/19*(thousand tonnes)
2017/18 2018/19
Marketing yearCommercial purchases Food aid
Total imports (commercial and aid)
Total import requirements
(excl. re-exports)
AFRICA 4 517.6 294.2 4 811.8 4 548.0
Eastern Africa 1 704.0 201.0 1 905.0 1 825.0 Somalia Aug/Jul 760.0 190.0 950.0 920.0 United Republic of Tanzania Jun/May 944.0 11.0 955.0 905.0
Southern Africa 2 813.6 93.2 2 906.8 2 723.0 Lesotho Apr/Mar 163.1 14.0 177.1 245.9 Madagascar Apr/Mar 1 006.5 17.1 1 023.6 601.0 Malawi Apr/Mar 161.0 6.0 167.0 277.0 Mozambique Apr/Mar 1 115.0 1.0 1 116.0 1 246.0 Zimbabwe Apr/Mar 368.0 55.1 423.1 353.1
ASIA 24 492.5 393.0 24 885.5 21 887.8
CIS in Asia 4 818.2 1.0 4 819.2 4 882.2 Kyrgyzstan Jul/Jun 616.2 1.0 617.2 618.2 Tajikistan Jul/Jun 1 032.0 0.0 1 032.0 1 232.0 Uzbekistan Jul/Jun 3 170.0 0.0 3 170.0 3 032.0
Far East 13 632.3 2.0 13 634.3 10 163.6 Bangladesh Jul/Jun 10 741.0 0.0 10 741.0 8 350.0 India Apr/Mar 1 915.7 0.0 1 915.7 761.0 Nepal Jul/Jun 818.8 2.0 820.8 895.8 Pakistan May/April 156.8 0.0 156.8 156.8
Near East 6 042.0 390.0 6 432.0 6 842.0 Afghanistan Jul/Jun 2 902.0 100.0 3 002.0 3 452.0 Syrian Arab Republic Jul/Jun 3 140.0 290.0 3 430.0 3 390.0
CENTRAL AMERICA AND THE CARIBBEAN 1 389.0 10.1 1 399.1 1 492.1 Haiti Jul/Jun 792.0 10.1 802.1 835.1 Nicaragua Jul/Jun 597.0 0.0 597.0 657.0
TOTAL 30 399.1 697.3 31 096.4 27 927.9
Source: FAO
* Countries included in this table are only those that have entered the new marketing year.1 The Low-Income Food-Deficit Countries (LIFDCs) group includes net food deficit countries with annual per caput income below the level used by the World Bank to determine eligibility for IDA assistance (i.e. USD 1 985 in 2013); for full details see http://www.fao.org/countryprofiles/lifdc

39
GIEWS CROP PROSPECTS AND FOOD SITUATION #3
SEPTEMBER 2018

GIEWS CROP PROSPECTS AND FOOD SITUATION #3
SEPTEMBER 2018
GIEWS - Global Information and Early Warning System on Food and Agriculture
Crop Prospects and Food Situation is published by the Trade and Markets Division of FAO under the Global Information and Early Warning System on Food and Agriculture (GIEWS). It is published four times a year and focuses on developments affecting the food situation of developing countries and the Low-Income Food-Deficit Countries (LIFDCs) in particular. The report provides a review of the food situation by geographic region, a section dedicated to the LIFDCs and a list of countries requiring external assistance for food. It also includes a global cereal supply and demand overview to complement the biannual analysis in the Food Outlook publication. Crop Prospects and Food Situation is available in English, French and Spanish in electronic format.
This report is based on information available as of August 2018.
Enquiries may be directed to: Global Information and Early Warning System on Food and Agriculture (GIEWS) Trade and Markets Division (EST) Food and Agriculture Organization of the United Nations (FAO) Viale delle Terme di Caracalla 00153 Rome - Italy E-mail: [email protected]
Crop Prospects and Food Situation and other GIEWS reports are available online at: www.fao.org/giews/.
The Global Information and Early Warning System on Food and Agriculture (GIEWS) has set up a mailing list to disseminate its reports.
To subscribe, send an email to FAO’s mail server [email protected]. Leave the subject blank and then put in the first line of the message the following:
subscribe GIEWSAlertsWorld-L
To unsubscribe from the GIEWSAlertsWorld-L list, put in the first line of the message the following:
unsubscribe GIEWSAlertsWorld-L
GIEWS continuously monitors crop prospects and food security situation at global, regional, national and sub-national levels and warns of impending food difficulties and emergencies. Established in the wake of the world food crisis of the early 1970’s, GIEWS maintains a unique database on all aspects of food supply and demand for every country of the world. GIEWS regularly provides policy makers and the international community with up-to-date information so that timely interventions can be planned and suffering avoided.
CA1487EN/1/09.18
ISBN 978-92-5-130948-3
9 7 8 9 2 5 1 3 0 9 4 8 3