Embed Size (px)
Citation preview
31 Atomic Physics31 Atomic Physics
Outline
31-1 Early Models of the Atom
31 2 The Spectrum of Atomic Hydrogen31-2 The Spectrum of Atomic Hydrogen
31-3 Bohr’s Model of the Hydrogen Atom
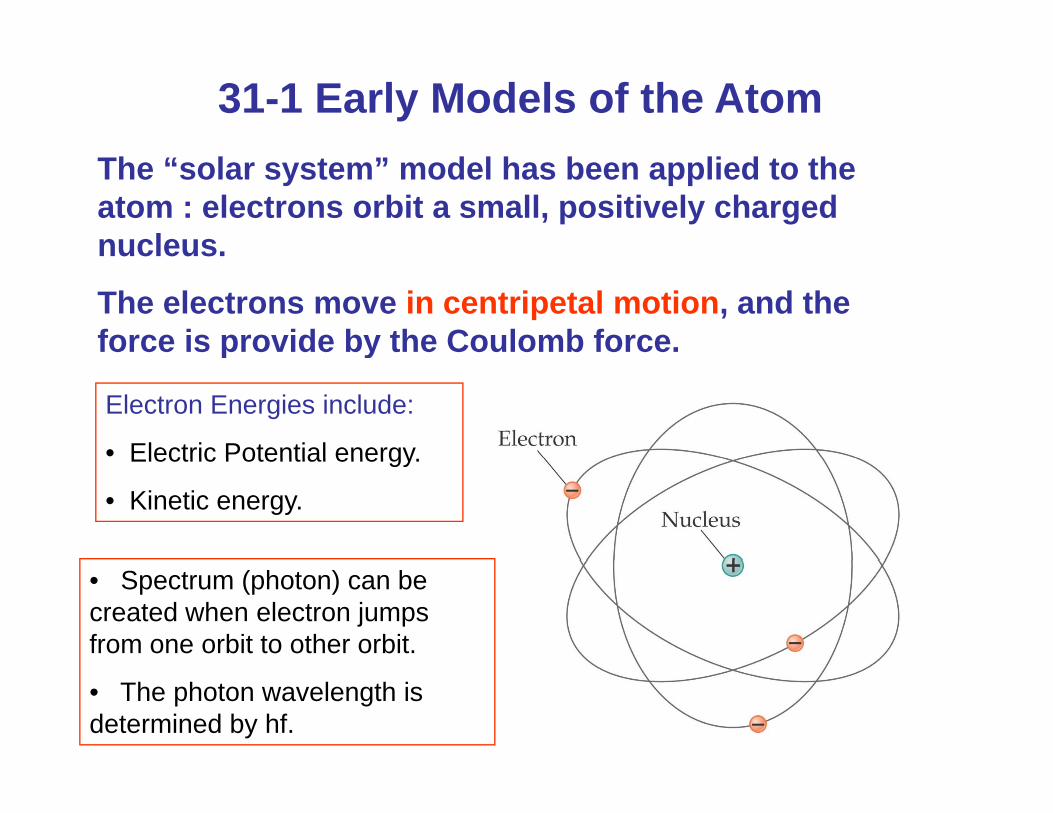
31-1 Early Models of the AtomThe “solar system” model has been applied to the atom : electrons orbit a small, positively charged nucleus.nucleus.
The electrons move in centripetal motion, and the force is provide by the Coulomb force.p y
Electron Energies include:
• Electric Potential energyElectric Potential energy.
• Kinetic energy.
• Spectrum (photon) can be created when electron jumps from one orbit to other orbit.
• The photon wavelength is determined by hf.
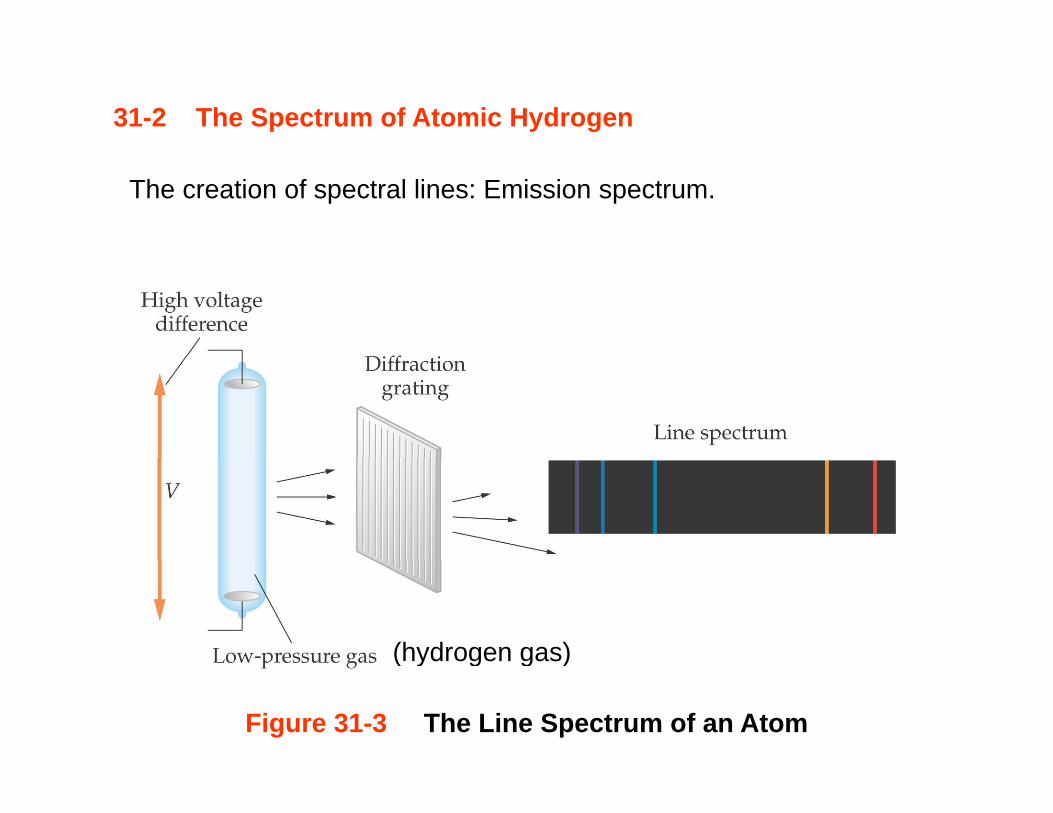
31-2 The Spectrum of Atomic Hydrogen
The creation of spectral lines: Emission spectrum.
(hydrogen gas)
Figure 31-3 The Line Spectrum of an Atom
( y g g )
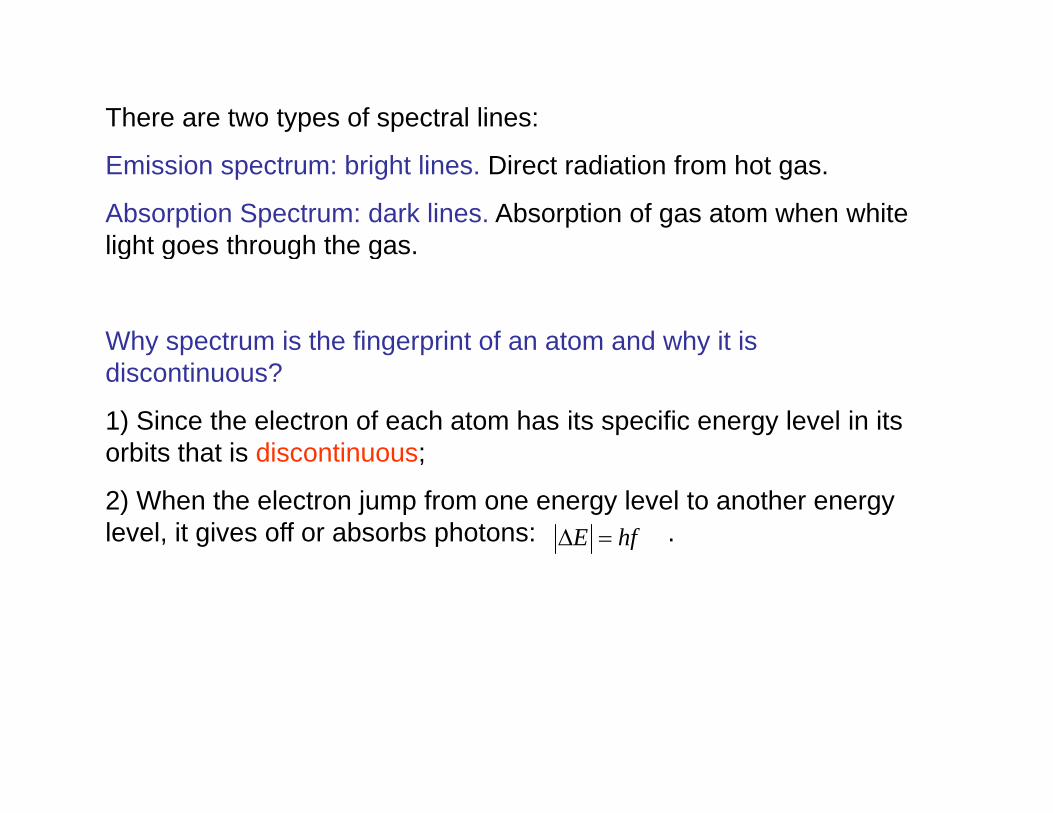
There are two types of spectral lines:
Emission spectrum: bright lines. Direct radiation from hot gas.
Absorption Spectrum: dark lines. Absorption of gas atom when white light goes through the gas.light goes through the gas.
Why spectrum is the fingerprint of an atom and why it is discontinuous?
1) Since the electron of each atom has its specific energy level in its orbits that is discontinuous;orbits that is discontinuous;
2) When the electron jump from one energy level to another energy level, it gives off or absorbs photons: . E hfΔ =

Figure 31-4 The Line Spectrum of Hydrogen
Emission spectrum lines (a);
absorption spectrum lines (b).
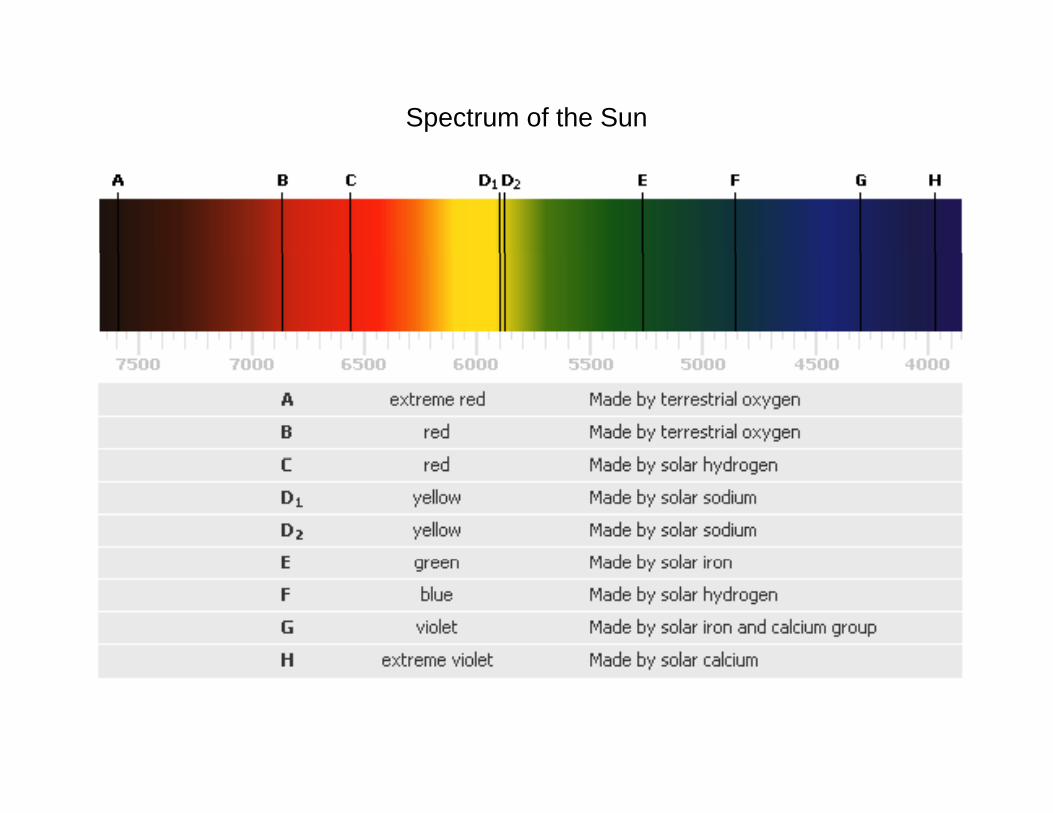
Spectrum of the Sun

(In 1885) Swiss school teacher, Balmer developed an empirical formula for the calculation Hydrogen spectrum lines. This formula is o u a o t e ca cu at o yd oge spect u es s o u a sexpressed as:
111 131)(,5,4,3),121(1
22 −⋅⋅⋅⋅=−= seriesBalmernn
Rλ
Unit: meter.
Where R is Rydberg constant:
R = 1.097 x 10⁷ m-1
The collection of lines by the above formula is called Balmer series.
For example, n=5:
m 2217 )
51
21)(10097.1(1 − −×=
λmso 710341.4,52
−×=λλ
Example 31-1 The Balmer Series
Find the longest and shortest wavelengths in the Balmer series of the spectral lines.
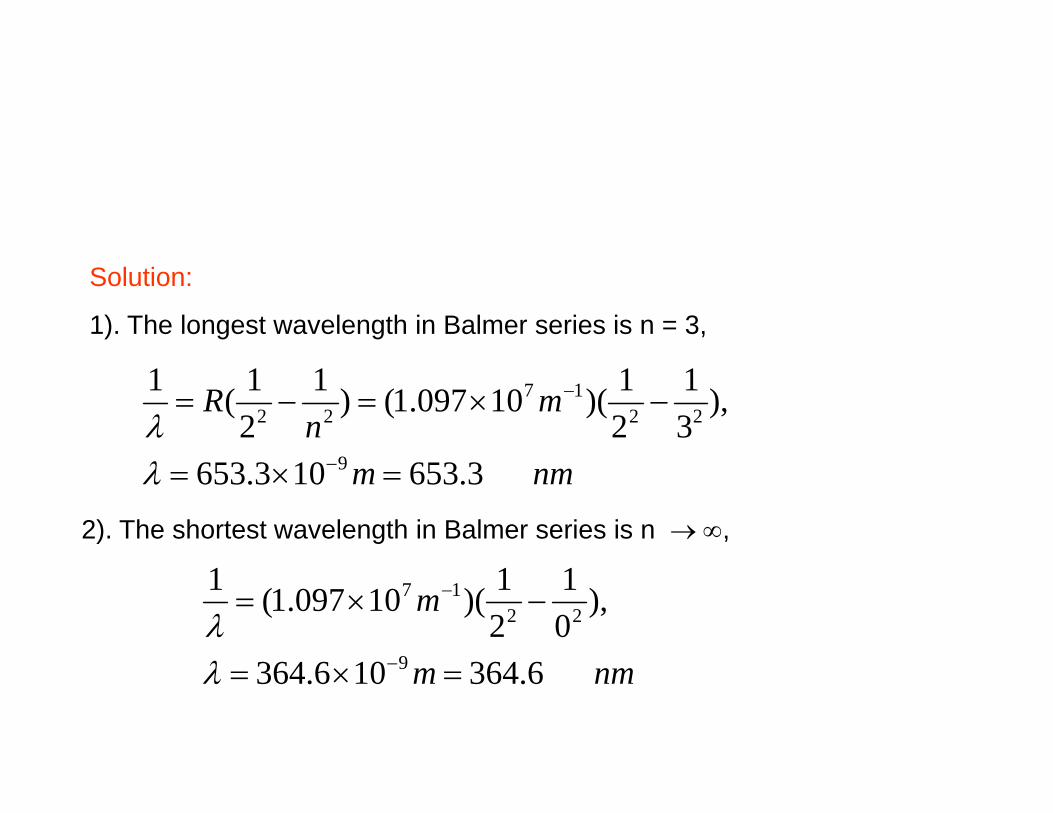
Solution:
1). The longest wavelength in Balmer series is n = 3,
mn
R ),31
21)(10097.1()1
21(1
9
2217
22 −×=−= −
λnmm 3.653103.653 9 =×= −λ
2). The shortest wavelength in Balmer series is n → ∞,
m
6364106364
),01
21)(10097.1(1
9
2217 −×= −
λλ
nmm 6.364106.364 9 =×= −λ
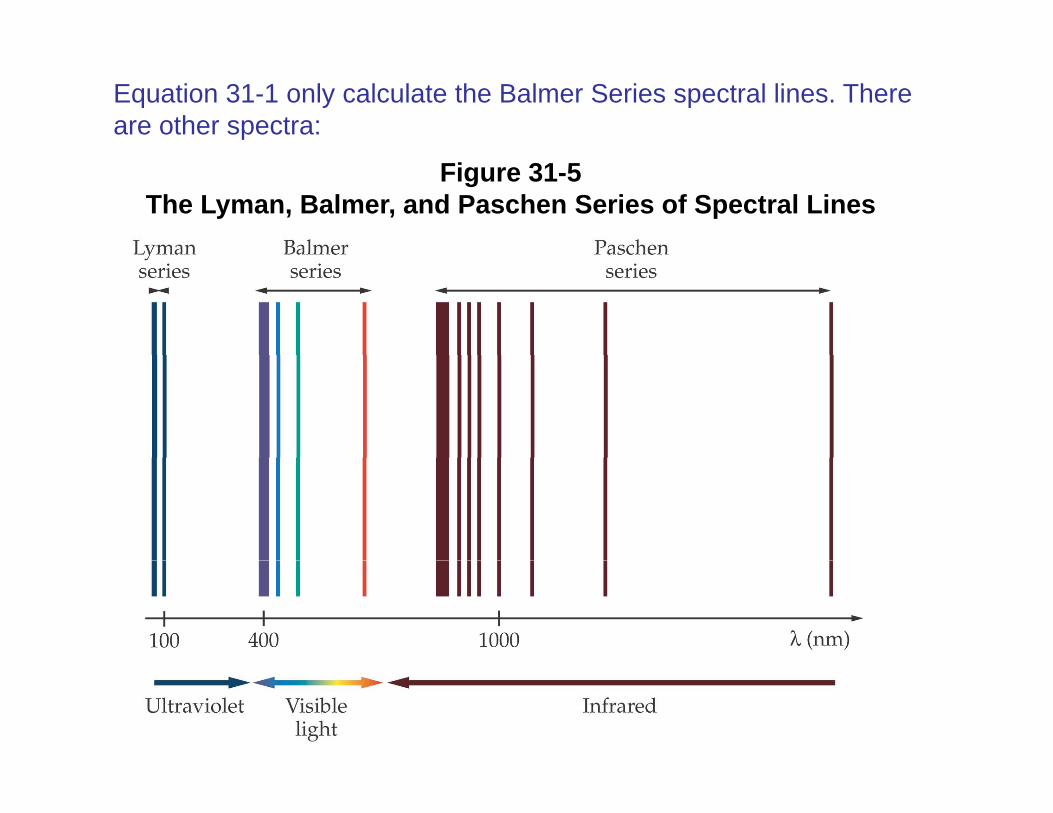
Equation 31-1 only calculate the Balmer Series spectral lines. There are other spectra:
Figure 31-5The Lyman, Balmer, and Paschen Series of Spectral Lines
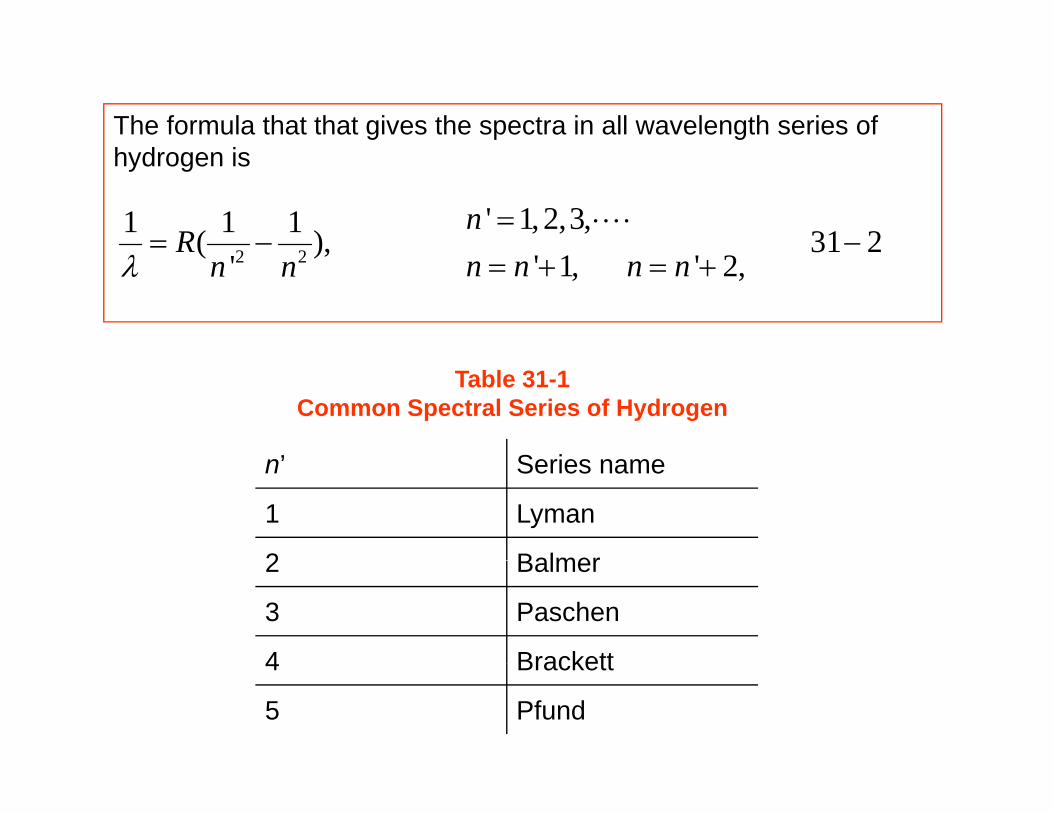
The formula that that gives the spectra in all wavelength series of h d ihydrogen is
2 2
' 1, 2,3,1 1 1( ), 31 2n
R= ⋅⋅⋅⋅
= − −2 2( ),' 1, ' 2,' n n n nn nλ = + = +
’ S i
Table 31-1Common Spectral Series of Hydrogen
n’ Series name
1 Lyman
2 Balmer2 Balmer
3 Paschen
4 Brackett4 Brackett
5 Pfund

Exercise 31-1
Find (a) the shortest wavelengths in the Lyman series and (b) the longest wavelength in the Paschen series.
Exercise 31-1
Find (a) the shortest wavelengths in the Lyman series and (b) the longest wavelength in the Paschen series.
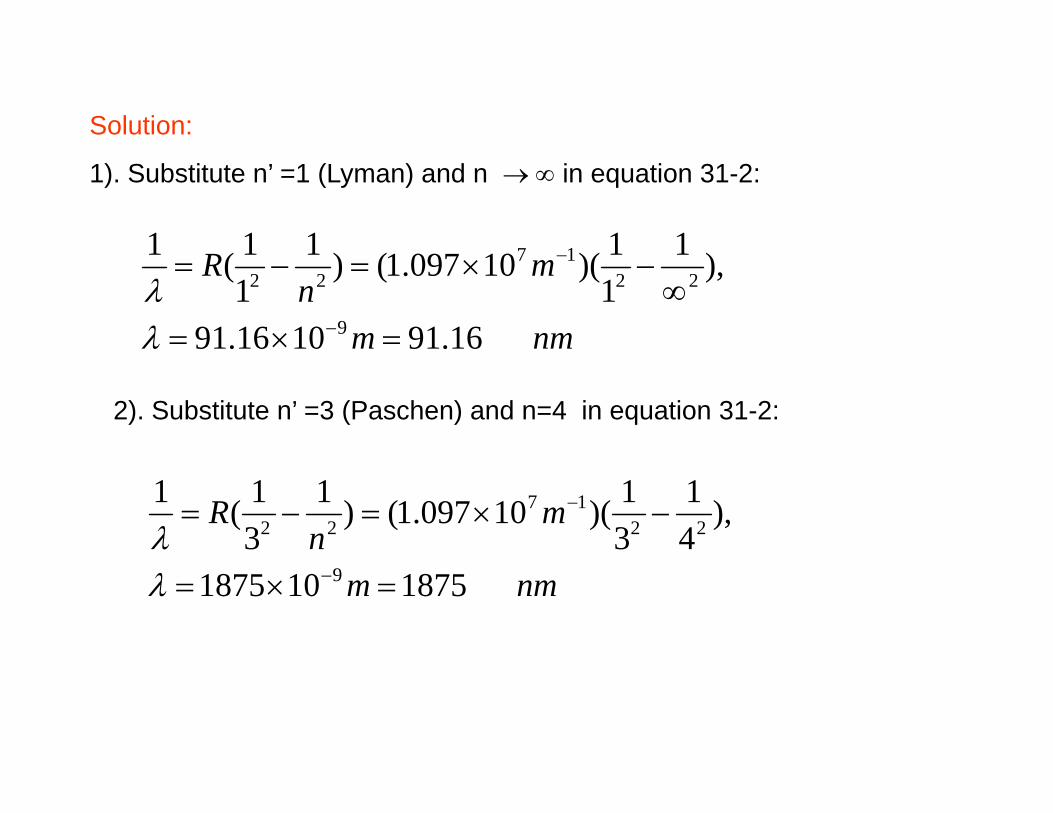
Solution:
1). Substitute n’ =1 (Lyman) and n → ∞ in equation 31-2:
)11)(()11(1 17
nmm
mn
R
16.911016.91
),111)(10097.1()1
11(1
9
2217
22
=×=∞
−×=−=
−
−
λλ
2). Substitute n’ =3 (Paschen) and n=4 in equation 31-2:
mn
R ),41
31)(10097.1()1
31(1
2217
22 −×=−= −
λnmm 1875101875 9 =×= −λ
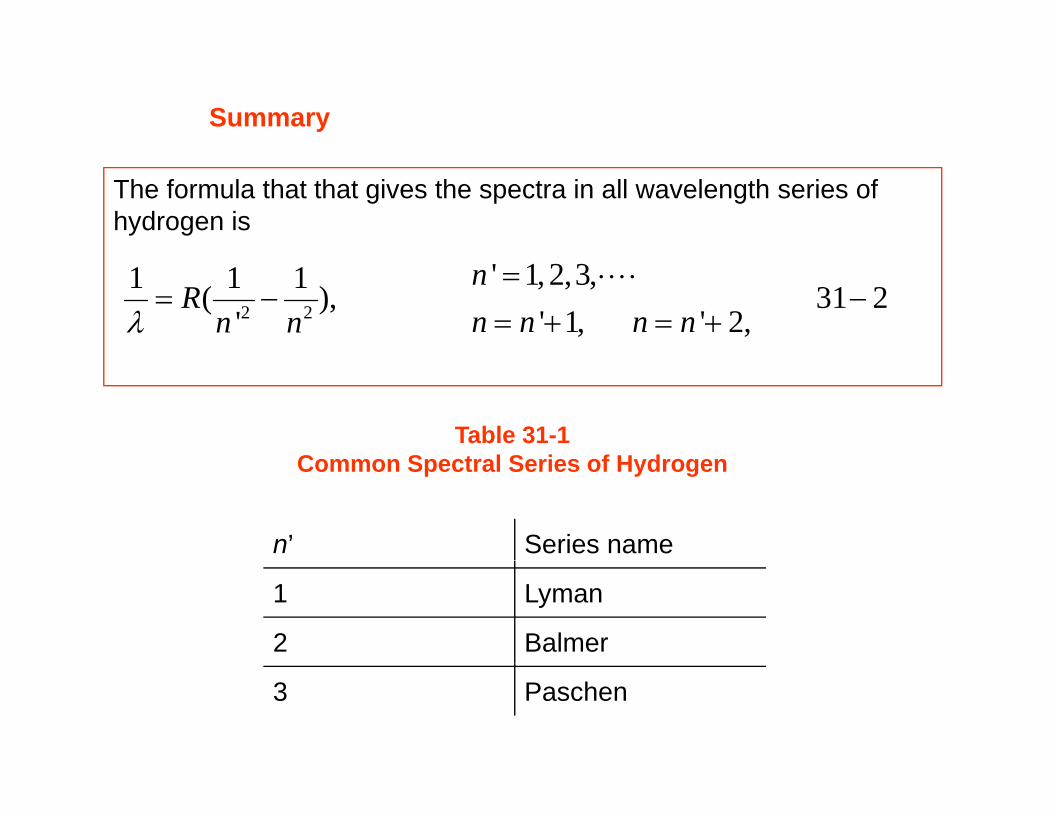
Summary
The formula that that gives the spectra in all wavelength series of hydrogen is
2 2
' 1, 2,3,1 1 1( ), 31 2' 1, ' 2,'
nR
n n n nn nλ= ⋅⋅⋅⋅
= − −= + = +
Table 31-1C S t l S i f H d
n’ Series name
Common Spectral Series of Hydrogen
1 Lyman
2 Balmer
3 Paschen