Embed Size (px)
Citation preview
3.1 BUSINESS HIGHLIGHTS IN 2017 48Highlights of 2017 48Other business activities in 2017 49
3.2 CONSOLIDATED NET INCOME REVIEW 51Sales 51Recurring operating income and recurring operating margin 54Net financial income (expense) 56Tax rate 56Recurring net income – Group share and Recurring EPS 56Additional information on consolidated income statement: transition from reported to like-for-like figures 58Dividend paid in respect of 2017 fiscal year 58
3.3 FREE CASH FLOW 59Free cash flow 59Consolidated statement of cash flows 60
3.4 BALANCE SHEET AND FINANCIAL SECURITY REVIEW 61Simplified consolidated balance sheet 61Financing structure and financial security 61Liabilities related to put options granted to non-controlling interests 63Net debt and net financial debt 63Shareholder’s equity 65Off-balance sheet commitments 65
3.5 OUTLOOK 2018 66Material change in financial or trading position 66Subsequent events 66Outlook for 2018 66
3.6 FINANCIAL INDICATORS NOT DEFINED IN IFRS 67
3.7 DOCUMENTS AVAILABLE TO THE PUBLIC 70

3
3BUSINESS HIGHLIGHTS IN 2017 AND OUTLOOK FOR 2018

BUSINESS HIGHLIGHTS IN 2017 AND OUTLOOK FOR 20183.1 BUSINESS HIGHLIGHTS IN 2017
DANONE REGISTRATION DOCUMENT 201748
Danone’s consolidated financial statements and the Notes to the consolidated financial statements are presented in section 4.1 Consolidated financial statements and Notes to the consolidated financial statements. Risk identification and control policy, as well as the major operational risks relating to Danone’s business sectors or to its activity and organization, are described in section 2.7 Risk factors.
Amounts are expressed in millions of euros and rounded to the nearest million. As a rule, the values presented are rounded to the nearest unit. Consequently, the sum of the rounded amounts may differ, albeit to an insignificant extent, from the reported total. In addition, ratios and variances are calculated based on the underlying amounts and not on the rounded amounts.
Danone reports on financial indicators not defined by IFRS, internally (among indicators used by the chief operating decision makers) and exter-nally. These indicators are defined in section 3.6 Financial indicators not defined in IFRS:
• Like-for-like New Danone changes (or “Like-for-like including WhiteWave starting in April 2017” changes) in sales and the recurring operating margin;
• recurring operating income;
• recurring operating margin;
• recurring tax rate;
• recurring net income;
• recurring EPS;
• recurring EPS growth excluding Yakult Transaction Impact;
• free cash flow;
• net financial debt.
The Group also uses references that are defined in section 1.2 Information about the Registration Document related to References and definitions.
3.1 BUSINESS HIGHLIGHTS IN 2017
HIGHLIGHTS OF 2017Highlights were detailed in the main press releases issued by Danone during 2017.
• On February 15, Danone announced the launch of Protein, an efficiency program aimed at delivering €1 billion in sustainable savings by 2020;
• On April 12, Danone announced the completion of the WhiteWave acquisition. The respective activities of Danone and WhiteWave in North America were combined into a single entity called DanoneWave;
• On May 18, during the Investor Seminar that it held in Évian (France), Danone outlined its financial targets for 2020 (see section 2.3. Strategic priorities);
• On June 22, Danone launched One Planet. One Health a new corporate signature reflecting its vision that our health is connected with and interdependent on the health of our planet;
• On July 3, Danone announced the disposal of Stonyfield to Lactalis for $875 million;
• On October 18, Danone announced that Emmanuel FABER had been appointed Chairman and Chief Executive Officer of Danone effective December 1st. Frank RIBOUD becomes Honorary President of Danone and remains a Director of the company. Danone also announced a new, tighter Executive Committee;
• On October 23, Danone launched a €1.25 billion hybrid bond issue and early redeemed WhiteWave’s $500 million senior notes, with a 5.375% coupon;
• On November 30, 2017, Danone was awarded damages of €105 million to be paid immediately by Fonterra for costs suffered because of the Fonterra food safety failures of 2013;
• On December 14, the Board of Directors of Danone proposed that Michel LANDEL be appointed as Lead Independent Director.

3
BUSINESS HIGHLIGHTS IN 2017 AND OUTLOOK FOR 20183.1 BUSINESS HIGHLIGHTS IN 2017
DANONE REGISTRATION DOCUMENT 2017 49
OTHER BUSINESS ACTIVITIES IN 2017Acquisitions, disposal of shares in companiesMain changes in fully consolidated companies
Ownership as of December 31
(in percentage) Division Country Transaction date (a) 2016 2017
Main companies consolidated for the first time during 2013
WhiteWave companiesEDP International
and EDP Noram
Several countries, of which mainly
the United States and Europe April − 100.0%
Main consolidated companies with change in ownership percentage
Danone-Unimilk entity EDP International CIS zone October 92.9% 97.6%
Happy FamilySpecialized
Nutrition United States July 91.9% 100.0%
Main companies that are no longer fully consolidated as of December 31
Stonyfield EDP Noram United States July 100.0% −
(a) Month of fiscal 2017.
Main changes in investments in associatesThe Group did not experience any material changes during the period.
Reduction of carbon footprintSee also section 5.4 Contributing to the protection of the environment.
Social and societal responsibilityThese activities are described in paragraph 5 Social, societal and environmental responsibility.
New phase in the transformation of DanoneA new organization to create the best conditions for growth and efficiencyDanone has decided to adapt the Company’s organization to become more agile at managing fast-moving trends and markets and bring relevant decision-making closer to local markets and consumers.
The three main organization principles are:
• 30 One Danone clusters;
• An empowered leadership team of 15 regional business Vice Presidents who are currently in charge of executing the busi-nesses’ regional agendas and are accountable for results in their region, and that will be the best point of leverage to make decisions as close as possible to consumers. By delegating extended responsibility to RVPs, Danone will ensure its new Executive Committee is completely focused on strategic topics.
• A tighter Executive Committee team, to increase efficiency and support more agile decision-making against the backdrop of rapid changes in the food sector. The new Executive Committee, as of 2018, is composed of three executives with operational responsibilities and three executives with functional responsi-bilities, under the leadership of Emmanuel FABER (see Section 6.1 Governance bodies).
Protein: launch of a €1 billion efficiency programAt the beginning of the year Danone announced the launch of Protein, an ambitious efficiency program aimed at delivering €1 billion in sustainable savings by 2020 by making smarter spending choices. At the end of 2017, 10 out of 30 clusters, representing more than 50% of the targeted cost base, had been activated. Procedures, governance, best practices and tools have been put in place to start delivering savings in 2018.
GovernanceRefer to sections 6.1 Governance Bodies and 6.2 Positions and responsibilities of the Directors and Nominees to the Board of Directors
BUSINESS HIGHLIGHTS IN 2017 AND OUTLOOK FOR 20183.1 BUSINESS HIGHLIGHTS IN 2017
DANONE REGISTRATION DOCUMENT 201750
Research and InnovationEssential Dairy and Plant-BasedIn 2017, Danone continued its research activities on the impact of yoghurt consumption on food and health; which has been confirmed by academic research studies covering, in particular:
• the relationship between yoghurt consumption and a better diet;
• the potential mechanisms of action that could explain the benefits of yogurt on cardio-metabolic risk and type 2 diabetes;
• the link between yogurt consumption and a better lifestyle among children in Europe.
In addition, in collaboration with scientific institutions such as INRA (French National Institute for Agricultural Research) in Paris, and Harvard University T.H. Chan School of Public Health in Boston, USA, Danone also continued its work on understanding the intestinal flora: its evolution and the impact of diet or probiotics on flora richness.
Lastly, Danone has maintained its plan to reduce the sugar content of all its products and redesign its brands, particularly with the launch of reseable Danonino flask. Easy to carry, the bottle can be kept outside the fridge for eight hours without spoiling and contains only 4.9g of added sugar per serving.
In the field of innovation, the development of strong positions in the Greek yogurt segment in the United States continued, with the deployment of range extensions on Oikos Triple Zero and Light & Fit. Danone has also been accelerating the development of its ranges in the indulgence segment, with an extension in Russia of the Danissimo range, which offers products to drink with a straw in innovative packaging.
Lastly, the Danone brand was relaunched in France and Spain in the last quarter of 2017, with simplified recipes, 100% natural ingredi-ents, and a new visual identity. Danone created the “1919” range, inspired by the original recipe based on whole milk and offered in four flavors: Plain, Orange Blossom, Vanilla and Cane Sugar.
WatersIn 2017, with a view to converting consumers to healthier hydration practices, the Waters Research and Innovation department con-tinued its efforts on aquadrinks and the packaging of its products:
• aquadrinks offerings have been enriched with new varieties to better meet the needs of consumers. Danone carried on with its efforts to reduce the sugar content of its products, for instance Bonafont products for children come with no added sugar and no artificial sweeteners. Danone has created new ranges: evian, in collaboration with KUSMI TEA, launched an infusion made from white tea and natural mineral water with no preservatives,
artificial flavors or sweeteners; a range of orangeade drinks was born in Argentina; the “Mizone Mi Pro” range and the Lemonade brand, targeted at millennials, were launched in China.
• in terms of packaging, Danone is continuing to develop the 100% vegetable and 100% recyclable plastic bottle by partnering with Nestlé Waters and California-based Origin Materials, a specialist in bio-sourced plastics (see section 5.4. Contribute to the protection of the environment. In addition, Danone continues innovating to improve the convenience of packaging, as illustrated by the new Volvic bottles (500 ml).
Danone is also continuing its scientific research on hydration and the benefits of water consumption on health.
Early Life NutritionDanone has continued its research on nutrition in the first 1,000 days, from the conception until the child’s second year, in particular in the following areas:
• development of healthy eating habits and the impact of nutrition on the immune system development;
• development of the intestinal function and microbiota;
• metabolism of infants and young children (to gain a better un-derstanding of the impact of nutrition on growth);
• the benefits of breast milk and breastfeeding;
• development of products and technologies.
To achieve this, Danone Nutricia Research works closely with a global network of thought leaders in specific areas: health experts, scientists and decision-makers, to create customized and nutritionally optimal products for every step of the 1,000 first days.
Advanced Medical NutritionResearch and Innovation in the Advanced Medical Nutrition Business aims to develop products with nutritional contributions to help people live longer and healthier.
Danone’s teams focus on the development of medical nutrition products adapted to specific diseases or specific clinical situations: allergies, Alzheimer’s disease, critical care, epilepsy, low growth and neuro and psychomotor disorders, inborn errors of metabolism, oncology, physical fragility, stroke and dysphagia.
In these areas, Danone is doing joint research with a variety of partners in the scientific community. In 2017, the results of a study on cow’s milk allergies (Assign) were published in the scientific journal Pediatric Research.
Legal and arbitration proceedingsThe Company and its subsidiaries are parties to legal proceedings arising in the normal course of business, in particular by compe-tition authorities in certain countries. Provisions are recognized when an outflow of resources is probable and the amount can be reliably estimated.
Proceedings relating to the false alarm given by Fonterra with respect to certain ingredients supplied to the Group in Asia in 2013Danone has reviewed its recourse and compensation options and decided to initiate proceedings in the New Zealand High Court, as well as arbitration proceedings in Singapore to bring all facts to light and to obtain compensation for the harm it has suffered. Proceedings are still in progress.

3
BUSINESS HIGHLIGHTS IN 2017 AND OUTLOOK FOR 20183.2 CONSOLIDATED NET INCOME REVIEW
DANONE REGISTRATION DOCUMENT 2017 51
On November 30, 2017, the Singapore arbitration court awarded Danone damages of €105 million (excluding costs and interest to be determined subsequently) to be paid immediately by Fonterra as compensation for the costs suffered as a result of the Fonterra food safety failures of 2013.
The full amount of this €105 million income was therefore recog-nized in 2017, in Other operating income (expense) in the income
statement and in Cash flows provided by operating activities in the consolidated statement of cash flows.
Other proceedingsTo the best of the Danone’s knowledge, no other governmental, court or arbitration proceedings are currently ongoing that are likely to have, or have had in the past 12 months, a material impact on the Danone’s financial position or profitability.
Major contracts and related party transactionsDanone granted put options to third parties with non-controlling interests in certain consolidated subsidiaries, with these options giving the holders the right to sell part or all their investment in these subsidiaries.
As of December 31, 2017, financial liabilities related to these options totaled €607 million and are classified as financial debt.
Related party transactions are described in Note 15 of the Notes to the consolidated financial statements.
See also section 6.6 Related party agreements and commitments.
3.2 CONSOLIDATED NET INCOME REVIEWYear ended December 31
(in millions of euros unless stated otherwise) 2016 2017 Reported changes
Like-for-like New Danone changes (a)
Sales 21,944 24,677 12.5% 2.5%
Recurring operating income (a) 3,022 3,543 17.2% 7.8%
Recurring operating margin (a) 13.77% 14.36% +58bps +70bps
Operating income 2,923 3,734 27.7%
Operating margin 13.32% 15.13% +180bps
Recurring net income – Group share (a) 1,911 2,190 14.6%
Net income – Group share 1,720 2,453 42.6%
Recurring EPS (in €) (a) 3.10 3.49 12.6%
EPS (in €) 2.79 3.91 40.1%
Free cash flow (a) 1,760 2,083 18.4%
Cash flow from operating activities 2,652 2,958 11.5%
(a) Refer to definition in section 3.6 Financial indicators not defined in IFRS.
SALESConsolidated salesIn 2017, consolidated sales were €24,677 million, up +2.5% on a like-for-like New Danone basis. The sales growth included a +3.9% rise in value showing continued mix and value enhancement in all Reporting entities, which offset a -1.4% decline in volume mainly driven by EDP International.
Full-year reported sales were up +12.5% vs. 2016, including:
• the base effect corresponding to the consolidation of WhiteWave from April 12, 2017 (+12.7%);
• other changes in the scope of consolidation (-1.1%), resulting primarily from the disposal of Stonyfield (August 2017);
• negative currency impact (-1.6%) reflecting the appreciation of the euro against the US dollar, the Turkish lira and the British pound.

BUSINESS HIGHLIGHTS IN 2017 AND OUTLOOK FOR 20183.2 CONSOLIDATED NET INCOME REVIEW
DANONE REGISTRATION DOCUMENT 201752
Sales by Reporting entityYear ended December 31
(in € millions except percentage) 2016 2017Sales
growth (a) Volume
growth (a)
EDP International 8,229 8,424 (1.3)% (6.1)%
EDP Noram 2,506 4,530 (2.0)% (1.8)%
Specialized Nutrition 6,634 7,102 9.3% 3.0%
Waters 4,574 4,621 4.7% 1.4%
Total 21,944 24,677 2.5% (1.4)%
(a) Like-for-like New Danone.
EDP InternationalSalesEDP International recorded sales of €8,424 million in 2017, down -1.3% on a like-for-like New Danone basis. This variation resulted from a -6.1% decline in volume partly offset by a +4.8% increase in value. The performance improved in Europe in the second half of the year, but operations in Brazil remained under pressure. Excluding Brazil, EDP International posted positive sales growth in 2017.
Main MarketsSales growth in Europe (excluding Alpro) was negative in 2017, despite the gradual improvement since the second quarter, with a different pace of recovery from one country to another. Activia started showing clear signs of progress in several major countries (France, Spain, United Kingdom and Italy) in the fourth quarter. The relaunch in the third quarter of the flagship Danone brand, with a new and enhanced brand stature, also contributed to this positive trend, in particular in France. Danone continued to expand successfully in Europe its portfolio of young and local-heritage brands, including Light&Free in the UK or Les Deux Vaches in France.
Sales of Alpro, now the second-largest EDP International brand in Europe, rose nearly 10% in 2017, driven by robust demand for nut-based beverages and plant-based alternatives to yogurt. Alpro is the market leader in its top-four countries — the UK, Germany, Belgium and the Netherlands.
In Latin America, sales growth was solid in 2017, supported by the good performance of Mexico. Operations in Brazil remained under pressure with a double-digit sales decline. The ongoing restructuring of the portfolio and distribution network is continuing although it will take time to complete.
In the CIS region, Danone reported solid growth, driven by the strong performance of premium brands like Actimel, Danissimo and the added value segment of Prostokvashino, sustained by a pipeline of major innovations.
EDP NoramSalesEDP Noram recorded sales of €4,530 million in 2017, down -2.0% on a like-for-like New Danone basis. This variation resulted from a decrease in volume of -1.8% and a -0.2% decline in value. The performance of the Reporting Entity has improved gradually since the acquisition of WhiteWave. EDP Noram recorded positive growth in the fourth quarter excluding Fresh Foods.
Main MarketsIn Yogurts, Danone continued to outperform the US retail market and posted market share gains. Further progress was made against strategic priorities, including the execution of the Non-GMO Pledge in the US, with around 90% of Danimals and Dannon brands almost entirely converted as of end 2017; the improved distribution of Silk and So Delicious plant-based yogurts; and the successful delivery of a large pipeline of innovations. In particular, Danone introduced in the fourth quarter the first whole-milk organic yogurts for kids and babies under the Happy Family brand, a new Light & Fit pack-aging design, as well as the first indulgence yogurt sold under the International Delight brand.
Coffee Creamers enjoyed good momentum throughout the year, driven by market share gains across the product portfolio. Effective marketing and innovation were key drivers of the performance.
Plant-based foods and beverages delivered positive growth in 2017, with a significant improvement in the second half, driven by a steep rise in Silk nut-based beverages, as well as continued strong growth of the Vega nutrition brand and So Delicious frozen desserts and novelties.
Premium Dairy sales declined sharply in 2017 as a result of the severe impact of the over-supply of organic milk in the industry. The entire industry was challenged in 2017 due to the abnormally high disparity in retail prices between organic and conventional milk and the recovery will take time. Danone has started to reduce its organic milk supply, reallocating the surplus to other products in its portfolio, and driving demand through innovations around differentiated milks, such as the Horizon Grassfed product line.
Lastly, sales in the Fresh Foods category contracted. Danone has started to implement a turnaround plan with further cost cutting initiatives.
Specialized NutritionSalesSpecialized Nutrition posted sales of €7,102 million in 2017, up +9.3% on a like-for-like New Danone basis. This growth resulted from a +3.0% increase in volume and a +6.3% increase in value. Early Life Nutrition posted a very strong performance in 2017 with sales growth of around 10%. The Advanced Medical Nutrition business saw its sales rise by more than +5%.
3
BUSINESS HIGHLIGHTS IN 2017 AND OUTLOOK FOR 20183.2 CONSOLIDATED NET INCOME REVIEW
DANONE REGISTRATION DOCUMENT 2017 53
Main MarketsEarly Life Nutrition sales increased by around +10% on a full-year basis, driven by very strong sales in China. The performance reflect-ed the rebound in Chinese demand as well as market share gains across all direct distribution channels, resulting from successful innovation and brand activation plans around Aptamil and Nutrilon brand platforms. Danone continued to focus on building a sustain-able direct sales model in China. Outside China, sales were stable in Europe and momentum remained strong in Latin America and North America. Danone continued the development of its Tailored Nutrition products, which delivered full-year sales growth of around +10%, driven by Indonesia, Russia and the UK.
Advanced Medical Nutrition delivered mid-to-high-single digit sales growth, driven by all regions and all product segments (adult and pediatric care), with visible gains in brands such as Neocate, Nutrison and Nutrini, and supported by very strong growth in China.
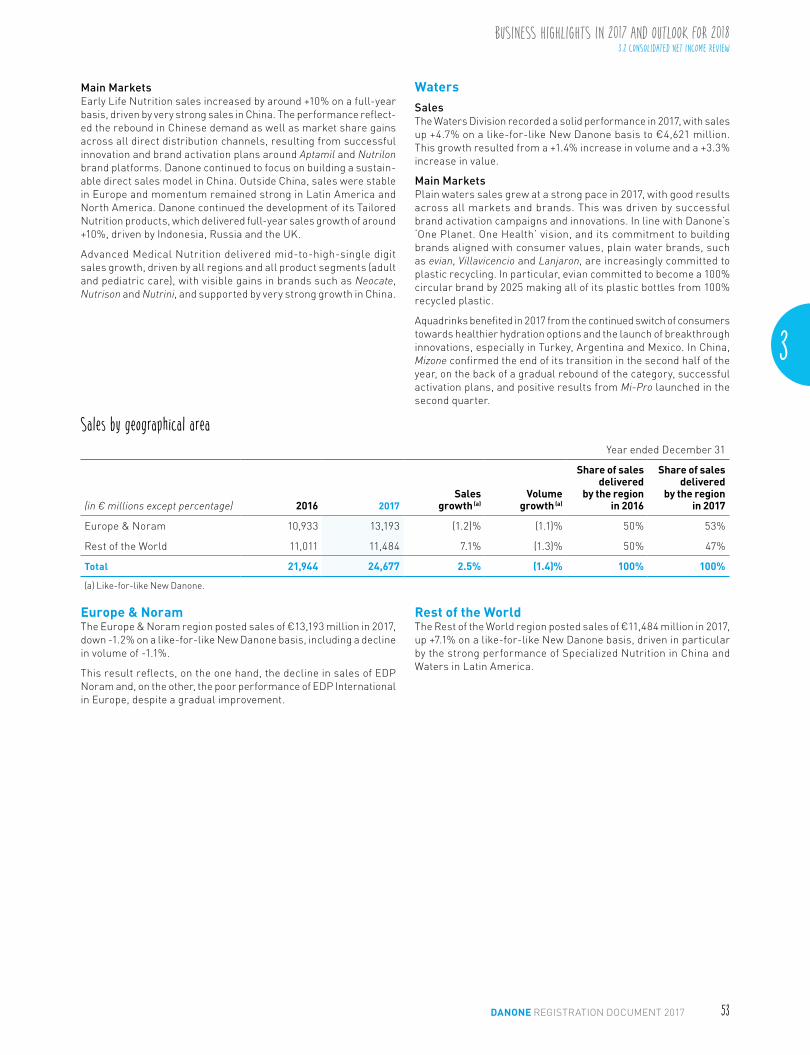
WatersSalesThe Waters Division recorded a solid performance in 2017, with sales up +4.7% on a like-for-like New Danone basis to €4,621 million. This growth resulted from a +1.4% increase in volume and a +3.3% increase in value.
Main MarketsPlain waters sales grew at a strong pace in 2017, with good results across all markets and brands. This was driven by successful brand activation campaigns and innovations. In line with Danone’s ‘One Planet. One Health’ vision, and its commitment to building brands aligned with consumer values, plain water brands, such as evian, Villavicencio and Lanjaron, are increasingly committed to plastic recycling. In particular, evian committed to become a 100% circular brand by 2025 making all of its plastic bottles from 100% recycled plastic.
Aquadrinks benefited in 2017 from the continued switch of consumers towards healthier hydration options and the launch of breakthrough innovations, especially in Turkey, Argentina and Mexico. In China, Mizone confirmed the end of its transition in the second half of the year, on the back of a gradual rebound of the category, successful activation plans, and positive results from Mi-Pro launched in the second quarter.
Sales by geographical areaYear ended December 31
(in € millions except percentage) 2016 2017Sales
growth (a)Volume
growth (a)
Share of sales delivered
by the region in 2016
Share of sales delivered
by the region in 2017
Europe & Noram 10,933 13,193 (1.2)% (1.1)% 50% 53%
Rest of the World 11,011 11,484 7.1% (1.3)% 50% 47%
Total 21,944 24,677 2.5% (1.4)% 100% 100%
(a) Like-for-like New Danone.
Europe & NoramThe Europe & Noram region posted sales of €13,193 million in 2017, down -1.2% on a like-for-like New Danone basis, including a decline in volume of -1.1%.
This result reflects, on the one hand, the decline in sales of EDP Noram and, on the other, the poor performance of EDP International in Europe, despite a gradual improvement.
Rest of the WorldThe Rest of the World region posted sales of €11,484 million in 2017, up +7.1% on a like-for-like New Danone basis, driven in particular by the strong performance of Specialized Nutrition in China and Waters in Latin America.
BUSINESS HIGHLIGHTS IN 2017 AND OUTLOOK FOR 20183.2 CONSOLIDATED NET INCOME REVIEW
DANONE REGISTRATION DOCUMENT 201754
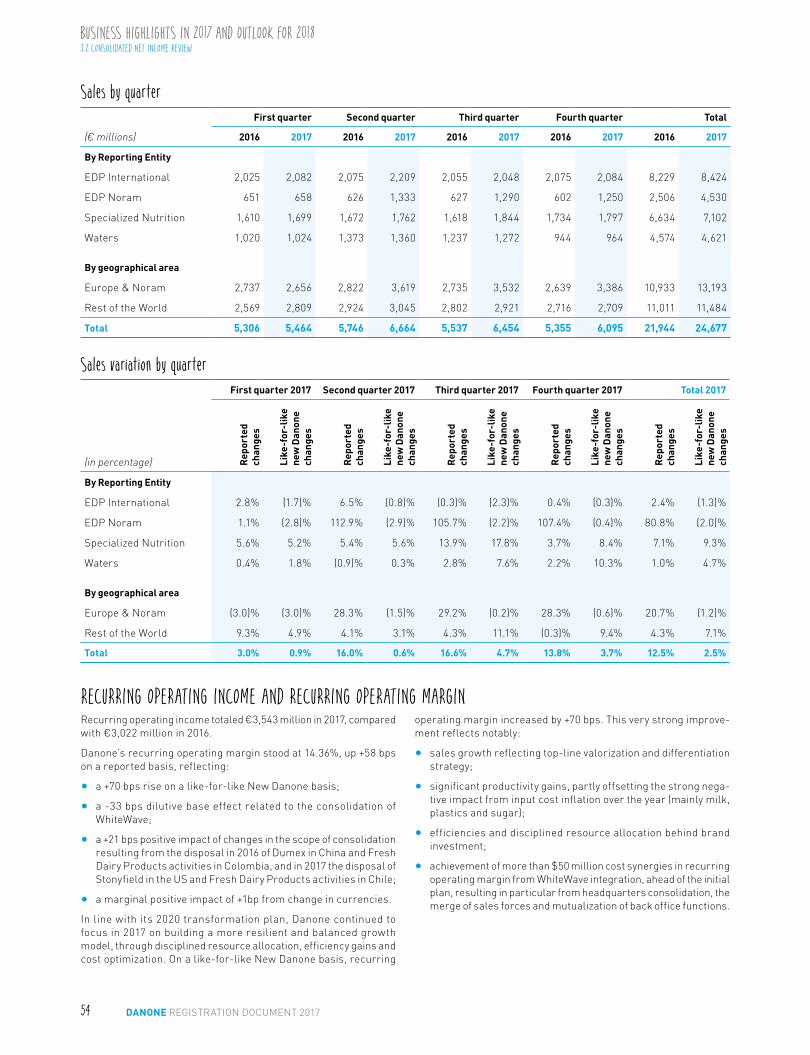
Sales by quarter
(€ millions)
First quarter Second quarter Third quarter Fourth quarter Total
2016 2017 2016 2017 2016 2017 2016 2017 2016 2017
By Reporting Entity
EDP International 2,025 2,082 2,075 2,209 2,055 2,048 2,075 2,084 8,229 8,424
EDP Noram 651 658 626 1,333 627 1,290 602 1,250 2,506 4,530
Specialized Nutrition 1,610 1,699 1,672 1,762 1,618 1,844 1,734 1,797 6,634 7,102
Waters 1,020 1,024 1,373 1,360 1,237 1,272 944 964 4,574 4,621
By geographical area
Europe & Noram 2,737 2,656 2,822 3,619 2,735 3,532 2,639 3,386 10,933 13,193
Rest of the World 2,569 2,809 2,924 3,045 2,802 2,921 2,716 2,709 11,011 11,484
Total 5,306 5,464 5,746 6,664 5,537 6,454 5,355 6,095 21,944 24,677
Sales variation by quarter
(in percentage)
First quarter 2017 Second quarter 2017 Third quarter 2017 Fourth quarter 2017 Total 2017
Rep
orte
d ch
ange
s
Like
-for
-lik
e ne
w D
anon
e ch
ange
s
Rep
orte
d ch
ange
s
Like
-for
-lik
e ne
w D
anon
e ch
ange
s
Rep
orte
d ch
ange
s
Like
-for
-lik
e ne
w D
anon
e ch
ange
s
Rep
orte
d ch
ange
s
Like
-for
-lik
e ne
w D
anon
e ch
ange
s
Rep
orte
d ch
ange
s
Like
-for
-lik
e ne
w D
anon
e ch
ange
s
By Reporting Entity
EDP International 2.8% (1.7)% 6.5% (0.8)% (0.3)% (2.3)% 0.4% (0.3)% 2.4% (1.3)%
EDP Noram 1.1% (2.8)% 112.9% (2.9)% 105.7% (2.2)% 107.4% (0.4)% 80.8% (2.0)%
Specialized Nutrition 5.6% 5.2% 5.4% 5.6% 13.9% 17.8% 3.7% 8.4% 7.1% 9.3%
Waters 0.4% 1.8% (0.9)% 0.3% 2.8% 7.6% 2.2% 10.3% 1.0% 4.7%
By geographical area
Europe & Noram (3.0)% (3.0)% 28.3% (1.5)% 29.2% (0.2)% 28.3% (0.6)% 20.7% (1.2)%
Rest of the World 9.3% 4.9% 4.1% 3.1% 4.3% 11.1% (0.3)% 9.4% 4.3% 7.1%
Total 3.0% 0.9% 16.0% 0.6% 16.6% 4.7% 13.8% 3.7% 12.5% 2.5%
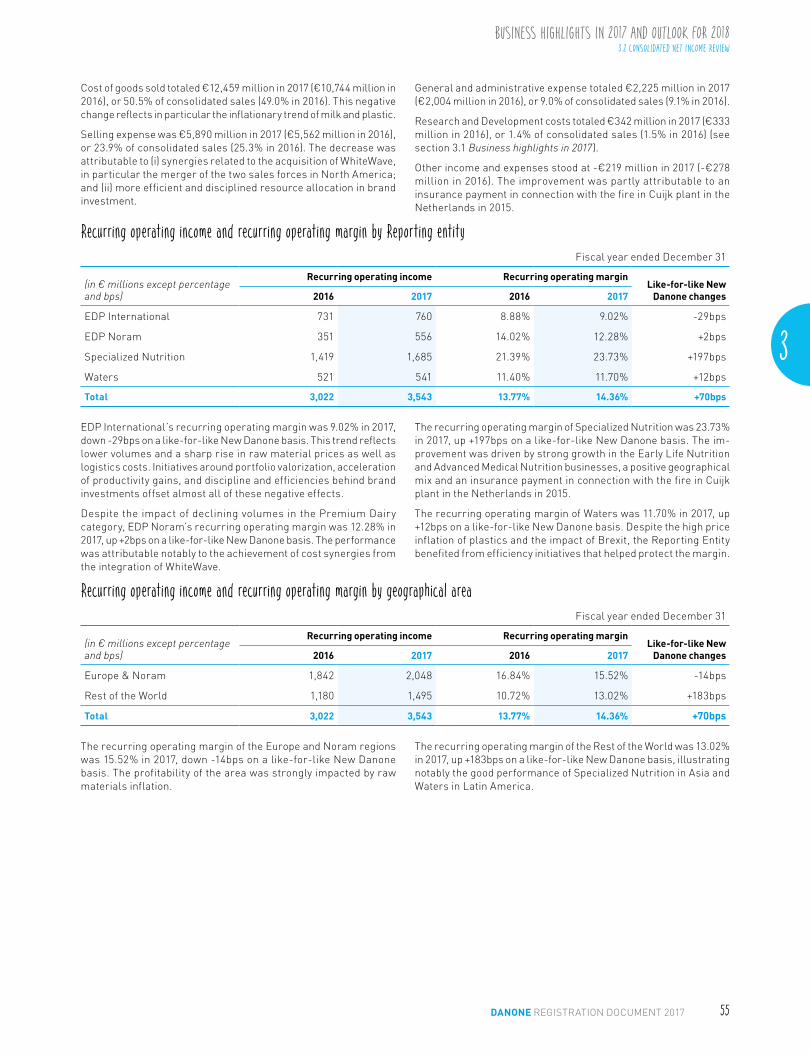
RECURRING OPERATING INCOME AND RECURRING OPERATING MARGINRecurring operating income totaled €3,543 million in 2017, compared with €3,022 million in 2016.
Danone’s recurring operating margin stood at 14.36%, up +58 bps on a reported basis, reflecting:
• a +70 bps rise on a like-for-like New Danone basis;
• a -33 bps dilutive base effect related to the consolidation of WhiteWave;
• a +21 bps positive impact of changes in the scope of consolidation resulting from the disposal in 2016 of Dumex in China and Fresh Dairy Products activities in Colombia, and in 2017 the disposal of Stonyfield in the US and Fresh Dairy Products activities in Chile;
• a marginal positive impact of +1bp from change in currencies.
In line with its 2020 transformation plan, Danone continued to focus in 2017 on building a more resilient and balanced growth model, through disciplined resource allocation, efficiency gains and cost optimization. On a like-for-like New Danone basis, recurring
operating margin increased by +70 bps. This very strong improve-ment reflects notably:
• sales growth reflecting top-line valorization and differentiation strategy;
• significant productivity gains, partly offsetting the strong nega-tive impact from input cost inflation over the year (mainly milk, plastics and sugar);
• efficiencies and disciplined resource allocation behind brand investment;
• achievement of more than $50 million cost synergies in recurring operating margin from WhiteWave integration, ahead of the initial plan, resulting in particular from headquarters consolidation, the merge of sales forces and mutualization of back office functions.
3
BUSINESS HIGHLIGHTS IN 2017 AND OUTLOOK FOR 20183.2 CONSOLIDATED NET INCOME REVIEW
DANONE REGISTRATION DOCUMENT 2017 55
Cost of goods sold totaled €12,459 million in 2017 (€10,744 million in 2016), or 50.5% of consolidated sales (49.0% in 2016). This negative change reflects in particular the inflationary trend of milk and plastic.
Selling expense was €5,890 million in 2017 (€5,562 million in 2016), or 23.9% of consolidated sales (25.3% in 2016). The decrease was attributable to (i) synergies related to the acquisition of WhiteWave, in particular the merger of the two sales forces in North America; and (ii) more efficient and disciplined resource allocation in brand investment.
General and administrative expense totaled €2,225 million in 2017 (€2,004 million in 2016), or 9.0% of consolidated sales (9.1% in 2016).
Research and Development costs totaled €342 million in 2017 (€333 million in 2016), or 1.4% of consolidated sales (1.5% in 2016) (see section 3.1 Business highlights in 2017).
Other income and expenses stood at -€219 million in 2017 (-€278 million in 2016). The improvement was partly attributable to an insurance payment in connection with the fire in Cuijk plant in the Netherlands in 2015.
Recurring operating income and recurring operating margin by Reporting entityFiscal year ended December 31
(in € millions except percentage and bps)
Recurring operating income Recurring operating marginLike-for-like New
Danone changes2016 2017 2016 2017
EDP International 731 760 8.88% 9.02% -29bps
EDP Noram 351 556 14.02% 12.28% +2bps
Specialized Nutrition 1,419 1,685 21.39% 23.73% +197bps
Waters 521 541 11.40% 11.70% +12bps
Total 3,022 3,543 13.77% 14.36% +70bps
EDP International’s recurring operating margin was 9.02% in 2017, down -29bps on a like-for-like New Danone basis. This trend reflects lower volumes and a sharp rise in raw material prices as well as logistics costs. Initiatives around portfolio valorization, acceleration of productivity gains, and discipline and efficiencies behind brand investments offset almost all of these negative effects.
Despite the impact of declining volumes in the Premium Dairy category, EDP Noram’s recurring operating margin was 12.28% in 2017, up +2bps on a like-for-like New Danone basis. The performance was attributable notably to the achievement of cost synergies from the integration of WhiteWave.
The recurring operating margin of Specialized Nutrition was 23.73% in 2017, up +197bps on a like-for-like New Danone basis. The im-provement was driven by strong growth in the Early Life Nutrition and Advanced Medical Nutrition businesses, a positive geographical mix and an insurance payment in connection with the fire in Cuijk plant in the Netherlands in 2015.
The recurring operating margin of Waters was 11.70% in 2017, up +12bps on a like-for-like New Danone basis. Despite the high price inflation of plastics and the impact of Brexit, the Reporting Entity benefited from efficiency initiatives that helped protect the margin.
Recurring operating income and recurring operating margin by geographical areaFiscal year ended December 31
(in € millions except percentage and bps)
Recurring operating income Recurring operating marginLike-for-like New
Danone changes2016 2017 2016 2017
Europe & Noram 1,842 2,048 16.84% 15.52% -14bps
Rest of the World 1,180 1,495 10.72% 13.02% +183bps
Total 3,022 3,543 13.77% 14.36% +70bps
The recurring operating margin of the Europe and Noram regions was 15.52% in 2017, down -14bps on a like-for-like New Danone basis. The profitability of the area was strongly impacted by raw materials inflation.
The recurring operating margin of the Rest of the World was 13.02% in 2017, up +183bps on a like-for-like New Danone basis, illustrating notably the good performance of Specialized Nutrition in Asia and Waters in Latin America.

BUSINESS HIGHLIGHTS IN 2017 AND OUTLOOK FOR 20183.2 CONSOLIDATED NET INCOME REVIEW
DANONE REGISTRATION DOCUMENT 201756
NET FINANCIAL INCOME (EXPENSE)Market risks exposure and management policySee section 2.7 Risk factors.
Net financial income (expense)Year ended December 31
(in € millions) 2016 2017
Interest income on cash, cash equivalents and short term investments 130 151
Interest expense on financial debt (276) (414)
Cost of net financial debt (146) (263)
Other financial income 67 137
Other financial expense (214) (312)
Other financial income or expense (146) (175)
Net financial income (expense) (293) (438)
Cost of net debtThe cost of net debt increased in absolute terms in 2017 from (€146) million in 2016 to (€263) million in 2017, reflecting additional charges related to the financing of the WhiteWave acquisition.
Other financial income and expenseOther financial income and expense stood at -€175million, an increase due notably to the non-recurring amount paid in relation to the early redemption last October of WhiteWave’s outstanding 5.375% $500 million senior notes.
TAX RATEThe recurring income tax rate was 30.3% in 2017, representing a 0.75 point decrease from 2016, mainly due to the removal of the 3% tax on cash dividends in France, partially offset by the new exceptional corporate income tax implemented by the French government.
The US tax reform enacted in December 2017 had a one-off non-cash benefit on reported income tax of +€285 million resulting from the revaluation of deferred tax liabilities. This was partially offset by other tax effects including capital gain arising from Stonyfield disposal.
RECURRING NET INCOME – GROUP SHARE AND RECURRING EPSNet income totaled €2,563 million in 2017, compared with €1,827 million in 2016. Net income – Group Share totaled €2,453 million in 2017, compared with €1,720 million in 2016.
Share of profit of associatesNet income from associates increased from €1 million last year to €109 million on the back of a favorable base of comparison
(impairment of the 25% interest in Yashili in 2016). Minority interests were stable at €110 million.
Recurring net income – Group shareRecurring net income – Group share was €2,190 million in 2017, up +14.6%.
Recurring EPS reached €3.49, up +14.2% at constant exchange rates, in line with full-year guidance. Recurring EPS was up +12.6% on a reported basis, including negative changes in exchange rate (-1.6%), mainly driven by the depreciation of the British pound.

3
BUSINESS HIGHLIGHTS IN 2017 AND OUTLOOK FOR 20183.2 CONSOLIDATED NET INCOME REVIEW
DANONE REGISTRATION DOCUMENT 2017 57
Bridge from Net income – Group share to Recurring net income – Group share
Year ended December 31
(in € millions except percentage)
2016 2017
Recurring Non-recurring Total 100% Recurring Non-recurring Total 100%
Recurring operating income 3,022 3,022 3,543 3,543
Other operating income and expenses (99) (99) 192 192
Operating income 3,022 (99) 2,923 3,543 192 3,734
Cost of net debt (146) (146) (263) (263)
Other financial income and expense (134) (13) (146) (137) (38) (175)
Income before taxes 2,742 (112) 2,630 3,143 153 3,296
Income tax (852) 48 (804) (953) 111 (842)
Effective tax rate 31.1% 30.6% 30.3% 25.5%
Net income from fully consolidated companies 1,890 (64) 1,826 2,190 264 2,454
Net income from associates 129 (128) 1 111 (2) 109
Net income 2,019 (191) 1,827 2,301 262 2,563
• Group share 1,911 (191) 1,720 2,190 263 2,453
• Non-controlling interests 108 − 107 111 (1) 110
Bridge from EPS to Recurring EPS
Year ended December 31
2016 2017
Recurring Total 100% Recurring Total 100%
Net income – Group share (in € millions) 1,911 1,720 2,190 2,453
Coupon relating to hybrid financing net of tax (in € millions) – – (2) (2)
Number of shares
• Before dilution 616,442,041 616,442,041 625,986,636 625,986,636
• After dilution 616,700,618 616,700,618 627,121,266 627,121,266
EPS (in €)
• Before dilution 3.10 2.79 3.50 3.92
• After dilution 3.10 2.79 3.49 3.91

BUSINESS HIGHLIGHTS IN 2017 AND OUTLOOK FOR 20183.2 CONSOLIDATED NET INCOME REVIEW
DANONE REGISTRATION DOCUMENT 201758
ADDITIONAL INFORMATION ON CONSOLIDATED INCOME STATEMENT: BRIDGE FROM REPORTED TO LIKE-FOR-LIKE FIGURES
Previous period
Period under review
Reported changes
Of which impact of
WhiteWave base effect
Of which impact of
other changes in scope of
consolidation
Of which impact of
changes in exchange
rates
Like-for-like New Danone
growth
Sales (in € millions except percentage)
Year ended December 31, 2016 22,412 21,944 (2.1)% − 0.5% (5.5)% 2.9%
Year ended December 31, 2017 21,944 24,677 12.5% 12.7% (1.1)% (1.6)% 2.5%
Recurring operating margin
Year ended December 31, 2016 12.91% 13.77% +87 bps − +10 bps +6 bps +70 bps
Year ended December 31, 2017 13.77% 14.36% +59 bps -33bps +21bps +1bps +70bps
DIVIDEND PAID IN RESPECT OF 2017 FISCAL YEARAt the Annual General Meeting on April 26, 2018, Danone’s Board of Directors will ask shareholders to approve the distribution of a €1.90 dividend per share in respect of the 2017 fiscal year, up +11.8% from 2016. This dividend reflects the confidence of both the Board and management in the Company’s roadmap towards strong profitable and sustainable growth.
Shareholders will be asked to opt for full payment of their dividend in either cash or in DANONE shares. New shares would be issued
at a price set at 90% of the average opening Danone share price on Euronext over the twenty trading days prior to the Shareholders’ Meeting on April 26, 2018 less the amount of the dividend.
Assuming this proposal is approved, the ex-dividend date will be May 4, 2018. The period during which shareholders may opt to receive dividends in cash or in shares will begin on May 4 and run through May 18. Dividends will be payable in cash or in shares on May 31, 2018.

3
BUSINESS HIGHLIGHTS IN 2017 AND OUTLOOK FOR 20183.3 FREE CASH FLOW
DANONE REGISTRATION DOCUMENT 2017 59
3.3 FREE CASH FLOWAt the date of this Registration Document, Danone estimates that the cash flows generated by its operating activities, its cash flow and the funds available through confirmed credit lines managed at the level of the Company will be sufficient to cover the necessary expenses and investments, the debt service (including the financing of the exercise of any put options granted to holders of non-controlling interests) and the payment of dividends.
Free cash flow stood at €2,083 million, up +18.4% from 2016, sup-ported by the rise in recurring operating income, strict discipline in capex and tight monitoring of working capital. In addition, this result includes an exceptional contribution from the €105 million Fonterra settlement.
This cash delivery will primarily contribute to the Company’s delever-aging and fund Danone’s roadmap for growth. Capital expenditure for 2017 came to €969 million, or 3.9% of sales.
FREE CASH FLOWTransition from operating cash flow to free cash flow
Year ended December 31
(€ millions) 2016 2017
Cash flow from operating activities 2,652 2,958
Capital expenditure (925) (969)
Disposal of tangible assets 27 45
Transaction fees related to business combinations (a) 6 50
Earn-outs related to business combinations (b) − −
Free cash flow 1,760 2,083
Cash flows related to plan to generate savings and adapt organization in Europe (c) 26 2
Free cash flow excluding exceptional items (d) 1,786 2,085
(a) Represents acquisition costs related to business combinations paid during the period.(b) Represents earn-outs related to business combinations and paid subsequently to acquisition date and over the period.(c) Net of tax.(d) Free cash flow excluding exceptional items corresponds to free cash flow before cash flows related to initiatives deployed within the framework of the plan
to generate savings and adapt Danone’s organization in Europe.

BUSINESS HIGHLIGHTS IN 2017 AND OUTLOOK FOR 20183.3 FREE CASH FLOW
DANONE REGISTRATION DOCUMENT 201760
CONSOLIDATED STATEMENT OF CASH FLOWSYear ended December 31
(in € millions) 2016 2017
Net income 1,827 2,563
Share of profit of associates net of dividends received 52 (54)
Depreciation, amortization and impairment of tangible and intangible assets 786 974
Increases in (reversals of) provisions 51 153
Change in deferred taxes (65) (353)
(Gains) losses on disposal of property, plant and equipment and financial investments (74) (284)
Expense related to Group performance shares 24 22
Cost of net financial debt 149 265
Net interest paid (148) (186)
Net change in interest income (expense) − 80
Other components with no cash impact 13 (15)
Cash flows provided by operating activities, before changes in net working capital 2,615 3,085
(Increase) decrease in inventories (24) (122)
(Increase) decrease in trade receivables (110) (190)
Increase (decrease) in trade payables 298 145
Change in other receivables and payables (127) 40
Change in working capital requirements 37 (127)
Cash flows provided by (used in) operating activities 2,652 2,958
Capital expenditure (a) (925) (969)
Proceeds from the disposal of property, plant and equipment (a) 27 45
Net cash outflows on purchases of subsidiaries and financial investments (b) (66) (10,949)
Net cash inflows on disposal of subsidiaries and financial investments (b) 110 441
(Increase) decrease in long-term loans and other long-term financial assets 6 (4)
Cash flows provided by (used in) investment activities (848) (11,437)
Increase in share capital and additional paid-in capital 46 47
Purchase of treasury shares (net of disposals) and DANONE call options (c) 32 13
Issue of perpetual subordinated debt securities − 1,245
Interest on perpetual subordinated debt securities − −
Dividends paid to Danone shareholders (d) (985) (279)
Buyout of non-controlling interests (295) (107)
Dividends paid (94) (86)
Contribution from non-controlling interests to capital increases 6 1
Transactions with non-controlling interests (383) (193)
Net cash flows on hedging derivatives (e) 50 (52)
Bonds issued during the period 11,237 −
Bonds repaid during the period (638) (1,487)
Net cash flows from other current and non-current financial debt (442) (564)
Net cash flows from short-term investments (10,531) 9,559
Cash flows provided by (used in) financing activities (1,616) 8,289
Effect of exchange rate and other changes (f) (151) 272
Increase (decrease) in cash and cash equivalents 38 81
Cash and cash equivalents as of January 1 519 557
Cash and cash equivalents as of December 31 557 638
Supplementary disclosures
Income tax payments during the year (891) (1,116)
(a) This expenditure relates to property, plant and equipment and intangible assets used in operating activities.(b) Acquisition/disposal of companies’ shares. In the case of fully consolidated companies, this comprises cash and cash equivalents as of the acquisition/
disposal date.(c) DANONE call options acquired by the Company.(d) Portion paid in cash.(e) Derivative instruments used to manage net debt. As of December 31, 2016, also includes and consists almost entirely of cash flows related to the hedging of
the WhiteWave acquisition price that expired in 2017.(f) Effect of reclassification with no impact on net debt.

3
BUSINESS HIGHLIGHTS IN 2017 AND OUTLOOK FOR 20183.3 FREE CASH FLOW
DANONE REGISTRATION DOCUMENT 2017 61
3.4 BALANCE SHEET AND FINANCIAL SECURITY REVIEWSIMPLIFIED CONSOLIDATED BALANCE SHEET
As of December 31
(in € millions except percentage) 2016 2017
Non-current assets 24,836 34,627
Current assets 19,113 9,641
Total assets 43,949 44,268
Equity – Group share 13,109 14,501
Non-controlling interests 85 73
Non-current liabilities 21,705 19,282
Current liabilities 9,050 10,411
Total equity and liabilities 43,949 44,268
Net debt 7,472 15,372
Net financial debt 6,773 14,765
FINANCING STRUCTURE AND FINANCIAL SECURITYLiquidity risk exposure and management policySee section 2.7 Risk factors relating to Market risk.
In particular Danone manages its liquidity risk and its financing at Company level.
Financing situation and liquidity riskMain financing transactions in 2017
Year ended December 31
2017
(in millions of currency) Currency Nominal Maturity
New financing
Hybrid financing EUR 1,250 Undated
Repayments
WhiteWave bond USD 553 2022
Eurobonds EUR 750 2017
Yen private placement JPY 11,000 2017
Euro private placement EUR 95 2017

BUSINESS HIGHLIGHTS IN 2017 AND OUTLOOK FOR 20183.3 FREE CASH FLOW
DANONE REGISTRATION DOCUMENT 201762
Main financial debt repayment scheduleThis relates to financing managed at the Company level.
Projected cash outflows related to the contractual repayment of the principal amount based on the assumption of non-renewal(in € millions)
(a) Includes the value of derivatives hedging bonds and commercial paper.
Sources of financing available at any timeThe sources of financing available at any time established by the Group are composed mainly of available committed credit facilities and a syndicated credit facility carried by the Company.
(in € millions)
Company rating
As of December 31
2016 2017
Moody's Standard and Poor's Moody's Standard and Poor's
Short-term rating (a)
Rating – A-2 – A-2
Long-term rating (b) (c)
Rating Baa1 (c) BBB+ Baa1 (c) BBB+
Outlook Stable Negative (d) Stable Negative (d)
(a) Rating given to the Company’s commercial paper program.(b) Rating on the Company’s debt with a maturity of more than one year.(c) Rating reviewed on September 8, 2016.(d) Rating reviewed on July 8, 2016 and outlook attributed on September 21, 2016.
On February 20, 2018, Standard & Poor’s raised its perspective on Danone’s credit rating from “negative” to “stable”.
2,000
3,000
1,000
0
Bonds (a)
Commercial paper (a)
Liabilities related to put options
Hybrid financing
569
719
2,1561,899 2,050 1,873 1,682 1,751
2,000
750
1,668 1,6001,250
2018 2019 2020 2021 2022 2023 2024 2025 2026 2027 2028 Undated
38
1,450
2,000
1,217
2,000
1,217
2,000
334
2,000
2017 2018 2019 2020 2021
2 000
3 000
1 000
0
Syndicated credit facility
Committed credit facilities
3
BUSINESS HIGHLIGHTS IN 2017 AND OUTLOOK FOR 20183.3 FREE CASH FLOW
DANONE REGISTRATION DOCUMENT 2017 63
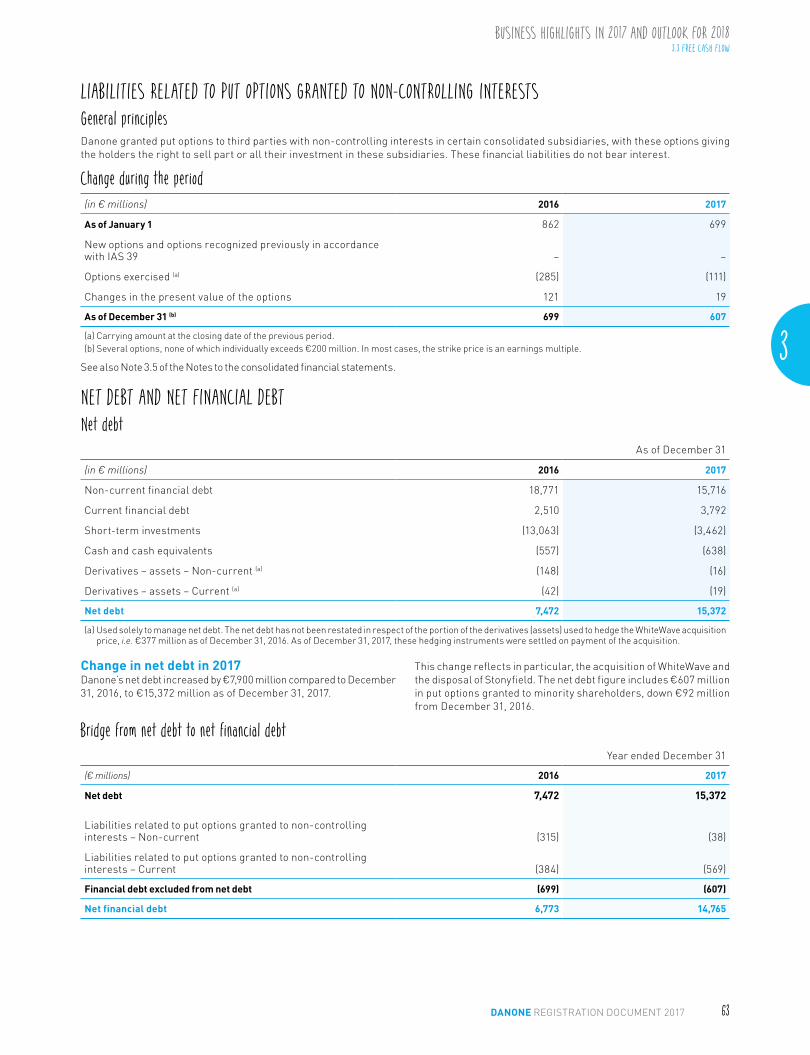
LIABILITIES RELATED TO PUT OPTIONS GRANTED TO NON-CONTROLLING INTERESTSGeneral principlesDanone granted put options to third parties with non-controlling interests in certain consolidated subsidiaries, with these options giving the holders the right to sell part or all their investment in these subsidiaries. These financial liabilities do not bear interest.
Change during the period(in € millions) 2016 2017
As of January 1 862 699
New options and options recognized previously in accordance with IAS 39 – −
Options exercised (a) (285) (111)
Changes in the present value of the options 121 19
As of December 31 (b) 699 607
(a) Carrying amount at the closing date of the previous period.(b) Several options, none of which individually exceeds €200 million. In most cases, the strike price is an earnings multiple.
See also Note 3.5 of the Notes to the consolidated financial statements.
NET DEBT AND NET FINANCIAL DEBTNet debt
As of December 31
(in € millions) 2016 2017
Non-current financial debt 18,771 15,716
Current financial debt 2,510 3,792
Short-term investments (13,063) (3,462)
Cash and cash equivalents (557) (638)
Derivatives – assets – Non-current (a) (148) (16)
Derivatives – assets – Current (a) (42) (19)
Net debt 7,472 15,372
(a) Used solely to manage net debt. The net debt has not been restated in respect of the portion of the derivatives (assets) used to hedge the WhiteWave acquisition price, i.e. €377 million as of December 31, 2016. As of December 31, 2017, these hedging instruments were settled on payment of the acquisition.
Change in net debt in 2017Danone’s net debt increased by €7,900 million compared to December 31, 2016, to €15,372 million as of December 31, 2017.
This change reflects in particular, the acquisition of WhiteWave and the disposal of Stonyfield. The net debt figure includes €607 million in put options granted to minority shareholders, down €92 million from December 31, 2016.
Bridge from net debt to net financial debtYear ended December 31
(€ millions) 2016 2017
Net debt 7,472 15,372
Liabilities related to put options granted to non-controlling interests – Non-current (315) (38)
Liabilities related to put options granted to non-controlling interests – Current (384) (569)
Financial debt excluded from net debt (699) (607)
Net financial debt 6,773 14,765

BUSINESS HIGHLIGHTS IN 2017 AND OUTLOOK FOR 20183.3 FREE CASH FLOW
DANONE REGISTRATION DOCUMENT 201764
Net debt / EBITDA and Return on invested capital (ROIC)Danone tracks these ratios every year.
Net debt / EBITDAThe net debt / EBITDA ratio corresponds to the ratio of net debt to operating income restated for depreciation, amortization and impairment of tangible and intangible assets. The ratio in fiscal 2017 was 3.3x:
(in € millions except ratio) 2016 2017
Net debt as of December 31 7,472 15,372
Operating income 2,923 3,734
Depreciation, amortization and impairment of property, plant and equipment and intangible assets 786 974
EBITDA of the year 3,709 4,708
Net debt / EBITDA of the year 2.0 x 3.3 x
ROICROIC is the ratio of net operating income in the current year to average capital invested in the current and prior years, which corresponds to:
Goodwill and other tangible and intangible assets
+ investments in non-consolidated companies and other financial investments;
+ assets held for sale net of liabilities;
+ working capital requirement;
- provisions and other net liabilities;
It stood at 10.3% in 2017:
(in € millions except percentage) 2015 2016 2017
Recurring operating income 3,022 3,543
Recurring income tax rate 31,1% 30.3%
Tax on recurring operating income (940) (1,074)
Recurring income from associates 129 111
Operating income 2,211 2,580
Intangible assets 15,779 15,803 24,945
Property, plant and equipment 4,752 5,036 6,005
Goodwill and other tangible and intangible assets 20,531 20,839 30,950
Investments in associates 2,882 2,730 2,678
Other financial investments 274 288 260
Short-term loans 40 18 14
Investments in non-consolidated companies and other financial investments 3,196 3,036 2,952
Assets held for sale net of liabilities 153 66 –
Deferred taxes net of deferred tax assets (224) (259) (922)
Provisions for retirement and other long-term benefits (793) (959) (919)
Other non-current provisions and liabilities (834) (885) (1,003)
Provisions and other net liabilities (1,851) (2,103) (2,844)
Working capital (1,561) (1,549) (1,112)
Capital expenditure of the year 20,468 20,289 29,947
Average invested capital 20,379 25,119
ROIC 10.9% 10.3%

3
BUSINESS HIGHLIGHTS IN 2017 AND OUTLOOK FOR 20183.3 FREE CASH FLOW
DANONE REGISTRATION DOCUMENT 2017 65
SHAREHOLDER’S EQUITYChange in shareholder’s equity – Group share
Year ended December 31
(in € millions) 2016 2017
As of January 1 12,606 13,108
Net income 1,720 2,453
Other comprehensive income 134 (391)
Dividends paid (a) (986) (279)
Translation adjustments (283) (1,722)
Other (83) 1,332
As of December 31 13,108 14,501
(a) Impact on the Group share of equity, impact of the dividends paid on the consolidated equity amounting to €(365) million in 2017 (€(1,079) million in 2016).
OFF-BALANCE SHEET COMMITMENTSCommitments given as of December 31, 2017 relating to operating activities
Total
Amount of financial flows by period
(in € millions) 2018 2019 2020 20212022 and
beyond
Commitments to purchase goods and services (a) (4,252) (2,397) (780) (478) (281) (317)
Capital expenditure commitments (197) (187) (9) − − (1)
Operating lease commitments (748) (223) (139) (101) (65) (220)
Guarantees and pledges given (25) (22) (1) – – (2)
Other (55) (34) (11) (6) (3) (2)
Total (5,278) (2,863) (939) (585) (349) (542)
(a) Commitments relating mainly to purchases of milk, dairy ingredients and other food raw materials.

BUSINESS HIGHLIGHTS IN 2017 AND OUTLOOK FOR 20183.5 OUTLOOK 2018
DANONE REGISTRATION DOCUMENT 201766
3.5 OUTLOOK 2018
MATERIAL CHANGE IN FINANCIAL OR TRADING POSITIONThe Company and its subsidiaries overall have not experienced any material changes in their financial or trading position since the close of the 2017 fiscal year.
SUBSEQUENT EVENTSNew phase in Danone’s strategic partnership with YakultOn February 14th, 2018 Danone has announced a new phase in its partnership with Yakult, thus strengthening their long-term strategic collaboration in probiotics, while optimizing its capital allocation:
• Intensified collaboration to promote and develop probiotics activities;
• Reduced stake in Yakult: in accordance with its continued focus on disciplined capital allocation, Danone announced in parallel its intention to sell part of its stake in Yakult. The intended di-vestiture will be carried out through:
• a market transaction launched on February 14th, 2018 by Yakult and expected to settle in March;
• a share buyback program launched in Yakult, in which Danone will participate.
Following the completion of these transactions, Danone’s resulting stake in Yakult’s issued share capital is expected to be approximately 7%, subject to market conditions. With this, Danone is expected to remain Yakult’s largest shareholder and will continue to sit on the company’s Board of Directors.
OUTLOOK FOR 2018In the current year, Danone will make further progress towards its 2020 ambition through its separate focuses on both mid-term growth and short-term efficiency. It will also start rolling out the
Protein efficiency program and continue to capture the synergies from the WhiteWave acquisition. These activities will underpin its ability to deliver sustainable growth in sales and profits.
Macroeconomic outlookDanone assumes that market volatility will continue.
In 2018, Danone expects further cost-inflation with a mid-single digit rise in the costs of raw and packaging materials, including:
• milk price inflation of low to mid-single digit overall;
• a double-digit increase of PET pricing driven by the rebound in crude oil prices; and
• inflationary conditions in other raw materials, in particular sugar and fruits.
Danone also expects an ongoing impact from currency volatility, particularly the UK pound.
2018 guidanceDanone’s focus will remain on accelerating growth and maximiz-ing efficiencies, including the first year of savings delivered by its Protein program. In 2018, the Company will progress towards its 2020 ambition through further sales growth and an improved recurring operating margin.
As a result, Danone is targeting double-digit recurring EPS growth at constant exchange rates for 2018, excluding Yakult Transaction Impact.

3
BUSINESS HIGHLIGHTS IN 2017 AND OUTLOOK FOR 20183.6 FINANCIAL INDICATORS NOT DEFINED IN IFRS
DANONE REGISTRATION DOCUMENT 2017 67
3.6 FINANCIAL INDICATORS NOT DEFINED IN IFRSAdditional indicator: Like-for-like New Danone growthSince completion of the WhiteWave acquisition, WhiteWave and Danone’s activities have been combined and are generating syner-gies. Separate reporting of WhiteWave and Danone in their pre-ac-quisition consolidation scopes thus no longer reflects their real performance. As a result, Danone has decided to monitor and then report its performance after adding the contribution of WhiteWave as a whole to its organic growth from the time of the acquisition by using an additional indicator, “like-for-like New Danone” changes.
This indicator is a variation on the ”like-for-like” changes indicator used by Danone which integrates WhiteWave’s performance starting at the date of acquisition:
• for periods in previous years compared; and
• based on WhiteWave reported data after restatement to allow comparison with Danone data.
This indicator is used starting with the second quarter of 2017 and running through the end of 2018. Danone does not publish like-for-like New Danone changes for prior periods given the way they are computed.
Lastly, Danone does not monitor internally nor publish like-for-like changes and will not do so until year-end 2018. Indeed like-for-like changes would not reflect accurately the Company’s real perfor-mance, which is reflected in like-for-like New Danone changes; and, by extension, the difference between like-for-like changes and like-for-like New Danone changes would not accurately reflect the contribution to this real performance of WhiteWave and its companies.
Financial indicators not defined in IFRSFinancial indicators not defined in IFRS used by Danone are cal-culated as follows:
Like-for-like changes in sales and recurring operating margin reflect Danone’s organic performance and essentially exclude the impact of:
• Changes in scope of consolidation, with indicators related to a given fiscal year calculated on the basis of the scope of the previous year;
• Changes in applicable accounting principles;
• Changes in exchange rates (i) calculating both current-year and previous-year indicators using the same exchange rates (the exchange rate used is a projected annual rate determined by Danone for the current year and applied to both the previous and current year); and (ii) correcting differences caused by the exceptional volatility of inflation in countries that are structurally subject to hyperinflation, which would otherwise distort any interpretation of Danone’s organic performance.
Since inflation in Argentina — already structurally high — accelerated further in 2014, in particular following the sharp, steep devaluation of the peso in January, using an identical exchange rate to com-pare 2014 figures with those for the prior year did not accurately reflect Danone’s organic performance in that country. As a result, the Company fine-tuned the definition of like-for-like changes to include in its exchange-rate impact the differences caused by the exceptional volatility in structurally hyperinflationary countries. Danone has been applying this methodology, which was applicable
only to Argentina, starting from the release of 2014 full-year results. Danone will keep an eye on the economic and monetary position of Argentina and the volatility of its inflation. This methodology led to (i) limiting the inflation of the price and cost of goods sold per kilo to their average level over three years; and (ii) capping Recurring operating margin at its prior-year level; this methodology has been applied to each Reporting entity operating in Argentina. With respect to 2014, adjustment for the full year was recorded in the fourth quar-ter of 2014. As a reminder, this special treatment of over-inflation in Argentina and its end have no impact on IFRS reported figures.
End of the special treatment of over-inflation in ArgentinaIn light of the normalization of the economic and monetary situation in Argentina observed since the beginning of 2017 and confirmed in Q3 2017, it is no longer required to limit the inflation of prices and to cap recurring operating margin in that country, as described above. As a result, when reporting third-quarter 2017 sales, Danone has ended its special treatment of over-inflation in Argentina with effect from January 1, 2017.
In the first half of 2017, this treatment had:
• a negative impact on “Like-for-like New Danone” sales growth of -0.3% (-0.2% and -0.4% on Q1 2017 and Q2 2017 respectively);
• a positive +0.3% impact on the change in exchange rates;
• no impact on the improvement of the “Like-for-like New Danone” recurring operating margin.

Business highlights in 2017 and outlook for 20183.6 financial indicators not defined in ifrs
DANONE REGISTRATION DOCUMENT 201768
The following table details Like-for-like New Danone changes for Q1, Q2, and H1 2017 and recaps corresponding figures considering the treatment of over-inflation in Argentina as published previously:
Changes in sales
Like-for-like New Danone as published, taking into account the treatment of over-inflation in Argentina Like-for-like new Danone
Q1 2017 Q2 2017 H1 2017 Q1 2017 Q2 2017 H1 2017
By Reporting Entity
EDP International -2.2% -1.8% -2.0% -1.7% -0.8% -1.2%
EDP Noram -2.8% -2.9% -2.9% -2.8% -2.9% -2.9%
Specialized Nutrition 5.2% 5.5% 5.4% 5.2% 5.6% 5.4%
Waters 1.7% 0.3% 0.8% 1.8% 0.3% 0.9%
By geographical area
Europe & Noram -3.0% -1.5% -2.1% -3.0% -1.5% -2.1%
Rest of the World 4.4% 2.3% 3.3% 4.9% 3.1% 4.0%
Total 0.7% 0.2% 0.4% 0.9% 0.6% 0.7%
Changes in recurring operating margin
Like-for-like New Danone as published, taking into account the treatment of over-inflation in Argentina Like-for-like New Danone
H1 2017 H1 2017
By Reporting Entity
EDP International -33 bps -13 bps
EDP Noram -67 bps -67 bps
Specialized Nutrition +320 bps +316 bps
Waters +37 bps +15 bps
By geographical area
Europe & Noram +24 bps +25 bps
Rest of the World +175 bps +175 bps
Total +91 bps +91 bps
“Like-for-like New Danone” changes (or “Like-for-like including WhiteWave starting in April 2017” changes) in sales and recurring operating margin reflect the organic performance of Danone and WhiteWave combined. This indicator corresponds to like-for-like changes for Danone and WhiteWave combined, considering the activity of WhiteWave as a whole by integrating its companies during the fiscal years prior to and following their acquisition in April 2017:
• from April 1 to December 31 for periods compared until 2017 included;
• from January 1 to December 31 for periods compared in 2018.
3
BUSINESS HIGHLIGHTS IN 2017 AND OUTLOOK FOR 20183.6 FINANCIAL INDICATORS NOT DEFINED IN IFRS
DANONE REGISTRATION DOCUMENT 2017 69
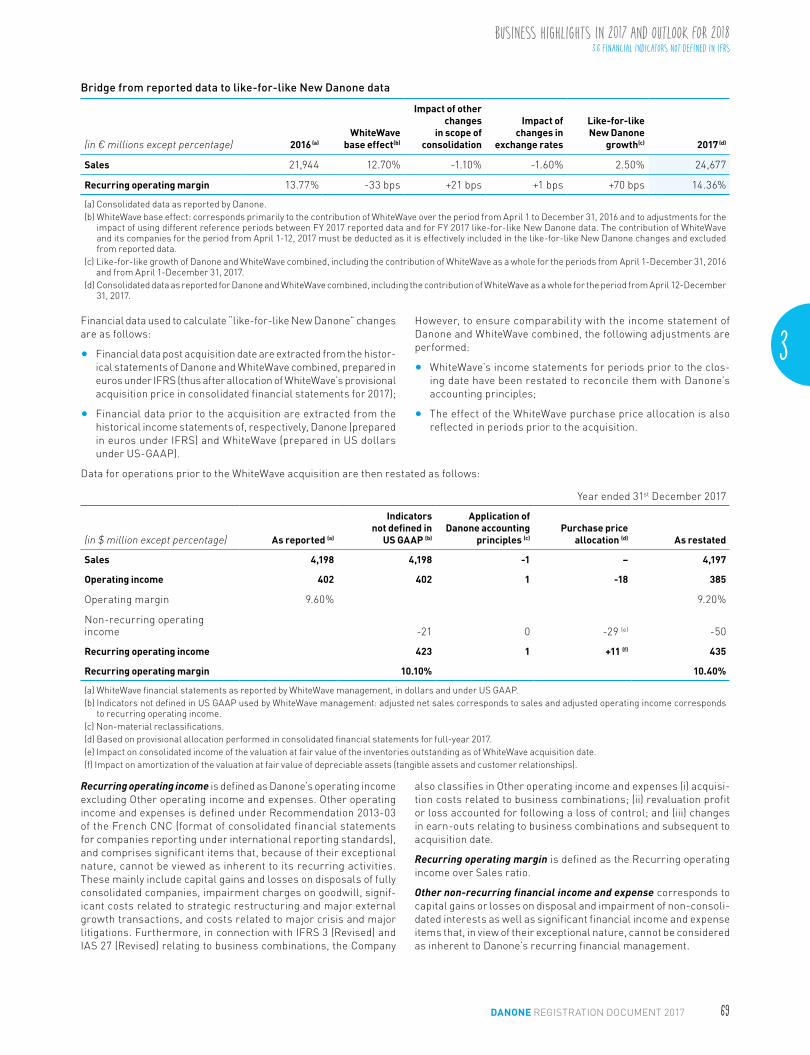
Bridge from reported data to like-for-like New Danone data
(in € millions except percentage) 2016 (a)WhiteWave
base effect(b)
Impact of other changes
in scope of consolidation
Impact of changes in
exchange rates
Like-for-like New Danone
growth(c) 2017 (d)
Sales 21,944 12.70% -1.10% -1.60% 2.50% 24,677
Recurring operating margin 13.77% -33 bps +21 bps +1 bps +70 bps 14.36%
(a) Consolidated data as reported by Danone.(b) WhiteWave base effect: corresponds primarily to the contribution of WhiteWave over the period from April 1 to December 31, 2016 and to adjustments for the
impact of using different reference periods between FY 2017 reported data and for FY 2017 like-for-like New Danone data. The contribution of WhiteWave and its companies for the period from April 1-12, 2017 must be deducted as it is effectively included in the like-for-like New Danone changes and excluded from reported data.
(c) Like-for-like growth of Danone and WhiteWave combined, including the contribution of WhiteWave as a whole for the periods from April 1-December 31, 2016 and from April 1-December 31, 2017.
(d) Consolidated data as reported for Danone and WhiteWave combined, including the contribution of WhiteWave as a whole for the period from April 12-December 31, 2017.
Financial data used to calculate “like-for-like New Danone” changes are as follows:
• Financial data post acquisition date are extracted from the histor-ical statements of Danone and WhiteWave combined, prepared in euros under IFRS (thus after allocation of WhiteWave’s provisional acquisition price in consolidated financial statements for 2017);
• Financial data prior to the acquisition are extracted from the historical income statements of, respectively, Danone (prepared in euros under IFRS) and WhiteWave (prepared in US dollars under US-GAAP).
However, to ensure comparability with the income statement of Danone and WhiteWave combined, the following adjustments are performed:
• WhiteWave’s income statements for periods prior to the clos-ing date have been restated to reconcile them with Danone’s accounting principles;
• The effect of the WhiteWave purchase price allocation is also reflected in periods prior to the acquisition.
Data for operations prior to the WhiteWave acquisition are then restated as follows:
Year ended 31st December 2017
(in $ million except percentage) As reported (a)
Indicators not defined in
US GAAP (b)
Application of Danone accounting
principles (c)Purchase price
allocation (d) As restated
Sales 4,198 4,198 -1 – 4,197
Operating income 402 402 1 -18 385
Operating margin 9.60% 9.20%
Non-recurring operating income -21 0 -29 (e) -50
Recurring operating income 423 1 +11 (f) 435
Recurring operating margin 10.10% 10.40%
(a) WhiteWave financial statements as reported by WhiteWave management, in dollars and under US GAAP.(b) Indicators not defined in US GAAP used by WhiteWave management: adjusted net sales corresponds to sales and adjusted operating income corresponds
to recurring operating income.(c) Non-material reclassifications.(d) Based on provisional allocation performed in consolidated financial statements for full-year 2017.(e) Impact on consolidated income of the valuation at fair value of the inventories outstanding as of WhiteWave acquisition date.(f) Impact on amortization of the valuation at fair value of depreciable assets (tangible assets and customer relationships).
Recurring operating income is defined as Danone’s operating income excluding Other operating income and expenses. Other operating income and expenses is defined under Recommendation 2013-03 of the French CNC (format of consolidated financial statements for companies reporting under international reporting standards), and comprises significant items that, because of their exceptional nature, cannot be viewed as inherent to its recurring activities. These mainly include capital gains and losses on disposals of fully consolidated companies, impairment charges on goodwill, signif-icant costs related to strategic restructuring and major external growth transactions, and costs related to major crisis and major litigations. Furthermore, in connection with IFRS 3 (Revised) and IAS 27 (Revised) relating to business combinations, the Company
also classifies in Other operating income and expenses (i) acquisi-tion costs related to business combinations; (ii) revaluation profit or loss accounted for following a loss of control; and (iii) changes in earn-outs relating to business combinations and subsequent to acquisition date.
Recurring operating margin is defined as the Recurring operating income over Sales ratio.
Other non-recurring financial income and expense corresponds to capital gains or losses on disposal and impairment of non-consoli-dated interests as well as significant financial income and expense items that, in view of their exceptional nature, cannot be considered as inherent to Danone’s recurring financial management.

BUSINESS HIGHLIGHTS IN 2017 AND OUTLOOK FOR 20183.7 DOCUMENTS AVAILABLE TO THE PUBLIC
DANONE REGISTRATION DOCUMENT 201770
Non-recurring income tax corresponds to income tax on non-re-curring items as well as significant tax income and expense items that, in view of their exceptional nature, cannot be considered as inherent to Danone’s recurring performance.
The recurring income tax rate measures the tax rate related to Danone’s recurring performance and corresponds to the ratio of tax income and charges relating to recurring items over recurring pretax income.
Non-recurring results from associates include significant items that, because of their exceptional nature, cannot be viewed as inherent to the recurring activity of those companies and distort the reading of their performance. They include primarily (i) capital gains and losses on disposal and impairment of Investments in associates; and (ii) when material, non-recurring items as defined by Danone included in the net income from associates.
Recurring net income (or Recurring net income – Group Share) corresponds to the Group share of the consolidated recurring net income. Recurring net income measures Danone’s recurring performance and excludes significant items that, because of their exceptional nature, cannot be viewed as inherent to its recurring performance. Such non-recurring income and expenses mainly include other operating income and expense, other non-recurring financial income and expense, non-recurring tax, and non-recurring income from associates. Such income and expenses excluded from Net income are defined as Non-recurring net income and expenses.
Recurring EPS (or Recurring net income – Group Share, per share after dilution) is defined as the ratio of Recurring net income ad-justed for hybrid financing over the Diluted number of shares. In compliance with IFRS, income used to calculate EPS is adjusted for the coupon related to the hybrid financing accrued for the period and presented net of tax.
Yakult Transaction Impact corresponds to the amount to deduct from Danone’s 2017 recurring net income to reflect an interest in Yakult in 2017 identical to the interest prevailing in 2018 following the completion of the intended partial disposal. It is computed as the difference between Danone’s interest in Yakult after the transaction and 21.29% applied on a prorated basis to 2017 profit from Yakult as estimated by Danone for its 2017 consolidated financial statements.
Free cash flow represents cash flows provided or used by operating activities less capital expenditure net of disposals and, in connection with IFRS 3 (Revised), relating to business combinations, exclud-ing (i) acquisition costs related to business combinations; and (ii) earn-outs related to business combinations and paid subsequently to acquisition date.
Net financial debt represents the net debt portion bearing interest. It corresponds to current and non-current financial debt (i) excluding Liabilities related to put options granted to non-controlling interests; and (ii) net of Cash and cash equivalents, Short term investments and Derivatives – assets managing net debt.
3.7 DOCUMENTS AVAILABLE TO THE PUBLICThe by-laws, the minutes of Shareholders’ Meetings, reports of the Statutory auditors, and other corporate documents may be consulted at the Company’s registered office. Moreover, historical financial
information and certain information regarding the organization and businesses of the Company and its subsidiaries are available on Danone’s website in the section pertaining to regulated information.
3
BUSINESS HIGHLIGHTS IN 2017 AND OUTLOOK FOR 2018
DANONE REGISTRATION DOCUMENT 2017 71