Embed Size (px)
Citation preview

1CONFIDENTIAL, For Nalco Employee Use Only 2006 Nalco Company
Cooling Water Application and Best Practices Guide – Book 313 (5-06)
Section 3.1
INTRODUCTION
Whether called a total system survey or a system audit, the end result should be the same.
The goals are to gain a thorough understanding of the entire cooling system from a mechanical,
operational, and chemical (MOC) point of view. Armed with this information, we can determine
where the system stresses are so that treatment programs can be optimized and we can provide
maximum value to our customers.
The goal of this Application and Best Practices Guide is to provide:
• The “how to” for auditing different types of systems and equipment
• The calculations needed to analyze the information gathered
• Troubleshooting ideas for common problems
• Analysis to determine where value can be provided
• “Adding Value” Examples
First we will look at the MOC approach for system surveys as a whole. Subsequent sections in
this Guide will cover the specifics for cooling towers, heat exchangers, chillers, condensers,
and other types of systems, such as air washers and scrubber systems. The final section provides
examples illustrating how important the entire cost picture can be in proving value.
PURPOSE
From a technical point of view, the objective of
a plant survey is to gather facts about a system
concerning the design, function, and operation
of the system. The survey data can be used to
optimize the treatment program, create a pro-
posal for a new program, troubleshoot problems,
confirm standard operating conditions, and
identify improvements that can be made. Data
collected in the survey should be compared to
design specifications to evaluate current opera-
tion vs. initial design operation. Differences can
help point to opportunities for improvements,
areas of stress in the system, or problems that
need to be solved. Key to understanding the
operation is knowing where the stress points of
the system are, so that the treatment program can
be best optimized for those stresses. Optimizing
the treatment program for the system stress
points will provide the optimum results and the
best value for that system.
There are key reasons why this important. First,
efficiency loss in any part of the system can
cause increased costs for the entire process. This
can come from lost heat transfer capability in an
exchanger or even from the cooling tower itself.
For example, an improperly maintained cooling
tower produces warmer cooling water, which
reduces the efficiency of any system. If this
system contains a chiller, the annual cost of
electricity for the chiller is a significant part of
operating costs. These costs can be 2-3% higher
for every 1°F increase in condenser water
temperature (3-4% higher for a 1°C increase).
An annual survey to identify needed mainte-
nance on the evaporative cooling equipment
prolongs the life of the tower and can result in
significant energy savings.
Another key reason for optimizing the program
for system stresses is to maximize the safety and
reliability of plant operation. The costs associ-
ated with poor plant reliability or availability can
quickly dwarf those associated with efficiency
of operation. A process shutdown resulting from
a fouled heat exchanger causes lost production
in addition to the costs of cleaning or repair.
MECHANICAL – OPERATIONAL – CHEMICAL SURVEY CONCEPT

Section 3.1
INTRODUCTION
2 CONFIDENTIAL, For Nalco Employee Use Only 2006 Nalco Company
Cooling Water Application and Best Practices Guide – Book 313 (5-06)
Sometimes, a shutdown from water-related
failures can cripple an entire plant. In large,
integrated facilities, these costs can easily reach
millions of dollars. Finally, in most cases, safety,
efficiency, and reliability are inextricably linked.
The goal of a survey is to understand the system
and processes well enough to identify areas
where the cooling system program or operation
can add value to the process. That is, demon-
strate the value of the treatment program. This is
where an engineering perspective, which makes
a detailed, thorough audit of the system, comes
in handy. To understand the system, it is neces-
sary to have relevant plant information and
water treatment history. The thorough engineer
will look at the mechanical, operational, and
chemical aspects of the entire system to collect
that information. This is the MOC concept that
will be detailed in this Guide.
SURVEY PROCESS
A thorough MOC (Mechanical – Operational –
Chemical) system audit has the following
characteristics:
• Studies the system with an engineering
perspective
• Provides mechanical details about the process
and system
• Collects operating history data, including costs
of operation
• Understands the chemistry of the system
through use of the Optimizer
• Analyzes operating control using SPC
techniques
• Validates the data and especially the costs of
the cooling system operation
• Identifies the current stresses and compares
those to optimum stress conditions to create
recommendations that manage the stresses to
maximize value
There are several ways to do a survey – from a
basic checklist (easy) to a detailed MOC evalua-
tion including heat exchanger modeling and
statistical analysis. Table 3.1.1 indicates areas of
investigation in each of the MOC survey catego-
ries. Best practice calls for the survey to paint a
baseline picture of the historical operating
condition of the process, and then update with
new information as often as necessary. There are
three areas to focus our survey efforts. Since
these areas interact in predictable and unpredict-
able ways, it is our challenge to keep on top of
changes that affect the process and document
them in our survey.
M – Mechanical Tower inspection
Heat exchanger types and
orientation
Exchanger metallurgy
Exchanger design and actual
heat loads and flows
Plant diagrams
Design cooling tower
dynamics
Exchanger lifetime
(replacement or cleaning
frequency)
O – Operational Historical control data
Performance monitoring data
Coupon data
Deposit analysis
Chemical application points
Chemical feed systems
System upsets
Automation
C – Chemical Water chemistry
Scale inhibitor(s)
Corrosion inhibitor(s)
Dispersant polymer
Oxidizing biocide
Non-oxidizing biocide
Biodispersant
Table 3.1.1 – Examples of M-O-C survey areas.

3CONFIDENTIAL, For Nalco Employee Use Only 2006 Nalco Company
Cooling Water Application and Best Practices Guide – Book 313 (5-06)
Section 3.1
INTRODUCTION
Other questions to ask should include the
following:
• What products and programs are being used?
• What are the operational costs of the
program?
• Are the volumes of product being used
consistent with initial projections?
• What level of program performance is being
obtained and does it meet the customer’s
expectation?
• What are the deficiencies in the program?
• What improvements could be made?
• What new customer goals may be achieved?
When reviewing mechanical data, it is important
to look for changes, either from design or from
the previous survey. Sometimes plants have been
significantly modified over the years such that
the duty on some exchangers bears no resem-
blance to the original specifications. In this case,
the current stresses in the system may be signifi-
cantly different than design.
Both operating history and current operational
data should be collected on the system. The
operating history involves information about
problems that have occurred and can often be
collected from service reports of the sales
representative. Examples of operational prob-
lems that may occur include:
• Temporary failure of the acid feed system
• Sour leaks
• Bleach tank empty due to delayed delivery
• Fire prevention system water periodically used
for tower makeup
Operational data would include the daily water
analyses done to monitor and control the cooling
system. Examples of historical control data that
should be collected include key operating
parameters such as the following:
• pH control data
• Concentration Ratio (CR) data
• Holding Time Index (HTI) data
• Free halogen residuals
• Product residual data
Nalco’s TRASAR® monitoring data is invalu-
able. Data from performance monitoring sys-
tems, such as heat exchanger performance or
continuous corrosion monitoring equipment are
valuable. This operational data can be evaluated
to provide information on control capability
using programs like Nalco’s VANTAGE® V100.
Recent operational data on water chemistry
should be validated with a thorough analysis
of the makeup water and cooling tower water
by one of the Nalco analytical laboratories.
Remember, a given water analysis only provides
a snapshot of the conditions at that particular
point in time. For thorough analysis of stresses
due to water chemistry, programs like the
Optimizer program can be used. Water chem-
istry conditions should be studied over an
extended period of time, and a range of analyses
should be used for these programs including an
average, the high concentration, and low con-
centration conditions for the makeup water.
Logging data into VANTAGE V100 provides
easy access to average, high and low values
for every parameter.
The audit provides an opportunity to review and
update all information available, to assess the
quality of the water treatment program, and to

Section 3.1
INTRODUCTION
4 CONFIDENTIAL, For Nalco Employee Use Only 2006 Nalco Company
Cooling Water Application and Best Practices Guide – Book 313 (5-06)
take appropriate actions necessary as preemptive
measure against potential problems. It also
provides an opportunity to meet with and gather
input from a variety of plant personnel, such as
shift operators, support engineers, maintenance
mangers, environmental managers, and others.
The survey should also include information on
what the customer would like to have improved.
Obviously, the customer may have specific goals
to achieve that may be different from the previ-
ous time a survey was done. An annual survey or
audit can be part of system inspections during
turnarounds, which are opportunities to perform
troubleshooting inspections.
SYSTEM STRESSES
The concept of stress analysis is important in a
complete system audit. Understanding where the
stresses are in a system is key to defining the
optimum treatment program. The stresses can be
divided into the MOC areas as follows:
Mechanical Stresses
• Conditions in heat exchangers
• Metallurgy, such as galvanic corrosion or the
effect of surface roughness on deposition
• Any part of the cooling tower that is not
functioning at its peak
• Problem areas such as dead-legs, shell side
units, high elevation exchangers, etc.
Operational Stresses
• The impact of variability of key operational
parameters
• Halogen control and resulting variability of
microbial control or influence on corrosion of
yellow metals
Chemical Stresses
• Chemical composition of makeup and recircu-
lating water
• Impact of chemical treatment programs
Mechanical Stresses
Any stress that impacts the efficiency of heat
transfer, in heat exchangers or the cooling tower,
will impact the total cost of operation (TCO) of
the system. This can be calculated in terms
of process capacity or energy costs in many
cases. Often, deposition or corrosion in heat
exchangers are caused by three main stress
factors:
1. Skin temperature
2. Water velocity
3. Heat flux
The skin temperature in a heat exchanger is the
temperature at the metal-water interface. It is a
function of the water and process temperatures
and flows. The water velocity is the speed at
which the water passes over the exchanger
surfaces. It is determined by the amount of
water flowing through the exchanger and the
cross sectional area available for water flow in
the exchanger. The heat flux is the amount of
heat passing through the tubes per unit area and
unit time.
Higher stress conditions are caused by higher
heat flux and skin temperature. Conversely,
lower water velocity increases the system stress.
The box, Mechanical Stress Ranges gives ranges
for severity of these stresses. (Note these are
examples that may vary in different systems.)
The stress caused by high skin temperature, high
heat flux, and low water velocity can have a
common impact on the cooling system:
• Increase the potential for many mineral scale
deposits
• Increase the potential for fouling by suspended
solids
• Bake soft deposits into harder deposits that are
more difficult to remove

5CONFIDENTIAL, For Nalco Employee Use Only 2006 Nalco Company
Cooling Water Application and Best Practices Guide – Book 313 (5-06)
Section 3.1
INTRODUCTION
• Increase the corrosion rates
• Reduce the effectiveness of some treatment
chemicals
• Create a potential for under-deposit corrosion
mechanisms
Note that high water velocity can also be a
stress. High water velocity can cause erosion-
corrosion in soft metals like copper and copper
alloy heat exchanger tubes. This can be aggra-
vated by suspended material in the water.
A summary of the input and output of the
mechanical part of the audit process is shown in
Figure 3.1.1. This illustrates the information
used to identify the problem heat exchangers.
The stress points can be used later with the
chemical analyses to evaluate different treatment
options with the Optimizer.
Operational Stresses
Variation of operational and control parameters
also causes stress in a cooling system. This can
be caused by variation of water chemistry, the
control capability of the system, or other factors.
Three key examples of operational stresses are
as follows:
1. Variation of cycles of concentration (CR)
2. Variation of pH
3. Variation of holding time index (HTI)
MECHANICAL STRESS RANGES
SKIN TEMPERATURE
• Mild Stress < 120oF (< 50oC)
• Moderate Stress 120-140oF (50-60oC)
• High Stress 140-160oF (60-70oC)
• Severe Stress > 160oF (> 70oC)
HEAT FLUX
• Mild Stress < 2500 BTU/h•ft2
(< 7.5 kW/m2)
• Moderate Stress 2500-8000 BTU/h•ft2
(7.5-25 kW/m2)
• High Stress 8000-12500 BTU/h•ft2
(25-40 kW/m2)
• Severe Stress > 12500 BTU/h•ft2
(> 40 kW/m2)
WATER VELOCITY
• Mild Stress > 3 ft/s (> 1 m/s)
• Moderate Stress 2-3 ft/s (0.6-1 m/s)
• High Stress 1-2 ft/s (0.3-0.6 m/s)
• Severe Stress < 1 ft/s (< 0.3 m/s)
Figure 3.1.1 – Illustration of the results of
mechanical component of a system audit.

Section 3.1
INTRODUCTION
6 CONFIDENTIAL, For Nalco Employee Use Only 2006 Nalco Company
Cooling Water Application and Best Practices Guide – Book 313 (5-06)
Variability of these control parameters causes
significant system stress. The severity of the
stress caused by cycles of concentration is
impacted by the type of control system for
blowdown, variability of system water leaks,
and variability of makeup water chemistry.
For pH control, the severity of stress is a func-
tion of the type of pH control system, variability
of the makeup water rate and alkalinity, and
system contamination. The variability of HTI
depends primarily on the control of cycles of
concentration.
The impact of poor control is directly evidenced
by poor results, although each control parameter
may have a different result. The box Operational
Stresses illustrates the severity of stress resulting
from different size variations for the three
control parameters mentioned above. The impact
of variation of control can be different depend-
ing on whether the variability is on the high side
of the control range vs. the low side of the
control range. Table 3.1.2 shows the impact of
variation in control on the high side and low side
of each control parameter.
OPERATIONAL STRESSES
VARIATION OF CONC. CYCLES (% of mean)
• Mild Stress < 20%
• Moderate Stress 20-50%
• High Stress 50-80%
• Severe Stress > 80%
VARIATION OF PH
• Mild Stress ± 0.1 unit
• Moderate Stress ± 0.2 units
• High Stress ± 0.4 units
• Severe Stress ± 0.6 units
VARIATION OF HOLDING TIME INDEX
• Mild Stress < 40 h
• Moderate Stress 40-100 h
• High Stress 100-200 h
• Severe Stress* > 200 h
*Very low HTI (<20 h) can also be a high or severe
stress condition. It can be difficult to control inhibitor
levels in this case and poor non-oxidizing biocide
performance can result from short contact time.
Note: these are typical stress ranges. For higher
concentration ratios or higher pH, the severity of
stress may increase with smaller variation than
indicated here.
Operational Stress Impact of Variation on High-side Impact of Variation onof Range Low-side of Range
Increases potential for scale formation Excessive water consumptionand deposition and excessive chemical costs
Increases corrosion potential onstainless steel as chloride ion increases
Variation of pH Increases potential for scale formation Increases potential for corrosionand deposition
Reduces efficiency of oxidizingbiocides, particularly chlorine
Variation of Holding Increases potential for product None, other than those related toTime Index (HTI) degradation through: low cycles of concentration
• Adsorption mechanisms• Undesirable reactions with halogens• Hydrolysis (particularly polyphosphates)• Precipitation (particularly with zinc or phosphate)
Increases potential for scale formationand deposition of suspended solids
Variation of
Concentration
Cycles (CR)
Table 3.1.2 – Impact of poor control for common cooling water parameters.

7CONFIDENTIAL, For Nalco Employee Use Only 2006 Nalco Company
Cooling Water Application and Best Practices Guide – Book 313 (5-06)
Section 3.1
INTRODUCTION
Finally, Figure 3.1.2 shows the input and output
of this phase of the audit. To illustrate this in
more detail, an example of analysis of opera-
tional control using the VANTAGE V100
program is shown in Figure 3.1.3. Here, a trend
chart for pH measurements is plotted above a
trend chart of calculated phosphate solubility.
The phosphate solubility can be determined
from the water chemistry operational data and
programs like the Optimizer. In the example in
Figure 3.1.3, the high pH spikes correlate
directly to low solubility of phosphate. This can
cause loss of corrosion inhibition and phosphate
scale. If continuous corrosion monitoring data
are available, a trend chart may show increases
in corrosion when the pH is at the low extremes
in this example. Thus, the operational phase of
the audit can directly show the results of vari-
ability of control and the control capability of
the system. This phase can be used to show the
value of automated control equipment like
TRASAR.
Figure 3.1.2 - Illustration of information and
analysis for operational phase of audit.
Figure 3.1.3 – Trend charts of operating data for pH and phosphate solubility show that phosphate
deposition can occur during high pH spikes. Potentially, increased corrosion can occur when the
phosphate levels are low.

Section 3.1
INTRODUCTION
8 CONFIDENTIAL, For Nalco Employee Use Only 2006 Nalco Company
Cooling Water Application and Best Practices Guide – Book 313 (5-06)
Chemical Stresses
The chemical composition of the makeup water
and hence the recirculating water can create
stresses, in combination with heat exchanger
stresses and operational variation. The water
chemistry will directly impact the potential for
corrosion, scale formation, deposition, and
microbial growth. The stress placed on a system
by chemical factors is a function of a variety of
parameters:
• Chemical composition of the makeup water
• Operational variability, particularly of concen-
tration cycles, pH, and HTI
• Mechanical factors like skin temperature and
water velocity
• Treatment program chosen, the concentration
of actives, and dosage control
• System contamination
Modeling the water chemistry under different
conditions is necessary to determine the scaling
potential of the system. This is the value of
programs like the Optimizer. The impact of
different treatment programs on mineral
solubility can also be evaluated. The response
of different scaling potentials can be determined
as a function of pH, concentration ratio, and
temperature. This can yield the optimum operat-
ing conditions for a system, based on operating
control and mechanical stresses in the system.
An example is shown in Figure 3.1.4, where the
optimum operational window for a phosphate-
based program is illustrated by the circled area.
This shows the Saturation Index (SI) of a scale-
forming mineral as a function of pH and concen-
tration cycles. The medium gray bars in the
circled area represent a Saturation Index that can
be handled by the treatment program. The light
gray and dark gray bars show unacceptable
scaling tendency. The area with the very short
bars represents unnecessarily low pH or low
concentration cycles. The optimum window is a
balance between the maximum cycles possible
and the ability of the treatment program to
prevent deposition and corrosion.
This step should be repeated for other scale
forming minerals and over a variety of condi-
tions. Trends for the makeup water chemistry
over time are valuable inputs for this analysis.
This allows the full range of water chemistry to
be evaluated. The ion concentrations can be
varied to study typical conditions up to the
maximum concentrations that may occur. In
many cases, evaluating scaling tendency at the
mean concentrations plus 2 sigma would cover
most situations. (Note: 2 sigma equals two
standard deviations from the mean, which can be
calculated with simple statistics from a set of
data.) The inputs and output of this phase of the
audit are summarized in Figure 3.1.5.
Figure 3.1.4 – Example of the operating window
for system pH and concentration cycles based
on mineral solubility.

9CONFIDENTIAL, For Nalco Employee Use Only 2006 Nalco Company
Cooling Water Application and Best Practices Guide – Book 313 (5-06)
Section 3.1
INTRODUCTION
METHODS AND TOOLS
Inspection methods include a variety of tools
and techniques, and may be slightly different for
different parts of the cooling system. A variety
of spreadsheets are available for collecting the
information during an audit. Rather than recom-
mending a given spreadsheet or survey form,
this manual will include checklists to illustrate
the types of information that should be collected.
A complete survey will include photographs of
various parts of the system as well as samples
taken for analysis.
Diagnostic TRASAR can provide useful tech-
niques for accurately determining a variety of
system parameters. Most of those techniques
will be mentioned where they are applicable.
The details of how to perform the diagnostic
TRASAR techniques will be covered in the
specific section devoted to them.
The VANTAGE V100 program can be a useful
means for analyzing control data from the
system. This program allows the input of
operating data collected over time and entered
into an Excel spreadsheet. The data are evalu-
ated using SPC techniques to show the control
capability of the system.
A variety of other tools are available to help
collect system data and evaluate the perfor-
mance of the system. These include sling
psychrometers, infrared temperature guns,
ultrasonic flow meters, and vibration analyzers.
VALIDATION
It is valuable to perform a survey with plant
personnel to ensure that you are collecting the
appropriate information. Due to the time com-
mitment, your customer may not be able to
participate with you all of the time. However,
you should still validate the data that you have
collected with them to ensure that the informa-
tion is correct. This is especially important with
any cost related information to ensure that
subsequent value calculations are accurate and
agreed upon by the customer. Verification of the
information gathered in the audit is essential.
ANALYSIS AND CALCULATIONS –
STRESS MANAGEMENT
Analysis of the information collected can be as
extensive as collection of the information itself,
and is an essential part of a survey or an audit.
Aspects of this analysis were discussed in the
section on System Stresses earlier in this chap-
ter. Taking this a step further, the analysis can
also be viewed in MOC terms as identification
of the stresses in each area, analysis of the
impact to the operating cost, and managing the
system at the optimum points for stress and cost.
This is shown conceptually in Figure 3.1.6.
Assessment of the impact of various stresses
involves understanding the costs of different
operating modes. These stresses on a cooling
system are very system specific. Consequently,
to be able to demonstrate the value of stress
management, identification of the stresses with
greatest impact on cooling system performance
is essential. The next step is to understand the
extent to which these key stresses impact on the
Figure 3.1.5 – Schematic illustration of input
and output of chemical phase of a survey.

Section 3.1
INTRODUCTION
10 CONFIDENTIAL, For Nalco Employee Use Only 2006 Nalco Company
Cooling Water Application and Best Practices Guide – Book 313 (5-06)
total cost of operation (TCO). By understanding
the total costs of the cooling system operation
and treatment, one is best able to determine the
return on investment (ROI).
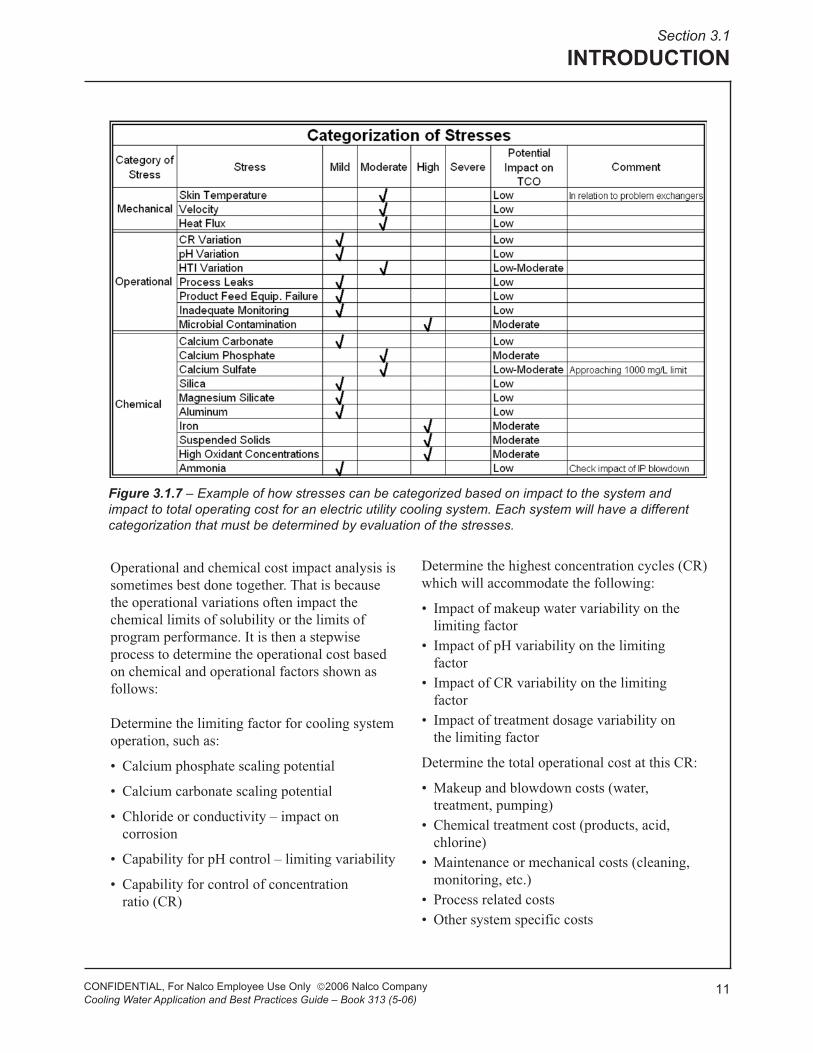
The categorization of stresses shown in Figure
3.1.7 was designed to help facilitate this process.
Potential MOC-related stresses are listed and
assigned a mild, moderate, high, or severe rating
to quantify the impact of each stress. Then, a
rating of how each stress could impact the TCO
is assigned, for a given facility. The example
shown in Figure 3.1.7 is from an electric power
facility. In this case, mechanical stresses are
moderate, with a low impact on costs, because
the main condenser has tube-side water, high
water velocity, and alloyed tubes. However,
microbial fouling could be a high stress with a
moderate impact on costs, due to the impact of
microbial films on heat transfer. The characteris-
tics of each stress and its potential impact on
costs must be determined for each individual
cooling system. The ratings of stresses could be
extremely different in a refinery with mild steel
exchangers and shell-side water.
Having all the stress-related information in one
place should help highlight potential interrela-
tionships between the stresses, making it less
likely that any are overlooked when designing a
stress management strategy. This method also
assists in prioritizing the emphasis of the stress
management strategy by starting with the severe
stresses and working backwards. Better identifi-
cation of stresses in relation to total cost of
operation will better demonstrate the value of
stress management. This is an essential compo-
nent of the MOC approach.
Mechanical aspects of the cost impact
analysis would include some of the following
parameters:
• Establishing the frequency and cost of heat
exchanger cleaning
• Estimating the cost of lost heat transfer
efficiency due to operating beyond stress
points
• Estimating the cost of corrosion
• Establishing the system maintenance costs
Figure 3.1.6 – Representation of audit steps in terms of stress identification
and analysis.
11CONFIDENTIAL, For Nalco Employee Use Only 2006 Nalco Company
Cooling Water Application and Best Practices Guide – Book 313 (5-06)
Section 3.1
INTRODUCTION
Operational and chemical cost impact analysis is
sometimes best done together. That is because
the operational variations often impact the
chemical limits of solubility or the limits of
program performance. It is then a stepwise
process to determine the operational cost based
on chemical and operational factors shown as
follows:
Determine the limiting factor for cooling system
operation, such as:
• Calcium phosphate scaling potential
• Calcium carbonate scaling potential
• Chloride or conductivity – impact on
corrosion
• Capability for pH control – limiting variability
• Capability for control of concentration
ratio (CR)
Determine the highest concentration cycles (CR)
which will accommodate the following:
• Impact of makeup water variability on the
limiting factor
• Impact of pH variability on the limiting
factor
• Impact of CR variability on the limiting
factor
• Impact of treatment dosage variability on
the limiting factor
Determine the total operational cost at this CR:
• Makeup and blowdown costs (water,
treatment, pumping)
• Chemical treatment cost (products, acid,
chlorine)
• Maintenance or mechanical costs (cleaning,
monitoring, etc.)
• Process related costs
• Other system specific costs
Figure 3.1.7 – Example of how stresses can be categorized based on impact to the system and
impact to total operating cost for an electric utility cooling system. Each system will have a different
categorization that must be determined by evaluation of the stresses.
Section 3.1
INTRODUCTION
12 CONFIDENTIAL, For Nalco Employee Use Only 2006 Nalco Company
Cooling Water Application and Best Practices Guide – Book 313 (5-06)
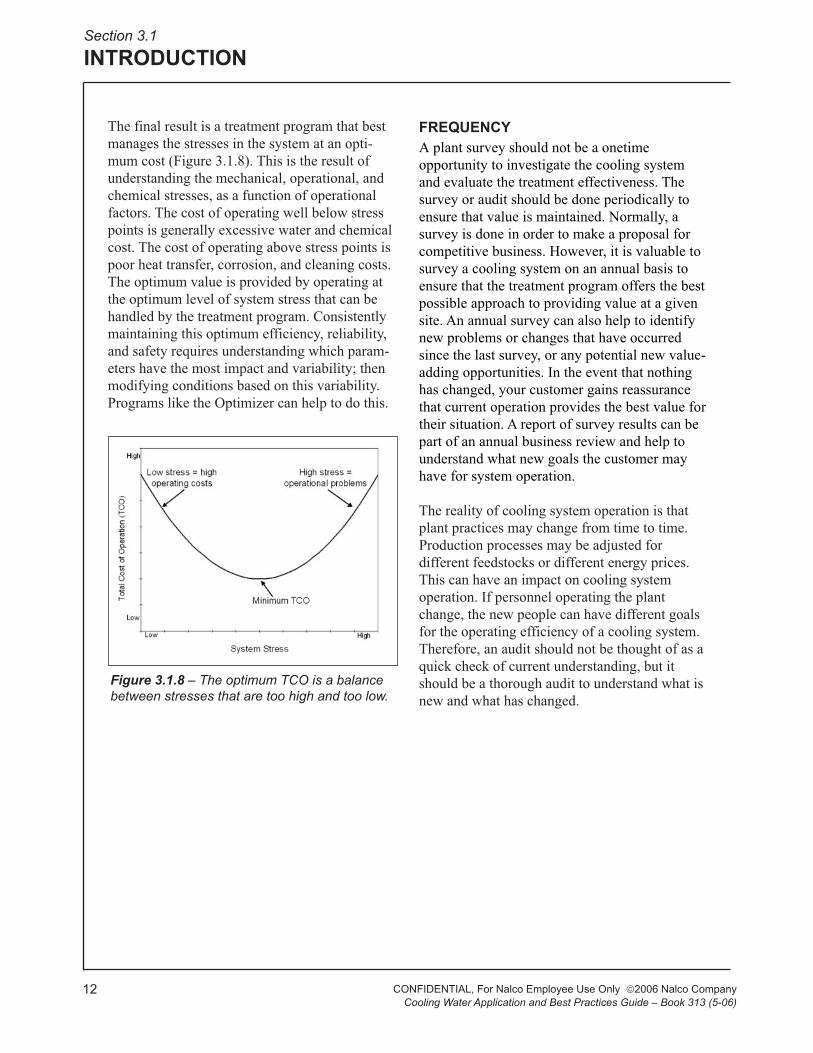
The final result is a treatment program that best
manages the stresses in the system at an opti-
mum cost (Figure 3.1.8). This is the result of
understanding the mechanical, operational, and
chemical stresses, as a function of operational
factors. The cost of operating well below stress
points is generally excessive water and chemical
cost. The cost of operating above stress points is
poor heat transfer, corrosion, and cleaning costs.
The optimum value is provided by operating at
the optimum level of system stress that can be
handled by the treatment program. Consistently
maintaining this optimum efficiency, reliability,
and safety requires understanding which param-
eters have the most impact and variability; then
modifying conditions based on this variability.
Programs like the Optimizer can help to do this.
FREQUENCY
A plant survey should not be a onetime
opportunity to investigate the cooling system
and evaluate the treatment effectiveness. The
survey or audit should be done periodically to
ensure that value is maintained. Normally, a
survey is done in order to make a proposal for
competitive business. However, it is valuable to
survey a cooling system on an annual basis to
ensure that the treatment program offers the best
possible approach to providing value at a given
site. An annual survey can also help to identify
new problems or changes that have occurred
since the last survey, or any potential new value-
adding opportunities. In the event that nothing
has changed, your customer gains reassurance
that current operation provides the best value for
their situation. A report of survey results can be
part of an annual business review and help to
understand what new goals the customer may
have for system operation.
The reality of cooling system operation is that
plant practices may change from time to time.
Production processes may be adjusted for
different feedstocks or different energy prices.
This can have an impact on cooling system
operation. If personnel operating the plant
change, the new people can have different goals
for the operating efficiency of a cooling system.
Therefore, an audit should not be thought of as a
quick check of current understanding, but it
should be a thorough audit to understand what is
new and what has changed.
Figure 3.1.8 – The optimum TCO is a balance
between stresses that are too high and too low.

13CONFIDENTIAL, For Nalco Employee Use Only 2006 Nalco Company
Cooling Water Application and Best Practices Guide – Book 313 (5-06)
Section 3.1
INTRODUCTION
SUMMARY
An audit or complete system survey is essential
to understand the total operation and the cost
impact of a cooling system on the process that it
serves. The concepts presented in this introduc-
tion can be summarized in a pyramid that has
ROI or Added Value at the pinnacle (Figure
3.1.9). The foundation is the use of MOC
concepts to gain understanding of the system,
and relate it to the total cost of operation (TCO).
The customer goals, opportunities for improve-
ment in system operation, and anything that
currently dissatisfies the customer can provide
direction for selecting a treatment approach.
Understanding the stresses in the system, and
how treatment programs interact with those
stresses, is essential to optimizing the total cost
of operation. These costs can be challenging to
uncover since they include much more than just
the treatment costs. Understanding the impact on
production costs, system maintenance, or utility
costs can truly show where value can be gained.
Better stress identification and relating these
stresses to TCO will lead to greater demonstra-
tion of value.
The MOC concepts provide a complete frame-
work to gather and analyze the information
needed to reach the top of the pyramid. This
manual will provide methods to survey different
types of systems and calculate the value, and
hence ROI, that an optimized program can
provide.
Figure 3.1.9 – Illustration of the steps and results of a complete MOC survey.
ROI,AddedValue
PAYOFF
Understand andoptimize stresses and TCO
IMPLICATIONS
Customer goals, opportunities andcurrent dissatisfaction
PROBLEMS
Discovering facts about the system and operation –MOC Survey Concepts
SITUATION

Section 3.1
INTRODUCTION
14 CONFIDENTIAL, For Nalco Employee Use Only 2006 Nalco Company
Cooling Water Application and Best Practices Guide – Book 313 (5-06)
This page has been intentionally left blank.
For your notes: