Embed Size (px)
Citation preview
One Gateway Plaza Los Angeles, CA 90012-2952
213.922.2ooo Tel metro. net
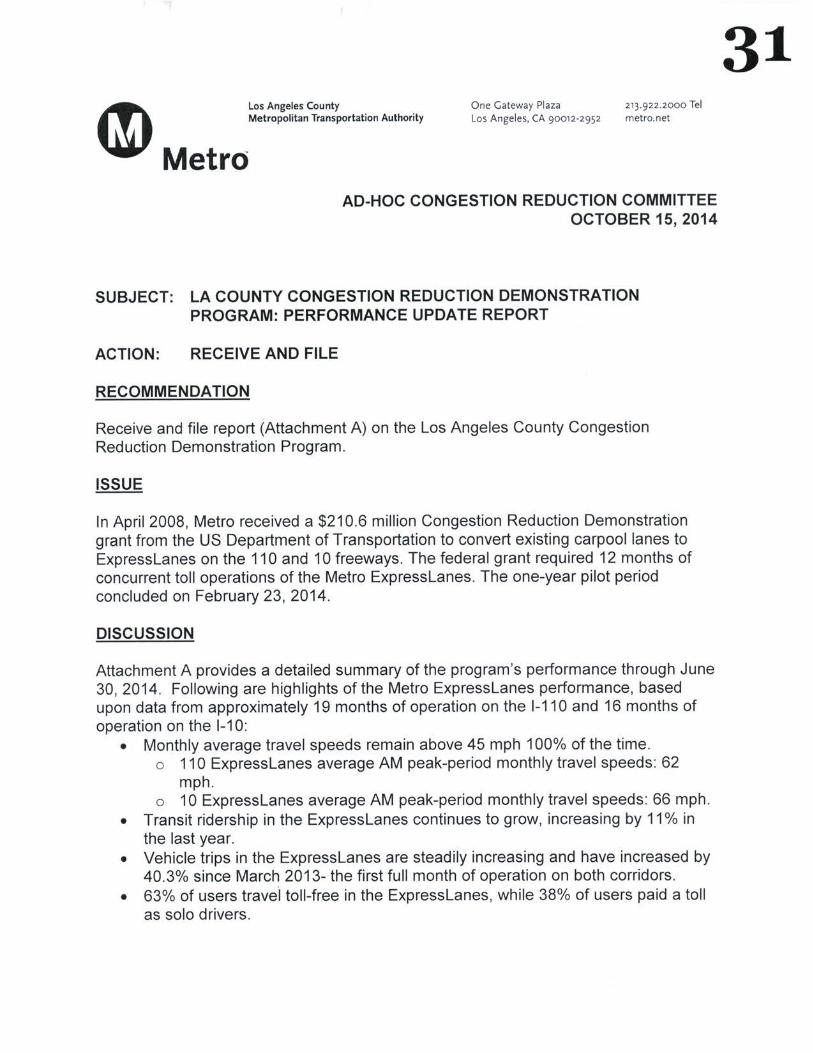
AD-HOC CONGESTION REDUCTION COMMITTEE OCTOBER 15, 2014
SUBJECT: LA COUNTY CONGESTION REDUCTION DEMONSTRATION PROGRAM: PERFORMANCE UPDATE REPORT
ACTION: RECEIVE AND FILE
RECOMMENDATION
Receive and file report (Attachment A) on the Los Angeles County Congestion Reduction Demonstration Program.
ISSUE
In April 2008, Metro received a $210.6 million Congestion Reduction Demonstration grant from the US Department of Transportation to convert existing carpool lanes to Expresslanes on the 11 0 and 1 0 freeways. The federal grant required 12 months of concurrent toll operations of the Metro Express lanes. The one-year pilot period concluded on February 23, 2014.
DISCUSSION
Attachment A provides a detailed summary of the program's performance through June 30, 2014. Following are highlights of the Metro Expresslanes performance, based upon data from approximately 19 months of operation on the 1-11 0 and 16 months of operation on the 1-1 0:
• Monthly average travel speeds remain above 45 mph 1 00% of the time. o 11 0 Express lanes average AM peak-period monthly travel speeds: 62
mph. o 10 Expresslanes average AM peak-period monthly travel speeds: 66 mph.
• Transit ridership in the Express lanes continues to grow, increasing by 11% in the last year.
• Vehicle trips in the Expresslanes are steadily increasing and have increased by 40.3% since March 2013- the first full month of operation on both corridors .
• 63% of users travei toll-free in the Expresslanes, while 38% of users paid a toll as solo drivers.
31
A total of 297,342 transponders have been issued through June 30, 2014. The distribution among Los Angeles County households indicates that the FasTrak® account holders are represented by all income levels, and the majority (66%) of account holders live in areas where the annual household income is less than $75,000.
Recently, the Los Angeles Department of Transportation (LADOT) installed new overhead signage at Figueroa Way, allowing all drivers traveling Westbound on Adams Blvd to access Northbound Figueroa Street via Figueroa Way. This road was previously restricted to carpools only as part of the Harbor Freeway Transitway Project. This new access will benefit 1-11 0 Express Lanes users, who use the Adams exit, to save time by bypassing the intersection at Adams and Figueroa and use Figueroa Way to continue their commute into Downtown Los Angeles. Since the installation of the new signage , LADOT reported a 10% increase in usage of Figueroa Way.
ATTACHMENT
A. Metro ExpressLanes Performance Update-Through June 30, 2014
Prepared by: Ruby Arellano, Transportation Planner, 213.922.1488 Shahrzad Amiri, Executive Officer, Congestion Reduction , 213-922-3061
Performance Update Report Page 2
Step~ Executive Director, Vendor Contract Management
Arthur T. Leahy Chief Executive Officer
Performance Update Report Page 3

SEPTEMBER 25, 2014
Note: The data contained in this report is based upon 19 and a half months ~.operation on the 110 corridor and 16 months of operation o the 10 corridor.
-
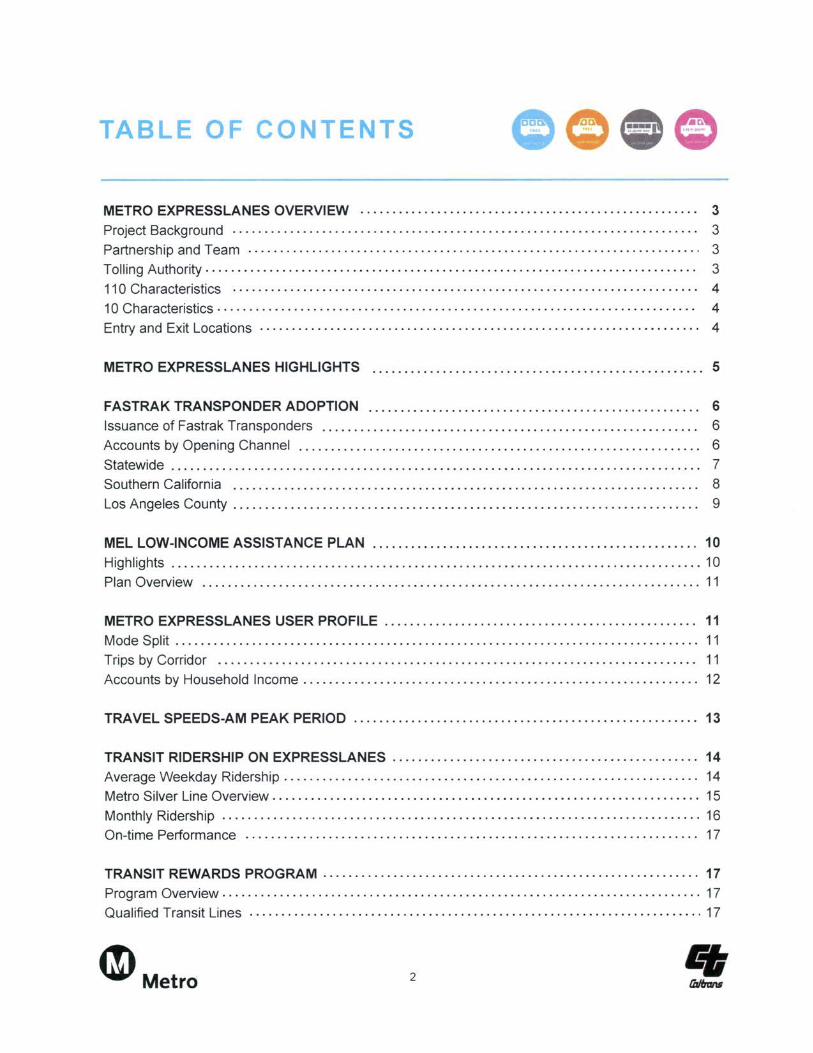
TABLE OF CONTENTS
METRO EXPRESSLANES OVERVIEW ................................ · . · . · ... · . · · · · · · · · · · · 3 Project Background ................................................................ · . · · . · · · · 3
Partnership and Team ........................................................... · · · · · · · · · · · 0 3
Tolling Authority ......................................................... · .. · · .. · · · · · · · · · · · · · 3
11 0 Characteristics ....................................... .. ................... · · · · · · · · · · · · · 4
1 0 Characteristics · · · · · · · · · · · · · · · · · · · · · · · · · · · · · · · · · · · · · · · · · · · · · · · · · · · · · · · · · · · · · · · · · · · · · · · · · · · 4
Entry and Exit Locations · · · · · · · · · · · · · · · · · · · · · · · · · · · · · · · · · · · · · · · · · · · · · · · · · · · · · · · · · · · · · · · · · · · · · 4
METRO EXPRESSLANES HIGHLIGHTS . . . . . . . . . . . . . . . . . . . . . . . . . . . . . . . . . . . . . . . . . . . . . . . . . . . . 5
FASTRAK TRANSPONDER ADOPTION . . . . . . . . . . . . . . . . . . . . . . . . . . . . . . . . . . . . . . . . . . . . . . . . . . . . 6 Issuance of Fastrak Transponders ......................... 0 ....................... 0......... 6
Accounts by Opening Channel . . . . . . . . . . . . . . . . . . . . . . . . . . . . . . . . . . . . . . . . . . . . . . . . . . . . . . . . . . . . . . . 6
Statewide . . . . . . . . . . . . . . . . . . . . . . . . . . . . . . . . . . . . . . . . . . . . . . . . . . . . . . . . . . . . . . . . . . . . . . . . . . . . . . . . . . . 7
Southern California . . . . . . . . . . . . . . . . . . . . . . . . . . . . . . . . . . . . . . . . . . . . . . . . . . . . . . . . . . . . . . . . . . . . . . . . . 8
Los Angeles County . . . . . . . . . . . . . . . . . . . . . . . . . . . . . . . . . . . . . . . . . . . . . . . . . . . . . . . . . . . . . . . . . . . . . . . . . 9
MEL LOW-INCOME ASSISTANCE PLAN ................................................... 10 Highlights .................. . .. . ....................... 0 ••••••••••••••••••••••••••••••••••••• 10
Plan Overview . . . . . . . . . . . . . . . . . . . . . . . . . . . . . . . . . . . . . . . . . . . . . . . . . . . . . . . . . . . . . . . . . . . . . . . . . . . . . . 11
METRO EXPRESSLANES USER PROFILE . . . . . . . . . . . . . . . . . . . . . . . . . . . . . . . . . . . . . . . . . . . . . . . . . 11 Mode Split . . . . . . . . . . . . . . . . . . . . . . . . . . . . . . . . . . . . . . . . . . . . . . . . . . . . . . . . . . . . . . . . . . . . . . . . . . . . . . . . . . 11
Trips by Corridor . . . . . . . . . . . . . . . . . . . . . . . . . . . . . . . . . . . . . . . . . . . . . . . . . . . . . . . . . . . . . . . . . . . . . . . . . . . 11
Accounts by Household Income .............................................................. 12
TRAVEL SPEEDS-AM PEAK PERIOD . . . . . . . . . . . . . . . . . . . . . . . . . . . . . . . . . . . . . . . . . . . . . . . . . . . . . . 13
TRANSIT RIDERSHIP ON EXPRESSLANES ................................................ 14 Average Weekday Ridership ..................................... 0 ........................... 14
Metro Silver Line Overview ................................................................... 15
Monthly Ridership . . . . . . . . . . . . . . . . . . . . . . . . . . . . . . . . . . . . . . . . . . . . . . . . . . . . . . . . . . . . . . . . . . . . . . . . . . . 16
On-time Performance . . . . . . . . . . . . . . . . . . . . . . . . . . . . . . . . . . . . . . . . . . . . . . . . . . . . . . . . . . . . . . . . . . . . . . . 17
TRANSIT REWARDS PROGRAM ............. o ••••••••••••••••••••••••••••••••••• • •••••••• o 17 Program Overview ..................................................... . ..................... 17
Qualified Transit Lines .......................................... 0 ••••••••••••••••• • •••••••• 0 0 17
a. Metro 2
METRO EXPRESSLANES OVERVIEW
PROJECT BACKGROUND
Los Angeles County is among the most congested areas in the nation _ A pioneer in the development of High
Occupancy Vehicle (HOV) lanes, California's solution to traffic congestion has itself become a casualty of overuse_ In
2008, the federal government provided an opportunity to build a High Occupancy Toll (HOT) lane system in Los
Angeles County with the Congestion Reduction Demonstration (CRD) grant award of significant federal funding
($210.6 million) _ Offering a multi-modal approach , the federal grant funded 59 new clean fuel buses, security and
lighting improvements at transit stations , new bike lockers, LA Express Park, construction of a new El Monte Station ,
expanded transit signal priority in downtown Los Angeles , and the conversion of existing carpool lanes to HOT lanes
on two congested corridors _ This integrated approach is critical to achieve the objective of moving more people - not
more cars _
The Los Angeles County Metropolitan Transportation Authority (Metro) and California Department of Transportation
(Caltrans) partnered on Los Angeles County's first ever HOT lanes , branded as ExpressLanes. The ExpressLanes
opened on November 10, 2012 on the 1-110 Harbor Freeway, between Adams Boulevard and the SR-91 freeway , and
on February 23 , 2013 on the 1-10 El Monte Freeway, between Alameda Street and the 1-605 freeway _
PARTNERSHIP AND T EAM
The combined 110 and 10 project is one of 10 State authorized design-build projects per SB4_ The project delivery
involved countless moving parts and required intensive coordination among multiple agencies, the contractor, elected
officials and their constituencies _ Use of design-build as a delivery method accelerated the project schedule by 9 to
12 months over the traditional design-bid-build delivery method _
The ExpressLanes project was built by Atkinson Contractors, LP under contract to Metro_ The contractor was
competitively selected to design-build-operate-and-maintain the ExpressLanes project. The Atkinson team includes
AECOM for design , Steiny for electrical , and Xerox for tolling integration , operations, and maintenance.
More than 615 stakeholder briefings, including 10 public hearings, have been convened . Marketing and Outreach
efforts were led by Metro staff and supplemented with consultant support: Lee Andrews Group , Noble Insight, Fiona
Hutton & Associates , David Lang & Associates , FAST, the RedHill Group, and The Robert Group_
TOLLING AU T HORI TY
Metro obtained legislative authority in 2008 with Senate Bill 1422 (Ridley-Thomas) which authorizes Metro, in
cooperation with Caltrans, to undertake the conversion of HOV lanes to HOT lanes on the 110 and 10 corridors _
®Metro 3
METRO EXPRESSLANES OVERVIEW - CONT'D
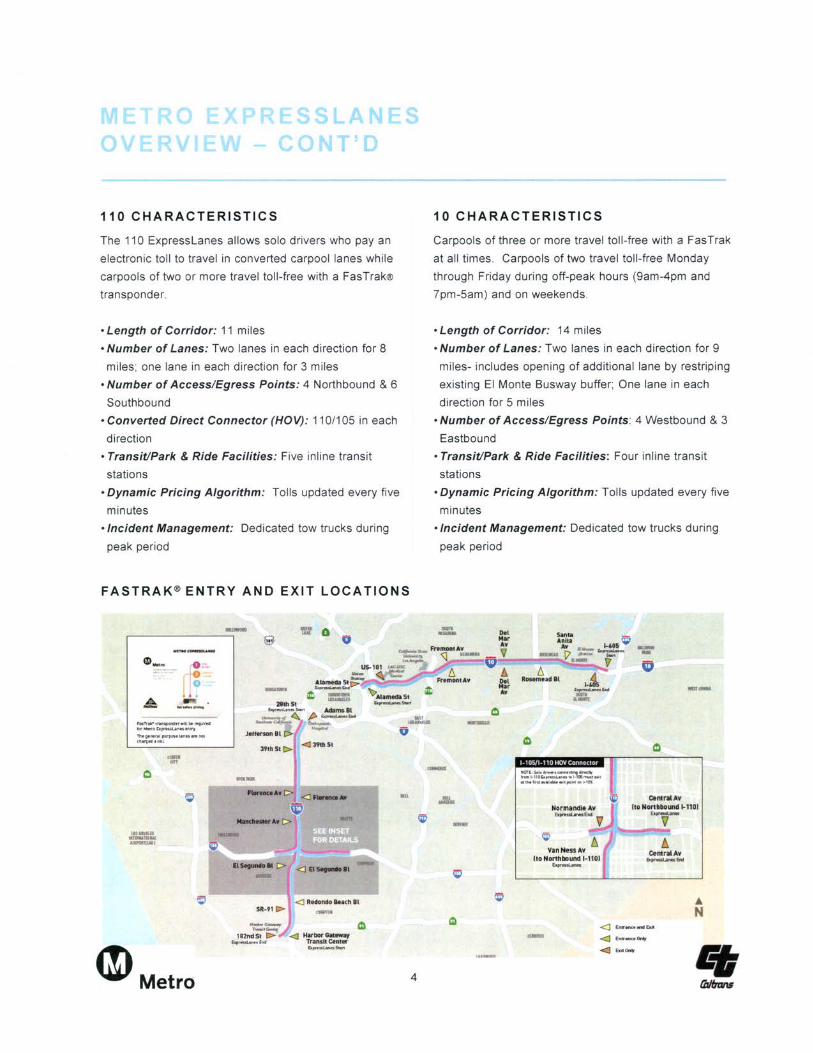
110 CHARACTERISTICS
The 110 Express lanes allows solo drivers who pay an
electronic toll to travel in converted carpool lanes wh ile
carpools of two or more travel toll-free with a FasTrak®
transponder.
• Length of Corridor: 11 miles
• Number of Lanes: Two lanes in each direction for 8
miles; one lane in each direction for 3 miles
• Number of Access/Egress Points: 4 Northbound & 6
Southbound
• Converted Direct Connector (HOV): 110/105 in each
direction
·Transit/Park & Ride Facilities: Five inline transit
stations
• Dynamic Pricing Algorithm: Tolls updated every five
minutes
•Incident Management: Dedicated tow trucks during
peak period
FASTRAK® ENTRY AND EXIT LOCATIONS
-r---------------,
Fls~~'PIIt'l:ltrw• Ot~lml W M«rr DpnuUnts ... ...,.
Tl'ltgtMB~.,.,-,"' ... ""-(ft.ll'Jtd~UU.
0
~Metro
.,._
-<J H:a~!~=:
u,....,.~ ... s.n
4
10 CHARACTERISTICS
Carpools of three or more travel toll-free with a FasTrak
at all times . Carpools of two travel toll-free Monday
through Friday during off-peak hours (9am-4pm and
7pm-5am) and on weekends.
• Length of Corridor: 14 miles
·Number of Lanes: Two lanes in each direction for 9
miles- includes opening of additional lane by restriping
existing El Monte Busway buffer; One lane in each
direction for 5 miles
• Number of Access/Egress Points: 4 Westbound & 3
Eastbound
• Transit/Park & Ride Facilities: Four inline transit
stations
• Dynamic Pricing Algorithm: Tolls updated every five
minutes
•Incident Management: Dedicated tow trucks during
peak period
--
C.ntraiAv
C.ntrolAv _ ....
<J encr-..... e lnd&il"
-<J Ern..--~
<l ... .,..
--
A N
METRO EXPRESSLANES HIGHLIGHTS
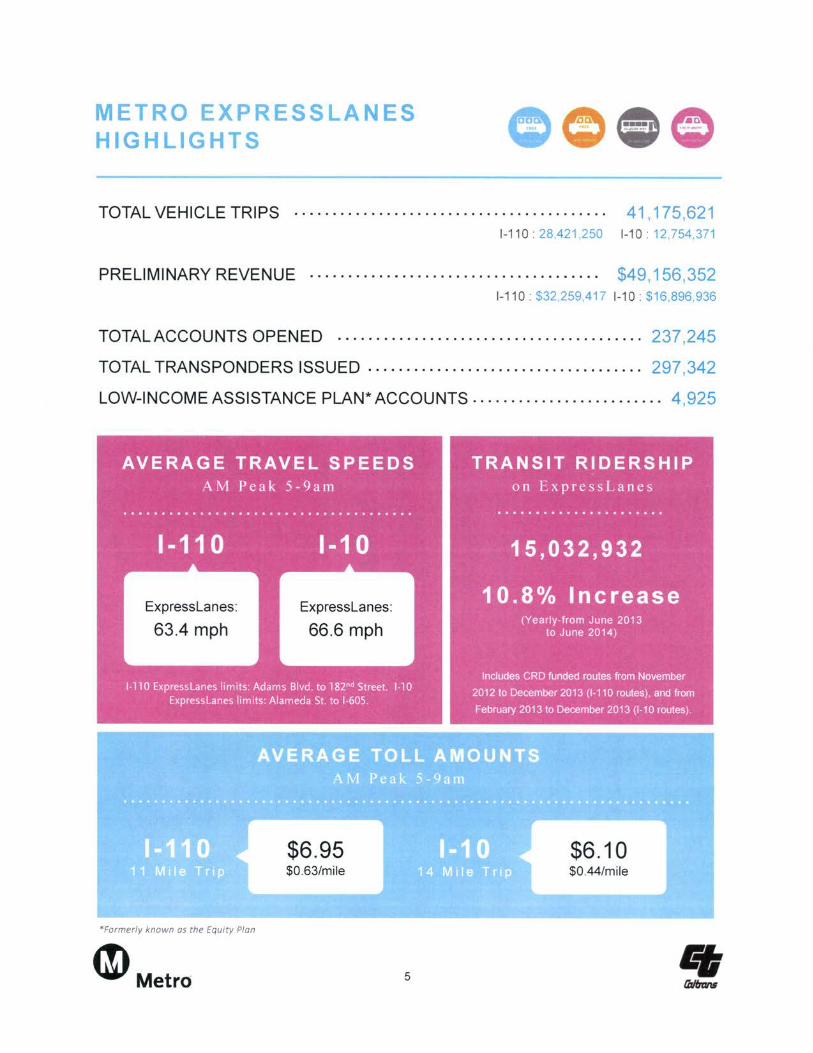
TOTAL VEHICLE TRIPS
PRELIMINARY REVENUE
TOTALACCOUNTS OPENED
41,175,621 1-110 : 28,421 ,250 1-10 : 12,754,371
$49,156,352 1-110 : $32,259,417 1-10: $16,896,936
237,245
TOTAL TRANSPONDERS ISSUED .................................... 297,342
LOW-INCOME ASSISTANCE PLAN* ACCOUNTS ............ . ............ 4,925
Expresslanes: Expresslanes:
63.4 mph 66.6 mph
$6.95 $6.10 $0.63/mile $0.44/mile
*Formerly known os the Equity Pion
®Metro 5
FASTRAK TRANSPONDER ADOPTION
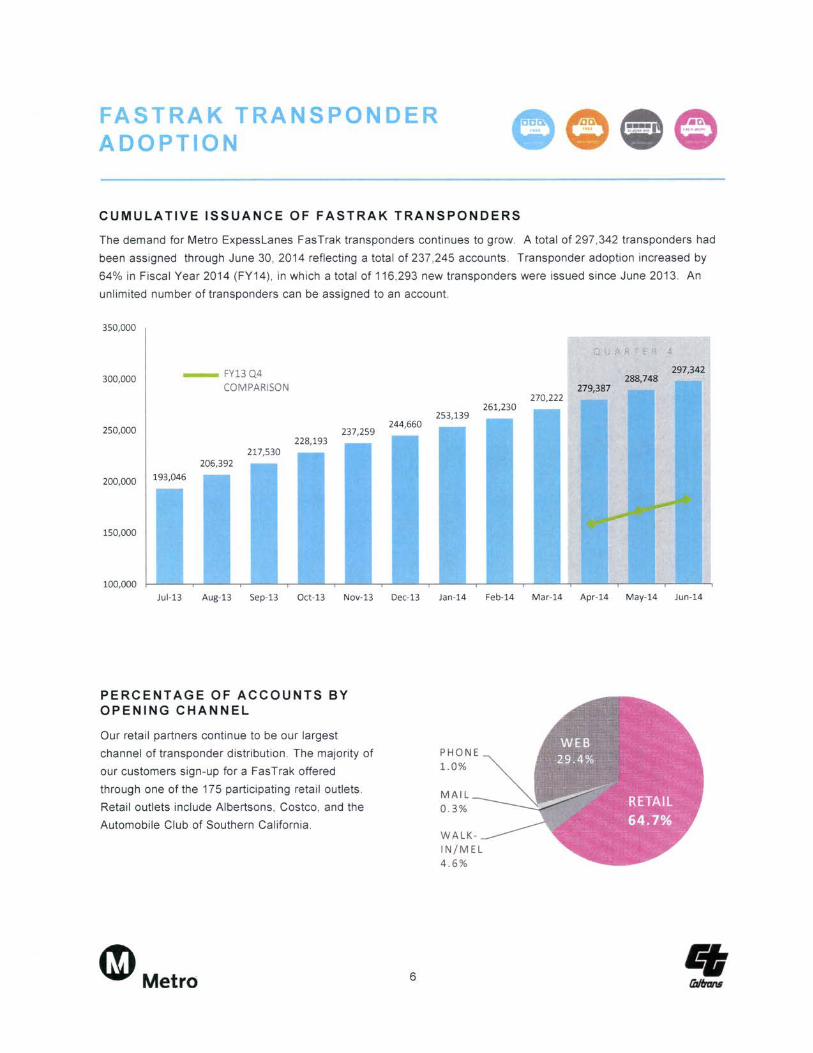
CUMULATIVE ISSUANCE OF FAS T RAK TRANSPONDERS
The demand for Metro Expesslanes FasTrak transponders continues to grow. A total of 297 ,342 transponders had
been assigned through June 30 , 20 14 reflecting a tota l of 237,245 accounts . Transponder adoption increased by
64% in Fiscal Yea r 2014 (FY14), in which a total of 116,293 new transponders were issued since June 2013 . An
unl imited number of transponders can be assigned to an account.
350,000
300,000
250,000
200,000
150,000
100,000
- FY13Q4 COMPARISON
217,530 206,392
193,046
228,193
297,342 288,748
279,387 270,222
261,230 253,139
237,259 244,660
Jul-13 Aug-13 Se p-13 Oct-13 Nov-13 Dec-13 Jan-14 Fe b-14 Ma r-14 Apr-14 May-14 Jun-14
PERCENTAGE OF AC C OUNTS BY OPENING CHANNEL
Our retail partners continue to be our largest
channel of transponder distribution . The majority of
our customers sign-up for a FasTrak offered
through one of the 175 participating retail outlets .
Retail outlets include Albertsons, Costco, and the
Automobile Club of Southern California .
®Metro 6
1.0%
0.3%
4.6%
FASTRAK TRANSPONDER ADOPTION - CONT'D
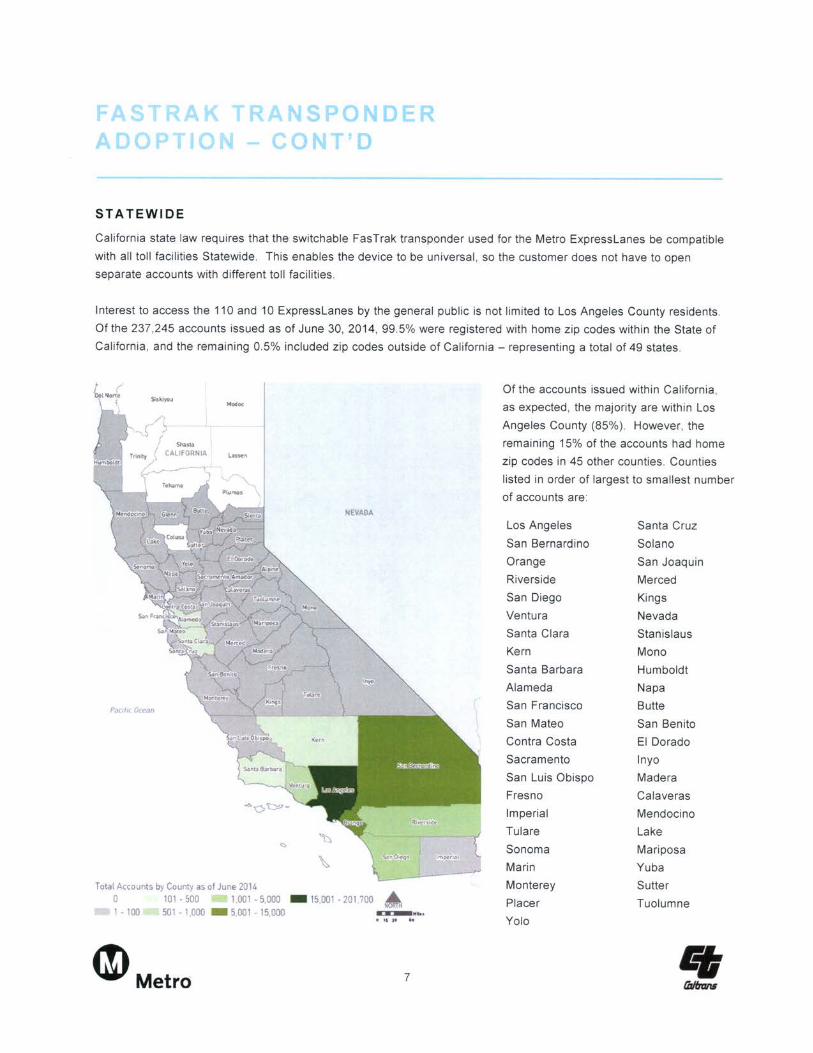
STATEWIDE
California state law requires that the switchable FasTrak transponder used for the Metro ExpressLanes be compatible
with all toll facilities Statewide. This enables the device to be universal , so the customer does not have to open
separate accounts with different toll facilities .
Interest to access the 110 and 10 Express Lanes by the general public is not limited to Los Angeles County residents .
Of the 237 ,245 accounts issued as of June 30, 2014, 99.5% were registered with home zip codes within the State of
California , and the remaining 0.5% included zip codes outside of California- representing a total of 49 states.
Total Accounts by County as of June 2014 0 101-500 1001 - 5.000 - 15,001 - 201.700 • 1 - 100 501 - 1,000 - 5,001 - 15,000 .._ ....
• II Je ..
~Metro 7
Of the accounts issued within California ,
as expected, the majority are within Los
Angeles County (85%). However, the
remaining 15% of the accounts had home
zip codes in 45 other counties. Counties
listed in order of largest to smallest number
of accounts are:
Los Angeles Santa Cruz
San Bernardino Solano
Orange San Joaquin
Riverside Merced
San Diego Kings
Ventura Nevada
Santa Clara Stanislaus
Kern Mono
Santa Barbara Humboldt
Alameda Napa
San Francisco Butte
San Mateo San Benito
Contra Costa ElDorado
Sacramento In yo
San Luis Obispo Madera
Fresno Calaveras
Imperial Mendocino
Tulare Lake
Sonoma Mariposa
Marin Yuba
Monterey Sutter
Placer Tuolumne
Yolo
Eli fitJtra.nl
ASTRAK TRANSPONDER ADOPTION - CONT'D
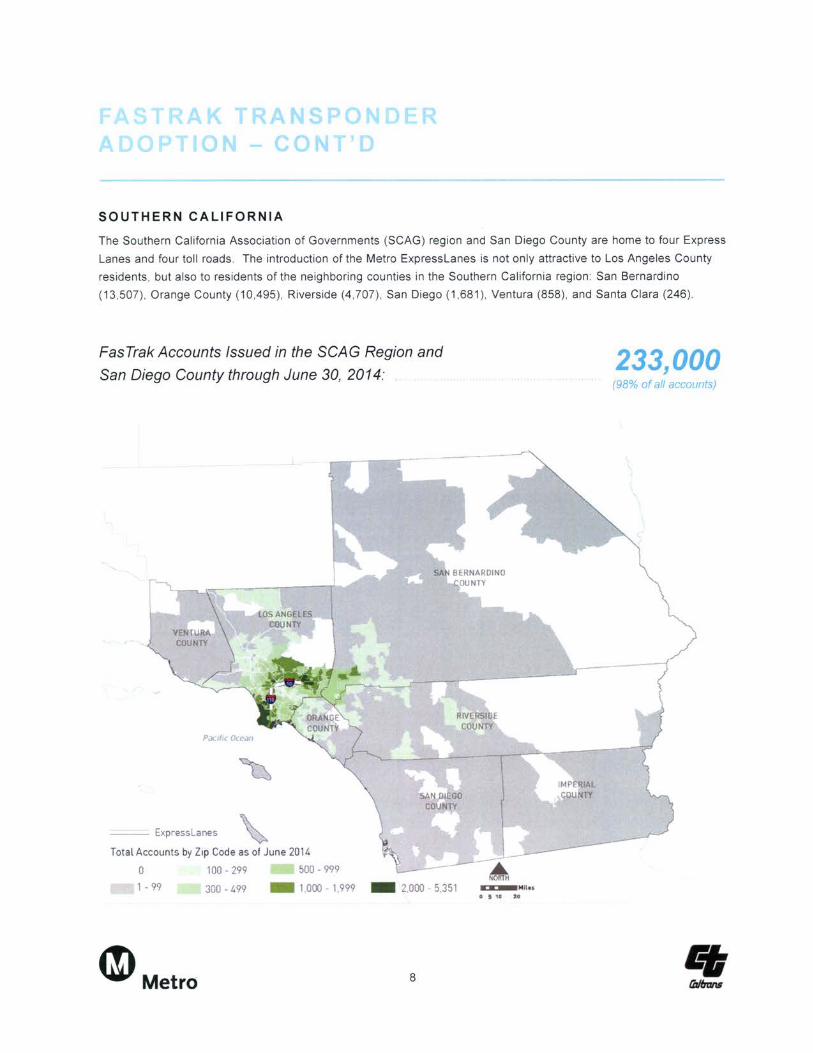
SOUTHERN CALIFORNIA
The Southern California Association of Governments (SCAG) reg ion and San Diego County are home to fou r Express
Lanes and fou r toll roads. The introduction of the Metro ExpressLanes is not only attractive to Los Ange les County
res idents, but also to residents of the neighboring counties in the Southern California region : San Bernardino
(13,507 ), Orange County (10,495), Riverside (4,707) , San Diego (1,681 ), Ventura (858), and Santa Clara (246).
FasTrak Accounts Issued in the SCAG Region and
San Diego County through June 30, 2014:
SA BERNARDINO OUNTY
--- Expresslanes
Total Accounts by Zip Code as of June 2014
0 100 - 299 500 - 999
1 -99 300 - 499 - 1,000 - 1,999 - 2,000 - 5,351
®Metro 8
-=-=-Mnes 051010
233,000 (98% of all accounts)
FASTRAK TRANSPONDER ADOPTION - CONT'D
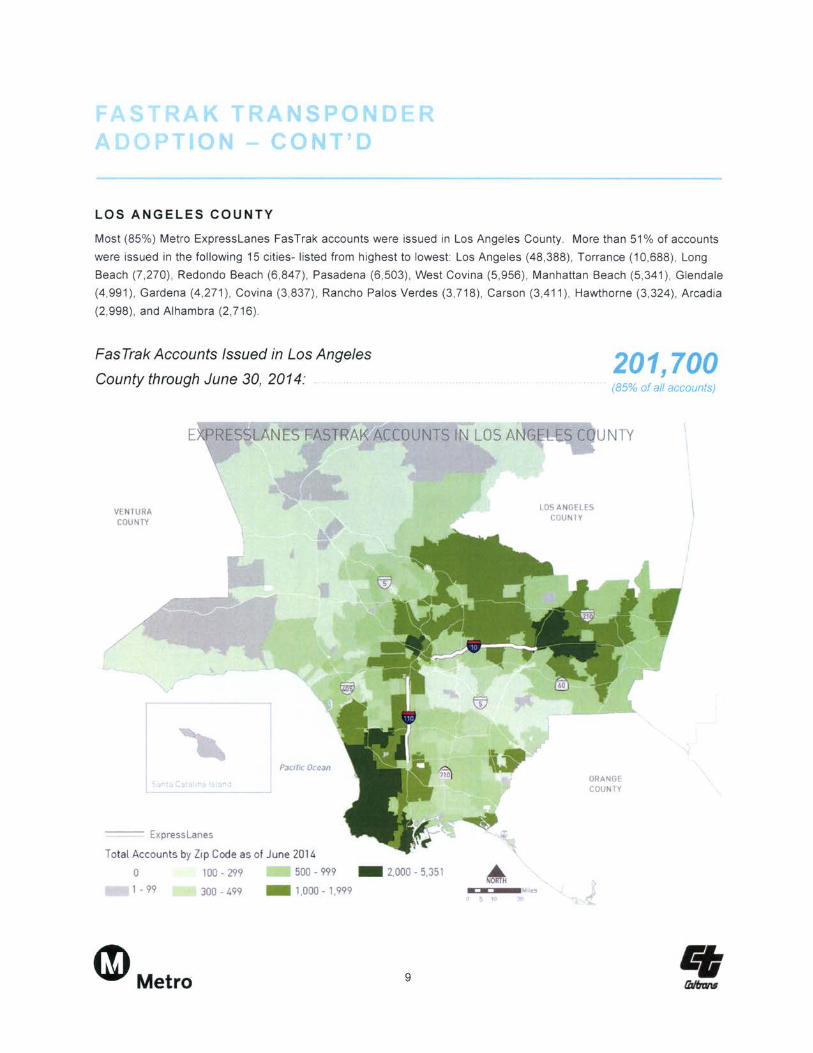
LOS ANGELES COUNTY
Most (85%) Metro Express Lanes FasTrak accounts were issued in Los Angeles County. More than 51 % of accounts
were issued in the following 15 cities- listed from highest to lowest: Los Angeles (48,388), Torrance (1 0,688), Long
Beach (7, 270), Redondo Beach (6,847), Pasadena (6,503), West Covina (5,956), Manhattan Beach (5,341), Glendale
(4,991 ), Gardena (4,271 ), Covina (3,837), Rancho Palos Verdes (3,718), Carson (3,411 ), Hawthorne (3,324), Arcadia
(2,998), and Alhambra (2,716)
Fas Trak Accounts Issued in Los Angeles
County through June 30, 2014:
RESSLANES FASTRAK ACCOUNTS IN LOS ANG
VENTURA COUNTY
-------- Expresslanes
P3c1 toe Ocean
Total Accounts by Z1 p Code as of June 2014
0 100- 299 500 - 999 - 2,000 - 5,351 ..... m 1 - 99 300-499 - 1,000- 1,999
~Metro 9
-M::JIM-=--MI.e9 5 10
LOS ANGELES COUNTY
201,700 (85% of all accounts)
ORANGE COUNTY
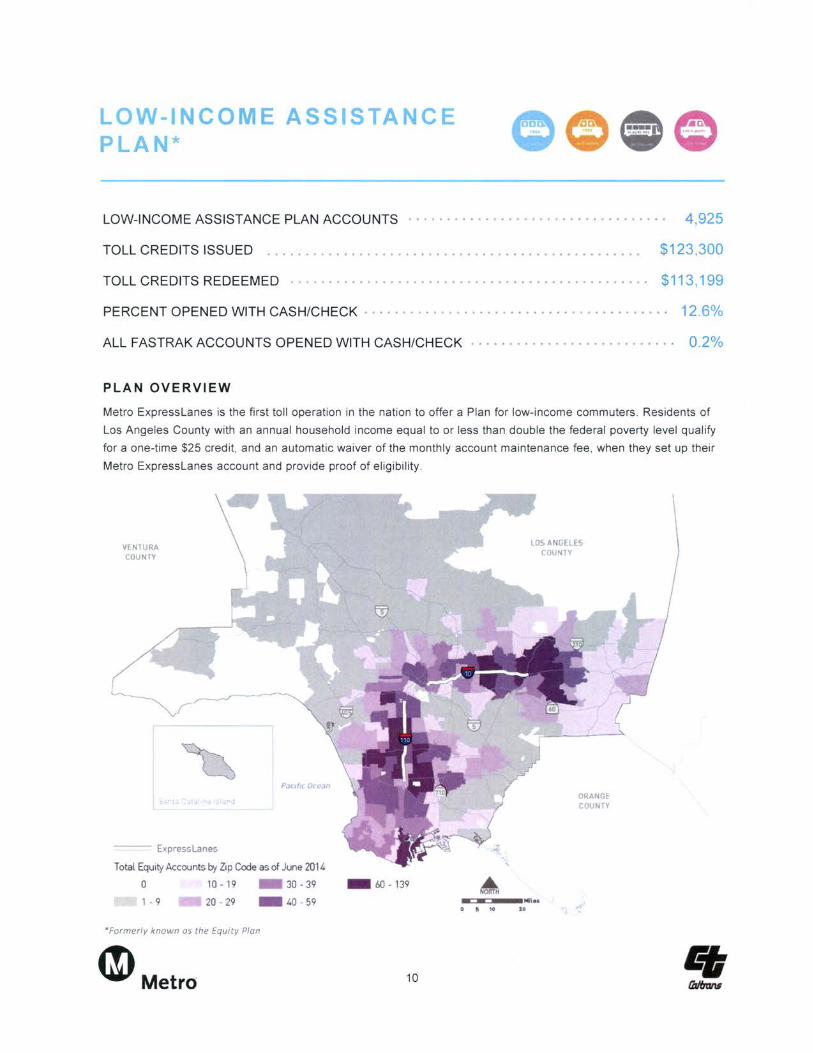
LOW-INCOME ASSISTANCE PLAN*
LOW-INCOME ASSISTANCE PLAN ACCOUNTS · · · · · · · · · · · · · · · · · · · · · · • · · · · · · · · · · · 4,925
TOLL CREDITS ISSUED $123,300
TOLL CREDITS REDEEMED · · · · · · · · · · · · · · · · · · · · · · · · · · · · · · · · · · · · · · · · · · · · · · · $113,199
PERCENT OPENED WITH CASH/CHECK · · · · · · · · · · · · · · · · · · · · · · · · · · · · · · · · · · · · · · · · 12.6%
ALL FASTRAK ACCOUNTS OPENED WITH CASH/CHECK · · · · · · · · · · · · · · · · · · · · · · · · · · · 0.2%
PLAN OVERVIEW
Metro Expresslanes is the first toll operation in the nation to offer a Plan for low-income commuters. Residents of
Los Angeles County with an annual household income equal to or less than double the federal poverty level qualify
for a one-time $25 credit, and an automatic waiver of the monthly account maintenance fee , when they set up their
Metro Expresslanes account and provide proof of eligibility .
VENTURA COUNTY
,.
-------- Expresslanes
Total Equity Accounts by Zip Code as of June 2014
0 10- 19 - 30 - 39 - 60-139
1 - 9 20 -29 - 40 - 59
*Formerly known as the Equity Plan
®Metro 10
LOS ANGELES COUNTY
ORANGE COUNTY
·-~-~-·"''" 0& 10 ta
METRO EXPRESSLANES USER PROFILE
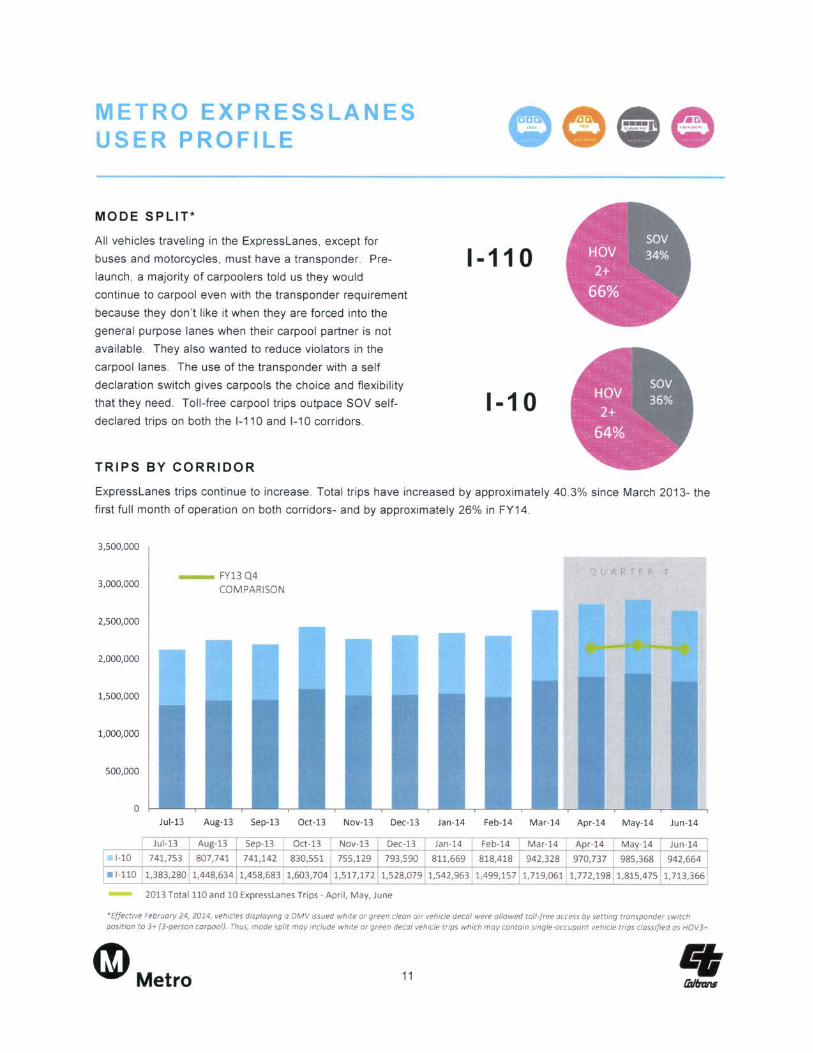
MODE SPLIT *
All veh icles traveling in the Expresslanes, except for
buses and motorcycles, must have a transponder. Pre
launch , a majority of carpoolers told us they would
continue to carpool even with the transponder requirement
because they don 't like it when they are forced into the
general purpose lanes when their carpool partner is not
available. They also wanted to reduce violators in the
carpool lanes. The use of the transponder with a self
declaration switch gives carpools the choice and flexibility
that they need . Toll-free carpool trips outpace SOV self
declared trips on both the 1-110 and 1-1 0 corridors.
TRIPS BY CORRIDOR
1-110
1-1 0
Expresslanes trips continue to increase. Total trips have increased by approximately 40.3% since March 2013- the
first full month of operation on both corridors- and by approximately 26% in FY14.
3,500,000
3,000,000
2,500,000
2,000,000
1,500,000
1,000,000
500,000
0
- FY13Q4 COMPARISON
Jul-13 Aug-13 Sep-13 Oct -13 Nov-13 Dec-13 Jan-14 Feb-14 Ma r-14 Apr-14 May-14 Jun-14
Jul-13 Aug-13 I Sep-13 Oct-13 Nov-13 Dec-13 i Jan-14 I Feb-14 I Mar-14 Apr-14 May-14 Jun-14 I 1-10 741,753 807,741 I 741,142 830,551 755,129 793,590 l 811,669 818,418 I 942,328 970,737 985,368 942,664 1
1• 1-110 1,383,280 1,448,634 11,458,683 11,603,704 1,517,172 1,528,079 1,542,963 11,499,157 11,719,061 1,772,198 1,815,475 1,713,366
2013 TotalllO and 10 Expresslanes Trips- April , May, June
'Effective February 24, 2014, vehicles displaying a DMV issued white or green clean air vehicle decal were allowed tall-free access by setting transponder switch position to 3+ (3-person carpool). Thus, mode split may include white or green decal vehicle trips which may contain single-occupant veh1cle trips classified os HOV3+.
®Metro 11
METRO EXPRESSLANES USER PROFILE- CO T'D
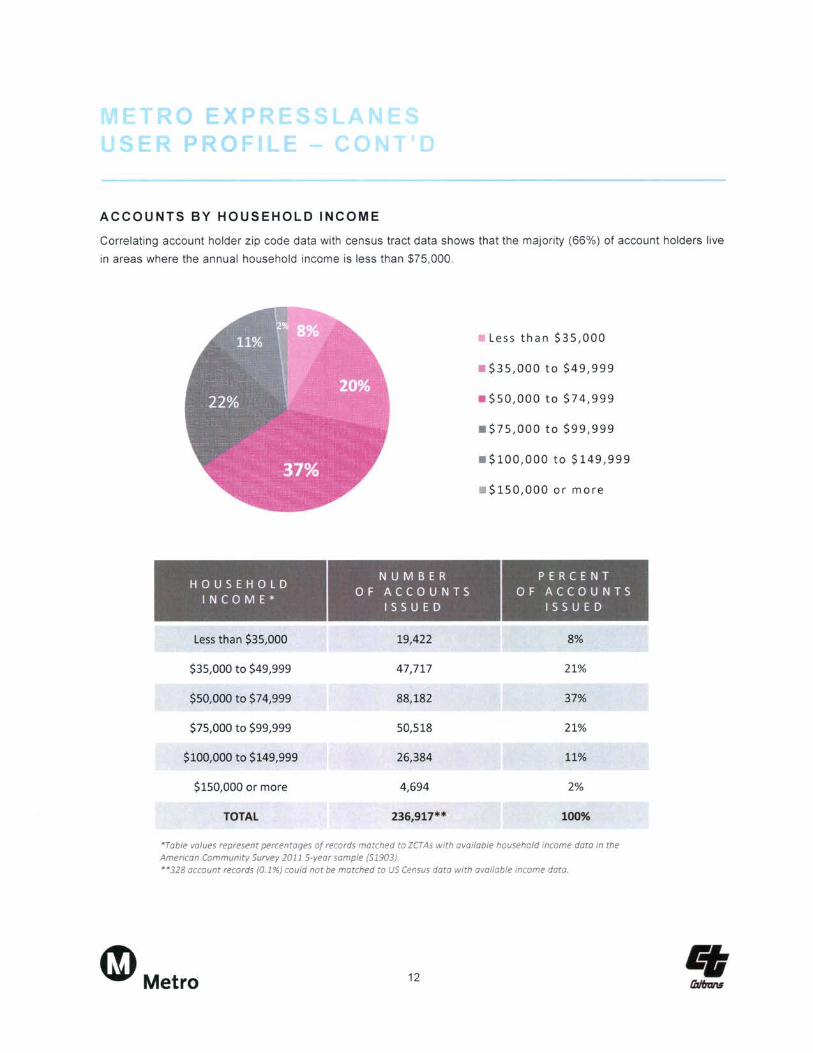
ACCOUNTS BY HOUSEHOLD INCOME
Correlating account holder zip code data with census tract data shows that the majority (66%) of account holders live
in areas where the annual household income is less than $75,000.
I
HOUSEHOLD INCOME*
Less than $35,000
$35,000 to $49,999
$50,000 to $74,999
$75,000 to $99,999
$100,000 to $149,999
$150,000 or more
TOTAL
NUMBER OF ACCOUNTS
ISSUED
19,422
47,717
88,182
50,518
26,384
4,694
236,917**
• Less than $35 , 000
• $35,000 to $49,999
• S5o,ooo to $74,999
• $75,000 to $99,999
• $100,000 to $149,999
• $150,000 or more
PERCENT OF ACCOUNTS
ISSUED
8%
21%
37%
21%
11%
2%
100%
*Table values represent percentages of records matched to ZCTAs with available household income data in the American Community Survey 2011 5-year sample (S1903). **328 account records (0.1%) could not be matched to US Census data with available income data.
®Metro 12
TRAVEL SPEEDS-AM PEAK PERIOD (5AM-9AM)
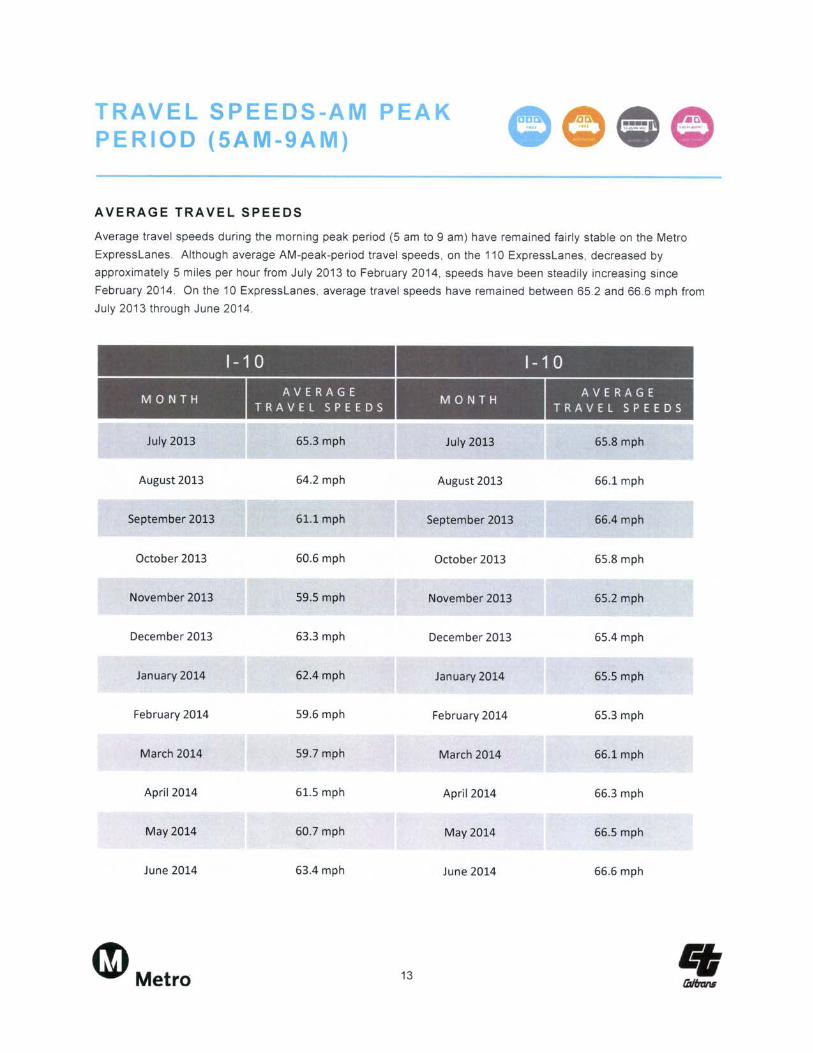
AVERAGE TRAVEL SPEEDS
Average travel speeds during the morn ing peak period (5 am to 9 am) have remained fa irly stable on the Metro
Expresslanes. Although average AM-peak-period travel speeds , on the 110 Expresslanes, decreased by
approximately 5 miles per hour from July 2013 to February 2014, speeds have been steadily increasing since
February 2014. On the 10 Expresslanes, average travel speeds have remained between 65.2 and 66.6 mph from
July 2013 through June 2014.
M 0 NTH
July 2013
August 2013
September 2013
October 2013
November 2013
December 2013
January 2014
February 2014
March 2014
April2014
May 2014
June 2014
a. Metro
1-1 0
AVERAGE TRAVEL SPEEDS
65.3 mph
64.2 mph
61.1 mph
60.6 mph
59.5 mph
63.3 mph
62.4 mph
59.6 mph
59.7 mph
61.5 mph
60.7 mph
63.4 mph
M 0 NTH
July 2013
August 2013
September 2013
October 2013
November 2013
December 2013
January 2014
February 2014
March 2014
April2014
May 2014
June 2014
13
1-1 0
AVERAGE TRAVEL SPEEDS
65.8 mph
66.1 mph
66.4 mph
65.8 mph
65.2 mph
65.4 mph
65.5 mph
65.3 mph
66.1 mph
66.3 mph
66.5 mph
66.6 mph
TRANSIT RIDERSHIP ON EXPRESS LANES
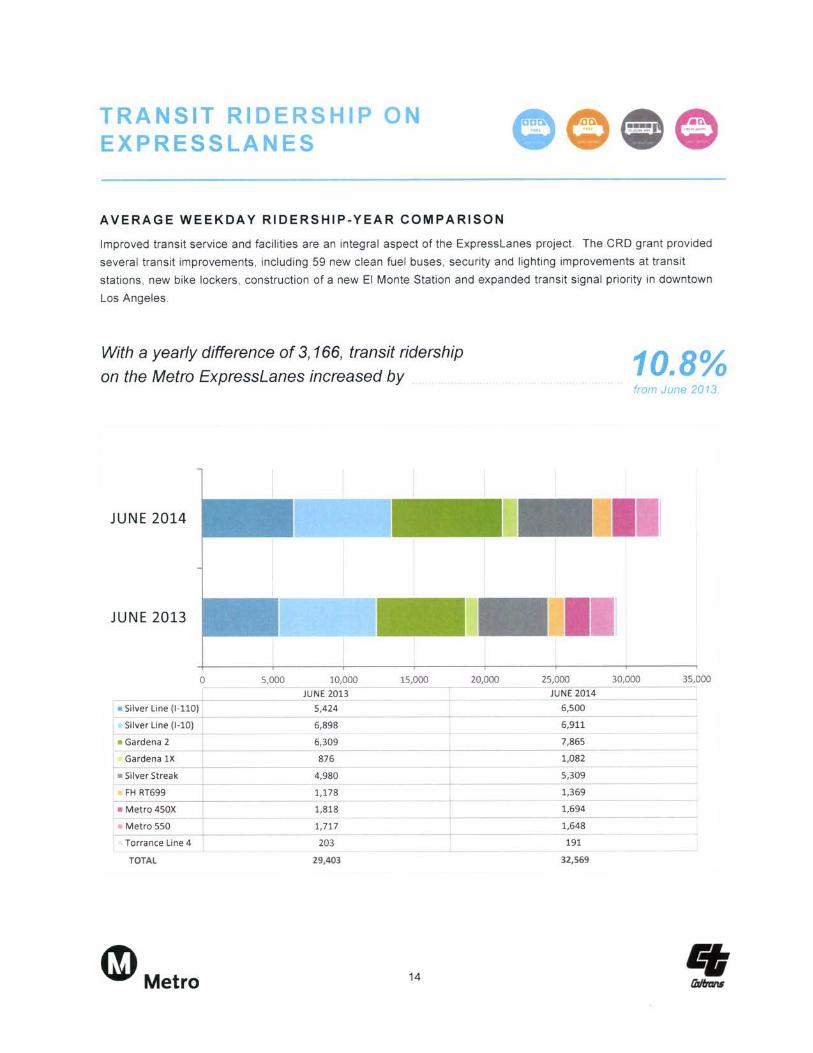
AVERAGE WEEKDAY RIDERSHIP-YEAR COMPARISON
Improved transit service and facilities are an integral aspect of the Expresslanes project. The CRD grant provided
several transit improvements, including 59 new clean fuel buses, security and lighting improvements at transit
stations , new bike lockers, construction of a new El Monte Station and expanded transit signal priority in downtown
Los Angeles.
With a yearly difference of 3, 166, transit ridership
on the Metro ExpressLanes increased by
JUNE 2014
JUNE 2013
0 5,000 10,000 15,000
JUNE 2013
• Silver Line (1-110) 5,424 ._ Silver Line (1 -10) 6,898
• Gardena 2 6,309
Gardena 1X 876 +--
• Silver Streak 4,980
FH RT699 1,178
• Metro 450X 1,818
Metro 550 1,717
Torrance Line 4 203
TOTAL 29,403
®Metro 14
10.8% from June 2013.
20,000 25,000 30,000 35,000
JUNE 2014
6,500
6,911
7,865
1,082
5,309
1,369
1,694
1,648
191
32,569
TRANSIT RIDERSHIPSILVER LINE
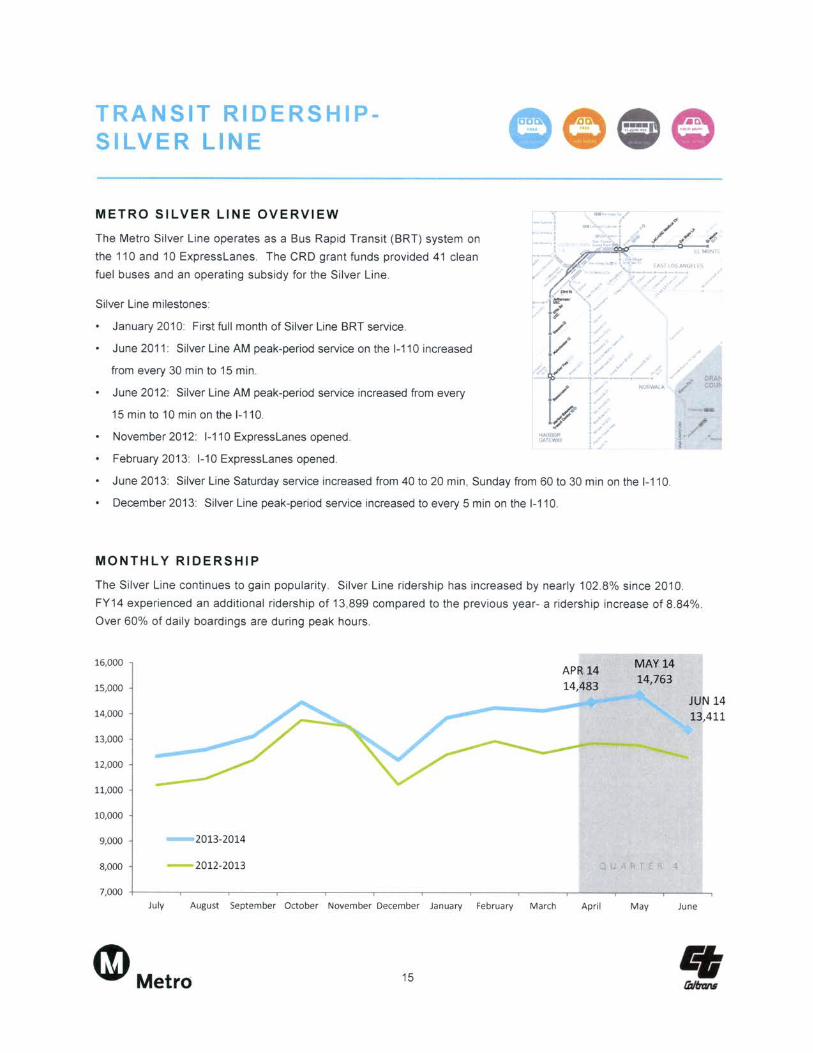
METRO SILVER LI NE OVERVIEW
The Metro Silver Line operates as a Bus Rapid Transit (BRT) system on
the 110 and 10 Express Lanes. The CRD grant funds provided 41 clean
fuel buses and an operating subsidy for the Silver Line.
Silver Line milestones:
January 2010: First full month of Silver Line BRT service.
June 2011 : Silver Line AM peak-period service on the 1-110 increased
from every 30 min to 15 min.
June 2012: Silver Line AM peak-period service increased from every
15 min to 10 min on the 1-110.
November 2012: 1-110 ExpressLanes opened.
February 2013: 1-10 ExpressLanes opened.
~·
HAR GAT'WAV
-t'
F i# / !/ I " .- • (/ ,; / t--·-·
NURW .... K
June 2013: Silver Line Saturday service increased from 40 to 20 min, Sunday from 60 to 30 min on the 1-110.
December 2013: Silver Line peak-period service increased to every 5 min on the 1-110.
MONTHLY RIDERSHIP
The Silver Line continues to gain popularity. Silver Line ridership has increased by nearly 102.8% since 2010.
FY14 experienced an additional ridership of 13,899 compared to the previous year- a ridership increase of 8.84%.
Over 60% of daily boardings are during peak hours.
16,000 APR 14
MAY14
14,483 14,763
15,000
JUN 14 14,000 13,411
13,000
12,000
11,000
10,000
9,000 2013-2014
8,000 - 2012-2013
7,000 July August September October November December January February March Apri l May June
G) Metro 15
TRANSIT R D P SILVER LINE -CO '0
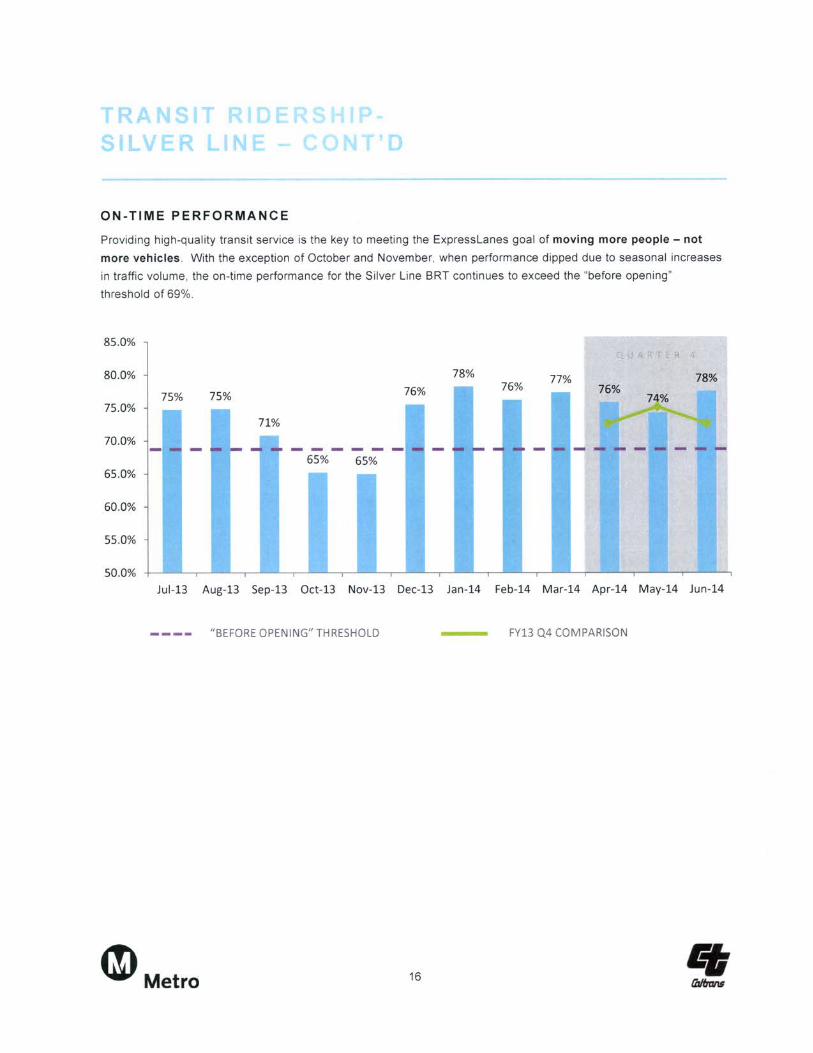
ON-TIME PERFORMANCE
Providing high-quality transit service is the key to meeting the Expresslanes goal of moving more people- not
more vehicles . With the exception of October and November, when performance dipped due to seasonal increases
in traffic volume , the on-time performance for the Silver Line BRT continues to exceed the "before opening"
threshold of 69%.
85.0%
80.0% 78% 77% 78%
75% 75% 76% 76%
75 .0%
70.0%
65% 65% 65 .0%
60.0%
55 .0%
50.0%
Jul-13 Aug-13 5ep-13 Oct-13 Nov-13 Dec-13 Jan-14 Feb-14 Mar-14 Apr-14 May-14 Jun-14
"BEFORE OPENING" THRESHOLD FY13 Q4 COMPARISON
a. Metro 16
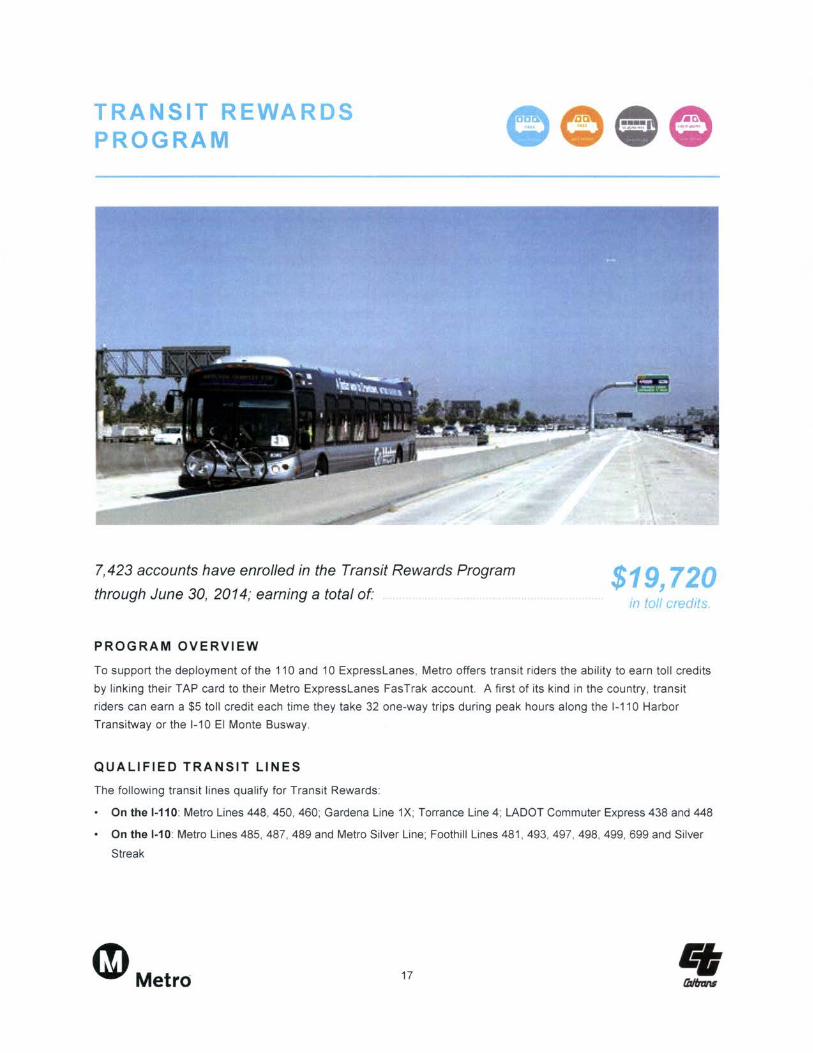
TRANSIT REWARDS PROGRAM
7,423 accounts have enrolled in the Transit Rewards Program
through June 30, 2014; earning a total or
PROGRAM OVERVIEW
$19,720 in toll credits.
To support the deployment of the 110 and 10 ExpressLanes, Metro offers transit riders the ability to earn toll credits
by linking their TAP card to their Metro ExpressLanes FasTrak account. A first of its kind in the country , transit
riders can earn a $5 toll credit each time they take 32 one-way trips during peak hours along the 1-110 Harbor
Transitway or the 1-10 El Monte Busway.
QUALIFIED TRANSIT LINES
The following transit lines qualify for Transit Rewards :
• On the 1-110: Metro Lines 448, 450, 460; Gardena Line 1X; Torrance Line 4; LADOT Commuter Express 438 and 448
• On the 1-10: Metro Lines 485, 487 , 489 and Metro Silver Line; Foothill Lines 481 , 493, 497, 498, 499, 699 and Silver
Streak
®Metro 17