Embed Size (px)
Citation preview
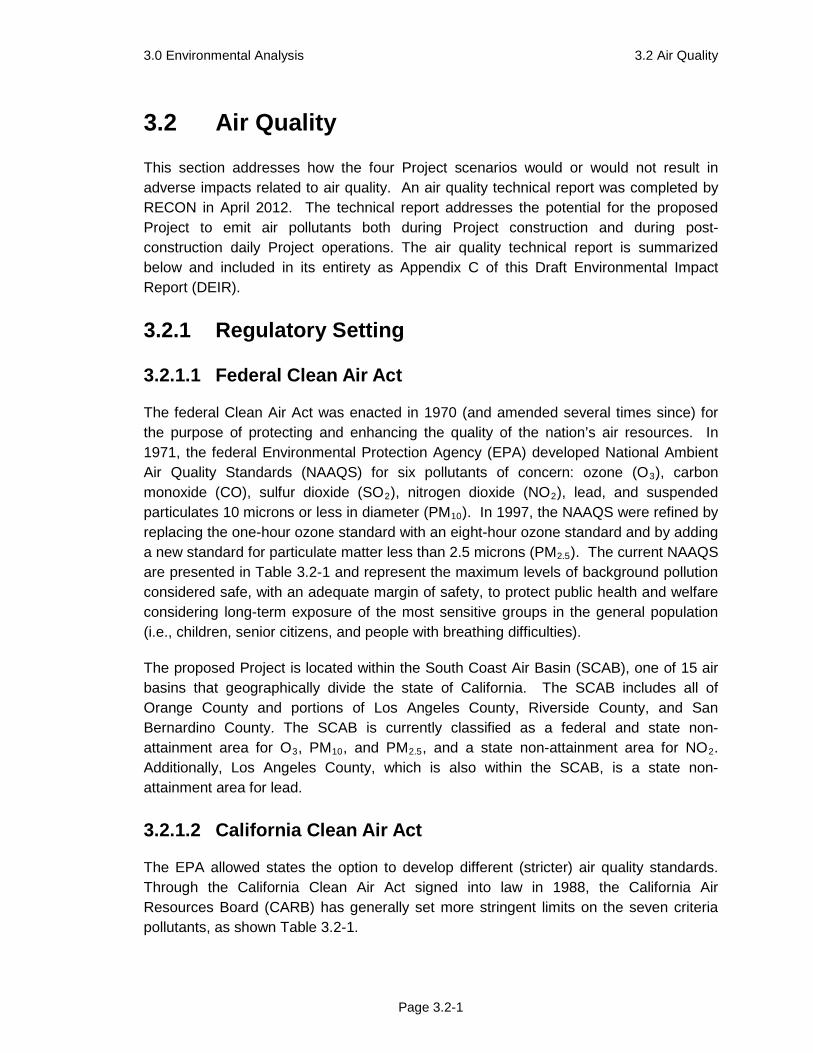
3.0 Environmental Analysis 3.2 Air Quality
Page 3.2-1
3.2 Air Quality
This section addresses how the four Project scenarios would or would not result in adverse impacts related to air quality. An air quality technical report was completed by RECON in April 2012. The technical report addresses the potential for the proposed Project to emit air pollutants both during Project construction and during post-construction daily Project operations. The air quality technical report is summarized below and included in its entirety as Appendix C of this Draft Environmental Impact Report (DEIR).
3.2.1 Regulatory Setting
3.2.1.1 Federal Clean Air Act
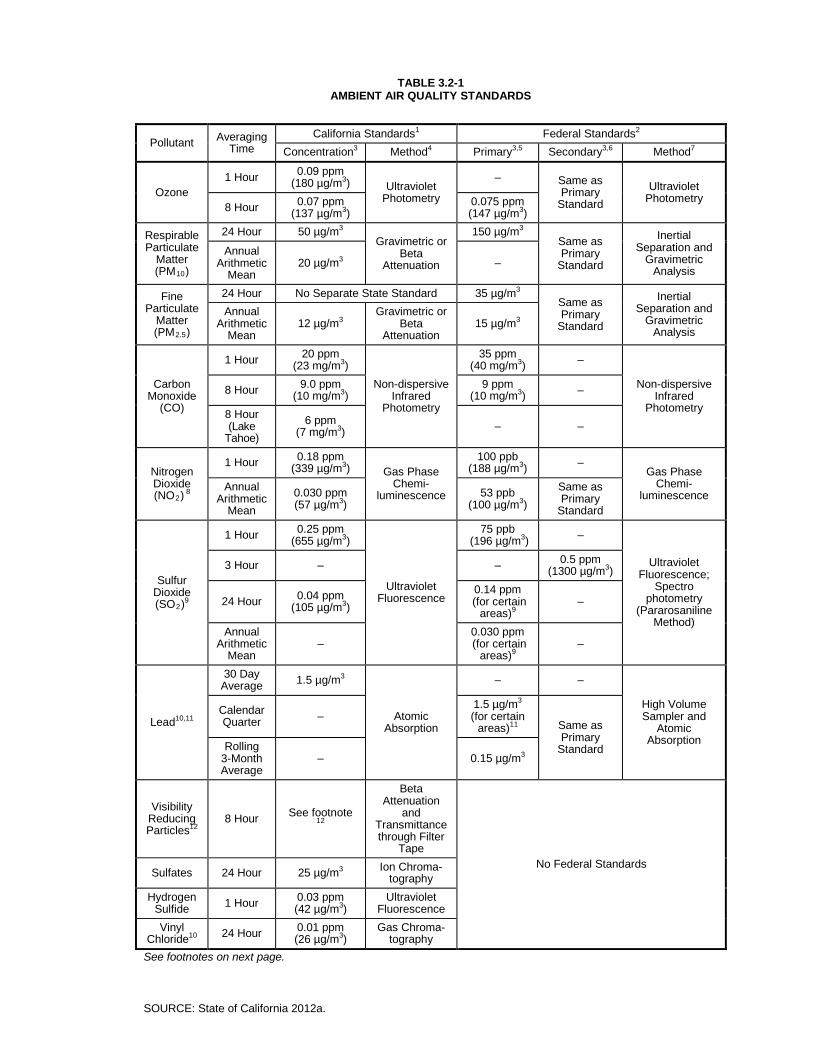
The federal Clean Air Act was enacted in 1970 (and amended several times since) for the purpose of protecting and enhancing the quality of the nation’s air resources. In 1971, the federal Environmental Protection Agency (EPA) developed National Ambient Air Quality Standards (NAAQS) for six pollutants of concern: ozone (O3), carbon monoxide (CO), sulfur dioxide (SO2), nitrogen dioxide (NO2), lead, and suspended particulates 10 microns or less in diameter (PM10). In 1997, the NAAQS were refined by replacing the one-hour ozone standard with an eight-hour ozone standard and by adding a new standard for particulate matter less than 2.5 microns (PM2.5). The current NAAQS are presented in Table 3.2-1 and represent the maximum levels of background pollution considered safe, with an adequate margin of safety, to protect public health and welfare considering long-term exposure of the most sensitive groups in the general population (i.e., children, senior citizens, and people with breathing difficulties).
The proposed Project is located within the South Coast Air Basin (SCAB), one of 15 air basins that geographically divide the state of California. The SCAB includes all of Orange County and portions of Los Angeles County, Riverside County, and San Bernardino County. The SCAB is currently classified as a federal and state non-attainment area for O3, PM10, and PM2.5, and a state non-attainment area for NO2. Additionally, Los Angeles County, which is also within the SCAB, is a state non-attainment area for lead.
3.2.1.2 California Clean Air Act
The EPA allowed states the option to develop different (stricter) air quality standards. Through the California Clean Air Act signed into law in 1988, the California Air Resources Board (CARB) has generally set more stringent limits on the seven criteria pollutants, as shown Table 3.2-1.
SOURCE: State of California 2012a.
TABLE 3.2-1 AMBIENT AIR QUALITY STANDARDS
Pollutant Averaging Time
California Standards1 Federal Standards2 Concentration3 Method4 Primary3,5 Secondary3,6 Method7
Ozone 1 Hour 0.09 ppm
(180 µg/m3) Ultraviolet Photometry
– Same as Primary
Standard Ultraviolet
Photometry 8 Hour 0.07 ppm
(137 µg/m3) 0.075 ppm (147 µg/m3)
Respirable Particulate
Matter (PM10)
24 Hour 50 µg/m3 Gravimetric or
Beta Attenuation
150 µg/m3 Same as Primary
Standard
Inertial Separation and
Gravimetric Analysis
Annual Arithmetic
Mean 20 µg/m3 –
Fine Particulate
Matter (PM2.5)
24 Hour No Separate State Standard 35 µg/m3 Same as Primary
Standard
Inertial Separation and
Gravimetric Analysis
Annual Arithmetic
Mean 12 µg/m3
Gravimetric or Beta
Attenuation 15 µg/m3
Carbon Monoxide
(CO)
1 Hour 20 ppm (23 mg/m3)
Non-dispersive Infrared
Photometry
35 ppm (40 mg/m3) –
Non-dispersive Infrared
Photometry 8 Hour 9.0 ppm
(10 mg/m3) 9 ppm
(10 mg/m3) –
8 Hour (Lake
Tahoe) 6 ppm
(7 mg/m3) – –
Nitrogen Dioxide (NO2) 8
1 Hour 0.18 ppm (339 µg/m3) Gas Phase
Chemi-luminescence
100 ppb
(188 µg/m3) – Gas Phase
Chemi-luminescence
Annual Arithmetic
Mean 0.030 ppm (57 µg/m3)
53 ppb (100 µg/m3)
Same as Primary
Standard
Sulfur Dioxide (SO2)9
1 Hour 0.25 ppm (655 µg/m3)
Ultraviolet Fluorescence
75 ppb (196 µg/m3) –
Ultraviolet Fluorescence;
Spectro photometry
(Pararosaniline Method)
3 Hour – – 0.5 ppm (1300 µg/m3)
24 Hour 0.04 ppm (105 µg/m3)
0.14 ppm (for certain
areas)9 –
Annual Arithmetic
Mean –
0.030 ppm (for certain
areas)9 –
Lead10,11
30 Day Average 1.5 µg/m3
Atomic Absorption
– –
High Volume Sampler and
Atomic Absorption
Calendar Quarter –
1.5 µg/m3 (for certain
areas)11 Same as Primary
Standard Rolling 3-Month Average
– 0.15 µg/m3
Visibility Reducing Particles12
8 Hour See footnote 12
Beta Attenuation
and Transmittance through Filter
Tape No Federal Standards
Sulfates 24 Hour 25 µg/m3 Ion Chroma-tography
Hydrogen Sulfide 1 Hour 0.03 ppm
(42 µg/m3) Ultraviolet
Fluorescence Vinyl
Chloride10 24 Hour 0.01 ppm (26 µg/m3)
Gas Chroma-tography
See footnotes on next page.
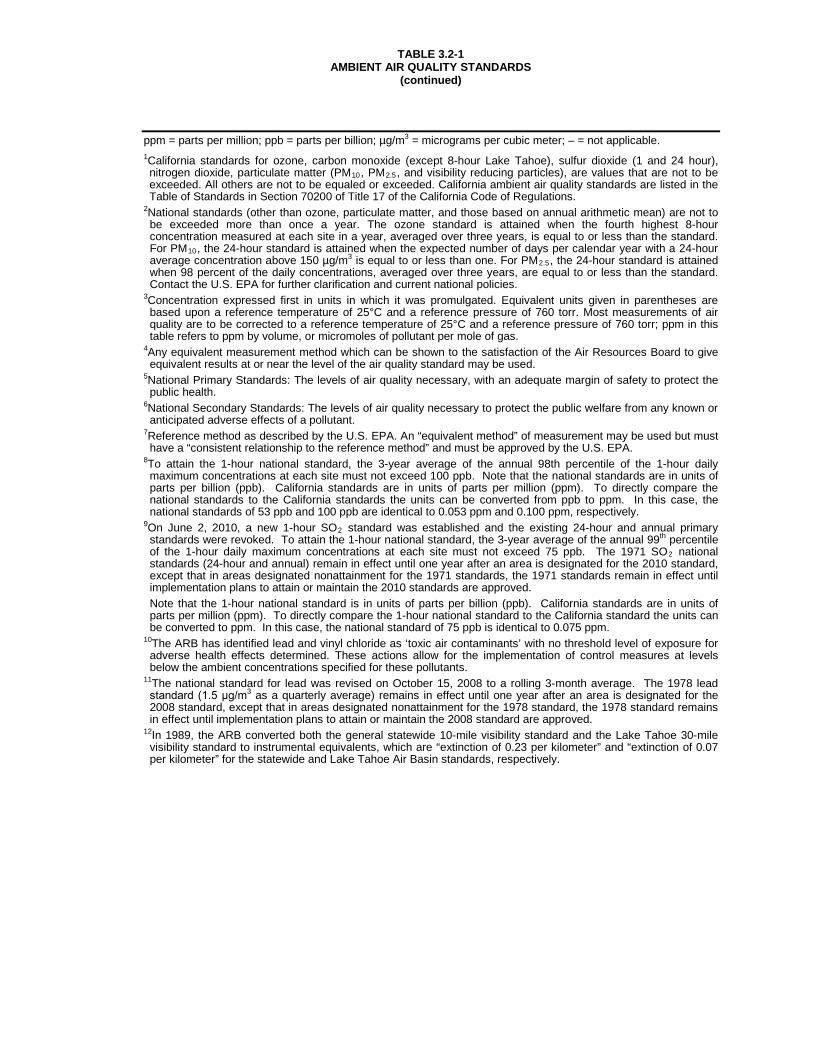
TABLE 3.2-1 AMBIENT AIR QUALITY STANDARDS
(continued)
ppm = parts per million; ppb = parts per billion; µg/m3 = micrograms per cubic meter; – = not applicable. 1California standards for ozone, carbon monoxide (except 8-hour Lake Tahoe), sulfur dioxide (1 and 24 hour), nitrogen dioxide, particulate matter (PM10, PM2.5, and visibility reducing particles), are values that are not to be exceeded. All others are not to be equaled or exceeded. California ambient air quality standards are listed in the Table of Standards in Section 70200 of Title 17 of the California Code of Regulations.
2National standards (other than ozone, particulate matter, and those based on annual arithmetic mean) are not to be exceeded more than once a year. The ozone standard is attained when the fourth highest 8-hour concentration measured at each site in a year, averaged over three years, is equal to or less than the standard. For PM10, the 24-hour standard is attained when the expected number of days per calendar year with a 24-hour average concentration above 150 µg/m3 is equal to or less than one. For PM2.5, the 24-hour standard is attained when 98 percent of the daily concentrations, averaged over three years, are equal to or less than the standard. Contact the U.S. EPA for further clarification and current national policies.
3Concentration expressed first in units in which it was promulgated. Equivalent units given in parentheses are based upon a reference temperature of 25°C and a reference pressure of 760 torr. Most measurements of air quality are to be corrected to a reference temperature of 25°C and a reference pressure of 760 torr; ppm in this table refers to ppm by volume, or micromoles of pollutant per mole of gas.
4Any equivalent measurement method which can be shown to the satisfaction of the Air Resources Board to give equivalent results at or near the level of the air quality standard may be used.
5National Primary Standards: The levels of air quality necessary, with an adequate margin of safety to protect the public health.
6National Secondary Standards: The levels of air quality necessary to protect the public welfare from any known or anticipated adverse effects of a pollutant.
7Reference method as described by the U.S. EPA. An “equivalent method” of measurement may be used but must have a “consistent relationship to the reference method” and must be approved by the U.S. EPA.
8To attain the 1-hour national standard, the 3-year average of the annual 98th percentile of the 1-hour daily maximum concentrations at each site must not exceed 100 ppb. Note that the national standards are in units of parts per billion (ppb). California standards are in units of parts per million (ppm). To directly compare the national standards to the California standards the units can be converted from ppb to ppm. In this case, the national standards of 53 ppb and 100 ppb are identical to 0.053 ppm and 0.100 ppm, respectively.
9On June 2, 2010, a new 1-hour SO2 standard was established and the existing 24-hour and annual primary standards were revoked. To attain the 1-hour national standard, the 3-year average of the annual 99th percentile of the 1-hour daily maximum concentrations at each site must not exceed 75 ppb. The 1971 SO2 national standards (24-hour and annual) remain in effect until one year after an area is designated for the 2010 standard, except that in areas designated nonattainment for the 1971 standards, the 1971 standards remain in effect until implementation plans to attain or maintain the 2010 standards are approved.
Note that the 1-hour national standard is in units of parts per billion (ppb). California standards are in units of parts per million (ppm). To directly compare the 1-hour national standard to the California standard the units can be converted to ppm. In this case, the national standard of 75 ppb is identical to 0.075 ppm.
10The ARB has identified lead and vinyl chloride as ‘toxic air contaminants’ with no threshold level of exposure for adverse health effects determined. These actions allow for the implementation of control measures at levels below the ambient concentrations specified for these pollutants.
11The national standard for lead was revised on October 15, 2008 to a rolling 3-month average. The 1978 lead standard (1.5 μg/m3 as a quarterly average) remains in effect until one year after an area is designated for the 2008 standard, except that in areas designated nonattainment for the 1978 standard, the 1978 standard remains in effect until implementation plans to attain or maintain the 2008 standard are approved.
12In 1989, the ARB converted both the general statewide 10-mile visibility standard and the Lake Tahoe 30-mile visibility standard to instrumental equivalents, which are “extinction of 0.23 per kilometer” and “extinction of 0.07 per kilometer” for the statewide and Lake Tahoe Air Basin standards, respectively.
3.0 Environmental Analysis 3.2 Air Quality
Page 3.2-4
The California Clean Air Act additionally requires that Air Quality Management Districts implement regulations to reduce emissions from mobile sources through the adoption and enforcement of transportation control measures and:
• Demonstrate the overall effectiveness of the air quality program;
• Reduce nonattainment pollutants at a rate of 5 percent per year, or include all feasible measures and expeditious adoption schedule;
• Reduce population exposure to severe nonattainment pollutants according to a prescribed schedule; and
• Rank control measures by cost-effectiveness and implementation priority.
In addition to the federal criteria pollutants, the California ambient air quality standards also specify standards for visibility-reducing particles, sulfates, hydrogen sulfide, and vinyl chloride (see Table 3.2-1). The portion of the SCAB containing the Project vicinity is a State non-attainment area for both one-hour and eight-hour O3, PM10, PM2.5, and NO2.
3.2.1.3 State Implementation Plan
The State Implementation Plan (SIP) is a collection of documents that set forth the state’s strategies for achieving ambient air quality standards. The South Coast Air Quality Management District (SCAQMD) is responsible for preparing and implementing the portion of the SIP applicable to the SDAB. The SCAQMD adopts rules, regulations, and programs to attain state and federal air quality standards, and appropriates money (including permit fees) to achieve its objectives.
3.2.1.4 South Coast Air Quality Management District
The SCAQMD is the air pollution control agency for Orange County and the urban portions of Los Angeles, Riverside, and San Bernardino counties. The agency’s primary responsibility is assuring that the national and state ambient air quality standards are attained and maintained in the SCAB. SCAQMD is also responsible for adopting and enforcing rules and regulations concerning air pollutant sources, issuing permits for stationary sources of air pollutants, inspecting stationary sources of air pollutants, responding to citizen complaints, monitoring ambient air quality and meteorological conditions, awarding grants to reduce motor vehicle emissions and conducting public education campaigns, as well as many other activities.
3.2.1.5 Air Quality Management Plan
Periodically, the SCAQMD prepares an Air Quality Management Plan (AQMP) describing air quality improvement strategies to be submitted for inclusion in the SIP.
3.0 Environmental Analysis 3.2 Air Quality
Page 3.2-5
The Final 2007 AQMP was adopted by the SCAQMD Governing Board on June 1, 2007. The 2007 AQMP, prepared by the SCAQMD in conjunction with CARB, the Southern California Association of Governments (SCAG), and the EPA, is intended to provide for continued progress toward cleaner air and to comply with state and federal requirements. The AQMP meets state and federal Clean Air Act planning requirements for all areas under the jurisdiction of the SCAQMD.
The AQMP includes a comprehensive strategy aimed at controlling pollution from all sources, including stationary sources, on-road and off-road mobile sources, and area sources. Despite improvements in southern California’s air quality, the region is a federal non-attainment area for PM10, PM2.5, and eight-hour surface-level ozone. The AQMP proposes attainment demonstration of the federal PM10, PM2.5, and O3 standards.
The SCAQMD is currently preparing the 2012 Air Quality Management Plan.
3.2.1.6 Toxic Air Contaminants
The public’s exposure to toxic air contaminants (TACs) is a significant public health issue in California. In 1983, the California Legislature enacted a program to identify the health effects of TACs and to reduce exposure to these contaminants to protect the public health (Assembly Bill (AB) 1807: Health and Safety Code Sections 39650–39674). The Legislature established a two-step process to address the potential health effects from TACs. The first step is the risk assessment (or identification) phase. The second step is the risk management (or control) phase of the process.
The California Air Toxics Program establishes the process for the identification and control of toxic air contaminants and includes provisions to make the public aware of significant toxic exposures and for reducing risk. Additionally, the Air Toxics "Hot Spots" Information and Assessment Act (AB 2588, 1987, Connelly) was enacted in 1987 and requires stationary sources to report the types and quantities of certain substances routinely released into the air. The goals of the Air Toxics "Hot Spots" Act are to collect emission data, identify facilities having localized impacts, ascertain health risks, notify nearby residents of significant risks, and reduce those significant risks to acceptable levels. The Children's Environmental Health Protection Act, Senate Bill 25 (Chapter 731, Escutia, Statutes of 1999), focuses on children's exposure to air pollutants. The Act requires CARB to review its air quality standards from a children's health perspective, evaluate the statewide air monitoring network, and develop any additional air toxic control measures needed to protect children's health.
Diesel-exhaust particulate matter emissions have been established as TACs. Diesel emissions generated within the county and surrounding areas pose a potential hazard to residents and visitors. Following the identification of diesel particulate matter as an air toxic in 1998, CARB has worked on developing strategies and regulations aimed at reducing the risk from diesel particulate matter. The overall strategy for achieving these
3.0 Environmental Analysis 3.2 Air Quality
Page 3.2-6
reductions is found in the Risk Reduction Plan to Reduce Particulate Matter Emissions from Diesel-Fueled Engines and Vehicles (State of California 2000). A stated goal of the plan is to reduce the cancer risk statewide arising from exposure to diesel particulate matter 75 percent by 2010 and 85 percent by 2020.
3.2.2 Environmental Setting The proposed Project is located within the SCAB, one of 15 air basins that geographically divide the state of California. Air quality at a particular location is a function of the kinds, amounts, and dispersal rates of pollutants being emitted into the air locally and throughout the basin. The major factors affecting pollutant dispersion are wind speed and direction, the vertical dispersion of pollutants (which is affected by inversions), and the local topography. Based on standards at the federal and state levels, air basins are classified as in attainment or in non-attainment for pollutants of concern. Non-attainment areas are required to implement a plan to meet the standard.
The SCAB is currently classified as a federal and state non-attainment area for O3, PM10, and PM2.5, and a state non-attainment area for NO2. Additionally, Los Angeles County, which is also within the SCAB, is a state non-attainment area for lead.
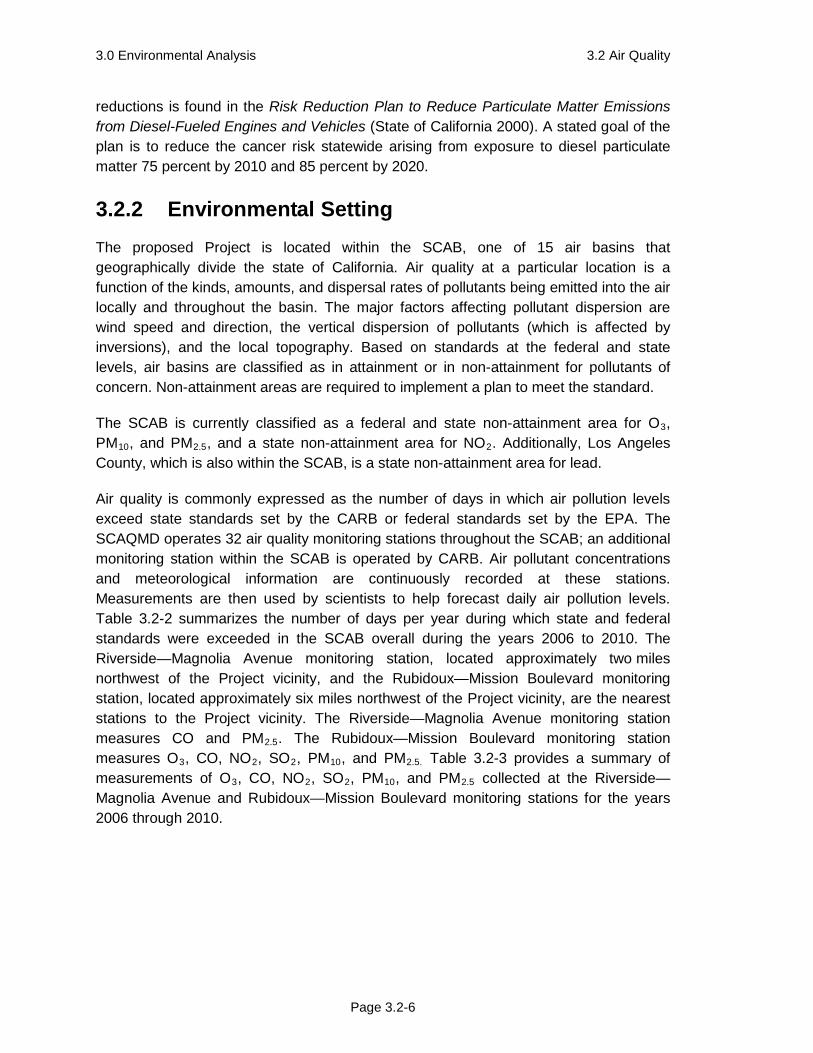
Air quality is commonly expressed as the number of days in which air pollution levels exceed state standards set by the CARB or federal standards set by the EPA. The SCAQMD operates 32 air quality monitoring stations throughout the SCAB; an additional monitoring station within the SCAB is operated by CARB. Air pollutant concentrations and meteorological information are continuously recorded at these stations. Measurements are then used by scientists to help forecast daily air pollution levels. Table 3.2-2 summarizes the number of days per year during which state and federal standards were exceeded in the SCAB overall during the years 2006 to 2010. The Riverside—Magnolia Avenue monitoring station, located approximately two miles northwest of the Project vicinity, and the Rubidoux—Mission Boulevard monitoring station, located approximately six miles northwest of the Project vicinity, are the nearest stations to the Project vicinity. The Riverside—Magnolia Avenue monitoring station measures CO and PM2.5. The Rubidoux—Mission Boulevard monitoring station measures O3, CO, NO2, SO2, PM10, and PM2.5. Table 3.2-3 provides a summary of measurements of O3, CO, NO2, SO2, PM10, and PM2.5 collected at the Riverside—Magnolia Avenue and Rubidoux—Mission Boulevard monitoring stations for the years 2006 through 2010.
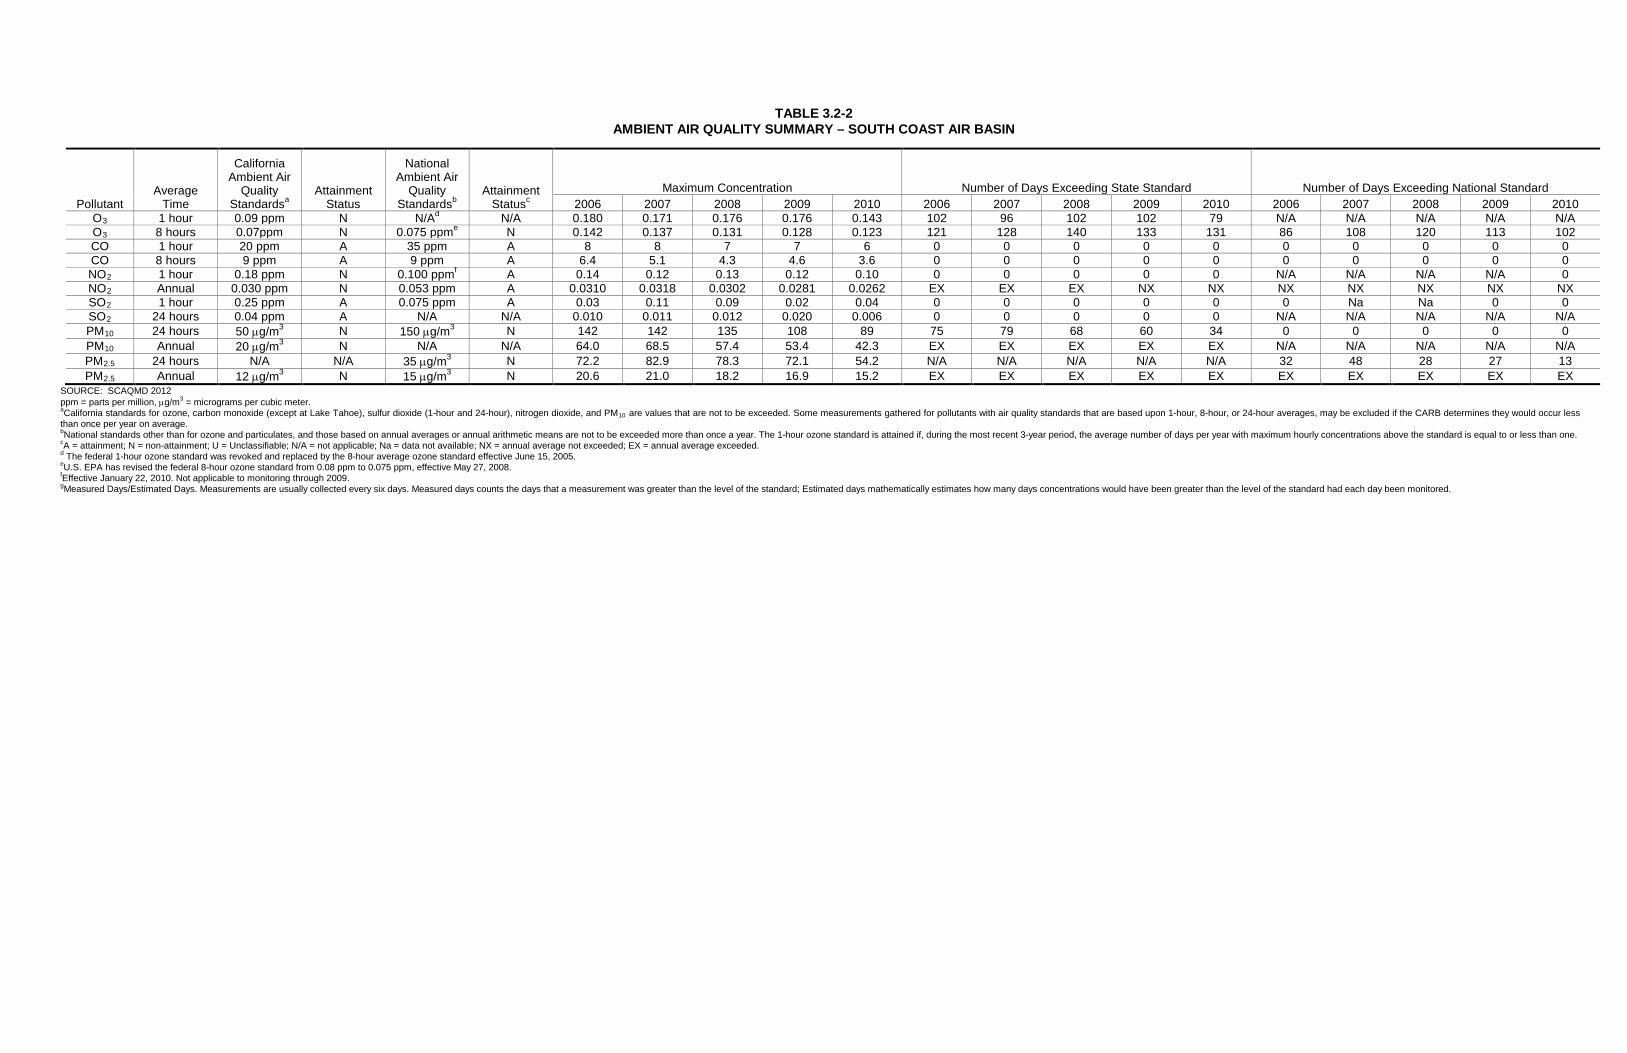
TABLE 3.2-2 AMBIENT AIR QUALITY SUMMARY – SOUTH COAST AIR BASIN
Pollutant
Average Time
California Ambient Air
Quality Standardsa
Attainment Status
National Ambient Air
Quality Standardsb
Attainment Statusc
Maximum Concentration
Number of Days Exceeding State Standard
Number of Days Exceeding National Standard
2006 2007 2008 2009 2010 2006 2007 2008 2009 2010 2006 2007 2008 2009 2010 O3 1 hour 0.09 ppm N N/Ad N/A 0.180 0.171 0.176 0.176 0.143 102 96 102 102 79 N/A N/A N/A N/A N/A O3 8 hours 0.07ppm N 0.075 ppme N 0.142 0.137 0.131 0.128 0.123 121 128 140 133 131 86 108 120 113 102 CO 1 hour 20 ppm A 35 ppm A 8 8 7 7 6 0 0 0 0 0 0 0 0 0 0 CO 8 hours 9 ppm A 9 ppm A 6.4 5.1 4.3 4.6 3.6 0 0 0 0 0 0 0 0 0 0 NO2 1 hour 0.18 ppm N 0.100 ppmf A 0.14 0.12 0.13 0.12 0.10 0 0 0 0 0 N/A N/A N/A N/A 0 NO2 Annual 0.030 ppm N 0.053 ppm A 0.0310 0.0318 0.0302 0.0281 0.0262 EX EX EX NX NX NX NX NX NX NX SO2 1 hour 0.25 ppm A 0.075 ppm A 0.03 0.11 0.09 0.02 0.04 0 0 0 0 0 0 Na Na 0 0 SO2 24 hours 0.04 ppm A N/A N/A 0.010 0.011 0.012 0.020 0.006 0 0 0 0 0 N/A N/A N/A N/A N/A PM10
24 hours 50 µg/m3 N 150 µg/m3 N 142 142 135 108 89 75 79 68 60 34 0 0 0 0 0
PM10 Annual 20 µg/m3 N N/A N/A 64.0 68.5 57.4 53.4 42.3 EX EX EX EX EX N/A N/A N/A N/A N/A
PM2.5 24 hours N/A N/A 35 µg/m3 N 72.2 82.9 78.3 72.1 54.2 N/A N/A N/A N/A N/A 32 48 28 27 13
PM2.5 Annual 12 µg/m3 N 15 µg/m3 N 20.6 21.0 18.2 16.9 15.2 EX EX EX EX EX EX EX EX EX EX
SOURCE: SCAQMD 2012 ppm = parts per million, µg/m3 = micrograms per cubic meter. aCalifornia standards for ozone, carbon monoxide (except at Lake Tahoe), sulfur dioxide (1-hour and 24-hour), nitrogen dioxide, and PM10 are values that are not to be exceeded. Some measurements gathered for pollutants with air quality standards that are based upon 1-hour, 8-hour, or 24-hour averages, may be excluded if the CARB determines they would occur less than once per year on average. bNational standards other than for ozone and particulates, and those based on annual averages or annual arithmetic means are not to be exceeded more than once a year. The 1-hour ozone standard is attained if, during the most recent 3-year period, the average number of days per year with maximum hourly concentrations above the standard is equal to or less than one. cA = attainment; N = non-attainment; U = Unclassifiable; N/A = not applicable; Na = data not available; NX = annual average not exceeded; EX = annual average exceeded. d The federal 1-hour ozone standard was revoked and replaced by the 8-hour average ozone standard effective June 15, 2005. eU.S. EPA has revised the federal 8-hour ozone standard from 0.08 ppm to 0.075 ppm, effective May 27, 2008. fEffective January 22, 2010. Not applicable to monitoring through 2009. gMeasured Days/Estimated Days. Measurements are usually collected every six days. Measured days counts the days that a measurement was greater than the level of the standard; Estimated days mathematically estimates how many days concentrations would have been greater than the level of the standard had each day been monitored.
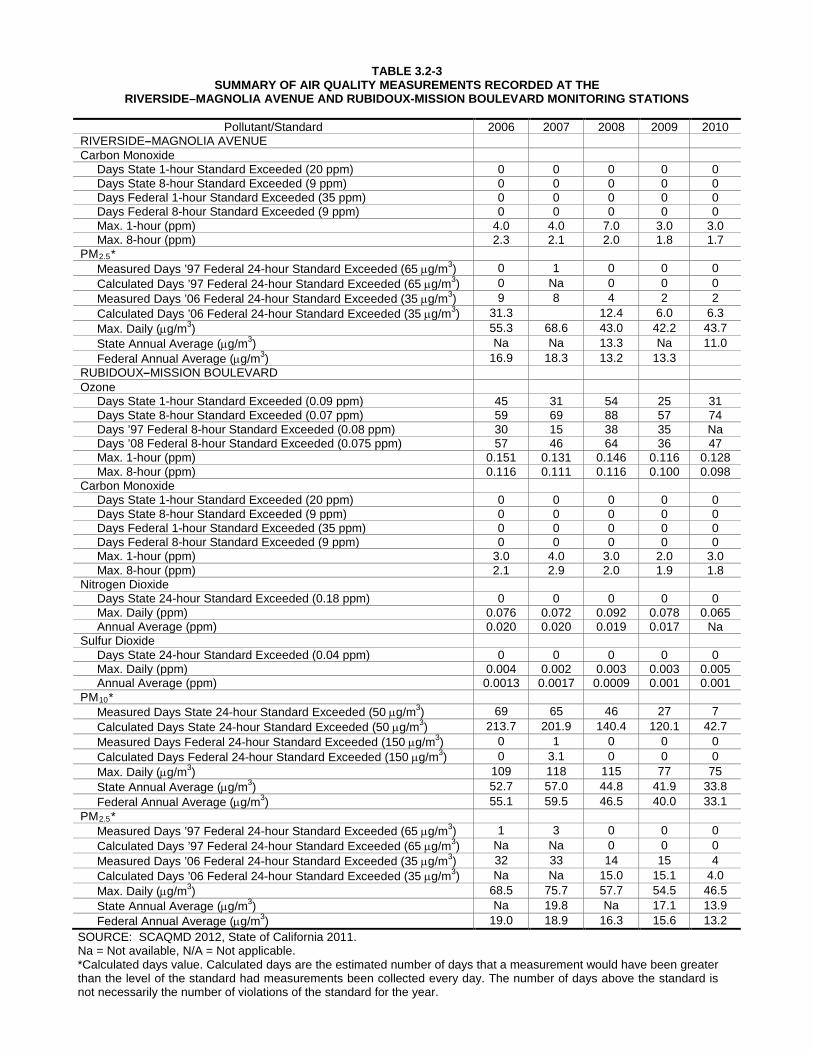
TABLE 3.2-3
SUMMARY OF AIR QUALITY MEASUREMENTS RECORDED AT THE RIVERSIDE–MAGNOLIA AVENUE AND RUBIDOUX-MISSION BOULEVARD MONITORING STATIONS
Pollutant/Standard 2006 2007 2008 2009 2010
RIVERSIDE–MAGNOLIA AVENUE Carbon Monoxide
Days State 1-hour Standard Exceeded (20 ppm) 0 0 0 0 0 Days State 8-hour Standard Exceeded (9 ppm) 0 0 0 0 0 Days Federal 1-hour Standard Exceeded (35 ppm) 0 0 0 0 0 Days Federal 8-hour Standard Exceeded (9 ppm) 0 0 0 0 0 Max. 1-hour (ppm) 4.0 4.0 7.0 3.0 3.0 Max. 8-hour (ppm) 2.3 2.1 2.0 1.8 1.7
PM2.5* Measured Days ’97 Federal 24-hour Standard Exceeded (65 µg/m3) 0 1 0 0 0 Calculated Days ’97 Federal 24-hour Standard Exceeded (65 µg/m3) 0 Na 0 0 0 Measured Days ’06 Federal 24-hour Standard Exceeded (35 µg/m3) 9 8 4 2 2 Calculated Days ’06 Federal 24-hour Standard Exceeded (35 µg/m3) 31.3 12.4 6.0 6.3 Max. Daily (µg/m3) 55.3 68.6 43.0 42.2 43.7 State Annual Average (µg/m3) Na Na 13.3 Na 11.0 Federal Annual Average (µg/m3) 16.9 18.3 13.2 13.3
RUBIDOUX–MISSION BOULEVARD Ozone
Days State 1-hour Standard Exceeded (0.09 ppm) 45 31 54 25 31 Days State 8-hour Standard Exceeded (0.07 ppm) 59 69 88 57 74 Days ’97 Federal 8-hour Standard Exceeded (0.08 ppm) 30 15 38 35 Na Days ’08 Federal 8-hour Standard Exceeded (0.075 ppm) 57 46 64 36 47 Max. 1-hour (ppm) 0.151 0.131 0.146 0.116 0.128 Max. 8-hour (ppm) 0.116 0.111 0.116 0.100 0.098
Carbon Monoxide Days State 1-hour Standard Exceeded (20 ppm) 0 0 0 0 0 Days State 8-hour Standard Exceeded (9 ppm) 0 0 0 0 0 Days Federal 1-hour Standard Exceeded (35 ppm) 0 0 0 0 0 Days Federal 8-hour Standard Exceeded (9 ppm) 0 0 0 0 0 Max. 1-hour (ppm) 3.0 4.0 3.0 2.0 3.0 Max. 8-hour (ppm) 2.1 2.9 2.0 1.9 1.8
Nitrogen Dioxide Days State 24-hour Standard Exceeded (0.18 ppm) 0 0 0 0 0 Max. Daily (ppm) 0.076 0.072 0.092 0.078 0.065 Annual Average (ppm) 0.020 0.020 0.019 0.017 Na
Sulfur Dioxide Days State 24-hour Standard Exceeded (0.04 ppm) 0 0 0 0 0 Max. Daily (ppm) 0.004 0.002 0.003 0.003 0.005 Annual Average (ppm) 0.0013 0.0017 0.0009 0.001 0.001
PM10* Measured Days State 24-hour Standard Exceeded (50 µg/m3) 69 65 46 27 7 Calculated Days State 24-hour Standard Exceeded (50 µg/m3) 213.7 201.9 140.4 120.1 42.7 Measured Days Federal 24-hour Standard Exceeded (150 µg/m3) 0 1 0 0 0 Calculated Days Federal 24-hour Standard Exceeded (150 µg/m3) 0 3.1 0 0 0 Max. Daily (µg/m3) 109 118 115 77 75 State Annual Average (µg/m3) 52.7 57.0 44.8 41.9 33.8 Federal Annual Average (µg/m3) 55.1 59.5 46.5 40.0 33.1
PM2.5* Measured Days ’97 Federal 24-hour Standard Exceeded (65 µg/m3) 1 3 0 0 0 Calculated Days ’97 Federal 24-hour Standard Exceeded (65 µg/m3) Na Na 0 0 0 Measured Days ’06 Federal 24-hour Standard Exceeded (35 µg/m3) 32 33 14 15 4 Calculated Days ’06 Federal 24-hour Standard Exceeded (35 µg/m3) Na Na 15.0 15.1 4.0 Max. Daily (µg/m3) 68.5 75.7 57.7 54.5 46.5 State Annual Average (µg/m3) Na 19.8 Na 17.1 13.9 Federal Annual Average (µg/m3) 19.0 18.9 16.3 15.6 13.2
SOURCE: SCAQMD 2012, State of California 2011. Na = Not available, N/A = Not applicable. *Calculated days value. Calculated days are the estimated number of days that a measurement would have been greater than the level of the standard had measurements been collected every day. The number of days above the standard is not necessarily the number of violations of the standard for the year.
3.0 Environmental Analysis 3.2 Air Quality
Page 3.2-10
3.2.2.1 Ozone
Nitrogen oxides and hydrocarbons (reactive organic gases) are known as the chief “precursors” of ozone. These compounds react in the presence of sunlight to produce ozone, which is the primary air pollution problem in the SCAB. Exposure to levels of ozone above the air quality standards can lead to human health effects such as lung inflammation and tissue damage and impaired lung functioning. Because sunlight plays such an important role in its formation, ozone pollution, or smog, is mainly a concern during the daytime in summer months. The SCAB is currently designated a federal and state non-attainment area for ozone. During the past 30 years, the SCAB had experienced a decline in ozone concentrations despite the region’s growth in population and vehicle miles traveled (SCAQMD 2012).
In the SCAB overall, during the five-year period of 2006 to 2010, the state 1-hour ozone standard of 0.09 parts per million (ppm) was exceeded 102 days in 2006, 96 days in 2007, 102 days in 2008, 102 days in 2009, and 79 days in 2010.
At the Rubidoux—Mission Boulevard monitoring station, the 1-hour state standard for ozone of 0.09 ppm was exceeded 45 days in 2006, 31 days in 2007, 54 days in 2008, 25 days in 2009, and 31 days in 2010.
In order to address adverse health effects due to prolonged exposure, the EPA phased out the national 1-hour ozone standard and replaced it with the more protective 8-hour ozone standard. The SCAB is currently a nonattainment area for the previous (1997) national 8-hour standard and is recommended as a nonattainment area for the revised (2008) national 8-hour standard of 0.075 ppm.
In the SCAB overall, during the five-year period of 2006 to 2010 the revised national 8-hour standard of 0.075 was exceeded by 86 days in 2006, 108 days in 2007, 120 days in 2008, 113 days in 2009, and 102 days in 2010. The stricter state 8-hour ozone standard of 0.07 ppm was exceeded 121 days in 2006, 128 days in 2007, 140 days in 2008, 133 days in 2009, and 131 days in 2010.
At the Rubidoux—Mission Boulevard monitoring station, the previous national 8-hour standard of 0.08 ppm was exceeded 30 days in 2006, 15 days in 2007, 38 days in 2008, and 35 days in 2009. Data was not available for 2010. The revised national 8-hour standard of 0.075 ppm was exceeded 57 days in 2006, 46 days in 2007, 64 days in 2008, 36 days in 2009, and 47 days in 2010. The stricter state 8-hour ozone standard of 0.07 ppm was exceeded 59 days in 2006, 69 days in 2007, 88 days in 2008, 57 days in 2009, and 74 days in 2010.
Not all of the air basin’s pollutants are created within the basin. The SCAB has been classified as a transport contributor to downwind air basins. Under certain meteorological conditions, such as during Santa Ana wind events, ozone and other pollutants are
3.0 Environmental Analysis 3.2 Air Quality
Page 3.2-11
transported from the SCAB to other air basins. The Mojave Desert Air Basin (which includes the eastern portion of Riverside County), the Salton Sea Air Basin, the San Diego Air Basin, and the South Central Coast Air Basin are all affected by ozone concentrations from the SCAB. Similarly, inversion and ocean winds transport pollutants from other basins into the SCAB and from western portions of the SCAB into the Project vicinity.
3.2.2.2 Carbon Monoxide
CO is a colorless, odorless gas resulting from the incomplete combustion of carbon-containing fuels. Exposure to levels of CO above the air quality standards can lead to fatigue, headaches, confusion, and dizziness. The SCAB is classified as a state and federal attainment area, as shown in Table 3.2-2. From 2006 to 2010, SCAB had zero days exceeding the 8-hour federal and state CO standards.
Small-scale, localized concentrations of CO above the state and national standards have the potential to occur at intersections with stagnation points such as those that occur on major highways and heavily traveled and congested roadways. Localized high concentrations of CO are referred to as “CO hot spots” and are a concern at congested intersections, where automobile engines burn fuel less efficiently and their exhaust contains more CO.
In 1987, the California legislature adopted the Air Toxics “Hot Spots” Information and Assessment Act (AB 2588) with the goals of collecting emissions data of toxic air contaminants, identifying facilities having localized impacts, determining health risks, and notifying affected individuals. The SCAQMD prepares an annual report on existing and future activities related to AB 2588. The report lists facilities which have prepared health risk assessments for the AB 2588 program and their corresponding risks. Approximately 96 percent of the facilities have cancer risks less than ten in a million and over 98 percent have acute and chronic non-cancer hazard indices less than one. The facilities in the City of Riverside (City) that have prepared an HRA are Riverside Cement Company, March Air Force Base, Rohr Industries, University of California Riverside, Caddock Electronics, ER Carpenter Company, Prudential Overall Supply, and Associated Plastics. None of these facilities are in the PIA.
3.2.2.3 PM10
PM10 is particulate matter with an aerodynamic diameter of 10 microns or less. Ten microns is about one-seventh of the diameter of a human hair. Particulate matter is a complex mixture of very tiny solid or liquid particles composed of chemicals, soot, and dust. The exposure to PM10 levels exceed air quality standards is associated with increased risk of lung and heart-related respiratory illness. Sources of PM10 emissions in
3.0 Environmental Analysis 3.2 Air Quality
Page 3.2-12
the SCAB consist mainly of urban activities, dust suspended by vehicle traffic, and secondary aerosols formed by reactions in the atmosphere.
Particles classified under the PM10 category are mainly emitted directly from activities that disturb the soil including travel on roads and construction, mining or agricultural operations. Other sources include windblown dust and the burning of fuels such as gasoline, oil, diesel, or wood. For several reasons related to the area’s dry climate and coastal location, the SCAB has special difficulty in developing adequate tactics to meet present State particulate standards. While emission controls for ozone also reduce levels of PM10, additional controls aimed specifically at PM10 will be required to reduce the high levels.
The SCAB is designated as state and federal non-attainment area for PM10. The measured federal PM10 standard of 150 µg/m3 was not exceeded in the SCAB during the years 2006 to 2010. The state standard of 50 µg/m3 was exceeded 75 days in 2006, 79 days in 2007, 68 days in 2008, 60 days in 2009 and 34 days in 2010.
At the Rubidoux—Mission Boulevard monitoring station, the national 24-hour PM10 standard was exceeded one day in 2007. The exceedance occurred at a time when major wildfires were raging throughout the county. Consequently, this exceedance was likely caused by the wildfires and would be beyond the control of the SCAQMD. As such, this event is covered under the EPA’s Natural Events Policy that permits, under certain circumstances, the exclusion of air quality data attributable to uncontrollable natural events (e.g., volcanic activity, wild land fires, and high wind events). The stricter state 24-hour PM10 standard was exceeded 69 days in 2006, 65 days in 2007, 46 days in 2008, 27 days in 2009, and 7 days in 2010.
3.2.2.4 PM2.5
Airborne, inhalable particles with aerodynamic diameters of 2.5 microns or less have been recognized as an air quality concern requiring regular monitoring. The health risks associated with exposure to excessive levels of PM2.5 are similar to those associated with PM10. Federal PM2.5 standards established in 1997 include an annual arithmetic mean of 15 µg/m3 and a 24-hour concentration of 65 µg/m3. As discussed above, the 24-hour PM2.5 standard has been changed to 35 µg/m3. However, this does not apply to the monitoring from 2004 to 2006. State PM2.5 standards established in 2002 are an annual arithmetic mean of 12 µg/m3.
Table 3.2-3 shows that the prior 24-hour PM2.5 standard of 65 µg/m3 was exceeded one day in 2006 and three days in 2007 at the Rubidoux—Mission Boulevard monitoring station, and one day in 2007 at the Riverside—Magnolia Avenue monitoring station. The new standard of 35 µg/m3 was exceeded 32 days in 2006, 33 days in 2007, 14 days in 2008, 15 days in 2009, and four days in 2010 at the Rubidoux—Mission Boulevard

3.0 Environmental Analysis 3.2 Air Quality
Page 3.2-13
monitoring station, and 9 days in 2006, eight days in 2007, four days in 2008, 2 days in 2009, and two days in 2010 at the Riverside—Magnolia Avenue monitoring station.
The SCAB is a non-attainment area for the state and federal PM2.5 standards.
3.2.2.5 Other Criteria Pollutants
The SCAB is a state non-attainment area for NO2. Additionally, Los Angeles County, which is also within the SCAB, is a state non-attainment area for lead. The national and state standards for sulfur oxide (SOx) are being met in the SCAB. As discussed above, new standards for these pollutants have been adopted, and new designations for the SCAB will be determined in the future. The SCAB is also in attainment of the state standards for hydrogen sulfides, sulfates, and visibility reducing particles.
3.2.3 Significance Determination Thresholds Based on Appendix G of the California Environmental Quality Act (CEQA) Guidelines, impacts related to air quality would be significant if the proposed Project would:
1. Conflict with or obstruct implementation of the applicable air quality plan,
2. Violate any air quality standard or contribute substantially to an existing or projected air quality violation,
3. Result in a cumulatively considerable net increase of any criteria pollutant for which the project region is non-attainment under an applicable federal or state ambient air quality standard (including releasing emissions which exceed quantitative thresholds for ozone precursors),
4. Expose sensitive receptors to substantial pollutant concentrations,
5. Create objectionable odors affecting a substantial number of people.
3.2.4 Issue 1: Air Quality Plan Implementation Would the proposed Project conflict with or obstruct implementation of the applicable air quality plan?
3.2.4.1 Impact Analysis
As described above, the California Clean Air Act requires areas that are designated non-attainment of state ambient air quality standards to prepare and implement plans to attain the standards by the earliest practicable date. The 2007 AQMP includes a comprehensive strategy aimed at controlling pollution from all sources, including
3.0 Environmental Analysis 3.2 Air Quality
Page 3.2-14
stationary sources, on-road and off-road mobile sources, and area sources. Despite improvements in southern California’s air quality, the region is a federal non-attainment area for PM10, PM2.5, and 8-hour surface-level O3. The AQMP proposes attainment demonstration of the federal PM10, PM2.5, and O3 standards.
Normally, if a project is consistent with land use designated in the city’s General Plan, it can be considered consistent with the growth assumptions in the AQMP (State of California 1989). The basis for this plan is the distribution of population in the region as projected by SCAG. Growth forecasting is based in part on the land uses which are established by the General Plan 2025 (SCAG 2012 [Growth Forecast Appendix page 29]).
The circulation network set forth in the 1994 General Plan and the current General Plan 2025 has not yet been completed. Key features of the 1994 General Plan not constructed when preparation of the General Plan 2025 update began included the linkage of Overlook Parkway (connecting the Alessandro Heights and Canyon Crest neighborhoods); therefore, this segment was addressed in the General Plan 2025. The Circulation and Community Mobility Element of the General Plan 2025 included a Master Plan of Roadways (see Figure 2-3). A feature of the Master Plan of Roadways included the provision of a roadway extension west of Washington Street.
Four scenarios related to traffic control and circulation patterns associated with Overlook Parkway are evaluated. Although these scenarios are intended to resolve the General Plan 2025 goals and policies relative to Overlook Parkway, none of the four scenarios would alter land use designations or result in an increase in growth in the region beyond what has already been projected, planned for, and approved by SCAG and the City. The following is a more detailed discussion for each scenario and its consistency with the General Plan 2025 and growth projections therein.
Scenario 1
Under Scenario 1, both Crystal View Terrace and Green Orchard Place gates would remain in place and be closed until Overlook Parkway is connected over the Alessandro Arroyo eastward to Alessandro Boulevard. Scenario 1 addresses traffic control devices and would not alter land use designations or affect SCAG growth assumptions. Therefore, Scenario 1 would not interfere with the 2007 AQMP, and no impact would result.
Scenario 2
Under Scenario 2, the gates at both Crystal View Terrace and Green Orchard Place would be permanently removed, and there would be no near-term connection of Overlook Parkway across the Alessandro Arroyo. The City would be required to approve an amendment to a policy in the General Plan 2025 regarding the use of barrier gates
3.0 Environmental Analysis 3.2 Air Quality
Page 3.2-15
until such time that Overlook Parkway is connected. Like Scenario 1, Scenario 2 would not alter land use designations or affect SCAG growth assumptions. Therefore, Scenario 2 would not interfere with the 2007 AQMP, and no impact would result.
Scenario 3
Under Scenario 3, the gates at Crystal View Terrace and Green Orchard Place would be removed and Overlook Parkway would be connected between Via Vista Drive and approximately 500 feet west of Sandtrack Road and over the Alessandro Arroyo. Scenario 3 would be consistent with the General Plan 2025 circulation network. Also, the scenario would not alter land use designations or affect SCAG growth assumptions. Therefore, Scenario 3 would not interfere with the 2007 AQMP, and no impact would result.
Scenario 4
Under Scenario 4, both Crystal View Terrace and Green Orchard Place gates would be removed and Overlook Parkway would be connected over the Alessandro Arroyo and east to Alessandro Boulevard, consistent with the General Plan 2025 circulation network. In addition, the Proposed C Street would be constructed west of Washington Street. The scenario would not alter land use designations or affect SCAG growth assumptions. Therefore, Scenario 4 would not interfere with the 2007 AQMP, and no impact would result.
Off-site
The Traffic Impact Analysis (TIA) prepared for the proposed Project identifies measures to mitigate potentially significant traffic impacts within the Project vicinity. Measures consist of improvements such as signalization, restriping, and repaving for additional turn lanes at key intersections. These improvements would not conflict with or obstruct implementation of the applicable air quality plan. No impacts are identified.
3.2.4.2 Significance of Impacts
All four scenarios would be consistent with the growth projections accounted for in the AQMP. As a result, the proposed Project would not interfere with implementation of the 2007 AQMP, and no impact would result.
No impacts would occur from implementation of off-site improvements.
3.2.4.3 Mitigation, Monitoring, and Reporting
No mitigation is required.
3.0 Environmental Analysis 3.2 Air Quality
Page 3.2-16
3.2.5 Issues 2 and 3: Air Quality Violations/Pollutant Emissions
Would the proposed Project violate any air quality standard or contribute substantially to an existing or projected air quality violation; or
Would the proposed Project result in a cumulatively considerable net increase of any criteria pollutant for which the project region is non-attainment under an applicable federal or state ambient air quality standard (including releasing emissions which exceed quantitative thresholds for ozone precursors)?
3.2.5.1 Impact Analysis
Air quality impacts can result from the construction and operation of a project. Construction impacts are short term and result from fugitive dust, equipment exhaust, and indirect effects associated with construction workers and deliveries. Operational impacts can occur from a new stationary source (e.g., factory, industrial uses, etc.), regional impacts resulting from growth-inducing development, or local hot-spot effects stemming from sensitive receivers being placed close to highly congested roadways. In the case of this Project, none of the four scenarios propose a new stationary source of emissions (i.e., factories or other large stationary emitters). The primary source of emissions would be construction activities and mobile emissions due to the change in vehicle miles traveled (VMT) as a result of the proposed Project.
a. Construction Emissions
Construction emissions were estimated for each scenario using the California Emissions Estimator Model (CalEEMod) that was released in March 2011 by the SCAQMD. In the case of the proposed Project, only the construction-related portions of the model were utilized. Operational (vehicle) emission calculations are discussed below. Construction inputs to CalEEMod include such items as the air basin containing the Project, duration of construction phases, construction equipment usage, grading areas, season, and ambient temperature, as well as other parameters. Emissions of NOx, CO, SOx, PM10, PM2.5, and reactive organic gasses (ROGs), an O3 precursor, are calculated. Fuel used in construction equipment and most other vehicles is not leaded and the Project would not be a source of lead emissions, and consequently, lead emissions are not calculated.
Scenario 1
Under Scenario 1, both Crystal View Terrace and Green Orchard Place gates would remain in place and be closed. This scenario addresses the use of traffic control devices and does not include roadway construction. Traffic flows under Scenario 1 would be the same as those required for the legal condition with the gates in place. Because no construction would occur, Scenario 1 would not produce construction related emission or
3.0 Environmental Analysis 3.2 Air Quality
Page 3.2-17
result in a violation or worsening of air quality. Therefore, construction air emission impacts under Scenario 1 would be less than significant.
Scenario 2
Under Scenario 2, the gates at both Crystal View Terrace and Green Orchard Place would be removed, and there would be no connection of Overlook Parkway across the Alessandro Arroyo and to Alessandro Boulevard. Like Scenario 1, no construction would occur under Scenario 2, as the removal of the gates is a minor procedure. Because Scenario 2 does not involve construction, there would be no increase in criteria pollutants. In addition, Scenario 2 would not contribute to an air quality violation, and impacts would be less than significant.
Scenario 3
Under Scenario 3, the gates at Crystal View Terrace and Green Orchard Place would be removed and Overlook Parkway would be connected between Via Vista Drive and approximately 500 feet west of Sandtrack Road and over the Alessandro Arroyo. In addition, storm drains, water lines, and gas and electric power lines would be extended to tie into existing lines concurrent with roadway construction. Temporary construction activities would occur within a construction easement on either side of the proposed roadways. Construction staging would be accommodated primarily on Overlook Parkway.
Construction-related pollutants result from dust raised during demolition and grading, emissions from construction vehicles, and chemicals used during construction. Fugitive dust emissions vary greatly during construction and are dependent on the amount and type of activity, silt content of the soil, and the weather. Vehicles moving over paved and unpaved surfaces, demolition, excavation, earth movement, grading, and wind erosion from exposed surfaces are all sources of fugitive dust.
Heavy-duty construction equipment is usually diesel powered. In general, emissions from diesel-powered equipment contain more nitrogen oxides, sulfur oxides, and particulate matter than gasoline-powered engines. However, diesel-powered engines generally produce less CO and less ROGs than do gasoline-powered engines. Standard construction equipment includes dozers, rollers, scrapers, dewatering pumps, backhoes, loaders, paving equipment, delivery/haul trucks, jacking equipment, welding machines, pile drivers, and so on. CalEEMod assumes that all construction equipment would be diesel powered. Based on typical construction fleets, this is a reasonable assumption, and was used in this analysis.
Grading would be required to construct the missing section of roadway between Brittanee Court and Sandtrack Road. This fill crossing construction is anticipated to last approximately two months. Additionally, a bridge is proposed to connect Overlook
3.0 Environmental Analysis 3.2 Air Quality
Page 3.2-18
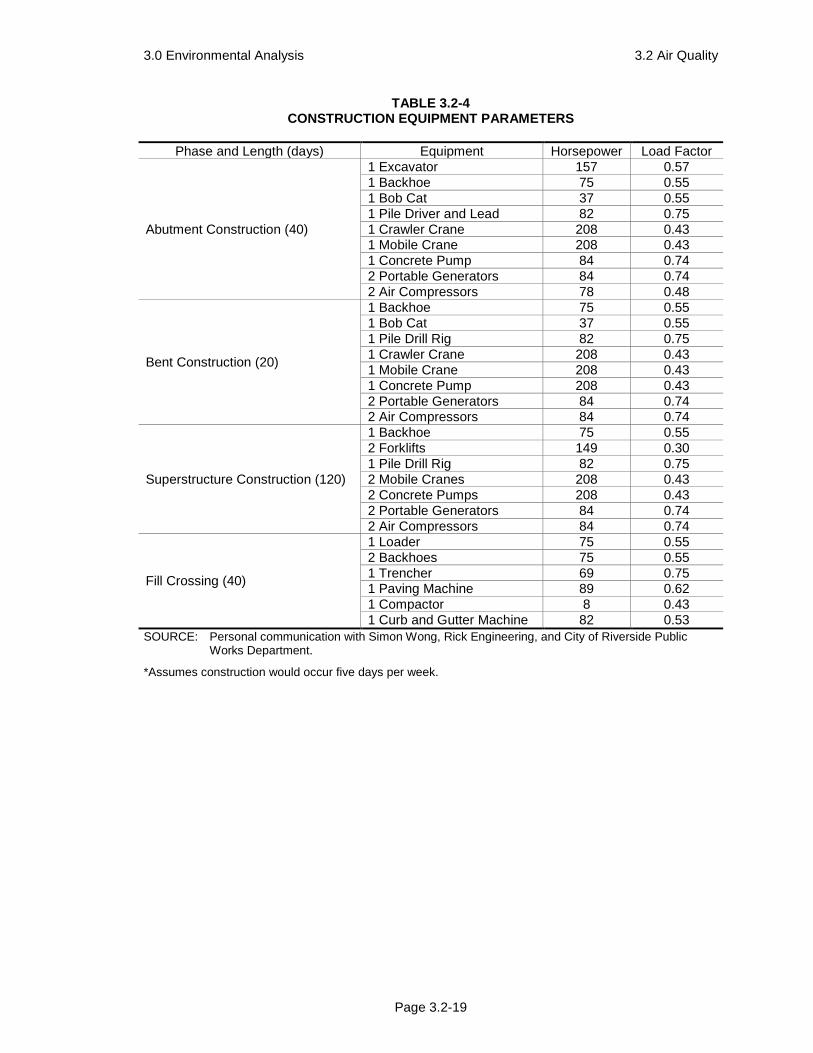
Parkway from Crystal View Terrace to Via Vista Drive and span the Alessandro Arroyo. The bridge construction is anticipated to last approximately nine months. The bridge construction would be divided into three phases: abutment construction (two months), bent construction (one month), and superstructure construction (six months). It was assumed that these construction phases (i.e., abutment construction, bent construction, superstructure construction, and fill crossing construction) would not overlap. Installation/construction of utilities (water, sewer, electrical) would be concurrent with these phases and was taken into account in CalEEMod. It was determined that this would be more efficient and would limit any subsequent surface disturbance. A trencher was included in the CalEEMod calculations. Table 3.2-4 summarizes the phases of construction, the equipment required for each task, and the default horsepower and load factor for each piece of equipment. It was assumed that each piece of equipment would operate eight hours per day and for five days a week. A total area of three acres would be graded.
In addition to the equipment listed in Table 3.2-4, trucks would be required for material delivery and hauling. Emissions due to on-road trucks as well as worker commute were calculated using CalEEMod.
3.0 Environmental Analysis 3.2 Air Quality
Page 3.2-19
TABLE 3.2-4 CONSTRUCTION EQUIPMENT PARAMETERS
Phase and Length (days) Equipment Horsepower Load Factor
Abutment Construction (40)
1 Excavator 157 0.57 1 Backhoe 75 0.55 1 Bob Cat 37 0.55 1 Pile Driver and Lead 82 0.75 1 Crawler Crane 208 0.43 1 Mobile Crane 208 0.43 1 Concrete Pump 84 0.74 2 Portable Generators 84 0.74 2 Air Compressors 78 0.48
Bent Construction (20)
1 Backhoe 75 0.55 1 Bob Cat 37 0.55 1 Pile Drill Rig 82 0.75 1 Crawler Crane 208 0.43 1 Mobile Crane 208 0.43 1 Concrete Pump 208 0.43 2 Portable Generators 84 0.74 2 Air Compressors 84 0.74
Superstructure Construction (120)
1 Backhoe 75 0.55 2 Forklifts 149 0.30 1 Pile Drill Rig 82 0.75 2 Mobile Cranes 208 0.43 2 Concrete Pumps 208 0.43 2 Portable Generators 84 0.74 2 Air Compressors 84 0.74
Fill Crossing (40)
1 Loader 75 0.55 2 Backhoes 75 0.55 1 Trencher 69 0.75 1 Paving Machine 89 0.62 1 Compactor 8 0.43 1 Curb and Gutter Machine 82 0.53
SOURCE: Personal communication with Simon Wong, Rick Engineering, and City of Riverside Public Works Department.
*Assumes construction would occur five days per week.
3.0 Environmental Analysis 3.2 Air Quality
Page 3.2-20
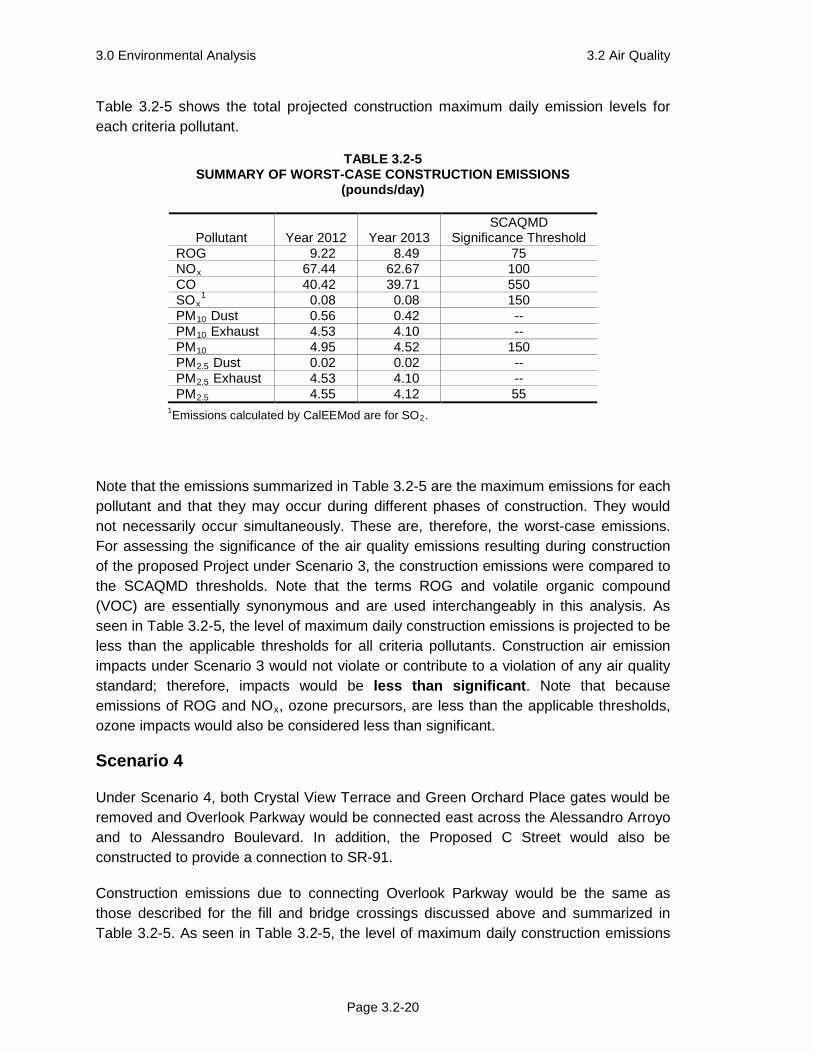
Table 3.2-5 shows the total projected construction maximum daily emission levels for each criteria pollutant.
TABLE 3.2-5 SUMMARY OF WORST-CASE CONSTRUCTION EMISSIONS
(pounds/day)
Pollutant Year 2012 Year 2013 SCAQMD
Significance Threshold ROG 9.22 8.49 75 NOx 67.44 62.67 100 CO 40.42 39.71 550 SOx
1 0.08 0.08 150 PM10 Dust 0.56 0.42 -- PM10 Exhaust 4.53 4.10 -- PM10 4.95 4.52 150 PM2.5 Dust 0.02 0.02 -- PM2.5 Exhaust 4.53 4.10 -- PM2.5 4.55 4.12 55
1Emissions calculated by CalEEMod are for SO2.
Note that the emissions summarized in Table 3.2-5 are the maximum emissions for each pollutant and that they may occur during different phases of construction. They would not necessarily occur simultaneously. These are, therefore, the worst-case emissions. For assessing the significance of the air quality emissions resulting during construction of the proposed Project under Scenario 3, the construction emissions were compared to the SCAQMD thresholds. Note that the terms ROG and volatile organic compound (VOC) are essentially synonymous and are used interchangeably in this analysis. As seen in Table 3.2-5, the level of maximum daily construction emissions is projected to be less than the applicable thresholds for all criteria pollutants. Construction air emission impacts under Scenario 3 would not violate or contribute to a violation of any air quality standard; therefore, impacts would be less than significant. Note that because emissions of ROG and NOx, ozone precursors, are less than the applicable thresholds, ozone impacts would also be considered less than significant.
Scenario 4
Under Scenario 4, both Crystal View Terrace and Green Orchard Place gates would be removed and Overlook Parkway would be connected east across the Alessandro Arroyo and to Alessandro Boulevard. In addition, the Proposed C Street would also be constructed to provide a connection to SR-91.
Construction emissions due to connecting Overlook Parkway would be the same as those described for the fill and bridge crossings discussed above and summarized in Table 3.2-5. As seen in Table 3.2-5, the level of maximum daily construction emissions
3.0 Environmental Analysis 3.2 Air Quality
Page 3.2-21
is projected to be less than the applicable thresholds for all criteria pollutants. Impacts would be less than significant. Construction activities would also occur west of Washington Street. This construction is not anticipated to occur at the same time as the fill crossing and bridge construction. It was assumed that construction would begin in 2013 after the fill crossing and bridge construction is complete.
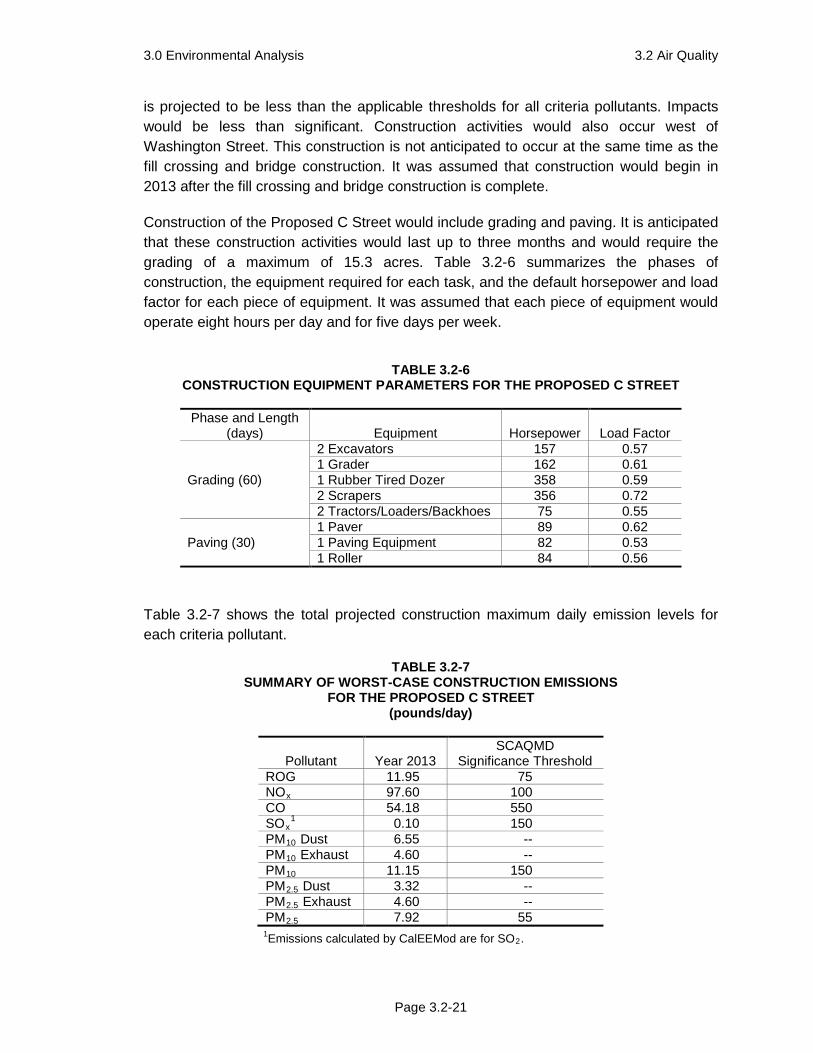
Construction of the Proposed C Street would include grading and paving. It is anticipated that these construction activities would last up to three months and would require the grading of a maximum of 15.3 acres. Table 3.2-6 summarizes the phases of construction, the equipment required for each task, and the default horsepower and load factor for each piece of equipment. It was assumed that each piece of equipment would operate eight hours per day and for five days per week.
TABLE 3.2-6
CONSTRUCTION EQUIPMENT PARAMETERS FOR THE PROPOSED C STREET
Phase and Length (days) Equipment Horsepower Load Factor
Grading (60)
2 Excavators 157 0.57 1 Grader 162 0.61 1 Rubber Tired Dozer 358 0.59 2 Scrapers 356 0.72 2 Tractors/Loaders/Backhoes 75 0.55
Paving (30) 1 Paver 89 0.62 1 Paving Equipment 82 0.53 1 Roller 84 0.56
Table 3.2-7 shows the total projected construction maximum daily emission levels for each criteria pollutant.
TABLE 3.2-7 SUMMARY OF WORST-CASE CONSTRUCTION EMISSIONS
FOR THE PROPOSED C STREET (pounds/day)
Pollutant Year 2013 SCAQMD
Significance Threshold ROG 11.95 75 NOx 97.60 100 CO 54.18 550 SOx
1 0.10 150 PM10 Dust 6.55 -- PM10 Exhaust 4.60 -- PM10 11.15 150 PM2.5 Dust 3.32 -- PM2.5 Exhaust 4.60 -- PM2.5 7.92 55
1Emissions calculated by CalEEMod are for SO2.
3.0 Environmental Analysis 3.2 Air Quality
Page 3.2-22
As seen in Table 3.2-7, the level of maximum daily construction emissions is projected to be less than the applicable thresholds for all criteria pollutants. Direct construction air emission impacts under Scenario 4 would be less than significant. Note that because emissions of ROG and NOx, ozone precursors, are less than the applicable thresholds, ozone impacts would also be considered less than significant.
Off-site
Off-site measures consist of improvements such as signalization, restriping, and repaving for additional turn lanes at key intersections. Construction would involve a minimal amount of construction equipment and would be short term. The improvements, if implemented would also occur after the completion of grading associated with roadway improvements described for the proposed Project and would not occur simultaneously with the construction activities discussed above. Therefore, these improvements would not violate any air quality standard or contribute substantially to an existing or projected air quality violation, or result in a cumulatively considerable net increase in any criteria pollutant. See also additional discussion in the cumulative impacts discussion of Section 4.0. No impacts are identified.
b. Operational Emissions
In order to address operational emissions, the County of Riverside was selected as a study area in order to capture the trips produced and attracted, some of which originate from outside the City boundaries and some of which have a destination outside the City boundary. This was especially important because features of the Project could affect traffic flows throughout the entire City circulation system, and some of the roads within the Project vicinity include major roads that are near the City boundary or provide direct routes of travel beyond City limits.
The total existing traffic volume in Riverside County is 5,531,645 average daily traffic (ADT), and the total projected buildout traffic volume in Riverside County is 11,222,346 ADT (ITERIS, Inc. 2012). The increase in ADT from existing to buildout is due to population growth in the region. The proposed Project is the evaluation of four circulation scenarios associated with Overlook Parkway. The scenarios consider traffic patterns and controls for roadways, but do not propose development that would generate new or additional trips. The Project would not result in an increase in ADT to the roadway network. Therefore, the existing and future total traffic volumes for the study area are the same for each scenario. However, each scenario would affect vehicle traffic patterns and distribution along with trip length on road segments in the County and City. Therefore, the following is an analysis of the changes in VMT and the change in vehicle emissions that would result under each proposed scenario.
3.0 Environmental Analysis 3.2 Air Quality
Page 3.2-23
The buildout year for the Project is 2035. Existing and buildout vehicle emissions for each scenario were calculated using emission factors calculated by the Emission Factors (EMFAC) 2007 program (State of California 2006). The EMFAC 2007 program requires a variety of inputs, including buildout year, ambient air temperature, vehicle mix, percent hot and cold starts, and vehicle speed. Emission factors were calculated for winter and summer average conditions of 50 degrees Fahrenheit (°F) and 80°F, respectively, and 50 percent humidity (Western Regional Climate Center 2011). Other default parameters provided by the model for Riverside County were used in the calculation of individual emission factors for each type of vehicle in the fleet. The EMFAC 2007 default 2011 and 2035 vehicle mixes for Riverside County was assumed. These values are based on an analysis of Department of Motor Vehicles (DMV) registration data specific to the region.
Existing and buildout emission factors in summer and winter conditions can be found in Appendix C of this DEIR.
Traffic information for the Project was obtained from ITERIS, Inc. (2012). Traffic speeds, volumes, and segment lengths for each roadway segment in Riverside County were provided for each scenario. The VMT for each scenario was calculated by multiplying the ADT for each segment by the length of each segment.
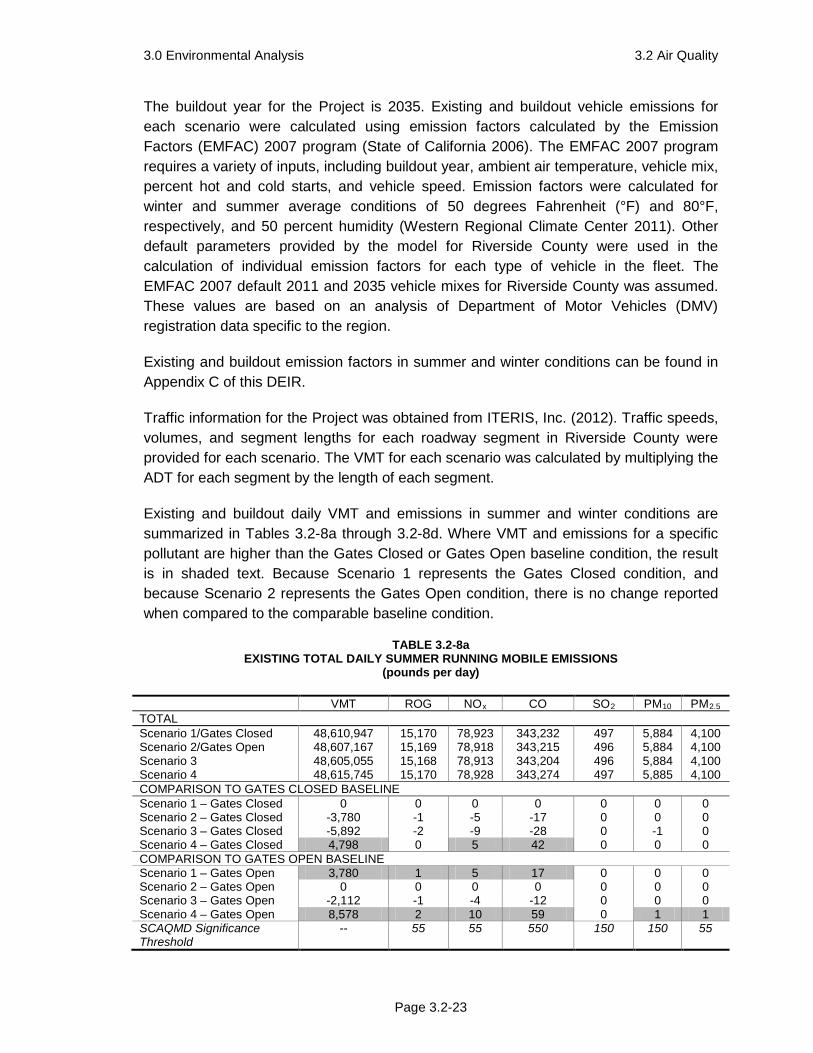
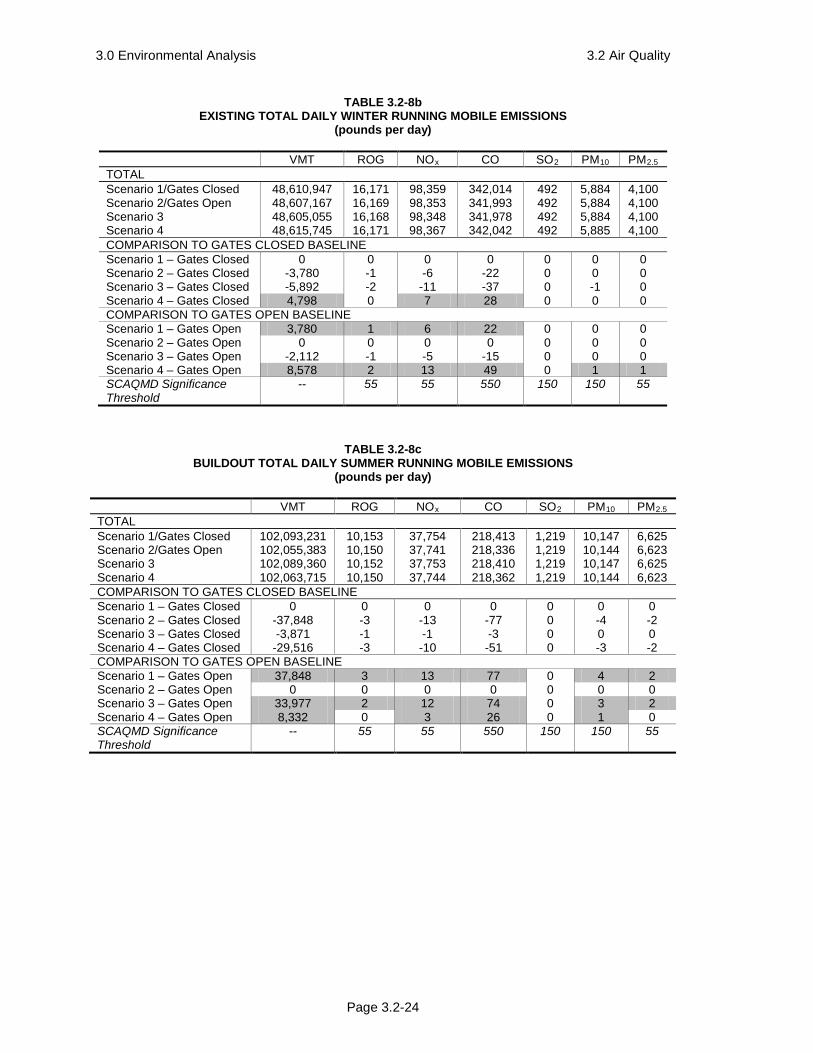
Existing and buildout daily VMT and emissions in summer and winter conditions are summarized in Tables 3.2-8a through 3.2-8d. Where VMT and emissions for a specific pollutant are higher than the Gates Closed or Gates Open baseline condition, the result is in shaded text. Because Scenario 1 represents the Gates Closed condition, and because Scenario 2 represents the Gates Open condition, there is no change reported when compared to the comparable baseline condition.
TABLE 3.2-8a EXISTING TOTAL DAILY SUMMER RUNNING MOBILE EMISSIONS
(pounds per day)
VMT ROG NOx CO SO2 PM10 PM2.5 TOTAL Scenario 1/Gates Closed 48,610,947 15,170 78,923 343,232 497 5,884 4,100 Scenario 2/Gates Open 48,607,167 15,169 78,918 343,215 496 5,884 4,100 Scenario 3 48,605,055 15,168 78,913 343,204 496 5,884 4,100 Scenario 4 48,615,745 15,170 78,928 343,274 497 5,885 4,100 COMPARISON TO GATES CLOSED BASELINE Scenario 1 – Gates Closed 0 0 0 0 0 0 0 Scenario 2 – Gates Closed -3,780 -1 -5 -17 0 0 0 Scenario 3 – Gates Closed -5,892 -2 -9 -28 0 -1 0 Scenario 4 – Gates Closed 4,798 0 5 42 0 0 0 COMPARISON TO GATES OPEN BASELINE Scenario 1 – Gates Open 3,780 1 5 17 0 0 0 Scenario 2 – Gates Open 0 0 0 0 0 0 0 Scenario 3 – Gates Open -2,112 -1 -4 -12 0 0 0 Scenario 4 – Gates Open 8,578 2 10 59 0 1 1 SCAQMD Significance Threshold
-- 55 55 550 150 150 55
3.0 Environmental Analysis 3.2 Air Quality
Page 3.2-24
TABLE 3.2-8b EXISTING TOTAL DAILY WINTER RUNNING MOBILE EMISSIONS
(pounds per day)
VMT ROG NOx CO SO2 PM10 PM2.5 TOTAL Scenario 1/Gates Closed 48,610,947 16,171 98,359 342,014 492 5,884 4,100 Scenario 2/Gates Open 48,607,167 16,169 98,353 341,993 492 5,884 4,100 Scenario 3 48,605,055 16,168 98,348 341,978 492 5,884 4,100 Scenario 4 48,615,745 16,171 98,367 342,042 492 5,885 4,100 COMPARISON TO GATES CLOSED BASELINE Scenario 1 – Gates Closed 0 0 0 0 0 0 0 Scenario 2 – Gates Closed -3,780 -1 -6 -22 0 0 0 Scenario 3 – Gates Closed -5,892 -2 -11 -37 0 -1 0 Scenario 4 – Gates Closed 4,798 0 7 28 0 0 0 COMPARISON TO GATES OPEN BASELINE Scenario 1 – Gates Open 3,780 1 6 22 0 0 0 Scenario 2 – Gates Open 0 0 0 0 0 0 0 Scenario 3 – Gates Open -2,112 -1 -5 -15 0 0 0 Scenario 4 – Gates Open 8,578 2 13 49 0 1 1 SCAQMD Significance Threshold
-- 55 55 550 150 150 55
TABLE 3.2-8c BUILDOUT TOTAL DAILY SUMMER RUNNING MOBILE EMISSIONS
(pounds per day)
VMT ROG NOx CO SO2 PM10 PM2.5 TOTAL Scenario 1/Gates Closed 102,093,231 10,153 37,754 218,413 1,219 10,147 6,625 Scenario 2/Gates Open 102,055,383 10,150 37,741 218,336 1,219 10,144 6,623 Scenario 3 102,089,360 10,152 37,753 218,410 1,219 10,147 6,625 Scenario 4 102,063,715 10,150 37,744 218,362 1,219 10,144 6,623 COMPARISON TO GATES CLOSED BASELINE Scenario 1 – Gates Closed 0 0 0 0 0 0 0 Scenario 2 – Gates Closed -37,848 -3 -13 -77 0 -4 -2 Scenario 3 – Gates Closed -3,871 -1 -1 -3 0 0 0 Scenario 4 – Gates Closed -29,516 -3 -10 -51 0 -3 -2 COMPARISON TO GATES OPEN BASELINE Scenario 1 – Gates Open 37,848 3 13 77 0 4 2 Scenario 2 – Gates Open 0 0 0 0 0 0 0 Scenario 3 – Gates Open 33,977 2 12 74 0 3 2 Scenario 4 – Gates Open 8,332 0 3 26 0 1 0 SCAQMD Significance Threshold
-- 55 55 550 150 150 55
3.0 Environmental Analysis 3.2 Air Quality
Page 3.2-25
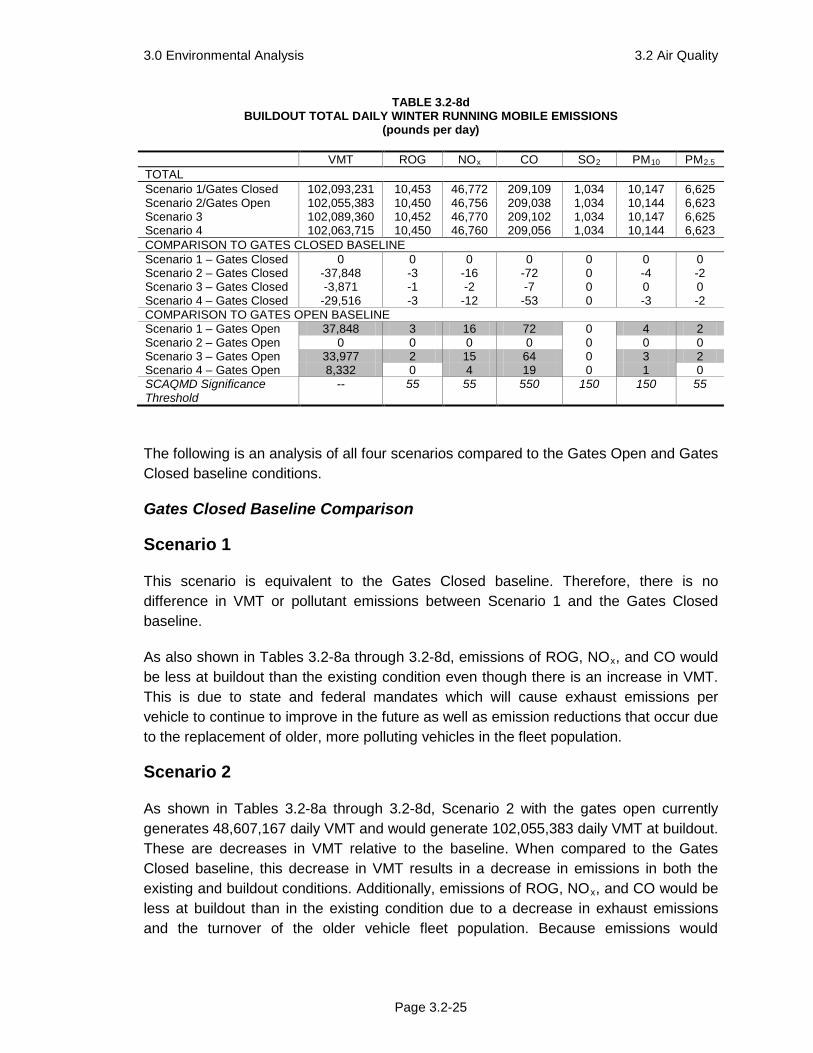
TABLE 3.2-8d BUILDOUT TOTAL DAILY WINTER RUNNING MOBILE EMISSIONS
(pounds per day)
VMT ROG NOx CO SO2 PM10 PM2.5 TOTAL Scenario 1/Gates Closed 102,093,231 10,453 46,772 209,109 1,034 10,147 6,625 Scenario 2/Gates Open 102,055,383 10,450 46,756 209,038 1,034 10,144 6,623 Scenario 3 102,089,360 10,452 46,770 209,102 1,034 10,147 6,625 Scenario 4 102,063,715 10,450 46,760 209,056 1,034 10,144 6,623 COMPARISON TO GATES CLOSED BASELINE Scenario 1 – Gates Closed 0 0 0 0 0 0 0 Scenario 2 – Gates Closed -37,848 -3 -16 -72 0 -4 -2 Scenario 3 – Gates Closed -3,871 -1 -2 -7 0 0 0 Scenario 4 – Gates Closed -29,516 -3 -12 -53 0 -3 -2 COMPARISON TO GATES OPEN BASELINE Scenario 1 – Gates Open 37,848 3 16 72 0 4 2 Scenario 2 – Gates Open 0 0 0 0 0 0 0 Scenario 3 – Gates Open 33,977 2 15 64 0 3 2 Scenario 4 – Gates Open 8,332 0 4 19 0 1 0 SCAQMD Significance Threshold
-- 55 55 550 150 150 55
The following is an analysis of all four scenarios compared to the Gates Open and Gates Closed baseline conditions.
Gates Closed Baseline Comparison
Scenario 1
This scenario is equivalent to the Gates Closed baseline. Therefore, there is no difference in VMT or pollutant emissions between Scenario 1 and the Gates Closed baseline.
As also shown in Tables 3.2-8a through 3.2-8d, emissions of ROG, NOx, and CO would be less at buildout than the existing condition even though there is an increase in VMT. This is due to state and federal mandates which will cause exhaust emissions per vehicle to continue to improve in the future as well as emission reductions that occur due to the replacement of older, more polluting vehicles in the fleet population.
Scenario 2
As shown in Tables 3.2-8a through 3.2-8d, Scenario 2 with the gates open currently generates 48,607,167 daily VMT and would generate 102,055,383 daily VMT at buildout. These are decreases in VMT relative to the baseline. When compared to the Gates Closed baseline, this decrease in VMT results in a decrease in emissions in both the existing and buildout conditions. Additionally, emissions of ROG, NOx, and CO would be less at buildout than in the existing condition due to a decrease in exhaust emissions and the turnover of the older vehicle fleet population. Because emissions would

3.0 Environmental Analysis 3.2 Air Quality
Page 3.2-26
decrease relative to the Gates Closed baseline condition, air quality impacts due to Project operation under Scenario 2 would be less than significant.
Scenario 3
As shown in Tables 3.2-8a through 3.2-8d, Scenario 3 with the gates removed and the Overlook connection complete would generate 48,605,055 daily VMT with the existing traffic conditions (i.e., the existing plus Project scenario), and would generate 102,089,360 daily VMT at buildout. These are decreases in VMT relative to the baseline. When compared to the Gates Closed baseline, this decrease in VMT results in a decrease in emissions in both the existing and buildout conditions. Additionally, as discussed above, emissions of ROG, NOx, and CO would be less at buildout than in the existing plus Scenario 3 condition due to a decrease in exhaust emissions and the turnover of the older vehicle fleet population. Because emissions would decrease relative to the Gates Closed baseline condition, air quality impacts due to Project operation under Scenario 3 would be less than significant.
Scenario 4
As shown in Tables 3.2-8a through 3.2-8d, Scenario 4 with the gates removed, the Overlook connection complete, and the construction of the Proposed C Street would generate 48,615,745 daily VMT with the existing traffic conditions (i.e., the existing plus Project scenario), and would generate 102,063,715 daily VMT at buildout. In the existing condition, the daily VMT under Scenario 4 is greater than the existing Gates Closed baseline daily VMT. This results in a net increase of approximately 5 pounds of NOx per day and 42 pounds of CO per day in the summer months, and 7 pounds of NOx per day and 28 pounds of CO per day in the winter months. The net increases in emissions of ROG, SO2, PM10, and PM2.5 are less than the SCAQMD significance thresholds for Project operation. Therefore, air quality impacts due to operation of the Project under existing plus Scenario 4 conditions would be less than significant.
At buildout, the daily VMT under Scenario 4 is less than the daily VMT under buildout of the Gates Closed baseline. This results in a decrease in emissions. Additionally, as discussed above, emissions of ROG, NOx, and CO would be less at buildout than in the existing plus Scenario 4 condition due to a decrease in exhaust emissions and the turnover of the older vehicle fleet population. Because emissions would decrease relative to the Gates Closed baseline condition, air quality impacts due to Project operation at buildout under Scenario 4 would be less than significant.
Off-site
The Traffic Impact Analysis (TIA) identified mitigation measures involving traffic signalization and restriping for new or additional right- or left-turn lanes for all scenarios. Signalization, restriping, and paving would occur after completion of grading associated
3.0 Environmental Analysis 3.2 Air Quality
Page 3.2-27
with roadway improvements described for the proposed Project. Upon completion of construction, there would not be an increase in emissions that would exceed the SCAQMD significance thresholds. Therefore, no impacts are identified.
Gates Open Baseline Comparison
Scenario 1
As shown in Tables 3.2-8a through 3.2-8d, the existing and buildout VMTs under Scenario 1 with the gates closed are greater than the existing and buildout VMTs under the Gates Open baseline. In the existing condition, this results in a net increase of approximately 1 pound of ROG, 5 pounds of NOx, and 17 pounds of CO in summer months, and 1 pound of ROG, 6 pounds of NOx, and 22 pounds of CO in winter months when compared to the Gates Open baseline. At buildout, this results in a net increase of approximately 3 pounds of ROG, 13 pounds of NOx, 77 pounds of CO, 4 pounds of PM10, and 2 pounds of PM2.5 in the summer months, and 3 pounds of ROG, 16 pounds of NOx, 72 pounds of CO, 4 pounds of PM10, and 2 pounds of PM2.5 in the winter months when compared to the Gates Open baseline. The net increases in emissions of SO2 are less than the SCAQMD significance thresholds for Project operation. Therefore, air quality impacts due to operation of Scenario 1 when compared to the Gates Open baseline would be less than significant.
Scenario 2
Scenario 2 is equivalent to the Gates Open baseline. Therefore, there is no difference in VMT or pollutant emissions between Scenario 2 and the Gates Open baseline, and air quality impacts due to operation of Scenario 2 when compared to the Gates Open baseline would be less than significant.
Scenario 3
In the existing condition, the daily VMT under Scenario 3 is less than the existing Gates Open baseline daily VMT. This results in a decrease in emissions. At buildout, the daily VMT under Scenario 3 is greater than the buildout Gates Open daily VMT. This results in a net increase of approximately 2 pounds of ROG, 12 pounds of NOx, 74 pounds of CO, 3 pounds of PM10, and 2 pounds of PM2.5 in the summer months, and 2 pound of ROG, 15 pounds of NOx, 64 pounds of CO, 3 pounds of PM10, and 2 pounds of PM2.5 in the winter months. The net increases in emissions of SO2 are less than the SCAQMD significance thresholds for Project operation. Additionally, as discussed above, emissions of ROG, NOx, and CO would be less at buildout than in the existing plus Scenario 3 condition due to a decrease in exhaust emissions and the turnover of the older vehicle fleet population. Therefore, air quality impacts due to operation of Scenario 3 when compared to the Gates Open baseline would be less than significant.
3.0 Environmental Analysis 3.2 Air Quality
Page 3.2-28
Scenario 4
As shown in Tables 3.2-8a through 3.2-8d, the existing and buildout VMTs under Scenario 4 are greater than the existing and buildout VMTs under the Gates Open baseline. In the existing condition, this results in a net increase of approximately 2 pounds of ROG, 10 pounds of NOx, 59 pounds of CO, 1 pound of PM10, and 1 pound of PM2.5 in summer months, and 2 pound of ROG, 13 pounds of NOx, 49 pounds of CO, 1 pound of PM10, and 1 pound of PM2.5 in winter months when compared to the Gates Open baseline. At buildout, this results in a net increase of approximately 3 pounds of NOx, 26 pounds of CO, and 1 pound of PM10 in the summer months, and 4 pounds of NOx, 19 pounds of CO, and 1 pound of PM10 in the winter months when compared to the Gates Open baseline. The net increases in emissions of SO2 in the existing condition and SO2 and ROG at buildout are less than the SCAQMD significance thresholds for Project operation. Therefore, air quality impacts due to operation of Scenario 4 when compared to the Gates Open baseline would be less than significant.
Off-site
The Traffic Impact Analysis (TIA) identified mitigation measures involving traffic signalization and restriping for new or additional right- or left-turn lanes for all scenarios. Signalization, restriping, and paving would occur after completion of grading associated with roadway improvements described for the proposed Project. Upon completion of construction, there would not be an increase in emissions that would exceed the SCAQMD significance thresholds. Therefore, no impacts are identified.
3.2.5.2 Significance of Impacts
a. Gates Closed Baseline Comparison
In the existing plus Project condition, Scenario 3 represents the lowest VMT for the network, followed by Scenario 2, Scenario 1, and Scenario 4. However, only Scenario 1 would result in an incremental increase in NOx and CO emissions. These incremental increases would be less than the applicable thresholds for NOx and CO, and would be less than significant. Emissions of all other pollutants under each scenario would be less than or equal to the existing condition; therefore, impacts would be less than significant.
In the buildout with Project condition, Scenario 2 represents the lowest VMT for the network, followed by Scenario 4, Scenario 3, and Scenario 1. Emissions of all pollutants under each scenario would be less than or equal to the buildout of the Gates Closed condition. Under all scenarios, impacts would be less than significant.
No potentially significant impacts would occur from implementation of off-site improvements.
3.0 Environmental Analysis 3.2 Air Quality
Page 3.2-29
b. Gates Open Baseline Comparison
In the existing plus project condition, Scenario 3 represents the lowest VMT for the network, followed by Scenario 2, Scenario1, and Scenario 4. Scenario 1 would result in an incremental increase in ROG, NOx, CO, PM10, and PM2.5. However, these incremental increases would be less than the applicable thresholds, and impacts would be less than significant. Under all scenarios, impacts would be less than significant.
In the buildout with project condition, Scenario 2 represents the lowest VMT for the network, followed by Scenario 4, Scenario 3, and Scenario 1. However, the incremental increases in pollutant emissions would be less than the applicable thresholds. Under all scenarios, impacts would be less than significant.
No potentially significant impacts would occur from implementation of off-site improvements.
3.2.5.3 Mitigation, Monitoring, and Reporting
No mitigation is required.
3.2.6 Issue 4: Sensitive Receptors Would the proposed Project expose sensitive receptors to substantial pollutant concentrations?
3.2.6.1 Impact Analysis
Sensitive receptors in the Project vicinity are mostly residential uses but also include public parks, religious facilities, day cares, and the following schools: Victoria Elementary School, California School for the Deaf, Raincross High School, Gage Middle School, Washington Elementary School, Riverside Montessori Academy, and Hawarden Hills Academy.
a. Carbon Monoxide Hot Spots
Small-scale, localized concentrations of CO above the state and national standards have the potential to occur near stagnation points of heavily traveled intersections. Localized, high concentrations of CO, referred to as “CO hot spots,” can occur when projects contribute traffic to area intersections. CO hot spots almost exclusively occur near intersections with LOS E or worse in combination with relatively high traffic volumes on all roadways.
A micro-scale CO hot spot analysis was performed at all study area intersections projected to operate at LOS E or F at buildout in order to assess potential exposure of
3.0 Environmental Analysis 3.2 Air Quality
Page 3.2-30
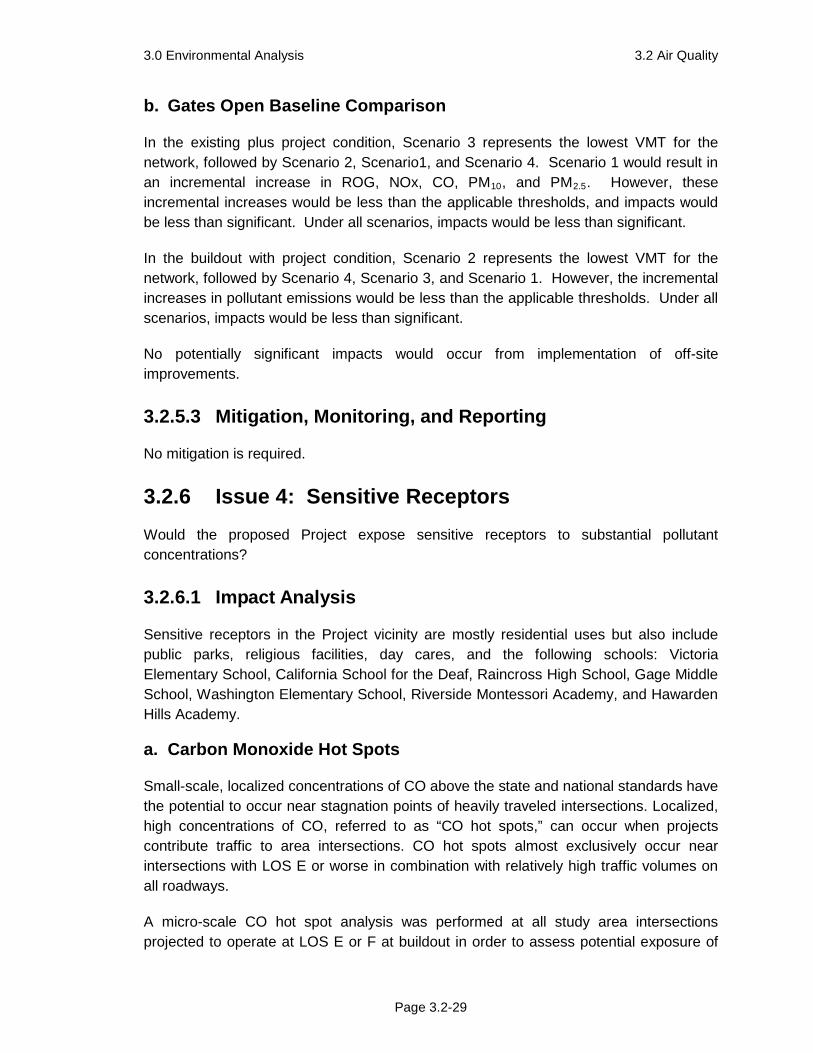
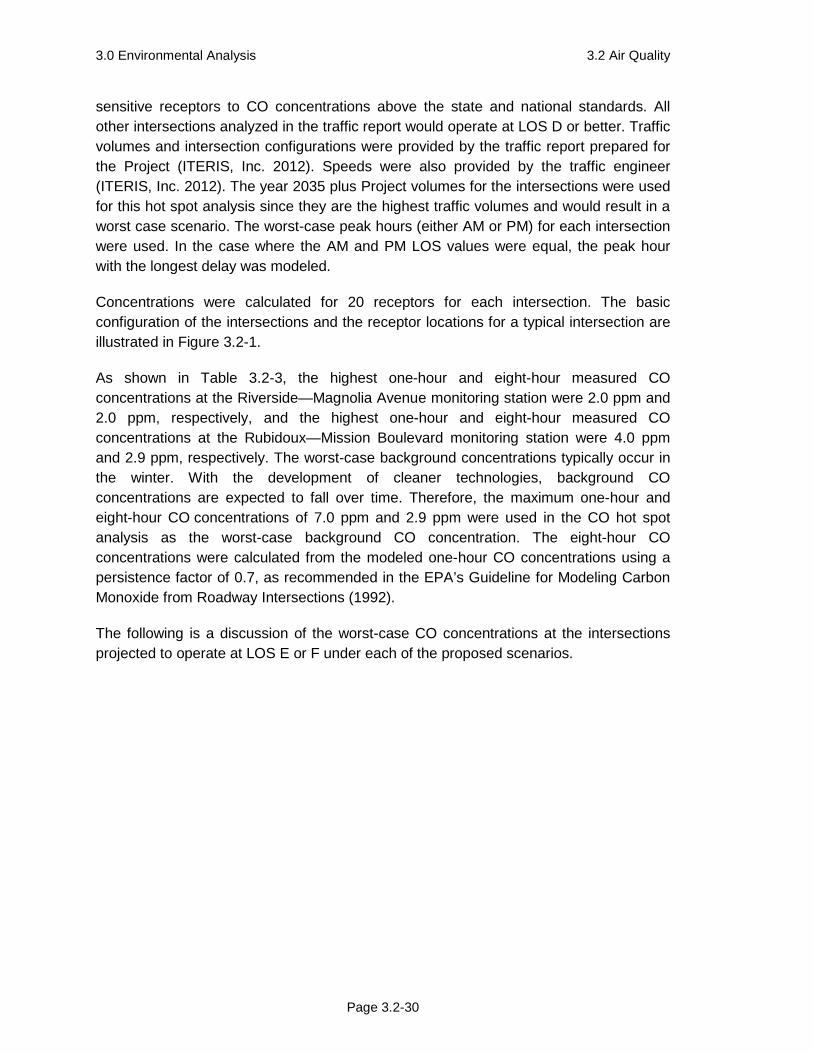
sensitive receptors to CO concentrations above the state and national standards. All other intersections analyzed in the traffic report would operate at LOS D or better. Traffic volumes and intersection configurations were provided by the traffic report prepared for the Project (ITERIS, Inc. 2012). Speeds were also provided by the traffic engineer (ITERIS, Inc. 2012). The year 2035 plus Project volumes for the intersections were used for this hot spot analysis since they are the highest traffic volumes and would result in a worst case scenario. The worst-case peak hours (either AM or PM) for each intersection were used. In the case where the AM and PM LOS values were equal, the peak hour with the longest delay was modeled.
Concentrations were calculated for 20 receptors for each intersection. The basic configuration of the intersections and the receptor locations for a typical intersection are illustrated in Figure 3.2-1.
As shown in Table 3.2-3, the highest one-hour and eight-hour measured CO concentrations at the Riverside—Magnolia Avenue monitoring station were 2.0 ppm and 2.0 ppm, respectively, and the highest one-hour and eight-hour measured CO concentrations at the Rubidoux—Mission Boulevard monitoring station were 4.0 ppm and 2.9 ppm, respectively. The worst-case background concentrations typically occur in the winter. With the development of cleaner technologies, background CO concentrations are expected to fall over time. Therefore, the maximum one-hour and eight-hour CO concentrations of 7.0 ppm and 2.9 ppm were used in the CO hot spot analysis as the worst-case background CO concentration. The eight-hour CO concentrations were calculated from the modeled one-hour CO concentrations using a persistence factor of 0.7, as recommended in the EPA’s Guideline for Modeling Carbon Monoxide from Roadway Intersections (1992).
The following is a discussion of the worst-case CO concentrations at the intersections projected to operate at LOS E or F under each of the proposed scenarios.
FIGURE 3.2-1Link and Receptor Network For a Single
Intersection with Dedicated Left Turn Lanes
M:\JOBS4\6103\air\graphics\fig4.ai 04/27/12
1234
56
789101112
13
14
15
16
17
18
19
20
300m
300m
100m
100m
100m
Left TurningLane Link
Left TurningLane Link
Receptors at 3mfrom edge of roadwayand 1.8m high
Link end point
3.0 Environmental Analysis 3.2 Air Quality
Page 3.2-32
Scenario 1
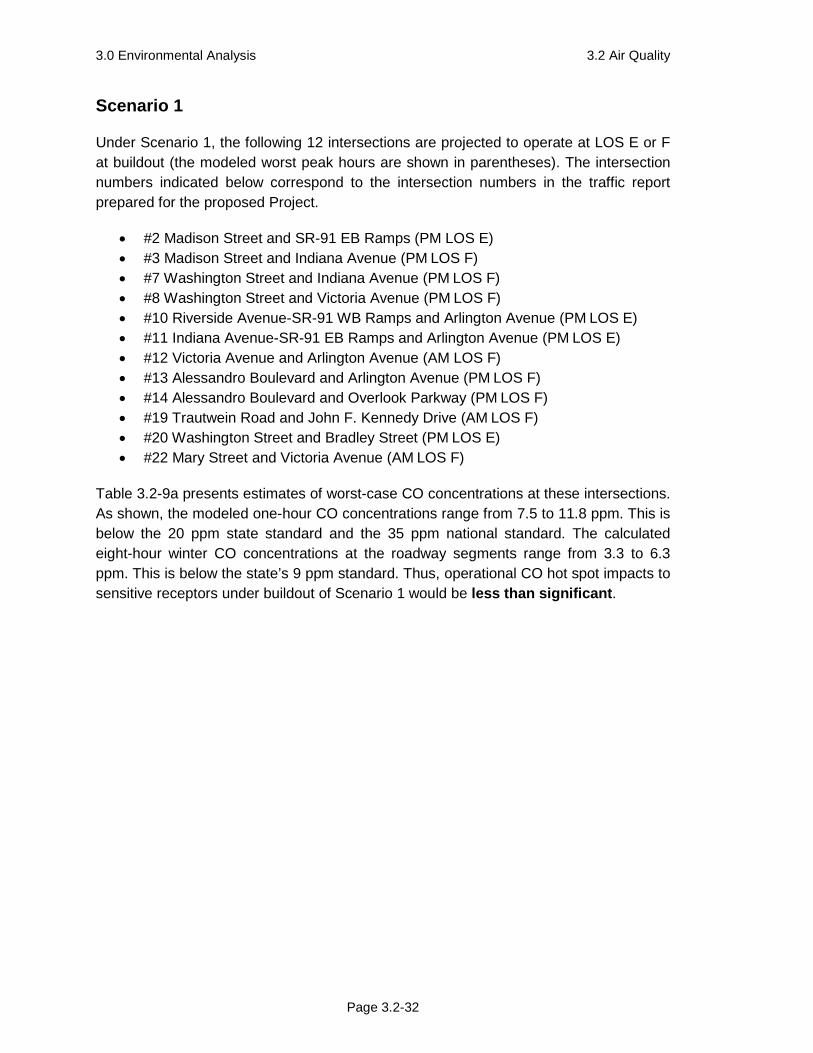
Under Scenario 1, the following 12 intersections are projected to operate at LOS E or F at buildout (the modeled worst peak hours are shown in parentheses). The intersection numbers indicated below correspond to the intersection numbers in the traffic report prepared for the proposed Project.
• #2 Madison Street and SR-91 EB Ramps (PM LOS E) • #3 Madison Street and Indiana Avenue (PM LOS F) • #7 Washington Street and Indiana Avenue (PM LOS F) • #8 Washington Street and Victoria Avenue (PM LOS F) • #10 Riverside Avenue-SR-91 WB Ramps and Arlington Avenue (PM LOS E) • #11 Indiana Avenue-SR-91 EB Ramps and Arlington Avenue (PM LOS E) • #12 Victoria Avenue and Arlington Avenue (AM LOS F) • #13 Alessandro Boulevard and Arlington Avenue (PM LOS F) • #14 Alessandro Boulevard and Overlook Parkway (PM LOS F) • #19 Trautwein Road and John F. Kennedy Drive (AM LOS F) • #20 Washington Street and Bradley Street (PM LOS E) • #22 Mary Street and Victoria Avenue (AM LOS F)
Table 3.2-9a presents estimates of worst-case CO concentrations at these intersections. As shown, the modeled one-hour CO concentrations range from 7.5 to 11.8 ppm. This is below the 20 ppm state standard and the 35 ppm national standard. The calculated eight-hour winter CO concentrations at the roadway segments range from 3.3 to 6.3 ppm. This is below the state’s 9 ppm standard. Thus, operational CO hot spot impacts to sensitive receptors under buildout of Scenario 1 would be less than significant.
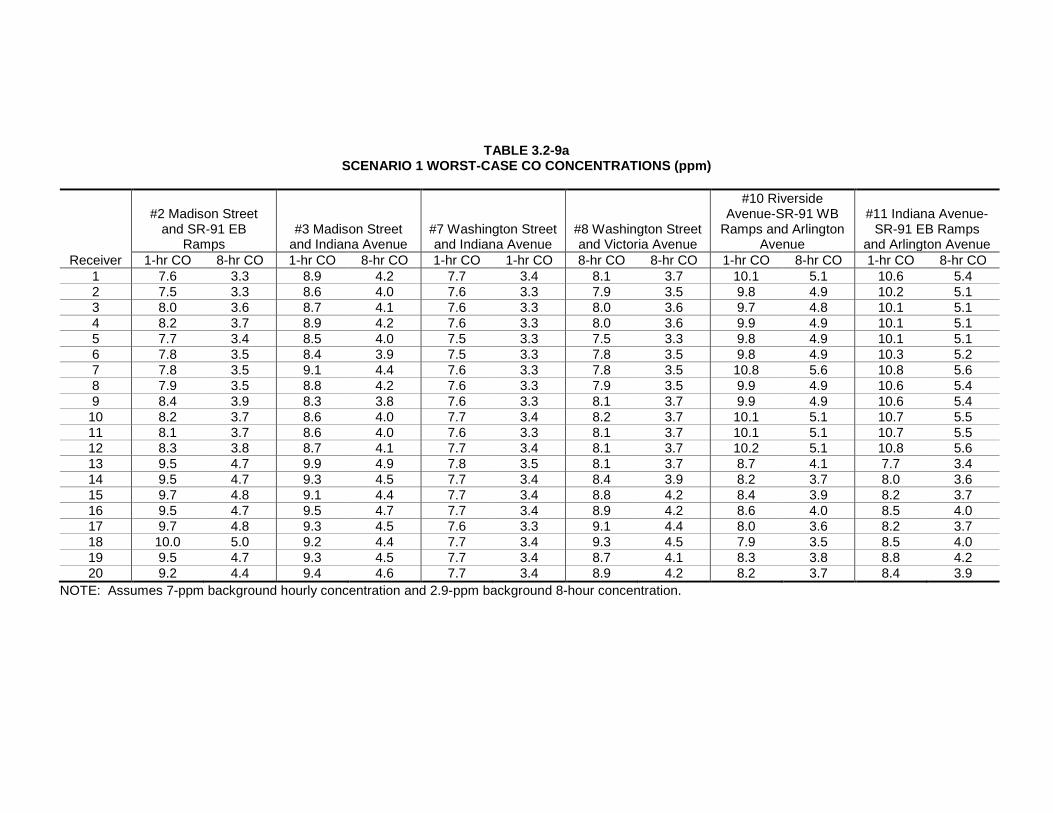
TABLE 3.2-9a SCENARIO 1 WORST-CASE CO CONCENTRATIONS (ppm)
Receiver
#2 Madison Street and SR-91 EB
Ramps #3 Madison Street
and Indiana Avenue #7 Washington Street and Indiana Avenue
#8 Washington Street and Victoria Avenue
#10 Riverside Avenue-SR-91 WB
Ramps and Arlington Avenue
#11 Indiana Avenue-SR-91 EB Ramps
and Arlington Avenue 1-hr CO 8-hr CO 1-hr CO 8-hr CO 1-hr CO 1-hr CO 8-hr CO 8-hr CO 1-hr CO 8-hr CO 1-hr CO 8-hr CO
1 7.6 3.3 8.9 4.2 7.7 3.4 8.1 3.7 10.1 5.1 10.6 5.4 2 7.5 3.3 8.6 4.0 7.6 3.3 7.9 3.5 9.8 4.9 10.2 5.1 3 8.0 3.6 8.7 4.1 7.6 3.3 8.0 3.6 9.7 4.8 10.1 5.1 4 8.2 3.7 8.9 4.2 7.6 3.3 8.0 3.6 9.9 4.9 10.1 5.1 5 7.7 3.4 8.5 4.0 7.5 3.3 7.5 3.3 9.8 4.9 10.1 5.1 6 7.8 3.5 8.4 3.9 7.5 3.3 7.8 3.5 9.8 4.9 10.3 5.2 7 7.8 3.5 9.1 4.4 7.6 3.3 7.8 3.5 10.8 5.6 10.8 5.6 8 7.9 3.5 8.8 4.2 7.6 3.3 7.9 3.5 9.9 4.9 10.6 5.4 9 8.4 3.9 8.3 3.8 7.6 3.3 8.1 3.7 9.9 4.9 10.6 5.4
10 8.2 3.7 8.6 4.0 7.7 3.4 8.2 3.7 10.1 5.1 10.7 5.5 11 8.1 3.7 8.6 4.0 7.6 3.3 8.1 3.7 10.1 5.1 10.7 5.5 12 8.3 3.8 8.7 4.1 7.7 3.4 8.1 3.7 10.2 5.1 10.8 5.6 13 9.5 4.7 9.9 4.9 7.8 3.5 8.1 3.7 8.7 4.1 7.7 3.4 14 9.5 4.7 9.3 4.5 7.7 3.4 8.4 3.9 8.2 3.7 8.0 3.6 15 9.7 4.8 9.1 4.4 7.7 3.4 8.8 4.2 8.4 3.9 8.2 3.7 16 9.5 4.7 9.5 4.7 7.7 3.4 8.9 4.2 8.6 4.0 8.5 4.0 17 9.7 4.8 9.3 4.5 7.6 3.3 9.1 4.4 8.0 3.6 8.2 3.7 18 10.0 5.0 9.2 4.4 7.7 3.4 9.3 4.5 7.9 3.5 8.5 4.0 19 9.5 4.7 9.3 4.5 7.7 3.4 8.7 4.1 8.3 3.8 8.8 4.2 20 9.2 4.4 9.4 4.6 7.7 3.4 8.9 4.2 8.2 3.7 8.4 3.9
NOTE: Assumes 7-ppm background hourly concentration and 2.9-ppm background 8-hour concentration.
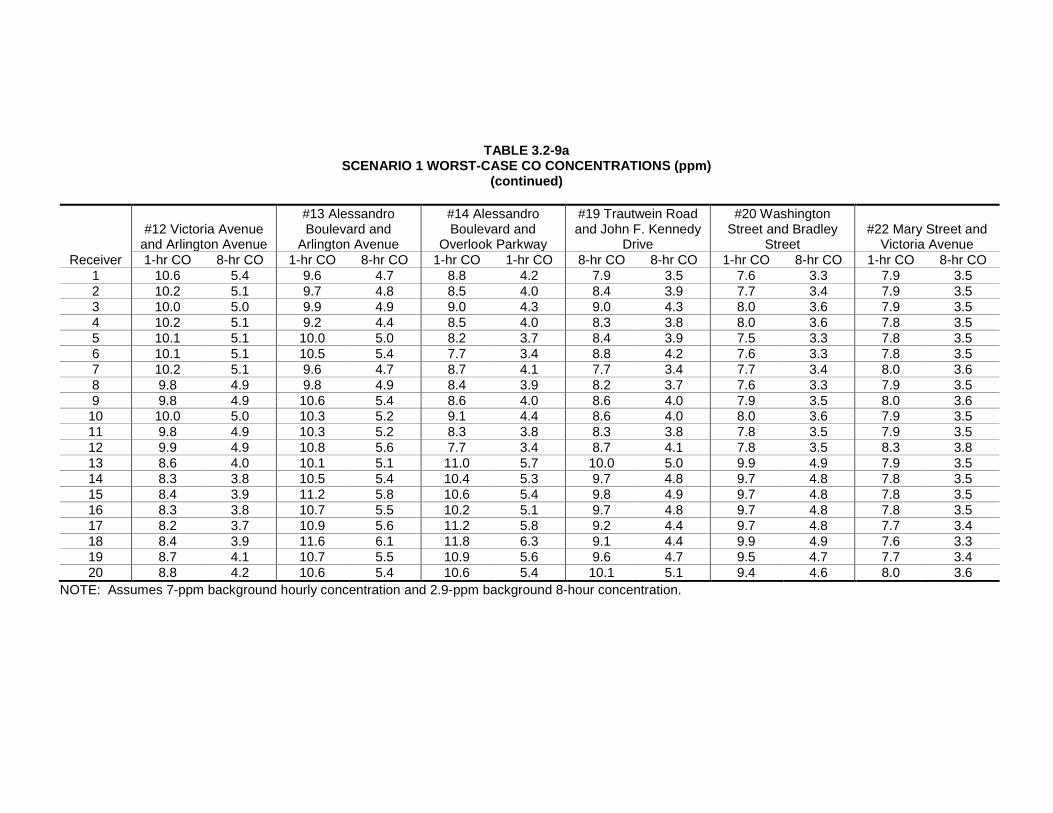
TABLE 3.2-9a SCENARIO 1 WORST-CASE CO CONCENTRATIONS (ppm)
(continued)
Receiver
#12 Victoria Avenue and Arlington Avenue
#13 Alessandro Boulevard and
Arlington Avenue
#14 Alessandro Boulevard and
Overlook Parkway
#19 Trautwein Road and John F. Kennedy
Drive
#20 Washington Street and Bradley
Street #22 Mary Street and
Victoria Avenue 1-hr CO 8-hr CO 1-hr CO 8-hr CO 1-hr CO 1-hr CO 8-hr CO 8-hr CO 1-hr CO 8-hr CO 1-hr CO 8-hr CO
1 10.6 5.4 9.6 4.7 8.8 4.2 7.9 3.5 7.6 3.3 7.9 3.5 2 10.2 5.1 9.7 4.8 8.5 4.0 8.4 3.9 7.7 3.4 7.9 3.5 3 10.0 5.0 9.9 4.9 9.0 4.3 9.0 4.3 8.0 3.6 7.9 3.5 4 10.2 5.1 9.2 4.4 8.5 4.0 8.3 3.8 8.0 3.6 7.8 3.5 5 10.1 5.1 10.0 5.0 8.2 3.7 8.4 3.9 7.5 3.3 7.8 3.5 6 10.1 5.1 10.5 5.4 7.7 3.4 8.8 4.2 7.6 3.3 7.8 3.5 7 10.2 5.1 9.6 4.7 8.7 4.1 7.7 3.4 7.7 3.4 8.0 3.6 8 9.8 4.9 9.8 4.9 8.4 3.9 8.2 3.7 7.6 3.3 7.9 3.5 9 9.8 4.9 10.6 5.4 8.6 4.0 8.6 4.0 7.9 3.5 8.0 3.6
10 10.0 5.0 10.3 5.2 9.1 4.4 8.6 4.0 8.0 3.6 7.9 3.5 11 9.8 4.9 10.3 5.2 8.3 3.8 8.3 3.8 7.8 3.5 7.9 3.5 12 9.9 4.9 10.8 5.6 7.7 3.4 8.7 4.1 7.8 3.5 8.3 3.8 13 8.6 4.0 10.1 5.1 11.0 5.7 10.0 5.0 9.9 4.9 7.9 3.5 14 8.3 3.8 10.5 5.4 10.4 5.3 9.7 4.8 9.7 4.8 7.8 3.5 15 8.4 3.9 11.2 5.8 10.6 5.4 9.8 4.9 9.7 4.8 7.8 3.5 16 8.3 3.8 10.7 5.5 10.2 5.1 9.7 4.8 9.7 4.8 7.8 3.5 17 8.2 3.7 10.9 5.6 11.2 5.8 9.2 4.4 9.7 4.8 7.7 3.4 18 8.4 3.9 11.6 6.1 11.8 6.3 9.1 4.4 9.9 4.9 7.6 3.3 19 8.7 4.1 10.7 5.5 10.9 5.6 9.6 4.7 9.5 4.7 7.7 3.4 20 8.8 4.2 10.6 5.4 10.6 5.4 10.1 5.1 9.4 4.6 8.0 3.6
NOTE: Assumes 7-ppm background hourly concentration and 2.9-ppm background 8-hour concentration.
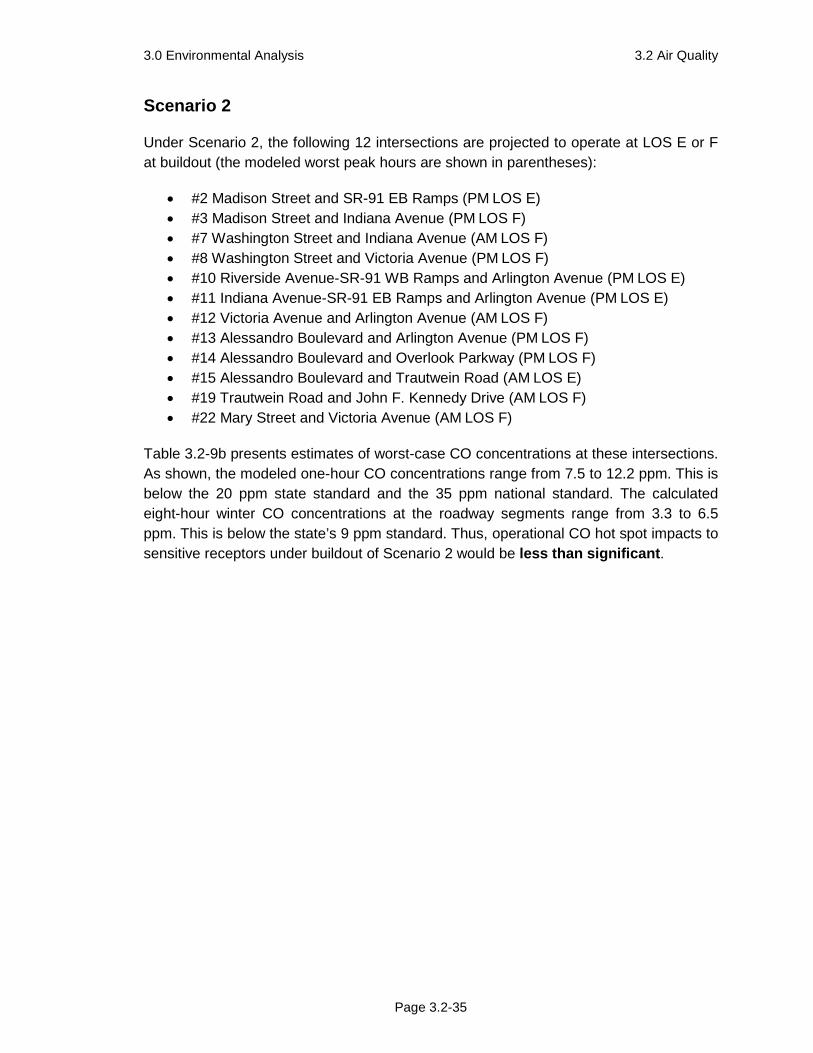
3.0 Environmental Analysis 3.2 Air Quality
Page 3.2-35
Scenario 2
Under Scenario 2, the following 12 intersections are projected to operate at LOS E or F at buildout (the modeled worst peak hours are shown in parentheses):
• #2 Madison Street and SR-91 EB Ramps (PM LOS E) • #3 Madison Street and Indiana Avenue (PM LOS F) • #7 Washington Street and Indiana Avenue (AM LOS F) • #8 Washington Street and Victoria Avenue (PM LOS F) • #10 Riverside Avenue-SR-91 WB Ramps and Arlington Avenue (PM LOS E) • #11 Indiana Avenue-SR-91 EB Ramps and Arlington Avenue (PM LOS E) • #12 Victoria Avenue and Arlington Avenue (AM LOS F) • #13 Alessandro Boulevard and Arlington Avenue (PM LOS F) • #14 Alessandro Boulevard and Overlook Parkway (PM LOS F) • #15 Alessandro Boulevard and Trautwein Road (AM LOS E) • #19 Trautwein Road and John F. Kennedy Drive (AM LOS F) • #22 Mary Street and Victoria Avenue (AM LOS F)
Table 3.2-9b presents estimates of worst-case CO concentrations at these intersections. As shown, the modeled one-hour CO concentrations range from 7.5 to 12.2 ppm. This is below the 20 ppm state standard and the 35 ppm national standard. The calculated eight-hour winter CO concentrations at the roadway segments range from 3.3 to 6.5 ppm. This is below the state’s 9 ppm standard. Thus, operational CO hot spot impacts to sensitive receptors under buildout of Scenario 2 would be less than significant.
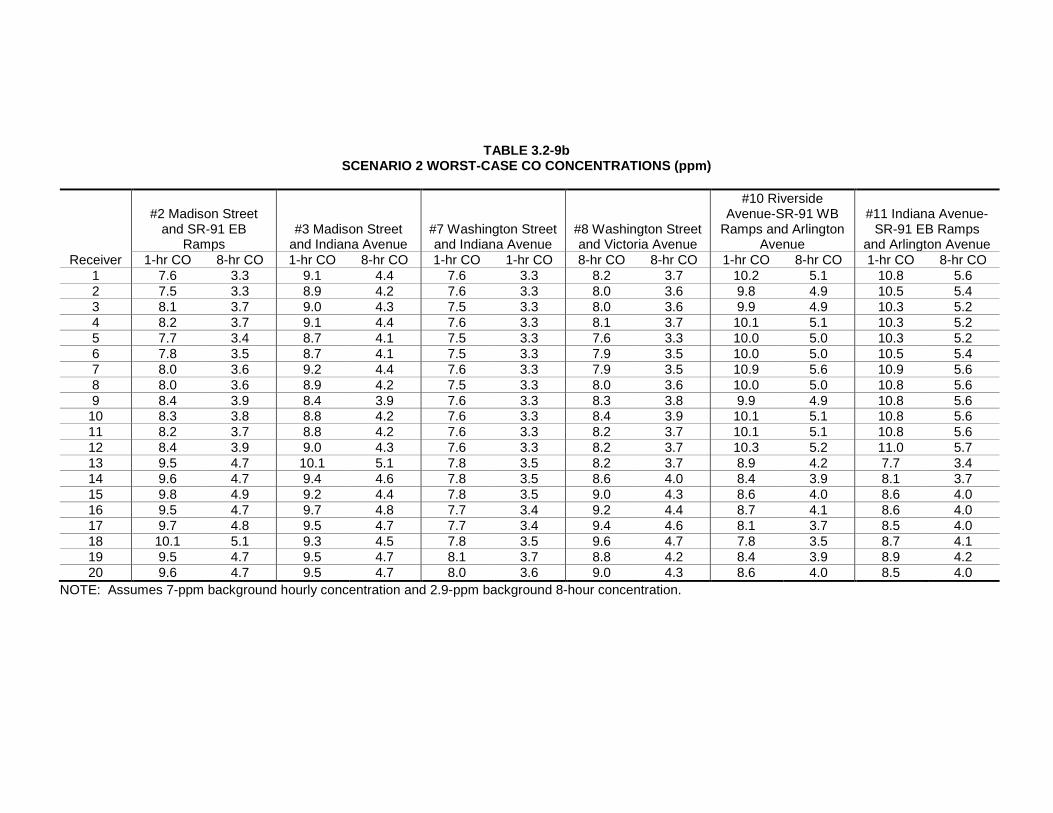
TABLE 3.2-9b SCENARIO 2 WORST-CASE CO CONCENTRATIONS (ppm)
Receiver
#2 Madison Street and SR-91 EB
Ramps #3 Madison Street
and Indiana Avenue #7 Washington Street and Indiana Avenue
#8 Washington Street and Victoria Avenue
#10 Riverside Avenue-SR-91 WB
Ramps and Arlington Avenue
#11 Indiana Avenue-SR-91 EB Ramps
and Arlington Avenue 1-hr CO 8-hr CO 1-hr CO 8-hr CO 1-hr CO 1-hr CO 8-hr CO 8-hr CO 1-hr CO 8-hr CO 1-hr CO 8-hr CO
1 7.6 3.3 9.1 4.4 7.6 3.3 8.2 3.7 10.2 5.1 10.8 5.6 2 7.5 3.3 8.9 4.2 7.6 3.3 8.0 3.6 9.8 4.9 10.5 5.4 3 8.1 3.7 9.0 4.3 7.5 3.3 8.0 3.6 9.9 4.9 10.3 5.2 4 8.2 3.7 9.1 4.4 7.6 3.3 8.1 3.7 10.1 5.1 10.3 5.2 5 7.7 3.4 8.7 4.1 7.5 3.3 7.6 3.3 10.0 5.0 10.3 5.2 6 7.8 3.5 8.7 4.1 7.5 3.3 7.9 3.5 10.0 5.0 10.5 5.4 7 8.0 3.6 9.2 4.4 7.6 3.3 7.9 3.5 10.9 5.6 10.9 5.6 8 8.0 3.6 8.9 4.2 7.5 3.3 8.0 3.6 10.0 5.0 10.8 5.6 9 8.4 3.9 8.4 3.9 7.6 3.3 8.3 3.8 9.9 4.9 10.8 5.6
10 8.3 3.8 8.8 4.2 7.6 3.3 8.4 3.9 10.1 5.1 10.8 5.6 11 8.2 3.7 8.8 4.2 7.6 3.3 8.2 3.7 10.1 5.1 10.8 5.6 12 8.4 3.9 9.0 4.3 7.6 3.3 8.2 3.7 10.3 5.2 11.0 5.7 13 9.5 4.7 10.1 5.1 7.8 3.5 8.2 3.7 8.9 4.2 7.7 3.4 14 9.6 4.7 9.4 4.6 7.8 3.5 8.6 4.0 8.4 3.9 8.1 3.7 15 9.8 4.9 9.2 4.4 7.8 3.5 9.0 4.3 8.6 4.0 8.6 4.0 16 9.5 4.7 9.7 4.8 7.7 3.4 9.2 4.4 8.7 4.1 8.6 4.0 17 9.7 4.8 9.5 4.7 7.7 3.4 9.4 4.6 8.1 3.7 8.5 4.0 18 10.1 5.1 9.3 4.5 7.8 3.5 9.6 4.7 7.8 3.5 8.7 4.1 19 9.5 4.7 9.5 4.7 8.1 3.7 8.8 4.2 8.4 3.9 8.9 4.2 20 9.6 4.7 9.5 4.7 8.0 3.6 9.0 4.3 8.6 4.0 8.5 4.0
NOTE: Assumes 7-ppm background hourly concentration and 2.9-ppm background 8-hour concentration.
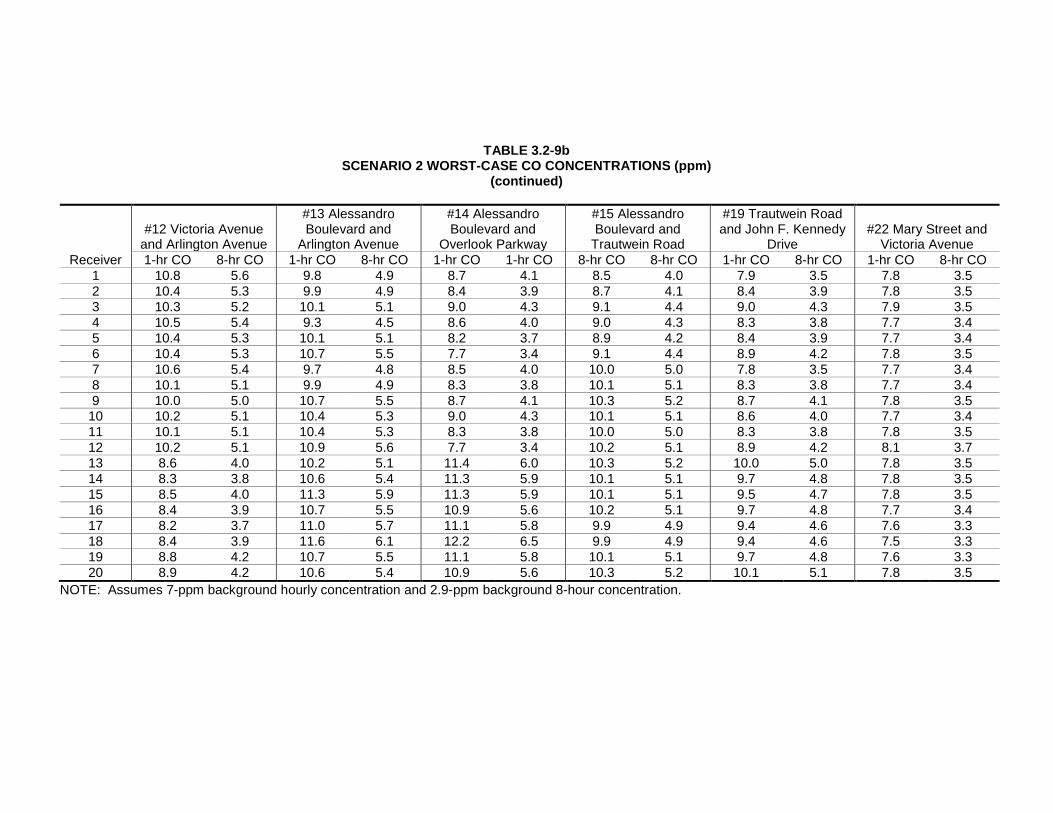
TABLE 3.2-9b SCENARIO 2 WORST-CASE CO CONCENTRATIONS (ppm)
(continued)
Receiver
#12 Victoria Avenue and Arlington Avenue
#13 Alessandro Boulevard and
Arlington Avenue
#14 Alessandro Boulevard and
Overlook Parkway
#15 Alessandro Boulevard and
Trautwein Road
#19 Trautwein Road and John F. Kennedy
Drive #22 Mary Street and
Victoria Avenue 1-hr CO 8-hr CO 1-hr CO 8-hr CO 1-hr CO 1-hr CO 8-hr CO 8-hr CO 1-hr CO 8-hr CO 1-hr CO 8-hr CO
1 10.8 5.6 9.8 4.9 8.7 4.1 8.5 4.0 7.9 3.5 7.8 3.5 2 10.4 5.3 9.9 4.9 8.4 3.9 8.7 4.1 8.4 3.9 7.8 3.5 3 10.3 5.2 10.1 5.1 9.0 4.3 9.1 4.4 9.0 4.3 7.9 3.5 4 10.5 5.4 9.3 4.5 8.6 4.0 9.0 4.3 8.3 3.8 7.7 3.4 5 10.4 5.3 10.1 5.1 8.2 3.7 8.9 4.2 8.4 3.9 7.7 3.4 6 10.4 5.3 10.7 5.5 7.7 3.4 9.1 4.4 8.9 4.2 7.8 3.5 7 10.6 5.4 9.7 4.8 8.5 4.0 10.0 5.0 7.8 3.5 7.7 3.4 8 10.1 5.1 9.9 4.9 8.3 3.8 10.1 5.1 8.3 3.8 7.7 3.4 9 10.0 5.0 10.7 5.5 8.7 4.1 10.3 5.2 8.7 4.1 7.8 3.5
10 10.2 5.1 10.4 5.3 9.0 4.3 10.1 5.1 8.6 4.0 7.7 3.4 11 10.1 5.1 10.4 5.3 8.3 3.8 10.0 5.0 8.3 3.8 7.8 3.5 12 10.2 5.1 10.9 5.6 7.7 3.4 10.2 5.1 8.9 4.2 8.1 3.7 13 8.6 4.0 10.2 5.1 11.4 6.0 10.3 5.2 10.0 5.0 7.8 3.5 14 8.3 3.8 10.6 5.4 11.3 5.9 10.1 5.1 9.7 4.8 7.8 3.5 15 8.5 4.0 11.3 5.9 11.3 5.9 10.1 5.1 9.5 4.7 7.8 3.5 16 8.4 3.9 10.7 5.5 10.9 5.6 10.2 5.1 9.7 4.8 7.7 3.4 17 8.2 3.7 11.0 5.7 11.1 5.8 9.9 4.9 9.4 4.6 7.6 3.3 18 8.4 3.9 11.6 6.1 12.2 6.5 9.9 4.9 9.4 4.6 7.5 3.3 19 8.8 4.2 10.7 5.5 11.1 5.8 10.1 5.1 9.7 4.8 7.6 3.3 20 8.9 4.2 10.6 5.4 10.9 5.6 10.3 5.2 10.1 5.1 7.8 3.5
NOTE: Assumes 7-ppm background hourly concentration and 2.9-ppm background 8-hour concentration.
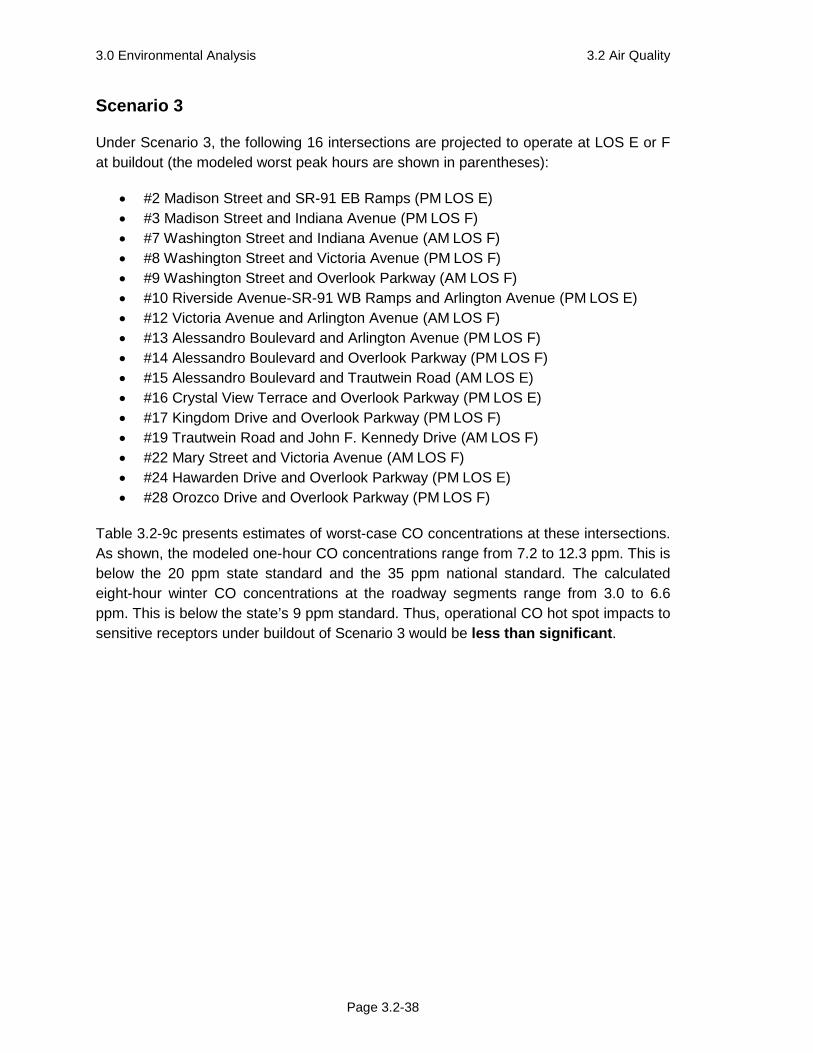
3.0 Environmental Analysis 3.2 Air Quality
Page 3.2-38
Scenario 3
Under Scenario 3, the following 16 intersections are projected to operate at LOS E or F at buildout (the modeled worst peak hours are shown in parentheses):
• #2 Madison Street and SR-91 EB Ramps (PM LOS E) • #3 Madison Street and Indiana Avenue (PM LOS F) • #7 Washington Street and Indiana Avenue (AM LOS F) • #8 Washington Street and Victoria Avenue (PM LOS F) • #9 Washington Street and Overlook Parkway (AM LOS F) • #10 Riverside Avenue-SR-91 WB Ramps and Arlington Avenue (PM LOS E) • #12 Victoria Avenue and Arlington Avenue (AM LOS F) • #13 Alessandro Boulevard and Arlington Avenue (PM LOS F) • #14 Alessandro Boulevard and Overlook Parkway (PM LOS F) • #15 Alessandro Boulevard and Trautwein Road (AM LOS E) • #16 Crystal View Terrace and Overlook Parkway (PM LOS E) • #17 Kingdom Drive and Overlook Parkway (PM LOS F) • #19 Trautwein Road and John F. Kennedy Drive (AM LOS F) • #22 Mary Street and Victoria Avenue (AM LOS F) • #24 Hawarden Drive and Overlook Parkway (PM LOS E) • #28 Orozco Drive and Overlook Parkway (PM LOS F)
Table 3.2-9c presents estimates of worst-case CO concentrations at these intersections. As shown, the modeled one-hour CO concentrations range from 7.2 to 12.3 ppm. This is below the 20 ppm state standard and the 35 ppm national standard. The calculated eight-hour winter CO concentrations at the roadway segments range from 3.0 to 6.6 ppm. This is below the state’s 9 ppm standard. Thus, operational CO hot spot impacts to sensitive receptors under buildout of Scenario 3 would be less than significant.
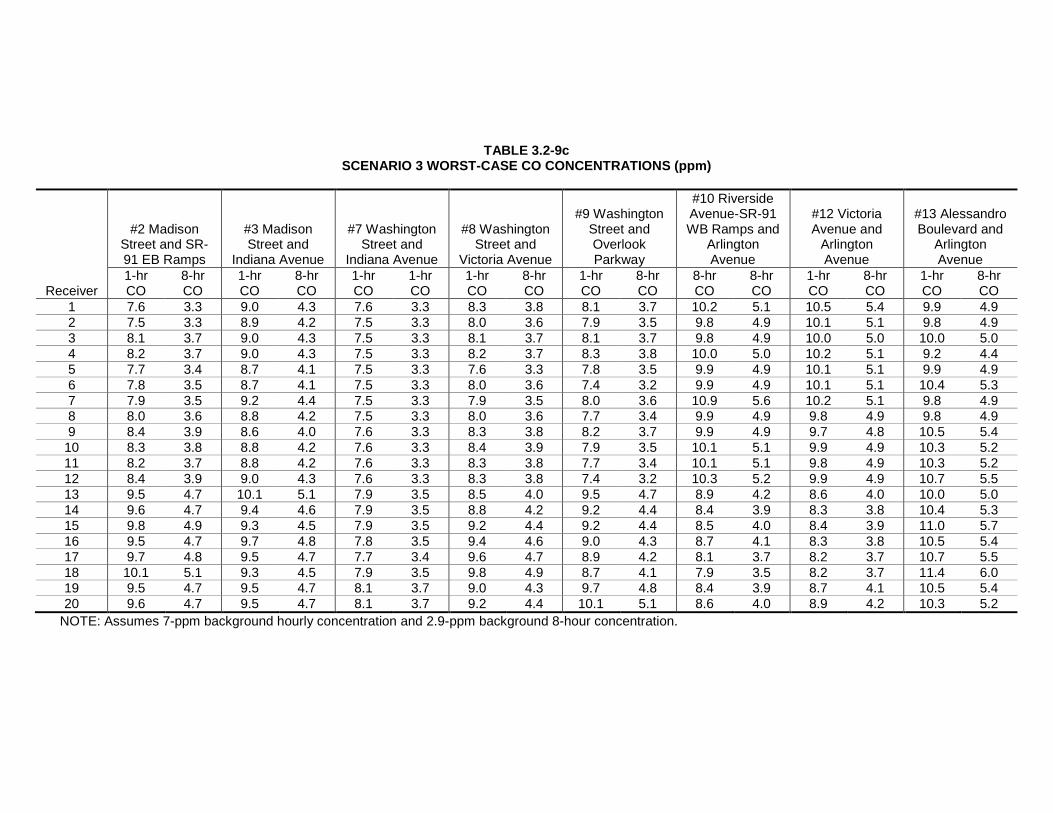
TABLE 3.2-9c SCENARIO 3 WORST-CASE CO CONCENTRATIONS (ppm)
Receiver
#2 Madison Street and SR-91 EB Ramps
#3 Madison Street and
Indiana Avenue
#7 Washington Street and
Indiana Avenue
#8 Washington Street and
Victoria Avenue
#9 Washington Street and Overlook Parkway
#10 Riverside Avenue-SR-91 WB Ramps and
Arlington Avenue
#12 Victoria Avenue and
Arlington Avenue
#13 Alessandro Boulevard and
Arlington Avenue
1-hr CO
8-hr CO
1-hr CO
8-hr CO
1-hr CO
1-hr CO
1-hr CO
8-hr CO
1-hr CO
8-hr CO
8-hr CO
8-hr CO
1-hr CO
8-hr CO
1-hr CO
8-hr CO
1 7.6 3.3 9.0 4.3 7.6 3.3 8.3 3.8 8.1 3.7 10.2 5.1 10.5 5.4 9.9 4.9 2 7.5 3.3 8.9 4.2 7.5 3.3 8.0 3.6 7.9 3.5 9.8 4.9 10.1 5.1 9.8 4.9 3 8.1 3.7 9.0 4.3 7.5 3.3 8.1 3.7 8.1 3.7 9.8 4.9 10.0 5.0 10.0 5.0 4 8.2 3.7 9.0 4.3 7.5 3.3 8.2 3.7 8.3 3.8 10.0 5.0 10.2 5.1 9.2 4.4 5 7.7 3.4 8.7 4.1 7.5 3.3 7.6 3.3 7.8 3.5 9.9 4.9 10.1 5.1 9.9 4.9 6 7.8 3.5 8.7 4.1 7.5 3.3 8.0 3.6 7.4 3.2 9.9 4.9 10.1 5.1 10.4 5.3 7 7.9 3.5 9.2 4.4 7.5 3.3 7.9 3.5 8.0 3.6 10.9 5.6 10.2 5.1 9.8 4.9 8 8.0 3.6 8.8 4.2 7.5 3.3 8.0 3.6 7.7 3.4 9.9 4.9 9.8 4.9 9.8 4.9 9 8.4 3.9 8.6 4.0 7.6 3.3 8.3 3.8 8.2 3.7 9.9 4.9 9.7 4.8 10.5 5.4
10 8.3 3.8 8.8 4.2 7.6 3.3 8.4 3.9 7.9 3.5 10.1 5.1 9.9 4.9 10.3 5.2 11 8.2 3.7 8.8 4.2 7.6 3.3 8.3 3.8 7.7 3.4 10.1 5.1 9.8 4.9 10.3 5.2 12 8.4 3.9 9.0 4.3 7.6 3.3 8.3 3.8 7.4 3.2 10.3 5.2 9.9 4.9 10.7 5.5 13 9.5 4.7 10.1 5.1 7.9 3.5 8.5 4.0 9.5 4.7 8.9 4.2 8.6 4.0 10.0 5.0 14 9.6 4.7 9.4 4.6 7.9 3.5 8.8 4.2 9.2 4.4 8.4 3.9 8.3 3.8 10.4 5.3 15 9.8 4.9 9.3 4.5 7.9 3.5 9.2 4.4 9.2 4.4 8.5 4.0 8.4 3.9 11.0 5.7 16 9.5 4.7 9.7 4.8 7.8 3.5 9.4 4.6 9.0 4.3 8.7 4.1 8.3 3.8 10.5 5.4 17 9.7 4.8 9.5 4.7 7.7 3.4 9.6 4.7 8.9 4.2 8.1 3.7 8.2 3.7 10.7 5.5 18 10.1 5.1 9.3 4.5 7.9 3.5 9.8 4.9 8.7 4.1 7.9 3.5 8.2 3.7 11.4 6.0 19 9.5 4.7 9.5 4.7 8.1 3.7 9.0 4.3 9.7 4.8 8.4 3.9 8.7 4.1 10.5 5.4 20 9.6 4.7 9.5 4.7 8.1 3.7 9.2 4.4 10.1 5.1 8.6 4.0 8.9 4.2 10.3 5.2
NOTE: Assumes 7-ppm background hourly concentration and 2.9-ppm background 8-hour concentration.
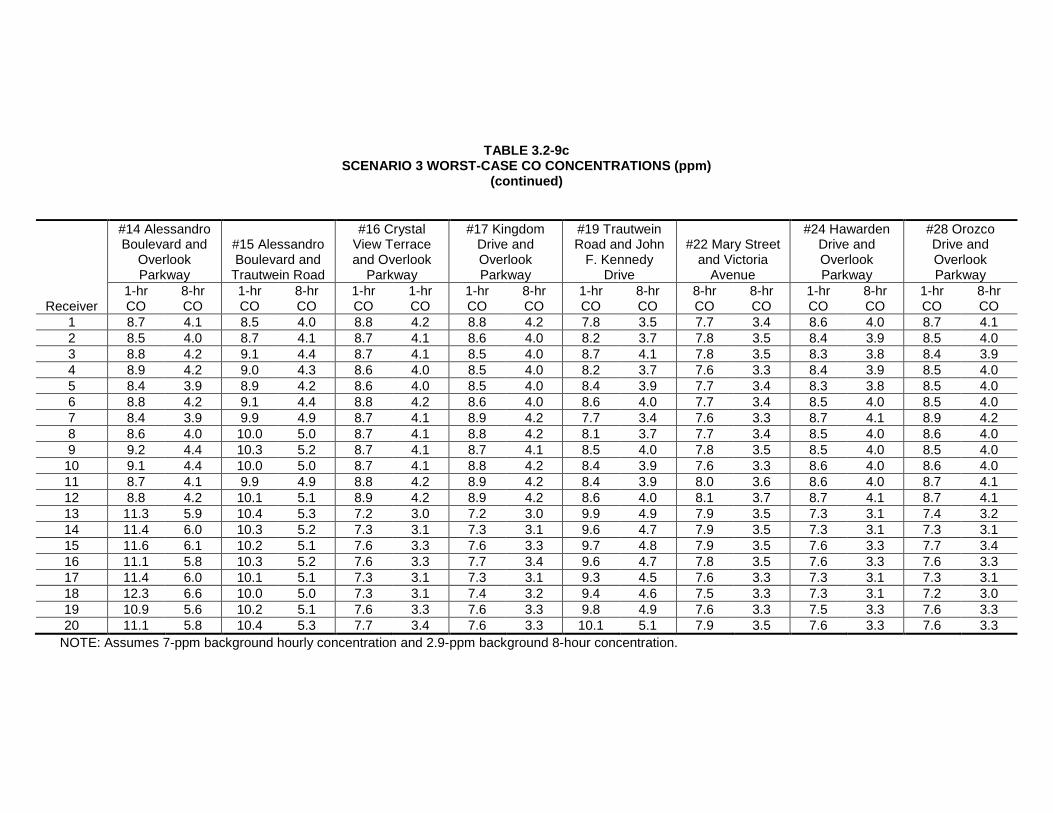
TABLE 3.2-9c SCENARIO 3 WORST-CASE CO CONCENTRATIONS (ppm)
(continued)
Receiver
#14 Alessandro Boulevard and
Overlook Parkway
#15 Alessandro Boulevard and
Trautwein Road
#16 Crystal View Terrace and Overlook
Parkway
#17 Kingdom Drive and Overlook Parkway
#19 Trautwein Road and John
F. Kennedy Drive
#22 Mary Street and Victoria
Avenue
#24 Hawarden Drive and Overlook Parkway
#28 Orozco Drive and Overlook Parkway
1-hr CO
8-hr CO
1-hr CO
8-hr CO
1-hr CO
1-hr CO
1-hr CO
8-hr CO
1-hr CO
8-hr CO
8-hr CO
8-hr CO
1-hr CO
8-hr CO
1-hr CO
8-hr CO
1 8.7 4.1 8.5 4.0 8.8 4.2 8.8 4.2 7.8 3.5 7.7 3.4 8.6 4.0 8.7 4.1 2 8.5 4.0 8.7 4.1 8.7 4.1 8.6 4.0 8.2 3.7 7.8 3.5 8.4 3.9 8.5 4.0 3 8.8 4.2 9.1 4.4 8.7 4.1 8.5 4.0 8.7 4.1 7.8 3.5 8.3 3.8 8.4 3.9 4 8.9 4.2 9.0 4.3 8.6 4.0 8.5 4.0 8.2 3.7 7.6 3.3 8.4 3.9 8.5 4.0 5 8.4 3.9 8.9 4.2 8.6 4.0 8.5 4.0 8.4 3.9 7.7 3.4 8.3 3.8 8.5 4.0 6 8.8 4.2 9.1 4.4 8.8 4.2 8.6 4.0 8.6 4.0 7.7 3.4 8.5 4.0 8.5 4.0 7 8.4 3.9 9.9 4.9 8.7 4.1 8.9 4.2 7.7 3.4 7.6 3.3 8.7 4.1 8.9 4.2 8 8.6 4.0 10.0 5.0 8.7 4.1 8.8 4.2 8.1 3.7 7.7 3.4 8.5 4.0 8.6 4.0 9 9.2 4.4 10.3 5.2 8.7 4.1 8.7 4.1 8.5 4.0 7.8 3.5 8.5 4.0 8.5 4.0
10 9.1 4.4 10.0 5.0 8.7 4.1 8.8 4.2 8.4 3.9 7.6 3.3 8.6 4.0 8.6 4.0 11 8.7 4.1 9.9 4.9 8.8 4.2 8.9 4.2 8.4 3.9 8.0 3.6 8.6 4.0 8.7 4.1 12 8.8 4.2 10.1 5.1 8.9 4.2 8.9 4.2 8.6 4.0 8.1 3.7 8.7 4.1 8.7 4.1 13 11.3 5.9 10.4 5.3 7.2 3.0 7.2 3.0 9.9 4.9 7.9 3.5 7.3 3.1 7.4 3.2 14 11.4 6.0 10.3 5.2 7.3 3.1 7.3 3.1 9.6 4.7 7.9 3.5 7.3 3.1 7.3 3.1 15 11.6 6.1 10.2 5.1 7.6 3.3 7.6 3.3 9.7 4.8 7.9 3.5 7.6 3.3 7.7 3.4 16 11.1 5.8 10.3 5.2 7.6 3.3 7.7 3.4 9.6 4.7 7.8 3.5 7.6 3.3 7.6 3.3 17 11.4 6.0 10.1 5.1 7.3 3.1 7.3 3.1 9.3 4.5 7.6 3.3 7.3 3.1 7.3 3.1 18 12.3 6.6 10.0 5.0 7.3 3.1 7.4 3.2 9.4 4.6 7.5 3.3 7.3 3.1 7.2 3.0 19 10.9 5.6 10.2 5.1 7.6 3.3 7.6 3.3 9.8 4.9 7.6 3.3 7.5 3.3 7.6 3.3 20 11.1 5.8 10.4 5.3 7.7 3.4 7.6 3.3 10.1 5.1 7.9 3.5 7.6 3.3 7.6 3.3
NOTE: Assumes 7-ppm background hourly concentration and 2.9-ppm background 8-hour concentration.
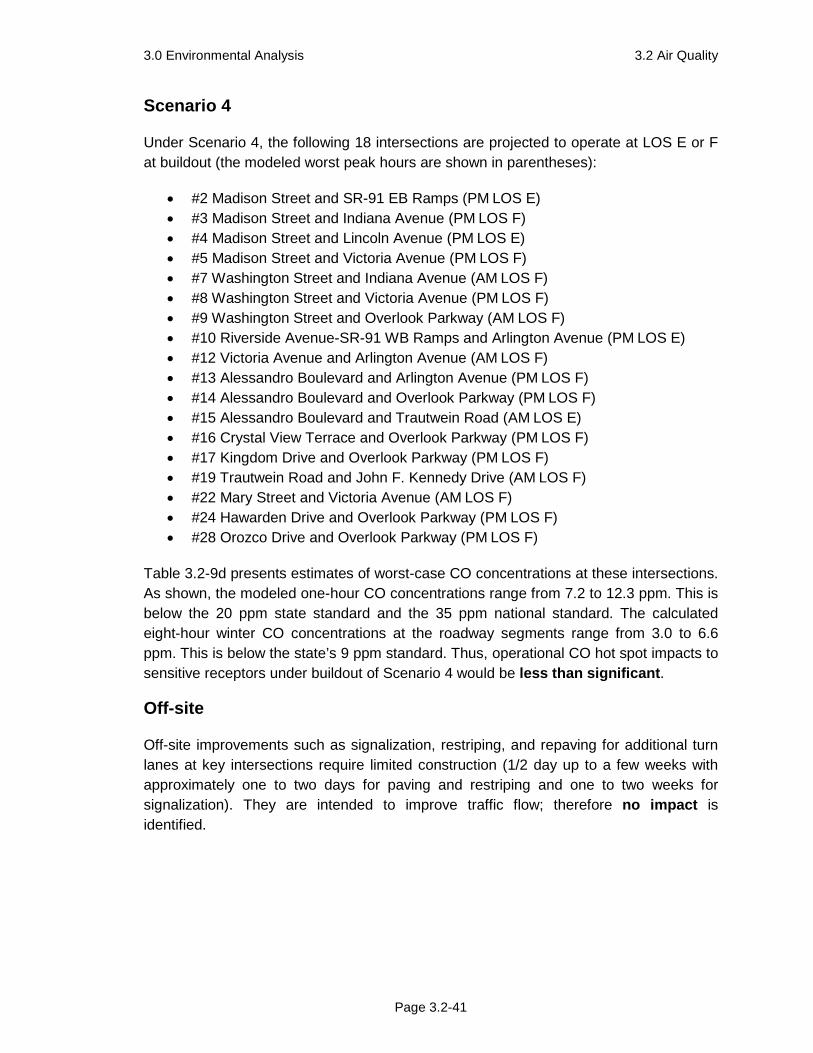
3.0 Environmental Analysis 3.2 Air Quality
Page 3.2-41
Scenario 4
Under Scenario 4, the following 18 intersections are projected to operate at LOS E or F at buildout (the modeled worst peak hours are shown in parentheses):
• #2 Madison Street and SR-91 EB Ramps (PM LOS E) • #3 Madison Street and Indiana Avenue (PM LOS F) • #4 Madison Street and Lincoln Avenue (PM LOS E) • #5 Madison Street and Victoria Avenue (PM LOS F) • #7 Washington Street and Indiana Avenue (AM LOS F) • #8 Washington Street and Victoria Avenue (PM LOS F) • #9 Washington Street and Overlook Parkway (AM LOS F) • #10 Riverside Avenue-SR-91 WB Ramps and Arlington Avenue (PM LOS E) • #12 Victoria Avenue and Arlington Avenue (AM LOS F) • #13 Alessandro Boulevard and Arlington Avenue (PM LOS F) • #14 Alessandro Boulevard and Overlook Parkway (PM LOS F) • #15 Alessandro Boulevard and Trautwein Road (AM LOS E) • #16 Crystal View Terrace and Overlook Parkway (PM LOS F) • #17 Kingdom Drive and Overlook Parkway (PM LOS F) • #19 Trautwein Road and John F. Kennedy Drive (AM LOS F) • #22 Mary Street and Victoria Avenue (AM LOS F) • #24 Hawarden Drive and Overlook Parkway (PM LOS F) • #28 Orozco Drive and Overlook Parkway (PM LOS F)
Table 3.2-9d presents estimates of worst-case CO concentrations at these intersections. As shown, the modeled one-hour CO concentrations range from 7.2 to 12.3 ppm. This is below the 20 ppm state standard and the 35 ppm national standard. The calculated eight-hour winter CO concentrations at the roadway segments range from 3.0 to 6.6 ppm. This is below the state’s 9 ppm standard. Thus, operational CO hot spot impacts to sensitive receptors under buildout of Scenario 4 would be less than significant.
Off-site
Off-site improvements such as signalization, restriping, and repaving for additional turn lanes at key intersections require limited construction (1/2 day up to a few weeks with approximately one to two days for paving and restriping and one to two weeks for signalization). They are intended to improve traffic flow; therefore no impact is identified.
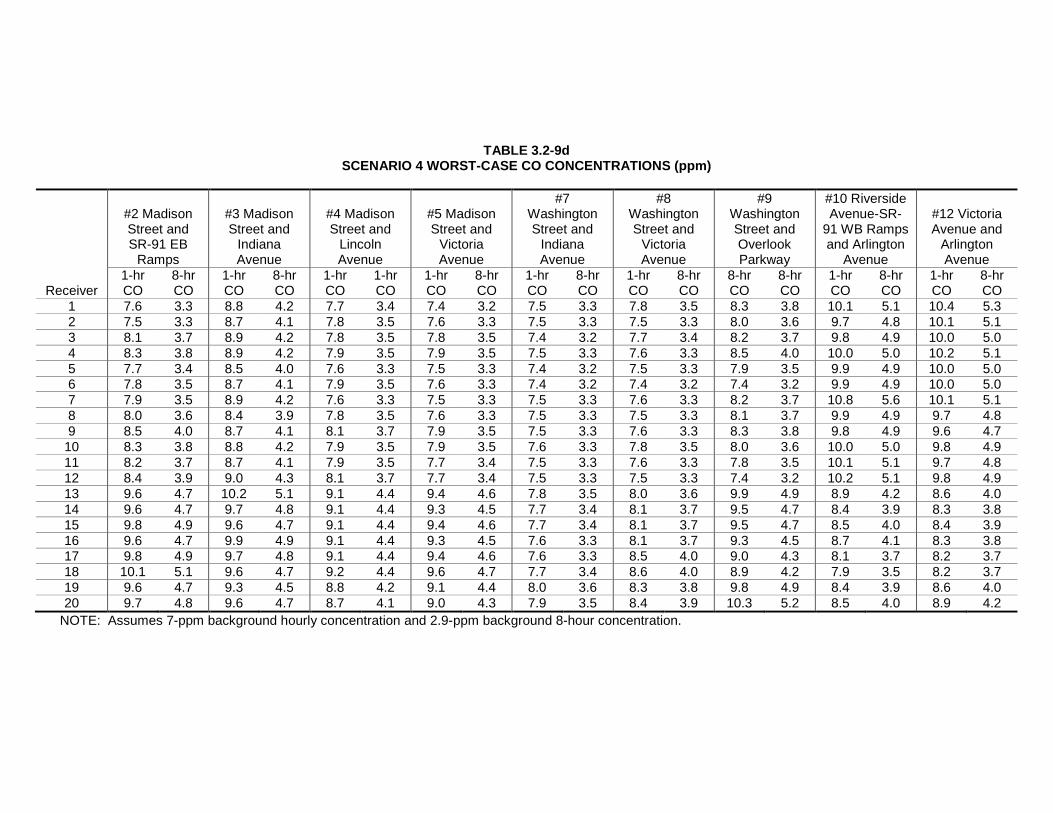
TABLE 3.2-9d SCENARIO 4 WORST-CASE CO CONCENTRATIONS (ppm)
Receiver
#2 Madison Street and SR-91 EB
Ramps
#3 Madison Street and
Indiana Avenue
#4 Madison Street and
Lincoln Avenue
#5 Madison Street and
Victoria Avenue
#7 Washington Street and
Indiana Avenue
#8 Washington Street and
Victoria Avenue
#9 Washington Street and Overlook Parkway
#10 Riverside Avenue-SR-
91 WB Ramps and Arlington
Avenue
#12 Victoria Avenue and
Arlington Avenue
1-hr CO
8-hr CO
1-hr CO
8-hr CO
1-hr CO
1-hr CO
1-hr CO
8-hr CO
1-hr CO
8-hr CO
1-hr CO
8-hr CO
8-hr CO
8-hr CO
1-hr CO
8-hr CO
1-hr CO
8-hr CO
1 7.6 3.3 8.8 4.2 7.7 3.4 7.4 3.2 7.5 3.3 7.8 3.5 8.3 3.8 10.1 5.1 10.4 5.3 2 7.5 3.3 8.7 4.1 7.8 3.5 7.6 3.3 7.5 3.3 7.5 3.3 8.0 3.6 9.7 4.8 10.1 5.1 3 8.1 3.7 8.9 4.2 7.8 3.5 7.8 3.5 7.4 3.2 7.7 3.4 8.2 3.7 9.8 4.9 10.0 5.0 4 8.3 3.8 8.9 4.2 7.9 3.5 7.9 3.5 7.5 3.3 7.6 3.3 8.5 4.0 10.0 5.0 10.2 5.1 5 7.7 3.4 8.5 4.0 7.6 3.3 7.5 3.3 7.4 3.2 7.5 3.3 7.9 3.5 9.9 4.9 10.0 5.0 6 7.8 3.5 8.7 4.1 7.9 3.5 7.6 3.3 7.4 3.2 7.4 3.2 7.4 3.2 9.9 4.9 10.0 5.0 7 7.9 3.5 8.9 4.2 7.6 3.3 7.5 3.3 7.5 3.3 7.6 3.3 8.2 3.7 10.8 5.6 10.1 5.1 8 8.0 3.6 8.4 3.9 7.8 3.5 7.6 3.3 7.5 3.3 7.5 3.3 8.1 3.7 9.9 4.9 9.7 4.8 9 8.5 4.0 8.7 4.1 8.1 3.7 7.9 3.5 7.5 3.3 7.6 3.3 8.3 3.8 9.8 4.9 9.6 4.7
10 8.3 3.8 8.8 4.2 7.9 3.5 7.9 3.5 7.6 3.3 7.8 3.5 8.0 3.6 10.0 5.0 9.8 4.9 11 8.2 3.7 8.7 4.1 7.9 3.5 7.7 3.4 7.5 3.3 7.6 3.3 7.8 3.5 10.1 5.1 9.7 4.8 12 8.4 3.9 9.0 4.3 8.1 3.7 7.7 3.4 7.5 3.3 7.5 3.3 7.4 3.2 10.2 5.1 9.8 4.9 13 9.6 4.7 10.2 5.1 9.1 4.4 9.4 4.6 7.8 3.5 8.0 3.6 9.9 4.9 8.9 4.2 8.6 4.0 14 9.6 4.7 9.7 4.8 9.1 4.4 9.3 4.5 7.7 3.4 8.1 3.7 9.5 4.7 8.4 3.9 8.3 3.8 15 9.8 4.9 9.6 4.7 9.1 4.4 9.4 4.6 7.7 3.4 8.1 3.7 9.5 4.7 8.5 4.0 8.4 3.9 16 9.6 4.7 9.9 4.9 9.1 4.4 9.3 4.5 7.6 3.3 8.1 3.7 9.3 4.5 8.7 4.1 8.3 3.8 17 9.8 4.9 9.7 4.8 9.1 4.4 9.4 4.6 7.6 3.3 8.5 4.0 9.0 4.3 8.1 3.7 8.2 3.7 18 10.1 5.1 9.6 4.7 9.2 4.4 9.6 4.7 7.7 3.4 8.6 4.0 8.9 4.2 7.9 3.5 8.2 3.7 19 9.6 4.7 9.3 4.5 8.8 4.2 9.1 4.4 8.0 3.6 8.3 3.8 9.8 4.9 8.4 3.9 8.6 4.0 20 9.7 4.8 9.6 4.7 8.7 4.1 9.0 4.3 7.9 3.5 8.4 3.9 10.3 5.2 8.5 4.0 8.9 4.2
NOTE: Assumes 7-ppm background hourly concentration and 2.9-ppm background 8-hour concentration.
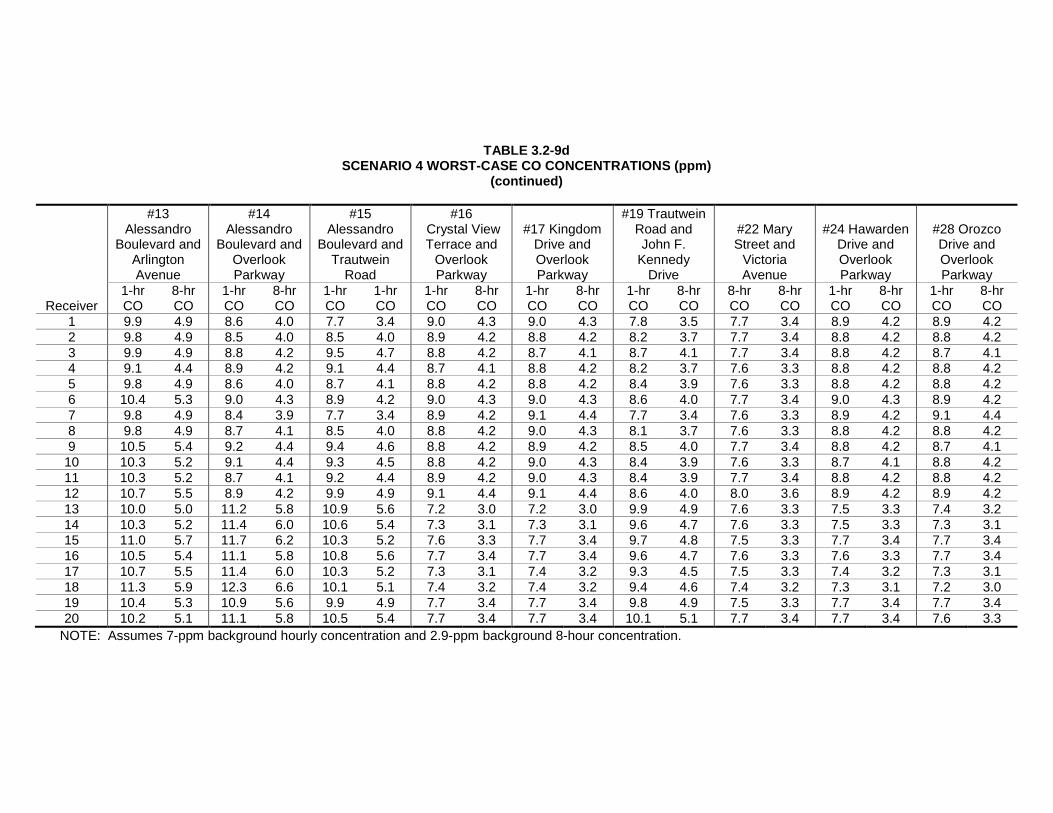
TABLE 3.2-9d SCENARIO 4 WORST-CASE CO CONCENTRATIONS (ppm)
(continued)
Receiver
#13 Alessandro
Boulevard and Arlington Avenue
#14 Alessandro
Boulevard and Overlook Parkway
#15 Alessandro
Boulevard and Trautwein
Road
#16 Crystal View Terrace and
Overlook Parkway
#17 Kingdom Drive and Overlook Parkway
#19 Trautwein Road and John F.
Kennedy Drive
#22 Mary Street and
Victoria Avenue
#24 Hawarden Drive and Overlook Parkway
#28 Orozco Drive and Overlook Parkway
1-hr CO
8-hr CO
1-hr CO
8-hr CO
1-hr CO
1-hr CO
1-hr CO
8-hr CO
1-hr CO
8-hr CO
1-hr CO
8-hr CO
8-hr CO
8-hr CO
1-hr CO
8-hr CO
1-hr CO
8-hr CO
1 9.9 4.9 8.6 4.0 7.7 3.4 9.0 4.3 9.0 4.3 7.8 3.5 7.7 3.4 8.9 4.2 8.9 4.2 2 9.8 4.9 8.5 4.0 8.5 4.0 8.9 4.2 8.8 4.2 8.2 3.7 7.7 3.4 8.8 4.2 8.8 4.2 3 9.9 4.9 8.8 4.2 9.5 4.7 8.8 4.2 8.7 4.1 8.7 4.1 7.7 3.4 8.8 4.2 8.7 4.1 4 9.1 4.4 8.9 4.2 9.1 4.4 8.7 4.1 8.8 4.2 8.2 3.7 7.6 3.3 8.8 4.2 8.8 4.2 5 9.8 4.9 8.6 4.0 8.7 4.1 8.8 4.2 8.8 4.2 8.4 3.9 7.6 3.3 8.8 4.2 8.8 4.2 6 10.4 5.3 9.0 4.3 8.9 4.2 9.0 4.3 9.0 4.3 8.6 4.0 7.7 3.4 9.0 4.3 8.9 4.2 7 9.8 4.9 8.4 3.9 7.7 3.4 8.9 4.2 9.1 4.4 7.7 3.4 7.6 3.3 8.9 4.2 9.1 4.4 8 9.8 4.9 8.7 4.1 8.5 4.0 8.8 4.2 9.0 4.3 8.1 3.7 7.6 3.3 8.8 4.2 8.8 4.2 9 10.5 5.4 9.2 4.4 9.4 4.6 8.8 4.2 8.9 4.2 8.5 4.0 7.7 3.4 8.8 4.2 8.7 4.1
10 10.3 5.2 9.1 4.4 9.3 4.5 8.8 4.2 9.0 4.3 8.4 3.9 7.6 3.3 8.7 4.1 8.8 4.2 11 10.3 5.2 8.7 4.1 9.2 4.4 8.9 4.2 9.0 4.3 8.4 3.9 7.7 3.4 8.8 4.2 8.8 4.2 12 10.7 5.5 8.9 4.2 9.9 4.9 9.1 4.4 9.1 4.4 8.6 4.0 8.0 3.6 8.9 4.2 8.9 4.2 13 10.0 5.0 11.2 5.8 10.9 5.6 7.2 3.0 7.2 3.0 9.9 4.9 7.6 3.3 7.5 3.3 7.4 3.2 14 10.3 5.2 11.4 6.0 10.6 5.4 7.3 3.1 7.3 3.1 9.6 4.7 7.6 3.3 7.5 3.3 7.3 3.1 15 11.0 5.7 11.7 6.2 10.3 5.2 7.6 3.3 7.7 3.4 9.7 4.8 7.5 3.3 7.7 3.4 7.7 3.4 16 10.5 5.4 11.1 5.8 10.8 5.6 7.7 3.4 7.7 3.4 9.6 4.7 7.6 3.3 7.6 3.3 7.7 3.4 17 10.7 5.5 11.4 6.0 10.3 5.2 7.3 3.1 7.4 3.2 9.3 4.5 7.5 3.3 7.4 3.2 7.3 3.1 18 11.3 5.9 12.3 6.6 10.1 5.1 7.4 3.2 7.4 3.2 9.4 4.6 7.4 3.2 7.3 3.1 7.2 3.0 19 10.4 5.3 10.9 5.6 9.9 4.9 7.7 3.4 7.7 3.4 9.8 4.9 7.5 3.3 7.7 3.4 7.7 3.4 20 10.2 5.1 11.1 5.8 10.5 5.4 7.7 3.4 7.7 3.4 10.1 5.1 7.7 3.4 7.7 3.4 7.6 3.3
NOTE: Assumes 7-ppm background hourly concentration and 2.9-ppm background 8-hour concentration.
3.0 Environmental Analysis 3.2 Air Quality
Page 3.2-44
b. Diesel Particulate Matter
Construction
Construction equipment is diesel powered. As noted previously in Section 3.2.1.6, diesel particulate matter has been identified as a toxic air contaminant. The health risks associated with diesel particulate matter are those related to long-term exposures (i.e., cancer and chronic effects) (California EPA’s Office of Environmental Health Hazard Assessment [OEHHA] 2003). Long-term health risk effects to residents are generally evaluated for an exposure period of 70 years (i.e., lifetime exposure) (OEHHA 2003). The nearest sensitive receptors are located as close as approximately 230 feet from the fill crossing, 350 feet from the bridge, and 70 feet from the Proposed C Street alignment. Because risk is based on a lifetime of exposure and because construction of any of the proposed scenarios would be short-term, impacts due to construction diesel particulate matter would be less than significant.
Operation
The health effects of exposure to diesel particulate matter generated by traffic on roadways have been raised as a potential concern. In April 2005, CARB published the Air Quality and Land Use Handbook: A Community Health Perspective. The handbook makes recommendations directed at protecting sensitive land uses while balancing a myriad of other land use issues (e.g., housing, transportation needs, economics, etc.). It notes that the handbook is not regulatory or binding on local agencies and recognizes that application takes a qualitative approach. As reflected in the CARB handbook, there is currently no adopted standard for the significance of health effects from mobile sources. Therefore, CARB has provided guidelines for the siting of land uses near heavily traveled roadways. Of pertinence to this study, CARB guidelines indicate that siting new sensitive land uses within 500 feet of a freeway, urban roads with 100,000 vehicles/day, or rural roads with 50,000 vehicles/day should be avoided when possible.
The proposed Project does not propose any new sensitive land uses. Additionally, the proposed Project would not result in an increase in ADT to the roadway network in the County. The total existing traffic volume in Riverside County is 5,531,645 ADT, and the total projected buildout traffic volume in Riverside County is 11,222,346 ADT (ITERIS, Inc. 2012). The increase in ADT from existing to buildout is due to population growth in the region and is not due to the Project since the Project would not generate trips. Therefore, the Project would not result in roadways of 100,000 vehicles per day or rural roads of 50,000 vehicles per day. Because the Project would not generate new trips or create new sensitive land uses, impacts would be less than significant.
3.0 Environmental Analysis 3.2 Air Quality
Page 3.2-45
Off-site
Off-site measures consist of improvements such as signalization, restriping, and repaving for additional turn lanes at key intersections. Because of the limited equipment and construction duration, these improvements would not be expected expose sensitive receptors to substantial pollutant concentrations. No impact is identified.
3.2.6.2 Significance of Impacts
As shown in Tables 3.2-9a through 3.2-9d, the modeled one-hour and calculated eight-hour CO concentrations are projected to be less than the state and federal standards. Under all scenarios, impacts from CO hot spots would be less than significant. In addition, impacts due to construction and operational diesel particulate matter would be less than significant.
No impacts would occur from implementation of off-site improvements.
3.2.6.3 Mitigation, Monitoring, and Reporting
No mitigation is required.
3.2.7 Issue 5: Odors Would the proposed Project create objectionable odors affecting a substantial number of people?
3.2.7.1 Impact Analysis
Scenario 1
Scenario 1 would not generate objectionable odors. No construction would be required under Scenario 1; therefore, there would be no impacts related to odors associated with construction equipment exhaust.
Scenario 2
Scenario 2 would not generate objectionable odors from removing the gate. No construction would be required under Scenario 2; therefore, there would be no impacts related to odors associated with construction equipment exhaust.
Scenario 3
Scenario 3 would not create a new odor source (e.g., landfill, waste treatment plant, industrial land use, etc.); therefore, operation of Scenario 3 would not generate
3.0 Environmental Analysis 3.2 Air Quality
Page 3.2-46
objectionable odors. Potential odor emitters during construction activities include asphalt paving and the use of architectural coatings and solvents. Construction activity could generate airborne odors from exhaust emissions. However, odors generated from vehicles and/or equipment exhaust during construction would be temporary and localized at the construction site, and would not create a significant level of objectionable odors. As noted above, the nearest sensitive receptors are located as close as approximately 230 feet from the proposed fill crossing and 350 feet from the proposed bridge. Impacts from construction would be less than significant. Additionally, SCAQMD Rules 1108 and 1113 limit the amount of volatile organic compounds from cutback asphalt and architectural coatings and solvents, respectively (SCAQMD 1985 and 2011). Rule 1108 requires that a person shall not sell or offer for sale for use in the SCAQMD, or use any cutback asphalt containing more than 0.5 percent by volume organic compounds. Rule 1113 requires any person who supplies, sells, offers for sale, or manufactures any architectural coating for use in the SCAQMD must comply with the current VOC standards. These standards are specific to each type of coating and are contained in the final rule.
Given mandatory compliance with SCAQMD rules, no construction activities or materials are proposed that would create a significant level of objectionable odors. As such, potential impacts during short-term construction would be less than significant.
Scenario 4
Operation of Scenario 4 would not generate objectionable odors. Potential odor emitters during construction activities include asphalt paving and the use of architectural coatings and solvents. Construction activity could generate airborne odors from exhaust emissions. However, odors generated from vehicles and/or equipment exhaust during construction would be temporary and localized at the construction site, would not create a significant level of objectionable odors. As noted above, the nearest sensitive receptors are located as close as approximately 230 feet from the fill crossing, 350 feet from the bridge, and 70 feet from the Proposed C Street alignment. Impacts from construction would be less than significant. Additionally, as with Scenario 3, given mandatory compliance with SCAQMD rules, no construction activities or materials are proposed that would create a significant level of objectionable odors. As such, potential impacts during short-term construction would be less than significant.
Off-site
Off-site improvement measures consist of signalization, restriping, and repaving for additional turn lanes at key intersections. Because construction equipment would be limited and construction activities would be short-term, these improvements would have no impact on risks associated with creating objectionable odors affecting a substantial number of people.

3.0 Environmental Analysis 3.2 Air Quality
Page 3.2-47
3.2.7.2 Significance of Impacts
No objectionable odors would be generated during operation of all four scenarios. Given mandatory compliance with SCAQMD rules, no construction activities or materials proposed under Scenarios 3 and 4 would create a significant level of objectionable odors. As such, potential impacts during short-term construction would be less than significant.
No impacts would be associated with off-site improvements.
3.2.7.3 Mitigation, Monitoring, and Reporting
No mitigation is required.
3.0 Environmental Analysis 3.2 Air Quality
Page 3.2-48
THIS PAGE IS INTENTIONALLY BLANK.