Embed Size (px)
Citation preview

320
CHAPTER VI
WEST GODAVARI DISTRICT – A PROFILE
West Godavari District is carved out of Old Godavari District. As it is the
Western delta of the River Godavari, it was appropriately named as “West Godavari",
with Headquarters at Eluru and came into existence in the year 1925. The Historical,
Political, Geographical, Topographic, Demographic and other socio economic aspects
of the West Godavari District are delineated hereunder.
Boundaries and Topography of the District:
The District is bounded by the following places and features on all the four
sides.
East : River Godavari
West : Krishna District
North : Khammam District
South : Krishna District and Bay of Bengal.
The District is situated in tropical region between 16°-15'-00" to 17°-30'-00"
Northern latitude and 80°-55'-00" to 81°-55'-00” Eastern Longitude. It can be divided
into three natural regions viz., Delta, Upland and Agency areas.
Location and Size
Lying along the shore of the Bay of Bengal. The District of West Godavari is
located between the Northern latitudes of latitudes of 16°15' and 170°30' and between
the Eastern longitudes of 80°50' and 81°55. The district is bounded on the North by
the Khammam District on the south by the Krishna District and the Bay of Bengal on
the East by river Godavari and on the West by Krishna District.
West Godavari District for a long time was not homogeneous unit and the
district was under the old Krishna District in the erstwhile Madras Presidency. The
District was formed as a separate revenue district after having been carved out of the
Krishna District on April 15, 1925.
321
According to the Census of 2001 West Godavari District, with an area of
7,780 sq.kms. (accounts for 2.84 per cent of the total area of the state) and population
of over 3.80 million is one of the smallest districts in Andhra Pradesh ranking
eighteenth in the State in area and it occupies fourth place in regard to population.
The district has a high density of 490 per square kilometer compared to the State
average of 275 people and it is the second highest after Hyderabad (16988). The
District is overwhelmingly rural with only 20.83 per cent living in urban areas
whereas the State has an average of nearly 23.93 per cent people living in cities and
towns. Only four towns in the district are of considerable size; the largest is the
district headquarters, Eluru town, with a population of 2,12,918 followed by
Bhimavaram, Tadepalligudem and Tanuku. In terms of literacy the district is in an
enviable position as it has 45.45 per cent of literates compared to the State average of
37.59.
History
The District of West Godavari was a homogeneous unit and the district was
under the sway of various dynasties at different periods of time. Its political history
appears to have been intimately connected with the hoary past of The Mauryas (297-
272 B.C). The Satavahanas (A.D. 62-86), The Salankayanas (A. D.375), The Vishnu
Kundins (A.D.515-535), The Western Chalukyas of Badami (A.D.609-642), The
Eastern Chalukyas of Vengi (A.D.719-755), The Chalukya-Cholas (A.D.1118-ll63),
The Velanati Cholas (A.D.1163-1181) and the Kolanu Chiefs (A.D.1182-1213).
The area became part of the Qutub Shahis of Golconda (near Hyderabad) in
1518. It came under Mughal Rule when Aurangazeb conquered Golconda 1n 1687.
Later the Nizams of Hyderabad held sway over this area for a brief period from 1724
to 1768. When the Southern Circars were ceded to the British India Company the
District became part of the Madras Presidency.
The District of West Godavari was formed before the formation of Andhra
Pradesh and all the then Taluks like Nidadavole, Tadepalligudem, Bhimavaram,
Narsapuram, Tanuku, Eluru and Kamavarapukota, were retained as they were in the
erstwhile Madras State. The divisional headquarters of Tadepalligudem which was
temporarily fixed at Bhimavaram was subsequently made permanent. The name of
322
Kamavarapukota taluk was subsequently changed as Chintalapudi independent sub-
taluk in 1931 with its headquarters at Chintalapudi. The district gained the Taluk of
Polavaram from East Godavari District on the 18th October, 1942 and was made an
Independent sub-taluk. Consequent on the separation of the judiciary from the
executive, the revenue division of Bhimavaram was abolished on the 1st of April,
1954 and the taluks of Bhimavaram and Tadepalligudem, the constituent units of this
division were tagged on to the revenue divisions of Narsapuram and Eluru
respectively. All the above changes were made for the administrative convenience.
Freedom Movement in West Godavari District
The partition of Bengal in 1905 gave a sharp edge to national awareness
allover the country and this was reflected in this district also. The people of this
district reacted to the movement spontaneously. Places like Eluru, Palakollu and
Tanuku were the centres of such activity and several important persons went round
the district organising meetings for the boycott of foreign goods. Likewise the Home
Rule Movement started by Annie Besant gave rise to a spate of activity in this district
and several branches of the League were started in this district.
The Non-Cooperative Movement of 1920 saw the district seething with
political activity. In 1921 Gandhi undertook a tour of some coastal towns including
Eluru so as to spread the message of nationalism. He opened a National College
named Gandhi Andhra Jateeya Mahavidyalayam for the spread of national education
during his visit to Eluru. It was during this year that several hartals were observed all
over the district· in-connection with the Non-Cooperation Movement. Of the several
patriots who participated in the Non-Cooperation Movement, Atmakuri
Govindacharyulu, Vellanki Krishna Murthy, H.V.Jogaiah Sarma, Mote Narayana
Rao, Dandu Narayana Raju and Maganti Bapineedu deserve mention. It is also of
interest to note that Alluri Sitarama Raju, a great patriot defied the British and spread
the message of Independence to other areas. The British however captured him on the
7th May, 1924 and shot him dead. Though he failed to achieve his ambition his whole
life and work directed towards attaining freedom. Further the incident at Eluru Taluk
Office at the time of toddy sales may be taken as typical of what happened throughout
Andhra in general and in this district in particular. Toddy sales were held at this place
on the 13th of August, 1921. The Congressmen with the help of Mote Ganga Raju, the

323
Zamindar and P. Ramaswami succeeded in persuading the bidders to boycott the
sales. On the constructive side popular Panchayat Courts were set-up in the place of
boycotted British Courts. For instance, Matlapalem Panchayat Court disposed of 100
cases relating to moveable and immoveable property. In the succeeding years
emphasis has been on Khaddar. As a result, the demand for khaddar went up so much
that the depots at places like Eluru were unable to meet it.
The district showed again its political awareness in connection with the visit of
Simon Commission In 1928. The Eluru Municipality and the Bhimavaram Bar
Association passed resolutions in favour of the boycott. Another out standing feature
of the period was the visit of Mahatma Gandhi to many towns and villages of West
Godavari District to raise funds for the khaddar movement. In this tour he collected
Bs.41,436/- in the form of cash while the Congress fixed Rs.25,OOO/- only as quota
from West Godavari. When Gandhi started this Civil Disobedience campaign again
on the 12th March, 1930 by marching from his Sabarmathi Ashram to Dandi to break
the Salt Law, the district again responded magnificently to this movement. The
Village of Matlapalem was selected as a centre for breaking the Salt Laws. Maganti
Bapineedu, Dandu Narayana Raju, Mulpuri Rangaiah and several others took an
active part in breaking the salt laws. As part of the Civil Disobedience Movement
shops throughout the district remain closed on the 20th September, 1932. With the
visit of Gandhi to this district in 1933 many temples were thrown open for Harijan
entry under the 1935 Government of India Act. The district returned 3 Congress
candidates out of 5 to the Provincial Legislative Assembly and thus displayed its solid
patriotism. Again the district played a notable part in the Quit India Movement
launched by Gandhi in 1942. The movement in the district took a violent turn because
of the policy of severe repression. A mob of 2.000 people attacked the revenue
officers. police stations and divisional office at Bhimavaram. It burnt completely all
the records in the Revenue Divisional Office. The telephone lines were partially burnt.
The police station was saved from total destruction by the Sub-Inspector of Police
who held the mob at bay by firing continuously for two hours. Three persons are
reported to have been killed and five injured in the firing. Similarly, the Relangi
Railway Station was burnt down. In fact the district hardly returned to normalcy until
the 20th February, 1947, when the British Government declared its intention to Quit
324
India. At last, India achieved Independence on August 15, 1947 and the Indian
National Government was headed by Jawaharlal Nehru.
Party System Development in West Godavari District
In west Godavari, as elsewhere in India, the Indian National Congress is the
oldest and most important of all the Indian political parties thanks to Gandhi for
making it a board-based organization. Because of the very nature of the nationalist
struggle, which the Congress Party led against the alien rulers, the Congress could
bring together a wide assortment of groups into its fold. A cursory glance at the social
composition of the Congress elite before and after 1920 would amply support this
view.
Unlike 1n some parts of the country the Congress Party in West Godavari had
a powerful challenger in the short-lived non-Brahmin Justice party between 1916 and
1937. This was possible mainly due to the fact that West Godavari happened to be the
home district of some prominent Justice Party leaders which included K.V.Reddy
Naidu and Badeti Venkata Ramaiah. While the former became the Development
Minister in the first ministry headed by the Justice Party, the latter became the
Chairman of Eluru Municipality.
There was a great deal of competition between the two political parties and it
was witnessed in the very beginning of the formation of politica1 parties. With the
electoral drubbing it received at the hands of the Congress Party in the elections to the
Central and Provincial Assemblies held in 1937, the opposition to the Congress came
not from outside out through factionalism within the party.
Although the Congress had emerged as the dominant party with a lion’s share
in terms of the number of seats and percentages of votes polled both in the Central
Parliament and in most State Assemblies in the First General Election of 1951-52, the
situation appeared quite different in the Andhra region and in the District of West
Godavari. While the Communist Party of India managed to win nearly as many seats
as the Congress and came close to forming the government in the erstwhile Madras
Province it was Krishikar Mazdoor Praja Party (K.M.P.P) headed by T. Prakasam
which gathered more Assembly seats than the Congress did in the District of West
325
Godavari. However, the Congress Party came out of this temporary setback and
dominated the National and State level politics between 1952 and 19.82. The electoral
politics in the district would in fact indicate the prevalence of a one-party dominant
system.
Since 1982 onwards the West Godavari District Congress had a powerful
riva1 in the Telugu Desam Party headed by N.T.Rama Rao. With the entry of the
T.D.P. into State politics, the West Godavari District unit of the Congress Party had to
operate in a far-more competitive environment. Now the ruling congress party at the
state provided two cabinet berths to the District. Mr. Vatti Vasantha Kumar, Minister
for Tourism and Mr. Peethani Satyanaryana, Minister for belong to the District.
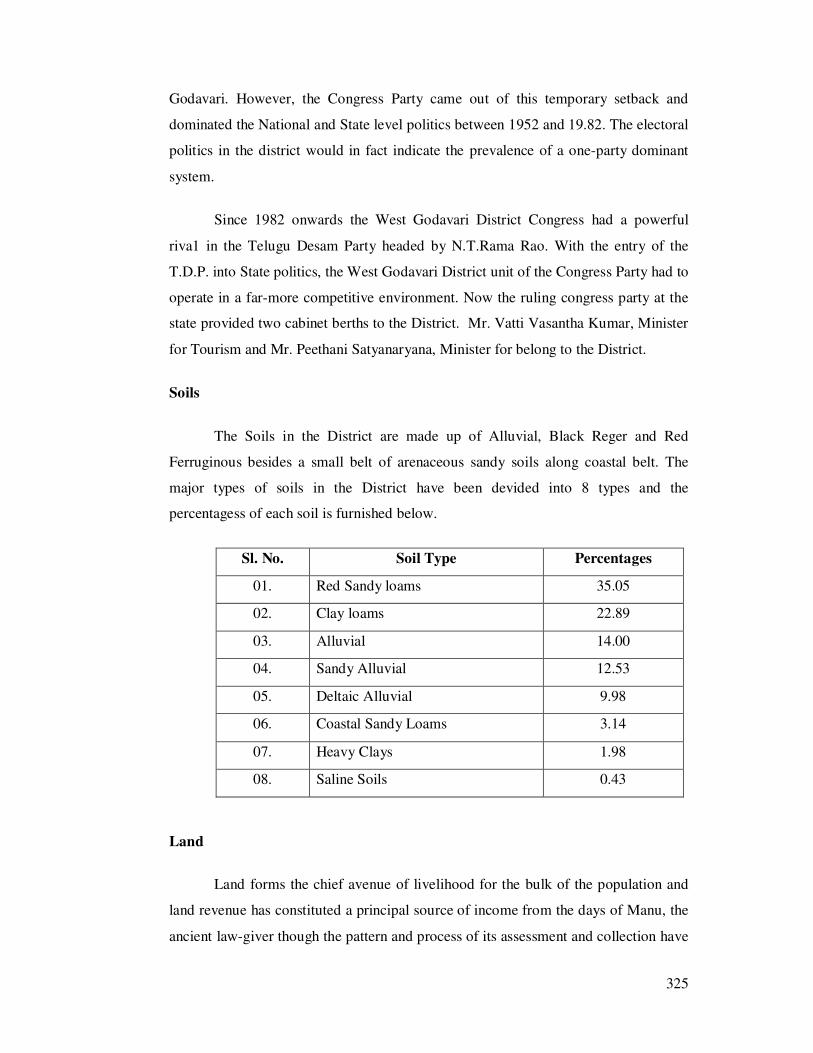
Soils
The Soils in the District are made up of Alluvial, Black Reger and Red
Ferruginous besides a small belt of arenaceous sandy soils along coastal belt. The
major types of soils in the District have been devided into 8 types and the
percentagess of each soil is furnished below.
Sl. No. Soil Type Percentages
01. Red Sandy loams 35.05
02. Clay loams 22.89
03. Alluvial 14.00
04. Sandy Alluvial 12.53
05. Deltaic Alluvial 9.98
06. Coastal Sandy Loams 3.14
07. Heavy Clays 1.98
08. Saline Soils 0.43
Land
Land forms the chief avenue of livelihood for the bulk of the population and
land revenue has constituted a principal source of income from the days of Manu, the
ancient law-giver though the pattern and process of its assessment and collection have

326
varied from one political era to another. The continual changes in governmental and
administrative structures and the gradual process of acquisition by the British of the
Madras Presidency, of which the district of West Godavari formed a part, made for
considerable diversity in the patterns of administration. This diversity was particularly
marked in the area of land settlement and revenue administration. At the time of
Independence, the district continued to have three types of land tenures - Zamindari,
Inam and Ryotwari.
The Zamindari system was abolished under the Madras Estates Abolition Act
of 1948. The tenure of many Inam lands has also been abolished and converted to
Ryotwari in accordance with the provisions of the Andhra Pradesh (Andhra area)
Inams (Abolition and Conversion into Ryotwari) Act of 1956. Thus a uniform pattern
of land tenure was established throughout the district (and the State). Only two classes
of land holders - owner cultivators and tenants remain.
Agriculture and Irrigation
In terms of agriculture, industry, communication, health and education, West
Godavari is one of the most advanced districts in the State of Andhra Pradesh.
Consequently, the standard of living and the per capita income of the district is one of
the highest in the State. The district is overwhelmingly rural with nearly 80 per cent of
the population living in the rural areas.
A substantial percentages of the district population over 70 per cent - depend on
agriculture for the livelihood. According to the 1951 Census which gave details of
liveliihood categories, 70 per cent of the district population depend on agricultura1
resources with the following breakup - owner-cultivators 40.2 per cent, tenants 8.6,
agricultural labourers 19.4 and rent receivers 1.8 per cent. Distribution of population
into workers and non-workers categories also shows, according to the 1971 Census, a
substantial percentages (over 74.5) of the workforce engaged in agricultural activity
36.7 per cent as cultivators and 37.8 per cent as agricultural labourers.
Of the geographical area of 7,79,535 hectares the net cultivated area
constitutes 58.1 per cent. Most of the cultivable land is irrigated by government
canals, tanks, wells and other sources. For instance, the chief source of irrigation in
327
the district are canals from the Godavari and the Krishna rivers and open head
channels from minor rivers like Tammileru. Erra Kaluva, Juleru, Bynere, Ramileru
and Gunderu besides a good number of tanks and wells. Of all these water sources
Godavari is the major source of irrigation in this district. In order to irrigate the delta
area an anicut was constructed across Godavari between 1850 and 1874 A.D. The
canals which drew their supply from the Godavari river have converted the delta area
into one vast expanse of paddy fields where failure of crops for want of water is
unknown.
The main canal which takes off from the river on the right side from
Vizzeswaram lock and head sluice serves both the irrigation and navigation needs
through various canals and distributaries. Irrigation in West Godavari is carried on
through a network of canals, namely Main Canal, the Eluru Canal, the Kakaraparru
Canal,Narsapuram Canal, the Bank Canal, the Attili Canal, the Junction Canal, the
Gosthanadhi and Velpur Canal, the Venkayya and Weyyeru Canal, and the Undi
Canal. The tata1 length of these canals is about 369 kms. cultivating about 5,19,782
acres of land in the district.
West Godavari is basically an agrarian district with rich natural resources. It
has a fertile land assured of irrigation facilities ties with less natural hazards besides
sound functioning of Co-operative and Panchayati Raj Institutions. The district is the
first of its kind in Andhra Pradesh as the Government of India has introduced
intensive agricultural district programme popularly known as package programme in
the district. The programme was launched in October, 1960 with the aid from the
Government of India as well as the Ford Foundation of U.S.A. The cropping pattern
in all the Mandals remains the same. Paddy is grown in almost all the parts of the
district. Besides paddy the principal crops of cultivation in the district are jowar,
maize, blackgram, chillies, turmeric, sugarcane, vegetables, groundnut, sesamum,
tobacco, etc.
The district has a distinct place in the State and it is popularly called as the
'Ricebowl' of Andhra Pradesh. The upland areas like Chintalapudi and parts of
Polavaram Taluk are well-known in Andhra Pradesh for the production of cashewnut,
mango and banana. Interestingly mixed cropping is also found in parts of the district.
328
For instance, groundnut is grown mixed with gingelly and vegetables are grown
mixed with banana.
In the agency areas podu or the shifting method of cultivation is prevalent.
This ancient type of cultivation is carried out by the tribals through burning or
clearing the forests for a single meager crop and then abandoning them for new plots.
Teak, bamboos, beedi leaves tamarind, soap nuts, honey and mangoes are some of the
important forest produce from the district. The produce is leased out to the A.P.
Scheduled Tribes Cooperative Finance Development Corporation in 1967.
Claimate and Rainfall
In West Godavari District, the climate moderate both in winter and summer
seasons in delta area. In the non-delta area of the district, the heat in the summer is
severe especially in the tracts of upland and agency areas. The normal maximum and
minimum temperatures recorded in the District are 48°C to 19°C respectively. The"
maximum temperature is usually recorded in the months of April and May.
The District receives its rainfall mostly and predominantly from South West as
well as North East monsoon, whose normal rainfall is 785.6 mm and 254.6 mm
respectively. The receipt of actual rainfall during 2005 - 2006 from South
Westmansoon is 9120.3mm, while 288.7 mm from North East monsoon. The
agriculture activity in the District is deplorable owing to gambling monsoons,
unreliable rainfall and much dependence on tanks, wells and M. I. Sources for
irrigation in upland and agency areas.
Demographic Particulars
The District occupies an area of 7,742 square K.Ms. with a density of 491 per
Sq. K.M. It accounts 2.81 per cent of the total area of the State. There are as many as
901 Revenue villages exist in the district, of which 866 villages are inhabited while
the balance 35 are uninhabited.
The Physical characteristics, natural resources and potentialities of the
mandals in the District are not homogeneous. As per 2001 census, the total population
of the District is 38,03,517. It accounts for 4.99 per cent of the total population of the
329
State. The female population of the District is 18,93,479 and this forms 49.8per cent
of the District and 5.02 per cent of the State Female Population.
According to 2001 census, rural population of the District is 30,52,630 and it
can stitutes 80.3per cent of the District population and 5.50per cent to that of State
rural population. Similarly, the urban population of the District spread over in 8 towns
is 7,50,887 forming 19.7per cent of the District population and 3.6per cent of the State
urban population.
As regards community wise population, the SC population of the District is
7,28,963 which is 19.16per cent of the District population and 5.90per cent of the
State total S.C. Population. Similarly, the S.T. Population of the District is 96,659 and
it accounts for 2.54per cent of the District and 1.92per cent of the State S.T.
Population. The S.C. and S.T. population are based upon 2001 provisional census.
The decennial growth of population in the District from 1991 census to 2001
census was 8.12per cent. The density of population according 2001 census is 491 per
Sq.km, whereas it was 277 per Sq.K.M. for the State. The Literacy rate of the District
is 65.9"2per cent which is higher than the State literacy rate of60.47per cent. The sex
ratio of the District is 991 females per 1,000 males as against 978 of the State. The
number of workers as arrived at in 2001 census is 25,71,589 forming 67.6per cent of
total population of the District and 3.37per cent of the State population.
Comparison District with State
Comprehensive details on all aspects of demography such as population, sex,
literacy, work force besides the status of Urban and Rural in terms of population are
provided for West Godavari District as compared to State in the statement. Further,
community wise population particulars are also specified. The area and production
generated under principal crops together with the total cropped and irrigated areas are
mentioned compared to State. The potentiality and facilities available under Animal
Husbandry, Medical & Health, Electrification and other communication infrastructure
are given. The comparative statement reveals the status of West Godavari District as
compared to the State under important sectors.
330
Population statistics of 2001 as compared to 1991 Census
A Critical analysis of the results of certain major items in population census
2001 is made as compared to the 1991 census with a particulars emphasis to identify
large decennial variations are specified.
Urban population as per 2001 census
The detailed particulars of Urban Population existing in the 8 Towns
(Municipalities) are mentioned in herewith there is significant increase of Urban
Population in four (4) towns viz., Tadepalligudem, Tanuku, Bhimavaram, Palacole
From 15.48per cent to 33.90per cent, whereas very marginal increase is there in the
remaining four towns viz., Eluru, Kovvuru, Nidadavole, Narasapuram from 1.38per
cent to 9.18per cent.
Caste and Social Structure
The principal religious groups in the district, as in the State, are Hindus,
Muslims and Christians. With 92.19 per cent Hindus constitute an overwhelming
majority of the district population, Christians, Muslims and others account for the
rest. All of them are largely based in rural areas although a quarter percentages of
Muslims and Christians live in urban areas compared to Hindus.
The Hindus are further divided into many castes and numerous sub-divisions
or sub-castes. The sub-caste is often the effective local caste unit which may be
confined to a few villages or a taluk or district. The numerically important castes in
West Godavari District are Harijan (Scheduled Caste), Kapu, Telaga peasants and
tenants), Kamma (landlords and peasants), Brahmins (priests and bureaucrats), Golla
(herdsmen), Chakali (washermen)and Kshatriyas (landlords and peasants). Along with
theses several tribals mainly inhabiting the agency areas, Christians and Muslims also
function as separate caste-like groups. In this regard an attempt has been made to
assess the numerical strength of each caste based on the 1911 Census. Projections
have been made here on the basis of the 1911 Census data.
Considering the occupations of various castes it has been observed that the
Vysyas of the district are for example largely engaged in trade and agriculture and
331
some in money-lending. The Kshatriyas, Brahmins, Kapus, Kammas, Velamas and
Reddis distributed allover the district are largely land-owners and cultivators. The
Kapus are widely diffused cultivating caste and a majority of them are ordinary
cultivators. The Madigas and Malas who form the two principal sub-castes among
Harijans are largely labourers, both agricultural and non-agricultural. Tanning and
shoe making are also pursued by considerable number of Harijans.
There are also some other groups associated with distinct professions or
trades. For instance Yadavas are primarily a caste of grazers and cowherds. Many of
them have taken of late to cultivation and trade. The Idigas now called Settibalijas are
engaged in toddy-tapping and Padma Salis are the weaver caste.
There are also some other castes known as Viswa-brahmins, Rajakas (washer
men), Mangalis (barbers), Kummaris (potters) and Vadderas (earth-diggers and stone
cutters). Considerable number of fishermen are also found in the district.
Brahmin, Kshatriya, Kamma, Kapu and Vysy castes are considered forward
communities in the district, of these, the Brahmins were politically active till about
1940 when they were finally relegated to the background by the newly emerging
cultivating communities like Kammas, Kshatriyas and Kapus. Kammas and
Kshatriyas though numerically less in the district, have been wielding much political
power in the district of West Godavari. For several generations, political leadership
has been drawn mainly from Kammas and Kshatriyas only. In recent years Kapus
have been claiming their due share. The extent of political dominance of these three
upper peasant castes can be gauged from the last Assembly election results from the
District of West Godavari. Of a tote1 of 13 general seats 12 seats were won by these
three upper castes. The fact that all the Zilla Parishad Chairmen elected so far have
also belonged to these three castes only. These three castes in addition to the
Brahmins played a prominent role during the freedom struggle. According to Prof. M.
Venkataarangaiya the freedom movement in Andhra was sphearheaded by the people
in the prosperous districts of Godavari, Krishna, Guntur and Nllore.

332
Administrative units of the District
The District comprises four Revenue Divisions viz., Eluru, Kovvur,
Narasapuram and Jangareddigudem with 16 Mandals, 12 Mandals, 12 Mandals and 6
Mandals respectively which comes to 46 Mandals, separately for Revenue and
Panchayat Raj with effect from 25-05-1985 in place of 12.erstwhile taluks and 16
Panchayat Samithies with the objective of bringing the administration to the doorsteps
of the people. They started functioning from 15-01-1987 besides, 78 Municipalities
and 1 Corporation are in position at Tadepalligudem, Kovvur, Nidadavole, Tanuku,
Narasapuram, Bhimavaram and Municipal Corporation, Eluru.
There are a total of 887 Gram Panchayats in the district, of which 206 are
notified Gram Panchayats and remaining 681 are non notified Gram Panchayats.
Industries
Rice, Sugar, Jute, Ceramic, Oil, Textile, Chemicals, Flour, Food processing,
Agarbathi, Brick, Knittings, Coir Industries etc., are the large, medium and Small
Scale Industries in the District.
Forestry
The total Forest area in the District accounts for 81,195 hectares; forming
10.41 per cent of the total geographical area. The species grown are Bamboos and
other wood useful for timber, fuel and other minor forests produce like Adda leaves,
Beedi leaves, Soa-pnuts, Tamarind, Honey and Fruits. In Polavaram, Buttayagudem,
Jeelugumilli mandals the coverage of area under forest that appear in Pedavegi,
Chintalapudi, T.Narasapuram, Lingapalem, Kamavarapukota are of shrub types.
The net area cultivated forms about 56.61 per cent of the total geographical
area of the district. Out of the net area sown, a large portion of the area is irrigated by
the net work of irrigation canals. The irrigation system of the River Godavari,
irrigates all the mandals in Delta region, whereas Pendyala, Gutala, Vegeswarapuram
pumping scheme irrigates some parts of Kovvur, Nidadavole, Tallapudi, Polavaram,
Gopalapuram Mandals. The irrigation system of River Krishna irrigates entire portion
of Eluru, Pedapady mandals and parts of the area in Denduluru and Bhimadole
333
mandals. In upland tracks, there are irrigation tanks fed by Hill streams besides other
number of Tubewells, Dugwells and M.I.Schemes supplements the irrigation sources.
On par with East Godavari and Krishna Districts, West Godavari District is also
having the distinction of being Rice Granary of Andhra Pradesh. Paddy forming 60per
cent to 65per cent of the total area sown with an average yield of 2,855 Kgs/Hect. in
the district. The other predominent crops also raised in this District are Banana,
Sugarcane, Chillies, Coconut, Maize, Tobacco. Oil palm crop area is also increasing
day by day due to fulfilling the requirement of "Oil production factory" established in
Pedavegi Mandal.
Rivers
Godavari is the important river flowing in this district. This river borders the
entire eastern boundary of the district. At Vijjeswaram, the river breaks into two
branches namely, the Gowthami Godavari (Eastern branch) and Vasista Godavari
(Western branch) and flows towards the south of the District before falling into the
Bay of Bengal near Antarvedi.
The other minor rivers which feed the irrigation tanks in the upland areas are
Tammileru, Yarrakalva, Byneru, Kowada Kalva, Jalleru, Rallamadugu and Gunderu
etc.,
Transport and Communication
Good communication facilities such as mass media transport, telegraph offices
and telephones are essential for economic development. Communication and transport
playa multipurpose role in modern societies in assisting and strengthening the process
of development.
The district is served by a total length of about 169 Kms. of railway track. The
most important railway line in the district is the east-coast 1ine connecting Madras in
the South with Calcutta in the east. It traverses the taluks of Eluru, Tadepalligudem.
Nidadavolu and Kovvuru in the district for a total distance of about 92 Kms. Another
line connecting Gudivada in Krishna District with Bhimavaram (meter gauge line)
was opened in September, 1928 and runs for a distance of about 20 Kms. In 1929, the
334
77 Km. broad gauge line connecting Nidadavole with Narsapuram was inaugurated
and this line traverses the taluks of Kovvur, Tanuku, Bhimavaram and Narsapuram.
The district has a satisfactory network of road and rail communications. All
the 10 towns in the district are well-connected by buses. The district has a total
mileage of 2,021 Kms. National Highway No.5 connecting Madras with Calcutta for a
total distance of about 96 kms. The Public Works Department is also maintaining
about 217.2 Kms. or State Highways, 842 Km. of major district roads and 16.8 Km.
of other district roads. The Andhra Pradesh Road Transport Corporation has extended
its operations to more than 90 per cent villages of the district. Only in some routes,
private buses are being operated.
The air-strips located near Pedavegi in Eluru Taluk and Tadepalligudem are
now in disuse. However, the air transport of Gannavaram (Krishna District) is the
nearest and 40 kilometers away from the district headquarters. Eluru, Narsapuram,
Madhavipalem located near the mouth of the Vasishta, arm of the river Godavari were
considered to be the important inland ports. The district has navigation facility
through the river Godavari providing cheap cargo and passenger facility. Ferries are
also maintained at some of the important places in all seasons. According to 1991
Census, there are 310 cinema halls out of which 200 are permanent theatres. 21 are
semi-permanent and the remaining 89 are temporary theatres in this district.
Education
That the district is quite advanced in the matter of education is quite obvious
from the fact that the 1991 Census classified that 45.45 per cent of the district
population is literate as against the State average of 37.59 per cent. The progress of
literacy in the district during the last 9 decades (from 1901 to 1991) compares well
with all the district of Andhra Pradesh except Hyderabad. The high per cent of
literacy can be attributed to the presence of dominant peasant castes like Kammas,
Kapus and Kshatriyas and the general advancement of the district. The growth of
literacy among women is also very high as is evident from the fact that it rose from
0.78 in 1901 to 40.18 per cent in 1991.
335
It appears however that the literacy rate has increased tremendously in the
years after Independence with the introduction of Panchayati Raj the management of
primary and secondary become one of its statutory functions and therefore a large
number of schools were started in the district, By the end of 1991 there were 2,342
primary schools, 234 upper primary schools, 299 high schools, 27 junior colleges, 17
degree colleges, 22 professional colleges, 5 post-graduate centres and 26 residential
colleges. The total number of students enrolled in the district is 1,21,637 out of which
68,417 are boys and 53,220 are girls.
Industrial Panorama
As far as the industries are concerned, the District is categorized as one of the
most advanced districts in Andhra Pradesh. It has well-developed infrastructural
facilities like electricity, communication and transportation. And it is one of the
districts with 100per cent electrification. The importance of electricity to industry can
be highlighted from the fact that it is the basic requirement to any industry. The
district though it has all the infrastructura1 facilities it could not develop until 1952
and the district started developing with the implementation of national plans as well
as with the establishment of Andhra Sugars, Among the medium and large scale
industries Sri Krishna Jute Mills Limited, Eluru ; Andhra
Sugars Limited, Tanuku, Delta Paper Mills, Vendra, Jaipur Sugar Company
Limited, Chagallu ; Messers Foods, Fats and Fertilizers Limited, Tadepalligudem; Sri
Akkamamba Textiles limited, Tanuku, Sri Satyanarayana Spinning Mills Limited,
Tanuku are worth-mentioning. The investment in all these industries is approximately
350 crores providing employment nearly 52,500 workers. All these industries are
concentrated in delta area and most of them are agro-based. The industries in the
small scale sector are also mostly agro-based as agricultural commodities support
nearly one-third of the total industrial units now functioning in the district. As a
whole the small scale sector has been providing employment to 37,520 persons. The
industries both in the large and small scale employ significant number of people.
Consequently there is an inflow of migrants from the neighbouring districts and
outside the State.
336
Handloom weaving is an important cottage industry of the district. The
Taluks of Narsapuram, Tanuku, Eluru, Tadepalligudem, Bhimavaram and Nidadavole
are famous for this industry. The main products of this industry are coarse cloth of
hand-spun yarn and fine cloth woven with mill yarn. The carpets of Eluru are known
throughout the world for their gaiety and workmanship. Crochet laces are exported to
U.K., U.S.A., Canada, France and Australia. The annual turnover from this industry
is amount 15 crores and the revenue from exports is 5 crore.
Fishery
With a 16 Kms long coast and a number of other perennial water sources,
finishing is an important non-agricultural industry. The sources of fishery are the
Godavari river, the Kolleru lake, the Upputeru besides canals and a good number of
tanks. The Vaddis and the Angikula Kshatriyas are the communities of the district
generally engaged in fishing. Presently 9,140 persons are engaged in fisheing. The
fishermen formed themselves into 66 co-operatives by the end of 1981. All these co-
operative societies are concentrated at Eluru, Narsapuram, Kovvuru, Tanuku,
Bhimavaram, Tadepalligudem, Chintalapudi and Polavaram. Besides the above, fish
forms were established at Badampudi, Kovvli, Polavaram, Tanuku, Narsapuram,
Eluru and Peda Amiram in the district which are under the control of Fisheries
Department, Govt. of Andhra Pradesh. All these developmental activities are being
undertaken by the government of Andhra Pradesh. The fish industry has made deep
inroads in the district. Altogether the district is not only self-sufficient in fishery
wealth but also exports the fish to other cities countries. It is estimated that the fish
industry earns 30 crores per year and about 50,000 acres of land has been converted
into fish tanks in recent years. Recently Prawn culture was also started in many areas
vigorously.
Tourism potential in West Godavari District
There is enormous potential for Tourism in West Godavari District, because of
its location of religious Monuments/Temples and endowed with rich historical or
archaeological heritage. The places of religious temples/institutions and
historical/archaeological significance in the District are presented briefly hereunder.
All efforts are afoot by the District Authorities for bringing about overall tourism
337
development in the District in view of its vast potentiality and ample scope in this
regard.
1. Bhimavaram
Bhimavaram is the Mandal Hqs. The place is noted for a big Naturopathic
Hospital located in an extensive garden. Of the several temples at the place,
Bhimeswara and Someswara are important. The Sivalingam in the temple of
Bhimeswara is said to be Swayambhu Lingam (Self manifested). The Sivalingam in
Gunupudi Someswara temple is also said to be a Swayambhu. The place is one of the
five Aramas (Pancharamas); the other four being Amaravathi (Gunturu), Bheemarama
near Samarlakota and Draksharamam both in East Godavari and Kshira
Ramalingeswara of Palakol in the District.
2. Dwaraka Tirumala
This is a place of Hindu religious importance owing to the temple of Lord
Venkateswara which also locally known as "CHINA TIRUPATHI" at a distance of
40 Kms from Eluru.
3. Palacole
Palacole formerly known as Palakota and Palakolanu is situated at a distance
of 10 Kms from Narasapur. The most important item of interest in this town is the
Kshira Ramalingeswara Temple which is one of the Pancharamas.
4. Pattisam
Pattisam is situated at a distance of 25 Kms from Kovvuru Railway Station. It-
is one of the ancient and sacred places in South India. The religious importance is due
to the shrines of Veerabhadra and Bhavanarayana situates on the Devakuta Parvatam
overlooking the Papi Hills in the heart of River Gowthami a branch of River
Godavari.
5. Juttiga and Natta Rameswaram (Dakshina Kasi)
Juttiga & Natta Rameswaram are twin Villages assumed religious importance
on account of the temples of Swayambhulingam known as Sri Uma Vasuki Ravi
338
Someswara Swamy at Juttiga Village and the Lingam which is made of shells and
cones named as Natta Ramalingeswara Swamy at Natta Rameswaram Village. Every
"SIVARATHRI" Festival day "Edurukolotsavam" is being celebrated at the border
place of two villages. Thousands of Piligrims attend to that celebrations. It is one of
the important piligrim centre in the District.
6. Penugonda
It is Mandal Headquarter. The importance of the place is believed to be the
birth place of Kanyakaparameswari, the goddess of the Vaisyas. The temple of
Kanyakaparameswari is the most important religious institution in the town.
7. Pedavegi
Pedavegi originally known as Vengi. The Capital of the Salankayanas,
Vishnukundins and the East Chalukyas and was a flourishing city at the time of
'Satavahanas. It is a petty village now with a few visible landmarks.
8. Khandavalli
This village is situated at a distance of 12 Kms from Tanuku. It is a very
ancient village situated on the banks of Vasista Godavari. This village is also known
as panchalingakshetram owing to the existance of five Sivalingams in the temple of
Markandeswara - Mrukandeswara. This strange phenomena of five lingams in a
temple is found only at Benarus and Rajahmundry. Hence this place is considered to
be of religious importance.
9. Tanuku
Tanuku is the Headquarters of the Mandal and it is said to be the birth place of
Adikavi Nannaya Bhattaraka, who undertook the translation into telugu of
Mahabharatha written in Sanskrit by Sage Vedavyasa.
10. Kolleru Lake
Kolleru lake is one of the fresh water and natural formed big lake in the
country, which is partly situated in West Godavari District and the remaining part is
339
situated in Krishna District. Four decades back, it was found that nearly 193 verities
of Birds were existed here. Now most of the verities of Birds are not seen there due to
pollution of water and atmosphere due to various reasons. Some of the verities of
Birds are migrated from thousands of miles distance, viz. from Egypt, Syberia,
Philliphines, Arabia, Australia, .China etc., to this place in the month of October and
again return back in the month of March, April to their concerned countries. Out of
the migrated birds, Gudakonga otherwise local name as "Kolleti Konga" is the
familiar bird. It is one of the beautiful tourist place in the District
11. Jainism and Budhism cultures were also prevailed in some places of the
District
a) Jainism
The Temple of Pradhama Teerthankara, named as Adhinadhudu of Jainism at
Pedamiram Village near Bhimavaram Town and on a big stone image of sitting
posture statue of a Jaina Tirthankara at Penumanchili of Achanta Mandal are samples
of existence of Jainism in West Godavari District. In every year Aniversal day of
Adhinadhudu at Pedamiram Village is being celebrated on Karthika Poornima day in
a grandeur manner.
b) Buddhism
The remains of ancient 'Sangharam' at Jeelakarragudem, H/o Guntupalli
Village of Kamavarapukota Mandal, include a group of Rock-cut Chambers i.e.
Caves, remains of a Brick-built Chaitya Hall and many "Sthupas" in different sizes,
mostly T rock-cut and a few structurals, reveals that Budhism was existed here. some
centuries ago. This place is picturesquely situated amidst hills of scenic beauty. The
history of Guntupalli caves dated back to 200 B.C. Thousands of people are still
visiting this historical place. It is believed that the entire development and extension
of its growth was during the centuries of 2nd B.C. to 3rd A.D. In the entire
Sangharam of this place, either in rock-cuts or in structures, Gowtama Budha picture
impressions are not found. So it is evident that "Heenayanam" Budhist culture i.e.
early ages of Budhist culture was prevailed in this place.
340
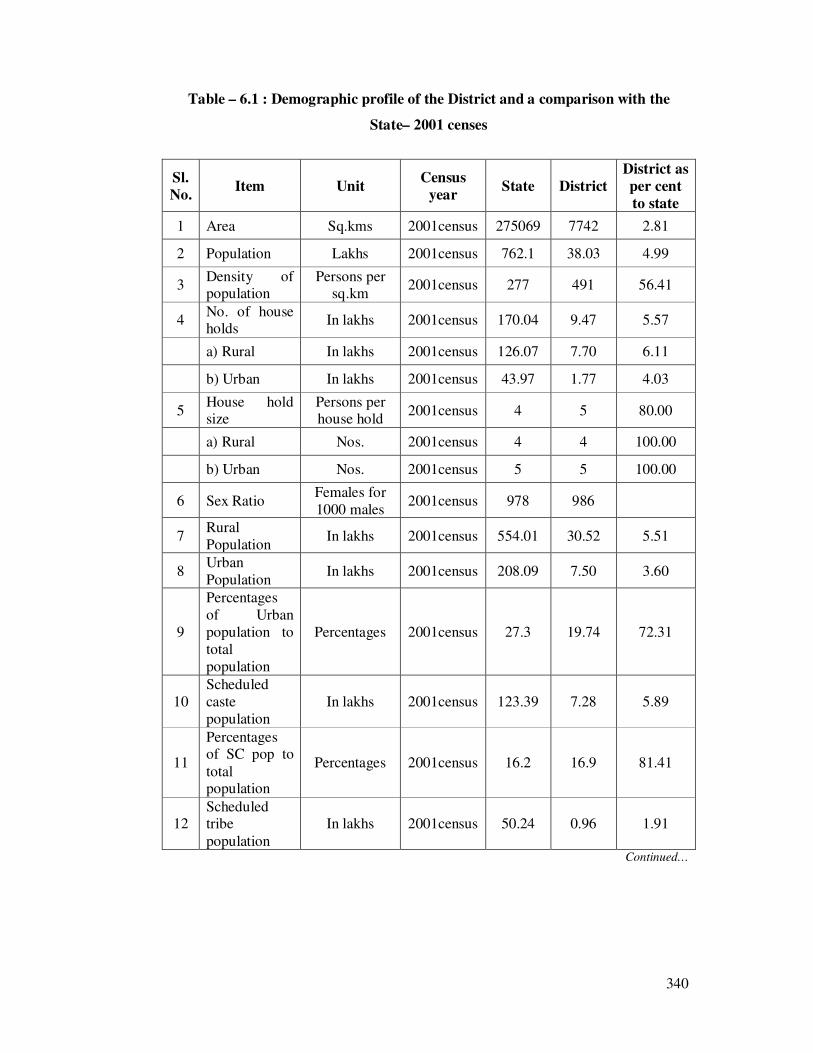
Table – 6.1 : Demographic profile of the District and a comparison with the
State– 2001 censes
Sl.
No. Item Unit
Census
year State District
District as
per cent
to state
1 Area Sq.kms 2001census 275069 7742 2.81
2 Population Lakhs 2001census 762.1 38.03 4.99
3 Density of population
Persons per sq.km
2001census 277 491 56.41
4 No. of house holds
In lakhs 2001census 170.04 9.47 5.57
a) Rural In lakhs 2001census 126.07 7.70 6.11
b) Urban In lakhs 2001census 43.97 1.77 4.03
5 House hold size
Persons per house hold
2001census 4 5 80.00
a) Rural Nos. 2001census 4 4 100.00
b) Urban Nos. 2001census 5 5 100.00
6 Sex Ratio Females for
1000 males 2001census 978 986
7 Rural
Population In lakhs 2001census 554.01 30.52 5.51
8 Urban
Population In lakhs 2001census 208.09 7.50 3.60
9
Percentages
of Urban
population to
total
population
Percentages 2001census 27.3 19.74 72.31
10
Scheduled
caste
population
In lakhs 2001census 123.39 7.28 5.89
11
Percentages of SC pop to
total population
Percentages 2001census 16.2 16.9 81.41
12 Scheduled tribe
population
In lakhs 2001census 50.24 0.96 1.91
Continued…
341
13
Percentages of ST
population to Total pop
Percentages 2001census 6.59 2.34 35.51
14 Literates – Total
population
In lakhs 2001census 399.34 25.07 6.28
15 a) Literacy
rate - Males Percentages 2001census 70.32 49.77 70.78
b) Literacy
rate - Females Percentages 2001census 50.43 69.11 72.97
c) Literacy
rate – Total population
Percentages 2001census 60.47 58.27 96.36
16 a) Workers – Total
In lakhs 2001census 348.94 11.63 3.33
b) Workers – Agriculture
In lakhs 2001census 216.92 8.9 4.10
c) Workers –
Non
Agriculture
In lakhs 2001census 132.02 2.73 2.07
17 Net cropped
Area ‘000’ hect 2008-09 10958 440.3 4.02
18 Net Area
Irrigated ‘000’ hect 2008 4820 3.74 0.08
19 Village
Electrified per cent 2008 100 100 100.00
20 Revenue
Villages Nos.
Census
2001 26613 883 3.32
21 Gramapan-
chayats Nos. 2009 21895 888 4.06
22 Revenue
Mandals Nos. 2009 1128 46 4.08
23 Mandal
Parishads Nos. 2009 1094 46 4.20
24
Schools
including Elementary,
UPS & High Schools
Nos. 2009 97557 3907 4.00
Source : Chief Planning Officer, Eluru, W.G.Dist., Director Population Census,
Director, Directorate of Economics & Statistics, Hyderabad, All Principals in the
District.
342
Demographic profile of the District
Table – 6.1 presents the demographic profile of the district according to 2001
census.
As evident from the table the total area of district is 7742 sq.km constituting
2.81 percent of the total area of the state with a population of 38.03 lakhs constituting
4.99 percent of the total population of the state. Much over the density of population
of the district is 491 persons per sq.km as against 277 persons per sq.km of the total
state.
The total number of households in West Godavari District is 9.47 lakhs as
against 170.04 lakhs of the state and thus constitutes 5.57 per cent of the total state.
The house hold size (persons per house hold) is 5 in the district as against 4 of the
state. No doubt it is 4 in the rural areas and 5 in the urban areas.
The rural house holds are 7.70 lakhs in the district constituting 6.11 per cent of
the total state (126.07 lakhs) on the other hand the urban house holds are the district
(1.77 lakhs) constitutes 4.03 per cent of the total urban population of the state (43.97
lakhs). This shows that, the district is more rural in character. This is further evident
from the fact. The rural population of the district (30.52 lakhs) constitutes 5.51 per
cent of the state total where as the urban population (7.50 lakhs) accounts for only
3.60 per cent of the total urban population of the state (208.09 lakhs). It can be
further seen that, the share of rural population in the district is 80.25 per cent as
against 72.7 per cent in the case of the state. This shows that, the state of Andhra
Pradesh as well as the district under study live in villages.
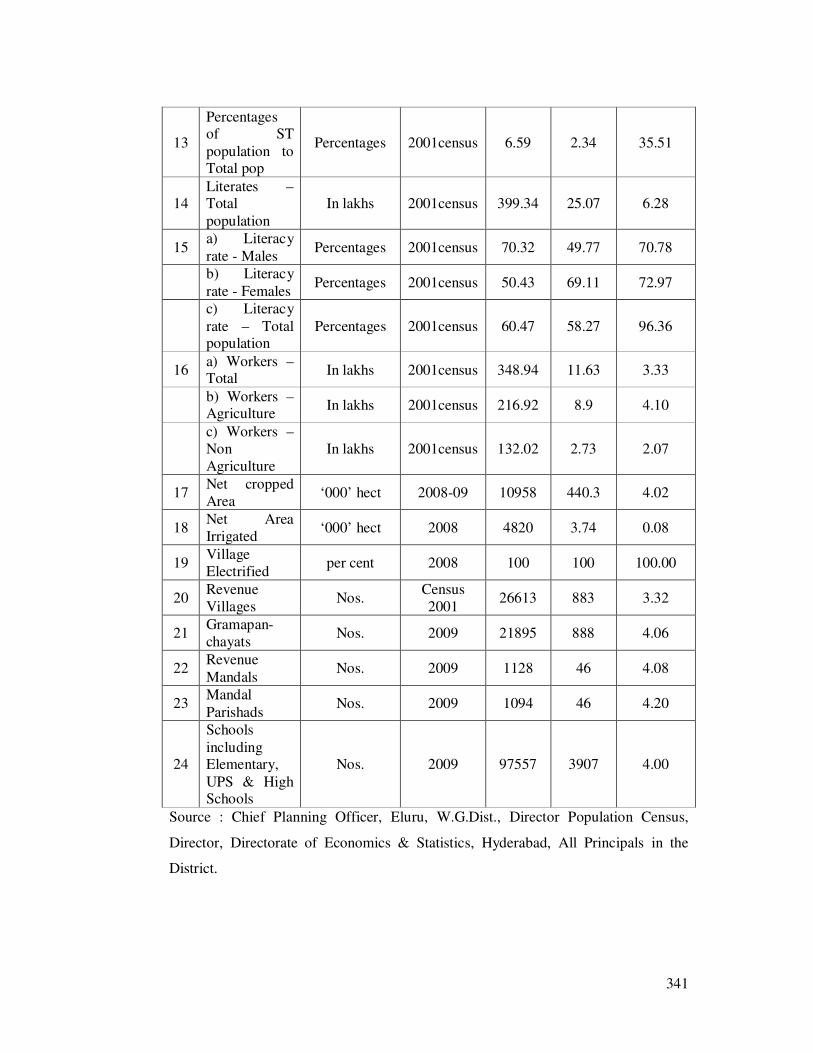
The sex ratio in the district of West Godavari is marginally higher at 986
females for 1000 males as the against 978 of the state more over the literacy rate of
females in 69.11 per cent as against 49.77 per cent of the males. It is as against 50.43
per cent and 70.32 per cent respectively in the case of the total state. Thus the district
stood in a position of pride with respective female literacy. This helps facilitate
empowerment in the desired direction.
343
The district composed of 883 revenue villages with 888 grampanchayat and 46
mandal parishads for local administration. More over there 4 revenue divisions in the
district with 46 revenue mandals out of the total 1128 in the state constituting 4.08 per
cent of the state total.
The status of the district as against the state with respective total area is 2.81
per cent, with respective population 4.99 per cent, number of rural loan holds 6.11 per
cent, rural population 5.51 per cent, scheduled caste population 5.89 population, ST
population 1.19 per cent, total workers 3.3 per cent, net cropped area 4.02 per cent,
net irrigated area 0.08 per cent, revenue villages 3.32 per cent, grampanchayats 4.06
per cent.
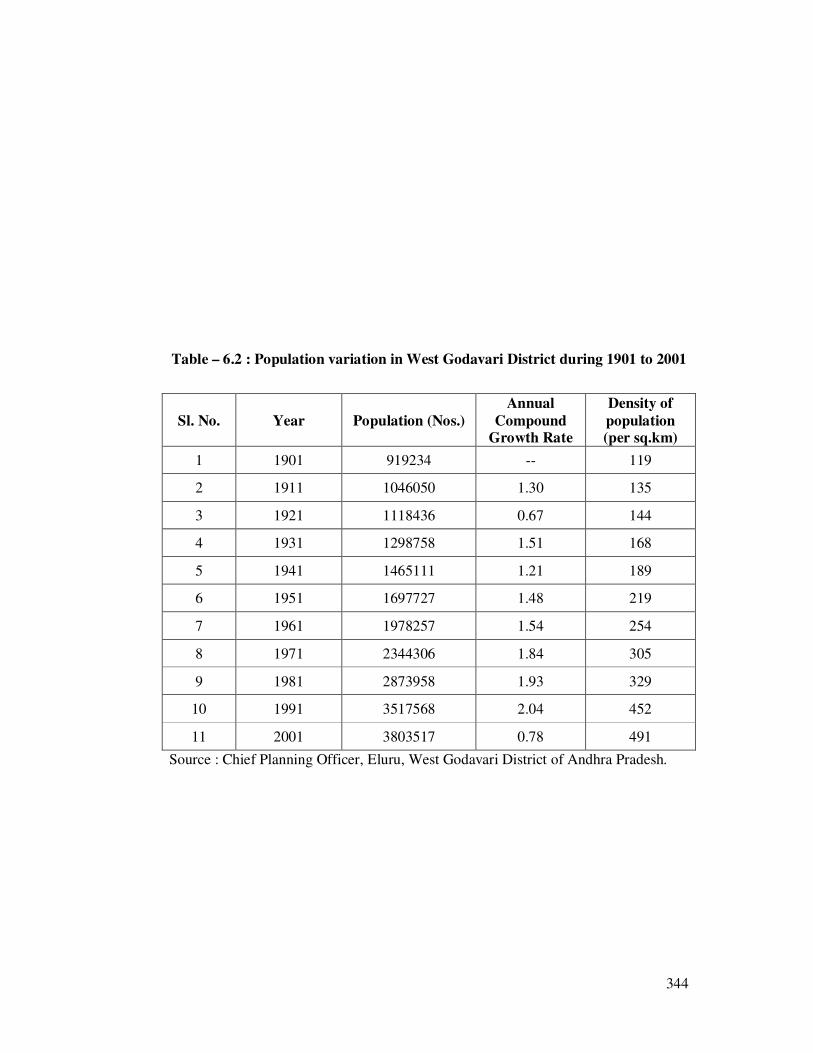
Decennial population variation in the District
West Godavari District in Andhra Pradesh is rich in fertility and stands as the
granary of the state. The district is also rich in populations. The dimensions of
variations in population in the district during the censes periods of 1901 to 2001 are
presented in table-‘6.2’. As evident from the table the population of the district which
was 919234 in 1901 with a density of 119 per sq.km exploded over the decades to
stand at 3803517 with a density of 491 per sq.km. Thus both the total population end
the density of populations in the district increased by leaps and bounds over the period
under review the annual compound growth rate of population in the district between
1901 to 2001 ranged between 0.67 per cent (1921) and 2.04 per cent (1991) it stood at
0.78 per cent by 2001. Moreover the average annual compound growth rate of
population in the district over the last century ending with 2001 is 1.43 per cent.
Land utilization pattern in the District
Table – 6.3 : presents the pattern of land utilization in the West Godavari
District of Andhra Pradesh during 2000-01 to 2008-09. As evident from the table the
net are sown assumes a predominant share of the total geographical area. It is evident
from the fact that the proportion of net area sown in the total geographical area put to
utilization in the District, ranged between 15.67 per cent (2002-03) to 61.37 per cent
(2008-09). Further the land put to non-agricultural uses which were 2.70 lakhs
hectors (14.01 per cent) during 2000-01 stood at 1.11 lakhs hectors (14.34 per cent
344
Table – 6.2 : Population variation in West Godavari District during 1901 to 2001
Sl. No. Year Population (Nos.)
Annual
Compound
Growth Rate
Density of
population
(per sq.km)
1 1901 919234 -- 119
2 1911 1046050 1.30 135
3 1921 1118436 0.67 144
4 1931 1298758 1.51 168
5 1941 1465111 1.21 189
6 1951 1697727 1.48 219
7 1961 1978257 1.54 254
8 1971 2344306 1.84 305
9 1981 2873958 1.93 329
10 1991 3517568 2.04 452
11 2001 3803517 0.78 491
Source : Chief Planning Officer, Eluru, West Godavari District of Andhra Pradesh.
345
during 2008-09). The Forest land which was 2 lakhs hectors (10.38 per cent)
during 2000-01 came down to 0.81 lakhs hectors during 2002-03 continued at the
same level till 2008-09 constituting 10.47 per cent of the total land utilization in the
district. The analysis thus shows that land of the district is monthly utilize for
agriculture as net sown area.
The district of West Godavari the aquaculture has been on the raise. But due
to crop failure, changing climatic conditions, expert rejections due to bacterial loud
etc. the commercial aqua culture as expired a set back over the years. It is as evident
from the fact that, the fish tanks which were to the extent of 0.92 lakh hectors (4.78
per cent of the land utilized) during 2000-01 considerably came down to 0.32 lakh
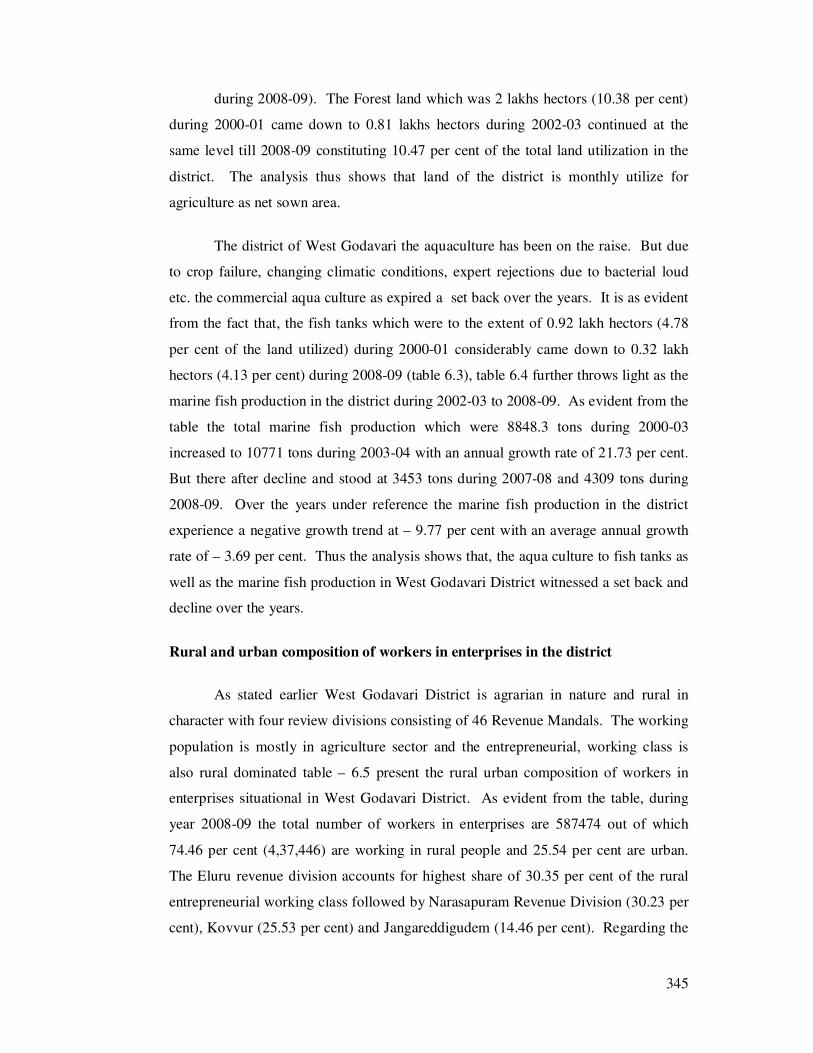
hectors (4.13 per cent) during 2008-09 (table 6.3), table 6.4 further throws light as the
marine fish production in the district during 2002-03 to 2008-09. As evident from the
table the total marine fish production which were 8848.3 tons during 2000-03
increased to 10771 tons during 2003-04 with an annual growth rate of 21.73 per cent.
But there after decline and stood at 3453 tons during 2007-08 and 4309 tons during
2008-09. Over the years under reference the marine fish production in the district
experience a negative growth trend at – 9.77 per cent with an average annual growth
rate of – 3.69 per cent. Thus the analysis shows that, the aqua culture to fish tanks as
well as the marine fish production in West Godavari District witnessed a set back and
decline over the years.
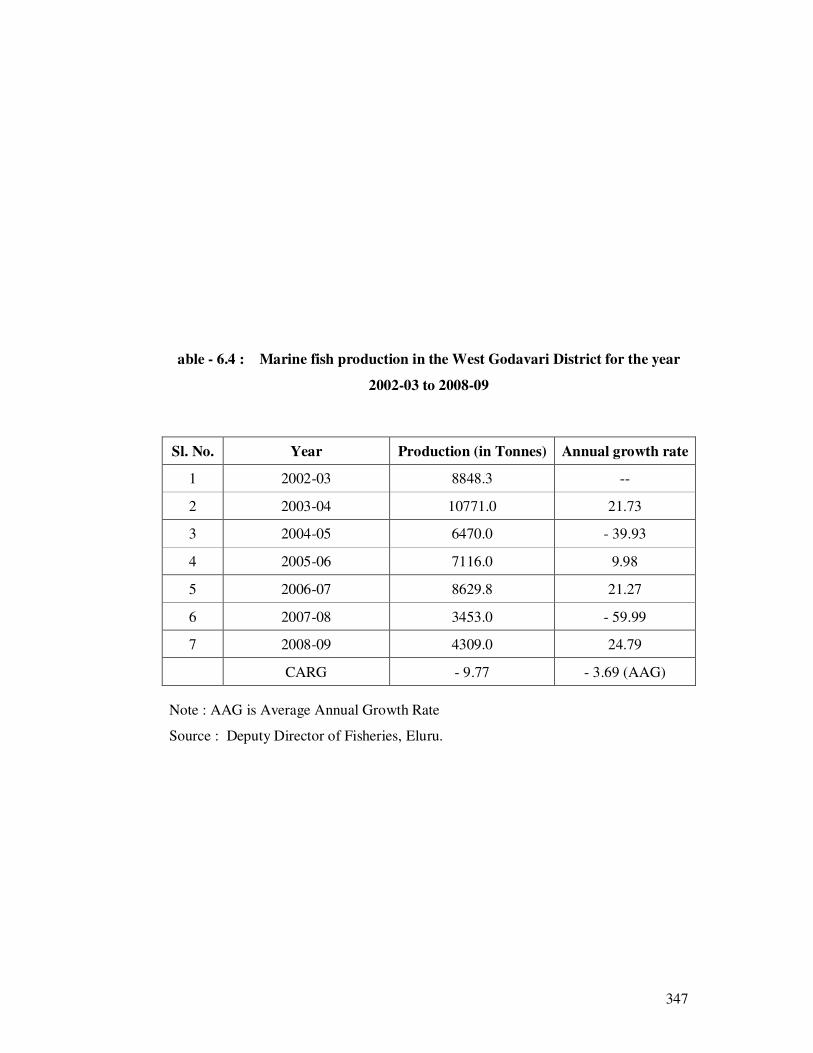
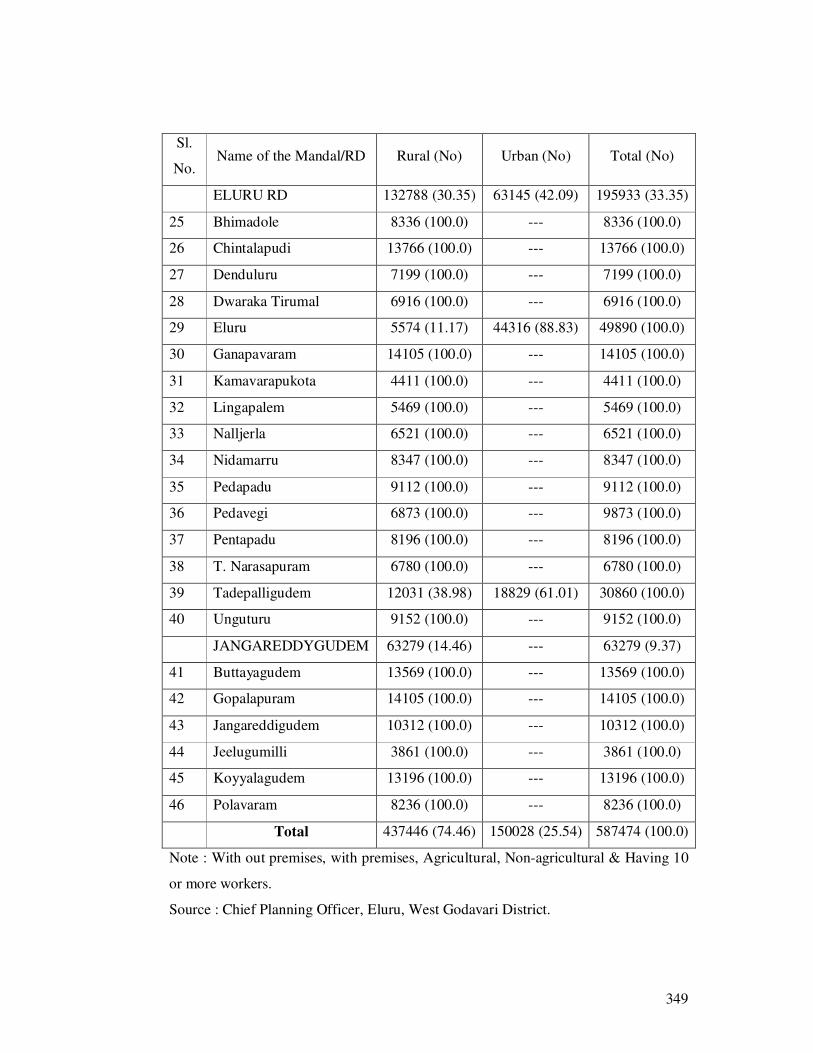
Rural and urban composition of workers in enterprises in the district
As stated earlier West Godavari District is agrarian in nature and rural in
character with four review divisions consisting of 46 Revenue Mandals. The working
population is mostly in agriculture sector and the entrepreneurial, working class is
also rural dominated table – 6.5 present the rural urban composition of workers in
enterprises situational in West Godavari District. As evident from the table, during
year 2008-09 the total number of workers in enterprises are 587474 out of which
74.46 per cent (4,37,446) are working in rural people and 25.54 per cent are urban.
The Eluru revenue division accounts for highest share of 30.35 per cent of the rural
entrepreneurial working class followed by Narasapuram Revenue Division (30.23 per
cent), Kovvur (25.53 per cent) and Jangareddigudem (14.46 per cent). Regarding the

346
Table – 6.3 : Land utilization in West Godavari District 2000-01 to 2008-09
(Area in Lakh Hectors) S.
No. Category
Year
2000-01 2001-02 2002-03 2003-04 2004-05 2005-06 2006-07 2007-08 2008-09
1. Forest 2.00 2.00 0.81 0.81 0.81 0.81 0.81 0.81 0.81
(10.38) (10.38) (10.38) (10.38) (10.38) (10.38) (10.47) (10.47) (10.47)
2. Barrent Uncultivable Land 1.01 1.01 0.41 0.41 0.41 0.41 0.41 0.41 0.41
(5.24) (5.24) (5.26) (5.26) (5.26) (5.26) (5.30) (5.30) (5.30)
3. Land put to non-Agriculutral
uses
2.70 2.70 1.10 1.10 1.10 1.10 1.10 1.11 1.11
(14.01) (14.01) (14.10) (14.10) (14.10) (14.10) (14.21) (14.34) (14.34)
4. Permanent Pastures & other
Crazing Lands
0.34 0.34 0.14 0.14 0.14 0.14 0.14 0.14 0.14
(1.77) (1.77) (1.79) (1.79) (1.79) (1.79) (1.81) (1.81) (1.81)
5. MSC tree crops & groves not
included in net area sown
0.20 0.20 0.08 0.08 0.08 0.07 0.08 0.08 0.08
(1.04) (1.04) (1.03) (1.03) (1.03) (0.90) (1.03) (1.03) (1.03)
6. Culturable Waste 0.58 0.52 0.21 0.21 0.20 0.19 0.20 0.19 0.18
(3.01) (2.70) (2.29) (2.69) (2.56) (2.44) (2.58) (2.45) (2.33)
7. Other fallow lands 0.22 0.25 0.17 0.10 0.10 0.09 0.06 0.05 0.05
(1.14) (1.30) (2.18) (1.28) (1.28) (1.15) (0.78) (0.65) (0.65)
8. Current fallows 0.57 1.13 0.49 0.30 0.26 0.22 0.30 0.24 0.21
(2.96) (5.87) (6.28) (3.85) (3.34) (2.82) (3.88) (3.10) (2.71)
9. Net area sown 10.70 10.11 4.03 4.26 4.32 4.41 4.32 4.38 4.75
(55.56) (52.49) (51.67) (54.62) (55.38) (56.54) (55.81) (56.59) (61.37)
10. Fish Tanks 0.92 0.96 0.35 0.39 0.37 0.34 0.33 0.33 0.32
(4.78) (0.96) (4.49) (5.00) (5.00) (4.36) (4.26) (4.26) (14.13)
11. Geographical Area 19.26 19.26 7.80 7.80 7.80 7.80 7.74 7.74 7.74
(100.0) (100.0) (100.0) (100.0) (100.0) (100.0) (100.0) (100.0) (100.0)
Source : Chief Planning Officer, Eluru, West Godavari Dist.
347
able - 6.4 : Marine fish production in the West Godavari District for the year
2002-03 to 2008-09
Sl. No. Year Production (in Tonnes) Annual growth rate
1 2002-03 8848.3 --
2 2003-04 10771.0 21.73
3 2004-05 6470.0 - 39.93
4 2005-06 7116.0 9.98
5 2006-07 8629.8 21.27
6 2007-08 3453.0 - 59.99
7 2008-09 4309.0 24.79
CARG - 9.77 - 3.69 (AAG)
Note : AAG is Average Annual Growth Rate
Source : Deputy Director of Fisheries, Eluru.
348
Table - 6.5 : Rural and urban composition of workers in enterprises during
2008-09
Sl.
No. Name of the Mandal/RD Rural (No) Urban (No) Total (No)
Narasapuram RD 132252 (30.23) 59955 (39.96) 192207 (32.72)
1 Achanta 7830 (100.0) --- 7830 (100.0)
2 Akiveedu 14252 (100.0) --- 14252 (100.0)
3 Bhimavaram 11897 (27.08) 32039 (72.92) 43936 (100.0)
4 Kalla 11398 (100.0) --- 11398 (100.0)
5 Mogalthur 15963 (100.0) 13098 (44.96) 29135 (100.0)
6 Narasapuram 16037 (55.04) 14818 (71.82) 20633 (100.0)
7 Palakole 5815 (28.18) --- 5815 (28.18)
8 Palakoderu 10780 (100.0) --- 10780 (100.0)
9 Poduru 7500 (100.0) --- 7500 (100.0)
10 Undi 8357 (100.0) --- 8357 (100.0)
11 Veeravasaram 11835 (100.0) --- 11835 (100.0)
12 Yelamanchili 10588 (100.0) --- 10588 (100.0)
KOVVURU RD 111689 (25.53) 26928 (17.95) 138617 (23.59)
13 Attili 10693 (100.0) --- 10693 (100.0)
14 Chagallu 6271 (100.0) --- 6271 (100.0)
15 Devarapalli 11058 (100.0) --- 11058 (100.0)
16 Iragavaram 12475 (100.0) --- 12475 (100.0)
17 Kovvuru 5698 (53.35) 4983 (46.65) 10681 (100.0)
18 Nidadavole 8026 (52.70) 7204 (47.30) 15230 (100.0)
19 Penugonda 15095 (100.0) --- 15095 (100.0)
20 Penumantra 7436 (100.0) --- 7436 (100.0)
21 Peravali 10447 (100.0) --- 10447 (100.0)
22 Tanuku 6765 (31.46) 14741 (68.54) 21506 (100.0)
23 Tallapudi 9617 (100.0) --- 9617 (100.0)
24 Undrajavaram 8108 (100.0) --- 8108 (100.0)
Continued…
349
Sl.
No. Name of the Mandal/RD Rural (No) Urban (No) Total (No)
ELURU RD 132788 (30.35) 63145 (42.09) 195933 (33.35)
25 Bhimadole 8336 (100.0) --- 8336 (100.0)
26 Chintalapudi 13766 (100.0) --- 13766 (100.0)
27 Denduluru 7199 (100.0) --- 7199 (100.0)
28 Dwaraka Tirumal 6916 (100.0) --- 6916 (100.0)
29 Eluru 5574 (11.17) 44316 (88.83) 49890 (100.0)
30 Ganapavaram 14105 (100.0) --- 14105 (100.0)
31 Kamavarapukota 4411 (100.0) --- 4411 (100.0)
32 Lingapalem 5469 (100.0) --- 5469 (100.0)
33 Nalljerla 6521 (100.0) --- 6521 (100.0)
34 Nidamarru 8347 (100.0) --- 8347 (100.0)
35 Pedapadu 9112 (100.0) --- 9112 (100.0)
36 Pedavegi 6873 (100.0) --- 9873 (100.0)
37 Pentapadu 8196 (100.0) --- 8196 (100.0)
38 T. Narasapuram 6780 (100.0) --- 6780 (100.0)
39 Tadepalligudem 12031 (38.98) 18829 (61.01) 30860 (100.0)
40 Unguturu 9152 (100.0) --- 9152 (100.0)
JANGAREDDYGUDEM 63279 (14.46) --- 63279 (9.37)
41 Buttayagudem 13569 (100.0) --- 13569 (100.0)
42 Gopalapuram 14105 (100.0) --- 14105 (100.0)
43 Jangareddigudem 10312 (100.0) --- 10312 (100.0)
44 Jeelugumilli 3861 (100.0) --- 3861 (100.0)
45 Koyyalagudem 13196 (100.0) --- 13196 (100.0)
46 Polavaram 8236 (100.0) --- 8236 (100.0)
Total 437446 (74.46) 150028 (25.54) 587474 (100.0)
Note : With out premises, with premises, Agricultural, Non-agricultural & Having 10
or more workers.
Source : Chief Planning Officer, Eluru, West Godavari District.

350
urban workers in the enterprises it is again Eluru Revenue Division that accounts for
the grater share of 42.09 per cent followed by Narasapuram 39.96 per cent and
Kovvuru 17.95 per cent. Further, excepting in the case of urban oriented mandals like
Bhimavaram, Narasapura, Palakole, Kovvur, Nidadavole, Tanuku, Eluru, and
Tadepalligudem the working population in enterprises in all other mandals is
absolutely rural. A mandal wise analysis of the rural urban composition further
reveals that with regard to the share of urban entrepreneurial working class Eluru
mandal stands at the top with 88.83 per cent followed by Bhimavaram (72.92 per
cent), Palakole (71.82 per cent), Tanuku (68.54 per cent) and Tadepalligudem (61.01
per cent). The analysis clearly shows that in West Godavari District the
entrepreneurial working class is also rural in their character and profile in majority of
the mandals.
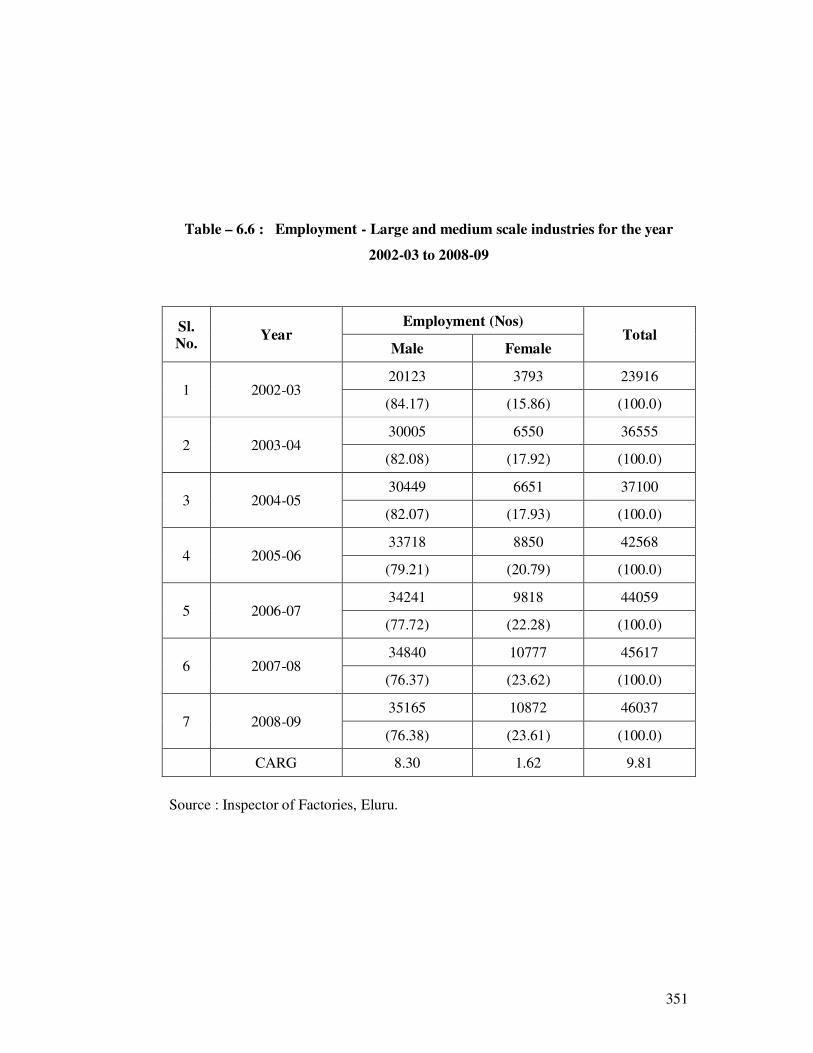
The employment scenario in the large and medium scale industries
The composition of total employment in the large and medium scale industries
(L & MSI) in the district is presented in table – 6.6 for the years 2002-03 to 2008-09
as evident from the table out of the total employment of 23916 during 2002-03 males
accounted for a share of 84.14 per cent (20123) followed by female (3793) by 2008-
09 out of the total employment 46037 males constituting 76.38 per cent (35165) as
against 23.61 per cent female employees (10872). This shows that, the employment
in the L & MSI in the district increased over the years under reference. More over the
proportion of female employees in the total employment in the L & MSI witnessed a
marked increase from 15.86 per cent (2002-03) to 23.65 per cent (2008-09) in the
district.
A further analysis shows that, the total employment in the L & MSI in the
district went up at a compute annual growth rate of 9.81 per cent during 2002-03. It is
as against 8.30 per cent with respective males and 1.62 per cent with respective
females. This further shows that, the total employment as well as the employment of
males in the L & MSI experienced an increase both absolutely and relatively at a
higher pace over the years. But the rate of increase with respective female
employment is relatively low at 1.62 per cent.
351
Table – 6.6 : Employment - Large and medium scale industries for the year
2002-03 to 2008-09
Sl.
No. Year
Employment (Nos) Total
Male Female
1 2002-03 20123 3793 23916
(84.17) (15.86) (100.0)
2 2003-04 30005 6550 36555
(82.08) (17.92) (100.0)
3 2004-05 30449 6651 37100
(82.07) (17.93) (100.0)
4 2005-06 33718 8850 42568
(79.21) (20.79) (100.0)
5 2006-07 34241 9818 44059
(77.72) (22.28) (100.0)
6 2007-08 34840 10777 45617
(76.37) (23.62) (100.0)
7 2008-09 35165 10872 46037
(76.38) (23.61) (100.0)
CARG 8.30 1.62 9.81
Source : Inspector of Factories, Eluru.
352
Table – 6.7 : Small scale industries in West Godavari District for the year
2002-03 to 2008-09
Sl.
No. Year No. of Units
Employment
(Nos)
Per unit
employment
(Nos)
1 2002-03 37 647
17.49 ( - ) ( - )
2 2003-04 50 677
13.54 (35.13) (4.64)
3 2004-05 44 593
13.48 (-12) (-12.41)
4 2005-06 64 735
11.48 (45.45) (23.95)
5 2006-07 78 1380
17.69 (21.87) 87.75
6 2007-08 61 1096
17.97 (-21.79) (-20.58)
7 2008-09 84 1191
14.18 (37.70) (8.67)
CARG 1.24 0.91
Note : Figures in parenthesis indicate Average Annual Growth Rate
Source : G.M. Industries, Eluru.
353
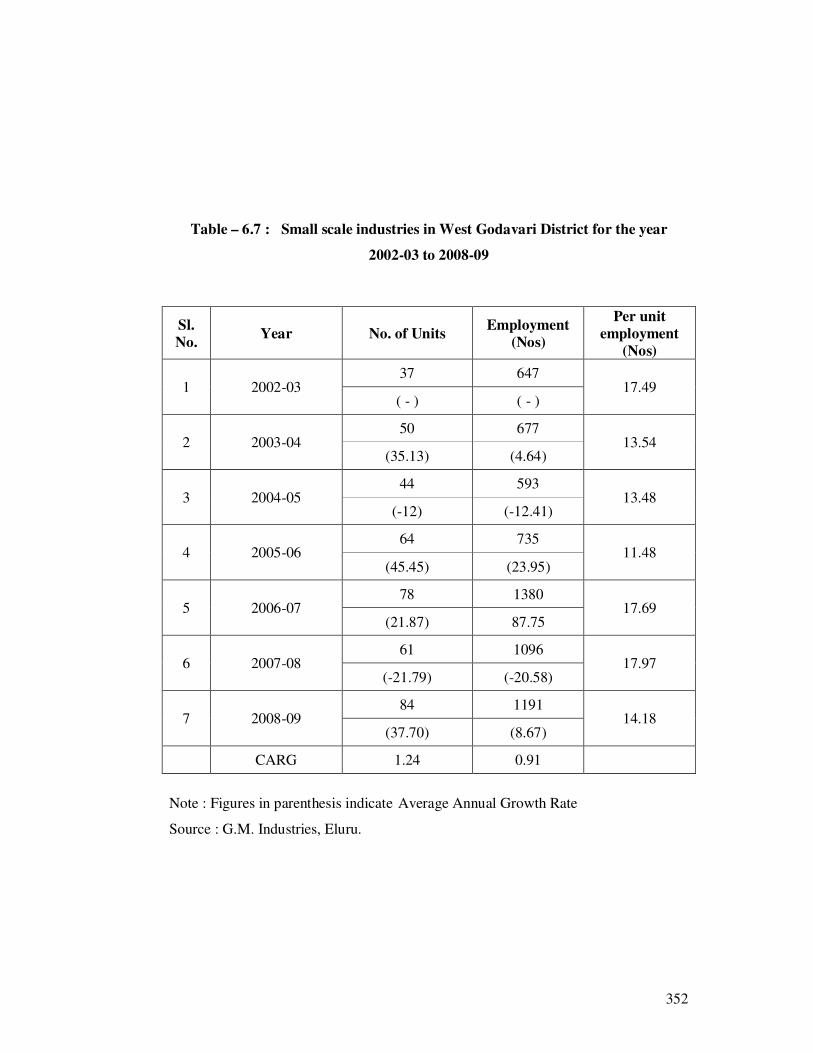
Small scale industries in the district
The scenario of small scale industries in terms of number of units and
employment during 2002-03 to 2008-09 presented in table – 6.7. As evident from the
table the number of SSI units which were 37 (2002-03) increased to 84 (2008-09)
with a growth rate of 1.24 per cent. On other hand the employment in SSI sector
which was 647 during 2002-03 stood at 1191 (2008-09) with a growth rate of only
0.91 per cent. Thus it can be observed the number of SSI units in the district, during
2002-03 to 2008-09, experience a relatively higher growth rate at 1.24 per cent
compare to the employment in small scale units at 0.91 per cent. The declining
employment potential may be due to the increasing mechanization an qusterity
orientation. It is also evident from the fact, that, the per unit employment in the SSI
sector in the district which was 17.49 (2002-03). Through increased to 17.97
(2007-08) stood at 14.18 (2008-09).
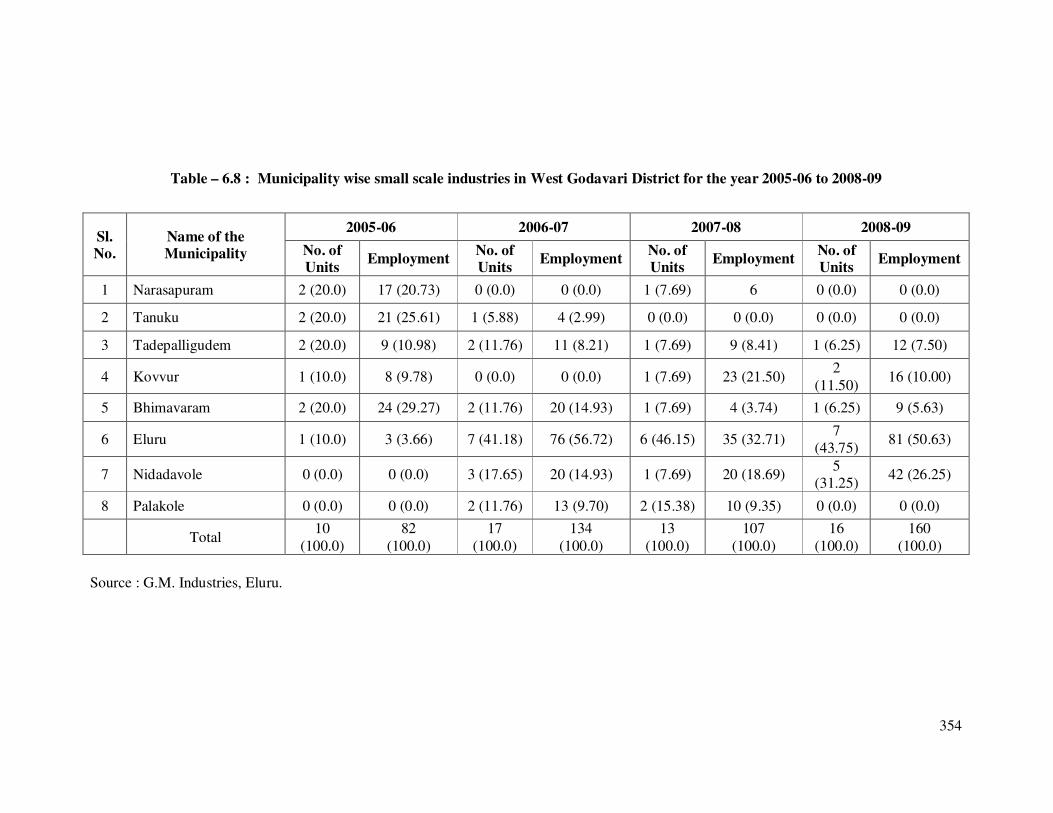
Municipality-wise distribution of SSI sector
Table – 6.8 presents the municipality-wise distribution of the SSI sector in the
district during 2005-06 to 2008-09. There are 8 municipalities in the district during
2005-06 the municipal area had a total number of 10 SSI units with an employment of
82 per cent. By 2008-09 the number of units stood at 16 with a total employment of
160. The municipality-wise spread of the number of units and the employment
further reveals that, during 2005-06, Narasapuram, Tanuku, Tadepalligudem and
Bhimavaram municipalities accounted for 20 per cent each of the total SSI units.
With respective employment Bhimavaram Municipality area accounted for (29.24 per
cent) followed by Tanuku (25.61 per cent) Narasapuram (20.73 per cent)
Tadepalligudem (10.98 per cent) and Kovvur (9.76 per cent). By 2008-09 they
observed a shift in the municipality wise distribution of a number of units as well as
employment. It is evident form the fact that during 2008-09, Eluru assumed a major
proportion 43.75 per cent of the number of units and 50.63 per cent of the total
employment in the SSI sector. It is followed Nidadavole with 31.25 per cent and
26.25 per cent with regard to the number of SSI units and employment respectively.
354
Table – 6.8 : Municipality wise small scale industries in West Godavari District for the year 2005-06 to 2008-09
Sl.
No.
Name of the
Municipality
2005-06 2006-07 2007-08 2008-09
No. of
Units Employment
No. of
Units Employment
No. of
Units Employment
No. of
Units Employment
1 Narasapuram 2 (20.0) 17 (20.73) 0 (0.0) 0 (0.0) 1 (7.69) 6 0 (0.0) 0 (0.0)
2 Tanuku 2 (20.0) 21 (25.61) 1 (5.88) 4 (2.99) 0 (0.0) 0 (0.0) 0 (0.0) 0 (0.0)
3 Tadepalligudem 2 (20.0) 9 (10.98) 2 (11.76) 11 (8.21) 1 (7.69) 9 (8.41) 1 (6.25) 12 (7.50)
4 Kovvur 1 (10.0) 8 (9.78) 0 (0.0) 0 (0.0) 1 (7.69) 23 (21.50) 2
(11.50) 16 (10.00)
5 Bhimavaram 2 (20.0) 24 (29.27) 2 (11.76) 20 (14.93) 1 (7.69) 4 (3.74) 1 (6.25) 9 (5.63)
6 Eluru 1 (10.0) 3 (3.66) 7 (41.18) 76 (56.72) 6 (46.15) 35 (32.71) 7
(43.75) 81 (50.63)
7 Nidadavole 0 (0.0) 0 (0.0) 3 (17.65) 20 (14.93) 1 (7.69) 20 (18.69) 5
(31.25) 42 (26.25)
8 Palakole 0 (0.0) 0 (0.0) 2 (11.76) 13 (9.70) 2 (15.38) 10 (9.35) 0 (0.0) 0 (0.0)
Total 10
(100.0)
82
(100.0)
17
(100.0)
134
(100.0)
13
(100.0)
107
(100.0)
16
(100.0)
160
(100.0)
Source : G.M. Industries, Eluru.
355
Table – 6.9 : Khadi and village industries in West Godavari District for the year 2002-03 to 2006-07
Sl. No. Year No. of units
Capital
investment
(Rs. In Lakhs)
Employment No
Total
Per unit
investment
(Rs.
Lakhs) Male Female
1 2002-03 11 111.27 92 134 226
10.12 (40.71) (59.29) (100.0)
2 2003-04 10 95.54 127 65 192
9.55 (66.15) (33.85) (100.0)
3 2004-05 73 120.00 200 160 360
1.64 (55.56) (44.45) (100.0)
4 2005-06 139 165.00 1478 1183 2661
1.19 (55.54) (44.46) (100.0)
5 2006-07 179 559.66 834 534 1368
3.13 (60.96) (39.04) (100.0)
6 2007-08 320 1295.78 1939 785 2724
4.05 (71.18) (28.82) (100.0)
7 2008-09 99 219.20 351 269 620
2.21 (56.61) (43.39) (100.0)
CARG 36.87 10.17 21.08 10.47 15.51
Note : Figures in parens indicate percentages to total.
Source : Development Officer, A.P. Khadi & Village Industries Board, Eluru.
356
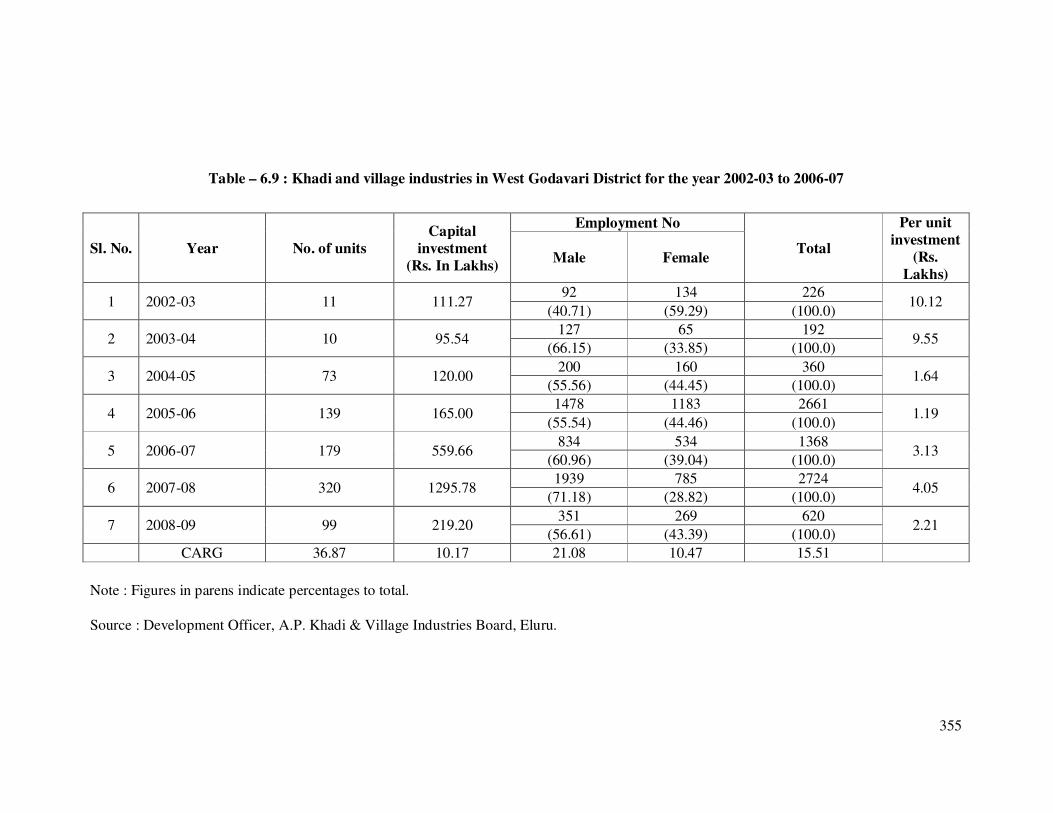
Position of in the cottage industries in the district
The cottage and village industries assume a place of prominence for creation
of employment and empowerment especially in the rural areas. Table – 6.9 presents
the position of cottage industries with respective the number of units, employment
and investment in the district during 2002-03 to 2008-09.
As evident from the table the number of cottage industries which were only 11
(2002-03) phinominally increased to 320 (2007-08) but stood at 99 (2008-09)
experiencing a compound annual growth rate of 36.87 per cent.
The capital invested in Khadhi and village industries in the district were
111.27 lakhs during 2002-03 and increased to Rs. 1295.78 lakhs (2007-08) but stood
at Rs. 219.20 lakhs during 2008-09 witnessing a growth rate of 1017 per cent. Thus it
can be observed the cottage and village industries experienced a marked growth tread
over one year and till 2007-08 both with the respective the number of units as well as
investment but the trend of growth nose dived during 2008-09.
With respective employment in the KVIS in the district the total number of
employees which was 226 during 2002-03 experienced a marked increased to 2724
during 2007-08 but came down to stand at 620 during 2008-09 experiencing a growth
rate of 15.51 per cent over the years. It can be further observed that the rate of growth
in the number of units stands higher at 36.87 per cent between 2002-03 to 2008-09,
compare to 1017 per cent 15.51 per cent respectively in the case of capital investment
and total employment. Further the per unit capital investment in the district as
constantly came down from Rs. 10.12 lakhs (2002-03) to Rs. 2.21 lakhs (2008-09).
A further analysis of the sex composition of the employment in cottage
industries shows that during 2002-03 the females dominated with a share of 59.29 per
cent (134) compare to the males (40.71 per cent). But since 2003-04 the males
assumed a domminent share ranging between 55.54 per cent (2005-06) to 71.18 per
cent (2007-08). On the hand the proportion of female employees in the total
employment in the cottage industries in the district ranged between 28.82 per cent
(2007-08) to 44.46 per cent (2005-06). More over between 2002-03 to 2008-09 the
employment of males in the cottage industries experienced a compound growth rate of

357
21.08 per cent as against the females 10.47 per cent. The analysis shows that, the
female employment in the cottage and village industries has come down over the
years (2002-03 to 2008-09) relatively when compare to the employment of males.
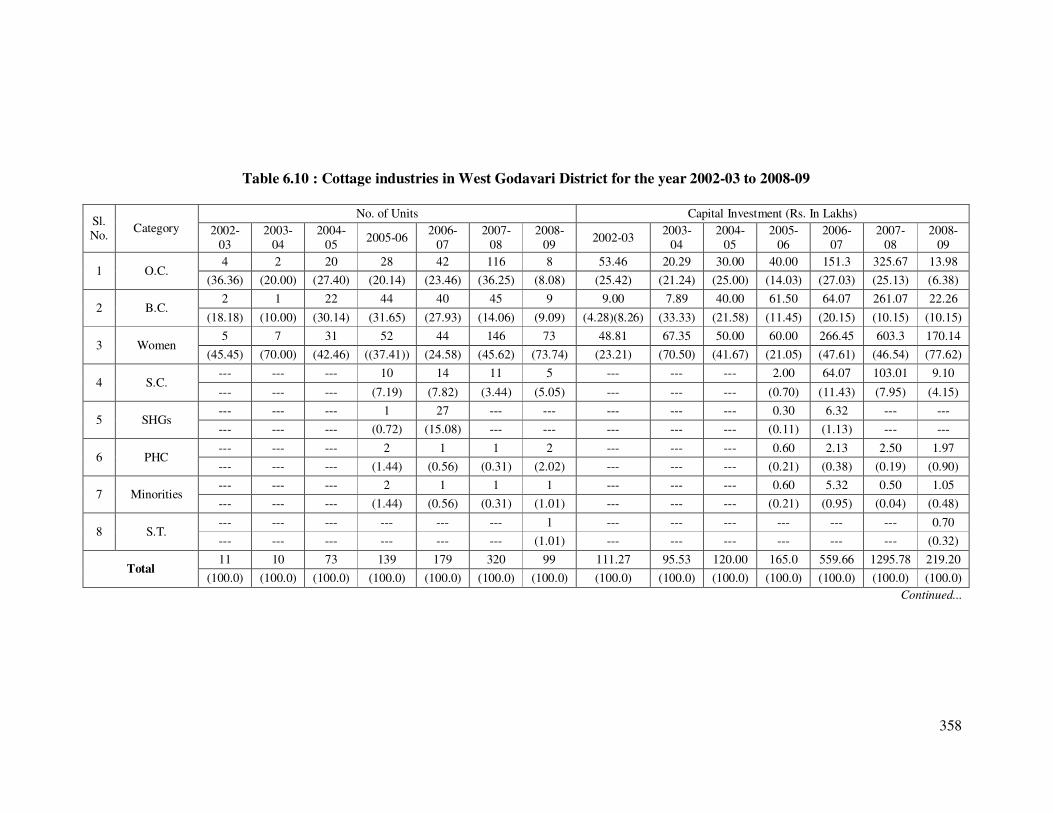
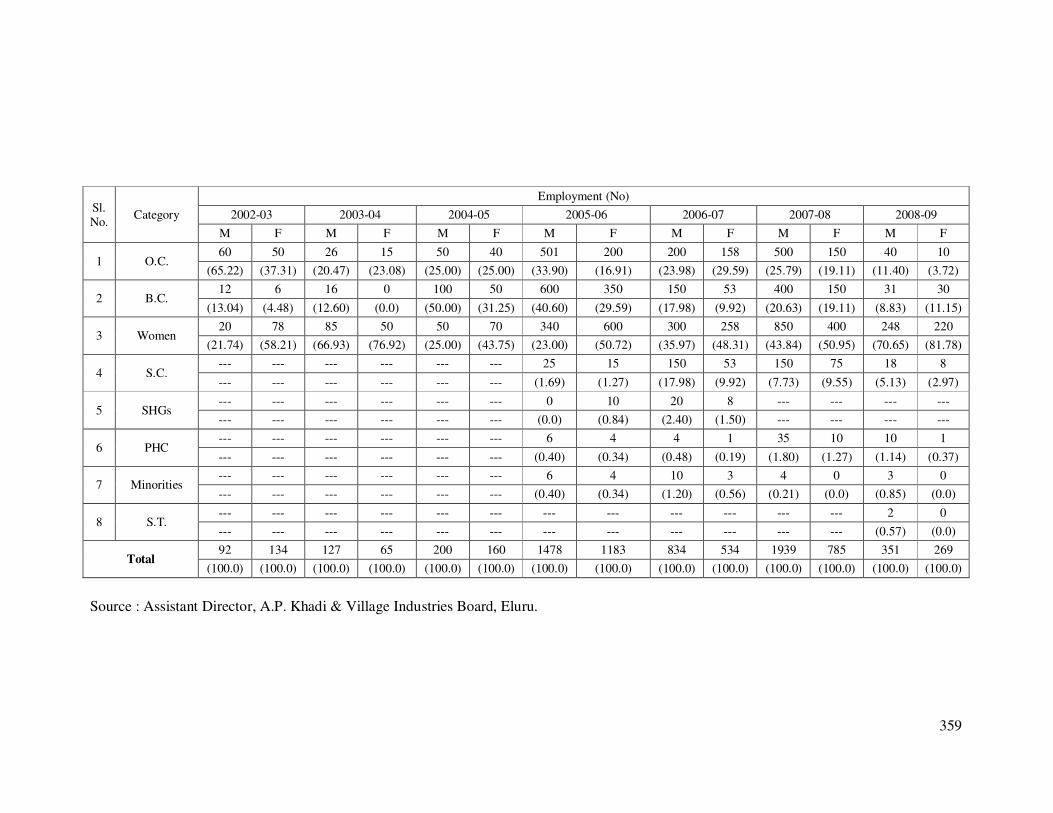
Cottage industries in the district a category-wise analysis
Table – 6.10 presents category-wise analysis of the cottage industries, in terms
of number of units, capital investment and employment in the district during 2002-03
to 2008-09. It is evident from the table that, among the total number of cottage
industries units during 2002-03 (11) 45.45 per cent of the units are promoted by
women followed by 36.36 per cent by forward cast people and 18.18 per cent by
backward class people. The S.C, PHCs, minorities and SHG promoted units could
not find a place in the map of cottage industries in the district. These categories
started emerging in the area of cottage industries since 2005-06. Women continued
their lead in the women ship of cottage industries over the period under reference.
Among the total number of cottage industrial units during 2002-03 to 2008-09 the
share of women ranged between 24.58 per cent (2006-07) to 73.74 per cent (2008-09).
With respective to the capital investment also the women run cottage
industrial units dominated the scene with a share ranging between 21.05 per cent
(2005-06) to 77.62 per cent (2008-090). So is the case with regard to the employment
were the share of women ranged between 21.74 per cent (2002-03) to 81.78 per cent
(2008-09) during the period under review. The analysis clearly shows the abundance
of women participation in entrepreneurial activity in the district. But what wailes still
to do his to propagate and promote. The cottage industries and micro enterprises on
the launch pad of SHGs.
Mahilamandals in the District
Table – 6.11 presents the number of mahilamandals in the registered
membership in the registered membership in the district during 2002-03 to 2008-09.
As evident from the table in the year 2002-03 there were 1066 mahilamandals in the
district with a total membership of 19785. By 2008-09 the number of mahilamandals
stood at 45418 with a membership 455532. Thus during the period under reference
the number of mahilamandals and the membership there in witnessed a compound
358
Table 6.10 : Cottage industries in West Godavari District for the year 2002-03 to 2008-09
Sl.
No. Category
No. of Units Capital Investment (Rs. In Lakhs)
2002-
03
2003-
04
2004-
05 2005-06
2006-
07
2007-
08
2008-
09 2002-03
2003-
04
2004-
05
2005-
06
2006-
07
2007-
08
2008-
09
1 O.C. 4 2 20 28 42 116 8 53.46 20.29 30.00 40.00 151.3 325.67 13.98
(36.36) (20.00) (27.40) (20.14) (23.46) (36.25) (8.08) (25.42) (21.24) (25.00) (14.03) (27.03) (25.13) (6.38)
2 B.C. 2 1 22 44 40 45 9 9.00 7.89 40.00 61.50 64.07 261.07 22.26
(18.18) (10.00) (30.14) (31.65) (27.93) (14.06) (9.09) (4.28)(8.26) (33.33) (21.58) (11.45) (20.15) (10.15) (10.15)
3 Women 5 7 31 52 44 146 73 48.81 67.35 50.00 60.00 266.45 603.3 170.14
(45.45) (70.00) (42.46) ((37.41)) (24.58) (45.62) (73.74) (23.21) (70.50) (41.67) (21.05) (47.61) (46.54) (77.62)
4 S.C. --- --- --- 10 14 11 5 --- --- --- 2.00 64.07 103.01 9.10
--- --- --- (7.19) (7.82) (3.44) (5.05) --- --- --- (0.70) (11.43) (7.95) (4.15)
5 SHGs --- --- --- 1 27 --- --- --- --- --- 0.30 6.32 --- ---
--- --- --- (0.72) (15.08) --- --- --- --- --- (0.11) (1.13) --- ---
6 PHC --- --- --- 2 1 1 2 --- --- --- 0.60 2.13 2.50 1.97
--- --- --- (1.44) (0.56) (0.31) (2.02) --- --- --- (0.21) (0.38) (0.19) (0.90)
7 Minorities --- --- --- 2 1 1 1 --- --- --- 0.60 5.32 0.50 1.05
--- --- --- (1.44) (0.56) (0.31) (1.01) --- --- --- (0.21) (0.95) (0.04) (0.48)
8 S.T. --- --- --- --- --- --- 1 --- --- --- --- --- --- 0.70
--- --- --- --- --- --- (1.01) --- --- --- --- --- --- (0.32)
Total 11 10 73 139 179 320 99 111.27 95.53 120.00 165.0 559.66 1295.78 219.20
(100.0) (100.0) (100.0) (100.0) (100.0) (100.0) (100.0) (100.0) (100.0) (100.0) (100.0) (100.0) (100.0) (100.0)
Continued...
359
Sl.
No. Category
Employment (No)
2002-03 2003-04 2004-05 2005-06 2006-07 2007-08 2008-09
M F M F M F M F M F M F M F
1 O.C. 60 50 26 15 50 40 501 200 200 158 500 150 40 10
(65.22) (37.31) (20.47) (23.08) (25.00) (25.00) (33.90) (16.91) (23.98) (29.59) (25.79) (19.11) (11.40) (3.72)
2 B.C. 12 6 16 0 100 50 600 350 150 53 400 150 31 30
(13.04) (4.48) (12.60) (0.0) (50.00) (31.25) (40.60) (29.59) (17.98) (9.92) (20.63) (19.11) (8.83) (11.15)
3 Women 20 78 85 50 50 70 340 600 300 258 850 400 248 220
(21.74) (58.21) (66.93) (76.92) (25.00) (43.75) (23.00) (50.72) (35.97) (48.31) (43.84) (50.95) (70.65) (81.78)
4 S.C. --- --- --- --- --- --- 25 15 150 53 150 75 18 8
--- --- --- --- --- --- (1.69) (1.27) (17.98) (9.92) (7.73) (9.55) (5.13) (2.97)
5 SHGs --- --- --- --- --- --- 0 10 20 8 --- --- --- ---
--- --- --- --- --- --- (0.0) (0.84) (2.40) (1.50) --- --- --- ---
6 PHC --- --- --- --- --- --- 6 4 4 1 35 10 10 1
--- --- --- --- --- --- (0.40) (0.34) (0.48) (0.19) (1.80) (1.27) (1.14) (0.37)
7 Minorities --- --- --- --- --- --- 6 4 10 3 4 0 3 0
--- --- --- --- --- --- (0.40) (0.34) (1.20) (0.56) (0.21) (0.0) (0.85) (0.0)
8 S.T. --- --- --- --- --- --- --- --- --- --- --- --- 2 0
--- --- --- --- --- --- --- --- --- --- --- --- (0.57) (0.0)
Total 92 134 127 65 200 160 1478 1183 834 534 1939 785 351 269
(100.0) (100.0) (100.0) (100.0) (100.0) (100.0) (100.0) (100.0) (100.0) (100.0) (100.0) (100.0) (100.0) (100.0)
Source : Assistant Director, A.P. Khadi & Village Industries Board, Eluru.

360
Table - 6.11 : Mahila Mandals in west Godavari district for the year 2002-03 to
2006-07
Sl. No. Year Registered
No. Membership
1 2002-03 1066 19785
2 2003-04 1066 19785
3 2004-05 1066 19785
4 2005-06 1066 19785
5 2006-07 45307 453870
6 2007-08 45307 453870
7 2008-09 45418 455532
CARG 70.91 56.53
Source : Project Director, District Women & Child Development Agency, Eluru.

361
Table – 6.12 : Bank branches in West Godavari District for the year
2002-03 to 2008-09
Sl.
No. Year
Nationalized
Banks
Regional
Rural
Banks
Co-op
Banks
Private
Banks
Total No. of
Bank Branches
2002-03 232 17 33 20 302
(76.82) (5.63) (10.93) (6.62) (100.00)
2003-04 232 17 33 20 302
(76.82) (5.63) (10.93) (6.62) (100.00)
2004-05 247 18 33 28 326
(75.77) (5.52) (10.12) (8.59) (100.00)
2005-06 243 19 33 32 327
(74.31) (5.81) (10.09) (9.79) (100.00)
2006-07 248 17 33 36 334
(74.25) (5.09) (9.88) (10.78) (100.00)
2007-08 250 17 33 37 337
(74.18) (5.04) (9.79) (10.98) (100.00)
2008-09 265 18 33 40 356
(74.44) (5.06) (9.27) (11.24) (100.00)
CARG 1.92 0.82 0 10.41 2.38
Source : Lead Manager, Andhra Bank, Eluru, West Godavari District.

362
annual growth rate of 70.91 per cent and 56.53 per cent respectively. The trend of
increase both in the number of mahilamandals and membership shows the sense of
awareness and the spirit of association and group activity among women in the
district.
Banking in the District
In terms of the number of bank branches under different categories of banks,
the banking in the district during 2002-03 to 2008-09 is presented in table – 6.12. As
evident from the table the total number of bank branches in the district were 302
during 2002-03 which increased to 356 during 2008-09 with a growth rate of 2.38 per
cent. A category wise analysis of the bank branches in the district clearly shows that
during the period under reference, the nationalized banks accounted for a major share
ranging between 74.18 per cent (2007-08) to 76.82 per cent (2002-03 and 2003-04)
the private sector banks which accounted for a share of 6.62 per cent in the total
number of bank branches in the district during 2002-03 experienced in increasing over
the years to stand at 11.24 per cent during 2008-09. On other hand the Regional Rural
Banks (RRBs) and the Co-operative banks witnessed a decline in their respective
share in the total number of bank branches. The increasing the share of private sector
bank branches caused a margined dilution in the shares of other category of Bank
branches. It could be further noted that, the number of private sector bank branches
during 2002-03 to 2008-09 experience a relatively grater growth rate of 10.41 per cent
as against 1.92 per cent in nationalized bank branches only 0.82 per cent in the RRB
branches
Credits and deposits of Commercial Banks
The credits and deposits of commercial banks in West Godavari District
during 2002-03 to 2008-09 are presented in table – 6.13. It is evident from the table
the number of commercial banks branches with which were 302 during 2002-03
increased to 356 during 2008-09 with a growth rate of only 2.38 per cent. The
deposits of the commercial banks went up by 13.64 per cent from Rs. 2344.53 crores
(2002-03) to Rs. 2738.52 crores. On other hand the total advances of the commercial
banks registered a growth rate of 22.32 per cent increasing from 2078.71 crores to
8518.52 crores during the corresponding period. This shows that, the total.
commercial bank advances in the district experience a grater growth compare to the
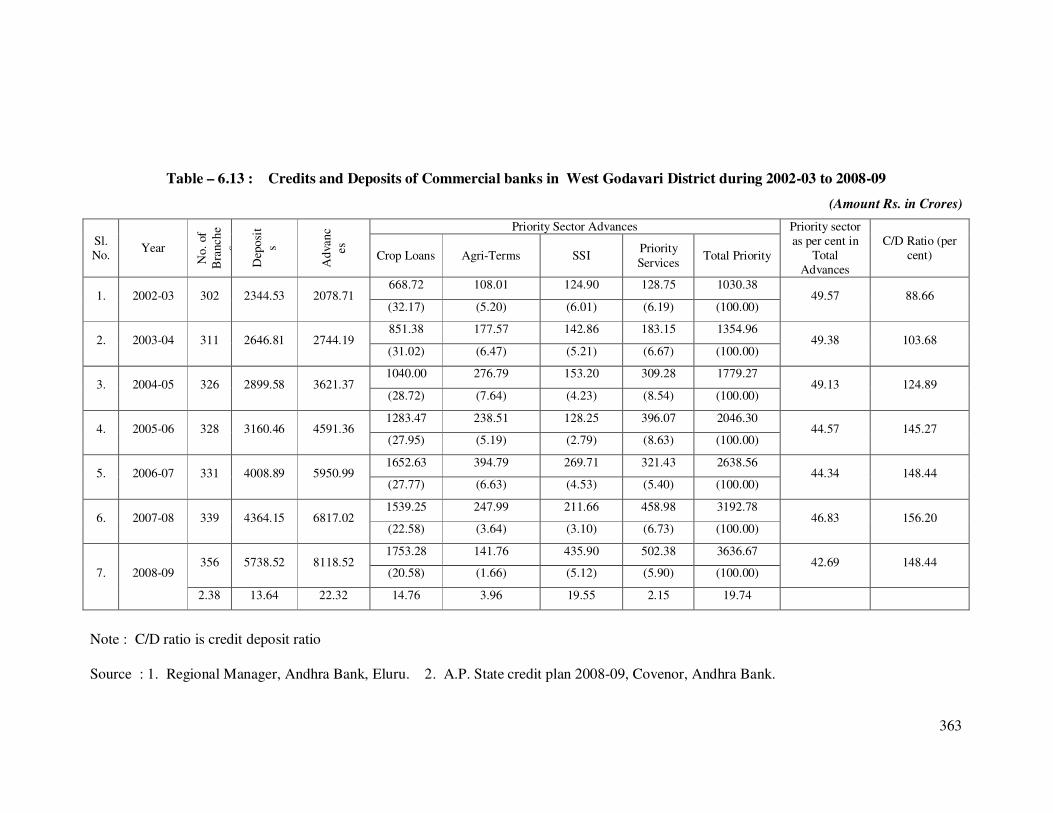
363
Table – 6.13 : Credits and Deposits of Commercial banks in West Godavari District during 2002-03 to 2008-09
(Amount Rs. in Crores)
Sl.
No. Year
No.
of
Bra
nch
e
s
Dep
osi
t
s
Ad
van
c
es
Priority Sector Advances Priority sector
as per cent in
Total
Advances
C/D Ratio (per
cent) Crop Loans Agri-Terms SSI Priority
Services Total Priority
1. 2002-03 302 2344.53 2078.71 668.72 108.01 124.90 128.75 1030.38
49.57 88.66 (32.17) (5.20) (6.01) (6.19) (100.00)
2. 2003-04 311 2646.81 2744.19 851.38 177.57 142.86 183.15 1354.96
49.38 103.68 (31.02) (6.47) (5.21) (6.67) (100.00)
3. 2004-05 326 2899.58 3621.37 1040.00 276.79 153.20 309.28 1779.27
49.13 124.89 (28.72) (7.64) (4.23) (8.54) (100.00)
4. 2005-06 328 3160.46 4591.36 1283.47 238.51 128.25 396.07 2046.30
44.57 145.27 (27.95) (5.19) (2.79) (8.63) (100.00)
5. 2006-07 331 4008.89 5950.99 1652.63 394.79 269.71 321.43 2638.56
44.34 148.44 (27.77) (6.63) (4.53) (5.40) (100.00)
6. 2007-08 339 4364.15 6817.02 1539.25 247.99 211.66 458.98 3192.78
46.83 156.20 (22.58) (3.64) (3.10) (6.73) (100.00)
7. 2008-09 356 5738.52 8118.52
1753.28 141.76 435.90 502.38 3636.67 42.69 148.44
(20.58) (1.66) (5.12) (5.90) (100.00)
2.38 13.64 22.32 14.76 3.96 19.55 2.15 19.74
Note : C/D ratio is credit deposit ratio
Source : 1. Regional Manager, Andhra Bank, Eluru. 2. A.P. State credit plan 2008-09, Covenor, Andhra Bank.

364
deposits. This is supported by the fact that the credit deposit ratio which was 88.66
per cent during 2002-03 increased to 156.20 per cent during 2007-08 and stood at
148.44 per cent during 2008-09.
Priority sector advances by commercial banks
The priority sector advances by commercial banks by district, as further shown
by table 6-13, which was Rs. 1030.38 crores constituting 49.57 per cent of the total
commercial bank advances, increased to Rs. 3636.67 crores constituting 42.69 per
cent of the total advances during 2008-09. Over the years under review (2002-03 to
2008-09) the amount of priority sector advances by commercial banks in the district
experience a compound annual growth rate of 19.74 per cent. The analysis shows
that, though the amount of priority sector advances by the commercial banks in the
district experience an impressive growth at 19.74 per cent during 2002-03 to 2008-09,
the ratio of private sector advances to total advances came down from 49.57 per cent
to 42.69 per cent.
Of the total amount of priority sector advances the crop loans assume a grater
share ranging between 20.58 per cent (2008-09) to 32.17 per cent (2002-03). It is
followed by priority services (ranging between 5.40 per cent to 8.63 per cent), agri-
term loans (ranging between 1.66 per cent to 7.64 per cent) and SSI sector (ranging
between 2.79 per cent in 2005-06 to 6.01 per cent in 2002-03). Over the period under
reference the crop loans in the priority sector experience an increase in absolute terms
but relatively the share of crop loan in the total priority sector advances came down
over the years. More over the rate of growth in the amount of crop loan stood at
14.76 per cent. On the other hand the amount of advances to SSI sector witnessed a
growth rate of 19.55 per cent over the years. Further the share of SSI sector in the
total amount of priority sector advances which was 6.01 per cent during 2002-03,
though came down to 2.79 per cent during 2005-06 looked up to stand at 5.12 per cent
during 2008-09. The analysis shows that away the priority sector constituents out of
the total advance of priority sector advance the crop loans and the agricultural term
loans put together assumed a dominate share but with a marginal decline over the
years on the other hand the share of the SSI sector in the total amount of priority
sector advances not only experienced a relatively higher growth rate but also in its
hare of the total priority sector advances by the commercial banks.