Embed Size (px)
Citation preview
Mottl, M.J., Davis, E.E., Fisher, A.T., and Slack, J.F. (Eds.), 1994Proceedings of the Ocean Drilling Program, Scientific Results, Vol. 139
33. ESTIMATION OF GRAIN THERMAL CONDUCTIVITY IN THE TURBIDITE SEDIMENT OF THEJUAN DE FUCA RIDGE1
Masataka Kinoshita2
ABSTRACT
Over 1000 thermal conductivity values were determined at four sites during Ocean Drilling Program Leg 139 exploration ofMiddle Valley, northern Juan de Fuca Ridge. Grain thermal conductivities were estimated from thermal conductivity and porositydata using the geometric mean model. In spite of large scatter in estimated grain conductivities, careful examinations of the datasuggest that average grain conductivity at Hole 858A, located at the edge of a hydrothermal vent area, is higher by more than 0.5W/(m K) compared with that at other holes. This difference cannot be attributed to either the error in thermal conductivitymeasurements or the difference in mineral composition determined from the smear-slide description data. The higher value at Site858 may reflect the influence of induration or cementation due to hydrothermal fluid flow at that site. Grain conductivities andgrain densities are higher at all sites than those expected from mineral composition, which may result from regional hydrothermalmetamorphism.
INTRODUCTION
Thermal conductivity was measured on samples cored during Leg139, Juan de Fuca Ridge. A thick sequence of late Pleistocene sedi-ments fills this rift valley and limits the exchange of seawater andcrustal hydrothermal fluids (Davis and Villinger, 1992).
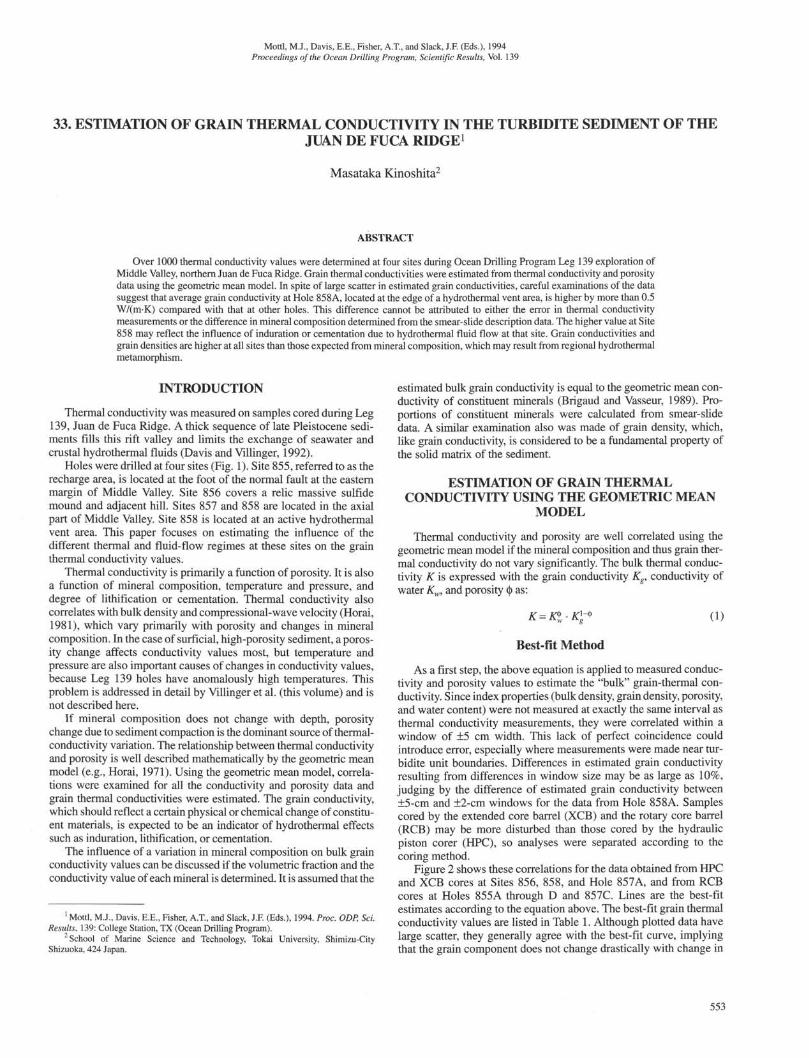
Holes were drilled at four sites (Fig. 1). Site 855, referred to as therecharge area, is located at the foot of the normal fault at the easternmargin of Middle Valley. Site 856 covers a relic massive sulfidemound and adjacent hill. Sites 857 and 858 are located in the axialpart of Middle Valley. Site 858 is located at an active hydrothermalvent area. This paper focuses on estimating the influence of thedifferent thermal and fluid-flow regimes at these sites on the grainthermal conductivity values.
Thermal conductivity is primarily a function of porosity. It is alsoa function of mineral composition, temperature and pressure, anddegree of lithification or cementation. Thermal conductivity alsocorrelates with bulk density and compressional-wave velocity (Horai,1981), which vary primarily with porosity and changes in mineralcomposition. In the case of surficial, high-porosity sediment, a poros-ity change affects conductivity values most, but temperature andpressure are also important causes of changes in conductivity values,because Leg 139 holes have anomalously high temperatures. Thisproblem is addressed in detail by Villinger et al. (this volume) and isnot described here.
If mineral composition does not change with depth, porositychange due to sediment compaction is the dominant source of thermal-conductivity variation. The relationship between thermal conductivityand porosity is well described mathematically by the geometric meanmodel (e.g., Horai, 1971). Using the geometric mean model, correla-tions were examined for all the conductivity and porosity data andgrain thermal conductivities were estimated. The grain conductivity,which should reflect a certain physical or chemical change of constitu-ent materials, is expected to be an indicator of hydrothermal effectssuch as induration, lithification, or cementation.
The influence of a variation in mineral composition on bulk grainconductivity values can be discussed if the volumetric fraction and theconductivity value of each mineral is determined. It is assumed that the
estimated bulk grain conductivity is equal to the geometric mean con-ductivity of constituent minerals (Brigaud and Vasseur, 1989). Pro-portions of constituent minerals were calculated from smear-slidedata. A similar examination also was made of grain density, which,like grain conductivity, is considered to be a fundamental property ofthe solid matrix of the sediment.
ESTIMATION OF GRAIN THERMALCONDUCTIVITY USING THE GEOMETRIC MEAN
MODEL
Thermal conductivity and porosity are well correlated using thegeometric mean model if the mineral composition and thus grain ther-mal conductivity do not vary significantly. The bulk thermal conduc-tivity K is expressed with the grain conductivity Kg, conductivity ofwater Kw, and porosity Φ as:
K=Kt •K -4
Best-fit Method
(1)
1 Mottl, M.J., Davis, E.E., Fisher, A.T., and Slack, J.F. (Eds.), 1994. Proc. ODP, Sci.Results, 139: College Station, TX (Ocean Drilling Program).
School of Marine Science and Technology, Tokai University, Shimizu-CityShizuoka, 424 Japan.
As a first step, the above equation is applied to measured conduc-tivity and porosity values to estimate the "bulk" grain-thermal con-ductivity. Since index properties (bulk density, grain density, porosity,and water content) were not measured at exactly the same interval asthermal conductivity measurements, they were correlated within awindow of ±5 cm width. This lack of perfect coincidence couldintroduce error, especially where measurements were made near tur-bidite unit boundaries. Differences in estimated grain conductivityresulting from differences in window size may be as large as 10%,judging by the difference of estimated grain conductivity between±5-cm and ±2-cm windows for the data from Hole 858A. Samplescored by the extended core barrel (XCB) and the rotary core barrel(RCB) may be more disturbed than those cored by the hydraulicpiston corer (HPC), so analyses were separated according to thecoring method.
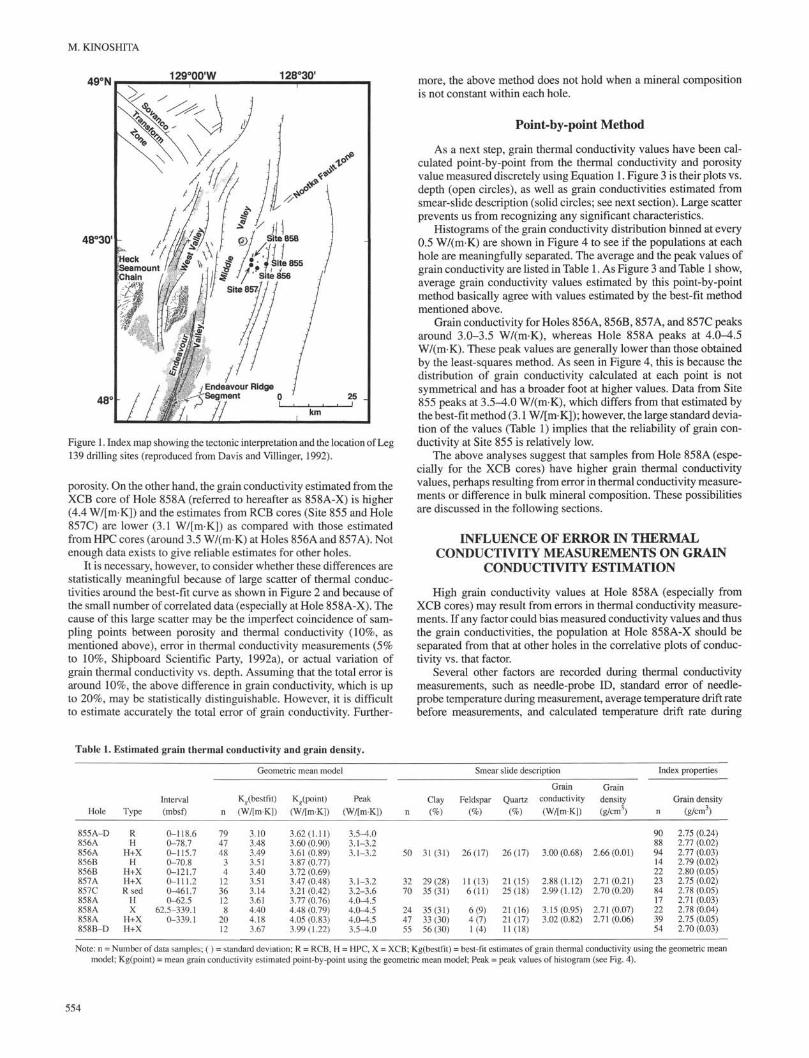
Figure 2 shows these correlations for the data obtained from HPCand XCB cores at Sites 856, 858, and Hole 857A, and from RCBcores at Holes 855A through D and 857C. Lines are the best-fitestimates according to the equation above. The best-fit grain thermalconductivity values are listed in Table 1. Although plotted data havelarge scatter, they generally agree with the best-fit curve, implyingthat the grain component does not change drastically with change in
M. KINOSHITA
49°N 129°00'W 128°30'
48°30'
48'
Figure 1. Index map showing the tectonic inteΦretation and the location of Leg139 drilling sites (reproduced from Davis and Villinger, 1992).
porosity. On the other hand, the grain conductivity estimated from theXCB core of Hole 85 8A (referred to hereafter as 858A-X) is higher(4.4 W/[m K]) and the estimates from RCB cores (Site 855 and Hole857C) are lower (3.1 W/[m K]) as compared with those estimatedfrom HPC cores (around 3.5 W/(m K) at Holes 856A and 857A). Notenough data exists to give reliable estimates for other holes.
It is necessary, however, to consider whether these differences arestatistically meaningful because of large scatter of thermal conduc-tivities around the best-fit curve as shown in Figure 2 and because ofthe small number of correlated data (especially at Hole 858A-X). Thecause of this large scatter may be the imperfect coincidence of sam-pling points between porosity and thermal conductivity (10%, asmentioned above), error in thermal conductivity measurements (5%to 10%, Shipboard Scientific Party, 1992a), or actual variation ofgrain thermal conductivity vs. depth. Assuming that the total error isaround 10%, the above difference in grain conductivity, which is upto 20%, may be statistically distinguishable. However, it is difficultto estimate accurately the total error of grain conductivity. Further-
more, the above method does not hold when a mineral compositionis not constant within each hole.
Point-by-point Method
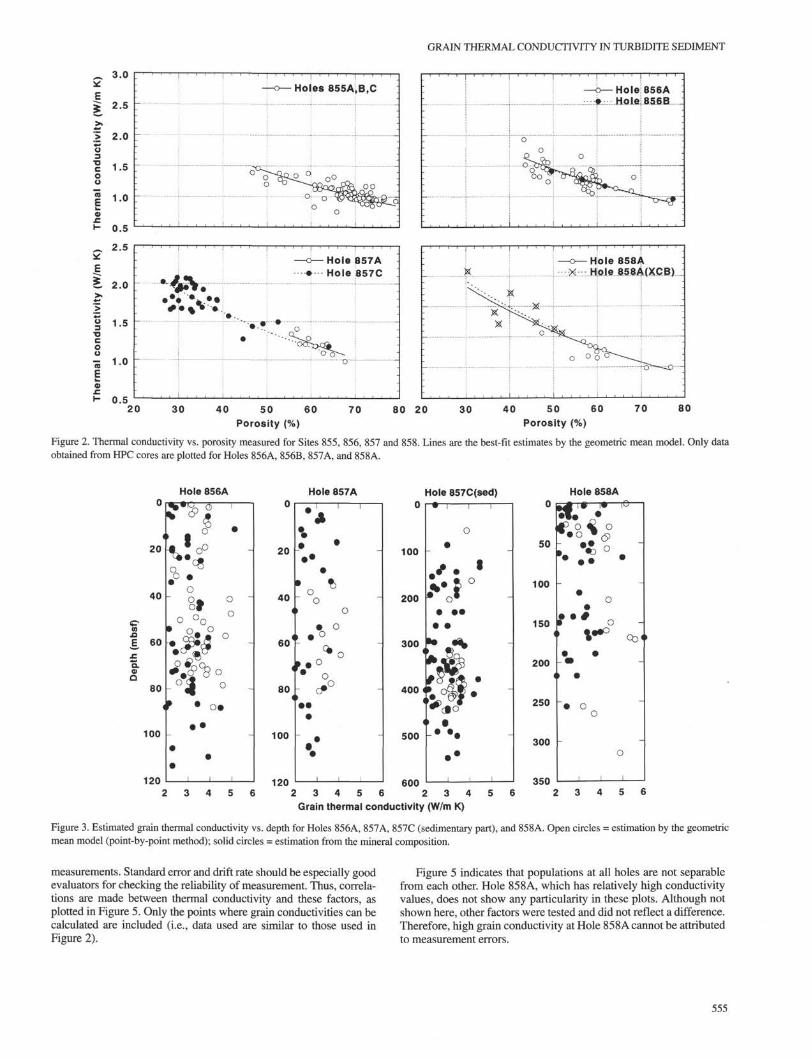
As a next step, grain thermal conductivity values have been cal-culated point-by-point from the thermal conductivity and porosityvalue measured discretely using Equation 1. Figure 3 is their plots vs.depth (open circles), as well as grain conductivities estimated fromsmear-slide description (solid circles; see next section). Large scatterprevents us from recognizing any significant characteristics.
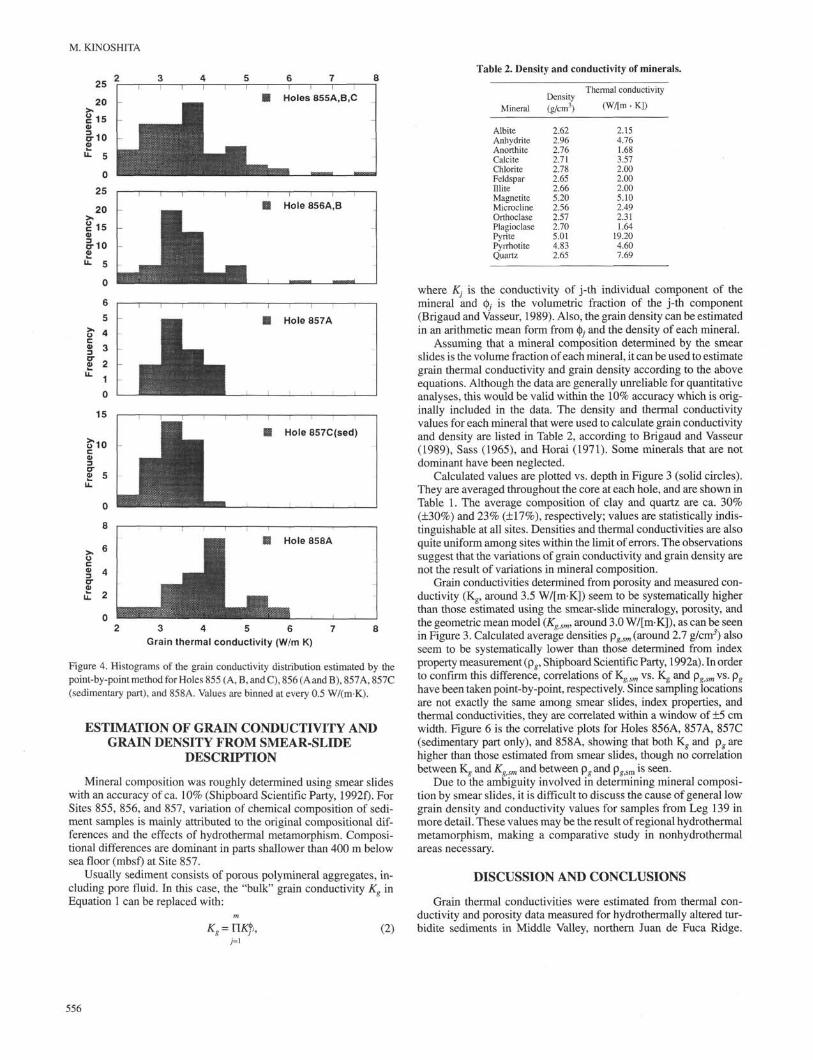
Histograms of the grain conductivity distribution binned at every0.5 W/(m K) are shown in Figure 4 to see if the populations at eachhole are meaningfully separated. The average and the peak values ofgrain conductivity are listed in Table 1. As Figure 3 and Table 1 show,average grain conductivity values estimated by this point-by-pointmethod basically agree with values estimated by the best-fit methodmentioned above.
Grain conductivity for Holes 856A, 856B, 857A, and 857C peaksaround 3.0-3.5 W/(m K), whereas Hole 858A peaks at 4.0-4.5W/(m K). These peak values are generally lower than those obtainedby the least-squares method. As seen in Figure 4, this is because thedistribution of grain conductivity calculated at each point is notsymmetrical and has a broader foot at higher values. Data from Site855 peaks at 3.5^4.0 W/(m K), which differs from that estimated bythe best-fit method (3.1 W/[m K]); however, the large standard devia-tion of the values (Table 1) implies that the reliability of grain con-ductivity at Site 855 is relatively low.
The above analyses suggest that samples from Hole 858A (espe-cially for the XCB cores) have higher grain thermal conductivityvalues, perhaps resulting from error in thermal conductivity measure-ments or difference in bulk mineral composition. These possibilitiesare discussed in the following sections.
INFLUENCE OF ERROR IN THERMALCONDUCTIVITY MEASUREMENTS ON GRAIN
CONDUCTIVITY ESTIMATION
High grain conductivity values at Hole 858A (especially fromXCB cores) may result from errors in thermal conductivity measure-ments. If any factor could bias measured conductivity values and thusthe grain conductivities, the population at Hole 858A-X should beseparated from that at other holes in the correlative plots of conduc-tivity vs. that factor.
Several other factors are recorded during thermal conductivitymeasurements, such as needle-probe ID, standard error of needle-probe temperature during measurement, average temperature drift ratebefore measurements, and calculated temperature drift rate during
Table 1. Estimated grain thermal conductivity and grain density.
Hole
855A-D856A856A856B856B857A857C858A858A858A858B-D
Type
RH
H+XH
H+XH+XRsed
HX
H+XH+X
Interval
(mbsf)
0-118.60-78.70-115.70-70.80-121.70-111.20-461.70-62.5
62.5-339.10-339.1
n
794748
34
1236128
2012
Geometric mean model
K/bestfit)
(W/[m K])
3.103483.493.513.403.513.143.614.404.183.67
K/point)
(W/[m•K])
3.62(1.11)3.60 (0.90)3.61 (0.89)3.87 (0.77)3.72 (0.69)3.47 (0.48)3.21 (0.42)3.77 (0.76)4.48 (0.79)4.05 (0.83)3.99(1.22)
Peak
(W/[m K])
3.5-4.03.1-3.23.1-3.2
3.1-3.23.2-3.64.0-4.54.0-4.54.0-4.53.5^.0
n
50
3270
244755
Clay
(%)
31(31)
29 (28)35 (31)
35(31)33 (30)56 (30)
Smear slide description
Feldspar
(%)
26 (17)
11(13)6(11)
6(9)4(7)1(4)
Quartz
(%)
26(17)
21 (15)25 (18)
21 (16)21 (17)11(18)
Grain
conductivity
(W/[m K])
3.00 (0.68)
2.88(1.12)2.99(1.12)
3.15(0.95)3.02 (0.82)
Grain
density
(g/cm3)
2.66 (0.01)
2.71 (0.21)2.70 (0.20)
2.71(0.07)2.71 (0.06)
Index properties
n
90
941422238417223954
Grain density
(g/cm3)
2.75 (0.24)2.77 (0.02)2.77 (0.03)2.79 (0.02)2.80 (0.05)2.75 (0.02)2.78 (0.05)2.71 (0.03)2.78 (0.04)2.75 (0.05)2.70 (0.03)
Note: n = Number of data samples; () = standard deviation; R = RCB, H = HPC, X = XCB; Kg(bestfit) = best-fit estimates of grain thermal conductivity using the geometric meanmodel; Kg(point) = mean grain conductivity estimated point-by-point using the geometric mean model; Peak = peak values of histogram (see Fig. 4).
554
GRAIN THERMAL CONDUCTIVITY IN TURBIDITE SEDIMENT
Hole 857A• --- Hole 857C
Hole 858AHole 858A(XCB)
0.520 30 40 50 60 70 80 20 30 40 50 60
Porosity (%) Porosity (%)
Figure 2. Thermal conductivity vs. porosity measured for Sites 855, 856, 857 and 858. Lines are the best-fit estimates by the geometric mean model. Only dataobtained from HPC cores are plotted for Holes 856A, 856B, 857A, and 858A.
Hole 856A Hole 857A Hole 857C(sed)
20
40
«E 60
a.aa
80
100
120
I I
%w
o••• c0
o
if
••
(-
•o
o
1f t
•
•
o
o
5
> oo
1 ° -^ oö ^
o
o•
•1 1
80
100
120
100
200
300
400
500
6002 3 4 5 6 2 3 4 5 6
Grain thermal conductivity (W/m K)
0
50
100
150(
200
250
300
Hole 858A
ΛP O
• o•9
•>~ C
-
•
•
•f
t•
)o
oy _
•
-
O
Oo<
-
-
-
o
j
Figure 3. Estimated grain thermal conductivity vs. depth for Holes 856A, 857A, 857C (sedimentary part), and 858A. Open circles = estimation by the geometricmean model (point-by-point method); solid circles = estimation from the mineral composition.
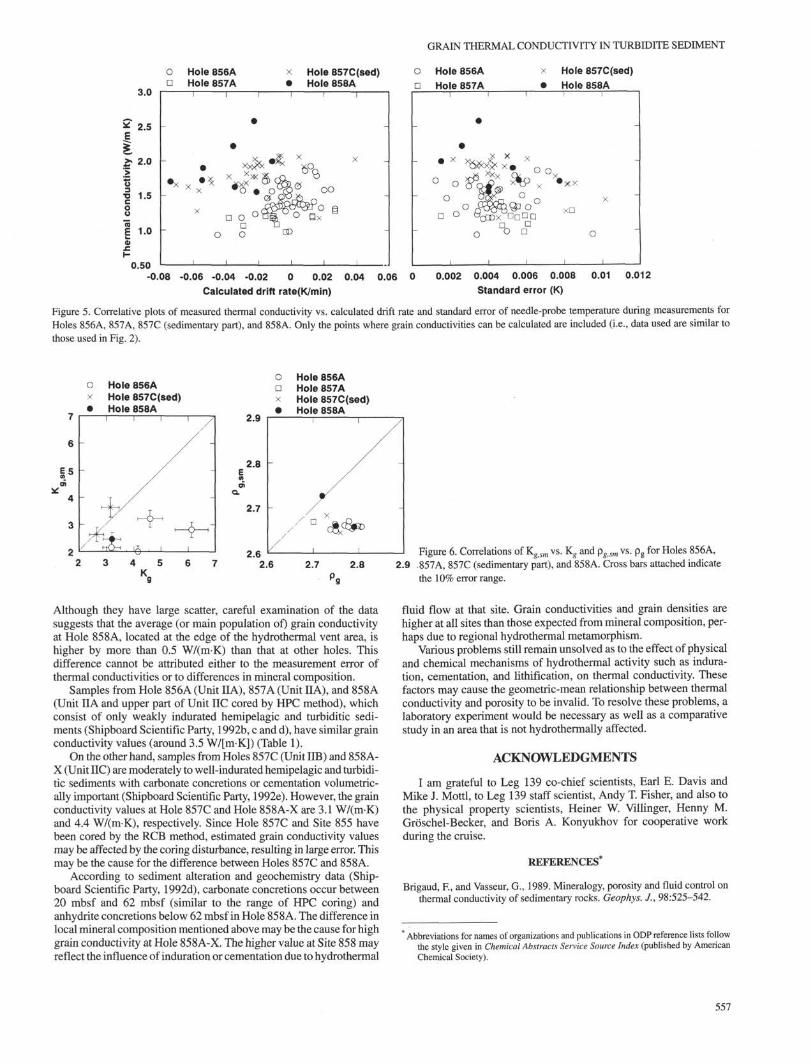
measurements. Standard error and drift rate should be especially good Figure 5 indicates that populations at all holes are not separableevaluators for checking the reliability of measurement. Thus, correla- from each other. Hole 858A, which has relatively high conductivitytions are made between thermal conductivity and these factors, as values, does not show any particularity in these plots. Although notplotted in Figure 5. Only the points where grain conductivities can be shown here, other factors were tested and did not reflect a difference,calculated are included (i.e., data used are similar to those used in Therefore, high grain conductivity at Hole 858A cannot be attributedFigure 2). to measurement errors.
555
M. KINOSHITA
Table 2. Density and conductivity of minerals.
Mineral
Density
(g/cm3)
Thermal conductivity
(W/[m K])
3 4 5 6 7 8
Grain thermal conductivity (W/m K)
Figure 4. Histograms of the grain conductivity distribution estimated by thepoint-by-point method for Holes 855 (A, B, and C), 856 (Aand B), 857A, 857C(sedimentary part), and 858A. Values are binned at every 0.5 W/(m K).
ESTIMATION OF GRAIN CONDUCTIVITY ANDGRAIN DENSITY FROM SMEAR-SLIDE
DESCRIPTION
Mineral composition was roughly determined using smear slideswith an accuracy of ca. 10% (Shipboard Scientific Party, 1992f). ForSites 855, 856, and 857, variation of chemical composition of sedi-ment samples is mainly attributed to the original compositional dif-ferences and the effects of hydrothermal metamorphism. Composi-tional differences are dominant in parts shallower than 400 m belowsea floor (mbsf) at Site 857.
Usually sediment consists of porous polymineral aggregates, in-cluding pore fluid. In this case, the "bulk" grain conductivity Kg inEquation 1 can be replaced with:
AlbiteAnhydriteAnorthiteCalciteChloriteFeldsparHikeMagnetiteMicroclineOrthoclasePlagioclasePyritePyrrhotiteQuartz
2.96
2.762.712.782.652.665.202.562.572.705.014.832.65
2.154.761.683.572.002.002.005.102.492.311.64
19.204.607.69
Kg = YlKfj, (2)
where Kj is the conductivity of j-th individual component of themineral and Φ> is the volumetric fraction of the j-th component(Brigaud and Vasseur, 1989). Also, the grain density can be estimatedin an arithmetic mean form from Φ,- and the density of each mineral.
Assuming that a mineral composition determined by the smearslides is the volume fraction of each mineral, it can be used to estimategrain thermal conductivity and grain density according to the aboveequations. Although the data are generally unreliable for quantitativeanalyses, this would be valid within the 10% accuracy which is orig-inally included in the data. The density and thermal conductivityvalues for each mineral that were used to calculate grain conductivityand density are listed in Table 2, according to Brigaud and Vasseur(1989), Sass (1965), and Horai (1971). Some minerals that are notdominant have been neglected.
Calculated values are plotted vs. depth in Figure 3 (solid circles).They are averaged throughout the core at each hole, and are shown inTable 1. The average composition of clay and quartz are ca. 30%(±30%) and 23% (±17%), respectively; values are statistically indis-tinguishable at all sites. Densities and thermal conductivities are alsoquite uniform among sites within the limit of errors. The observationssuggest that the variations of grain conductivity and grain density arenot the result of variations in mineral composition.
Grain conductivities determined from porosity and measured con-ductivity (Kg, around 3.5 W/[m K]) seem to be systematically higherthan those estimated using the smear-slide mineralogy, porosity, andthe geometric mean model (Kgsm, around 3.0 W/[m K]), as can be seenin Figure 3. Calculated average densities pgsm (around 2.7 g/cm5) alsoseem to be systematically lower than those determined from indexproperty measurement (pg, Shipboard Scientific Party, 1992a). In orderto confirm this difference, correlations of Kg s m vs. Kg and pgsm vs. pg
have been taken point-by-point, respectively. Since sampling locationsare not exactly the same among smear slides, index properties, andthermal conductivities, they are correlated within a window of ±5 cmwidth. Figure 6 is the correlative plots for Holes 856A, 857A, 857C(sedimentary part only), and 858A, showing that both Kg and pg arehigher than those estimated from smear slides, though no correlationbetween Kg and Kgsm and between pgand p^ s m is seen.
Due to the ambiguity involved in determining mineral composi-tion by smear slides, it is difficult to discuss the cause of general lowgrain density and conductivity values for samples from Leg 139 inmore detail. These values may be the result of regional hydrothermalmetamorphism, making a comparative study in nonhydrothermalareas necessary.
DISCUSSION AND CONCLUSIONS
Grain thermal conductivities were estimated from thermal con-ductivity and porosity data measured for hydrothermally altered tur-bidite sediments in Middle Valley, northern Juan de Fuca Ridge.
556
3.0
2.5
2.0
ε 1.0
0.50
O Hole 856Aπ Hole 857A
1.5 -
× Hole 857C(sed)Hole 858A
GRAIN THERMAL CONDUCTIVITY IN TURBIDITE SEDIMENT
Hole 857C(sed)Hole 858A
-0.08 -0.06 -0.04 -0.02 0 0.02 0.04Calculated drift rate(K/min)
0.06 0 0.002 0.004 0.006 0.008Standard error (K)
0.01 0.012
Figure 5. Correlative plots of measured thermal conductivity vs. calculated drift rate and standard error of needle-probe temperature during measurements forHoles 856A, 857A, 857C (sedimentary part), and 858A. Only the points where grain conductivities can be calculated are included (i.e., data used are similar tothose used in Fig. 2).
O Hole 856Ax Hole 857C(sed)• Hole 858A
o Hole 856AG Hole 857Ax Hole 857C(sed)• Hole 858A
Although they have large scatter, careful examination of the datasuggests that the average (or main population of) grain conductivityat Hole 85 8A, located at the edge of the hydrothermal vent area, ishigher by more than 0.5 W/(m K) than that at other holes. Thisdifference cannot be attributed either to the measurement error ofthermal conductivities or to differences in mineral composition.
Samples from Hole 856A (Unit IIA), 857A (Unit IIA), and 858A(Unit IIA and upper part of Unit IIC cored by HPC method), whichconsist of only weakly indurated hemipelagic and turbiditic sedi-ments (Shipboard Scientific Party, 1992b, c and d), have similar grainconductivity values (around 3.5 W/[m K]) (Table 1).
On the other hand, samples from Holes 857C (Unit IIB) and 85 8 A-X (Unit IIC) are moderately to well-indurated hemipelagic and turbidi-tic sediments with carbonate concretions or cementation volumetric-ally important (Shipboard Scientific Party, 1992e). However, the grainconductivity values at Hole 857C and Hole 858A-X are 3.1 W/(m K)and 4.4 W/(m K), respectively. Since Hole 857C and Site 855 havebeen cored by the RCB method, estimated grain conductivity valuesmay be affected by the coring disturbance, resulting in large error. Thismay be the cause for the difference between Holes 857C and 85 8A.
According to sediment alteration and geochemistry data (Ship-board Scientific Party, 1992d), carbonate concretions occur between20 mbsf and 62 mbsf (similar to the range of HPC coring) andanhydrite concretions below 62 mbsf in Hole 85 8 A. The difference inlocal mineral composition mentioned above may be the cause for highgrain conductivity at Hole 858A-X. The higher value at Site 858 mayreflect the influence of induration or cementation due to hydrothermal
Figure 6. Correlations of Kgsm vs. Kg and pgsm vs. pg for Holes 856A,2.9 .857A, 857C (sedimentary part), and 858A. Cross bars attached indicate
the 10% error range.
fluid flow at that site. Grain conductivities and grain densities arehigher at all sites than those expected from mineral composition, per-haps due to regional hydrothermal metamorphism.
Various problems still remain unsolved as to the effect of physicaland chemical mechanisms of hydrothermal activity such as indura-tion, cementation, and lithification, on thermal conductivity. Thesefactors may cause the geometric-mean relationship between thermalconductivity and porosity to be invalid. To resolve these problems, alaboratory experiment would be necessary as well as a comparativestudy in an area that is not hydrothermally affected.
ACKNOWLEDGMENTS
I am grateful to Leg 139 co-chief scientists, Earl E. Davis andMike J. Mottl, to Leg 139 staff scientist, Andy T. Fisher, and also tothe physical property scientists, Heiner W. Villinger, Henny M.Gröschel-Becker, and Boris A. Konyukhov for cooperative workduring the cruise.
REFERENCES*
Brigaud, F., and Vasseur, G., 1989. Mineralogy, porosity and fluid control onthermal conductivity of sedimentary rocks. Geophys. J., 98:525-542.
* Abbreviations for names of organizations and publications in ODP reference lists followthe style given in Chemical Abstracts Service Source Index (published by AmericanChemical Society).
557
M. KINOSHITA
Davis, E.E., and Villinger, H., 1992. Tectonic and thermal structure of theMiddle Valley sedimented rift, northern Juan de Fuca Ridge. In Davis, E.E.,Mottl, M.J., Fisher, A.T., et al., Proc. ODP, Init. Repts., 139: CollegeStation, TX (Ocean Drilling Program), 9^41.
Horai, K., 1971. Thermal conductivity of rock-forming minerals. J. Geophys.Res., 76:1278-1308.
, 1981. Thermal conductivity of sediments and igneous rocks recov-ered during Deep Sea Drilling Project Leg 60. In Hussong, D.M., Uyeda,S., et al., Init. Repts. DSDP, 60: Washington (U.S. Govt. Printing Office),807-834.
Sass, J.H., 1965. The thermal conductivity of fifteen feldspar specimens. J.Geophys. Res., 70:4064-^065.
Shipboard Scientific Party, 1992a. Explanatory notes. In Davis, E.E., Mottl,M.J., Fisher, A.T., et al., Proc. ODP, Init. Repts., 139: College Station, TX(Ocean Drilling Program), 55-97.
, 1992b. Site 855. In Davis, E.E., Mottl, M.J., Fisher, A.T., et al.,Proc. ODP, Init. Repts., 139: College Station, TX (Ocean Drilling Pro-gram), 101-160.
, 1992c, Site 856. In Davis, E.E., Mottl, M.J., Fisher, A.T., et al.,Proc. ODP, Init. Repts., 139: College Station, TX (Ocean Drilling Pro-gram), 161-281.
-, 1992d. Site 857. In Davis, E.E., Mottl, M.J., Fisher, A.T., et al.,Proc. ODP, Init. Repts., 139: College Station, TX (Ocean Drilling Pro-gram), 283^29.
-, 1992e. Site 858. In Davis, E.E., Mottl, M.J., Fisher, A.T., et al.,Proc. ODP, Init. Repts., 139: College Station, TX (Ocean Drilling Pro-gram), 431-569.
-, 1992f. Section 4: Smear slides. In Davis, E.E., Mottl, M.J., Fisher,A.T., et al., Proc. ODP, Init. Repts., 139: College Station, TX (OceanDrilling Program), 933-946.
Date of initial receipt: 8 March 1993Date of acceptance: 22 October 1993Ms 139SR-250
558