Embed Size (px)
Citation preview
Understanding Statistics
3/4/2009Chia Hui LaiClaire Bode
EDUC 5394: Understanding Classroom Research
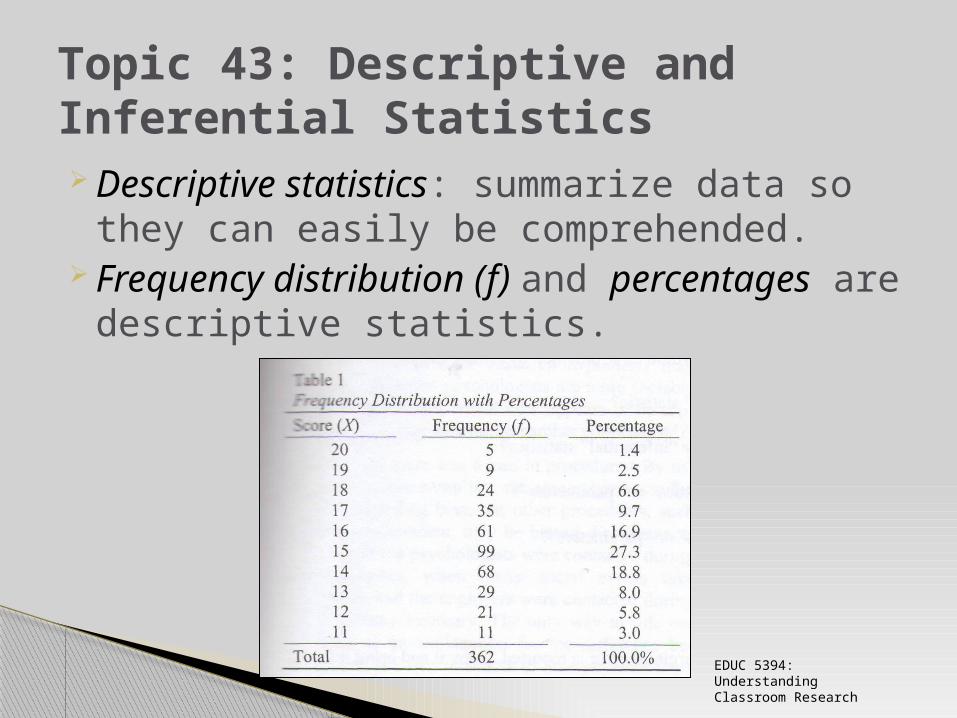
Descriptive statistics: summarize data so they can easily be comprehended.
Frequency distribution (f) and percentages are descriptive statistics.
EDUC 5394: Understanding Classroom Research
Topic 43: Descriptive and Inferential Statistics
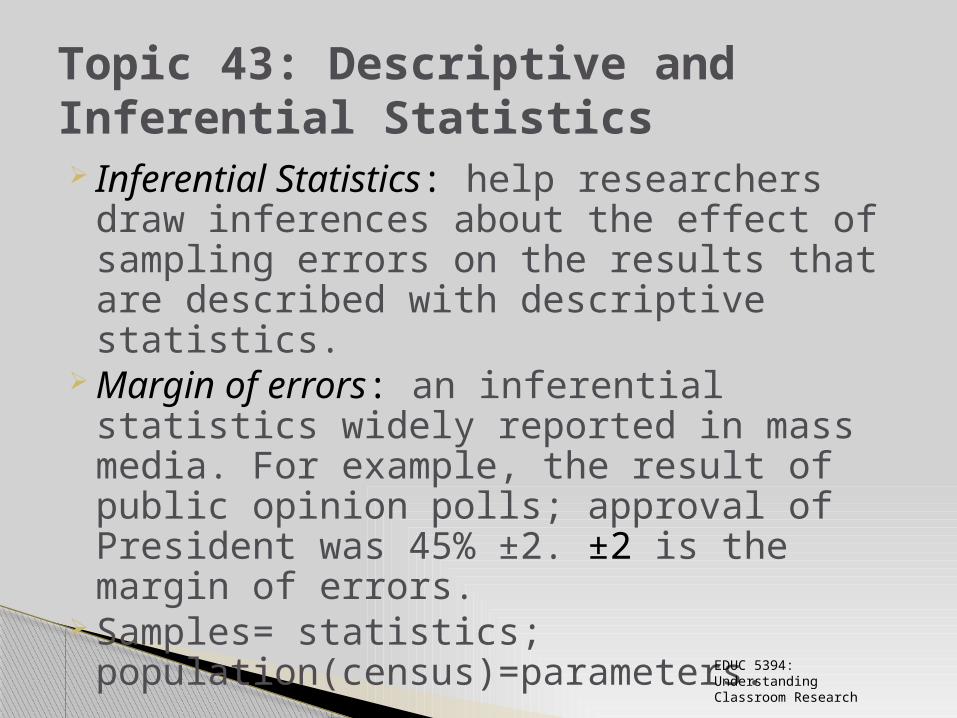
Inferential Statistics: help researchers draw inferences about the effect of sampling errors on the results that are described with descriptive statistics.
Margin of errors: an inferential statistics widely reported in mass media. For example, the result of public opinion polls; approval of President was 45% ±2. ±2 is the margin of errors.
Samples= statistics; population(census)=parameters.
EDUC 5394: Understanding Classroom Research
Topic 43: Descriptive and Inferential Statistics
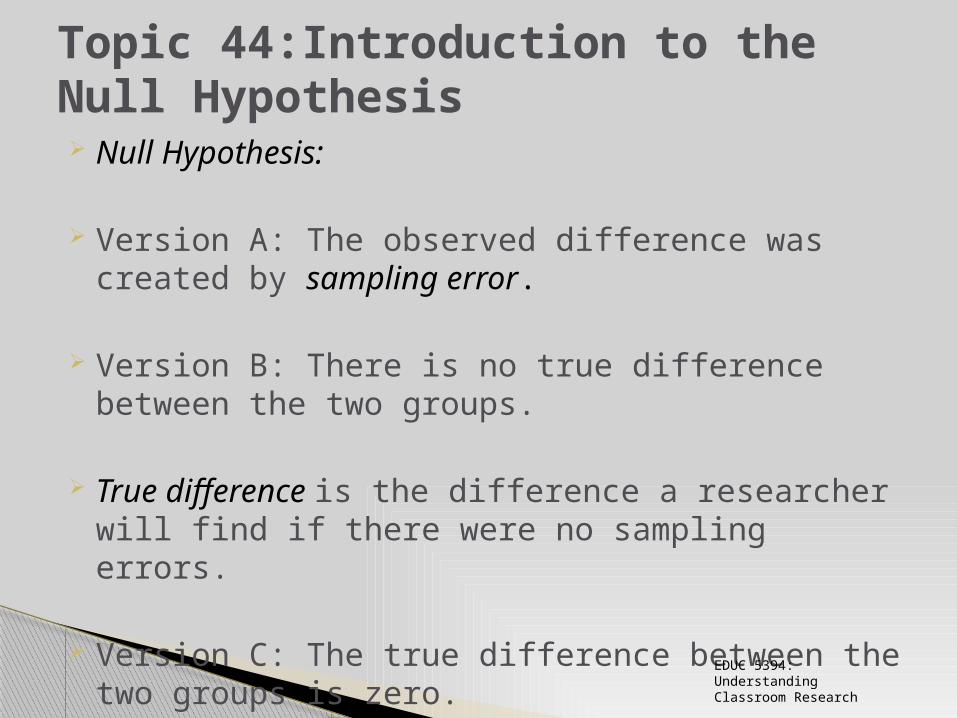
Null Hypothesis:
Version A: The observed difference was created by sampling error.
Version B: There is no true difference between the two groups.
True difference is the difference a researcher will find if there were no sampling errors.
Version C: The true difference between the two groups is zero.
EDUC 5394: Understanding Classroom Research
Topic 44:Introduction to the Null Hypothesis
EDUC 5394: Understanding Classroom Research
Topic 44:Introduction to the Null Hypothesis
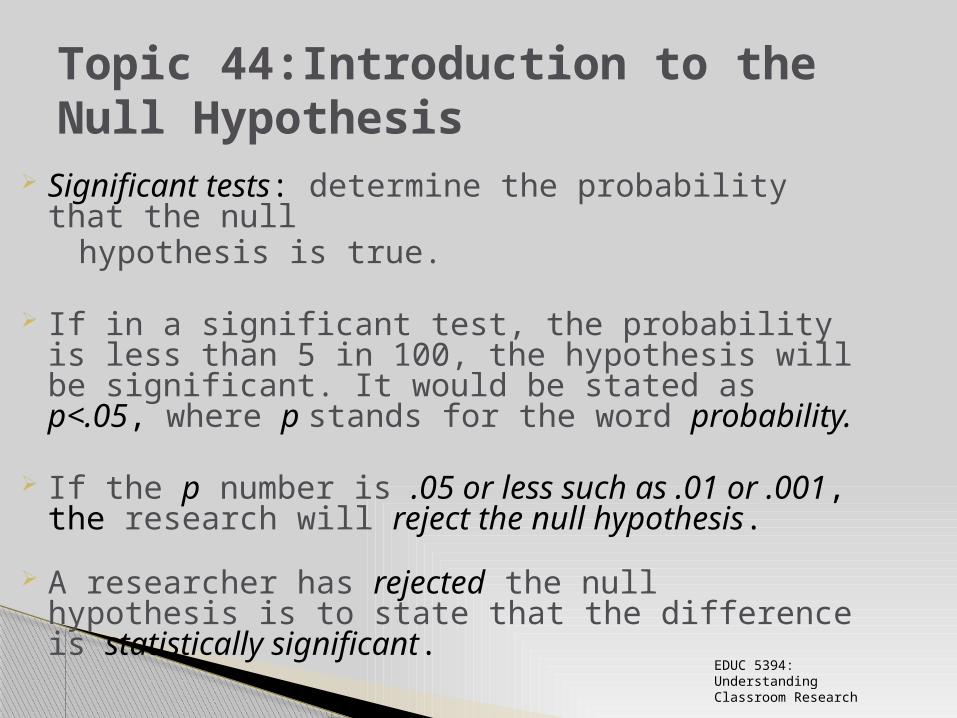
Significant tests: determine the probability that the null
hypothesis is true.
If in a significant test, the probability is less than 5 in 100, the hypothesis will be significant. It would be stated as p<.05, where p stands for the word probability.
If the p number is .05 or less such as .01 or .001, the research will reject the null hypothesis.
A researcher has rejected the null hypothesis is to state that the difference is statistically significant.
Topic 44:Introduction to the Null Hypothesis
EDUC 5394: Understanding Classroom Research
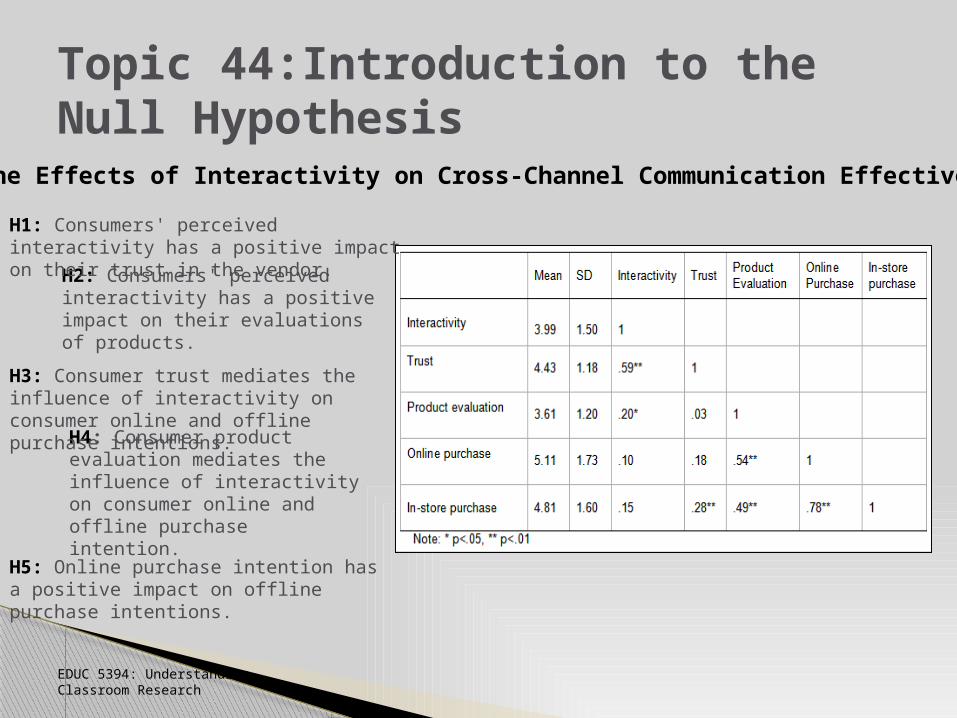
The Effects of Interactivity on Cross-Channel Communication Effectiveness
H2: Consumers' perceived interactivity has a positive impact on their evaluations of products.
H5: Online purchase intention has a positive impact on offline purchase intentions.
H4: Consumer product evaluation mediates the influence of interactivity on consumer online and offline purchase intention.
H1: Consumers' perceived interactivity has a positive impact on their trust in the vendor.
H3: Consumer trust mediates the influence of interactivity on consumer online and offline purchase intentions.
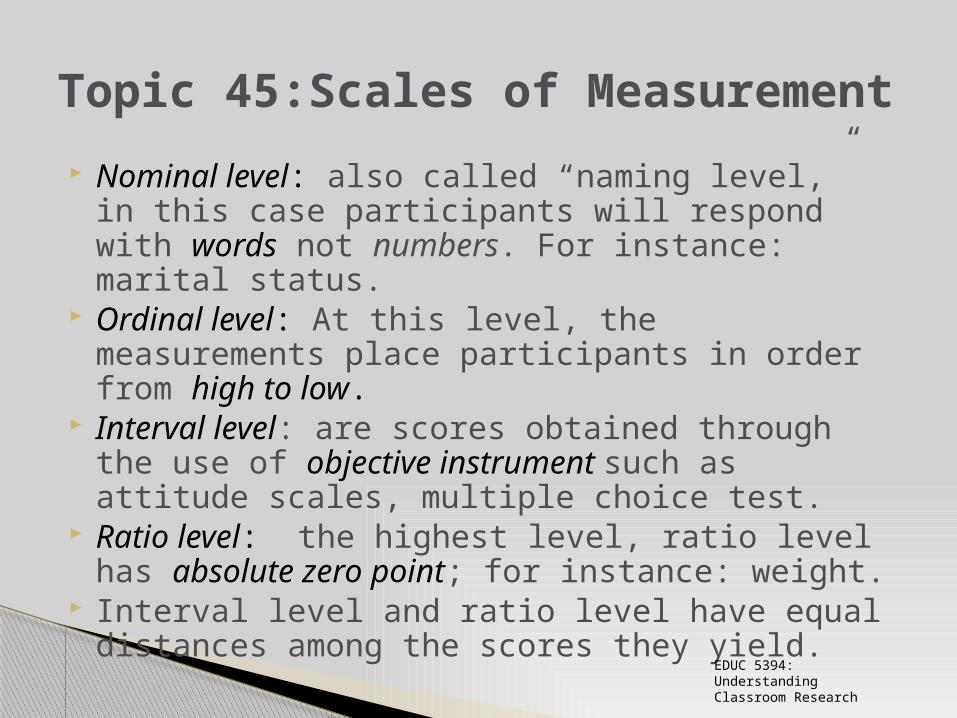
Nominal level: also called “naming level,” in this case participants will respond with words not numbers. For instance: marital status.
Ordinal level: At this level, the measurements place participants in order from high to low.
Interval level: are scores obtained through the use of objective instrument such as attitude scales, multiple choice test.
Ratio level: the highest level, ratio level has absolute zero point; for instance: weight.
Interval level and ratio level have equal distances among the scores they yield.
EDUC 5394: Understanding Classroom Research
Topic 45:Scales of Measurement
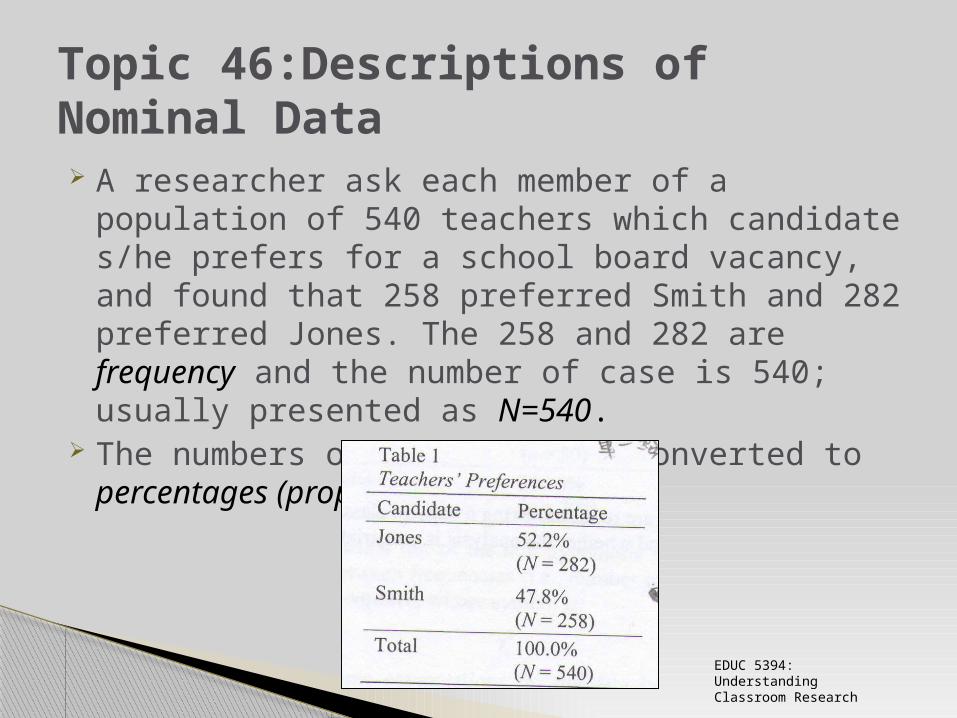
A researcher ask each member of a population of 540 teachers which candidate s/he prefers for a school board vacancy, and found that 258 preferred Smith and 282 preferred Jones. The 258 and 282 are frequency and the number of case is 540; usually presented as N=540.
The numbers of cases can be converted to percentages (proportions).
EDUC 5394: Understanding Classroom Research
Topic 46:Descriptions of Nominal Data
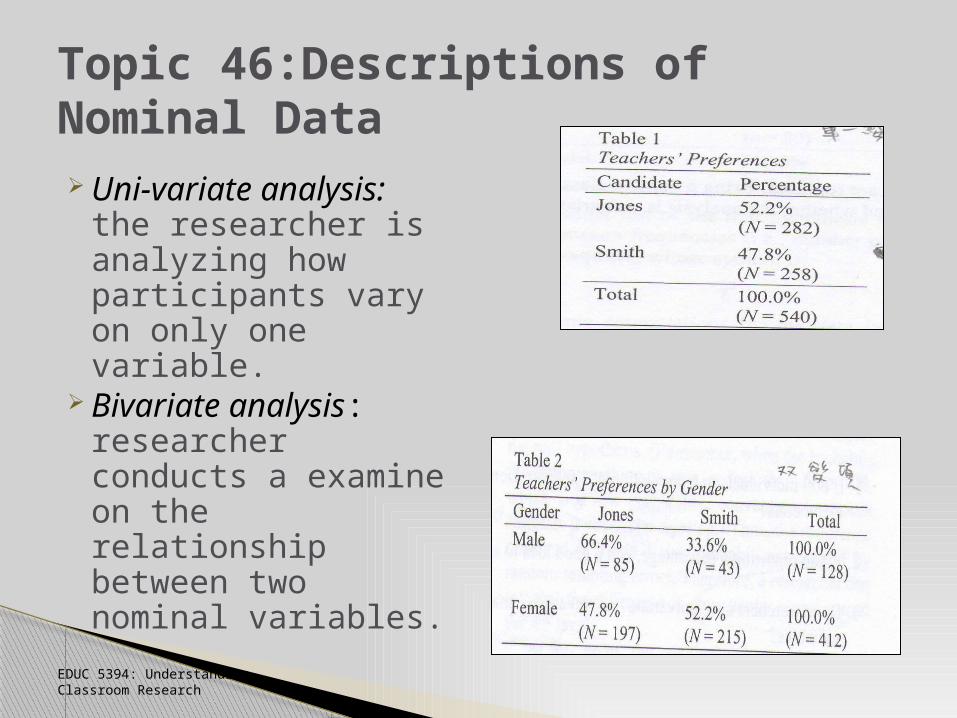
Topic 46:Descriptions of Nominal Data Uni-variate
analysis: the researcher is analyzing how participants vary on only one variable.
Bivariate analysis: researcher conducts a examine on the relationship between two nominal variables.
EDUC 5394: Understanding Classroom Research
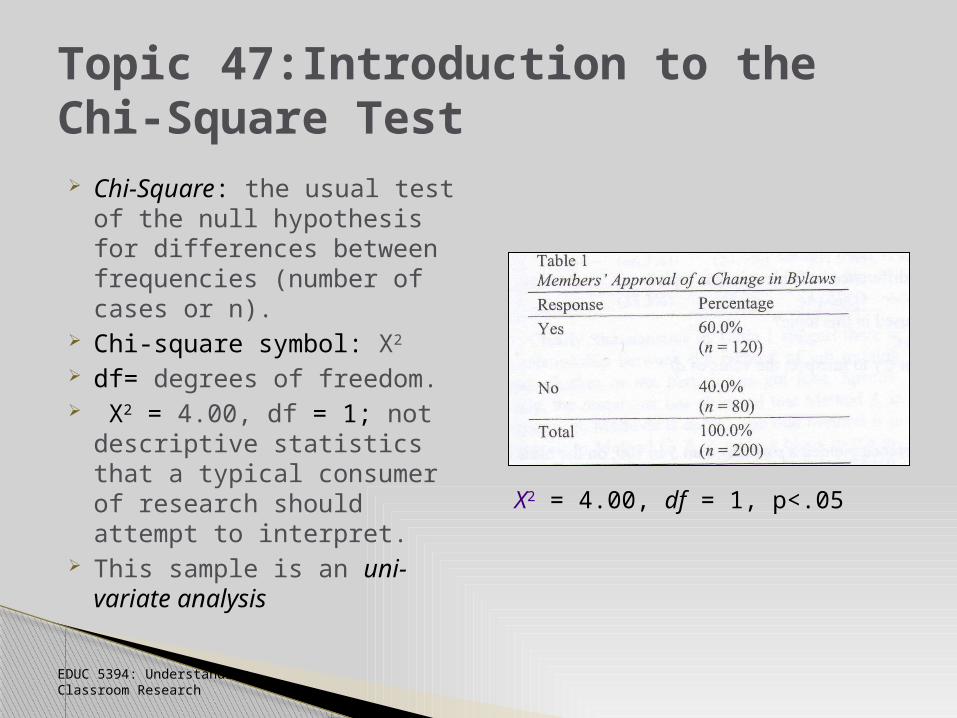
Topic 47:Introduction to the Chi-Square Test Chi-Square: the usual test
of the null hypothesis for differences between frequencies (number of cases or n).
Chi-square symbol: X2
df= degrees of freedom. X2 = 4.00, df = 1; not
descriptive statistics that a typical consumer of research should attempt to interpret.
This sample is an uni-variate analysis
EDUC 5394: Understanding Classroom Research
X2 = 4.00, df = 1, p<.05
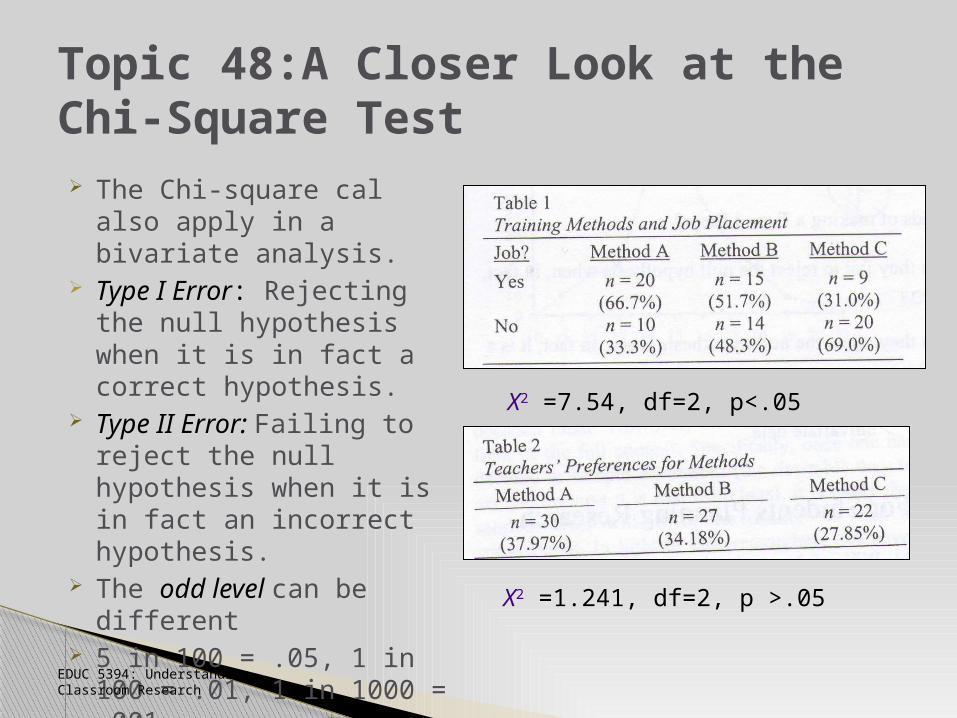
Topic 48:A Closer Look at the Chi-Square Test The Chi-square cal also
apply in a bivariate analysis.
Type I Error: Rejecting the null hypothesis when it is in fact a correct hypothesis.
Type II Error: Failing to reject the null hypothesis when it is in fact an incorrect hypothesis.
The odd level can be different
5 in 100 = .05, 1 in 100 = .01, 1 in 1000 = .001.
EDUC 5394: Understanding Classroom Research
X2 =7.54, df=2, p<.05
X2 =1.241, df=2, p >.05
Topic 49:Shape of Distribution
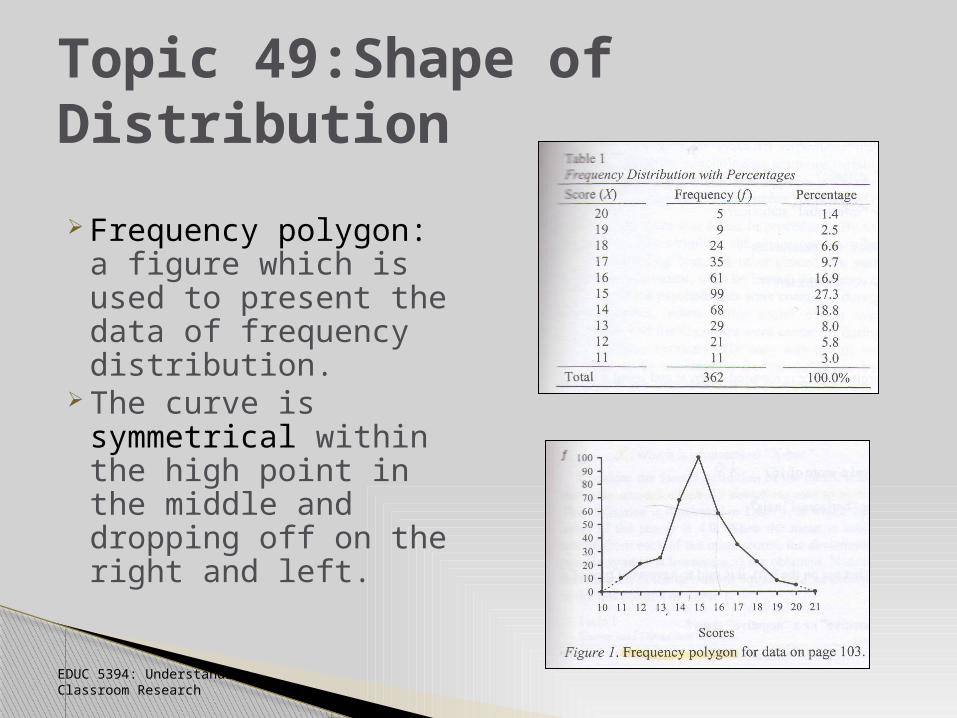
Frequency polygon: a figure which is used to present the data of frequency distribution.
The curve is symmetrical within the high point in the middle and dropping off on the right and left.
EDUC 5394: Understanding Classroom Research
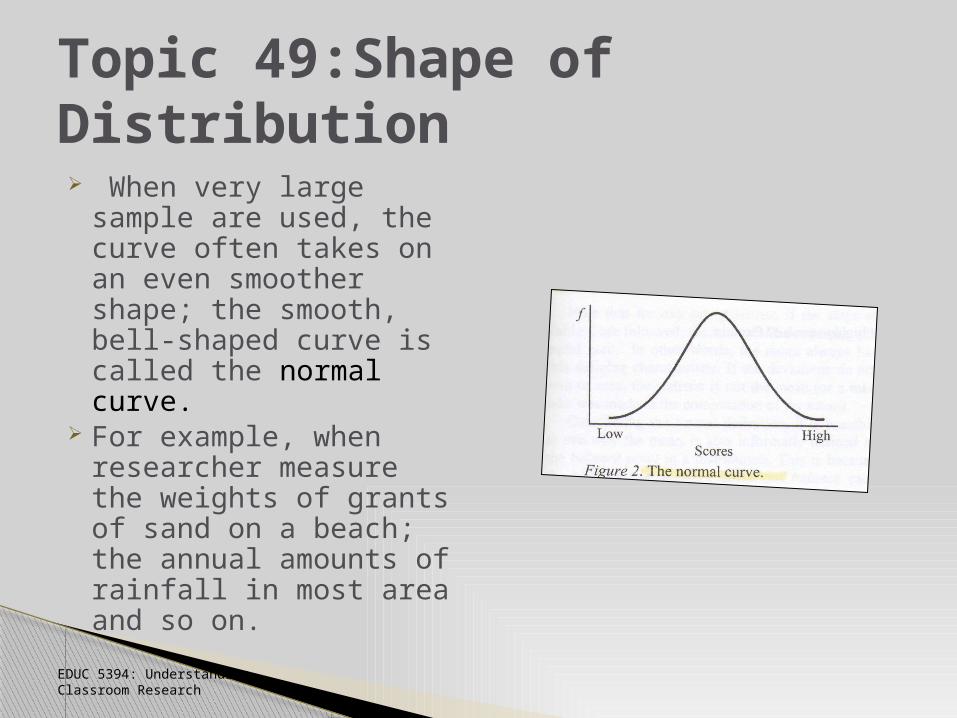
Topic 49:Shape of Distribution When very large
sample are used, the curve often takes on an even smoother shape; the smooth, bell-shaped curve is called the normal curve.
For example, when researcher measure the weights of grants of sand on a beach; the annual amounts of rainfall in most area and so on.
EDUC 5394: Understanding Classroom Research
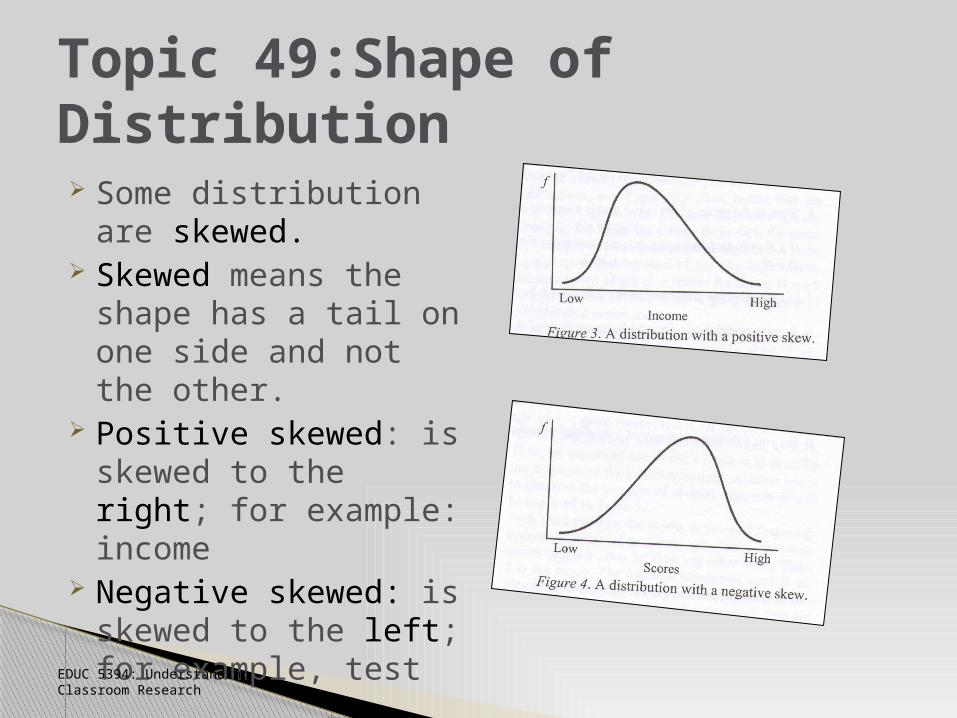
Topic 49:Shape of Distribution Some distribution are
skewed. Skewed means the
shape has a tail on one side and not the other.
Positive skewed: is skewed to the right; for example: income
Negative skewed: is skewed to the left; for example, test
EDUC 5394: Understanding Classroom Research
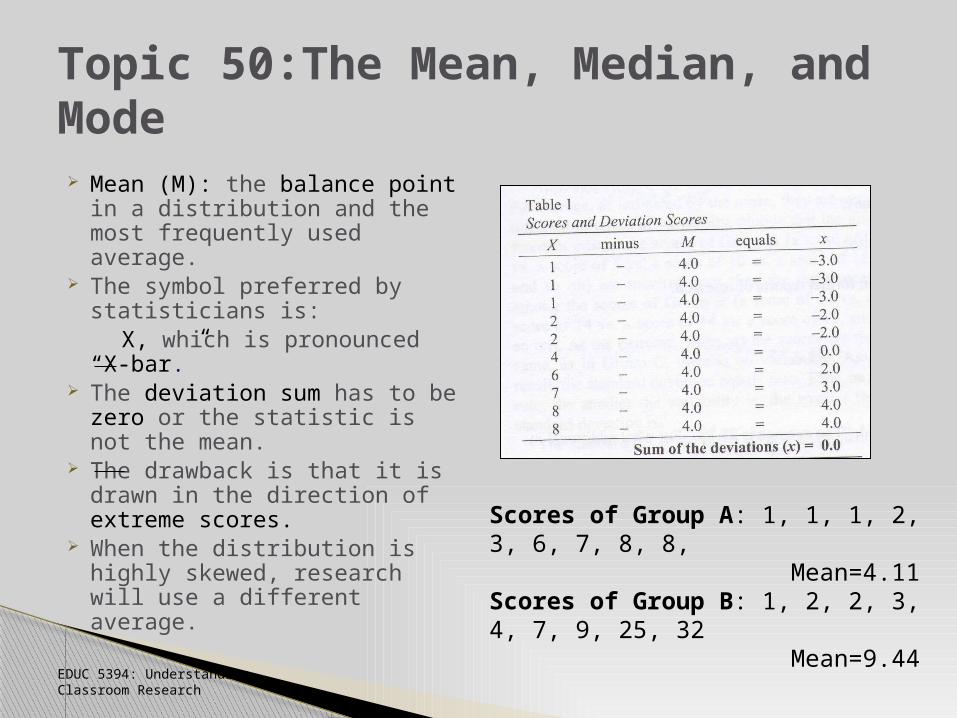
Topic 50:The Mean, Median, and Mode Mean (M): the balance point
in a distribution and the most frequently used average.
The symbol preferred by statisticians is:
X, which is pronounced “X-bar.”
The deviation sum has to be zero or the statistic is not the mean.
The drawback is that it is drawn in the direction of extreme scores.
When the distribution is highly skewed, research will use a different average.
EDUC 5394: Understanding Classroom Research
Scores of Group A: 1, 1, 1, 2, 3, 6, 7, 8, 8, Mean=4.11Scores of Group B: 1, 2, 2, 3, 4, 7, 9, 25, 32 Mean=9.44
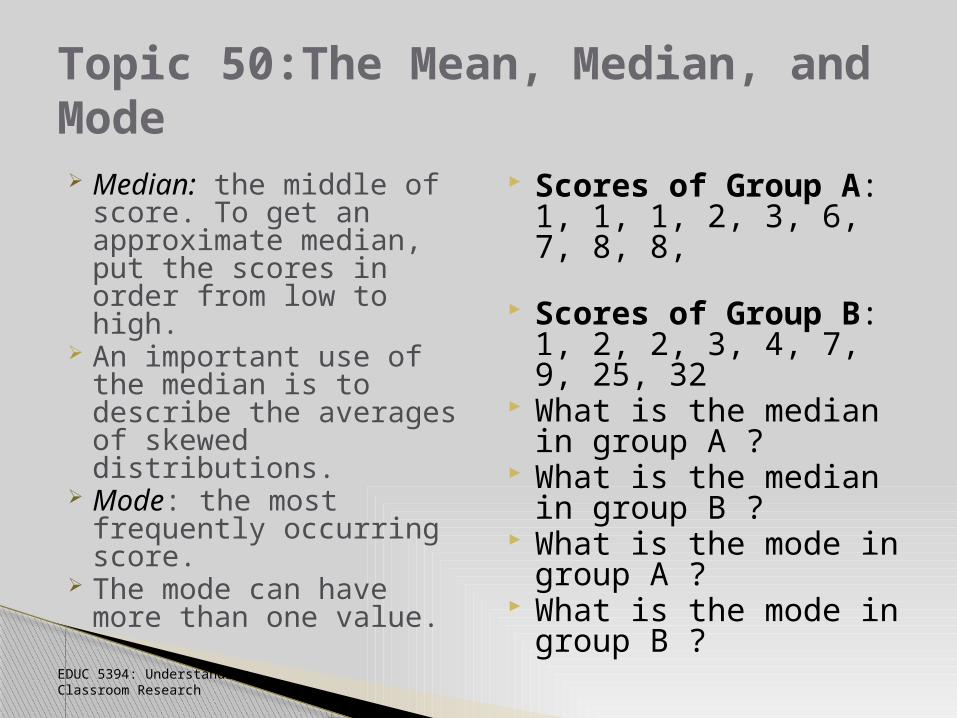
Topic 50:The Mean, Median, and Mode Median: the middle of
score. To get an approximate median, put the scores in order from low to high.
An important use of the median is to describe the averages of skewed distributions.
Mode: the most frequently occurring score.
The mode can have more than one value.
Scores of Group A: 1, 1, 1, 2, 3, 6, 7, 8, 8,
Scores of Group B: 1, 2, 2, 3, 4, 7, 9, 25, 32
What is the median in group A ?
What is the median in group B ?
What is the mode in group A ?
What is the mode in group B ?
EDUC 5394: Understanding Classroom Research
Because there is more than one type of average; therefore, the researchers indicate the specific type of average being reported with statement such as the mean is 4.11.
Average = measures of central tendency.
EDUC 5394: Understanding Classroom Research
Topic 50:The Mean, Median, and Mode
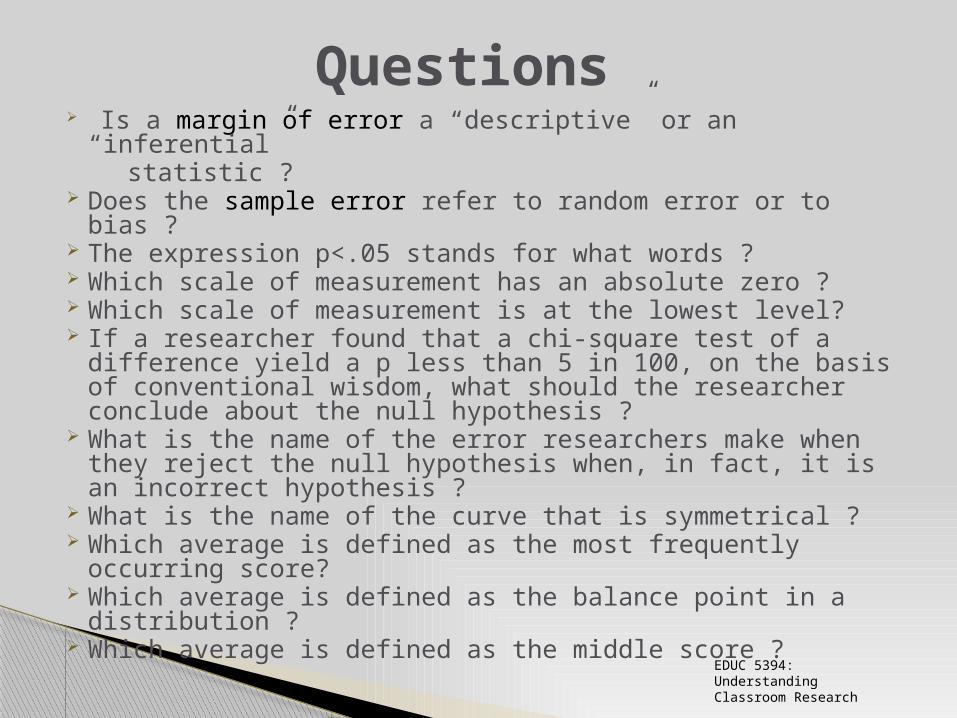
Is a margin of error a “descriptive” or an “inferential” statistic ? Does the sample error refer to random error or to bias ? The expression p<.05 stands for what words ? Which scale of measurement has an absolute zero ? Which scale of measurement is at the lowest level? If a researcher found that a chi-square test of a
difference yield a p less than 5 in 100, on the basis of conventional wisdom, what should the researcher conclude about the null hypothesis ?
What is the name of the error researchers make when they reject the null hypothesis when, in fact, it is an incorrect hypothesis ?
What is the name of the curve that is symmetrical ? Which average is defined as the most frequently
occurring score? Which average is defined as the balance point in a
distribution ? Which average is defined as the middle score ?
EDUC 5394: Understanding Classroom Research
Questions
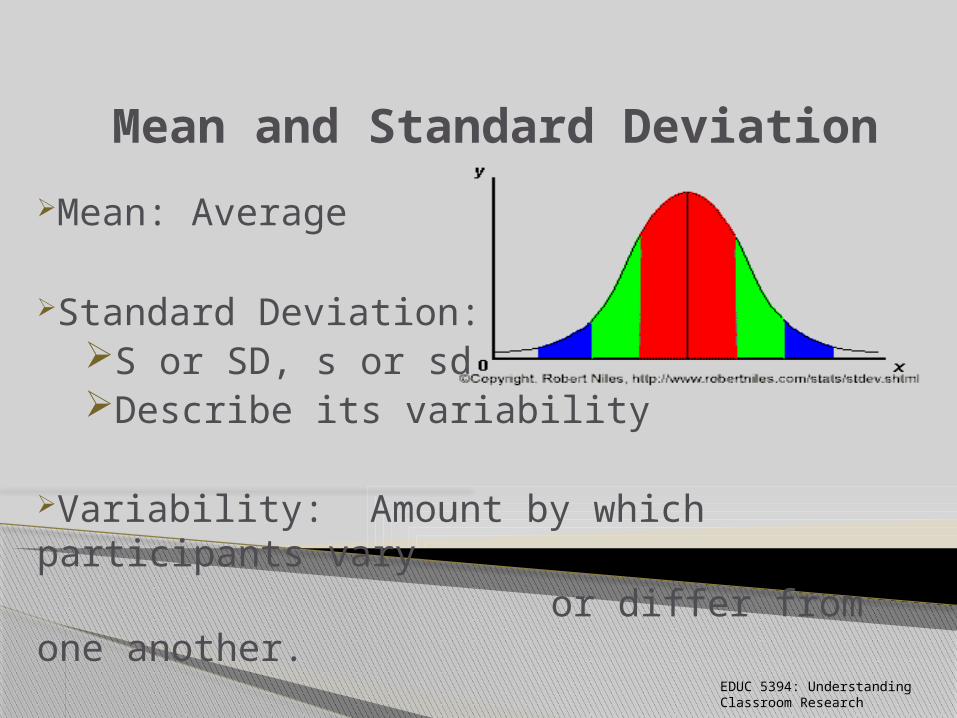
Mean and Standard Deviation
Mean: Average
Standard Deviation:S or SD, s or sdDescribe its variability
Variability: Amount by which participants vary or differ from one another.
EDUC 5394: Understanding Classroom Research
Median: The middle score in a distribution Used when distribution is highly skewed Used when data is ordinal
Range: Highest score minus the lowest score
Inter quartile range: Range of the middle two quarters
Describes the variability of the
average scores.
Median and Interquartile Range
EDUC 5394: Understanding Classroom Research
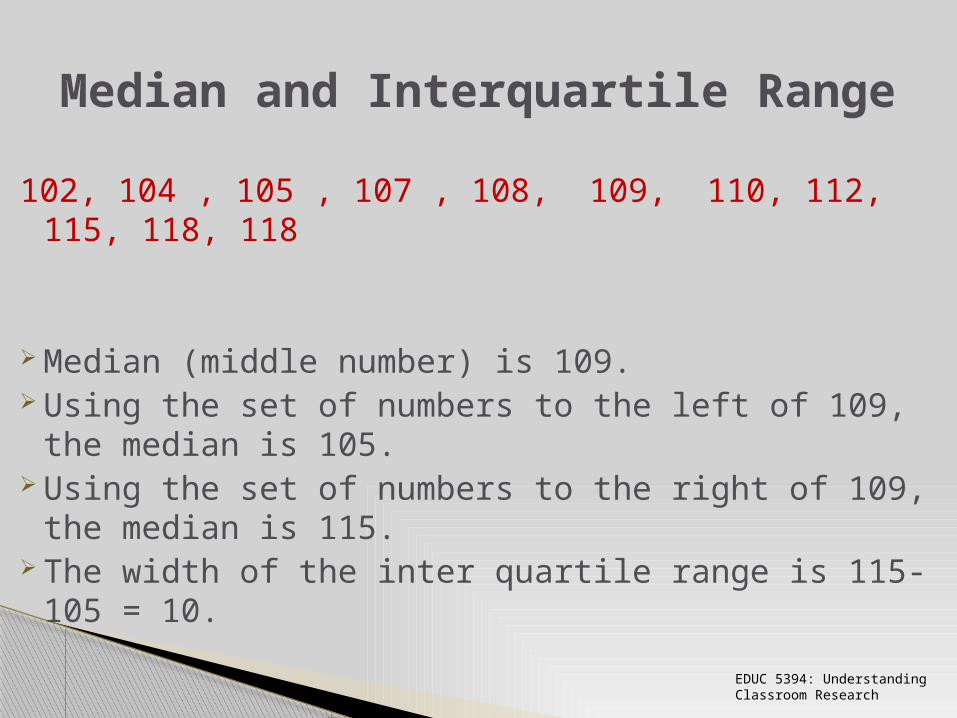
102, 104 , 105 , 107 , 108, 109, 110, 112, 115, 118, 118
Median (middle number) is 109. Using the set of numbers to the left of 109, the
median is 105. Using the set of numbers to the right of 109, the
median is 115. The width of the inter quartile range is 115-105 =
10.
Median and Interquartile Range
EDUC 5394: Understanding Classroom Research
Examines relationship between two quantitative sets of scores.
A statistic representing how closely two variables co-vary; it can vary from -1 (perfect negative correlation) through 0 (no correlation) to +1.
Indicates the strength and direction of a linear relationship between two random variables.
Could be used to determine relation between pre-test/post-test
Pearson Correlation Coefficient
EDUC 5394: Understanding Classroom Research
Often used to test null hypothesis regarding observed
differences between two means.
Assesses whether the means of two groups are statistically different from each other.
Only value of interest is p.
Example: Find the difference between mean scores of boys and girls on a timed basic facts test.
The t test
Analysis of variance called ANOVA Only one independent variable is being
considered Can compare a number of means Indicates whether a set of differences is
significant overall. Testing differences between more than two
groups or treatment.
One-Way Analysis of Variance
EDUC 5394: Understanding Classroom Research
An extension of the one-way analysis of variance
Two independent variables
The investigator can take into account simultaneously the effects of two factors on an outcome of interest. (say age, gender, and IQ)
Additionally, the investigator can test for interaction, if any, between the two factors.
Two-Way Analysis of Variance
EDUC 5394: Understanding Classroom Research
Statistical Significance-Whether a difference is reliable in light of random errors.
Practical Significance◦ Cost-benefit analysis◦ Crucial difference◦ Client acceptability◦ Public and political acceptability◦ Ethical and legal implications
Practical Significance of Results
EDUC 5394: Understanding Classroom Research
Robertniles.Com available from http://www.robertniles.com.stats/stdev.shtml
Answers.com available from http://www.answers.com/topic/interquartile-range
Socialresearchmethosd.net available from http://www.socialresearchmethods.net/kb/stat_t.php
Childrens-mercy.org available from http://www.childrens-mercy.org/stats/definitions/iqr.htm
Mste.uiuc.edu available from http://www.mste.uiuc.edu/patel/chisquare/keyprobanswer.html
Answers.yahoo.com available from http://answers,yahoo.com/question/index?qid=200061202052549AAz52s
Jaid.org available from http://www.jiad.org/article60 Roscoe, J. T. (1969). Fundamental Research Statistics. New York, NY: Holt,
Rinehart and Winston, Inc. Patten, M. L. (2009). Understanding Research Methods. Glendale, CA:
Pyrczak Publishing.
References
EDUC 5394: Understanding Classroom Research