Embed Size (px)
Citation preview

Copyright ©2013 by International Journal of Sales, Retailing and Marketing Vol. 2 No. 1 2013
IJSRM
EDITORS Mirko Palić, Ph.D. – Editor in Chief Marketing Department, Faculty of Economics and Business, University of Zagreb, Croatia [email protected] Professor Claudio Vignali, Ph.D. – Editor for the UK Professor of Retail Marketing Management Leeds Metropolitan University, UK [email protected] Professor Bernd Hallier, Ph.D. – Editor for Western Europe Managing Director of EHI Retail Institute President of The European Retail Academy [email protected] Professor John L. Stanton, Ph.D. – Editor for the USA Professor and Chairman of the Food Marketing Department, St. Joseph’s University, Philadelphia [email protected] Prof. Dr. Laetitia Radder, D.Comm – Editor for Africa & Asia Professor of Marketing, Nelson Mandela Metropolitan University, South Africa, [email protected]
www.ijsrm.com ISSN 2045-810X
International Journal of Sales, Retailing and Marketing is published by: Access Press UK 1 Hilllside Gardens Darwen, Lancashire, BB3 2NJ United Kingdom
IJSRM
Copyright ©2013 by International Journal of Sales, Retailing and Marketing Vol. 2 No. 1 2013
EDITORIAL BOARD
Barry Davies, University of Gloucestershire, UK [email protected] Maria Pollard, University of Falmouth, UK [email protected] Graham Orange, Coventry, UK [email protected] S. Henderson, Leeds Met University, UK [email protected] Bernd Britzlemaier, Pforzheim University, DE [email protected] Leo Dana, The University of Canterbury, NZ [email protected] Hans Rudiger Kaufmann, University of Nicosia [email protected] Dominique Gerber, Kempton University, DE [email protected] Gianpaolo Basile, University of Salerno, IT [email protected] Tomasz Wisniewski, Szczecin University, PL [email protected] Juergen Polke, Gloucestershire University [email protected] Enrico Bonetti, University of Naples, IT [email protected] Gianpaolo Vignali, Manchester University, UK [email protected] David Pollard, Leeds Met University, UK [email protected] Marko Grunhagen, Eastern Illinois Univ., USA [email protected] George Lodorfos, Leeds Met University, UK [email protected]
Iga Rudawska, University Szczecin Poland [email protected] Aftab Dean, Leeds Met University [email protected] Martin Samy, Leeds Met University, UK [email protected] Edyta Rudawska, Szczecin University, Poland [email protected] Krešimir Žnidar, Prizma, Zagreb Croatia [email protected] Daniela Ryding, UCLAN, UK [email protected] John Peters, Leeds, UK [email protected] Paul Elmer, UCLAN, UK [email protected] Katarzyna Byrka-Kita, Szczecin University Poland [email protected] Antonio Feraco, Nan yang University Singapore [email protected] Vitor Ambrosio, ESHTE, Portugal [email protected] Ivan Kovač, Croatian Bureau of Statistics [email protected] Sanda Renko, Faculty of Economics and Business, Zagreb, CRO [email protected] Razaq Raj, Leeds Met University, UK [email protected] Tahir Rashid, Salford University, UK [email protected]

Copyright ©2013 by International Journal of Sales, Retailing and Marketing Vol. 2 No. 1 2013
IJSRM
Subscription Fees 2013 subscriptions are available in a number of major currencies. Exchange rates and prices will be held throughout 2013. Subscription fees per volume are: $US 300 £Stg 150 $Aus 370 € 210 SFr 345 ¥ 33,740 Individual journal editions can be purchased at the following prices: 10 Journals @ £15 per journal 20 Journals @ £10 per journal 50 Journals @ £7 per journal Subscription information is available from the Publishers at: Access Press UK 1 Hilllside Gardens Darwen Lancashire BB3 2NJ UK +447815737243 Reproduction Rights The publishers of the International Journal of Sales, Retailing and Marketing have granted, free of charge, unlimited photocopying and other reproduction rights to subscribers, for teaching and study use within the subscribing organization. Authors may also photocopy or otherwise reproduce their particular case from The International Journal Sales, Retailing and Marketing, subject to an acknowledgement of publication and copyright details.

Copyright ©2013 by International Journal of Sales, Retailing and Marketing Vol. 2 No. 1 2013
1 Contents
Contents
Contents:
Editorial ................................................................................................................................................... 2
HIERARCHY OF NEEDS FOR IMPROVING RETAIL SERVICE QUALITY ........................................................ 3
Kelley O’Reilly
CUSTOMERS’ OPINION ON SMALL SCALE RETAIL STORES - A CASE STUDY .......................................... 21
K. Rama Mohana Rao & K. Ratna Manikyam
INNOVATIVE RECRUITMENT OF HIGH POTENTIALS: THE POTENTIAL BENEFITS OF ORGANISING
PROFESSIONAL STUDENT COMPETITIONS – RESULTS OF A CROSS-NATIONAL STUDY ......................... 34
Katalin Pádár
HOLLYWOOD AND FASHION: INFLUENCE ON APPAREL PURCHASE DECISIONS .................................. 50
Sanjukta A. Pookulangara, Tammy R. Kinley, Bharath M. Josiam & Daniel L. Spears
UNDERLYING DIMENSIONS OF PERCEIVED PERFORMANCE IMPROVEMENT AS A RESULT OF
ATTENDING MANAGERIAL SALES TRAINING PROGRAMS IN MALAYSIA: AN EMERGING MARKET
PERSPECTIVE ......................................................................................................................................... 64
M. Asri Jantan & Ayse N. Balas
WHAT CONSTITUTES AN ISLAMIC RETAILER? ISLAMIC STORE ATTRIBUTES FROM THE PERSPECTIVES
OF ISLAMIC MARKETING PRINCIPLES. ................................................................................................... 74
Abdul Rahim Abu Bakar & Siti Rahayu Hussin
Copyright ©2013 by International Journal of Sales, Retailing and Marketing Vol. 2 No. 1 2013
2
Editorial
It is with great joy that we stepped into a second year of publishing of the International Journal of Sales, Retail and Marketing The journal focuses on challenging and complex area of retailing, sales and marketing in general. Due to the increased competition in those fields and changing patterns of consumption, this area is bound to receive a lot of scientific and scholar attention in the future. There is a lot of space for investigating and for offering implications and strategic decisions to retailers and to all those who are involved in this business. Current issue of the journal is dedicated to six research papers of high academic quality
written by academics from U.S.A., India, Saudi Arabia, Hungary and Malaysia . The articles cover the core theories, empirical researches, essential research tools expanding the existing knowledge base about topics in retailing, sales and marketing and we hope that they will be read and cited in the future investigations and relieves dealing with this area. Until then we are working diligently to have the journal indexed in the respected data bases. We wish you an enjoyable reading!
Editors
3 HIERARCHY OF NEEDS FOR IMPROVING RETAIL SERVICE QUALITY
Copyright ©2013 by International Journal of Sales, Retailing and Marketing Vol. 2 No. 1 2013
Dr. Kelley OReilly is Professor at Department of Marketing, Western Michigan University, Haworth College of Business, 3141 Schneider Hall – Mail Stop #5430, Kalamazoo, MI 49008, U.S.A. (email: [email protected]).
HIERARCHY OF NEEDS FOR IMPROVING RETAIL
SERVICE QUALITY
Kelley O’Reilly, Ph.D.
Abstract
Developing, leveraging, and extending customer relationships is a priority of service firms. Findings
suggest that when firms do this successfully, this strategy can result in more customers, spending
more money on each visit, and referring other customers to the company. While front-line employees
(FLEs) understand this strategy, they believe that management does not prioritize the necessary
components, tools, and knowledge for effective customer-company interactions. Therefore, this work
contributes to the field by providing a conceptual hierarchy of components needed for FLEs to deliver
on management’s goals of developing, leveraging, and extending customer relationships in a
profitable manner.
Keywords: Front-line employees (FLEs), service quality, customer experience management (CEM),
customer relationships, retail.
INTRODUCTION
It has been said “Customers always
have an experience – good, bad, or indifferent –
whenever they purchase a product or service
from a company” (Berry, Carbone, and Haeckel,
2002, p. 88). Therefore, understanding,
improving, and effectively managing the
experience within a retail setting has been a
long-held priority for most retail management
teams and “remains a critical area for academic
research” (Grewal, Levy, and Kumar, 2009, p. 1).
Yet “the literature in marketing, retailing, and
service management historically has not
considered customer experience as a separate
construct” (Verhoef, Lemon, Parasuraman,
Roggeveen, Tsiros, and Schlesinger, 2009, p. 32)
and the construct remains fragmented (Palmer,
2010).
Loosely defined as a holistic perspective that
includes every point of contact that exists
between a company and the customer it serves,
customer experience management (CEM) is a
retailer’s strategy to engineer the customer’s
experience in such a way as to create value
both to the customer and the firm (Verhoef et
al., 2009). In line with the concept of service
dominant logic (Vargo and Lusch, 2004),
experience(s) between customer and company
may be influenced by the power and trust that
exists within the relationships beyond just the
customer-supplier dyad. Meaning, all actors in
the integration of resources used to create an
experience are relevant to the creation of value
throughout the value chain and the quality of
the interaction remains key (Fyrberg and
Jüriado, 2009). Supporting this notion:
Many retailers are realizing that their growth
and profitability are being determined by the
little things that make a big difference in
customer satisfaction and loyalty; for example,
easy interaction between the customers and

4 HIERARCHY OF NEEDS FOR IMPROVING RETAIL SERVICE QUALITY
Copyright ©2013 by International Journal of Sales, Retailing and Marketing Vol. 2 No. 1 2013
firm, consistency of the message across all the
communication channels, providing multiple
channels to interact and shop, and finally being
responsive to customer needs and feedback.
(Grewal et al., 2009, pp. 1-2)
Research supports the premise that effective
customer experiences promote customer
satisfaction and improve both customer loyalty
and company profitability (Frow and Payne,
2007; Gentile, Spiller, and Noci, 2007; Grewal et
al., 2009). At its simplest, good CEM strategy
has been described as being about creating a
point of differentiation in the consumer’s mind
through an experience rather than a product
(Frow and Payne, 2007; Hollbrook and
Hirschman, 1982; Patterson, Hodgson, and Shi,
2008). Therefore, whether the customer is
buying a power tool or a life insurance policy,
“A service experience is held in the mind and
not in the hands” (Ford and Bowen, 2008, p.
230), with the experience (good or bad) crafted
of physical and emotional constructs. Of note is
the difference between the concepts of
customer experience and customer experience
management. The former relates to everything
the customer feels, thinks, believes, and
perceives about the shopping experience, while
the latter is concerned with a retailer’s strategy
to engineer a positive experience for the
customer.
The literature suggests that, “Firms that
leverage service can build strong relationships
with customers that will generate barriers to
competition, increase customer loyalty, and
switching costs, and make market activities
more efficient” (Bolton, Grewal, and Levy 2007,
p. 1). Front-line employees (FLEs) and their
disposition towards customers is a leading
factor in generating customer loyalty (Bell,
Gilbert, and Lockwood, 1997; Cortiñas, Elorz,
and Villanueva, 2004), and it is well
documented that interactions with customers
(and resultant experiences and relationships)
are highly dependent on the actions of FLEs
(Beatty, Mayer, Coleman, Reynolds, and Lee,
1996; Berry, Parasuraman, Zeithaml, 1994;
Bitner, Booms, and Mohr, 1994; Bowers,
Martin, and Luker, 1990; Dean and Rainnie,
2009; Goff, Boles, Bellenger, and Stojack, 1997;
Gremler and Gwinner, 2008; Guenzi and Pelloni,
2004; Mittal and Lassar, 1996; Vella, Gountas,
and Walker, 2009; Zeithaml, Berry, and
Parasuraman, 1996, 1998). Yet FLEs are under-
researched as a group in the customer-company
interaction phenomenon.
Therefore, in line with the recommendation of
Berry et al., (2002) who suggest a first step
toward managing the total customer experience
involves “…in-depth interviews with customers
and employees to find out how people on both
sides of a transaction feel about different
aspects of an experience and the emotional
associations that go along with it” (p. 85), this
study attempts to fill a gap in the literature by
exploring the views of FLEs regarding how
customer-company interactions might be
improved.
REVIEW OF LITERATURE
Customer Experience Management (CEM)
Because this research is focused on the
perceptions of FLEs regarding customer-
company interactions, CEM and service quality
related literature addressing situational
variables such as employee attitude,
knowledge, store policies, service interface,
shopping atmosphere, price, assortment,
channel issues, and past customer experience(s)
(e.g. service recovery) are particularly relevant.
However, the data highlights some, but not all,
of these areas. The following areas emerged in
this research: (1) service interface, (2)
assortment, (3) channel issues, and (4) past
customer experience(s). Each of these will be
addressed in turn.
Service Interface
The interaction between FLEs and
customers is one critical element in the delivery
of good (or bad) service experiences. Ford and
Bowen (2008) argue that “[…] in both services

5 HIERARCHY OF NEEDS FOR IMPROVING RETAIL SERVICE QUALITY
Copyright ©2013 by International Journal of Sales, Retailing and Marketing Vol. 2 No. 1 2013
practice and research, there is an emphasis on
the linkage between internal employee
attitudes and external customer attitudes and
even service-firm profitability” (p. 232). Going
one-step further, retail employees may
influence customer perceptions, generate
favorable word-of-mouth, and affect the
company’s brand equity (Gremler and Gwinner,
2008; Goff et al., 1997; Plakoyiannaki, Tzokas,
Dimitratos, and Saren, 2008).
Research has attempted to identify the traits or
behaviors that positively impact customers such
as smiling, being friendly, acknowledging
customers when they enter, being able to
identify customer needs, and being immediately
available for customers (Bäckström and
Johansson, 2006; Baker, Parasuraman, Grewal,
and Voss, 2002; Homburg, Wieseke, and
Bornemann, 2009). These behaviors highlight
that there is more than simply a product or
service exchange at work and shed light on the
role that emotions play in the overall customer
experience. While multiple stores can offer the
same products or services, creating a strong
emotional bond through effective customer-
company interactions is an effective means to
thwart competitors (Berry et al., 2002).
While research suggests that accessibility of
retail employees can influence the interaction,
the quality of the interaction is also important.
Meaning, the competence of the retail
employee (e.g. their advice, suggestions, and
guidance to a customer) is as important as their
accessibility (Bäckström and Johansson, 2006;
Mittal and Lassar, 1996). Interestingly, the way
in which an FLE’s competence is demonstrated
is also important. For instance, selling style of
the FLE is highlighted in the research. Often
called “customer oriented selling” (Goff et al.,
1997) or “relationship selling” (Beatty et al.,
1996), it is suggested that selling style is
important and noteworthy when the retail
employee can offer a range of alternative
products and has product expertise, when the
purchase is complex, when there is a positive
relationship between the retail employee and
customer, and when referrals and repeat sales
are important to the company (Saxe and Weitz,
1982).
Assortment
Assortment has been studied from varying
perspectives and often includes factors that go
beyond the mere product choice in stores. For
instance, Baker et al., (2002) considered store
layout and design (e.g. the ability to find
merchandise quickly) as one key element. In
their study, design “cues” were shown to be
more influential and stronger than either store
employees or music in a retail setting. Yet,
getting the right product to the right place at
the right time for the right customer remains
one of the biggest challenges retailers face (see
Mantrala, Levy, Kahn, Fox, Gaidarev,
Dankworth, and Shah, 2009, p. 78, for a
snapshot of historical product assortment
planning (PAP) literature). Simply put, retailers
must determine what to stock, and then create
means by which to maintain a predetermined
number of SKUs (stock keeping units) on hand
(Broniarczyk, Hoyer, and McAlister, 1998). This
issue involves tradeoffs and a balancing of total
inventory dollars, fixed floor space, and a retail
philosophy of “broad versus deep” selection by
category (Mantrala et al., 2009). A location
offering a broad selection is often referred to as
a “category killer,” which connotes a retailer
that offers a huge assortment within specific
product categories (Huffman and Kahn, 1998).
“Big Box” retailers such as Wal-Mart, The Home
Depot, Barnes and Noble, and Toys R Us fit
nicely under the label of “category killer.”
Channel Issues
Multiple channel strategies within retailing
typically consist of traditional brick-and mortar
retail outlets, direct mail solicitation such as
catalogs, sales forces, telephony, e-commerce,
and m-commerce initiatives all designed to
target the same customer (Neslin, Grewal,
Leghorn, Shankar, Teerling, Thomas, and
Verhoef, 2006; Payne and Frow, 2004; Wallace,
Giese, and Johnson, 2004). Retailers use
multiple channel strategies for a variety of
6 HIERARCHY OF NEEDS FOR IMPROVING RETAIL SERVICE QUALITY
Copyright ©2013 by International Journal of Sales, Retailing and Marketing Vol. 2 No. 1 2013
reasons. Common reasons cited in the literature
include providing consumer choice (e.g. Neslin
et al., 2006; Payne and Frow, 2004), to respond
to competitor pressure (e.g. Grewal, Comer,
and Mehta, 2001), to minimize transaction
costs (e.g. Payne and Frow, 2005), and to
expand market coverage beyond the physical
footprint of brick and mortar locations (e.g.
Sousa and Voss, 2006).
The overall objective of multichannel
integration is to provide a significantly
enhanced customer experience that results in
higher customer satisfaction, and increased
sales, profits, and share of wallet. Ideally, this
should be accompanied by a lower cost to
serve, through alternative channels, lower in
the value chain, e.g., from direct sales force to
desk-based account management or a shift
from desk-based account management to the
adoption or increase in the use of electronic
solutions. (Payne and Frow, 2004, p. 534)
This objective as framed by Payne and Frow
speaks to an important provision in designing
CEM strategies: improved customer experience
must be achieved at an affordable cost,
implying that certain customers may hold
better potential for the company than others.
For instance, some customer groups may be
willing to pay for extra service that others may
not.
Providing customers more choice through
multiple channels is linked to higher levels of
customer satisfaction and loyalty (Wallace et
al., 2004). However, the validity of this linkage
is in question considering that “[…] in today’s
multi-channel environment a customer’s
experiences in one channel (e.g. a store) may be
affected by experiences in other channels (e.g.
the Internet)” (Verhoef et al., 2009, p. 33). The
potential that a service failure in one channel
may negatively affect future interactions in
other channels has led to interesting research
results. Wallace et al., (2004) assert that
“dissatisfaction does not appear to result from
cross-channel failures related to the complexity
inherent in multiple channel strategies” (p.
259), rather the dissatisfaction results from a
retailer’s failure to meet customers’
expectations. “Because of the importance of a
highly positive customer experience, the
channel strategy should seek to ensure such an
experience occurs both within channels and
across channels” (Payne and Frow, 2004, p.
532). Failure to do so may result in past
customer experiences that negatively influence
future interactions.
Past Customer Experience(s)
Past customer experiences are the result of
more than just “[…] making, enabling, and
keeping promises” (Bitner, 1995, p. 246).
Customer perceptions regarding their
experiences are a result of all the points of
contact a customer has with a company as well
as other environmental factors such as word-of-
mouth communication, company
communications, and contact with the company
and/or its competitors (Boulding, Kalra, Staelin,
and Zeithaml, 1993). Consequently, several
studies have taken aim at conceptualizing how a
customer’s past experience with a company
might influence their current or future
interactions. Boulding et al., (1993) argue that
current perceptions of service quality are a
blend of what customers believe will happen,
their expectation of what should happen, and
their perception of what actually happened
during the service encounter.
Over time, a customer may interact with a
company once or many times. Based on a
customer’s previous encounters with the
company, Hess Shankar, and Klein (2007) argue
that a customer will make an assessment of
how widespread the service failures are likely to
be in the company overall. If a customer has
had good previous experiences, they are more
likely to attribute subsequent poor service to
the specific FLE rather than the company as a
whole. While it is tempting to simply state that
training must be in place to ensure no service
failures, recent work in the area of conflict
management assumes that conflict is always
7 HIERARCHY OF NEEDS FOR IMPROVING RETAIL SERVICE QUALITY
Copyright ©2013 by International Journal of Sales, Retailing and Marketing Vol. 2 No. 1 2013
present and that it may help to define the
relationship (Hagel and Brown, 2005). However,
conflict must be “managed in a manner that
does not disrupt the ability of the members to
work together and maintain a beneficial
relationship from each member’s perspective”
(Koza and Dant, 2007, p. 291).
When service encounters fail, companies
implement various service recovery tactics. This
is a focal theme that emerged from the data
analysis of this study. However, research on this
topic within a retail context is limited (Bolton et
al., 2007). “The lack of an overarching
theoretical and methodological approach to
recovery research has left the field with
conflicting findings and no systematic
resolution” (Ringberg, Odekerken-Schröder, and
Christensen, 2007, p. 195). While Bendapudi
and Berry (1997) argue that, a utilitarian
rationale frames the customer-company
interaction; Ringberg et al., (2007) posit that
relational and oppositional models are also at
play thereby providing a cultural models
approach to service recovery that is intrinsically
linked to relationship and services marketing. A
cultural models approach as applied to service
recovery suggests that:
[B]reaches of less importance allow for
superficial or even scripted intervention related
to specific situational cues, breaches with high
self-relevance require adaptive responses that
match consumer recovery (identity-related)
cultural models. (Ringberg et al., 2007, p. 209)
For example, suppose you were in a video store
to rent a movie to watch that evening with
friends. If the FLE inadvertently suggested a
movie that was not in stock, you would likely
use a superficial cultural model and simply ask
for another recommendation. However, once at
your friends’ house, had the FLE inadvertently
put the wrong DVD disc in the case, (requiring a
return trip to the video store) the situation
would likely turn self-relevant because it
interferes with personal goal achievement (e.g.
looking “cool” by renting the latest movie
thriller instead of finding “Benji” tucked inside
the video case). Therefore, it is suggested that
understanding what cultural model is at play
can be helpful in effective service recovery
programs.
Research Purpose
What guides this research inquiry is the quest to
understand the views, perceptions, and beliefs
of FLEs and how these perspectives might help
improve customer-company interactions within
the retail domain. While customers may
interact and form relationships with a store,
department, or specific retail employee, the
focus here is on the interaction between the
FLE and customer. Although there is a vast
cache of literature exploring the service
interface from the customer perspective,
studies exploring the FLE as the main character
are less prolific (for notable exceptions see
Beatty et al., 1996; Dean and Rainnie, 2009;
Goff et al., 1997; Gremler and Gwinner, 2008;
Gruber, Szmigin, and Voss, 2009; Varca, 2009).
Customer-employee relationships can be
effective in positively affecting customer-
company relationships leading to loyalty
(Boulding, Staelin, Ehret, and Johnston, 2005;
Frow and Payne, 2007; Guenzi and Pelloni,
2004; Osarenkhoe, 2006; Yim, Tse, and Chan,
2008; Zeithaml et al., 1996, 1998). Moreover,
since FLEs are often more closely connected to
customers than management or external
parties such as vendors or consultants are, it is
logical to assume that their insights are as
valuable as those of any other stakeholder are.
METHOD
Because grounded theory is a research method
designed to allow focus on context, process,
intentions, and interpretations of key players
(Locke, 2001; O’Reilly, Paper and Marx, 2012), it
seemed the most useful and appropriate
methodology for the study. Data collection
occurred over the course of a six-month period
and was guided by the constant comparison
method, theoretical sampling, theoretical

8 HIERARCHY OF NEEDS FOR IMPROVING RETAIL SERVICE QUALITY
Copyright ©2013 by International Journal of Sales, Retailing and Marketing Vol. 2 No. 1 2013
coding and theoretical sensitivity related to
CEM (Glaser and Strauss, 1967). A variety of
data sources were used including open-ended
reciprocal interviews, member-checking
interviews, observation, and collection of
participant and researcher artifacts. In total, 18
participants (as shown in Table 1) were
interviewed and dozens of in-store observations
of these FLEs and others augmented the
transcription data. GT and these data sources
are appropriate for this inquiry since “[…]
qualitative research and existing process
theories may be applied to advance our
understanding of buyer-seller relationships and
relationship networks” (Plakoyiannaki and
Saren, 2006, p. 226). While this study focuses
on only one side of the customer-company dyad
(FLEs) for in-depth interviews, observations
occurring between FLEs and customers help to
rigorously contextualize the findings, analysis,
and interpretations of this work.
Table 1: In-Depth Interview Participant Profiles (US)
Pseudonym Company Description State
Alex National Bank UT
Beth Call Center UT
Brett Home Cleaning Business NJ
Brian Home Restoration Business UT
Dan Call Center UT
Donna Home Improvement Retailer UT
Dylan National Book Retailer UT
Grant Regional Drug Store Chain WA
James Home Improvement Retailer UT
John Home Cleaning Business UT
Josh Home Cleaning Business MI
Kim Call Center UT
Marcy Hair Salon and Spa UT
Matt Tire Retailer CO
Olive Home Improvement Retailer UT
Rebecca Home Cleaning Business GA
Sam National Pet Supply Retailer UT
Wendy Call Center UT
KEY FINDINGS
What Companies Want from Customer-
Company Interactions
From drug store manager to hairstylist and from
carpet cleaner to retail home improvement
store employee, all participants directly
referred to the need to develop a relationship
with customers as a common goal for customer-
company interactions. While the participants
are very diverse in nature and included
managers and rank-and-file retail employees as
well as both product sellers (e.g. pet supply and
bookstore employees) and service technicians
(e.g. carpet cleaner, hairstylist), customer-
company interactions are referred to as the
experience that would hopefully lead to a
relationship.
For instance, Alex, a bank manager, said, “We
have a whole process for the customer
experience that we focus on to make sure that
when the customer leaves they say, ‘Wow. That
was my bank and I had a really good experience
there.’” Rebecca talked about positive
customer-company interactions in more detail
and said, “Well, I think that the whole company
culture should be centered on delivering an
outstanding service experience… expressing
concern, listening to the customer, being
friendly, delivering the service in the way in

9 HIERARCHY OF NEEDS FOR IMPROVING RETAIL SERVICE QUALITY
Copyright ©2013 by International Journal of Sales, Retailing and Marketing Vol. 2 No. 1 2013
which you have been trained…” While the
specifics of the experience may have nuances
for particular businesses, common agreement
exists in the data regarding what companies
want from positive customer-company
interactions: (1) to develop relationships with
customers, (2) to leverage relationships with
customers, and (3) to extend relationships with
customers.
Develop Relationships
Developing relationships with customers is
commonly reported as the reason why positive
customer-company interactions are of vital
importance. Understanding that customers
have a choice when it comes to most products
and services, participants like Josh explained
that, “We treat them like they are a friend and
regular customers, and don’t just assume that
they are going to stick with us.” For
participants, developing a relationship with
customers means more than a single one-off
transaction; it means developing a good
(longer-term) relationship to help bring
customers back repeatedly. “Ultimately, we all
want customers to come back,” said Wendy.
FLEs recognize that the sustainability of their
companies is at the heart of this motivation for
a relationship with customers. For instance,
Marcy said, “We want repeat clients. Our whole
business revolves on that.” Doing what it takes
to bring customers back rewards the customer
(who experiences positive interactions), the
merchant (who benefits from repeat business),
and the FLE (who contributes to the value chain
experience through customer relationship-
building activities). This symbiotic condition is
the essence of co-creating value between
customers and all company stakeholders. Matt
explained this idea well when he said, “I want
them [customers] to know that when they leave
that we had their best interest at heart... that it
isn’t the almighty dollar; it is relationships and
families, and ultimately, then the profits come.”
In the minds of retail employees with a mindset
like Matt, without a positive experience,
customers are not likely to come back; and if
they do not come back, profitability is adversely
affected.
Leverage Relationships
Once a relationship is established, FLEs
are more likely (and able) to “cross sell”
additional products and services to customers.
Whether speaking with employees at banks, tire
stores, or carpet cleaning service businesses,
the ability to cross sell products and services to
customers is how employees “leverage”
customer relationships on behalf of their
companies. Simply put, “We do focus on the
cross sell…” explained Alex. Virtually all
participants supported this notion. “We are
trying to sell product, trying to get people to
come back… we do upgrade [sell premium
services] and try to add services on,” explained
Marcy. However, participants also recognized
that their ability to cross sell is directly affected
by their ability to first form a relationship with
customers. For instance, Josh said:
I don’t like to sell everything up front because I
think it is too overwhelming and too pricey if
you start there. But it is amazing that if you get
done with part of the job and the customer
feels comfortable with us, they are willing to
buy the extra services…but you have to gain
their trust first.
For some participants, while their actions are in
line with a cross sell mentality, the notion of
selling is not altogether desirable and many
framed their actions as recommendations
instead of selling. A good example of this is
Brett saying, “We are not there to sell you
anything. We are there to identify your needs
and then recommend the solution… and that
can lead into the cross selling on other items in
the home.” Regardless of the semantics,
employees view the relationship with
customers as vital for effective cross selling and
ultimately, for extending the relationship to
include customer referrals.
Extend Relationships
10 HIERARCHY OF NEEDS FOR IMPROVING RETAIL SERVICE QUALITY
Copyright ©2013 by International Journal of Sales, Retailing and Marketing Vol. 2 No. 1 2013
Retail employees view the evolution of
the relationship in linear terms: develop the
relationship (repeat purchases) → leverage the
relationship (cross sell) → and extend the
relationship (referrals). These steps prove to be
consistent across participants, venues, and
products/services with customer referrals
mentioned by several participants as the “Holy
Grail” of retailing. When you consider the
following comment, the value of referrals
becomes a bit clearer. “Our best franchisees
have high referral rates. These referrals
generate the least expensive customer lead and
are for a customer that the franchisee has a
high probability of delighting…” explained Brian.
This sheds light on the idea that a customer that
is referred to a company is more likely to
develop a relationship with that company, more
likely to spend more money via cross-selling by
the FLEs, and more likely to refer other
customers to the company. While a few leaps of
logic may exist in this scenario, this assumptive
thinking is consistent across participants. “The
only real true happy loyal customers you get are
those that come to you from referrals…”
proclaimed Brett. The analysis of the data
suggests that FLEs are well vested in the belief
that the evolution of the customer relationship
is linear and that the strength of the
relationship is measured by customer referral
rates.
What Affects Relationships
While many of the ideas covered thus far are
descriptive in nature, it was during these
descriptive accounts that employees began to
refer to issues of control (or the lack thereof)
that they believe affect customer-company
relationships. In an effort to delve deeper into
this area, FLEs were asked to share what they
could do to improve customer-company
interactions. The employee insights shed light
on their own role as well as the company
processes and the supporting technology in
place to support customer-company
interactions.
Issues of Control
The data suggests that FLEs consider certain
aspects of their job to be frustrating. Most
commonly, these aspects deal with situations or
protocols in which employees have very little
direct control. For instance, trying to handle
customer issues when the retail employee feels
s/he has no control over the advertising,
pricing, scheduling, or job assignments creates a
situation where the employee feels “caught in
the middle” and results in feelings of isolation,
resentment, or apathy. While employees are
expected to maximize opportunities created by
advertising, pricing, scheduling, or job
assignments, they believe that they have little
to no direct involvement in their creation and
instead, end up just “cleaning up the mess” that
result from these factors. While not always
explicit in their use of language regarding
control, FLEs are very clear that issues of control
are a key component affecting relationships
with customers. These control issues manifest
consistently across participants into three
categories: (1) The service experience, (2) the
product/service offering, and (3) service
recovery.
The Service Experience
The service experience is described by FLEs as
the interaction taking place over the phone, in-
store, or in the home. These experiences are
related to the actual shopping and purchase of
a product, or in the case of in-home service,
when the technician arrives to perform the
service.
Staffing. Inadequate staffing levels are
considered an obstacle to delivering effective
customer experiences. For instance Alex said, “I
would like to see a little more staffing just to
give us a little more staff to be able to handle
the busier times and to handle the customer
service experience instead of worrying so much
about hours.” For others, more staffing would
help to alleviate feelings of being

11 HIERARCHY OF NEEDS FOR IMPROVING RETAIL SERVICE QUALITY
Copyright ©2013 by International Journal of Sales, Retailing and Marketing Vol. 2 No. 1 2013
“overwhelmed.” Staffing levels are commonly
described as “worse than ever” and employees
feel “caught in the middle” since customer
complaints about “not finding someone to help
them” are one of the most common issues FLEs
have to face when dealing with customers.
Many participants reflected back to a time
when staffing was greater. For instance, Dylan
said:
When I first started working for the company,
they used to say that you couldn’t run a store
on anything less than 800 hours in payroll. Right
now, we average between 450 and 500 hours –
so it is about half of what it used to be… what
does that mean for customer service?
As part of the staffing conundrum, many FLEs
talk about the advantage of being able to take
more time with customers when there isn’t a
line or staffing is at the “right” level. They
believe that more time with customers helps to
build the relationship.
Pressure for cross selling. As mentioned,
employees are motivated (via goals, incentives,
or bonuses) to build relationships with
customers. This is typically framed by the
company as being “sensitive to customer needs
or making customers feel welcome.” Yet, the
purpose of the relationship as measured by the
company is “to sell something” rather than to
deliver good service for service’s sake.
Therefore, employees feel at times “abused” or
“used.” Participants believe that “management
doesn’t really understand” and that if FLEs push
too hard, the relationship may be damaged.
Tied to this idea is the need retail employees
feel to find balance and not just “push, push,
push; sell, sell, sell”… employees report wanting
to sell, but do not want sales to come at the
expense of their relationships with customers.
“I think there needs to be a balance between
the cross sell and the service and we have a lot
of pressure for that cross selling…constantly it is
a push and pull,” explained Alex. Driving the
cross selling activities of employees are goals.
Goals are commonly discussed but often are
mentioned by three standards: (1) what is good
for the company, (2) how retail employees are
measured against the goal, and (3) what is good
for the customer. For instance, when discussing
the goals a bank teller is measured against, Alex
said, “I mean if it comes down to meeting our
goals versus doing what is right, we are going to
do what is right.” While this seems noble, will
employee actions really follow this philosophy?
Will employees willingly forgo financial
payment (bonuses) and potentially mar their
performance records by not hitting their
performance goals to “do the right thing?” The
answers to these questions directly impact the
development of solid, long-term customer
relationships and recent research suggests that
incentives and performance goals of this nature
can negatively impact service quality (Poujol,
2009).
Scripted interactions. Retail employees are
simultaneously encouraged to “build
relationships” with customers and to “follow
protocol” that involves such things as: greeting
customers within 3 seconds, or opening a new
register if a customer line of 3 or more
customers forms. Such protocols are designed
to speed up the process for customers, and
hopefully build good relationships at the same
time. These “scripted interactions” are typically
viewed by employees as either positive or
negative with few expressing neutral feelings.
From the positive perspective, having more
scripted (automated) interaction protocols
helps to speed up work and minimize the
number of manual decisions that are made on
each transaction, and to normalize, standardize,
and therefore improve service delivery.
On the negative side, scripted interactions are
often viewed as inhibiting the interactions
between FLE and customer due to the lack of
flexibility and the restriction on the FLE’s ability
to respond to specific and individual customer
needs which is supported in the literature
(Patterson and Baron, 2010). John said it best,

12 HIERARCHY OF NEEDS FOR IMPROVING RETAIL SERVICE QUALITY
Copyright ©2013 by International Journal of Sales, Retailing and Marketing Vol. 2 No. 1 2013
“The first step is to listen. Reps often just get
hung up with scripted interactions and don’t
really listen to what the customer is asking for…
it takes effort and it takes very quick thinking to
avoid that.” Being locked into a certain “work
flow” for booking jobs is seen by employees as
negative. Often customers just want to “book”
but the agent is forced to follow a protocol
reliant on the sequence of screens to get
customer information first. These types of
system designs are often blamed on Marketing
and FLEs feel that these systems did not help
them interact positively with customers.
Training and product knowledge. When
discussing the service experience and their
ability to interact with customers, it is
interesting to note that employees talked in
terms of what could benefit them, rather than
what does benefit them. For instance, Donna is
keenly focused on training and the further
development of her product knowledge:
It is really good when an retail employee knows
how to fix it or has done it, they [customers]
really like it when you take them to a product
they need and talk to them about it and what
they are buying and explain to them the things
about the product. These are things that
impress the customer… when you actually know
about a product and can tell them about a
product.
However, as a cashier she indicated that she is
not given the same opportunities as FLEs who
work “on the floor.” Her use of language
suggests that cashiers are considered to have
lower status than other FLEs and she guessed
this to be true since “cashiers have the highest
turnover and are paid the lowest.” Considering
that cashiers are typically located at the front of
the store, they are likely the first employees to
interact with customers. In light of this, it is
interesting to consider that cashiers may have
been in their jobs for the shortest time (high
turnover), may be paid the least, and have less
training than other FLEs. This same trend
appeared in all of the traditional brick-and-
mortar retail locations included in this study,
with the exception of the tire store, where the
salespeople also act as cashiers.
The idea that training and product knowledge
could help create a more positive customer-
company interaction is shared across
participants. Yet, very few expressed confidence
regarding their current product knowledge.
“You still need to know so many different
things. When a customer comes in, they expect
to get answers…there is so much expected from
employees,” voiced Dan. For Olive, this lack of
knowledge created a great challenge when she
began and she shared that she was “so afraid
that customers would ask her a question that
she couldn’t answer.” Olive also admitted that
she has had customers “complain about
employees that don’t know anything.”
Technology. Like other participants, Wendy
feels that technology both helps and hurts
customer-company interactions: it helps from
the standpoint of being able to share
information to resolves issues quickly, and it
hurts from the perspective that it makes the
interactions less personal. She goes on to say,
“So you lose the people part of it and even with
all the systems and computers and booking a
carpet cleaning job online, eventually you need
a voice… you still need people.” This echoed a
surprising undercurrent from FLEs: technology
aversion. Marcy reflected, “… like the whole
texting thing is so huge, but I hate it. I’ll do it
out of necessity because that is what everybody
does. Nobody wants to talk anymore; it drives
me crazy.” Josh also feels strongly regarding
technology in the retail setting and explained, “I
think maybe it is a process that could be
changed… away from the mechanization or the
computerization of the business.” He went on
to say, “The more human beings we bring into
the company, the more successful we are.”
Resistance to technology may be simply that
FLEs feel threatened by it and its role in job
eliminations or staff reductions. Regardless,
13 HIERARCHY OF NEEDS FOR IMPROVING RETAIL SERVICE QUALITY
Copyright ©2013 by International Journal of Sales, Retailing and Marketing Vol. 2 No. 1 2013
most participants expressed a similar idea to
Dan’s, “Online booking is an impersonal
process, and is frustrating for customers.” John
supported this notion when he talked about the
likelihood of miscommunication with
customers, “Online is the worst, over the phone
is probably better, and face-to-face is the best.”
From the interviews, the notion emerged that
as retail operations grow, the focus shifts from
enhancing high-touch customer-company
interactions to streamlining low-touch, high-
tech transactions. Many participants insinuated
that their company is more concerned with
streamlining the transaction through
technology systems such as voice operated toll
free numbers, online ordering, and web-
enabled customer feedback surveys than the
company is with improving customer-company
interactions that occur face-to-face. Many
chalked this up to profit motives and this idea is
captured well by Josh when he said, “It seems
to me that they [company] are going to do
anything and everything they can to get more
profits. Period.”
During further questioning of participants, it is
clear that the idea of online systems is not
inherently negative, but that the current
systems in place are not well designed. For
most participants, it is the system design that
created the biggest customer-company
interaction challenges. Dan believes that as
companies get bigger, their service and the
means by which they communicate with
customers gets more impersonal. Dan says that
most of his customers will book either online or
over the phone, “Which is very impersonal.” As
an employee, Dan too finds it difficult to
navigate the 1-800 phone system of his
company, “To call the toll free number it’s a
maze…” In the words of Kim, “This would be
impossible but… if we could actually book
people and schedule it; not just enter it, then
they [customer] wouldn’t have to get a
separate phone call to see when they can
schedule.” Stronger sentiment for this issue is
voiced by Brian when he said, “They put the
customer lead in Siebel (store’s lead
management system) and then it goes off into
Siebel hell and ends up with us about 48 hours
later… so our close rate is much, much, much
worse.”
The constraints of poorly designed and
outdated systems that are not integrated
seemed core and consistent across participants.
In the words of Olive, “I think this system is
really outdated... I know they keep talking
about updating it because it is kind of hard to
manage and move around on because it is so
old …” James echoed this same thought:
A lot of our systems are not aligned
together…we’ll have to enter in our ID and code
six different times…if I want to do my email, I
enter in my password and code, if I want to get
into the store systems, do it again. If I want to
go into the store portal, I’ll enter it again. And
they are supposed to be working on rolling all
those together. These mobile carts right here,
this is what we order with…Same thing, they are
not integrated.
These comments indicate both a reluctance of
FLEs to fully embrace the technology systems of
their companies, and point to a lack of effective
system design, development, and
implementation in retail settings.
The Product/Service Offering
Advertising, pricing, and inventory stocking
levels are viewed as key issues consistently
being faced by retail employees. Participants
discussed advertising from the standpoint of
employees having little control over what
products are featured, what prices are
promoted, and whether inventory is ordered to
support the advertising. Brian talked about the
advertising this way, “…We send them
[corporate] what we think the ad should look
like, and they completely screw it up… no offer,
no call to action.” Employees feel as if they are
dealing with problems they did not create. “I
14 HIERARCHY OF NEEDS FOR IMPROVING RETAIL SERVICE QUALITY
Copyright ©2013 by International Journal of Sales, Retailing and Marketing Vol. 2 No. 1 2013
think in some ways, we have our hands tied
behind our backs a little bit because we don’t
set pricing, we just deal with the issues,” said
Beth.
Connected to the pressure to cross sell is the
idea that employees are held to certain
performance goals but are expected to sell
some products or services that are not
competitive. “We are not giving the best price
either, so we are almost competing with
ourselves… we lose a lot of jobs,” complained
Dan. Alex explained this in detail when he said,
“We should be a little more liberal with the
lending… our auto loan rates are at the higher
end so it is really hard for us to hit our loan
goals when our rates are higher than typical.”
Beth voiced this same concern, “We try to
compete with price, but we are usually a little
bit higher. Sometimes we are double the
competition.”
Consistent across participants is the importance
of having a good assortment and stocking
inventory of the items customers want. While a
seemingly simple idea, Grant explains, “The big
bugaboo in retail is that there are always new
products coming out all the time. The store
doesn’t get any bigger, so where do you put this
stuff?” Grant noted that larger companies tend
to focus more on inventory in terms of total
dollar inventories and turnover rates. These two
metrics tend to be easily measured by inventory
systems and involve more of a total inventory
rather than SKU-by-SKU analysis. Relying on
total dollar and inventory rates as sole
performance measures can result in a total
inventory value that meets company standards
yet still contains numerous SKU-by-SKU out-of-
stocks.
Considering Grant’s idea, it is interesting to
reflect upon the reliance of retailers on their
inventory systems. It is clear from the
participant interviews that these systems are
the key to inventory, stocking, and reordering
with few FLEs “allowed” to order or provide
stocking input. Yet it is typically the cashier, the
least-paid and least-trained employee, who is
responsible for correctly ringing up items,
handling customer returns, or product
exchanges. Accuracy at the cash register
provides the core data that the systems use to
determine stocking levels and replenishment.
Solely relying on perpetual inventory (dollar and
SKU) reports based on the entry by these junior
retail employees is unlikely to result in ordering
that will satisfy customer needs or enable the
organization to react well to emerging trends.
Reliance on such metrics also explains why out-
of-stocks are a common customer complaint
mentioned by participants.
Service Recovery
Service recovery, or the ways in which
customer-company conflict is handled, creates
challenges for FLEs across venues. Often the
process for service recovery inadvertently
places certain employees in the middle
between the company and customer interests
because they work at the service desk or handle
customer issues over the phone or via the
Internet. As Donna explained, “I used to work in
special services at the service desk… I love
that… you know, all the problems and whatever
came to that desk.” However, by creating
central foci for service recovery, only select
employees feel empowered to solve issues. For
all others, it can feel like a no win scenario. John
explained this idea, “We deal with that all the
time. The store says this and the customer says
that…So we get left holding the bag.” Adding to
the complexity, employees have varied views
and orientations as to how customer issues
should be resolved. Although Donna enjoyed
working at the service desk, she too felt the
acute pressure to conform to shifting demands
by management:
Someone once explained to me that retail is
kind of like a pendulum. Like sometimes, they
[management] are really strict about
procedures and policies and then the next year
they are super lax and want to make sure
customers are really happy…So I think that

15 HIERARCHY OF NEEDS FOR IMPROVING RETAIL SERVICE QUALITY
Copyright ©2013 by International Journal of Sales, Retailing and Marketing Vol. 2 No. 1 2013
there is always the need to find a balance. We
are definitely in the customer service phase
right now. When I first started - it was so
specific about markdowns, rules, and stuff like
that. And you know it didn’t matter if the
customer got frustrated, well it did, but the rule
went first. Now it’s like we don’t care – make
‘em happy, make ’em happy, make ’em happy. I
feel like it is too much since I work in returns.
Does that mean I have to take back everything?
In this scenario, we can glimpse how Donna
sees herself caught in the middle between
customer issues and management policies.
Stefan, Bowen, and Johnston (2009) support
this notion and argue that service recovery
efforts fail often due to unresolved tensions like
those described by Donna and others.
Considering that Donna works at a service desk
in a brick-and-mortar store, she may find it even
harder since she is dealing with customers face-
to-face. The data revealed a difference between
those employees dealing with customers face-
to-face and those interacting over the phone or
via the Internet.
Employees that deal with customers face-to-
face are more “relationship focused” than the
employees dealing with customers over the
phone or via the Internet. This contrast is very
clear when one considers the words of James,
who deals with customers face-to-face,
compared with Wendy, who typically deals with
customers over the phone. James said, “It is
really about keeping customers happy; our
district manager said, ‘We don’t have a return
policy. Just take it.’” In contrast, Wendy’s
perception is very different. She said, “The store
just throws money at it [customer issues], but
they don’t really make the customer feel good.”
The philosophical orientation of the FLEs
involved in service recovery seems related to
whether they believe that problems are being
resolved, or simply “swept under the rug.”
In addition, participants responsible for service
recovery efforts feel held to standard
procedures with no control over policy. Wendy
explained:
I wish those of us on the phone with the
customers had a little bit of something we could
do…something we could offer because that is
the hardest part when you are on the phone
handling the customer complaint… we can’t
really do anything.
Regardless of an FLE’s service recovery
orientation, most expressed frustration that
they had no “real control” and that their
managers “didn’t understand.” Beth explained
this well when she said, “I don’t think they
[management] understand…if they could see on
a daily basis what we have to deal with at the
customer level…I think they would be
surprised.”
MANAGERIAL IMPLICATIONS
Analysis of the issues described by FLEs
as factors affecting their relationships with
customers formed a hierarchy of needs that
retail employees believe will result in better
service, positive customer-company
interactions, and happier employees. This
hierarchy, culled from the data, is shown in
Figure 1 and is supported by recent research
findings (Ueno, 2010). The components of the
hierarchy are the result of one interesting
question: What would you change if you were
the President of the company? From the
responses, issues were categorized for likeness
and frequency across participants. While many
FLEs described the need for a positive “service
attitude,” it is clear that they believe their
attitude (good or bad) is conditional upon
whether management provides the
environment, knowledge, tools, and authority
FLEs need in their jobs.

16 HIERARCHY OF NEEDS FOR IMPROVING RETAIL SERVICE QUALITY
Copyright ©2013 by International Journal of Sales, Retailing and Marketing Vol. 2 No. 1 2013
Figure 1: Hierarchy of Needs for Positive Customer-Company Interactions
As mentioned previously, staffing is the
most mentioned “gap” cited by participants
across all business types. Without higher
staffing levels, employees perceive that positive
customer-company interactions cannot
develop, regardless of other hierarchical
components that may be in place such as
training or technology. Secondly, employees
believe that companies should ensure that all
employees are provided with training,
knowledge, and tools (technology) to perform
their jobs. This is an interesting finding since
many participants stated that their companies
prioritize these items in the reverse order with
management believing that they can staff the
stores with fewer employees if they train them
better. Also adding to the intrigue of this issue
is that both retail managers and rank-and-file
retail employees agree that customers’ most
common complaint is “not finding someone to
help them” followed by “finding a
knowledgeable employee to help.” These
common and agreed upon customer complaints
add credence to the position of FLEs regarding
the staffing and training of employees. Once
staffing levels are optimized and employees are
provided the proper training, knowledge, and
tools; employees are keenly focused on the
atmosphere, assortment, stocking levels, and
product quality and/or workmanship of the
product and/or service offering(s) as crucial for
relationship development. This hierarchical
component is viewed by employees in an
interesting way. As they see it, if the company
doesn’t have enough properly trained
employees “on the floor”; good workmanship
and service is unlikely to be delivered to
customers. However, with good coverage of
+
SERVICE ATTITUDE
SERVICE RECOVERY:
Employee Expertise & Authority
PRODUCT/SERVICE OFFERING:
Product Quality and Service Workmanship
PRODUCT/SERVICE OFFERING:
Atmosphere and Product Assortment
SERVICE EXPERIENCE:
Employee Training, Knowledge, and Tools
SERVICE EXPERIENCE:
Employee Staffing Levels

17 HIERARCHY OF NEEDS FOR IMPROVING RETAIL SERVICE QUALITY
Copyright ©2013 by International Journal of Sales, Retailing and Marketing Vol. 2 No. 1 2013
properly trained employees, better information
is likely to be supplied to management to help
improve product selection, assortment, and
quality. The last components on the hierarchy
relate to the service recovery efforts of the
company and the degree that employees are
empowered to handle customer issues and
inquiries. Without the ability to fully assist
customers, FLEs believe that customers and
employees become frustrated which directly
affects their service attitude.
Not surprisingly, retail employees consistently
indicate that all of the hierarchy’s components
are critical; i.e., the absence of any component
would cause service failures or customer-
company interaction breakdowns. While this
hierarchy is based on the perceptions of just
one side of the dyad (FLEs), it is interesting to
note that many of the companies in this study
prioritize the hierarchical components
differently than FLEs. Most notable is the idea
expressed by participants regarding how
management prioritizes these needs. For
example, FLEs believe that management uses
an inverse hierarchy whereby management
hires employees with the right service attitude
and provides extensive training to this small
unique pool of FLEs. By doing so, management
believes that the remaining hierarchical
components will “take care of themselves.”
Concluding Remarks
Developing, leveraging, and extending
customer relationships are a priority of service
firms. Done successfully, this strategy can result
in positive relationships with more customers,
who spend more money on each visit, shop
more frequently and generate new referral
sources for the company. Berry et al., (1994)
state,
Excellent service is a profit strategy because it
results in more new customers, more business
with existing customers, fewer lost customers,
more insulation from price competition, and
fewer mistakes requiring the reperformance of
services.
While FLEs understand this strategy, they
believe that management does not prioritize
the necessary components of the service
experience, product/service offering, or service
recovery initiatives properly for effective
customer-company interactions. Subsequently,
these managerial decisions of priority affect the
FLEs’ ability to develop, leverage, and extend
customer relationships. Therefore, by
reprioritizing the hierarchical components, FLEs
are more likely to deliver on management’s
goals of developing, leveraging, and extending
customer relationships in a profitable manner.
References
Bäckström, K., and Johansson, U. (2006). Creating and consuming experiences in retail store environments: Comparing retailer and consumer perspectives. Journal of Retailing and Consumer Services, Vol. 13, pp. 417-430.
Baker, J., Parasuraman, A., Grewal, D., and Voss, G. B. (2002). The influence of multiple store environment cues on perceived merchandise value and patronage intentions. Journal of Marketing, Vol. 66, pp. 120-141.
Beatty, S. E., Mayer, M., Coleman, J. E., Reynolds, K. E., and Lee, J. (1996). Customer-
sales retail employee retail relationships. Journal of Retailing, Vol. 72 (3), pp. 223-247.
Bell, J., Gilbert, D., and Lockwood, A. (1997). Service quality in food retailing operations: A critical incident Analysis. The International Review of Retail, Distribution and Consumer Research, Vol. 1 (4), pp. 405-423.
Bendapudi, N., and Berry, L. L. (1997). Customers’ motivations for maintaining relationships with service Providers. Journal of Retailing, Vol. 73 No. 1, pp. 15-37.
18 HIERARCHY OF NEEDS FOR IMPROVING RETAIL SERVICE QUALITY
Copyright ©2013 by International Journal of Sales, Retailing and Marketing Vol. 2 No. 1 2013
Berry, L. L., Carbone, L. P., and Haeckel, S. H. (2002). Managing the total customer experience. MIT Sloan Management Review, Vol. Spring, pp. 85-89.
Berry, L. L., Parasuraman, A., and Zeithaml, V. A. (1994). Improving service quality in America: Lessons Learned. Academy of Management Executive, Vol. 2, pp. 32-45.
Bitner, M. J. (1995). Building service relationships: It’s all about promises. Journal of the Academy of Marketing Science, Vol. 23 No. 4, pp. 246-251.
Bitner, M. J., Booms, B. H., and Mohr, L. A. (1994). Critical service encounters: The employee’s viewpoint. Journal of Marketing, Vol. 58, pp. 95-106.
Bolton, R. N., Grewal, D., and Levy, M. (2007). Six strategies for competing through service: An agenda for future Research. Journal of Retailing, Vol. 83 (1), pp. 1-4.
Boulding, W., Kalra, A., Staelin, R., and Zeithaml, V. A. (1993). A dynamic process model of service quality: From expectations to behavioral intentions. Journal of Marketing Research, Vol. XXX, pp. 7-27.
Boulding, W., Staelin, R., Ehret, M., and Johnston, W. J. (2005). A customer relationship management roadmap: What is known, potential pitfalls, and where to go. Journal of Marketing, Vol. 69, pp. 155-166.
Bowers, M. R., Martin, C. L., and Luker, A. (1990). Trading places: Employees as customers, customers as Employees. Journal of Services Marketing, Vol. 4 (2), pp. 55-69.
Broniarczyk, S. M., Hoyer, W. D., and McAlister, L. (1998). Consumers’ perceptions of the assortment offered in a grocery category: The impact of item reduction. Journal of Marketing Research, Vol. XXXV, pp. 166-176.
Cortiñas, M., Elorz, M., and Villanueva, M. L. (2004). Retail store loyalty management via an analysis of heterogeneity of the service elements,” The International Review of Retail, Distribution and Consumer Research, Vol. 14 (4), pp. 407-436.
Dean, A. M., and Rainnie, A. (2009). Frontline employees’ views on organizational factors that affect the delivery of service quality in call
centers. Journal of Services Marketing, Vol. 23 (5), pp. 326-337.
Ford, R. C., and Bowen, D. E. (2008). A service-dominant logic for management education : It’s time. Academy of Management Learning and Education, Vol. 7 No. 2, pp. 224-243.
Frow, P., and Payne, A. (2007). Special issue papers. Towards the ‘perfect’ customer experience. Brand Management, Vol. 15, pp. 89-101.
Fryberg, A., and Jüriado, R. (2009). What about interaction? Networks and brands as integrators within service-dominant logic. Journal of Service Management, Vol. 20 (4), pp. 420-432.
Gentile, C., Spiller, N., and Noci, G. (2007). How to sustain the customer experience: An overview of experience components that co-create value with the customer. European Management Journal, Vol. 25 (5), pp. 395-410.
Glaser, B. G. (1978). Theoretical sensitivity. Advances in the methodology of grounded theory. Mill Valley, CA: Sociology Press.
Glaser, B. G. (2001). The grounded theory perspective. Conceptualization contrasted with description. Mill Valley, CA: Sociology Press.
Glaser, B. G., and Strauss, A. L. (1967). The discovery of grounded theory. Hawthorne, NY: Aldine De Gruyter.
Glesne, C. (2006). Becoming qualitative researchers (third edition). Boston: Pearson.
Goff, B. G., Boles, J. S., Bellenger, D. N., and Stojack, C. (1997). The influence of salesperson selling behaviors on customer satisfaction with products. Journal of Retailing, Vol. 73 (2), pp. 171-183.
Gremler, D. D., and Gwinner, K. P. (2008). Rapport-building behaviors used by retail employees. Journal of Retailing, Vol. 84 (3), pp. 308-324.
Grewal, D., Comer, J. M., and Mehta, R. (2001). An investigation into the antecedents of organizational participation in business-to-business electronic markets. Journal of Marketing, Vol. 65 (July), pp. 17-33.
Grewal, D., Levy, M., and Kumar, V. (2009). Customer experience management in retailing:
19 HIERARCHY OF NEEDS FOR IMPROVING RETAIL SERVICE QUALITY
Copyright ©2013 by International Journal of Sales, Retailing and Marketing Vol. 2 No. 1 2013
An organizing Framework. Journal of Retailing, Vol. 85 (1), pp. 1-14.
Gruber, T., Szmigin, I., and Voss, R. (2009). Developing a deeper understanding of the attributes of effective customer contact employees in personal complaint-handling encounters. Journal of Services Marketing, Vol. 23 (6), pp. 422-435.
Guenzi, P., and Pelloni, O. (2004). The impact of interpersonal relationships on customer satisfaction and loyalty to the service provider. International Journal of Service, Vol. 15, pp. 365-384.
Gummesson, E. (2005). Qualitative research in marketing. Road-map for a wilderness of complexity and Unpredictability. European Journal of Marketing, Vol. 39 (3/4), pp. 309-327.
Hagel III, J., and Brown, J. (2005). Productive friction. Harvard Business Review, Vol. 83 (2), pp. 82-91.
Hess, R. J., Shankar, G., and Klein, N. M. (2007). Interactional service failures in a pseudo relationship: The role of organizational attributions. Journal of Retailing, Vol. 83 (1), pp. 79-95.
Hollbrook, M. B., and Hirschman, E. C. (1982). The experiential aspects of consumption: Consumer fantasies, feelings, and fun. Journal of Consumer Research, Vol. 9 (2), pp. 132-140.
Homburg, C., Wieseke, J., and Bornemann, T. (2009). Implementing the marketing concept at the employee-customer interface: The role of customer need knowledge. Journal of Marketing, Vol. 73 (4), pp. 64-81.
Huffman, C., and Kahn, B. E. (1998). Variety for sale: Mass customization or mass confusion? Journal of Retailing, Vol. 74 (4), pp. 491-513.
Koza, K. L., and Dant, R. P. (2007). Effects of relationship climate, control mechanism, and communications on conflict resolution behavior and performance outcomes. Journal of Retailing, Vol. 83 (3), pp. 279-296.
Locke, K. (2001). Grounded theory in management research. SAGE Publications Ltd, ISBN 978-0-7619-6428-5 (pbk).
Mantrala, M. K., Levy, M., Kahn, B., Fox, E. J., Gaidarev, P., Dankworth, B., and Shah, D.
(2009). Why is assortment planning so difficult for retailers? A framework and research agenda. Journal of Retailing, Vol. 85 (1), pp. 71-83.
Mittal, B., and Lassar, W. M. (1996). The role of personalization in service encounters. Journal of Retailing, Vol. 72 (1), pp. 95-109.
Neslin, S. A., Grewal, D., Leghorn, R., Shankar, V., Teerling, M. L., Thomas, J. S., and Verhoef, P. C. (2006). Challenges and opportunities in multichannel customer management, Journal of Service Research, Vol. 9 (2), pp. 95-112.
O’Reilly, K., Paper, D., and Marx, S. (2012). Demystifying grounded theory for business research. Organizational Research Methods, Vol. 15 (2), pp. 247 - 262. DOI 10.1177/1094428111434559.
Osarenkhoe, A. (2006). Customer-centric strategy: A longitudinal study of implementation of a customer relationship management solution. International Journal of Technology Marketing, Vol. 1, pp. 115-144.
Palmer, A. (2010). Customer experience management: A critical review of an emerging idea. Journal of Services Marketing, Vol. 24 (3), pp. 196-208.
Patterson, A., and Baron, S. (2010). Deviant employees and dreadful service encounters: Customer takes of discord and distrust. Journal of Services Marketing, Vol. 24 (6), pp. 438-445.
Patterson, A., Hodgson, J., and Shi, J. (2008). Chronicles of ‘customer experience’: The downfall of Lewis’s Foretold. Journal of Marketing Management, Vol. 24 (1/2), pp. 29-45.
Payne, A., and Frow, P. (2004). The role of multichannel integration in customer relationship management. Industrial Marketing Management, Vol. 33, pp. 527-538.
Payne, A., and Frow, P. (2005). A strategic framework for customer relationship management. Journal of Marketing, Vol. 69, pp. 167-176.
Plakoyiannaki, E., and Saren, M. (2006). Time and customer relationship management process: Conceptual and methodological insights. Journal of Business and Industrial Marketing, Vol. 21 (4), pp. 218-230.
20 HIERARCHY OF NEEDS FOR IMPROVING RETAIL SERVICE QUALITY
Copyright ©2013 by International Journal of Sales, Retailing and Marketing Vol. 2 No. 1 2013
Plakoyiannaki, E., Tzokas, N., Dimitratos, P., and Saren, M. (2008). How critical is employee orientation for customer relationship management?” Insights from a case study. Journal of Management Studies, Vol. 45 (2), pp. 268-293.
Poujol, J. G. (2009). Management of sales advisers and service climate: An experiment. Journal of Service Management, Vol. 20 (3), pp. 274-289.
Ringberg, R., Odekerken-Schröder, G., and Christensen, G. L. (2007). A cultural models approach to service Recovery. Journal of Marketing, Vol. 71, pp. 194-214.
Saxe, R., and Weitz, B. A. (1982). The SOCO scale: A measure of the customer orientation of salespeople. Journal of Marketing Research, Vol. 19 (August), pp. 343-351.
Sousa, R., and Voss, C. A. (2006). Service quality in multichannel services employing virtual channels. Journal of Service Research, Vol. 8 (4), pp. 356-371.
Stefan, M., Bowen, D., Johnston, R. (2009). Why service recovery fails: Tensions among customer, employee, and process perspectives. Journal of Service Management, Vol. 20 (3), pp. 253-273.
Ueno, A. (2010). What are the fundamental features supporting service quality? Journal of Services Marketing, Vol. 24 (1), pp. 74-86.
Varca, P. E., (2009). Emotional empathy and front line employees: does it make sense to
care about the customer? Journal of Services Marketing, Vol. 23 (1), pp. 51-56.
Vargo, S. L., and Lusch, R. F. (2004). Evolving to a new dominant logic for marketing. Journal of Marketing, Vol. 68, pp. 1-17.
Vella, P. J., Gountas, J., and Walker, R. (2009). Employee perspectives of service quality in the supermarket Sector. Journal of Services Marketing, Vol. 23 (6), pp. 407-421.
Verhoef, P. C., Lemon, K. N., Parasuraman, A., Roggeveen, A., Tsiros, M., and Schlesinger, L. A. (2009). Customer
experience creation: Determinants, dynamics and management strategies. Journal of Retailing, Vol. 85 (1), pp. 31-41.
Wallace, D. W., Giese, J. L., and Johnson, J. L. (2004). Customer retailer loyalty in the context of multiple channel Strategies. Journal of Retailing, Vol. 80, pp. 249-263.
Yim, C. K. B., Tse, D. K., and Chan, K. W. (2008). Strengthening customer loyalty through intimacy and passion: Roles of customer-firm affection and customer-staff relationships in services. Journal of Marketing Research, Vol. XLV, pp. 741-756.
Zeithaml, V. A., Berry, L. L., and Parasuraman, A. (1998). Communication and control processes in the delivery of service quality. Journal of Marketing, Vol. 52 (April), pp. 35-48.
Zeithaml, V. A., Berry, L. L., and Parasuraman, A. (1996). The behavioral consequences of service quality. Journal of Marketing, Vol. 60 (April), pp. 31-46.
21 CUSTOMERS’ OPINION ON SMALL SCALE RETAIL STORES - A CASE STUDY
Copyright ©2013 by International Journal of Sales, Retailing and Marketing Vol. 2 No. 1 2013
Dr. K. Rama Mohana Rao, M.Com., M.B.A., Ph.D. Is Professor at Department of Commerce and Management Studies, Andhra University, Visakhapatnam, A.P., India. Mobile: 9949669929 (e-mail: [email protected]) Dr. K. Ratna Manikyam, M. Com., M.B.A., M. Phil., Ph.D. is Lecturer at Department of Commerce Sri A.S.N.M. Government College, Palakol, W.G. Dist., A.P., India
CUSTOMERS’ OPINION ON SMALL SCALE RETAIL
STORES - A CASE STUDY
K. Rama Mohana Rao & K. Ratna Manikyam
Abstract
Indian Retail sector is dominated by small scale retails. Organized sector occupied only 5 per cent
share in the total retailing. The presence of millions of small scale retails in different product
categories makes to realize that the large number of people is depending on this activity. In the light
of severe competition threats from the fast growing and more challenging big retailers in the fast
changing scenario, the survival and growth of small scale retailing depends upon their ability to
provide customer satisfaction. Customer loyalty and support are the pillars of success for these
retailers. The present study aims to study the opinion of customer on small scale retail
establishments. The customers’ opinion on facilities, ambience factors, communication, sales
promotion techniques, and services performance of small scale retailers are ascertained and
analyzed in this paper.
Keywords: Ambience factors, Customer loyalty, Means of Communication, Retailing, Sales promotion
techniques,
Introduction
Retailing involves selling goods and services in
small quantities directly to customers. It
consists of all activities involved in marketing of
goods and services to consumers directly for
their personal, family and household use. The
retail industry in India has come forth as one of
the most dynamic and fast paced industries
with several players entering the market
(Dhanabhakyam M. and Shanthi A). The retail
opportunities are at the peak in recent years.
The new entrants into the business find
excellent opportunities to establish themselves
and to achieve desired growth. India is expected
to account for the third largest share at US$ 2.7
billion in 2015 in Asia (Research Firm Ovum,
2011). According to the Business Monitor
International’s (BMI) India Retail Report for the
second-quarter of 2011, the total retail sales in
India will grow from US$ 395.96 billion in 2011
to US$ 785.12 billion by 2015. Strong underlying
economic growth, population expansion, the
increasing wealth of individuals and the rapid
construction of organized retail infrastructure
are key factors behind the forecast growth.
With the expanding middle and upper class
consumer base, there will also be opportunities
in India's tier II and III cities (www.ibef.org). The
Indian retailing industry is becoming intensely
competitive, as more and more players are
vying for the same set of customers.
Retail in India – Historical Perspective
The Indian retail industry is divided into
organized and unorganized sectors. Organized
22 CUSTOMERS’ OPINION ON SMALL SCALE RETAIL STORES - A CASE STUDY
Copyright ©2013 by International Journal of Sales, Retailing and Marketing Vol. 2 No. 1 2013
retailing refers to trading activities undertaken
by licensed retailers such as those who are
registered for sales tax, income tax, etc. These
include the corporate-backed hypermarkets and
retail chains, and also the privately owned large
retail businesses. Unorganized retailing, on the
other hand, refers to the traditional formats of
low-cost retailing, such as the local kirana
shops, owner manned general stores,
paan/beedi shops, convenience stores,
handcart and pavement vendors, etc(
www.cci.in).
In the beginning there were only kirana stores
called Mom and Pop Stores, the friendly
neighbourhood stores selling every day needs.
In the 1980s manufacturer’s retail chains like
DCM, Gwalior Suitings, Bombay Dyeing, Calico,
Titan etc. started making its appearance in
metros and small towns. Multi brand retailers
came into the picture in the 1990s. In the food
and FMCG sectors retailers like Food world,
Nilgiris are some of the examples. In music
segment Planet M, Music world and in books
Crossword and Fountainhead are some others.
Shopping Centres began to be established from
1995 onwards. A unique example was the
establishment of margin free markets in Kerala
(Sreejith A. and Jagathy Raj V. P, 2007). The 21st
century saw the emergence of super markets
and hyper markets. Big players like Reliance,
Bharti, Tatas, HLL, ITC etc. entered into the
organized retail segment. The international
retail bigwigs are waiting in the wings for
favorable FDI guidelines to establish their own
retail outlets in the country.
According to CPAS study, the unorganized retail
sector of small and medium retailers employs
over 40 million people. There are 11 retail
outlets for every 1000 people (Singhal, Arvind
1999) in India. This fact suggests a considerable
element of ‘forced employment’ in this sector.
Only 4 per cent of India’s 11 million retail
outlets have floor areas in excess of 500 sq.ft.
(Anil Sasi, 2004). This should dispel any image of
any preponderance of large-scale retailing we
may have derived to the size of the old
established downtown retail outlets and in the
new suburban malls. Retail in India is mostly the
millions of tiny shops with pucca and semi-
pucca premises, and millions more on handcarts
and pavements (Mohan Guruswamy and Kamal
Sharma).
Reasons for Retail Sector Boom in India
The most important factors responsible for
retail sector development in India are
liberalization of the economy, upward mobility
of middle class, shifting consumer demands,
and expansion of ICTs (A.T.Kearney Report,
2007). Since the liberalization of the economy
there has been a visible impact on the income
level of the middle class, which as a whole is
upwardly mobile, with a huge disposable
income in hand. Along with this there has been
a change in the spending habits with more
focus on improving the quality of life through
increasing consumption of high end products,
which previously the middle class refrained
from using (Shaoni Shabnam and Bino Paul G.D,
2008). Thus, the changes in economic and
industrial policies in India, growth in the size of
middle income households, changes in
consumer buying and consumption habits,
technology and information access to
consumers, and the changing life styles are
some of the prominent reasons for retail sector
boom in India.
Indian shoppers are very different in many ways
from their counterparts elsewhere in the world.
Loyalty is not a virtue with the Indian shopper.
According to Mc Kinsey report in Indian retail
great Indian bazaar, around 60 per cent of the
consumers surveyed bought from more than
one retailer compared with 10 per cent in Brazil
and 24 per cent in China. Indian consumers
associate packaged food with lack of freshness
and it is not surprising that almost 65 per cent
of respondents indicated they will never buy
packed fruits or vegetables compared to 24 per
cent in China and 6 per cent in the US. Also,

23 CUSTOMERS’ OPINION ON SMALL SCALE RETAIL STORES - A CASE STUDY
Copyright ©2013 by International Journal of Sales, Retailing and Marketing Vol. 2 No. 1 2013
shoppers in India place a lot of importance on
convenience. Around 64 per cent buyers
surveyed said they do not mind paying extra for
conveniently located stores, compared with 31
per cent in China. According to the survey,
women in India prefer ethnic apparel and
jewellery. More than 75 per cent women’s
clothing and 85 per cent jewellery sold in India
are traditional in style and design. Around 38
per cent shoppers in India said they buy clothes
mostly for special occasions; only 6 per cent
Chinese and 3 per cent Russians are driven by
occasions for most of their apparel purchase.
Indian shoppers are willing to compromise a bit
on food and grocery, the survey says. For
instance, 57 per cent respondents said buying a
well-known brand of shampoo is important;
while as many as 49 per cent indicated that
they were willing to buy lesser-known brands.
When it comes to electronic goods, almost 85
per cent shoppers said they would only go with
a reputed brand (Great Indian Bazaar, 2008).
The Indian consumers are not simple and
accepting, they want the lowest prices for the
best quality at convenient locations along with
quality service and some freebies thrown in for
good measure. Success in India depends on
understanding the complexities of a diverse
country, evaluating its potential in terms of a
company’s customer focus and having a plan
that can be adapted to the Indian consumer.
Retail in India has always been a lucrative
business. Traditionally, the Vaishya’s were the
trader class and their businesses were passed
on from father to son. Even now, small family-
run stores, also called Kiranas, offer consumers
low prices, convenient locations, longer store
hours and home delivery at no extra charge.
Not surprising that they have traditionally
dominated the Indian retail sector. These stores
have low operating costs as they employ
household labour and usually pay no taxes.
According to a Research and Markets study, in
2003 there were over 12 million retail stores in
India, of which about 78 per cent were small
family run enterprises using family labour.
India’s retail industry has traditionally followed
no recognizable format, but has grown
organically, attuned to local needs. This has
made it hard for traditional retailers to adapt to
new ways of doing business and competing with
international retailers (Shalini Bahadur, 2006).
Small scale retailers continue to play vital role
in Indian retailing in spite of the tremendous
growth of organized retailing in recent years.
The consumers are lured by the big retailers by
providing many shopping experiences. The fact
is that the big and small retailers are fighting for
the same consumer. In the changing scenario,
the studies of consumer opinion are small scale
retailers proves vital for the sector and to the
policy makers. The present study was taken up
with an objective of eliciting customer opinion
on various aspects of small scale retailing and to
identify gaps between customer expectations
and the retailer services.
Research Methodology
The study covers small scale retail units in
different retail categories. For the purpose of
the study, five retail categories were selected
based on the number of retailing units
established in Andhra Pradesh. The five
categories selected for the study are food and
grocery, textile and apparel, electrical and
electronics, jewellery, and footwear. To elicit
the opinion of the customers on small scale
retail establishments, a sample of 450
customers are selected from the three regions
of the state viz, Coastal Andhra, Telangana and
Rayalaseema. Scaling techniques were used to
measure the opinions and weighted scores are
calculated for analysis and interpretation.
Scaling technique is used to ascertain opinions.
The five point scale ranging from strongly agree
to strongly disagree was used. The data
obtained with the use of likert scale has been
converted into weighed scores as shown below.
Scale: Weight
Strongly agree 5

24 CUSTOMERS’ OPINION ON SMALL SCALE RETAIL STORES - A CASE STUDY
Copyright ©2013 by International Journal of Sales, Retailing and Marketing Vol. 2 No. 1 2013
Agree 4
Neutral 3
Disagree 2
Strongly disagree 1
Score: n x rating x weight
Wherever scores are calculated weighed mean,
and percentage to Maximum possible score
(MPS) are calculated for data analysis.
Likert scale: MPS of any variable = 5
n of variable x 5 = MPS of that variable.
(The score obtained by each variable/MPS) x
100 = % to MPS
(Total number of respondents x Maximum
weight = MPS)
For example:
Particulars Food & Grocery
Score 64
Maximum Score N x max. weight = 45 x 3 = 135
% to MPS (64/135) x 100 = 47.41
The following are the findings of the study.
A. Opinion on Facilities Offered
The opinion of the respondents on facilities
provided by small scale retailers was presented
in Table 1. The facilities include space to move
freely in the shop, access to product-shelves,
delivery of goods ordered through telephone,
exchange of products, support of the sales
personnel and desired goods in stock. The study
reveals that ‘space to move freely in the shop’ is
the top rated facility which secured a score of
7818 representing 69.49 per cent to MPS (mean
value 3.47). ‘Desired goods in stock’ is the
facility that secured the second place in rating
with a score of 7299 which represents 64.88 per
cent to MPS (mean value 3.24). The facility that
is rated third was ‘support of sales personnel’.
This facility secured a score of 6833
representing 60.74 per cent to MPS. The scores
obtained by each facility as a percentage to
MPS varied between 51.82 per cent and 69.49
per cent. The mean values of the facilities
varied between 2.80 and 3.47.
Table 1: Opinion on the facilities offered by the small scale retailers.
Particulars Score WM % to MPS
Space to move freely in the shop 7818 3.47 69.49
Access to product-shelves 6696 2.98 59.52
*Delivery of goods ordered through
telephone 2332 2.59 51.82
Exchange of products 6308 2.80 56.07
Support of the sales personnel 6833 3.04 60.74
Desired goods in stock 7299 3.24 64.88
WM=Weighed Mean, MPS=Maximum Possible Score
* Applicable only to food and grocery and electrical and electronics categories.
Source: primary data
Table 2 presents the top three rated opinions
on the facilities provided by different categories
of small scale retailers. ‘Desired goods in stock’
and ‘Space to move freely in the shop’ are the
two factors found in the top three ratings of
four categories. ‘Support of the sales

25 CUSTOMERS’ OPINION ON SMALL SCALE RETAIL STORES - A CASE STUDY
Copyright ©2013 by International Journal of Sales, Retailing and Marketing Vol. 2 No. 1 2013
personnel’ is the factor identified in three
categories. ‘Access to product shelves’ was
considered as important facility in textile and
apparel and jewellery categories. ‘Delivery of
goods ordered through telephone’ is one of the
top rated facilities in food and grocery
categories while ‘exchange of products’ is the
facility specially recognized in textile and
apparel category.
Table 2: Top three rated opinions on the facilities provided small scale retail shops.
Factor
Ratings Food & Grocery
Textile &
Apparel
Electrical &
Electronics Jewellery Footwear
1 Desired goods in
stock
Space to move
freely in the
shop
Desired goods in
stock
Space to move
freely in the
shop
Space to move
freely in the
shop
2 Support of the
sales personnel
Access to
product-shelves
Space to move
freely in the shop
Access to
product-shelves
Desired goods in
stock
3 Delivery of goods
ordered through
telephone
Exchange of
products
Support of the
sales personnel
Desired goods in
stock
Support of the
sales personnel
Source: primary data
B. Opinion on Ambience Factors
Ambience factors play an important role in
marketing of retail services. These factors
influence the behaviour of the consumers in
participation of the service production and
consumption process. The opinion of the
respondents was elicited in the study on the
factors such as lighting, ventilation, colouring
walls and ceiling, decoration, air conditioning,
store display, cleanliness, spatial layout,
signage, seating arrangements, and orderly
placement of products. The data presented in
Table 3 reveals that ‘lighting’ is the highly rated
ambience factor. This factor got an overall
score of 8803 which represents 78.29 per cent
to MPS. ‘Orderly placement of the products’
got the second place with a score of 7665
representing 68.13 per cent to MPS.
‘Cleanliness’ occupied the third place with a
score of 7572 per cent to MPS. All the
ambience factors rated by the respondents got
mean values >3 each except the factor ‘air
conditioning’. The scores obtained by each
factor as percentage to MPS varied between
55.68 per cent and 78.29 per cent.
Table 3: Opinion on the ambience factors of small scale retailers
Particulars Score WM % to MPS
Lighting 8803 3.91 78.29
Ventilation 7342 3.26 65.26
Colouring walls & ceiling 7528 3.35 66.92
Decorations 7286 3.24 64.76
Air conditioning 6264 2.78 55.68
Store display 7486 3.33 66.54
Cleanliness 7572 3.37 67.31
Spatial layout 7277 3.23 64.68
Signage 6864 3.05 61.01
Seating arrangements 7301 3.24 64.90
Orderly placement of the products 7665 3.41 68.13
WM=Weighed Mean, MPS=Maximum Possible Score; Source: primary data
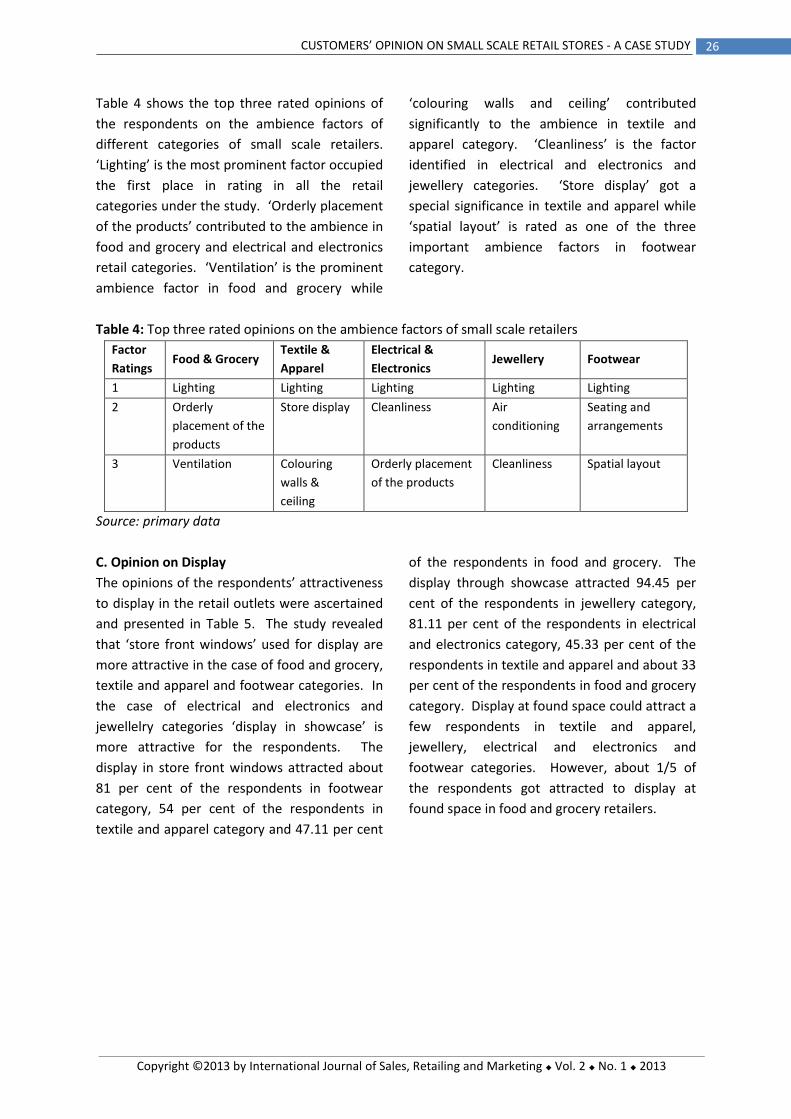
26 CUSTOMERS’ OPINION ON SMALL SCALE RETAIL STORES - A CASE STUDY
Copyright ©2013 by International Journal of Sales, Retailing and Marketing Vol. 2 No. 1 2013
Table 4 shows the top three rated opinions of
the respondents on the ambience factors of
different categories of small scale retailers.
‘Lighting’ is the most prominent factor occupied
the first place in rating in all the retail
categories under the study. ‘Orderly placement
of the products’ contributed to the ambience in
food and grocery and electrical and electronics
retail categories. ‘Ventilation’ is the prominent
ambience factor in food and grocery while
‘colouring walls and ceiling’ contributed
significantly to the ambience in textile and
apparel category. ‘Cleanliness’ is the factor
identified in electrical and electronics and
jewellery categories. ‘Store display’ got a
special significance in textile and apparel while
‘spatial layout’ is rated as one of the three
important ambience factors in footwear
category.
Table 4: Top three rated opinions on the ambience factors of small scale retailers
Factor
Ratings Food & Grocery
Textile &
Apparel
Electrical &
Electronics Jewellery Footwear
1 Lighting Lighting Lighting Lighting Lighting
2 Orderly
placement of the
products
Store display Cleanliness Air
conditioning
Seating and
arrangements
3 Ventilation Colouring
walls &
ceiling
Orderly placement
of the products
Cleanliness Spatial layout
Source: primary data
C. Opinion on Display
The opinions of the respondents’ attractiveness
to display in the retail outlets were ascertained
and presented in Table 5. The study revealed
that ‘store front windows’ used for display are
more attractive in the case of food and grocery,
textile and apparel and footwear categories. In
the case of electrical and electronics and
jewellelry categories ‘display in showcase’ is
more attractive for the respondents. The
display in store front windows attracted about
81 per cent of the respondents in footwear
category, 54 per cent of the respondents in
textile and apparel category and 47.11 per cent
of the respondents in food and grocery. The
display through showcase attracted 94.45 per
cent of the respondents in jewellery category,
81.11 per cent of the respondents in electrical
and electronics category, 45.33 per cent of the
respondents in textile and apparel and about 33
per cent of the respondents in food and grocery
category. Display at found space could attract a
few respondents in textile and apparel,
jewellery, electrical and electronics and
footwear categories. However, about 1/5 of
the respondents got attracted to display at
found space in food and grocery retailers.

27 CUSTOMERS’ OPINION ON SMALL SCALE RETAIL STORES - A CASE STUDY
Copyright ©2013 by International Journal of Sales, Retailing and Marketing Vol. 2 No. 1 2013
Table 5: Types of display attracts the most
Particulars Food &
Grocery
Textile &
Apparel
Electrical &
Electronics Jewellery Footwear
Store front
windows
212
(47.11)
243
(54.00)
78
(17.33)
24
(05.33)
364
(80.89)
Showcase 147
(32.67)
204
(45.33)
365
(81.11)
425
(94.45)
74
(16.44)
Found-space 91
(20.22)
3
(00.67)
7
(01.56)
1
(00.22)
12
(02.67)
Total 450
(100.00)
450
(100.00)
450
(100.00)
450
(100.00)
450
(100.00)
Source: primary data
D. Opinion on Means of Communication
The small scale retailers adopted varied
means to communicate their marketing offers.
The study revealed that the retail categories
under study are communicating the customer
through advertisements in news papers,
advertisements in local T.V. channels,
distribution of leaflets, hoardings,
advertisements in cinema halls, audio on
wheels, display at entry points, exhibitions and
trade shows, sales personnel, radio, and wall
writings.
The effectiveness rating of various
communication sources from the retailers of
the five categories under the study were
presented in Table 6. The study reveals that
‘sales personnel’ is the most effective source of
communication in small scale retail units. This
source secured a score of 8871 representing
about 79 per cent to MPS. ‘Advertisements in
news papers’ secured the second place in
effectiveness as this source got a score of 6446
representing 57.30 per cent to MPS. ‘Display at
entry points’ is the source that was rated the
third by the respondents. This source got a
score of 5691 representing 50.59 per cent to
MPS. All other sources got less than 50 per cent
rating for their effectiveness by the
respondents.
Table 6: Ways of communication about various offerings by the small scale retailers
Particulars Score % to MPS
Advertisements in news papers 6446 57.30
Advertisements in local TV channels 3433 30.52
Distribution of leaflets 4313 38.34
Hoardings 2544 22.61
Advertisements in cinema halls 1477 13.13
Audio on wheels 2843 25.27
Display at entry points 5691 50.59
Exhibitions and trade shows 2758 24.52
Sales personnel 8871 78.85
Radio 1893 16.83
Wall writings 2903 25.80
MPS=Maximum Possible Score
Source: primary data
The top three communication sources of the
respondents were shown in Table 7. ‘Sales
personnel’ is identified as one of the top three
communication sources by the respondents in
all retail categories under the study. ‘Display at
entry points’ has been the source of

28 CUSTOMERS’ OPINION ON SMALL SCALE RETAIL STORES - A CASE STUDY
Copyright ©2013 by International Journal of Sales, Retailing and Marketing Vol. 2 No. 1 2013
communication in food and grocery, electrical
and electronics, and footwear categories.
‘Distribution of leaflets’ was identified as one of
the top three sources of communication in food
and grocery and electrical and electronics
categories. ‘Advertisements in news papers’
and ‘advertisements in local TV channels’ are
perceived effective in the case of textile and
apparel and jewellery categories.
‘Advertisements in news papers’ were also
found effective in footwear category.
Table 7: Top three rated means of communication about offerings by the small scale retailers.
Ratings Food & grocery Textile & apparel Electrical &
Electronics Jewellery footwear
1 Sales personnel Sales personnel Sales
personnel
Advertisements in
news papers
Sales personnel
2 Display at entry
points
Advertisements in
news papers
Display at
entry points
Sales personnel Display at entry
points
3 Distribution of
leaflets
Advertisements in
local TV channels
Distribution of
leaflets
Advertisements in
local TV channels &
Display at entry
points
Advertisements
in news papers
Source: primary data
E. Opinion on Sales Promotion Techniques
The opinion of the respondents on the sales
promotion techniques adopted by small scale
retailers are ascertained in the study. The sales
promotion techniques adopted by retailers
include credit, free servicing, offering products
for trial use, discounts, gift coupons, display of
products, free offers, product bundling, saving
schemes, and finance schemes.
The overall opinions of the respondents
on sales promotion techniques adopted by the
selected small scale retail categories were
presented in Table 8. It can be seen from the
table that ‘display of products’ is considered as
the highly favoured sales promotion technique
by the respondents. This factor secured a score
of 7549 representing 67.10 per cent to MPS
(mean value 3.36). ‘Discounts’ occupied the
second place as this technique got a score of
6105 which represents 54.27 per cent to MPS
while ‘credit facility’ occupied the third place
with a score of 5337 representing 47.44 per
cent to MPS. Free servicing, product bundling,
saving schemes, and finance schemes got less
than 30 per cent rating as sales promotion
techniques used by small scale retailers.
Table 8: Response to the sales promotion techniques adopted by the small scale retailers
Particulars Score WM % to MPS
Credit 5337 2.37 47.44
Free Servicing 3044 1.35 27.06
Offering products for trial use 3937 1.75 35.00
Discounts 6105 2.71 54. 27
Gift coupons 5113 2.27 45.45
Display of the products 7549 3.36 67.10
Free offers 3968 1.76 35.27
Product bundling 2890 1.28 25.69
Saving Schemes 733 0.33 6.52
Finance schemes 689 0.31 6.12
WM=Weighed Mean, MPS=Maximum Possible Score; Source: primary data
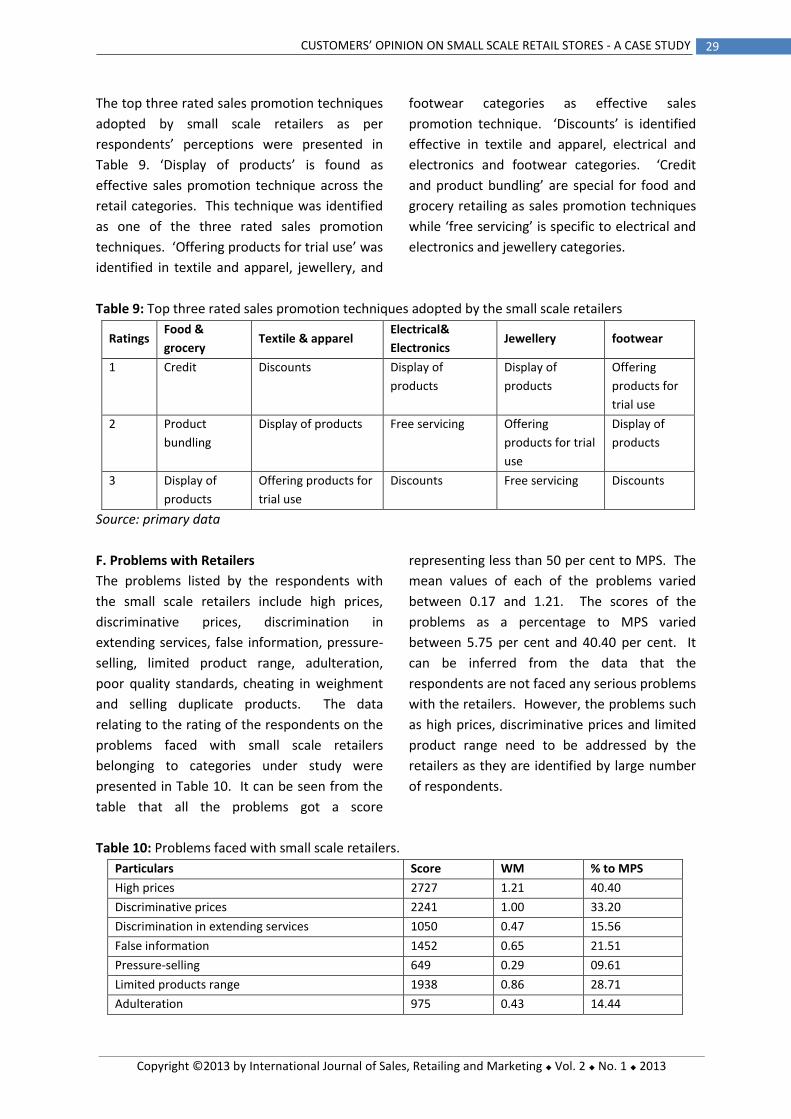
29 CUSTOMERS’ OPINION ON SMALL SCALE RETAIL STORES - A CASE STUDY
Copyright ©2013 by International Journal of Sales, Retailing and Marketing Vol. 2 No. 1 2013
The top three rated sales promotion techniques
adopted by small scale retailers as per
respondents’ perceptions were presented in
Table 9. ‘Display of products’ is found as
effective sales promotion technique across the
retail categories. This technique was identified
as one of the three rated sales promotion
techniques. ‘Offering products for trial use’ was
identified in textile and apparel, jewellery, and
footwear categories as effective sales
promotion technique. ‘Discounts’ is identified
effective in textile and apparel, electrical and
electronics and footwear categories. ‘Credit
and product bundling’ are special for food and
grocery retailing as sales promotion techniques
while ‘free servicing’ is specific to electrical and
electronics and jewellery categories.
Table 9: Top three rated sales promotion techniques adopted by the small scale retailers
Ratings Food &
grocery Textile & apparel
Electrical&
Electronics Jewellery footwear
1 Credit Discounts Display of
products
Display of
products
Offering
products for
trial use
2 Product
bundling
Display of products Free servicing Offering
products for trial
use
Display of
products
3 Display of
products
Offering products for
trial use
Discounts Free servicing Discounts
Source: primary data
F. Problems with Retailers
The problems listed by the respondents with
the small scale retailers include high prices,
discriminative prices, discrimination in
extending services, false information, pressure-
selling, limited product range, adulteration,
poor quality standards, cheating in weighment
and selling duplicate products. The data
relating to the rating of the respondents on the
problems faced with small scale retailers
belonging to categories under study were
presented in Table 10. It can be seen from the
table that all the problems got a score
representing less than 50 per cent to MPS. The
mean values of each of the problems varied
between 0.17 and 1.21. The scores of the
problems as a percentage to MPS varied
between 5.75 per cent and 40.40 per cent. It
can be inferred from the data that the
respondents are not faced any serious problems
with the retailers. However, the problems such
as high prices, discriminative prices and limited
product range need to be addressed by the
retailers as they are identified by large number
of respondents.
Table 10: Problems faced with small scale retailers.
Particulars Score WM % to MPS
High prices 2727 1.21 40.40
Discriminative prices 2241 1.00 33.20
Discrimination in extending services 1050 0.47 15.56
False information 1452 0.65 21.51
Pressure-selling 649 0.29 09.61
Limited products range 1938 0.86 28.71
Adulteration 975 0.43 14.44

30 CUSTOMERS’ OPINION ON SMALL SCALE RETAIL STORES - A CASE STUDY
Copyright ©2013 by International Journal of Sales, Retailing and Marketing Vol. 2 No. 1 2013
Poor quality standards 1427 0.63 21.14
Cheating in weighment 497 0.22 07.36
Selling duplicate products 388 0.17 05.75
WM=Weighed Mean, MPS=Maximum Possible Score
Source: primary data
Table 11 presents the top three rated problems
faced by the respondents with the small scale
retailers. ‘High prices’ is the problem rated in
food and grocery, electrical and electronics and
jewellery retailing. ‘Discriminative prices’ is the
problem rated in textile and apparel, electrical
and electronics, and footwear categories.
‘Limited product range’ is the problem
identified with food and grocery, jewellery, and
footwear. ‘Adulteration’ is the problem
identified in food and grocery while ‘false
information’ is the problem identified in
electrical and electronics and also ‘poor quality
standards’ is the problem recognized by the
respondents in jewellery and footwear
categories.
Table 11: Top three rated problems with small scale retailers
Factor
Ratings
Food &
Grocery Textile & Apparel
Electrical &
Electronics Jewellery Footwear
1 High prices Discriminative
prices
Discriminative
prices
High prices Discriminative
prices
2 Limited
products
range
Poor quality
standards
High prices Limited
products
range
Limited products
range
3 adulteration False information Discrimination in
extending services
Poor quality
standards
Poor quality
standards
Source: primary data
G. Opinion on Performance of Small Scale
Retailers
The respondents were asked to give their rating
on the performance of small scale retail stores
on the factors such as products information,
customer classification and treatment, service
recovery, handling consumer grievances,
dealing with aggrieved customers, information
reporting, techniques in receiving the
customers into the shop, techniques of
identifying the exact needs of customers,
exhibition of the products to the customers,
explaining the features of the products to the
customers, explaining the features of the
products and the shop, techniques of
persuading the customers to buy the products,
and products placement/window display.
The ratings of the respondents on the
performance of small scale retail units under
the selected five categories were presented in
Table 12. The data shown in the table reveals
that the factor ‘explaining the features of the
products and the shop’ got the highest score of
8013 representing 71.23 per cent to MPS (mean
value 3.56). The factor ‘exhibition of the
products to the customers’ got the second place
in performance rating with a score of 7779
which represents 69.15 per cent to MPS (mean
value 3.46). ‘Products placement/window
display’ occupied the third place with a score of
7640 representing 67.91 per cent to MPS (mean
value 3.40). It can be inferred from the table
that all the factors got mean values >3 each
indicating positive rating by the respondents.

31 CUSTOMERS’ OPINION ON SMALL SCALE RETAIL STORES - A CASE STUDY
Copyright ©2013 by International Journal of Sales, Retailing and Marketing Vol. 2 No. 1 2013
Table 12: Rating on the performance of small scale retail stores.
Particulars Score WM % to MPS
Products information 7596 3.38 67.52
Customer classification and treatment 7070 3.14 62.84
Service recovery 6919 3.08 61.50
Handling consumer grievances 7064 3.14 62.79
Dealing with aggrieved customers 7161 3.18 63.65
Information reporting 7120 3.16 63.29
Techniques in receiving the customers
into the shop 7608 3.38 67.63
Techniques of identifying the
exact needs of customers 7457 3.31 66.28
Exhibition of the products to
the customers 7779 3.46 69.15
Explaining the features of the
products and the shop 8013 3.56 71.23
Techniques of persuading the
customers to buy the products 7626 3.39 67.79
Products placement/window display 7640 3.40 67.91
WM=Weighed Mean, MPS=Maximum Possible Score
Source: primary data
The top three ratings on the performance of the
small scale retail units under study were
presented in Table 13. The performance of the
retailers in ‘explaining the features of the
products and the shop’ and ‘product placement
and window display’ are rated in top three in
four of the five categories (except food and
grocery). ‘Exhibition of the products to the
customers’ is the factor rated among the three
by textile and apparel and footwear retailing.
The table further reveals that the three factors
rated high in performance in food and grocery
retailing units are different to those of the
factors in the other four categories.
Table 13: Top three ratings of the performance of small scale retail units
Source: primary data
Factor
Ratings
Food &
Grocery
Textile &
Apparel
Electrical &
Electronics Jewellery Footwear
1 Products
information
Explaining the
features of the
products and the
shop
Explaining the
features of the
products and
the shop
Products
placement/
window display
Products
placement/
window display
2 Service
recovery
Exhibition of the
products to the
customers
Products
placement/
window display
Explaining the
features of the
products and the
shop
Exhibition of
the products to
the customers
3 Techniques
identifying the
exact needs of
customers
Products
placement/
window display
Techniques of
persuading the
customers to buy
the products
Exhibition of the
products to the
customers
Explaining the
feature of the
products and
the shop
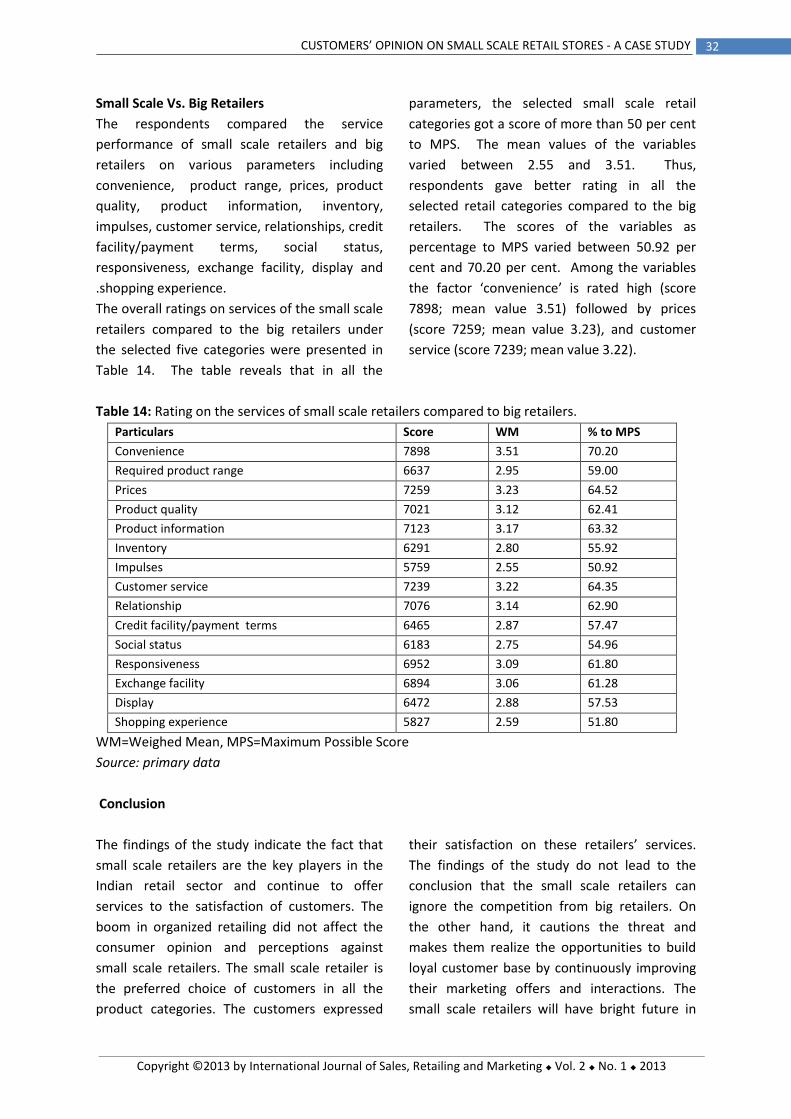
32 CUSTOMERS’ OPINION ON SMALL SCALE RETAIL STORES - A CASE STUDY
Copyright ©2013 by International Journal of Sales, Retailing and Marketing Vol. 2 No. 1 2013
Small Scale Vs. Big Retailers
The respondents compared the service
performance of small scale retailers and big
retailers on various parameters including
convenience, product range, prices, product
quality, product information, inventory,
impulses, customer service, relationships, credit
facility/payment terms, social status,
responsiveness, exchange facility, display and
.shopping experience.
The overall ratings on services of the small scale
retailers compared to the big retailers under
the selected five categories were presented in
Table 14. The table reveals that in all the
parameters, the selected small scale retail
categories got a score of more than 50 per cent
to MPS. The mean values of the variables
varied between 2.55 and 3.51. Thus,
respondents gave better rating in all the
selected retail categories compared to the big
retailers. The scores of the variables as
percentage to MPS varied between 50.92 per
cent and 70.20 per cent. Among the variables
the factor ‘convenience’ is rated high (score
7898; mean value 3.51) followed by prices
(score 7259; mean value 3.23), and customer
service (score 7239; mean value 3.22).
Table 14: Rating on the services of small scale retailers compared to big retailers.
Particulars Score WM % to MPS
Convenience 7898 3.51 70.20
Required product range 6637 2.95 59.00
Prices 7259 3.23 64.52
Product quality 7021 3.12 62.41
Product information 7123 3.17 63.32
Inventory 6291 2.80 55.92
Impulses 5759 2.55 50.92
Customer service 7239 3.22 64.35
Relationship 7076 3.14 62.90
Credit facility/payment terms 6465 2.87 57.47
Social status 6183 2.75 54.96
Responsiveness 6952 3.09 61.80
Exchange facility 6894 3.06 61.28
Display 6472 2.88 57.53
Shopping experience 5827 2.59 51.80
WM=Weighed Mean, MPS=Maximum Possible Score
Source: primary data
Conclusion
The findings of the study indicate the fact that
small scale retailers are the key players in the
Indian retail sector and continue to offer
services to the satisfaction of customers. The
boom in organized retailing did not affect the
consumer opinion and perceptions against
small scale retailers. The small scale retailer is
the preferred choice of customers in all the
product categories. The customers expressed
their satisfaction on these retailers’ services.
The findings of the study do not lead to the
conclusion that the small scale retailers can
ignore the competition from big retailers. On
the other hand, it cautions the threat and
makes them realize the opportunities to build
loyal customer base by continuously improving
their marketing offers and interactions. The
small scale retailers will have bright future in

33 CUSTOMERS’ OPINION ON SMALL SCALE RETAIL STORES - A CASE STUDY
Copyright ©2013 by International Journal of Sales, Retailing and Marketing Vol. 2 No. 1 2013
India provided they upgrade the quality of services continuously.
References
Anil Sasi (2004), “Indian Retail Most
Fragmented”, The Hindu Business Line, Aug 18.
A.T.Kearney Report (2007), Growth
Opportunities for Global Retailers,
http://www.atkearney.com/shared_res/pdf/GR
DI_2007.pdf
Dhanabhakyam M. and Shanthi A. Indian retail
Industry - It’s growth, challenges and
opportunities, Coimbatore,
www.fibre2fashion.com , p.7, dt. 19-12-2011.
Mohan Guruswamy and Kamal Sharma, FDI in
Retail – II Inviting more Trouble?, Centre
for Policy Alternatives, New Delhi,
www.cpasind.com, February, p.3
Research Firm Ovum (2011) www.ibef.org, India
Brand Equity Foundation, January, dt.21-5-2011
Retail Industry In India, A report on Indian Retail
Industry, Corporate Catalyst India,
www.cci.in/pdf/surveys_reports/indias_retail_s
ector.pdf, p.2, dt.19-12-11
Shalini Bahadur (2006), A Retail Scene in India:
An Overview and the Opportunities, chillibreese
publications, p.6-7. www.chillibreeze.com
Shaoni Shabnam and Bino Paul G.D (2008),
Employment in Retail Sector: A comparison of
unorganized and organized retail in India, Tata
Institute Of Social Sciences, Mumbai,
December, p.11
Singhal, Arvind (1999), “A Strong Pillar of Indian
Economy”, KSA Technopak, www.ksa-
technopak.com
Sreejith A. and Jagathy Raj V. P. (2007),
Organized Retail Market Boom and the Indian
Society, International Marketing Conference on
Marketing & Society, 8-10 April, IIMK
www.dspace.iimk.ac.in/bitstream /2007/
The Great Indian Bazaar (2008): Organized
Retail Comes of Age in India, Mckensey &
Company, Aug, dt. 19-12-2011, p.34-36
www.ibef.org, India Brand Equity Foundation,
dt.21-5-2011.
34 INNOVATIVE RECRUITMENT OF HIGH POTENTIALS: THE POTENTIAL BENEFITS OF ORGANISING PROFESSIONAL STUDENT COMPETITIONS – RESULTS OF A CROSS-NATIONAL STUDY
Copyright ©2013 by International Journal of Sales, Retailing and Marketing Vol. 2 No. 1 2013
Dr. Katalin Pádár, Budapest University of Technology
and Economics, Magyar Tudosok korutja 2, Bld.
Q.A309, H1117 Budapest, Hungary.
(email: [email protected]).
INNOVATIVE RECRUITMENT OF HIGH POTENTIALS: THE POTENTIAL BENEFITS OF ORGANISING
PROFESSIONAL STUDENT COMPETITIONS – RESULTS OF A CROSS-NATIONAL STUDY
Katalin Pádár
Abstract
In today’s world of such turbulent times, flexibility and innovativeness are key factors to success.
This statement holds not only true in regard to the satisfaction of customers’/consumers’ needs, but
also regarding the internal processes of organizations, for instance, recruitment.
Building on the findings of a thorough literature review of the related fields (i.e. (global) talent
management, atypical employment, employer branding, etc.), this paper examines the potential
benefits of (international) student competitions – that are of growing popularity nowadays. ‘As war
for talent shows no signs of letting up’ (Fernández-Aráoz et al., 2011, p. 76), being able to attract and
recruit high potentials are of vital importance. The study’s basic hypothesis is that these
competitions are mainly organized for recruitment purposes. Furthermore, it was also assumed that
such competitions are beneficial for both the organizing companies and the participants.
Primary data, which derive from the interviews conducted with HR representatives of multinational
companies operating in different European countries that organise (international) professional
student competitions, proved the study’s main hypothesis – providing empirical evidence of the
importance of a potentially new recruitment tool. Results of a complimentary, questionnaire-based
pilot research of the participants supported the assumption concerning mutual benefits.
Key words: global talent management, high potentials, student competition, recruitment
Introduction
Globalisation, fierce competition, (economic)
recession: these expressions are being used
more and more often nowadays – let that be an
academic article or simply an informal
conversation. It is possible to protest against it,
although, in my opinion it is undeniable that
globalisation has become a constant element of
our everyday lives, strengthening the otherwise
already tough enough competition even
further; and the situation has just been topped
with the economic crisis of the recent years.
Actors of the economy – companies as well as
employees or rather the government – have no
other choice but to get used to the changed
(and changing) conditions if they plan to survive
also in the long-run.
A possible way of doing so could be an
approach that is more flexible than ever before,
together with the application of alternative
solutions (e.g. atypical forms of employment) in
contrast to conventional practices.
Today’s challenges, however, do not only affect
companies, or in other words: employers. The
situation of actors on the ‘other side’ of the
labour market, namely employees, is also not
35 INNOVATIVE RECRUITMENT OF HIGH POTENTIALS: THE POTENTIAL BENEFITS OF ORGANISING PROFESSIONAL STUDENT COMPETITIONS – RESULTS OF A CROSS-NATIONAL STUDY
Copyright ©2013 by International Journal of Sales, Retailing and Marketing Vol. 2 No. 1 2013
simple and straightforward. According to my
experience, this statement holds particularly
true to entrants, those just entering the labour
market, as higher education in itself does not
guarantee an easy, fast and smooth job-hunt. In
accordance with this, Mile et al. claim that the
situation of entrants holding a degree is
especially challenging as the rate of
unemployment in their case is higher than
among older, more experienced professionals
also holding a degree. (Mile et al., 2007) The
subtitle of the work of Burnsed work also tells a
lot: ‘Internships are a near necessity in the
quest to find a job in today’s market.’ (2010, p.
52). Not to mention that young graduates have
to face requirements which are harder and
harder to meet. With a bit of exaggeration, one
should be fluent in a couple of languages, have
participated in (and won) student competitions,
possibly with (a couple years of) experience on
the given field by the beginning of their
twenties. Most probably the possession of
professional experiences is the criterion hardest
to meet. (Mátyási et al., 2007)
Even though pointing to the fact that there are
further actors/stakeholders (i.e. educational
institutions, parents, even the state) to be taken
into account, would be a justifiable remark to
make, the present article focuses on the
relations between employers (mostly
companies, for-profit organizations) and
potential employees-to-be (mostly university
students) with special attention to challenges
they have to face nowadays and to their
reactions (already given or expectable) to these
challenges.
After the discussion of labour market flexibility
and the concept of atypical employment, the
article focuses on matters that are considered
to be interesting in the eyes of the examined
stakeholders (i.e. employers and potential
employees/entrants). These include (global)
talent management, as a ‘subset’ of corporate
succession planning, questions regarding
internships and professional student
competitions.
The second main part of the article presents the
circumstances, methodology and findings of the
empirical research, the aim of which was to
answer the following questions.
Are internships, in fact, beneficial for both
parties?
Do (international) professional student
competitions serve as (potentially) new means
of talent recruitment?
Labour market flexibility and its importance
The economic recession has certainly
strengthened the demand for finding efficient
solutions and, in parallel to this, more flexible
employment alternatives have also come to the
forefront. However, it cannot be stated that the
concept of flexibility on the labour market has
only become a much discussed topic during the
past couple of years. For instance, Michie and
Sheehan (2005) had the opinion already 7 years
ago, well before the crisis, that labour market
flexibility has to be regarded as one of the ‘key
determinants of national competitiveness and
successful corporate performance’.
Furthermore, the link between globalisation
and the spread of atypical employment (as a
manifestation of flexibility in practice) has
already caught researchers’ attention around
the millennium (e.g. Bratton, Gold, 2000).
Williams’ (1993, p. 1) definition is often quoted,
according to which labour market flexibility is a
‘variety of functional techniques that
organisations deploy to maximise the increased
efficiency of the labour contribution to the
strategic purpose of the organisation’. Cazes
and Nesporova (2003) also highlight the
complex nature of the concept, pointing to the
fact that flexibility on the macro-level refers to
the speed of adaptation to the effects of
external shocks and/or changing labour market
circumstances. Based on which, labour market
flexibility means the extent to which
36 INNOVATIVE RECRUITMENT OF HIGH POTENTIALS: THE POTENTIAL BENEFITS OF ORGANISING PROFESSIONAL STUDENT COMPETITIONS – RESULTS OF A CROSS-NATIONAL STUDY
Copyright ©2013 by International Journal of Sales, Retailing and Marketing Vol. 2 No. 1 2013
employment (and its features) is adjusted to
changes in the economy.
Solow approaches the concept with the help of
the Beveridge curve, from a somewhat
different, economic point of view, saying that a
‘perfectly flexible labour market would […] be
one that interposes no obstacles to the
frictionless matching of an unfulfilled job and an
unemployed worker with the appropriate skills’,
adding that ‘labour-market rigidities (including
skill mismatches now) are precisely what allows
vacancies and unemployment to coexist’
(Solow, 1997, p. 191).
Three basic types of labour-market flexibility
are distinguished in the literature (e.g. Michie,
Sheehan, 2005; Valverde et al., 2000), namely
functional, numerical and wage or
reward/financial flexibility; where numerical
flexibility refers to the capability of a company
to ‘easily increase and decrease its total
number of workers in the short term […], which
is achieved through the use of different types of
contracts and variations in the distribution of
working time’ (Valverde et al., 2000; pp. 650-
651).
Atkinson’s (1984) so called ‘Flexible Firm’ model
has to be mentioned as well regarding labour
market flexibility. (e.g. Finna, 2008; Valverde,
2000) The model suggests the structure of firms
being viewed as a series of concentric parts
(core group; first and second peripheral groups;
and outermost part), where ‘the second
peripheral group consists of employees with
fixed-term, part-time contracts, coming from
employment training programs (apprentices
and work-experience contracts) or job sharing
[…giving…] the company numerical and to a
certain extent functional flexibility. (Valverde et
al., 2000, pp. 651-652)
Guest (1999) has reviewed and analysed several
models dealing with the relations of human
resource (HR) management and corporate
performance, and has come to the conclusion
that sufficiently chosen HR management
practices are the keys to successful HR
management, which can serve as a source of
HR-based competitive advantage. Therefore, I
believe, that studying the ways how companies
approach corporate succession planning and
talent management is worth the effort, as a
well-chosen HR management practice will have
a valuable contribution to the company’s
success. (However, it has to be kept in mind
that the chosen corporate strategy determines
the extent to which HR management practices
can contribute to success. (Michie, Sheehan,
2005))
Finna and Forgács (2010) also discuss the
importance of labour market flexibility as well
as flexicurity, a concept hard to by-pass
regarding the literature of labour market
flexibility. The expression refers to the
simultaneous execution of both flexibility and
security (Belchamber, 2010) in terms of
employment, as with the increase of flexibility
(e.g. definite contracts instead of indefinite
ones), insecurity also rises (i.e. whether or not
the contact will be prolonged). According to
Burroni and Keune, ‘“Flexicurity” has become
an influential concept in academic and political
discourse, in particular since the European
Commission placed it at the core of the
European Employment Strategy.’ (2011, p. 75).
Regardless of this, they argue beside the
abandonment or the substantial improvement
of the concept. (Burroni Keune, 2011).
Although the limitations of this article do not
make any further discussion of the concept of
flexicurity possible, it should be sensible and
clear that it is an important chain-link between
labour market flexibility and atypical
employment.
Atypical employment
In today’s world of unemployment and
economic recession, companies’ adaptability
have a more and more important role in their
survival and/or success. One possible way of
making a company more flexible is through
37 INNOVATIVE RECRUITMENT OF HIGH POTENTIALS: THE POTENTIAL BENEFITS OF ORGANISING PROFESSIONAL STUDENT COMPETITIONS – RESULTS OF A CROSS-NATIONAL STUDY
Copyright ©2013 by International Journal of Sales, Retailing and Marketing Vol. 2 No. 1 2013
numerical flexibility, which can be manifested
via the application of atypical employment.
‘The post-war period, with unprecedented
growth and development and ample full
employment had created a climate that led to
the establishment of a “standard” or “typical”
employment relationship.’ (Bronstein, 2009, p.
1) The archetypes of employment contracts are
considered to be ones according to which work
has to be performed full-time, at the given
workplace, for an indefinite amount of time.
(Nacsa, 1997) While anything that differs from
this is considered atypical employment. Many
authors (e.g. Laky, 1997; Borbély, 2000; Hertel,
2004; Laky, 2006) name the last third of
twentieth century as the time of appearance,
development and spread of atypical
employment. (The work of Szabó and Négyesi
(2004) explains the changes and processes in
details that have led to the various forms of
atypical employment.) According to Bronstein
(2009, p. 1), ‘part-time work, fixed-term
employment, extended probation terms, on-call
work and temporary work are examples of
atypical forms of employment’.
As the work of Finna and Forgács (2010) also
points to it, the definition of atypical
employment is rather loose, which means an
obstacle from several perspectives.
Additionally, legal regulations regarding atypical
employment might also vary from country to
country which makes attempts of creating a
precise definition even more challenging.
Corporate talent management, succession
planning
I strongly believe that referring to corporate
succession planning, as well as talent
management, as a strategic issue is not an
overstatement. The fact that some companies
are not (yet) willing to view them so is a
different question.
For the purposes of the current article, the first
or even ‘the one but first’ step of succession
planning, namely the attraction of young talents
and high potentials (including the related
techniques, strategies), is of interest.
Since talent management is not the main focus
of the this article, below I would only like to
highlight some points that are important to
know for the complete understanding of the
conceptual framework behind the empirical
research.
War for talent?
It is of no doubt (e. g. Farndale, Scullion,
Sparrow, 2010) that McKinsey’s ‘War for Talent’
article (Chambers et al., 1998) has been
determining in the way how corporate talent
management evolved during the years ever
since. Chambers et al. (1998) have pointed to
the importance of handling talent management
as one of the corporate priorities, as this is the
way how one can win in the war for talent,
because ‘superior talent will be tomorrow’s
competitive advantage’ (p. 48). The article
highlights that companies should be clear about
the kind and amount of people they need; and
these needs should be met through complete
commitment for hiring the best people, with
the help of using innovative channels of
recruitment to find and attract them. In my
opinion, professional student competitions,
which are of growing popularity nowadays,
exactly serve as such innovative channels of
recruitment, even fulfilling the requirement of
continuous recruitment if they are organised
e.g. on a yearly basis.
The McKinsey’s research was repeated again in
2000, confirming the results and forecasts of
the previous study. 89% of the participants
found it harder to attract talented people to
their companies than three years before.
Financial analyses showed that the
performance of those paying real attention to
talent management is far better than that of
the others, meaning that these companies were
capable of the realisation of their competitive

38 INNOVATIVE RECRUITMENT OF HIGH POTENTIALS: THE POTENTIAL BENEFITS OF ORGANISING PROFESSIONAL STUDENT COMPETITIONS – RESULTS OF A CROSS-NATIONAL STUDY
Copyright ©2013 by International Journal of Sales, Retailing and Marketing Vol. 2 No. 1 2013
advantage through their talents and high
potentials. (Axelrod et al, 2001).
Regardless of the effect of these McKinsey
studies, one has to keep it in mind that the
world and the environment is changing fast,
which also means that challenges that
companies have to face are also changing. A
new expression, ‘demand for talent’ has also
emerged recently and some even argue that the
war for talent is over.
Global talent management vs. MNCs
According to Farndale et al. (2010),
multinational companies (MNCs) have to face a
new challenge nowadays, namely the need for
coordination of talent pipelines on a global
basis, global talent management. They also
argue that the ‘war for talent’ is not the best
expression to use any more, especially when
considering the unemployment rates of East-
and South-Asia. Even though the pure mass of
labour force on the market does not necessarily
mean that employers do not have to struggle to
find the individuals with the appropriate skills
and capabilities, other authors (e.g. McDonnell
et al., 2010; Schuler et al., 2010) also argue that
the meaning of war for talent has changed since
1998. Although the war for talent is probably
not the best expression to use any more,
‘demand for talent’ still has a significant role.
(Lane, Pollner, 2008)
Globalisation, consequently, also has an effect
on corporate talent management, pushing
global talent management to the forefront; or
in other words, thanks to internationalisation
and globalisation, HR management is playing a
more and more strategic role. (Novicevic,
Harvey, 2001; Scullion, Starkey, 2000)
As global talent management has its own and
growing literature, even regarding current
issues (e.g. Mellahi, Collings, 2010; Hartmann et
al., 2010; Tarique, Schuler, 2010; Iles et al.,
2010), I would only like to highlight that a new
requirement has emerged to which global
talent management has to reflect, namely that
companies need more and more talents who
‘remain’ talents regardless of the geographical,
cultural or language environment (Huselid et al.,
2009).
Attraction of young talents
As it has been mentioned already, the current
study examines talent management in relation
to the (alternative) possibilities of recruitment
and attraction of labour market entrants and
young graduates. Building on the processed
secondary sources of literature (e.g. Chambers
et al., 1998; Tarique, Schuler, 2010; Schuler et
al., 2010), I am on the opinion that the main
elements of attracting young, talented
individuals, the contribution of whom to the
success of the company is great, are the
following:
continuous recruitment – regarding which it is
important that companies have to find the best
people and they have to be matched to the
positions suitable for them, not the other way
around: trying to find people for the positions;
the use of innovative techniques of
recruitment;
the attraction of young high potentials who are
also interested in working in an international
environment;
the development of an attractive corporate
identity – in which the practice of employer
branding has a growing role. Accordingly, a
McKinsey study raises the attention of
companies to think of talents as the possible
customers of the corporate brand (Hieronimus
et al., 2005).
Amidst the challenges of head-count
restrictions and layoffs, most probably, carrying
out continuous recruitment faces the biggest
obstacles. In my opinion, atypical ways of
employment (e.g. internships) might serve as a
solution. The example of Germany is also quite
39 INNOVATIVE RECRUITMENT OF HIGH POTENTIALS: THE POTENTIAL BENEFITS OF ORGANISING PROFESSIONAL STUDENT COMPETITIONS – RESULTS OF A CROSS-NATIONAL STUDY
Copyright ©2013 by International Journal of Sales, Retailing and Marketing Vol. 2 No. 1 2013
instructive, as the level of employment even
rose in the country in spite of the economic
crisis, thanks to the more extensive use of
atypical ways of employment. (Why has…,
2010)
Linkages
Numerical flexibility vs. talent management
Even though continuous recruitment might as
well seem to be a requirement possible to be
met, it is rather a luxury that most of the
companies simply cannot afford. This is exactly
why the concept of flexibility, and numerical
flexibility within, is important. Following the
logic of Atkinson’s Flexible Firm model
(described in details by Atkinson, 1984;
Valverde et al., 2000; Finna, 2008; Finna,
Forgács, 2010, etc.), continuous development
can become possible even amidst the
challenges companies have to face nowadays.
As if (some of) the employment of talented
young graduates happen via atypical
employment (e.g. part-time employment;
internship), the company could employ more
talents while also keeping its capability of
reacting fast to changes in its environment.
Members of the so called second peripheral
group are still connected to the company and in
case of a suitable vacancy, they can become
members of the core group. A Scandinavian
study also supports the atypical employment of
labour market entrants via atypical forms of
employment, since according to its findings,
part-time jobs let entrants actually enter
employment. (Try, 2004)
The potential in professional student
competitions
Professional student competitions, organisers,
participants and their main motives are in the
focus of the second part of this article. The
reason for this is that in my opinion, these
competitions are ideal tools from numerous
view-points for the attraction of talented young
individuals, high potentials. They definitely
function as an innovative way of recruitment
and the selection criteria, throughout the
competitions themselves, can be tailored to the
needs of the given organiser company.
Competitions also having an international
round/final can be useful even for companies
facing global talent management challenges as
the fluent use of a foreign language (in most of
the cases English) is impossible to by-pass, and
during an international final, which usually lasts
for a couple of days, both of the parties
(organisers and participants) have the chance to
get to know each. Furthermore, the
participants’ capabilities of handling an
international working environment can also be
easily examined. Participants, in return, are
given the chance to experience what working
with others coming from different countries,
cultural backgrounds really means.
According to my experience, organisers of such
professional student competitions live with the
opportunity of giving a presentation about the
company, which is a perfect opportunity for
employer branding as well as the whole
competition itself.
The competitions often end with position offers
(mostly internships) of the organisers. After
accepting such an offer, talents are only a step
away from becoming employed with a
permanent contract, becoming part of the core
group.
From the other view-point, that of the
participants, such competitions might seem to
be a lot more interesting and beneficial than job
interviews or assessment centres. Furthermore,
showing off with their strengths in a positive
way are only up to them, and it does not
necessarily depend on the ‘questions’ they
receive (e.g. during an interview). Additionally,
they can obtain such an experience via
participating in a competition, which is not
attainable anyhow else. (cp. Maddox, 1987)

40 INNOVATIVE RECRUITMENT OF HIGH POTENTIALS: THE POTENTIAL BENEFITS OF ORGANISING PROFESSIONAL STUDENT COMPETITIONS – RESULTS OF A CROSS-NATIONAL STUDY
Copyright ©2013 by International Journal of Sales, Retailing and Marketing Vol. 2 No. 1 2013
A different approach: who does actually benefit
from internships?
Unfortunately, it has become clear that the
literature dealing with internships are not
extremely extensive, which is actually an
interesting fact, knowing that higher education
in itself does not assure smooth employment
and that the situation of labour market entrants
is especially challenging. (Mile, Hinek, Torgyik,
2007) ‘Internships are our primary recruiting
source for full-time positions.’ cites Burnsed
(2010, p. 52) Holly Paul, a national recruiting
leader at PricewaterhouseCoopers. Therefore it
should not be surprising that more and more
students are looking for internship positions
worldwide to keep and improve their
‘marketability’. (Pianko, 1996) The lack of
articles dealing with this topic surprised me,
because Pianko (1996) also point to the
mutually (for both employers and students)
beneficial nature of internships.
Based on the work of Mátyási et al. (2007, p.
24), internship is a structured activity aimed at
practice, in the frame of which students have
the opportunity to apply the professional
knowledge they gained at the educational
institution in a real or protected working
environment, and through the learning process
interns experience the peculiarities of the given
professional field.
The functions of internships are the followings
(Mátyási et al, 2007, pp. 25-26).
‘Gaining professional experience – for the
student;
Obtaining key competencies – for the student;
Networking – for the student; and also for the
educational institution and the company;
Feedback from the company where the
internship takes place – for the student;
Extra labour force – for the company;
First step of recruitment and training of future
co-workers – for the company;
Feedback regarding the contents and the
quality of the educational program – for the
educational institution;
Possibility of deepening contacts, obtaining
academic, research assignments – for the
educational institutions.’
These eight points perfectly summarize the
benefits that an internship can provide to
actively participating parties. In spite of this, I
would suggest to add an additional point:
Possibility of testing the potential future co-
operation of the parties – for the student and
the company. (With Pianko’s words:
‘internships give both the company and the
student a trial run’. (1996, p. 32))
According to the previously summarized
secondary information, professional student
competitions, which are of growing popularity
nowadays, seem to be beneficial for both
parties, as well as offering and accepting
internship positions seemingly provide benefits
for both parties. The second part of the article
empirically examines this idea, or else, tries to
answer the question whether really all parties
gain with such competitions.
Primary research
In order to test the real-life relevance of the
previously summarized findings from secondary
sources, and also to answer the main questions
of this study, namely ‘Are internships, in fact,
beneficial for both parties?’ as well as ‘Do
(international) student competitions serve as
(potentially) new means of talent recruitment?’,
primary data have been collected.
Hereby I would like to point to the fact that I
had found it important to get to know the
opinion of both parties (employers and
(potential) employees), as it would have been
impossible to draw well-supported conclusions
from information originating exclusively from
only one of the sides. This approach resulted in
41 INNOVATIVE RECRUITMENT OF HIGH POTENTIALS: THE POTENTIAL BENEFITS OF ORGANISING PROFESSIONAL STUDENT COMPETITIONS – RESULTS OF A CROSS-NATIONAL STUDY
Copyright ©2013 by International Journal of Sales, Retailing and Marketing Vol. 2 No. 1 2013
two separate but also comparable empirical
research threads: one examining the employers,
one the potential employees.
The methodology
The original idea was to study only Hungarian
employers (ones that organise professional
student competitions), for which the qualitative
method of personal interviews would have
been perfectly adequate (Babbie, 2010;
Scipione, 1994). As the research evolved,
however, the possibility of getting to know the
opinions of employers from countries other
than Hungary emerged, and therefore the
research method had to be altered. Building on
the advantages of quantitative methods (e.g.
Scipione 1992; Szabó, 2001), I used an online
questionnaire, in which as many questions were
open-ended as possible, to let participants
express their opinions as freely as possible –
while also keeping the requirement of
comparability in mind. Since the circle of the
potential participants was well-defined and not
too numerous, the chosen survey method made
it possible to integrate the benefits from
qualitative and quantitative methods and to by-
pass the potentials disadvantages (low response
rate, no unique opinions; incomparable
answers, etc. (Hoffmann et al., 2000; Scipione;
1992)).
The other target group of the empirical
research was university students or in other
words: potential employees. In their case, the
only feasible option seemed to be the use of an
online questionnaire as this thread of the
primary data collection aimed to reach students
of various nationalities, to whom there was no
direct contact.
Results and findings
Employers which organise professional student
competitions
The final version of the online questionnaires
contained 7 open-ended and 7 close-ended
questions, beside the ones serving solely
statistical purposes. The followings summarise
the findings based on the answers of the
representatives (HR coordinator, Recruiting &
Employer Branding manager; HR account
manager; HR manager) of multinational
companies from 4 different countries: Hungary,
Austria, Belgium and the Slovak Republic
respectively, ones that organise international
professional student competitions. All of the
interviewees were actual organisers (each with
3-4 years of experience), therefore they were
capable of giving relevant answers to all the
questions.
The questionnaire consisted of two main parts,
the first asking about professional student
competitions, while the second focusing on
matters regarding potential intern-to-bes and
internships.
The main aim of these competitions seems to
be the ‘The hunt-up and attraction of potential
talents (high potentials).’ as all the participants
marked this as a response to the ‘What is the
aim of these competitions (from the company’s
perspective)?’ question. Corporate image
development, the expression of social
responsibility and employer banding are also
admitted purposes of such competitions as
three out of four respondents also marked each
of the following statements: ‘Corporate image
development.’; ‘Social responsibility can be
expressed through them as well.’; ‘They serve
as a field for corporate branding.’. Two
participants believe that ‘Innovative ideas and
new inspiration derive from these
competitions.’; and no further aims were
named.
Responses to the open-ended question related
to the plans regarding successful participants of
these competitions contained the following
statements:
‘to hire them either as interns or full time
employees’

42 INNOVATIVE RECRUITMENT OF HIGH POTENTIALS: THE POTENTIAL BENEFITS OF ORGANISING PROFESSIONAL STUDENT COMPETITIONS – RESULTS OF A CROSS-NATIONAL STUDY
Copyright ©2013 by International Journal of Sales, Retailing and Marketing Vol. 2 No. 1 2013
‘The successful participants have the
opportunity to network with senior manager to
get an insight into daily business and aspects
that are important besides the hard facts they
learn in university – what are the issues which
are worked on in daily business. Besides that we
try to offer internships to those participants who
left a good impression during the game.’
‘To stay in touch with them and if the possibility
is there to offer them an internship or a
permanent position once these students have
finished their studies.’
‘In case we have suitable job offerings we intend
to hire them. Otherwise they are also available
to our branches in other countries, including
headquarter.’
In the light of these responses, the question
asking about intentions of hiring successful
participant seems to be somewhat needless as
obviously all of the recipients confirmed they
plan to do so. Therefore it is clear that the main
reason of these competitions is to recruit
talented young individuals, high potentials.
Internship appeared to be the most popular
form of employment (3 respondents); while
infinite and definite contracts are also viable
options (2-2 respondents), beside ‘Employment
with ‘Contract of Services’.’ (1 respondent). No
further ways of employment were named.
The next open-ended questions asked about
the direct and indirect benefits related to
organising such competitions. Participants
named the following direct advantages:
‘meeting young graduates and high potential
students, strong presence at universities’
‘potential interns and young professionals; get
to know students which are motivated and
interested in [the company’s] Employer
branding activities with an added value for the
students (more than posters and career fairs)’
‘Meet interesting business students
(internships); Get to know how business
students see the future.’
Indirect advantages were also described:
‘good contacts with universities, employer
branding’
‘to get to know young and enthusiastic students
who are interested in [the company]; if the
students have a positive impression during the
game they tell their friends about their positive
impression and this is very important in such
times’
’Position the company as an attractive
employer towards students. Stay in touch and
maybe hire high-potential students once they
have finished their studies.
‘image improvement; employer branding;
attracting students; new interesting experience
for managers’
The next section of questions was asking about
interns and internship.
Three of the companies employ interns, while
the fourth representative explained that they
do not employ interns as they ‘directly employ
many students on normal contracts’.
(Consequently, the further questions were only
put to the other three participants.)
The reason for employing interns is the fact that
‘This is also a way/tool of corporate talent
management.’ as all of the respondents marked
this and only this option, even though there
were also other possibilities (‘In order to ensure
the sufficient amount of labour.’; ‘Interns are a
cost-efficient source of labour.’; ‘Other, i.e.:’).
The advantages of employing interns are as
follows.
‘our interns are the first source for hiring, we
train them and if possible hire them afterwards’
‘to have future hiring potential; to get to know
students and to learn about their working style;
to have support in the daily business’
‘Its a way to get in touch with talented students
and to see them in 'action' for a couple of
months.’

43 INNOVATIVE RECRUITMENT OF HIGH POTENTIALS: THE POTENTIAL BENEFITS OF ORGANISING PROFESSIONAL STUDENT COMPETITIONS – RESULTS OF A CROSS-NATIONAL STUDY
Copyright ©2013 by International Journal of Sales, Retailing and Marketing Vol. 2 No. 1 2013
While disadvantages are the following:
‘none (we are flexible on working hours and we
only hire interns for long term)’
‘for those interns who are interested in [the
company] and when we cannot offer an entry
position afterwards; they are disappointed
afterwards; the effort to hire interns is as high
as for positions for young graduates’
‘The introduction period sometimes takes quite
long and after 6 months most of the interns left
already.’
From the quotations above it is visible that,
within the possibilities; interns serve as the
number one source for the future employee
pool. Disadvantages appear to be somewhat
country specific.
The questionnaire also asked about the costs of
employing interns and whether this
‘investment’ pays off. The received answers
were the following:
‘Yes, this is definitely a good investment, by the
time they finish their studies and their internship
at [the company] we already know them (and
they know the company as well), we have an
overview about their performance and potential
--> higher possibility for retention after hiring,
loyalty, choosing the best person for the given
job.’
‘costs of advertising is zero; the payment is
depending on the collective agreement (valid for
all companies in our industry); most costs are
due to personal effort of the recruiter;
investment pays off most of the time because
the students do a great job’
‘The cost differs, but is not of a lot of interest,
it's about having talented interns that might
stay on a permanent contract after their
studies. So yes the investment def. pays off.’
From these opinions it is clear that it is well-
worth for the companies to employ interns as
the benefits of doing so easily outweigh the
cost and disadvantages, if any.
‘Active command of at least one foreign
language’; ‘Interpersonal competencies’; and
‘Good learning skills’ are expected from an
intern-to-be, according to all of the three
interviewees. ‘Adaptability/flexibility’ is also
important, while ‘Experience on the given field’
is not required.
The Belgian and the Hungarian respondents are
rather looking for ‘still ‘shapable material’,
while, in Austria they are rather looking for
‘already ready applicants’ ’.
Based on the answers, the economic recession
has not induced major changes in the
company’s approach and/or planned actions in
this field (i.e. the employment of interns).
Participants of professional student
competitions
The second (parallel) thread of the empirical
data collection was related to those students
(potential employee-to-bes) who had already
participated in professional student
competitions.
Since the link of the questionnaire was
forwarded online, it was impossible to reach
exclusively only students who had already taken
part in such competitions. Therefore the
relevant respondents had to be filtered out,
which happened with the help of the very first
question, asking whether the participant have
ever taken part in professional student
competitions.
Those who never had such experience obviously
would not have been able to provide relevant
information on the topic, but they were asked
about the reasons why they never participated
in such competitions. Findings of this part are
discussed later on.
63 answers arrived by the end of the data
collection, 78 percent of which happened to be
irrelevant. It means that only 14 answers could
be analysed, which counts as one of the major
44 INNOVATIVE RECRUITMENT OF HIGH POTENTIALS: THE POTENTIAL BENEFITS OF ORGANISING PROFESSIONAL STUDENT COMPETITIONS – RESULTS OF A CROSS-NATIONAL STUDY
Copyright ©2013 by International Journal of Sales, Retailing and Marketing Vol. 2 No. 1 2013
limitations of this study. Due to the low number
of responses, one should avoid making
conclusions that are based on these results.
Hence the following are considered as pilot
results.
Most of the experienced participants took part
in business-related, at times case study
competitions (e.g. BCG Strategy Cup; MOL
Freshhh; Diák Menedzsment Bajnokság; Big
One; Henkel Innovation Challenge); two
respondents named (international) law
competitions (e.g. Willem C. Vis International
Commercial Arbitration Moot). The listed
competitions were organised and took place in
several countries (Austria, China (Hong Kong),
Germany, Hungary, The Netherlands and
Russian Federation) from 2009 to 2011.
One of the most important questions asked the
respondents about how much had the listed
factors contributed to their decision of taking
part in such competitions. Each factor had to be
weighted by deciding whether it had absolutely
no contribution (0 point); had a little part in the
decision (1 point); or was one of the main
reasons (2 points). The summarized, weighted
results show that the most important factor is
(obtainable) professional experience. The first
runner-up is ‘the challenge itself’, slightly
scoring more than ‘the hope of getting an offer
(internship/position) from the company’ and
the ‘additional item to put into my CV’ options.
The other four factors appeared to be a lot less
important. This result is in sync with that of the
following question, which asked the
participants to name the most determining
factor from the previously listed eight.
‘Professional experience’ was the most
determining factor for the majority of the
respondents, followed by ‘the challenge itself’;
‘the hope of getting an offer
(internship/position) from the company’ and
the ‘additional item to put into my CV’ options.
In nine out of thirteen cases, the participant’s
opinion about the company has changed in a
positive way due to the competition – there
was no change in four cases. Furthermore, nine
of the students stated that the competition
made them want to work for the given
company as it was a positive experience.
Also nine of the respondents would probably
(further two would surely) take a position at the
company, even if the way of employment was
atypical (i.e. with a definite term contract, with
a contract for services or part-time work).
Beside that experience, networking and gained
knowledge were named by most of the
participants as the potential benefits and
strengths of such competitions, while the
following opinions summarize many others as
well.
‘international (professional) relations; to get
acquainted deeper with the teamwork; to
compose high level argumentations; significant
improvement in presentations and convincing
other people; research; unforgettable
experiences; English language skills; confidence’
‘Challenging and interesting tasks, good result
can be a good point in the CV or at the
company, experiencing teamwork’
‘A lot of experience in presentation techniques,
working together with partners, how to treat
competitors, how to behave under stress, how
to react for a sudden and unexpected question.’
‘I've got a general idea of the company's
priorities, and understood the working system of
a multinational company. I've learned a lot
about the diversity of the activities the company
is dealing with, the great portfolio of its brands
and the technique of launching a product with
all the necessary marketing and financial
elements.’
‘broader thinking; understanding of business;
positive for CV; new ideas’
‘experience on (intercultural) teamwork, one
can improve their presentation skills,
networking, professional experience’
45 INNOVATIVE RECRUITMENT OF HIGH POTENTIALS: THE POTENTIAL BENEFITS OF ORGANISING PROFESSIONAL STUDENT COMPETITIONS – RESULTS OF A CROSS-NATIONAL STUDY
Copyright ©2013 by International Journal of Sales, Retailing and Marketing Vol. 2 No. 1 2013
In light of their experience, everyone would
take part (either definitely (9) or probably (5)) in
such a competition again.
An interesting question asked about the
participants’ advice to organiser companies,
asking them to list the things they would
change if they were in the shoes of the
companies. Many of the suggestions called for
more attention to participants other than the
winners; feedback regardless of the results and
at any level of the competition would be highly
appreciated. Furthermore, some has suggested
more intense marketing/advertising activity for
the competition/event itself, although others
were completely satisfied and would not
change a thing.
Theory versus practice: The relation of
secondary and primary results
Regarding the aim of organising professional
student competitions, theory is in accordance
with practice. It can be stated that the main
reason for organising such competitions is the
hunt-up and attraction of talented young
individuals, high potentials. This means it was a
valid conception to study these competitions as
a way or means to the atypical employment
(e.g. internship) of young high potentials.
Getting an internship can, in fact, be considered
as a way of entering the labour market and also
employment, as according to the primary
research, employers are willing to hire
successful participants of these competitions
either as inters or with a(n) (in)definite
contract.
In terms of direct and indirect advantages, I
have also found the information derivable from
the literature to be in line with practice.
Furthermore, it is surprising how much
resemblance the possible functions of
internships (Mátyási et al, 2007) and their real-
life benefits show.
Due to the relatively low number of
respondents, I would warn everyone not to
generalize the results, though the pattern of
taking these competitions as a tool of talent
management is clearly recognisable from the
responses of the organisers. The fact that talent
management and succession planning is
actually of high importance for these companies
is also derivable from the previously delineated
information.
It is also interesting that the concept of
continuous recruitment (cp. Chambers et al,
1998) has also appeared, indirectly, regarding
the costs and benefits of employing interns.
The main motivation for students to participate
in these competitions is the obtainable
professional experience, while organisers also
believe these competitions are a potential field
for employer branding. It is worth to point to
the fact that getting to know more about the
company is not among the main motives for
participants. Though, it is undeniable that by
the end of the event, as a side-effect, students
will know more about the company than
before. As most of the participants end up
being ‘positively disappointed’ by the end,
professional student competitions provide a
sufficient field for employer branding and
corporate image development.
Since employers are not only willing to but also
do actually hire participants as interns, practice
shows that professional student competitions
can lead to the atypical employment of talented
young individuals. According to Maddox (1987),
competitions provide such practical experience
which is not obtainable by any other way. This is
completely in line with the opinion of students,
who named the possibility of attaining
professional experience as their main motive
for participation.
At this point, I would like to point to the fact
that no major differences are noticeable in the
approaches and practices of organisations
operating in different countries.
Limitations
Even though examining the opinions of all the
actors was admittedly not an aim of the
46 INNOVATIVE RECRUITMENT OF HIGH POTENTIALS: THE POTENTIAL BENEFITS OF ORGANISING PROFESSIONAL STUDENT COMPETITIONS – RESULTS OF A CROSS-NATIONAL STUDY
Copyright ©2013 by International Journal of Sales, Retailing and Marketing Vol. 2 No. 1 2013
presented research, I still believe that getting to
know the roles and possible motives of
educational institutions and parents would
mean a valuable contribution to the already
collected information. Identifying the roles of
parents would be especially useful since beside
competitions for college and/or university
students, ones targeting students in secondary
education are also of growing popularity.
Organisers of these competitions in Hungary are
no smaller names than the Central Bank of the
country (Magyar Nemzeti Bank) or MOL
Hungarian Oil and Gas Company, the former
organising ‘Monetary’, the latter MOL Junior
Fresh.
As it was already mentioned, the greatest
limitation is the low number of participants,
especially regarding the questionnaire asking
participating students opinions. I believe that
this is less of an issue in terms of the organisers
as the questions of the originally planned
interviews had been transformed into the
online questionnaire, which even facilitated the
analysis, still providing a sufficient amount of
valuable information.
The research was not representative to any
extent; therefore it provides no ground for
generalisations. While, on the other hand, the
collected data proved the online questionnaires
to be sufficient tools for the purposes of the
research. The current research can be regarded
as a pilot study, one which is definitely worth to
be extended to a bigger sample.
Conclusions, recommendations
Based on the information presented above, one
can state that organising as well as taking part
in professional student competitions provide
mainly benefits for both sides. (Costs and/or
possible disadvantages are negligible, if any, or
fixed due to regulations.)
Participating in such competitions may lead to
atypical employment (e.g. internship) of the
successful participants.
Companies might consider paying a bit more
attention to the organisation of such events,
especially in terms of the marketing/advertising
activity to reach as many talented, young
individuals as possible. This idea has also been
justified by the empirical research in a way, as
22 percent of those students who never
participated in professional student
competitions said they had had no idea that
such competitions existed and a further 7
percent could not take part due to the lack of
teammates. In today’s world, the creation of
(even virtual) forums could mean a solution for
the latter problem.
I strongly believe that providing some kind of
feedback for all those with an evaluable
performance would be an investment that is
certainly worth consideration, although I also
know that the resources of the organising
companies are very limited.
Taking into account that labour market entrants
and young graduates are in a tough situation
when trying to get employed, educational
institutions as well as teachers should play a
more (pro)active role in convincing and
encouraging students to take part in
competitions, as with such an experience their
chances of getting employed appear to be
higher.
A further function of these competitions,
namely selection, comes to light at this point, as
the most motivated, determined and hopefully
talented students will take part in these
competitions regardless of the possible
obstacles they might have to face.
The fact that competitions bring mutual
benefits for organisers and participants is of no
question, although, in my opinion, the positive
effects would be extendable with some extra
efforts that are worth to consider.
Acknowledgement
I would like to express my gratitude to all those
who supported and helped me through this
research, with special thanks to Tibor Szabó,

47 INNOVATIVE RECRUITMENT OF HIGH POTENTIALS: THE POTENTIAL BENEFITS OF ORGANISING PROFESSIONAL STUDENT COMPETITIONS – RESULTS OF A CROSS-NATIONAL STUDY
Copyright ©2013 by International Journal of Sales, Retailing and Marketing Vol. 2 No. 1 2013
PhD and Béla Pataki, PhD. I also owe a debt of
thanks to all the respondents and participants
of this study for their support and commitment.
The research was supported by the „Közösen a
Jövő Munkahelyeiért” Foundation.
(http://www.kjmalapitvany.hu/)
References
Atkinson, J. (1984): Manpower Strategies for
Flexible Organizations. Personnel Management,
pp. 28-31
Axelrod, E. L., Handfield-Jones, H., Welsh, T. A.
(2001): War for Talent, Part Two. The McKinsey
Quarterly, 2001 No. 2, pp. 9-11
Babbie, E. (2010): The practice of social
research. Twelfth edition, Wadsworth, Cengage
Learning. Belmont, CA, USA
Bratton, J., Gold, J. (2000): Human Resource
Management: Theory and Practice. Second
edition, MacMillan Press Ltd., London, Great
Britain
Belchamber, G. (2010): Flexicurity: What is it?
Can it Work Downunder? Australian Bulletin of
Labour, Sept, 2010
Borbély Sz. (2000): Atipikus foglalkoztatás
feltételei és hatása a munka világára. SZGTI
kutatás; souce:
http://mathom.dura.hu/mszosz/00/00/index/ht
ml/szolgaltatasok/szgti/atipikus-
foglalkoztat.pdf, downloaded: April 10, 2011
Bronstein, A. (2009): International and
comparative labour law: Current challenges.
(Executive Summary), ISBN 978-92-2-121202-7;
downloaded: Jan 11; 2012:
http://www.ilo.org/wcmsp5/groups/public/@d
greports/@dcomm/@publ/documents/article/
wcms_107847.pdf
Burnsed. B. (2010): When a Degree Isn’t
Enough. US News & World Report, May 2010,
Vol. 147, Issue 5, p. 52
Burroni, L., Keune, M. (2011): Flexicurity: A
conceptual critique. European Journal of
Industrial Relations, Vol. 17 Issue 1, pp. 75-91
Cazes, S., Nesporova, A. (2003):
Munkaerőpiacok átalakulóban: rugalmasság és
biztonság Közép- és Kelet-Európában,
International Labour Office, Budapest
Chambers, E. G., Foulon, M., Handfield-Jones,
H., Hankin, S. M., Michaels III, E. G. (1998): The
War for Talent, The McKinsey Quarterly, 1998
No. 3, pp. 44-57
Council Directive 97/81/EC (of 15 December
1997) concerning the Framework Agreement on
part-time work concluded by UNICE, CEEP and
the ETUC; source: http://eur-
lex.europa.eu/LexUriServ/LexUriServ.do?uri=OJ
:L:1998:014:0009:0014:EN:PDF, downloaded:
March 11, 2011
Farndale, E., Scullion, H., Sparrow, P. (2010):
The role of corporate HR function in global
talent management. Journal of World Business
No. 45 (2010) pp. 161-168
Fernandez-Aráoz, C., Groysberg, B., Nohria N.
(2010): How to Hang On to Your High
Potentials. Harward Business Review, Vol. 89,
No. 10, pp. 76-82.
Finna H. (2008): A munkaerőpiaci
rugalmasságot elősegítő atipikus foglalkoztatási
formák a hazai kis- és középvállalkozásoknál.
Ph.D. Dissertation
Finna H., Forgács T. (2010): A rugalmas
foglalkoztatási formákról. Információs
társadalom, Vol. 10, No. 1, pp. 77-94
Guest, D. E. (1999): Human Resource
Management and Performance: A Review and
Research Agenda. In: Schuler, R. S., Jackson, S.
E. (1999): Strategic Human Resource
Management: A Reader. pp. 177-190, Wiley-
Blackwell, Bodmin, Cronwall, Great Britain

48 INNOVATIVE RECRUITMENT OF HIGH POTENTIALS: THE POTENTIAL BENEFITS OF ORGANISING PROFESSIONAL STUDENT COMPETITIONS – RESULTS OF A CROSS-NATIONAL STUDY
Copyright ©2013 by International Journal of Sales, Retailing and Marketing Vol. 2 No. 1 2013
Hartmann, E., Feisel, E., Schober, H. (2010):
Talent management of western MNV sin China:
Balancing global integration and local
responsiveness. Journal of World Business No.
45 (2010), pp. 169-178
Hertel A. (2004): Atipikus foglalkoztatási formák
Magyarországon.; source: http://www.e-
tudomany.hu/etudomany/web/uploaded_files/
20040203.pdf, downloaded: April 10, 2011
Hieronimus, F., Schaefer, K., Schröder, J. (2005):
Using branding to attract talent. The McKinsey
Quarterly 2005, No. 3, pp. 12-14
Hoffmann M., Kozák Á., Veres Z. (2000):
Piackutatás. Műszaki Könyvkiadó, Budapest
Huselid, M. A., Beatty, R. W., Becker, B. (2009):
The differentiated workforce. Harvard Business
School Press, Boston – Quoted by: Schuler, R. S.,
Jackson, S. E., Tarique, I. (2010): Global talent
management and global talent challenges:
Strategic opportunities for IHRM. Journal of
World Business (2010), doi:
10.1016/j.jwb.2010.10.011
Iles, P., Chuai, X., Preece, D. (2010): Talent
management and HRM in multinational
companies in Beijing: Definitions, differences
and drivers. Journal of World Business No. 45
(2010), pp. 179-189
Laky T. (1997): Atipikus munkák
Magyarországon. In: Laky T., Borbély Sz., Nacsa
B., Lakatos J., Nádas M., Simonyi Á., Linder S.,
Plank F., Gere I. (1997): Az atipikus
foglalkoztatási formák. Európai Tükör
Műhelytanulmányok 25., Integrációs Stratégiai
Munkacsoport, Budapest
Laky T. (2006): Az atipikus foglalkozásokról.
Manuscript; source:
http://people.mokk.bme.hu/~kornai/laky/Cikk/
atipikus.pdf, downloaded: May 1, 2011
Lane, K., Pollner, F. (2008): How to address
China’s talent shortage. The McKinsey
Quarterly, 2008 No. 3
Maddox, L. M. (1987): Corporate competitions
superior to internships. Marketing News, Sept.
25, 1987, pp. 11-12
Mátyási S., Haskó K., Buzási Z., Selymeci V.
(2007): Iskola melletti munkatapasztalat-
szerzés: kényszer vagy lehetőség? (A szakmai
gyakorlat munkaerő-piaci hatásinak átfogó
elemzése) I. rész. Munkaügyi Szemle, 2007/1.,
pp. 23-27
McDonnell, A., Lamare, R., Gunnigle, P, Lavelle,
J. (2010): Developing tomorrow’s leaders –
Evidence of global talent management in
multinational enterprises. Journal of World
Business No. 45 (2010), pp. 150-160
Mellahi, K., Collings, D. G. (2010): The barriers
to effective global telent management: The
example of corporate élites in MNEs. Journal of
World Business No. 45 (2010) pp. 143-149
Michie, J., Sheehan, M. (2005): Business
strategy, human resources, labour market
flexibility and competitive advantage.
Interational Journal of Human Resource
Management, 16:3 March, pp. 445-464
Mile Cs., Hinek M., Torgyik J. (2007): A karrier
irodák lehetőségei a fiatal diplomások
elhelyezkedésének megkönnyítésében.
Munkaügyi Szemle, 2007/7., pp. 18-21
Nacsa B. (1997): Az atipikus munkaviszonyok
szabályozása Nyugat-Európa egyes országaiban.
In: Laky T., Borbély Sz., Nacsa B., Lakatos J.,
Nádas M., Simonyi Á., Linder S., Plank F., Gere I.
(1997): Az atipikus foglalkoztatási formák.
Európai Tükör Műhelytanulmányok 25.,
Integrációs Stratégiai Munkacsoport, Budapest
Novicevic, M. M., Harvey, M. (2001): The
changing role of the corporate HR function in
global organizations over the twenty-first
century. International Journal of Human
Resource Management, 12, pp. 1251-1268 –
Quoted by: Farndale, E., Scullion, H., Sparrow,
P. (2010): The role of corporate HR function in
global talent management. Journal of World
Business No. 45 (2010), pp. 161-168
49 INNOVATIVE RECRUITMENT OF HIGH POTENTIALS: THE POTENTIAL BENEFITS OF ORGANISING PROFESSIONAL STUDENT COMPETITIONS – RESULTS OF A CROSS-NATIONAL STUDY
Copyright ©2013 by International Journal of Sales, Retailing and Marketing Vol. 2 No. 1 2013
Pianko, D. (1996): Power internships.
Management Review, Vol. 85, Issue 12, pp. 31-
33
Schuler, R. S., Jackson, S. E., Tarique, I. (2010):
Global talent management and global talent
challenges: Strategic opportunities for IHRM.
Journal of World Business (2010), doi:
10.1016/j.jwb.2010.10.011
Scipione, P A. (1992): Practical Marketing
Research. Kendall/Hunt Publishing Company,
Dubuque, IA, USA
Scipione, P. A. (1994): A piackutatás gyakorlata:
Springer Hungarica Kiadó Kft., Budapest
Solow, R. M. (1997): What is Labour Market
Flexibility? What is it Good for?, Proceedings of
the British Academy, 97, pp. 189-211
Szabó K., Négyesi Á. (2004): Az atipikus munka
térnyerésének okai a tudásgazdaságban.
Közgazdasági Szemle, Vol. LI, January 2004, pp.
46–65
Szabó L. (2001): A vállalati piackutatás
gyakorlata. Perfekt Gazdasági Tanácsadó,
Oktató és Kiadó Rt.
Tarique, I., Schuler, R. S. (2010): Global talent
management: Literature review, integrative
framework, and suggestions for further
research. Journal of World Business, No. 45
(2010), pp. 122-133
Try, S. (2004): The role of flexible work int he
transition from higher education into the labour
market. Journal of Education and Work, Vol. 17,
Issue 1, pp. 27-45
Valverde, M. Tregaskis, O., Brewster, C. (2000):
Labor flexibility and firm performance.
International Advances in Economic Research,
Vol. 6, No. 4, pp. 649-661
Why has unemployment not risen more in the
recession? (2010), Economic Outlook, Vol. 34,
Issue 1 pp. 5-12
Williams, A. (1993): Human Resource
Management and Labour Market Flexibility.
Avebury, Aldershot, England

50 HOLLYWOOD AND FASHION: INFLUENCE ON APPAREL PURCHASE DECISIONS
Copyright ©2013 by International Journal of Sales, Retailing and Marketing Vol. 2 No. 1 2013
Sanjukta A. Pookulangara, Ph.D.,Assistant Professor
University of North Texas, College of Merchandising,
Hospitality and Tourism, 1155 Union Circle #311100
Denton, TX 76203
(email: [email protected]).
Tammy R. Kinley, Ph.D., University of North Texas
College of Merchandising, Hospitality and Tourism
Bharath M. Josiam, Ph.D., University of North Texas
College of Merchandising, Hospitality and Tourism
Daniel L. Spears, Ph.D., University of North Texas
College of Merchandising, Hospitality and Tourism
HOLLYWOOD AND FASHION: INFLUENCE ON APPAREL
PURCHASE DECISIONS
Sanjukta A. Pookulangara, Tammy R. Kinley, Bharath M. Josiam & Daniel L. Spears
Abstract
The study investigated the influence of fashion involvement, movies, and television programs on
Generation Y consumers’ apparel and apparel-related product purchase behaviors. An online survey
was administered to a convenience sample of 397 students. Structural equation modeling was
employed to test the hypotheses and explore causal relationships. Findings indicate participants
were not only interested in movies and television programs, but also indicated they paid attention to
the costume selection for the characters – to the extent that they allowed character costumes to
influence their own clothing purchase behavior. Additionally, actual purchase behavior of fashion
products also influenced consumer’s new fashion purchase behavior.
Keywords: Hollywood, Fashion Involvement, Fashion Media Influence, Clothing Purchase, Gen Y
Introduction
For most of the past century, one of the most
powerful and influential sources of
entertainment worldwide is Hollywood. Movies
and television shows are readily available to
audiences through different channels such as
movie theatres, CD/DVDs/Blue-Ray discs,
Internet, satellite dish networks, and cable
channels. The increase in media choices (i.e.,
television, movies, the Internet, and
magazines), has increased product diversity and
lifestyle choices requiring marketers and
retailers to incorporate new and effective
approaches and strategies to reach target
consumers (Bakewell & Mitchell, 2003).
In almost every part of the world, Hollywood
movies are released each year and thus viewed
by a variety of audiences. Similarly, television
viewing is the dominant leisure activity for
many people (Harris, 1989). There are several
historic examples of the powerful impact of
movies on fashion: Annie Hall and Saturday
Night Fever in 1977, Flashdance in 1983, and
Sex in the City (the movie) in 2008. In these and
several other examples, the dress of movie
characters became fashion – and indeed
defined the decade (Leopold & Zerba, 2009; la
Ferla, 2010). Today the influence may be more
subtle – perhaps a mood or a color story – as
we have seen in 2010 after the release of
Avatar (la Ferla, 2010).
Television programs have also had similar
influences – Miami Vice in the 1980s and Sex
and the City in the 2000s both had an impact on
consumer-driven fashion trends. Sex and the
City is credited with making Manolo Blahnik
shoes popular, while Gossip Girl brought us
crested blazers and headbands. More recently,
programs like Mad Men and Real Housewives

51 HOLLYWOOD AND FASHION: INFLUENCE ON APPAREL PURCHASE DECISIONS
Copyright ©2013 by International Journal of Sales, Retailing and Marketing Vol. 2 No. 1 2013
are influencing fashion by creating looks that
are classic and trendy (Flam, 2009; Leopold &
Zerba, 2009; la Ferla, 2010).
“The proliferation of entertainment media
worldwide has increased the exposure of
celebrities to mass audiences and given them a
powerful status” (Fraser & Brown, 2002, p. 183-
184). Celebrities are important cultural agents
presenting a certain set of messages or ideas;
they influence audiences. Females, particularly,
reach out to movies, television shows, and
magazines for information about cosmetics and
clothes (Steele & Brown, 1995). However, the
influence of entertainment and fashion does
not just appeal to the younger market, as
television shows that target a mature audience
have the same impact on their viewers. Olijnyk,
(2007) reported the influence of the hit ABC
drama, Brothers and Sisters, on one viewer who
stated, “I saw the bag on the TV show and loved
it” (p. 94). Olijnyk believed this to be just one
example of consumer purchase made because
of the strong fashion influence of
entertainment media in our culture. Style
conscious fans tend to hone in on new looks
while viewing their favorite shows. Kozar
(2010) found a positive relationship between
the viewer’s intent to purchase particular
clothing styles when the model was
photographed wearing the style, however there
has been no empirical study which has
examined how Hollywood depicted in both
movies and televisions has influenced fashion.
People born between 1978 and 1994 are
referred to in the consumer behavior literature
as Generation Y or the Millennium Generation,
and they account for approximately 20% of the
U.S. population (Durvasula & Lysonski, 2008).
They have grown up with the Internet and are
very comfortable seeking information
constantly (Krayewski, 2009). They have
greater exposure to all kinds of media than
have young people in previous generations,
resulting in stronger access to ideas, trends, and
opinions of relevant others. They also consume
a great amount of fashion (Durvasula & Lyonski,
2008) and are known to have high fashion
involvement (Belleau et al., 2007).
Consequently, it can be assumed that
Generation Y is likely to have developed a
different shopping style compared with
previous generations. Given the size of this
growing segment it is imperative to focus on
Generation Y consumers and offer guidelines to
marketers on how these consumers make their
choices.
Earlier studies have examined purchase
intention based on media influences
(Chowdhary, 1989; Cohen, 2001). Additionally,
studies have examined celebrities as sources of
influence (Lines 2001; Moeran 2003) as well as
the celebrity endorsement which has indicated
that endorsed product will have more
purchases and so be of higher value(Clark &
Horstman, 2003). Hence, it can be stated that
while research has examined celebrity
endorsement and celebrity influence on
purchase intention, actual purchase behavior
influenced by media has never been studied,
and needs to be explored in more depth. This
study aims to fill the gap in literature by
examining influence of Hollywood (i.e. fashion
shown in the movies) on actual purchase
behavior. Therefore the purpose of this study
was to investigate the influence of fashion
involvement, movies, and television programs
on reported Gen Y consumer apparel and
apparel-related product purchase behaviors.
Style conscious fans identify new looks while
viewing their favorite shows. Given the growth
of Hollywood’s influence on the fashion
industry and consumers, it is important for
retailers to gain a better understanding of how
to capitalize on the “media influences” more
holistically.
Literature Review
The conceptual framework of this study
presented here draws on the theory of media
effects proposed by Cohen (2001) as well as
McCracken’s (1989) theory of meaning transfer.
52 HOLLYWOOD AND FASHION: INFLUENCE ON APPAREL PURCHASE DECISIONS
Copyright ©2013 by International Journal of Sales, Retailing and Marketing Vol. 2 No. 1 2013
These two theories are used to predict
influence of fashion media on consumers’
purchase behavior.
According to theories of media effects,
identification with the celebrity or a character
increases due to media exposure and its impact
(Cohen, 2001). Cohen asserts that members of
the audience often identify themselves with the
characters portrayed while reading a novel or
watching a movie or a television program.
Viewers who imitate and model their lives after
a character in television shows or movies
commonly do so in their personal aesthetic via
clothing and appearance (Romeo, 2009).
Wilson’s (1998) study found that 24% of
viewers’ clothing choices were influenced by
television and that consumers imitated
television characters’ appearance through
clothing choice, hairstyle and color.
McCracken (1989) proposed that it is the
celebrity's cultural meaning and the transfer of
that meaning that drives endorsement
outcomes. Celebrities are publicly well-known
people in the realm of popular culture (sports,
entertainment, and fashion; see Giles, 2000).
The meaning transfer model posits that
celebrities develop a persona through the types
of roles they play in society as well as how they
are portrayed in the media (Amos, Holmes, &
Strutton, 2008). It is believed that when
celebrities endorse a product, the meaning
developed around a particular celebrity ideally
should transfer to a company, brand or product
and hence when a consumer identifies with a
celebrity he/she purchases the product in the
hope of claiming some of these transferred
meanings for their own lives (Erdogan & Baker
2000; McCracken 1989).
Generation Y and Media Consumption
According to Bush, Martin & Bush (2004),
Generation Y also termed as “Millennials” have
been identified as a market that is high in
demand because of their (a) spending power,
(b) ability to be trendsetters, (c) receptivity to
new products, and (d) tremendous potential for
becoming lifetime consumers. Additionally,
these consumers utilize a range of new media
for information and insight when making brand
decisions (Millennial Shoppers, 2012). In case
of movies and television viewing, Pew Research
has indicated that that nearly a third of users
ages 18-29 watch or download movies and TV
shows (Madden, 2007). Generation Y is
redefining media consumption is taking their
personal connection—with each other and
content—to new levels, new devices and new
experiences like no other age group (State of
The Media, 2011). Thus, it can be stated that
the effects of heightened consumption of media
and increased use of technology have made
consumerism and brand awareness a central
aspect of their lives (Syrett & Lammiman, 2004)
and hence an attractive segment for the fashion
industry.
Influence of Media on Clothing Purchase
Fashion media can be defined as any media
including magazines, television, and movies
with fashion content, fashion websites and
social media outlets. In general, it can be stated
that fashion media coverage is greater than any
other area of human interest such as art,
education, architecture, theater, literature, the
environment, or technology (Polan, 2006).
Actors and actresses act as trend setters by the
clothing they wear on the red carpet or even by
what they wear in their day-to-day life and are
able to exert some influence on consumers
particularly through the vast arrays of fashion
media including television, movies, Internet,
magazines, and print advertisements (Winge,
2008).
Historically, credit for new fashion was given to
the fashion designer, but in more recent years
celebrities dressed in designer clothing have
become a medium to reach audiences because
of their large fan following. Accordingly,
televised award functions have become major
events to showcase designer creations (Dunn,
2008). This trend in marketing is strong
evidence of the effect of Hollywood on the

53 HOLLYWOOD AND FASHION: INFLUENCE ON APPAREL PURCHASE DECISIONS
Copyright ©2013 by International Journal of Sales, Retailing and Marketing Vol. 2 No. 1 2013
fashion industry. Therefore, to increase their
consumer base, clothing designers and
manufacturers introduce styles that are shown
in the movies or are worn by celebrities. Thus,
it is evident that movies/media have a
significant influence on audience’ clothing
choices (Chowdhary, 1989).
Advertising is the major method of
promoting brand image for apparel (Thompson,
2000). New forms of media such as the
Internet, television shopping networks, and
magalogs (which combine magazine and catalog
formats), have emerged to promote brands (Oh
& Jasper, 2006). Advertisements can create
meanings in fashion items that are decoded by
the consumers with surprising consistency
depending on the differing levels of fashion
involvement. Through such advertising
techniques as brand placement and brand
integration, featured items or styles take
precedence. According to Lehu and Bressoud
(2007), the technique of product placement in
movies is used frequently by advertisers. For
example, in the movie What Women Want,
Nike as a sports brand was very effectively
promoted. In addition to movies, product
placement is also used frequently in television
programs, theater plays, songs, video games,
and novels (Kretchmer, 2004).
Fashion Involvement
Involvement as a measure of explaining
consumer behavior has become a well-
developed research tool (O’Cass, 2000). In a
nutshell, “involvement is the extent to which
consumers are concerned with a particular
purchase decision and consider it to be
important to them” (Kaiser, 1997); involvement
for different products may be affected by
different factors (Michaelidou & Dibb, 2006).
Goldsmith et al. (1999) determined that
consumers who are highly involved in fashion
are the driving force of the fashion adoption
process. High fashion involvement suggests a
self-indulgent and pleasure-seeking aspect,
implying that the individual’s involvement is
driven partly by a desire to spend time on an
enjoyable activity (Michaelidou & Dibb, 2006).
Studies have shown that fashion involvement is
related to positive emotion during shopping,
hedonic tendency (sense of curiosity or
exploration), impulse buying, and not only for
purchasing apparel but for buying the newest
styles (Park et al., 2006; Seo et al., 2001) as well
as buying clothing frequently (Goldsmith, 2002).
The consistently positive relationship between
level of fashion involvement and apparel
purchase (Park, et al, 2006) makes this
psychographic characteristic particularly useful
in the context of entertainment media influence
on clothing buying behavior. By definition, a
higher level of fashion involvement should lead
the consumer to be more attuned to the
costuming of characters and the resultant
possibility/probability of developing fashion
trend. Thus, fashion involvement provides an
interesting perspective on clothing purchase
choice since clothing provides a means of
expressing social identity (Noesjirwan &
Crawford, 1982; Michaelidou & Dibb, 2006),
and the level of fashion involvement can
influence a consumer’s choice and eventual
purchase intentions (Belleau et al, 2007).
Lee et al. (2003) found that fashion involvement
was related to subjective (rather than objective)
knowledge, which influenced experiential
information processing. The authors concluded
that female adult consumers who follow the
latest fashion trends tend to process
information experientially. Observing a
character in a movie or television plot moving
and being in a particular clothing style is a
virtual experiential manifestation of fashion or
trend observation. Furthermore, Belleau et al.
(2007) indicated that media usage, fashion
involvement, and personality traits of young
consumers were found to influence purchase
intentions with 80% of the respondents noticing
clothing on television shows.

54 HOLLYWOOD AND FASHION: INFLUENCE ON APPAREL PURCHASE DECISIONS
Copyright ©2013 by International Journal of Sales, Retailing and Marketing Vol. 2 No. 1 2013
Fashion involvement has been studied
in relation to a number of specific categories of
clothing including dress for in-line skating
(Dickson & Pollack, 2000), bicycling (Casselman-
Dickson & Damhorst, 1993) and tennis (Chae, et
al., 2006). Fashion items, such as hair or
clothing styles, can be considered central to the
television show as they contribute to building
the characters' image and the atmosphere of
the show (Russell & Puto, 1999).
Purchase Behavior
People look at celebrities today for
similarities in lifestyles and they want to imitate
them. There is an assumption made by the
consumer that what is good for the celebrity is
good for them (Cohen, 2006). Hence, it can be
assumed that consumer’s purchase behaviors
would be influenced by what they see on
television and movies. Additionally, fashion
involvement is a relevant indicator that has
been used to predict purchase behavior and
consumer characteristics (Brown & Kaldenberg,
1997; O’Cass, 2001). Thus, in this study
purchase behavior was measured for two
variables: Fashion in Media and New Fashion.
Fashion in Media. Fashion in Media has been
defined for the present study as the consumers’
purchase behavior related to clothing and/or
accessories they have bought which were
inspired by movies and television programming.
As early as the 1930s, Blumer (1933) reported
that movies influenced college students with
regard to specific activities such as modes of
dress, hairstyles, and forms of communication.
Similarly, Belleau et. al.’s (2007) study indicated
the influence of media on purchase behaviors
of fashion clothing. Thus, it can be inferred that
consumers who are watching movies and
television will likely be inspired to buy and/or
consume products as seen on these media. By
adopting the styles of their favorite characters,
viewers bring these meanings into social
circulation and it helps them construct their
identity (Fiske, 1987). It can be assumed that
portrayal of fashion in the media will influence
consumers’ interest in “new” fashion in media.
New Fashion. New Fashion can be defined for
the present study as consumers’ conscious
behavior in finding out about new fashion being
portrayed in the movies. The cults of celebrity
and fashion are interwoven with designers
successfully using both television and movies to
create buzz around their fashion products
(Tungate, 2005; Carroll, 2009). Consumers look
for “new” looks created in the movies such as
the Alice in Wonderland inspired line that was
launched in Kohl’s (Alwill, 2010). With the
advent of new technology, consumers are able
to watch movies and television shows
whenever and however they want, increasing
their exposure to both of these media.
Consumers who are already consuming movies
and television programming could be also
looking for new fashion ideas.
Studies have examined the direct influence of
movies and/or television on purchase intention
but not actual purchase behavior. Additionally,
studies have also examined the influence of
fashion involvement on purchase intention.
However, this study examines the moderating
role of fashion involvement with respect to
both movies and television and the eventual
purchase behavior. The influence of movies
and television are combined to better reflect
the changing consumer lifestyle of consuming
multiple media formats simultaneously; hence,
the following hypotheses are put forth. The
resulting research model is presented in Figure
1.
H1a: Media Influence will positively impact
Fashion Involvement.
H1b: Media Influence will positively impact New
Fashion Purchase Behavior.
H1c: Media Influence will positively impact
Fashion In Media Purchase Behavior.
H2a: Fashion Involvement will positively impact
New Fashion Purchase Behavior.
H2b: Fashion Involvement will positively impact
Fashion In Media Purchase Behavior.
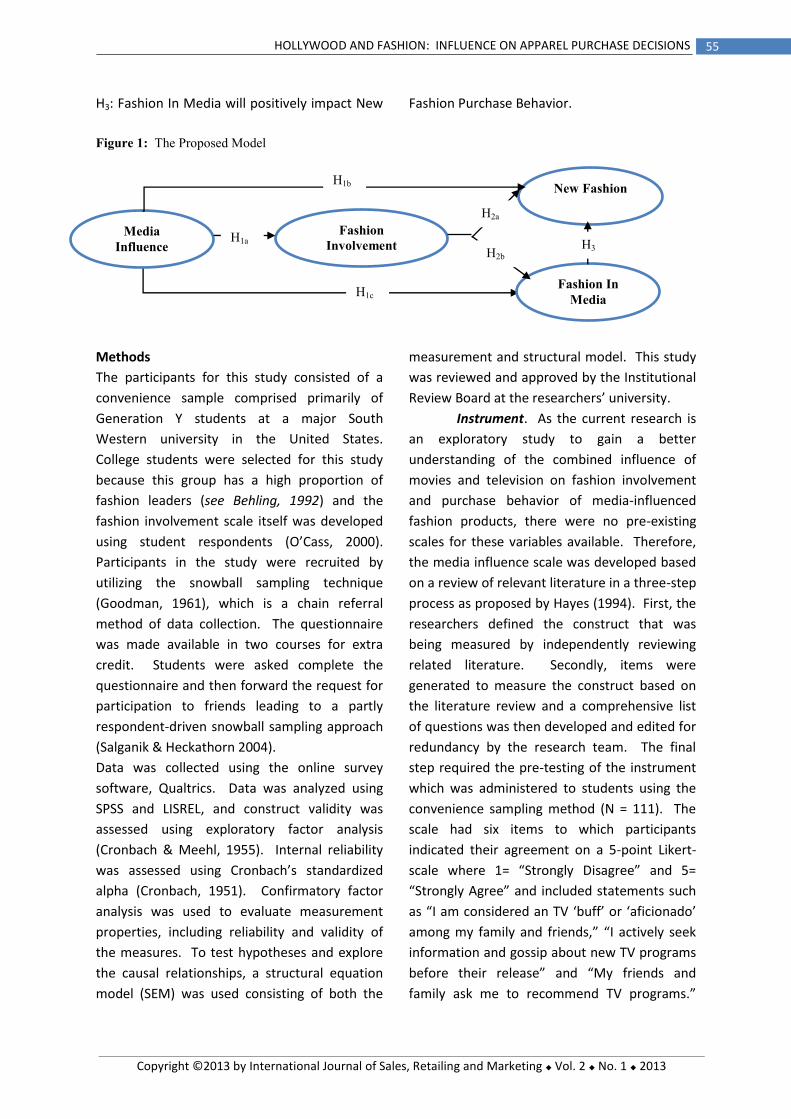
55 HOLLYWOOD AND FASHION: INFLUENCE ON APPAREL PURCHASE DECISIONS
Copyright ©2013 by International Journal of Sales, Retailing and Marketing Vol. 2 No. 1 2013
H1c
H3: Fashion In Media will positively impact New Fashion Purchase Behavior.
Figure 1: The Proposed Model
Methods
The participants for this study consisted of a
convenience sample comprised primarily of
Generation Y students at a major South
Western university in the United States.
College students were selected for this study
because this group has a high proportion of
fashion leaders (see Behling, 1992) and the
fashion involvement scale itself was developed
using student respondents (O’Cass, 2000).
Participants in the study were recruited by
utilizing the snowball sampling technique
(Goodman, 1961), which is a chain referral
method of data collection. The questionnaire
was made available in two courses for extra
credit. Students were asked complete the
questionnaire and then forward the request for
participation to friends leading to a partly
respondent-driven snowball sampling approach
(Salganik & Heckathorn 2004).
Data was collected using the online survey
software, Qualtrics. Data was analyzed using
SPSS and LISREL, and construct validity was
assessed using exploratory factor analysis
(Cronbach & Meehl, 1955). Internal reliability
was assessed using Cronbach’s standardized
alpha (Cronbach, 1951). Confirmatory factor
analysis was used to evaluate measurement
properties, including reliability and validity of
the measures. To test hypotheses and explore
the causal relationships, a structural equation
model (SEM) was used consisting of both the
measurement and structural model. This study
was reviewed and approved by the Institutional
Review Board at the researchers’ university.
Instrument. As the current research is
an exploratory study to gain a better
understanding of the combined influence of
movies and television on fashion involvement
and purchase behavior of media-influenced
fashion products, there were no pre-existing
scales for these variables available. Therefore,
the media influence scale was developed based
on a review of relevant literature in a three-step
process as proposed by Hayes (1994). First, the
researchers defined the construct that was
being measured by independently reviewing
related literature. Secondly, items were
generated to measure the construct based on
the literature review and a comprehensive list
of questions was then developed and edited for
redundancy by the research team. The final
step required the pre-testing of the instrument
which was administered to students using the
convenience sampling method (N = 111). The
scale had six items to which participants
indicated their agreement on a 5-point Likert-
scale where 1= “Strongly Disagree” and 5=
“Strongly Agree” and included statements such
as “I am considered an TV ‘buff’ or ‘aficionado’
among my family and friends,” “I actively seek
information and gossip about new TV programs
before their release” and “My friends and
family ask me to recommend TV programs.”
Media
Influence
Fashion
Involvement
Fashion In
Media
New Fashion
H1a
H1b
H3
H2a
H2b

56 HOLLYWOOD AND FASHION: INFLUENCE ON APPAREL PURCHASE DECISIONS
Copyright ©2013 by International Journal of Sales, Retailing and Marketing Vol. 2 No. 1 2013
Similar statements were included for movie
viewing. Fashion involvement was measured
using the product involvement scale developed
by O’Cass (2000). The original scale included
four factors (1) product involvement (2)
purchase decision involvement (3) consumption
involvement and (4) advertising involvement.
For the purpose of this study five statements
from factor 1, two statements from factor 2,
and two statements from factor 3 were utilized.
The selection of which statements to be
included was based on analysis of the pre-test.
Participants indicated their agreement on a 5-
point Likert-scale where 1= “Strongly Disagree”
and 5= “Strongly Agree” on the resultant nine
question scale. Sample statements included:
“Fashion means a lot to me” and “I have a
strong commitment to fashion.”
Reported purchase behaviors were measured
with eight statements measured with a Likert-
scale where 1= “Strongly Disagree” and 5=
“Strongly Agree.” The scale included
statements such as, “I purchase clothing that I
have seen in movies/TV programs” and “I look
for new fashions when I see trailers about new
movies.”
Results
Sample Demographics. A total of 454
questionnaires were completed of which 397
respondents were female. Only female
participants were included in the analysis
because the questions that were asked to gauge
actual purchase behavior included specific
reference to merchandise bought (e.g.,
handbags, jewelry, shoes, cosmetics, and
clothing). It could be inferred that male
students would answer differently to these
questions vis-à-vis the female students and
hence could influence the outcome.
Approximately 80% of the respondents were
between the ages of 18 and 23. Table 1 also list
the participants’ movie and television viewing
hours per week. The lack of diversity in the
participant pool is acknowledged as a limitation
of the study.
Table 1: Demographic Characteristics of the Respondents
Variables Frequency (N=284) Percent
Age
Less than 22 yrs old 221 55.7%
22-26 159 40.05%
More than 26 yrs old 17 4.25%
Movies watching habit/week – In a movie theater
None 166 41.8%
One movie per week 186 46.9%
Two movies per week 29 7.3%
More than two movies per week 16 4.0%
Movies watching habit/week – On television
None 46 11.6%
One movie per week 95 23.9%
Two movies per week 102 25.7%
More than two movies per week 154 38.8%
Movies watching habit/week – On the Internet
None 258 65.0%
One movie per week 58 14.6%
Two movies per week 30 7.6%
More than two movies per week 51 12.8%
Television watching habit/week
None 18 4.5%
One hour per week 97 24.4%
Two hours per week 102 25.7%
More than two hours per week 180 45.4%
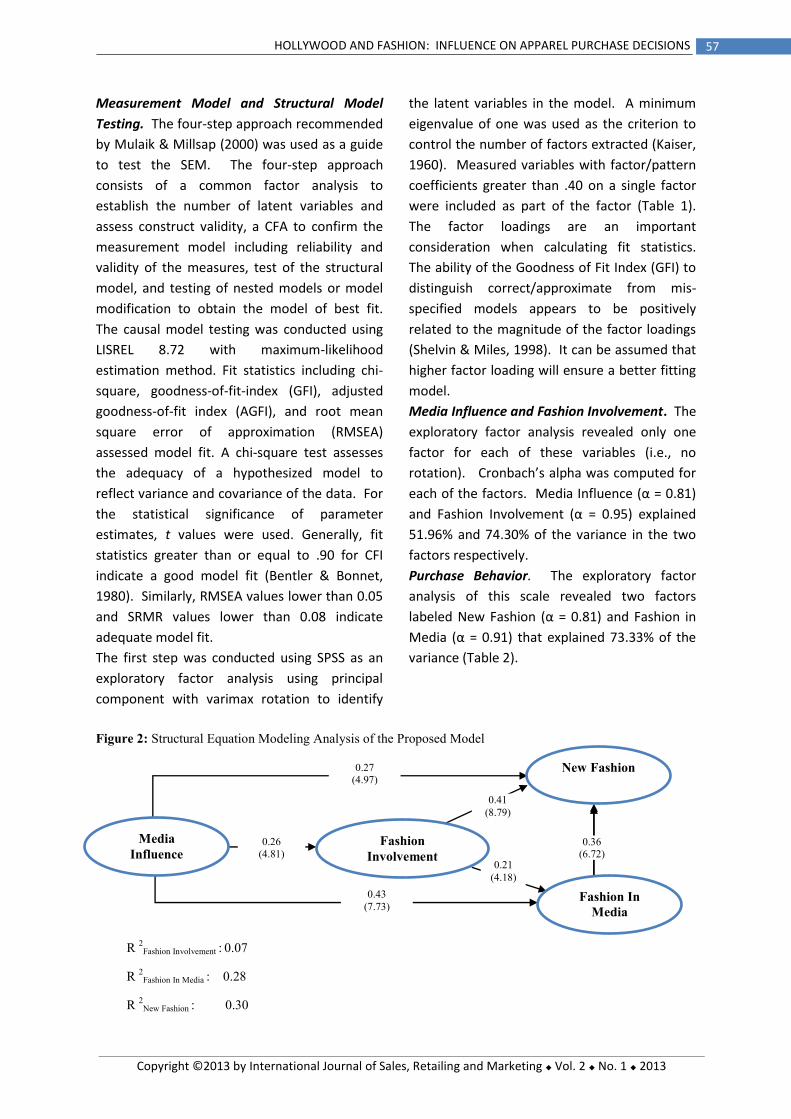
57 HOLLYWOOD AND FASHION: INFLUENCE ON APPAREL PURCHASE DECISIONS
Copyright ©2013 by International Journal of Sales, Retailing and Marketing Vol. 2 No. 1 2013
Measurement Model and Structural Model
Testing. The four-step approach recommended
by Mulaik & Millsap (2000) was used as a guide
to test the SEM. The four-step approach
consists of a common factor analysis to
establish the number of latent variables and
assess construct validity, a CFA to confirm the
measurement model including reliability and
validity of the measures, test of the structural
model, and testing of nested models or model
modification to obtain the model of best fit.
The causal model testing was conducted using
LISREL 8.72 with maximum-likelihood
estimation method. Fit statistics including chi-
square, goodness-of-fit-index (GFI), adjusted
goodness-of-fit index (AGFI), and root mean
square error of approximation (RMSEA)
assessed model fit. A chi-square test assesses
the adequacy of a hypothesized model to
reflect variance and covariance of the data. For
the statistical significance of parameter
estimates, t values were used. Generally, fit
statistics greater than or equal to .90 for CFI
indicate a good model fit (Bentler & Bonnet,
1980). Similarly, RMSEA values lower than 0.05
and SRMR values lower than 0.08 indicate
adequate model fit.
The first step was conducted using SPSS as an
exploratory factor analysis using principal
component with varimax rotation to identify
the latent variables in the model. A minimum
eigenvalue of one was used as the criterion to
control the number of factors extracted (Kaiser,
1960). Measured variables with factor/pattern
coefficients greater than .40 on a single factor
were included as part of the factor (Table 1).
The factor loadings are an important
consideration when calculating fit statistics.
The ability of the Goodness of Fit Index (GFI) to
distinguish correct/approximate from mis-
specified models appears to be positively
related to the magnitude of the factor loadings
(Shelvin & Miles, 1998). It can be assumed that
higher factor loading will ensure a better fitting
model.
Media Influence and Fashion Involvement. The
exploratory factor analysis revealed only one
factor for each of these variables (i.e., no
rotation). Cronbach’s alpha was computed for
each of the factors. Media Influence (α = 0.81)
and Fashion Involvement (α = 0.95) explained
51.96% and 74.30% of the variance in the two
factors respectively.
Purchase Behavior. The exploratory factor
analysis of this scale revealed two factors
labeled New Fashion (α = 0.81) and Fashion in
Media (α = 0.91) that explained 73.33% of the
variance (Table 2).
Figure 2: Structural Equation Modeling Analysis of the Proposed Model
R 2Fashion Involvement : 0.07
R 2Fashion In Media : 0.28
R 2New Fashion : 0.30
0.26
(4.81) 0.21
(4.18)
0.41
(8.79)
0.43
(7.73)
0.36 (6.72)
Media
Influence
New Fashion 0.27 (4.97)
Fashion
Involvement
Fashion In
Media
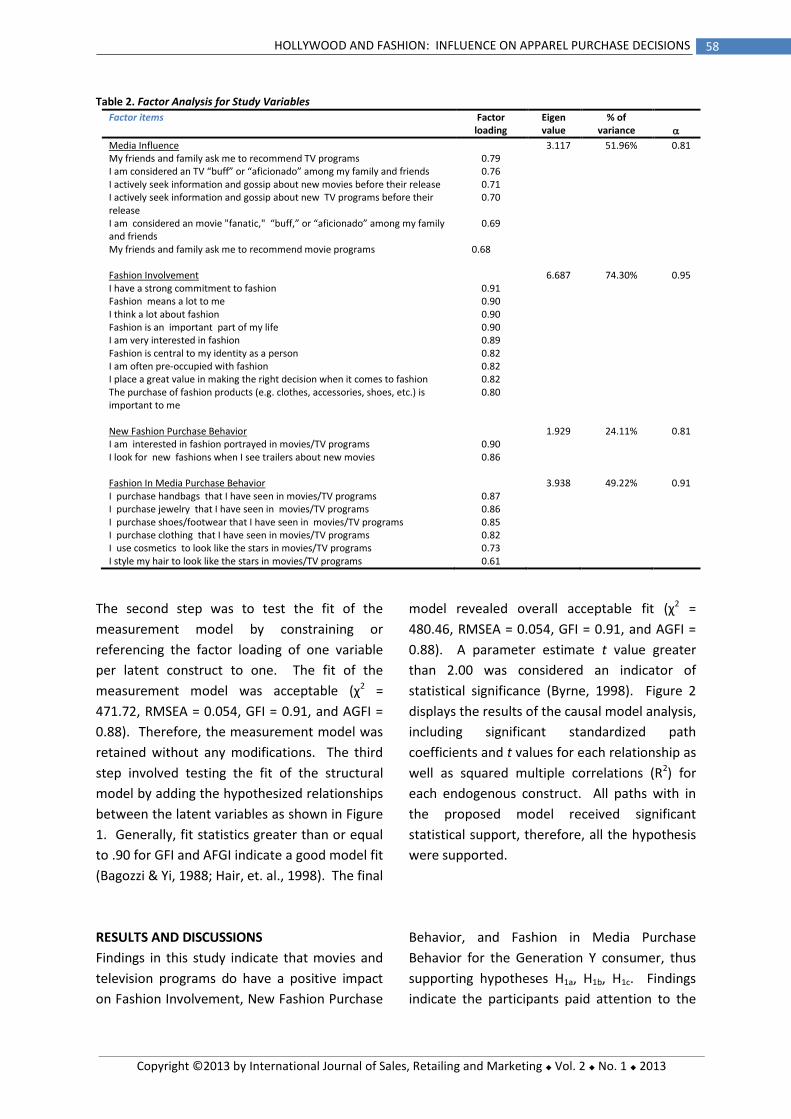
58 HOLLYWOOD AND FASHION: INFLUENCE ON APPAREL PURCHASE DECISIONS
Copyright ©2013 by International Journal of Sales, Retailing and Marketing Vol. 2 No. 1 2013
Table 2. Factor Analysis for Study Variables
Factor items Factor loading
Eigen value
% of variance
Media Influence 3.117 51.96% 0.81 My friends and family ask me to recommend TV programs 0.79 I am considered an TV “buff” or “aficionado” among my family and friends 0.76 I actively seek information and gossip about new movies before their release 0.71 I actively seek information and gossip about new TV programs before their release
0.70
I am considered an movie "fanatic," “buff,” or “aficionado” among my family and friends
0.69
My friends and family ask me to recommend movie programs 0.68 Fashion Involvement 6.687 74.30% 0.95 I have a strong commitment to fashion 0.91 Fashion means a lot to me 0.90 I think a lot about fashion 0.90 Fashion is an important part of my life 0.90 I am very interested in fashion 0.89 Fashion is central to my identity as a person 0.82 I am often pre-occupied with fashion 0.82 I place a great value in making the right decision when it comes to fashion 0.82 The purchase of fashion products (e.g. clothes, accessories, shoes, etc.) is important to me
0.80
New Fashion Purchase Behavior 1.929 24.11% 0.81 I am interested in fashion portrayed in movies/TV programs 0.90 I look for new fashions when I see trailers about new movies 0.86 Fashion In Media Purchase Behavior 3.938 49.22% 0.91 I purchase handbags that I have seen in movies/TV programs 0.87 I purchase jewelry that I have seen in movies/TV programs 0.86 I purchase shoes/footwear that I have seen in movies/TV programs 0.85 I purchase clothing that I have seen in movies/TV programs 0.82 I use cosmetics to look like the stars in movies/TV programs 0.73 I style my hair to look like the stars in movies/TV programs 0.61
The second step was to test the fit of the
measurement model by constraining or
referencing the factor loading of one variable
per latent construct to one. The fit of the
measurement model was acceptable (χ2 =
471.72, RMSEA = 0.054, GFI = 0.91, and AGFI =
0.88). Therefore, the measurement model was
retained without any modifications. The third
step involved testing the fit of the structural
model by adding the hypothesized relationships
between the latent variables as shown in Figure
1. Generally, fit statistics greater than or equal
to .90 for GFI and AFGI indicate a good model fit
(Bagozzi & Yi, 1988; Hair, et. al., 1998). The final
model revealed overall acceptable fit (χ2 =
480.46, RMSEA = 0.054, GFI = 0.91, and AGFI =
0.88). A parameter estimate t value greater
than 2.00 was considered an indicator of
statistical significance (Byrne, 1998). Figure 2
displays the results of the causal model analysis,
including significant standardized path
coefficients and t values for each relationship as
well as squared multiple correlations (R2) for
each endogenous construct. All paths with in
the proposed model received significant
statistical support, therefore, all the hypothesis
were supported.
RESULTS AND DISCUSSIONS
Findings in this study indicate that movies and
television programs do have a positive impact
on Fashion Involvement, New Fashion Purchase
Behavior, and Fashion in Media Purchase
Behavior for the Generation Y consumer, thus
supporting hypotheses H1a, H1b, H1c. Findings
indicate the participants paid attention to the

59 HOLLYWOOD AND FASHION: INFLUENCE ON APPAREL PURCHASE DECISIONS
Copyright ©2013 by International Journal of Sales, Retailing and Marketing Vol. 2 No. 1 2013
emerging fashion themes in media – to the
extent that they allowed character costumes to
influence their own clothing purchase behavior.
This is an important finding especially since
Generation Y is an influential market segment
with their annual spending power exceeding
$200 billion (Irwin, 2010). Generation Y is a
unique group of consumers because they have
been grown up in a media driven,
technologically saturated world, making it
difficult to reach them through traditional
marketing strategies (Morton, 2002).
Additionally, they have opposing attitudes,
values, and behaviors about shopping when
compared to other generations due to
technological, socio-cultural, economic, and
retail advances in the last several decades
(Bakewell & Mitchell, 2003). Hence, it is
imperative that the fashion industry explore
new avenues in exposing these consumers to
new fashion utilizing new media outlets such as
movies and television. Movies and television
are attractive channels as they appeal to the
technology savvy Generation Y consumer
especially since movies and televisions shows
now can be streamed via internet to any mobile
device. The results also indicate a positive
relationship between media influence and
fashion involvement supporting the hypothesis.
The findings supported previous studies
findings which have indicated that consumers
involved with media were interested in
processing marketing communications,
particularly with fashion media and were also
involved with the fashion product (O’Cass,
2001b; Solomon & Rabolt, 2004).
Respondents who indicated a stronger
affiliation for movies and television programs
indicated a more positive level of fashion
involvement and resultant purchase of relevant
trends as well as interest in new fashion trends
portrayed in movies and television, with the
relationship having a higher beta coefficient for
new fashion in media supporting hypotheses
H2a and H2b. This market segment is paying
attention to many things in their environment.
The findings in this study indicate they are
aware, alert, and interested in a variety of
incoming trends. Further, they indicated they
make a conscious effort to discern trends while
watching movies and television programs. This
is an important finding as fashion retailers can
take utilize movies and television to showcase
new trends, especially since more fashion
retailers are going mainstream. Additionally,
celebrities are also perceived as role models
and as such can influence people’s attitudes
and behavior (Bandura, 1977; Ferris, 2007) and
therefore it can be assumed that fashion worn
by the celebrities in movies and television will
influence interest in new fashion ideas/trends.
Finally, the results also indicated that purchase
of trends related to media influenced their
interest in new fashion in general supporting
hypothesis H3. This finding is important in the
light of earlier studies which have indicated that
past purchase behavior influences today’s
purchase behavior (Seetharaman & Chintagunta
1998) as well as a good predictor of future
behavior (Bult & Wansbeek 1995). It can be
inferred that consumers who are already
purchasing fashion products seen in movies and
television shows are also paying attention to
new trends being shown which could lead to
future purchase of these trends. It is important
that fashion retailers pay attention to this group
of consumers by utilizing technology friendly
tools such as social media tools to provide
offers specific to new fashion trends.
Implications and Recommendations
Overall, this study has succeeded in predicting
the causal relationships (among independent
and dependent variables) thus supporting the
theories of media effects and meaning transfer
(Cohen, 2001; McCracken, 1989). That is,
clothing and accessories such as jewelry and
shoes, worn by characters in movies and
television programs (Hollywood) does have an
impact on Generation Y consumers’ purchase
60 HOLLYWOOD AND FASHION: INFLUENCE ON APPAREL PURCHASE DECISIONS
Copyright ©2013 by International Journal of Sales, Retailing and Marketing Vol. 2 No. 1 2013
behavior. Furthermore, fashion in media is
influencing consumer’s purchase of cosmetic
and grooming products thus emphasizing the
transference of meaning from Hollywood
imagery to their purchase behavior. These
findings further suggest that there is a need to
evaluate the specific financial impact of
marketing techniques and approaches to launch
or sell a product via movies or advertisements.
Movies and television are powerful sources of
information which have the capacity to reach a
great number of consumers. This research
provides a validation to brand managers to
utilize the full potential of these sources to
reach masses for promotion avenues in the
fashion industry. Since fashion related
behaviors are diverse due to the different
meanings of fashion to different people,
involvement with fashion can be considered a
key measurement to analyze consumer
behavior related to fashion. Moreover, this
fashion involvement can result through
numerous factors such as exposure to particular
movies, television, celebrities, and
advertisements. Among all these factors
celebrities could prove to be a major source, as
consumers consider them trustworthy and
reliable sources for fashion information.
Study Limitations and Suggestions for Future
Studies
This exploratory study opens the door to
numerous opportunities for further research in
this area. The findings gleaned through this
study will be beneficial for designers, retailers,
advertisers and marketing professionals, as they
verify the movie/television program channel as
a promotion option in the fashion arena by
demonstrating influence of movies and
television on clothing purchase choices.
Further, Chowdhary (2000) found that fashion
opinion leadership does not decline with age;
therefore it would be interesting to study the
extent to which the influence of media
personalities and movie characters are
influential to older consumers.
These findings may not be generalizable to the
study population because the sample was
restricted to a small area. Future studies should
be expanded to include different ethnic groups
and a diverse age group. The questionnaire was
administered online, which made it difficult to
calculate the response rate. Additionally, this
study asked participants to indicate their
behavior on a questionnaire –actual purchase
behavior was not verified. In future studies it is
suggested that respondents are asked more
specific questions that could be used to verify
media influence on their actual purchase
behavior.
References
Alwill, C. (2010). Avril Lavigne's 'Alice in
Wonderland'-inspired clothing line launches at
Kohl's this week. [WWW document].
Retrievedfromhttp://hollywoodcrush.mtv.com/
2010/03/02/avril-lavignes-alice-in-wonderland-
inspired-clothing-line-launches-at-kohls-this-
week/.
Amos, C., Holmes, G., & Strutton, D. (2008).
Exploring the relationship between celebrity
endorser effects and advertising effectiveness.
International Journal of Advertising, 27(2), 209-
234.
Bagozzi, R.P. & Yi, Y. (1988). On the evaluation
of structural equation models. Journal of the
Academy of Marketing Science, 16(1), 74-94.
Bakewell, C. & Mitchell, V-W. (2003).
Generation Y female consumer decision-making
styles. International Journal of Retail and
Distribution Management, 3(2), 95-106.
Bandura, A. (1977). Social Learning Theory.
Englewood Cliffs, NJ: Prentice Hall
61 HOLLYWOOD AND FASHION: INFLUENCE ON APPAREL PURCHASE DECISIONS
Copyright ©2013 by International Journal of Sales, Retailing and Marketing Vol. 2 No. 1 2013
Behling, D.U. (1992). Three and a half decades
of fashion adoption research: What have we
learned? Clothing and Textiles Research Journal,
10(2), 34–41.
Belleau, B., Summers, T., Xu, Y. & Pinel, R.
(2007). Theory of reasoned action: Purchase
intention of young consumers. Clothing and
Textiles Research Journal, 25(3), 109-123.
Blumer, H. (1933). Movies and conduct. New
York: Macmillan.
Bentler, P.M., & Bonnet, D.G. (1980).
Significance tests and goodness of fit in the
analysis of covariance structures. Psychological
Bulletin, 88(3), 588-606.
Brown, B. & Kaldenberg, D. (1997).
Conceptualizing self-monitoring: links to
materialism and product involvement. Journal
of Consumer Marketing, 14(1), 31-44.
Bush, A., Martin, C., & Bush, V. (2004). Sports
celebrity influence on the behavioral intentions
of generation y. Journal of Advertising Research,
44(1), 108-118.
Byrne, B.M. (1998). Structural Equation
Modeling with Lisrel, Prelis, and Simplis: Basic
Concepts, Applications, and Programming.
Mahwah, NJ: Lawrence Erlbaum Associates.
Carroll, A. (2009). Brand communications in
fashion categories using celebrity endorsement.
The Journal of Brand Management, 17(2), 146-
158.
Casselman-Dickson, M.A. & Damhorst, M.L.
(1993). Female bicyclists and interest in dress:
Validation with multiple measures. Clothing And
Textiles Research Journal, 11(4), 7-17.
Chae, M.H., Black, C. & Heitmeyer, J. (2006).
Pre-purchase and post-purchase satisfaction
and fashion involvement of female tennis wear
consumers. International Journal of Consumer
Studies, 30(1), 25-33.
Chowdhary, U. (1989). Fashion information
seeking by younger and older consumers.
Clothing and Textiles Research Journal, 8(1), 49-
55.
Chowdhary, U. (2000). Correlates of apparel
significance among older men and women.
Journal of Consumer Studies and Home
Economics, 24(3), 150-159.
Clark, C. R. and Horstmann, . I. J. (2005).
Advertising and coordination in markets with
consumption scale effects. Journal of Economics
& Management Strategy, 14(2), 377–401.
Cohen, J. (2001). Defining identification: A
theoretical look at the identification of
audiences with media characters. Mass
Communication and Society, 4(3), 245-264.
Cohen, J. (2006). Audience identification with
media characters, in J. Bryant and P. Vorderer
(Eds.), Psychology of Entertainment, Mahwah,
NJ: Erlbaum, 183-198.
Cronbach, L.J. (1951). Coefficient alpha and the
internal structure of tests. Psychometrika, 16(3),
297-335.
Cronbach, L.J. & Meehl, P. (1955). Construct
validity in psychological tests. Psychological
Bulletin, 52(4), 281-302.
Dickson, M.A. & Pollack, A. (2000). Clothing and
identity among female in-line skaters. Clothing
and Textiles Research Journal, 18(2), 65-72.
Dunn, M.R. (2008). I want to be a Fashion
Designer. New York, NY: The Rosen Publishing
Group.
Durvasula, S. & Lysonski, S. (2008). A double-
edged sword: Understanding vanity across
cultures. Journal of Consumer Marketing, 25(4),
230-244.
Erdogan, B.Z. & Baker, M.J. (2000). Towards a
practitioner-based model of selecting celebrity
endorsers. International Journal of Advertising,
19(1), 25–43.
Ferris, K. O. (2007). The sociology of celebrity.
Sociology Compass, 1(1), 371–384.
Fiske, J. (1987). Television Culture. London,
England: Methuen.
Flam, L. A. (2009). It's getting easier to dress like
your favorite TV characters. [WWW document].
Retrieved from http://www.sj-
r.com/features/x2072231764/Its-getting-easier-
to-dress-like-your-favorite-TV-characters.
Fraser, B.P. & Brown, W.J. (2002). Media,
celebrities, and social influence: Identification
62 HOLLYWOOD AND FASHION: INFLUENCE ON APPAREL PURCHASE DECISIONS
Copyright ©2013 by International Journal of Sales, Retailing and Marketing Vol. 2 No. 1 2013
with Elvis Presley. Mass Communication and
Society, 5(2), 183-206.
Giles, D. (2000). Illusions of immortality: A
psychology of fame and celebrity.
London:MacMillan.
Goldsmith, R. R. (2002). Some personality traits
of frequent clothing buyers. Journal of Fashion
Marketing and Management, 6(3), 303-316.
Goldsmith, R., Moore, M. & Beaudoin, P. (1999).
Fashion innovativeness and self-concept: A
replication. Journal of Product and Brand
Management, 8(1), 7-18.
Goodman, L. A. (1961). Snowball sampling. The
Annals of Mathematical Statistics, 32(1), 148-
170.
Hair, J.F., Anderson, R.E., Tatham, R.L. & Black,
W.C. (1998). Multivariate data analysis. Upper
Saddle River, NJ: Prentice-Hall.
Harris, R.J. (1989). A cognitive psychology of
mass communication. Hillsdale, NJ: Lawrence
Erlbaum Associates.
Hayes, B. (1994). How to measure
empowerment. Quality Progress, 27(2), 41-46.
Irwin, T. (2010). Among Gen Y affluents: Chanel,
BMW top brands. Marketing Daily. Retrieved
from:http://www.mediapost.com/publications/
?fa=Articles.showArticle&art_aid=127529.
Kaiser, S. (1997). The social psychology of
clothing: Symbolic appearances in context. 2nd
rev. ed. New York: Fairchild.
Kozar, J. M. (2010). Women’s responses to
fashion media images: a study of female
consumers aged 30-59. International Journal of
Consumer Studies, 34(3), 272-278.
Krayewski, K. (2009). Generation Y and why they
matter: Characteristics, statistics and fun facts
about Gen Yers.(Suite101.com) [WWW
document]. Retrieved from
http://internationalaffairs.suite101.com/article.
cfm/generation_y.
Kretchmer, S. (2004). Advertainment: The
evolution of product placement as a mass
media marketing strategy. Journal of Promotion
Management, 10(1/2), 37-54.
la Ferla, R. (2010). Film and fashion: Just
Friends. (New York Times) [WWW document].
Retrieved from www.NewYorkTimes.com.
Lee, J-Y., Park, J-O, & Kyu-H. L. (2003). Effects of
consumer knowledge and involvement on
information processing and evaluation of
apparel products. ITAA (International Textile
and Apparel Association) Proceedings, 60.
Retrieved from www.itaaonline.org
Lehu, J. & Bressoud, E. (2007). Effectiveness of
brand placement: New insights about viewers.
Journal of Business Research, 61(10), 1083-
1090.
Leopold, T. & Zerba, A. (2009). ‘Mad Men’ latest
from Hollywood to influence fashion. (CNN)
[WWW document]. Retrieved from
www.cnn.com/entertainment.
Madden, M. (2007). Online Video. Pew Internet
& American Life Project. [WWW document].
Retrieved
fromhttp://www.pewinternet.org/~/media//Fil
es/Reports/2007/PIP_Online_Video_2007.pdf.p
df.
McCracken, G. (1989). Who is the celebrity
endorser? Cultural foundations of the
endorsement process. Journal of Consumer
Research, 16(3), 310-321.
Michaelidou, N., & Dibb, S. (2006). Product
involvement: An application in clothing. Journal
of Consumer Behaviour, 5(5), 442-453.
Millennial Shoppers: Tapping into the Next
Growth Segment. (2012). SymphonyIRI Group.
[WWW document]. Retrieved from:
http://supermarketnews.com/site-
files/supermarketnews.com/files/uploads/2012
/07/T_T%20June%202012%20Millenial%20Shop
pers.pdf.
Morton, L. (2002). Targeting Generation Y.
Public Relations Quarterly, 47(2), 43–45
Mulaik, S. A. & Millsap, R. E. (2000). Doing the
four-step right. Structural Equation Modeling,
7(1), 36-73, 2000.
Noesjirwan J. & Crawford J. (1982). Variations in
perceptions of clothing as a function of dress
63 HOLLYWOOD AND FASHION: INFLUENCE ON APPAREL PURCHASE DECISIONS
Copyright ©2013 by International Journal of Sales, Retailing and Marketing Vol. 2 No. 1 2013
form and viewers’ social community. Perceptual
and Motor Skills, 54(1), 155-163.
O’Cass, A. (2000). An assessment of consumers
product, purchase decision, advertising and
consumption involvement in fashion clothing.
Journal of Psychology, 21(5), 545-576.
O’Cass, A. (2001a). Consumer self-monitoring,
materialism and involvement in fashion
clothing. Australian Marketing Journal, 9(1), 46-
60.
O'Cass, A. (2001b). An exploratory assessment:
fashion clothing involvement's influence on the
development of perceptions of product
knowledge expertise and confidence. Asia
Pacific Advances in Consumer Research, 4, 288–
295.
Oh, H. & Jasper, C. (2006). Processing for
apparel advertisements: Application and
extension of elaboration likelihood model.
Clothing and Textiles Research Journal, 24(1),
15-32.
Olijnyk, Z. (2007). As seen on TV. Canadian
Business, 80(22), 93-96.
Park, E.J., Kim, E.Y. & Forney, J.C. (2006). A
structural model of fashion-oriented impulse
buying behavior. Journal of Fashion Marketing
and Management, 10(4), 433-446.
Polan, B. (2006). Fashion journalism. In Jackson,
T. & Shaw, D. (Eds.), The Fashion Handbook
(154-187). London: Routledge.
Romeo, M. (2009). Television study: “Gossip
Girl” and it’s affects on viewer’s fashion. The
McMaster Journal of Communication, 5(1),
Article 3.
Russell, C.A. & Puto, C.P. (1999). Rethinking
television audience measures: An exploration
into the construct of audience
connectedness. Marketing Letters, 10(4), 393-
407.
Salganik, M. J., & Heckathorn, D. D. (2004).
Sampling and estimation in hidden populations
using respondent-driven sampling. Sociological
Methodology, 34(1), 193-240.
Seo, J., Hathcote, J.M. & Sweaney, A.L. (2001).
Casualwear shopping behavior of college men in
Georgia, USA. Journal of Fashion Marketing and
Management, 5(3), 208-222.
Shevlin, M. & Miles, J. N. V. (1998). Effects of
sample size, model specification and factor
loadings on the GFI in confirmatory factor
analysis. Personality and Individual Differences,
25, 85-90.
Solomon, M. and Rabolt, N. 2004. Consumer
Behavior In Fashion, NJ: Prentice Hall.
Steele, J.R. & Brown, J.D. (1995). Adolescent
room culture: Studying media in the context of
everyday life. Journal of Youth and
Adolescence, 24(5), 551-576.
State of The Media: U.S. Digital Consumer
Report (2011). Nielsen . [WWW document].
Retrieved from:
http://www.nielsen.com/content/dam/corpora
te/us/en/reports-downloads/2012-
Reports/Digital-Consumer-Report-Q4-2012.pdf.
Syrett, M., & Lammiman, J. (2004). Advertising
and millennials. Young Consumers, 5(4), 62-73.
Thompson, M.J. (2000). Gender in a magazine
advertising: Skin sells best. Clothing and Textiles
Research Journal, 18(3), 178-181.
Tungate, M. (2005). Fashion Brands - Branding
style from Armani to Zara. London: Kogan Page
Publishers.
Wilson, J.D. (1998). Self-perceived influences of
family, friends, and media on adolescent
clothing choice. Family and Consumer Sciences
Research, 26(4), 425-43.
Winge, T. (2008). Green is the new black:
Celebrity chic and the "green" commodity
fetish. Fashion Theory: The Journal of Dress,
Body and Culture, 12(4), 511-523.

64 UNDERLYING DIMENSIONS OF PERCEIVED PERFORMANCE IMPROVEMENT AS A RESULT OF ATTENDING MANAGERIAL SALES TRAINING PROGRAMS IN MALAYSIA: AN EMERGING MARKET PERSPECTIVE
Copyright ©2013 by International Journal of Sales, Retailing and Marketing Vol. 2 No. 1 2013
M. Asri Jantan, Ph.D., Associate Professor of Marketing
Department of Business & Economics, School of
Business, Edinboro University of Pennsylvania, U.S.A.
(email: [email protected]).
Ayse N. Balas, Ph.D., Assistant Professor of Marketing
College of Business and Economics, Longwood
University, U.S.A., (email: [email protected]).
UNDERLYING DIMENSIONS OF PERCEIVED PERFORMANCE IMPROVEMENT AS A RESULT OF
ATTENDING MANAGERIAL SALES TRAINING PROGRAMS IN MALAYSIA: AN EMERGING MARKET
PERSPECTIVE
M. Asri Jantan & Ayse N. Balas
Abstract
This study examined the underlying dimensions of perceived sales managers’ performance
improvement as a result of attending managerial sales training in Malaysia. Surveys were distributed
to 310 sales managers and 121 surveys were completed yielding a response rate of 39 percent. An
overview of the findings revealed that sales managers reported to have experienced significant
performance improvement from such important areas as: achieving sales objectives, providing
information, and making effective sales presentation, as a result of attending managerial sales
training offered by their firms’ training center. Moreover, the results indicate that the results do not
change based on the firms’ characteristics - whether they are classified as low-tech or high-tech sales
training; low budget or high budget sales training; consumer goods or industrial goods; or domestic
or multinational.
Keywords: Managerial Sales Training, Consumer and Industrial Goods Industry, Malaysia
INTRODUCTION
Many of the measurement scales in sales
management have been developed in the
setting of industrialized markets. However, as
emerging markets gain prominence in the
global economy there is increased need for
research that explores new perspectives and
practices in sales management based on the
realities of emerging markets (Sheth, 2011).
Large numbers of practitioner studies
demonstrated possible association between
sales training activities and favorable
performance of sales team performance
(Keater, 1994; Stein, 2011; Still, 1981). Equally
important, in the past two decades, many
empirical studies have also shown evidence that
the sales training activities such as: needs
assessment activities (Erffmeyer, Russ, & Hair,
1991); inter-departmental coordination of
objectives setting (Honeycutt, Ford, & Tanner,
1994); selecting proper training methods and
contents (Honeycutt, Ford, Lupton, and
Flaherty, 1999); and adoption of higher level of
evaluation techniques (Attia & Honeycutt,
65 UNDERLYING DIMENSIONS OF PERCEIVED PERFORMANCE IMPROVEMENT AS A RESULT OF ATTENDING MANAGERIAL SALES TRAINING PROGRAMS IN MALAYSIA: AN EMERGING MARKET PERSPECTIVE
Copyright ©2013 by International Journal of Sales, Retailing and Marketing Vol. 2 No. 1 2013
2000), can favorably affect sales
representative’s (Jantan & Honeycutt, 2002)
and sales manager’s (Anderson, Mehta, &
Strong, 1997; Jantan, 2009) selling
performance.
In other words, when sales training programs
are implemented effectively, there is a strong
tendency that sales managers could experience
improvement in their performance level (Attia,
Honeycutt, & Jantan, 2008; Honeycutt et al.,
1999; Jantan, 2009). These findings are not only
limited to the domestic market, such as the US,
but also has gained similar momentum in the
global market environment. Research in select
global markets has consistently shown
piecemeal findings related to perceived
improvement of sales managers’ performance
as a result of attending sales training
particularly in the area of market orientation
(Erffmeyer, Al-khatib, Al-Habib, & Hair, 1993;
Jantan, 2009; Jantan & Honeycutt, 2002);
customer relationship management (Erffmeyer
et al., 1993; Jantan, 2009); improvement in
selling skills (Honeycutt et al., 1999; Jantan,
2009); and improvement in sales managers time
management (Jantan & Honeycutt, 2002).
In spite of the above evident, very few studies
have dealt with exploring the underlying
dimensions of perceived performance
improvement measures as a result of attending
managerial sales training-- especially in an
emerging country such as Malaysia (Attia et al.,
2008; Jantan, 2009). Hence, consistent with
these previous research findings and to further
provide empirical support to the body of
knowledge in this topical area, this study aims
at exploring the following research questions:
RQ1: What are the underlying dimensions of
perceived sales managers’ performance
improvement as a result of attending
managerial sales training program as
experienced by Malaysian sales managers?
RQ2: Do role of technology (low-tech/high-
tech), industry type (consumer goods/industrial
goods), budget (high budget/low budget), and
international involvement
(multinational/domestic companies) influence
the composition of the perceived sales
managers’ performance improvement scale?
QUESTIONNAIRE
The perceived sales manager’s performance
improvement measure for this study is derived
by adopting Behrman and Perreault’s (1982)
sales performance scale. Only twenty of the
thirty-one items from the original scale were
deemed fit to be used for this study. Our scale
utilizes a seven points Likert-type format that
ranges from 1 (need improvement) to 7
(outstanding). The mean score of all items was
used to indicate perceived improvement in
sales manager’s performance as a result of
them attending the most recent managerial
sales training program offered by their firms’
training center.
The questionnaire was translated from English
to Bahasa Melayu, and back-translated to
English to resolve any discrepancies in meaning
(Brislin, 1970). To ensure response consistency
across firms, each sales manager was asked to
evaluate the influence of their most recent
managerial sales training program. In addition,
to control for a similar effect of sales training
program across participating firms, the
researcher ensured that the sales training
program under investigation was offered solely
at their firm’s training center and not offered by
external training consultant or involved with
external funding.
SAMPLE AND SETTING
The sample for our survey consisted of
randomly selected companies listed in Kuala
Lumpur Stock Exchange Location of Share
Register (KLSELOSR) 2008 Directory. This
directory consisted of medium and large sized
companies that were listed on the Kuala
Lumpur Stock Exchange. Use of this directory
ensured the existence of sales personnel and
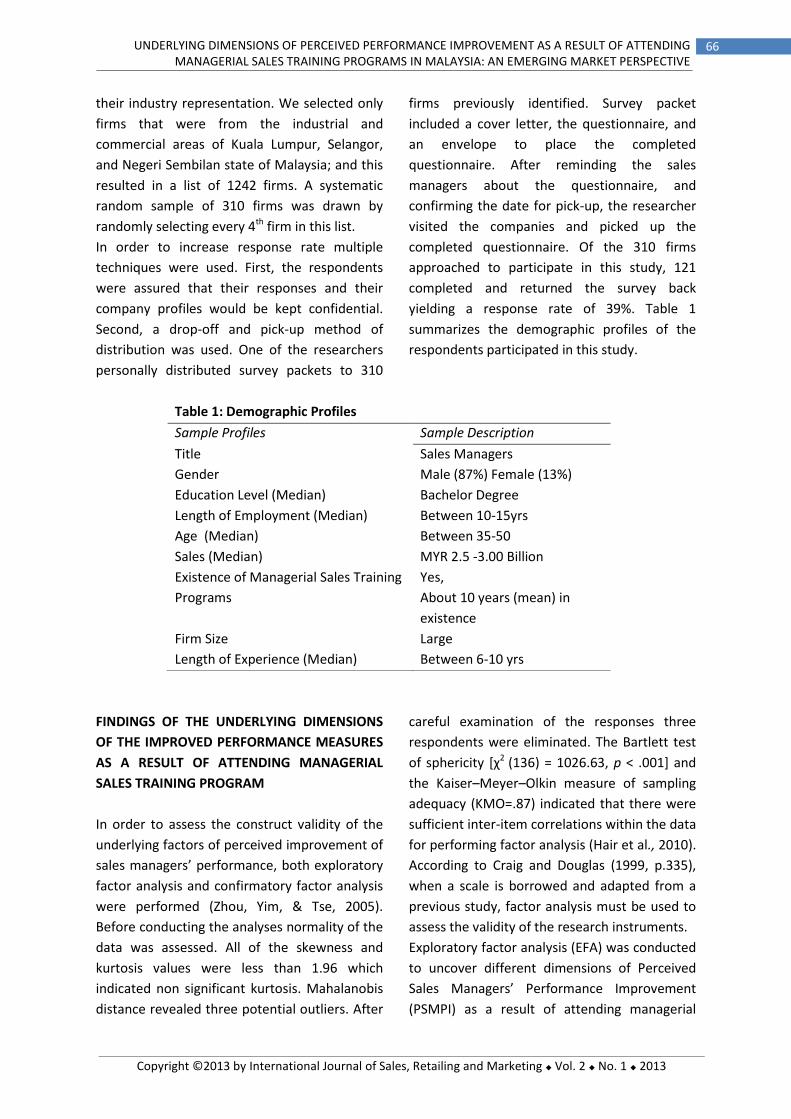
66 UNDERLYING DIMENSIONS OF PERCEIVED PERFORMANCE IMPROVEMENT AS A RESULT OF ATTENDING MANAGERIAL SALES TRAINING PROGRAMS IN MALAYSIA: AN EMERGING MARKET PERSPECTIVE
Copyright ©2013 by International Journal of Sales, Retailing and Marketing Vol. 2 No. 1 2013
their industry representation. We selected only
firms that were from the industrial and
commercial areas of Kuala Lumpur, Selangor,
and Negeri Sembilan state of Malaysia; and this
resulted in a list of 1242 firms. A systematic
random sample of 310 firms was drawn by
randomly selecting every 4th firm in this list.
In order to increase response rate multiple
techniques were used. First, the respondents
were assured that their responses and their
company profiles would be kept confidential.
Second, a drop-off and pick-up method of
distribution was used. One of the researchers
personally distributed survey packets to 310
firms previously identified. Survey packet
included a cover letter, the questionnaire, and
an envelope to place the completed
questionnaire. After reminding the sales
managers about the questionnaire, and
confirming the date for pick-up, the researcher
visited the companies and picked up the
completed questionnaire. Of the 310 firms
approached to participate in this study, 121
completed and returned the survey back
yielding a response rate of 39%. Table 1
summarizes the demographic profiles of the
respondents participated in this study.
FINDINGS OF THE UNDERLYING DIMENSIONS
OF THE IMPROVED PERFORMANCE MEASURES
AS A RESULT OF ATTENDING MANAGERIAL
SALES TRAINING PROGRAM
In order to assess the construct validity of the
underlying factors of perceived improvement of
sales managers’ performance, both exploratory
factor analysis and confirmatory factor analysis
were performed (Zhou, Yim, & Tse, 2005).
Before conducting the analyses normality of the
data was assessed. All of the skewness and
kurtosis values were less than 1.96 which
indicated non significant kurtosis. Mahalanobis
distance revealed three potential outliers. After
careful examination of the responses three
respondents were eliminated. The Bartlett test
of sphericity [χ2 (136) = 1026.63, p < .001] and
the Kaiser–Meyer–Olkin measure of sampling
adequacy (KMO=.87) indicated that there were
sufficient inter-item correlations within the data
for performing factor analysis (Hair et al., 2010).
According to Craig and Douglas (1999, p.335),
when a scale is borrowed and adapted from a
previous study, factor analysis must be used to
assess the validity of the research instruments.
Exploratory factor analysis (EFA) was conducted
to uncover different dimensions of Perceived
Sales Managers’ Performance Improvement
(PSMPI) as a result of attending managerial
Table 1: Demographic Profiles
Sample Profiles Sample Description
Title Sales Managers
Gender Male (87%) Female (13%)
Education Level (Median) Bachelor Degree
Length of Employment (Median) Between 10-15yrs
Age (Median) Between 35-50
Sales (Median) MYR 2.5 -3.00 Billion
Existence of Managerial Sales Training
Programs
Yes,
About 10 years (mean) in
existence
Firm Size Large
Length of Experience (Median) Between 6-10 yrs

67 UNDERLYING DIMENSIONS OF PERCEIVED PERFORMANCE IMPROVEMENT AS A RESULT OF ATTENDING MANAGERIAL SALES TRAINING PROGRAMS IN MALAYSIA: AN EMERGING MARKET PERSPECTIVE
Copyright ©2013 by International Journal of Sales, Retailing and Marketing Vol. 2 No. 1 2013
sales training in the Malaysian context.
Eigenvalue rule of 1 was used, and Varimax
rotation was applied to obtain a factor structure
that has each variable loading on one and only
one factor (Sharma 1996, p. 119). The results of
EFA indicated that two variables had high cross-
loadings more than .40, and thus these
variables were excluded in subsequent
analyses. At the completion of the analysis
thirteen items were retained with four factors
explaining 74.68 percent of variance. The
eigenvalues for the four factors in the final
solution were 6.133, 1.282, 1.176, and 1.118
respectively. These four factors were labeled as
Sales Objectives (SO), Technical Knowledge (TK),
Providing Information (PI), and Sales
Presentation (SP).
The remaining thirteen-items of perceived sales
managers’ performance measure with its four
dimensions is provided in the Appendix. Based
on the results of the EFA, a hierarchical model
with four first-order factors and one second-
order factor was conceptualized. The first-order
factors consist of Sales Objectives (SO),
Technical Knowledge (TK), Providing
Information (PI), while Sales Presentation (SP)
represented the second-order construct of the
Perceived Sales Managers' Performance. Only
the first-order factors had observed variables
loading on them, while the indicator for the
second-order factor was these four first-order
factors.
First-Order Model Analysis
Before testing our hierarchical model, the
measurement properties of the four first-order
factors were established by conducting a
confirmatory factor analysis. The overall fit for
the first-order measurement model, without
any modifications, was good based on the fit
indices, as suggested by Jackson, Gillaspy, and
Purc-Stephenson (2009), χ² (d.f. 59) = 120.88 p <
.001, comparative fit index (CFI) = .93, root
mean square error of approximation (RMSEA) =
.09, and standardized root mean square
residual (SRMR) = .06.
Convergent validity is supported as all the paths
between the observed variables and their
assigned latent variables were significant, and
the standardized loadings were equal to or
greater than .40, as shown in Table 2.
Furthermore, convergent validity was also
assessed by calculating construct reliabilities
(Hair, Black, Babin, & Anderson, 2010). The
calculated construct reliabilities for the four
factors were .90, .80, .85, and .81 respectively.
The construct reliabilities for all constructs were
greater than .70, which indicated good
reliability, as they are larger than the suggested
threshold by Bagozzi and Yi (1988). Another
indicator of convergent validity is average
variance extracted (AVE). The calculated AVE
values ranged between .59 and .69 and thus
were larger than the suggested rule of thumb
value of .50 (Fornell & Larcker, 1981). Table 2
provides the factor loadings, composite
reliability and average variance extracted and
Table 3 provides correlations among the first-
order factors.
Discriminant validity was assessed for each
construct by calculating average variance
extracted values and comparing it to the shared
variance for all possible pairs of constructs
(Bagozzi & Yi, 1988). The results indicate
support for discriminant validity as the square
of the correlations among constructs ranged
between .27 and .52, which are lower than the
calculated AVE values. Moreover, discriminant
validity for two estimated constructs was
evaluated by constraining the estimated
correlation parameter between pairs of
constructs to 1, and comparing the χ² of this
constrained model to the χ² of the
unconstrained model for each pair (Anderson &
Gerbing, 1988; Bagozzi, Yi, & Phillips, 1991).
Changes on χ² were large and significant in each
case, indicating the existence of discriminant
validity.
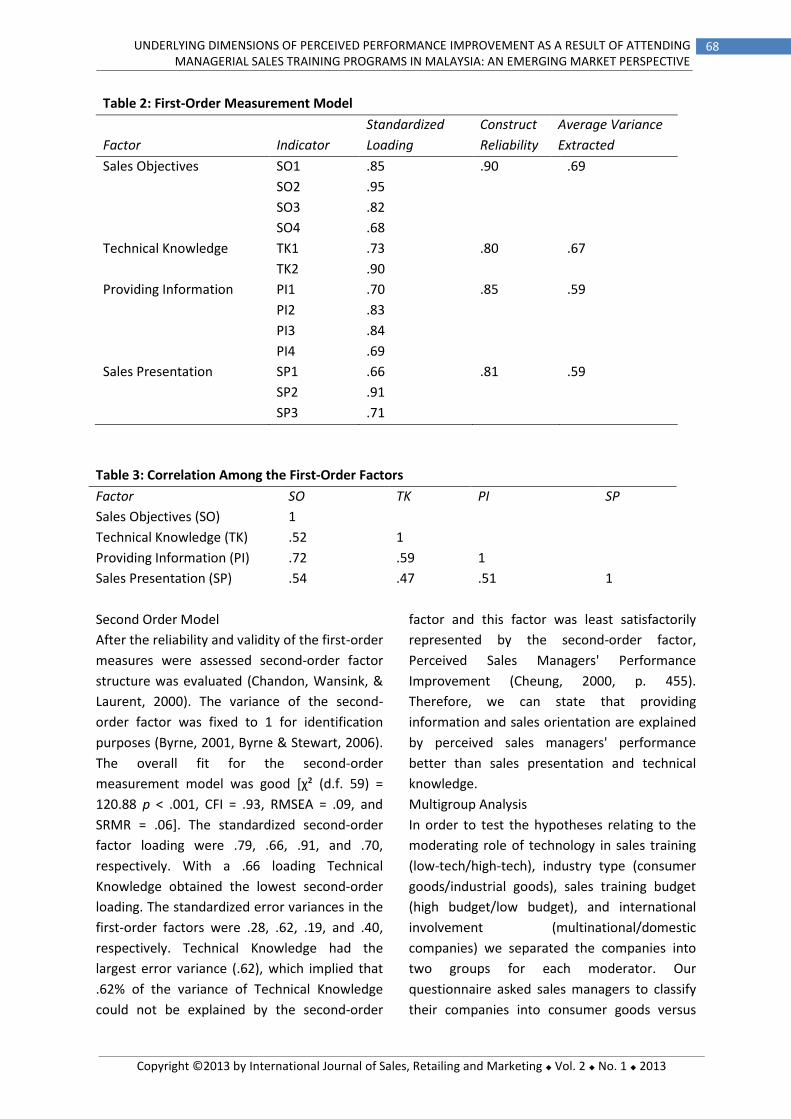
68 UNDERLYING DIMENSIONS OF PERCEIVED PERFORMANCE IMPROVEMENT AS A RESULT OF ATTENDING MANAGERIAL SALES TRAINING PROGRAMS IN MALAYSIA: AN EMERGING MARKET PERSPECTIVE
Copyright ©2013 by International Journal of Sales, Retailing and Marketing Vol. 2 No. 1 2013
Table 2: First-Order Measurement Model
Factor
Indicator
Standardized
Loading
Construct
Reliability
Average Variance
Extracted
Sales Objectives SO1 .85 .90 .69
SO2 .95
SO3 .82
SO4 .68
Technical Knowledge TK1 .73 .80 .67
TK2 .90
Providing Information PI1 .70 .85 .59
PI2 .83
PI3 .84
PI4 .69
Sales Presentation SP1 .66 .81 .59
SP2 .91
SP3 .71
Table 3: Correlation Among the First-Order Factors
Factor SO TK PI SP
Sales Objectives (SO) 1
Technical Knowledge (TK) .52 1
Providing Information (PI) .72 .59 1
Sales Presentation (SP) .54 .47 .51 1
Second Order Model
After the reliability and validity of the first-order
measures were assessed second-order factor
structure was evaluated (Chandon, Wansink, &
Laurent, 2000). The variance of the second-
order factor was fixed to 1 for identification
purposes (Byrne, 2001, Byrne & Stewart, 2006).
The overall fit for the second-order
measurement model was good [χ² (d.f. 59) =
120.88 p < .001, CFI = .93, RMSEA = .09, and
SRMR = .06]. The standardized second-order
factor loading were .79, .66, .91, and .70,
respectively. With a .66 loading Technical
Knowledge obtained the lowest second-order
loading. The standardized error variances in the
first-order factors were .28, .62, .19, and .40,
respectively. Technical Knowledge had the
largest error variance (.62), which implied that
.62% of the variance of Technical Knowledge
could not be explained by the second-order
factor and this factor was least satisfactorily
represented by the second-order factor,
Perceived Sales Managers' Performance
Improvement (Cheung, 2000, p. 455).
Therefore, we can state that providing
information and sales orientation are explained
by perceived sales managers' performance
better than sales presentation and technical
knowledge.
Multigroup Analysis
In order to test the hypotheses relating to the
moderating role of technology in sales training
(low-tech/high-tech), industry type (consumer
goods/industrial goods), sales training budget
(high budget/low budget), and international
involvement (multinational/domestic
companies) we separated the companies into
two groups for each moderator. Our
questionnaire asked sales managers to classify
their companies into consumer goods versus
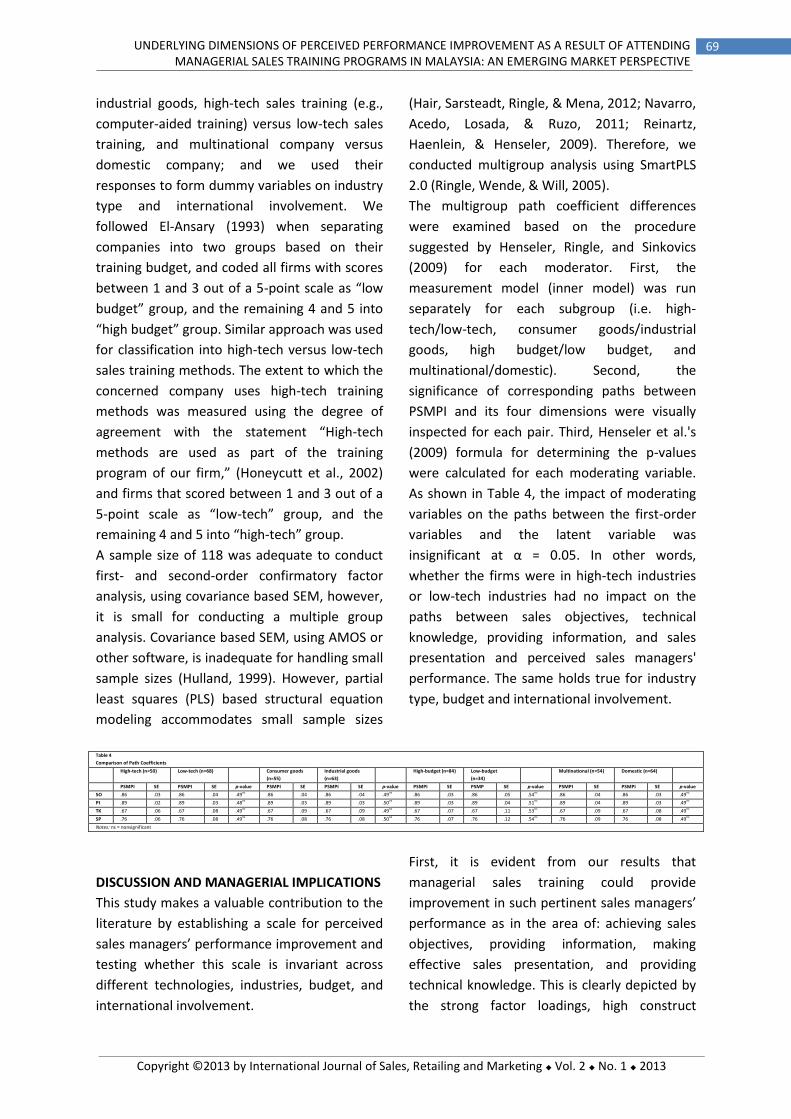
69 UNDERLYING DIMENSIONS OF PERCEIVED PERFORMANCE IMPROVEMENT AS A RESULT OF ATTENDING MANAGERIAL SALES TRAINING PROGRAMS IN MALAYSIA: AN EMERGING MARKET PERSPECTIVE
Copyright ©2013 by International Journal of Sales, Retailing and Marketing Vol. 2 No. 1 2013
industrial goods, high-tech sales training (e.g.,
computer-aided training) versus low-tech sales
training, and multinational company versus
domestic company; and we used their
responses to form dummy variables on industry
type and international involvement. We
followed El-Ansary (1993) when separating
companies into two groups based on their
training budget, and coded all firms with scores
between 1 and 3 out of a 5-point scale as “low
budget” group, and the remaining 4 and 5 into
“high budget” group. Similar approach was used
for classification into high-tech versus low-tech
sales training methods. The extent to which the
concerned company uses high-tech training
methods was measured using the degree of
agreement with the statement “High-tech
methods are used as part of the training
program of our firm,” (Honeycutt et al., 2002)
and firms that scored between 1 and 3 out of a
5-point scale as “low-tech” group, and the
remaining 4 and 5 into “high-tech” group.
A sample size of 118 was adequate to conduct
first- and second-order confirmatory factor
analysis, using covariance based SEM, however,
it is small for conducting a multiple group
analysis. Covariance based SEM, using AMOS or
other software, is inadequate for handling small
sample sizes (Hulland, 1999). However, partial
least squares (PLS) based structural equation
modeling accommodates small sample sizes
(Hair, Sarsteadt, Ringle, & Mena, 2012; Navarro,
Acedo, Losada, & Ruzo, 2011; Reinartz,
Haenlein, & Henseler, 2009). Therefore, we
conducted multigroup analysis using SmartPLS
2.0 (Ringle, Wende, & Will, 2005).
The multigroup path coefficient differences
were examined based on the procedure
suggested by Henseler, Ringle, and Sinkovics
(2009) for each moderator. First, the
measurement model (inner model) was run
separately for each subgroup (i.e. high-
tech/low-tech, consumer goods/industrial
goods, high budget/low budget, and
multinational/domestic). Second, the
significance of corresponding paths between
PSMPI and its four dimensions were visually
inspected for each pair. Third, Henseler et al.'s
(2009) formula for determining the p-values
were calculated for each moderating variable.
As shown in Table 4, the impact of moderating
variables on the paths between the first-order
variables and the latent variable was
insignificant at α = 0.05. In other words,
whether the firms were in high-tech industries
or low-tech industries had no impact on the
paths between sales objectives, technical
knowledge, providing information, and sales
presentation and perceived sales managers'
performance. The same holds true for industry
type, budget and international involvement.
Table 4
Comparison of Path Coefficients
High-tech (n=50) Low-tech (n=68) Consumer goods
(n=55)
Industrial goods
(n=63)
High-budget (n=84) Low-budget
(n=34)
Multinational (n=54) Domestic (n=64)
PSMPI SE PSMPI SE p-value PSMPI SE PSMPI SE p-value PSMPI SE PSMP SE p-value PSMPI SE PSMPI SE p-value
SO .86 .03 .86 .04 .49ns
.86 .04 .86 .04 .49ns
.86 .03 .86 .05 .54ns
.86 .04 .86 .03 .49ns.
PI .89 .02 .89 .03 .48ns
.89 .03 .89 .03 .50ns
.89 .03 .89 .04 .51ns.
.89 .04 .89 .03 .49ns
TK .67 .06 .67 .08 .49ns
.67 .09 .67 .09 .49ns
.67 .07 .67 .11 .53ns
.67 .09 .67 .08 .49ns
SP .76 .06 .76 .08 .49ns
.76 .08 .76 .08 .50ns
.76 .07 .76 .12 .54ns
.76 .09 .76 .08 .49ns
Notes: ns = nonsignificant
DISCUSSION AND MANAGERIAL IMPLICATIONS
This study makes a valuable contribution to the
literature by establishing a scale for perceived
sales managers’ performance improvement and
testing whether this scale is invariant across
different technologies, industries, budget, and
international involvement.
First, it is evident from our results that
managerial sales training could provide
improvement in such pertinent sales managers’
performance as in the area of: achieving sales
objectives, providing information, making
effective sales presentation, and providing
technical knowledge. This is clearly depicted by
the strong factor loadings, high construct

70 UNDERLYING DIMENSIONS OF PERCEIVED PERFORMANCE IMPROVEMENT AS A RESULT OF ATTENDING MANAGERIAL SALES TRAINING PROGRAMS IN MALAYSIA: AN EMERGING MARKET PERSPECTIVE
Copyright ©2013 by International Journal of Sales, Retailing and Marketing Vol. 2 No. 1 2013
reliability, and the discriminant validity of the
underlying factor structures as reported in both
Table 2 and 3 of this study. This finding provides
strong empirical support to the anecdotal
claims made by many prolific authors in the
area of professional selling concerning how
sales training could provide significant
improvement in sales people’ performance
(Manning et al., 2010; Ingram et al., 2012).
Thus, firms in Malaysia must continue to invest
in sales training dollars because such strategy
clearly supports sales managers’ performance
improvement in those important areas.
Second, while the four performance measures
could all provide performance improvement for
sales managers’ performance in both the
Consumer and Industrial goods industries in
Malaysia; the data also proved that only three
of the four important performance areas -
achieving sales objectives, providing
information to consumers, and making sales
presentation - have strong predictive ability
towards the improvement of sales managers’
performance as a result of attending managerial
sales training program. In other words, the
former three performance measures have
stronger predictive ability in the improvement
of sales managers’ performance than the
remaining performance measure, providing
technical knowledge as a result of attending
managerial sales training program (Refer to the
second order analysis). This second finding
offers one practical recommendation for firms
who took part in the study to offer more
effective managerial sales training contents that
will take into account how to improve their
sales managers’ technical knowledge skills. By
the same token, firms who took part in the
study should also feel relief knowing that their
sales training programs did provide some
returns on investment by providing
improvement in their sales managers’
performance in the area of achieving sales
objectives, providing information, and making
effective sales presentation to key customers.
Finally, the results indicate that the PSMPI scale
is stable across companies with different sales
training technologies (low-tech/high-tech),
industry (consumer goods/industrial goods),
budget (low budget/high budget), and
international involvement
(domestic/multinational). The results that
support the invariant nature of our scale have a
number of implications. First, they support the
notion that the PSMPI is an instrument that can
be used under different settings. In other
words, the PSMPI scale applies to both low-tech
and high-tech companies, companies that
produce consumer goods and industrial goods,
companies with low budget and high budget,
and companies that have strong international
involvement and domestic companies. Second,
the results indicate that the results obtained
using the PSMPI scale in one population in
Malaysia are likely to be generalized to other
populations. This facilitates the generalization
of studies conducted using different samples. In
summary, we can state that the PSMPI is a
valuable instrument.
FUTURE RESEARCH AREA
This study offers two future research
suggestions which subsequent research could
further improve upon. First, since the sample
was selected from both the Consumer and
Industrial goods industries in Malaysia, future
studies could focus on one of the two industries
to provide an in depth analysis from a single
industry perspective in that country. Second,
more variables such as corporate culture, the
degree of firms’ sales training technology
sophistication, the degree of firms’ sales
training orientation/acceptance, and the degree
of top management support of sales training
culture could be developed as mediating and
moderating variables to create a more robust
analyses for future empirical studies in this
topical area.

71 UNDERLYING DIMENSIONS OF PERCEIVED PERFORMANCE IMPROVEMENT AS A RESULT OF ATTENDING MANAGERIAL SALES TRAINING PROGRAMS IN MALAYSIA: AN EMERGING MARKET PERSPECTIVE
Copyright ©2013 by International Journal of Sales, Retailing and Marketing Vol. 2 No. 1 2013
CONCLUSION
In conclusion, in the past three
decades, sales training program has remained
as a strong tool utilized by salespeople and sales
managers to educate and equip them on how
they could improve their daily selling
performance for businesses around the globe
including an emerging country such as Malaysia.
This is especially true where Malaysian sales
managers from both the Consumer and
Industrial goods industries experienced
performance improvement in the three of the
four critical performance areas as mentioned in
the discussion section earlier. The notion that
sales training remains an important strategic
tool in the corporate world today is better
summed by Lawler (2008) when the author
cautioned that employees will leave a company
because of the frustrations they experienced as
a result of not getting the proper support,
coaching, and feedback, which in turn will result
in failure to achieve their organizations’ sales
objectives.
APPENDIX
Sales Objectives (SO)
SO1. Helped me to produce a high market share for our company in my territory.
SO2. Helped me to generate high levels of dollar sales.
SO3. Helped me to generate sales of new company products.
SO4. Helped me produce sales with long-term profitability.
Technical Knowledge (TK)
TK1. Helped me to know the design and specifications of company products.
TK2. Helped me to know the applications and functions of company products.
Providing Information (PI)
PI1. Helped me to carry out company policies, procedures, and programs for providing information.
PI2. Provided me with accurate and complete paperwork related to order, expenses, and other
routine reports.
PI3. Provided me input on how company operations and procedures can be improved
PI4. Increased my productivity by submitting required reports on time.
Sales Presentation (SP)
SP1. Improved my performance by practicing good listening skills (i.e., listening attentively to
customers to identify and understand their real concerns).
SP2. Improved my performance by demonstrating the ability to understand customers' unique
problems and concerns.
SP3. Improved my performance by mastering the skills of establishing contact (networking) to
develop new customers.
REFERENCES
Anderson, R., Mehta, R. & Strong, J. (1997). An
empirical investigation of sales management
training programs for sales managers. Journal of
Personal Selling & Sales Management, 17(3),
Summer, 53-66.
Anderson, J.C., & Gerbing, D.W. (1988).
Structural equation modeling in practice: A
review and recommended two step approach,
Psychological Bulletin, 103(3), 411-423.
72 UNDERLYING DIMENSIONS OF PERCEIVED PERFORMANCE IMPROVEMENT AS A RESULT OF ATTENDING MANAGERIAL SALES TRAINING PROGRAMS IN MALAYSIA: AN EMERGING MARKET PERSPECTIVE
Copyright ©2013 by International Journal of Sales, Retailing and Marketing Vol. 2 No. 1 2013
Attia, M.A., & Honeycutt Jr., E.D. (2000).
Measuring sales training effectiveness: A
conceptual framework. The 2000 National
Conference in Sales Management Proceedings,
51–62.
Attia, A.M., Honeycutt Jr., E.D., & Jantan, M.A.
(2008). Global sales training: In search of
antecedent, mediating, and consequence
variables. Industrial Marketing Management,
37(2), 181–190.
Bagozzi, R.P., & Yi, Y. (1988). The evaluation of
structural equation models. Journal of Academy
of Marketing Science, 16(1), 74-97.
Bagozzi, R.P., Yi, Y., & Phillips, L.W. (1991).
Assessing construct validity in organizational
research. Administrative Science Quarterly,
46(3), 421-458.
Behrman, N.D., & Perreault, W.D. (1982).
Measuring performance of industrial
salespersons. Journal of Business Research, 10,
355-370.
Brislin, R.W. (1970). Back-translation for cross-
cultural research. Journal of Cross-Cultural
Psychology, 1(September), 185-216.
Byrne, B.M. (2001). Structural equation
modeling with AMOS - Basic Concepts,
Applications and Programming, Mahwah, NJ:
Lawrence Erlbaum Associates Inc.
Byrne, B.M., & Stewart, S.M. (2006). The MACS
approach to testing for multigroup invariance of
a second-order structure: A walk through the
process. Structural Equation Modeling, 13(2),
287-321.
Chandon, P., Wansink, B., & Laurent, G. (2000).
A benefit congruency framework of sales
promotion effectiveness. Journal of Marketing,
64 (October), 65-81.
Cheung, D. (2000). Evidence of a single second-
order factor in student ratings of teaching
effectiveness. Structural Equation Modeling,
7(3), 442-460.
Chu, K. H. (2008). A factorial validation of work
value structure: Second-order confirmatory
factor analysis and its implications. Tourism
Management, 29(2), 320-330.
Craig, C.S. & Douglas, S.P. (1999). International
Marketing Research. 2nd Edition, New York:
John Wiley and Sons Inc.
El-Ansary, A.I. (1993). Selling and sales
management in action: Sales force effectiveness
research reveals new insights and reward-
penalty patterns in sales force training. Journal
of Personal Selling & Sales Management, 13(2),
83–90.
Erffmeyer, R.C., Russ, R., & Hair Jr., J.F. (1991).
Needs assessment and evaluation in sales
training programs. Journal of Personal Selling &
Sales Management, 11(1), 17-30.
Erffmeyer, R.C., Al-khatib, J.A., Al-Habib, M.I., &
Hair Jr., J.F. (1993). Sales training practices: A
cross-national comparison. International
Marketing Review, 10(1), 45-59.
Fornell, C. & Larcker, D.F. (1981). Evaluating
structural equation models with unobservable
variables and measurement error. Journal of
Marketing Research, 18(1), 39-50
Hair Jr., J.F., Black, W.C., Babin, B.J., &
Anderson, R.E. (2010). Multivariate Data
Analysis. 7th Edition, Upper Saddle River, NJ:
Prentice Hall.
Hair, J., Sarstedt, M., Ringle, C., & Mena, J.
(2012). An assessment of the use of partial least
squares structural equation modeling in
marketing research. Journal of the Academy of
Marketing Science, 40(3), 414–433.
Henseler, J., Ringle, C.M. & Sinkovics, R.R.
(2009). The use of partial least squares path
modeling in international marketing. Advances
in International Marketing, 20, 277-319.
Honeycutt Jr., E.D., Ford, J.B., & Tanner Jr., J.F.
(1994). Who trains salespeople? The role of
sales trainers and sales managers. Industrial
Marketing Management, 23(1), 65–70.
Honeycutt Jr., E.D., Ford, J.B., Lupton, R. &
Flaherty, T. (1999). Selecting and training the
international sales force: A comparison of China
and Slovakia. Industrial Marketing
Management, 28, 627-635.
Hulland, J. (1999). Use of partial least squares
(PLS) in strategic management research: A
73 UNDERLYING DIMENSIONS OF PERCEIVED PERFORMANCE IMPROVEMENT AS A RESULT OF ATTENDING MANAGERIAL SALES TRAINING PROGRAMS IN MALAYSIA: AN EMERGING MARKET PERSPECTIVE
Copyright ©2013 by International Journal of Sales, Retailing and Marketing Vol. 2 No. 1 2013
review of four different studies. Strategic
Management Journal, 20(2), 195-204.
Ingram, T., LaForge, R., Avila, R., Schwepker, C.
& Williams, M. (2012). Sell. 2012 Edition,
Cengage Learning, Mason OH 45040.
Jackson, D.L., Gillaspy, J.A., & Purc-Stephenson,
R. (2009). Reporting practices in confirmatory
factor analysis: An overview and some
recommendations. Psychological Methods,
14(1), 6-23.
Jantan, M.A., & Honeycutt Jr., E.D. (2002). Sales
training practices in Malaysia. Multinational
Business Review, 10(1), 72-78.
Jantan, M.A. (2009). An analysis of Malaysian
sales managers’ perceived performance
improvement as a result of attending sales
training programs. Global Conference on
Business and Finance Proceedings, 4(1), 208-
218.
Keater, M. (1994). Training the world to sell.
Training, 56(June) 51-54.
Kuala Lumpur Stock Exchange: Location of Share
Registers Directory (2008). KLSE Publishing
Company, Bukit Kewangan, Kuala Lumpur.
Lawler, I.E. (2008). Why are we losing all our
good people. Harvard Business Review, 86(6),
41-51.
Manning, G., Reece, B., & Ahearne, M. (2010).
Selling Today: Creating Customer Value.
Eleventh Edition, Prentice Hall, NJ, 07458.
Navarro, A., Acedo, F.J., Losada, F., & Ruzo, E.
(2011). Integrated model of export activity:
Analysis of heterogeneity in managers'
orientations and perceptions on strategic
marketing management in foreign markets.
Journal of Marketing Theory and Practice, 19(2),
187-204.
Reinartz, W., Haenlein, M., & Henseler, J.
(2009). An empirical comparison of the efficacy
of covariance-based and variance-based SEM.
International Journal of Research in Marketing,
26(4), 332-344.
Ringle, C.M., Wende, S. & Will, A. (2005).
SmartPLS 2.0 (beta) www.smartpls.de.
Sharma, S. (1996). Applied Multivariate
Techniques. John Wiley & Sons, Inc. USA.
Sheth, J.N. (2011). Impact of emerging markets
on marketing: Rethinking existing perspectives
and practices. Journal of Marketing, 75(4), 166–
182.
Stein, D. (2011). Developing a winning sales
team. Training and Development Journal, 65(6),
62-65.
Still, R.R. (1981). Sales management: Some
cross-cultural aspects. Journal of Personal
Selling & Sales Management, 1(2), 6-9.
Zhou, K.Z., Yim, C.K. (B), & Tse, D.K. (2005). The
effects of strategic orientation on technology-
and market-based breakthrough innovations,
Journal of Marketing, 69(April), 42-60

74 WHAT CONSTITUTES AN ISLAMIC RETAILER? ISLAMIC STORE ATTRIBUTES FROM THE PERSPECTIVES OF ISLAMIC MARKETING PRINCIPLES.
Copyright ©2013 by International Journal of Sales, Retailing and Marketing Vol. 2 No. 1 2013
Abdul Rahim Abu Bakar, Professor, Marketing and
Management Department, College of Business
Administration, Prince Sultan University, P.O.Box
66833, Riyadh 11686. Saudi Arabia,
(email: [email protected]).
Siti Rahayu Hussin, Universiti Putra Malaysia, Malaysia
WHAT CONSTITUTES AN ISLAMIC RETAILER? ISLAMIC STORE ATTRIBUTES FROM THE PERSPECTIVES OF
ISLAMIC MARKETING PRINCIPLES.
Abdul Rahim Abu Bakar & Siti Rahayu Hussin
Abstract
An upcoming trend that has caught the attention of marketers and consumers alike is the recent
debut of retailers that projected itself as an Islamic retailer. This paper provides a critical overview of
the existing scholarship on the influence of Islam specifically towards consumer retail store selection.
This paper outlined the general store attributes of an Islamic retailer based on the synthesis of past
literatures. As the store image or “store personality” is determined as one of the factors of store
choice, which is largely based on the store attributes, it is pertinent for retailers to project the
“appropriate” Islamic store image in the minds of consumers.
Keywords: Islamic Marketing; Islamic Retailer; Store attributes
1. Introduction
The retail industry sector is considered as one
of the important economic contributors to a
country’s economy. With the encouraging
growth in retail industry, it seems that the
industry will continue to be a prominent
economic activity in generating revenue for a
country. In Malaysia the retail sector comprises
of a wide ranging category from department
stores, supermarkets and mini markets,
specialty shops, convenience stores, provision
stores, pharmacies, medical halls, direct sale,
wet market stalls to pavement shops and petrol
kiosk. However, an upcoming trend that has
caught the attention of marketers and
consumers alike is the recent debut of small
scale retailers that operate based on “Islamic”
concept or rather projected itself as an Islamic
retailer. While the Islamic products and services
of banks and other financial related products
are “well defined” and established (e.g. Dusuki
and Abdullah, 2007; Abbas, Hamid, Joher, and
Ismail, 2003; Ahmad, and Haron, 2002), the
concept of these newly established Islamic
retailer is still unclear. The rationale for the
growth of these new breed of retailers which
position themselves on Islamic image is
justifiable. With the global population of 1.8
billion people who say their faith shapes their
consumption choices, it’s a market estimated at
US$2.1 trillion. This power is articulated
especially through the emergence of a Muslim
middle class, which is united in its interest in
consumption and ability to afford branded
products (Nasr, 2009).
In countries like Turkey, Saudi Arabia, United
Arab Emirates, Malaysia and Indonesia to name
a few, accumulation of wealth had resulted in
the creation of a new middle class
“conservative in values but avant-garde in
consumption practices” (Sandikci and Ger,
2002, p. 467; Wong, 2007; Nasr, 2009). In
75 WHAT CONSTITUTES AN ISLAMIC RETAILER? ISLAMIC STORE ATTRIBUTES FROM THE PERSPECTIVES OF ISLAMIC MARKETING PRINCIPLES.
Copyright ©2013 by International Journal of Sales, Retailing and Marketing Vol. 2 No. 1 2013
addition, the current political mood indicates
that there appears to be a definitive push
towards greater Islamisation of countries where
Muslims are in the majority in the form of a
return to the application of the Islamic law
(Sharia) to all facets of life and thought. With
respect to Malaysia, there is a growing
confidence among many Malaysian Muslims
that the syari’ah or Islamic law should guide all
economic and social transactions in Malaysia
(Sloane-White, 2011). Since the late 2000s,
consultancy reports highlighting the importance
of addressing the Muslim market began to
appear (Kearney, 2007; JWT, 2009; Ogilvy and
Mather, 2010). Common in these reports is the
emphasis on the size of the Muslim market and
its purchasing power. In addition, the profiles of
this particular target market are predominantly
young, tech-savvy Muslims who take pride in
their faith but embrace modernity. Hence,
along with the Muslim middle class, there is
increasing visibility of Muslim entrepreneurs, a
new breed of businesspeople, located in both
Muslim-majority and minority societies, who
are keenly pursuing Islamic principles as well as
capitalist aspirations (Adas, 2006; Osella and
Osella, 2009).
According to Malik Musharaf, vice president
of Malaysia’s Halal Industry Development
corporation, the global halal ecosystem is
worth “more than US2.3 trillion annually and is
fast gaining attention worldwide”. He says the
halal eco-system cuts across many industries,
ranging from halal food and non-food products
to halal-related services, including Islamic
banking and finance, halal logistics, tourism and
healthcare. Hence, with the significant
economic contribution that the Islamic eco-
system brings, retailers need to understand the
Islamic principles and guidelines that dictate the
consumer purchases (Al Serhan, 2010). The
word ‘Islamic’ itself won’t be enough to engage
with consumers or attracts store patronage.
While the Islamic products and services of
banks and other financial related products are
“well defined” and established, the concept of
these newly established Islamic retailer is still
unclear. At the same time, customers differ in
terms of their store choice and evaluation of
store attributes. This can be attributed to many
customer background factors such as culture,
personality, and lifestyle. What follows next is a
critical overview of the existing scholarship on
the influence of religion in general and Islam
specifically towards consumer retail store
selection. Therefore, the objective of this paper
is to outline the general store attributes of an
Islamic retailer based on the synthesis of these
literatures. Finally, it highlights the
development and progress within the concept
of the Islamic retail outlet.
2. Retail and Religion
The retailing sector has been the focus of much
academic research and considerable attention
has been directed to the way consumers think
and feel about stores that makes up their
attitudes and perceptions towards the stores.
The main issue for retailers is consumer choice;
choice of product as well as choice from where
to buy that particular product. In the process of
evaluating retail store, consumers consider a
variety of factors, often referred to in retailing
literature as store-choice evaluative criteria
(Rosebloom, 1983). According to Moye (2000),
consumers engage in a comparison process in
their minds to determine whether their
evaluation of the relative importance of store
attributes aligns with their perceptions of these
attributes. If the two factors match, then the
consumer chooses the store. Consumer
compares the importance of store attributes
with the store image (i.e. overall perception) to
determine acceptable and unacceptable stores.
If consumers’ perceptions of the store
attributes are positive, then they may decide to
purchase from the store. On the other hand, if
consumers’ perceptions of the store attributes

76 WHAT CONSTITUTES AN ISLAMIC RETAILER? ISLAMIC STORE ATTRIBUTES FROM THE PERSPECTIVES OF ISLAMIC MARKETING PRINCIPLES.
Copyright ©2013 by International Journal of Sales, Retailing and Marketing Vol. 2 No. 1 2013
are negative, then they are unlikely to shop in
the store (Engel et al. 1995). As the store image
or “store personality” is determined as one of
the factors of store choice, which is largely
based on the store attributes, it is pertinent for
retailers to project the “appropriate” store
image in the minds of consumers. Hence, store
attributes help retailers to predict which
shopping outlets people will prefer.
Differences in consumer choice and evaluation
of store attributes can be attributed to many
reasons such as, different culture, personality,
and lifestyle. Previous studies in the area of
culture and formation of consumption (e.g.
Shaw and Clarke, 1998) have generally
identified cultural values as important factors in
determining the consumption behavior of
individuals. The effect of culture on people’s life
is so great that it will even affect the motives
and choices when consuming or shopping
(Chang, 2005). Although culture is the most
basic deciding factor of human desire and
behavior, it is actually religious groups that are
one of the major determinants in subculture
influencing consumer behavior (Shah Alam,
Mohd and Hisham, 2011). Gayatri, Chan, Mort
and Hume (2011) for instance found that a
Muslim who holds Islamic cultural values will
influence his or her evaluation criteria for
restaurant, hotel and airlines service quality and
in turn, the use of these services.
Religion is an important cultural factor to study
because it is one of the most universal and
influential social institutions that have
significant influence on people’s attitudes,
values and behaviors at both the individual and
societal levels (Mokhlis, 2009). Religion is a set
of beliefs that are taught since childhood, and
people gradually commit to the religion as they
have greater understandings towards its
teachings. Hence, religiosity may serve as a
potentially powerful predictor and determinant
of consumer behavior.
Islam is a religion that guides Muslims in every
aspect of life, not just in specific acts of
worship. For instance, in the Qur’anic verse, Al
Isra’:26-27, Allah commands Muslims not to
consume or spend extravagantly, but to spend
in the way of Allah. Islam also provides
guidance on how and what to trade, how to
interact with others and what can be
consumed. For example, eating and drinking are
strictly followed according to the Islamic rules in
the everyday life of the Muslim society. In
Islam, religion is not a culture but it is basically a
way of life that could form a set of behavior
that is termed as “Islamic”. According to
Alserhan (2011), practicing Muslims are those
who strive to comply with the teachings of
Islam, such as carrying out duties depicted in
the pillars of Islam (i.e. performing the daily five
prayers, fasting in the month of Ramadhan
etc.).
The rules and laws are derived from three
important sources, namely the Holy Qur’an (the
holy book of the religion of Islam), Sunnah (the
practice and tradition of the Prophet
Muhammad s.a.w.) and ijtihad (the reasoning of
qualified scholars). Further elaboration and
interpretation of the rules dictated by the Holy
Qur’an and Sunnah are provided by qualified
scholars in Islamic jurisprudence via ijtihad or
an interpretative process which is carried out
within the framework of Qur’an and Sunnah.
In discussing the concept of Islamic retail
however, one needs to clearly define between
the main pillars (usul) and branches (furuq).
Issues about what is halal which involves food
and finance are mainly usul which is relatively
clear. Mixing of the genders for instance is
haraam and country like Saudi Arabia has made
it clear that all business premises must
segregate its customers based on gender (male
and family) although some Islamic scholars have
discussed and argued that there are exceptions
to that rule. Nevertheless, some of the issues

77 WHAT CONSTITUTES AN ISLAMIC RETAILER? ISLAMIC STORE ATTRIBUTES FROM THE PERSPECTIVES OF ISLAMIC MARKETING PRINCIPLES.
Copyright ©2013 by International Journal of Sales, Retailing and Marketing Vol. 2 No. 1 2013
are furuq such as music, pictures or specific
decors that creates the ambience of the retail
store. These issues are debatable or khilaf
among the main mazhabs. In terms of operating
hours, the issue of closing the business
premises during prayer times is also khilaf.
Hence, it might create an issue among some
Muslims depending on their views (or their
stand on the Islamic school of thought) of the
issues.
2.1 Retail Store Attributes and Islam
As defined in many marketing textbooks,
attributes refer to tangible and intangible
characteristics of products that provide
“subjective satisfactions” or “needs satisfaction
to consumers”. Several marketing researchers
have used these attributes to compare and
contrast consumer images of competing stores.
In a meta-analysis by Lindquist (1974-1975), it
was found that attributes influencing store
patronage behavior are: (1) merchandise
selection or assortment, (2) merchandise
quality, (3) merchandise pricing, (4) locational
convenience (5) merchandise styling or fashion,
(6) general service, and (7) salesclerk service.
Meanwhile, Tigert (1983) analyzed the results
of thirty-eight studies across four retail sectors
(retail food, fast food, do-it-yourself, and
fashion). For retail food store-choice, Tigert
performed a comparative analysis between the
proportions of total numbers of attributes. He
found that locational convenience is the most
determinant attribute. Low price was the
second strongest attribute. Consequently, the
sequence of importance of the attributes is as
follows: (1) locational convenience, (2) low
price, (3) merchandise assortment, (4) service,
and (5) merchandise quality.
More recently, scholars had found that there is
another unique dimension affecting store
patronage behavior, which relates to religious
customer (e.g. Muslim). For example, McDaniel
and Burnett (1990) found that religiosity as
being measured by cognitive and behavioral
components have significant relationship with
store choice. Consumers with a high degree of
cognitive religious commitment have viewed
that sales personnel friendliness, shopping
efficiency, and product quality as being of
greater importance in selecting a retail store
than did those low in cognitive religious
commitment. On the other hand, religious
contribution, a behavioral component of
religious commitment, was positively and
significantly associated with sales personnel
friendliness/assistance and credit availability.
3. Marketing Mix
3.1 Product
While these findings are based on religiosity in
“general”, Islam outlines a clear guideline on
what is permissible, i.e. the concept of halal and
haraam. Halal (Arabic: حالل , "permissible") is a
term designating any object or an action which
is permissible to use or engage in, according to
sharia (Islamic law). The term is used to
designate food seen as permissible according to
Islamic law. The opposite of this word is
haraam. The terms halal and haraam are
applied to many facets of life where it includes
any Sharia compliant products ranging from
bank dealings to cosmetics, vaccines, and
tourism. This means offering product that are
particularly designed to cater for Muslim
considerations and address Muslim needs. By
this definition halal covers many aspects of a
product: its components, production process,
and delivery (Kocturk, 2002). Based on
Malaysia’s department of Islamic development
(Jabatan Kemajuan Islam Malaysia, JAKIM) the
halal guidelines are guided by Qur’anic
interpretations by the four mazhabs (school of
thought) namely Maliki, Hambali, Syafie and
Hanafi. The complete guidelines of halal food
based on certain criteria highlighted by JAKIM
are:
78 WHAT CONSTITUTES AN ISLAMIC RETAILER? ISLAMIC STORE ATTRIBUTES FROM THE PERSPECTIVES OF ISLAMIC MARKETING PRINCIPLES.
Copyright ©2013 by International Journal of Sales, Retailing and Marketing Vol. 2 No. 1 2013
1) Does not consist of or contain anything which
is considered to be unlawful according to
Islamic law.
2) Has not been prepared, processed,
transported or stored using any appliance or
facility that was not free from anything unlawful
according to Islamic law and
3) Has not, in the course of preparation,
processing, transportation or storage been in
direct contact with any food that fails to satisfy
1 and 2 above.
Previously, the halal dimensions were
suggested to measure only service retailing
such as bank (Haron, Ahmad, and Planisek,
2005), and insurances company. But, recently,
the halal dimension is also seen to influence
other retail industries. A study by Abu (2004)
had proved the importance of the halal
dimension in the retail sector. Abu (2004)
revealed that offering halal merchandise is an
important attribute in selecting a store. The
study found that although factors such as
merchandise assortment and quality of the
merchandise are important, the most important
factor in selection of the merchandise is the
halal considerations. One of the statements
that elaborated the feeling of Muslims in retail
store selection can be related to the following
quotation based on a study by Mohd Fauzi and
Muhammad (2011),“ Personally, knowing that a
store is sensitive towards Islamic values makes
me more confident to shop at the store... no
doubts on the halalness of products sold
there...” Indeed, for the devout Muslims they
are not only concerned about halal but the
product must also be halalan tayyibba, which
means that it goes beyond halal concept where
the product is in good quality to enhance the
confidence of “Muslim made” product.
As a Muslim consumer, it is part of their
obligations to find halal product and they must
shy away from consumable that are doubted.
This matter of fact has been stressed in Al
Quran in surah Al Baqarah verse 2:168 and Al-
Baqarah verse 2:172 respectively.
“O ye people! Eat what is on earth, lawful
(halal) and good (tayyib)… (Al-Baqarah, 2:168)
“O you who believe! Eat of the good things that
we have provided to you, and be grateful of
god, if it is He ye worship. He hath only
forbidden you dead meat, and blood, and the
flesh of swine and that on which any other
name hath been invoked besides that of god.”
(Al-Baqarah, 2:172)
By referring to the definition by JAKIM, halal
means not only prohibited to unlawful food, but
the concept of halal is wide. Moreover in Islam,
it is not only concerned about halal but must be
tayyib (good). The concept of halal is broad and
the product not only must free from prohibited
items but also must be prepared, store and
prepare according to syari’ah compliance.
Furthermore it must be clean and hygiene to
determine that the food or products are safe to
be consumed or eaten.
3.2 Sales personnel
While it is important the products sold are halal,
the appearance of the employees in the store
must also follow Islamic appearance which
means dress according to the Islamic guidelines
which is covering the aurah. The aurah is the
intimate parts of the human body that must be
covered from the sight of others with proper
clothing. Nevertheless, which body parts must
be covered and how it is covered varies
between different schools of Islamic thought.
There are many verses in the Qur’an that stated
this. Among the verses is “O Prophet! Tell your
wives and your daughters, and the believing
women, to draw their cloaks (veils) over their
bodies. That will be better that they should be
known (as respectable woman) so as not to be
annoyed. And Allah is Ever Oft-Forgiving, Most
Merciful." (Al-Ahzab:59).

79 WHAT CONSTITUTES AN ISLAMIC RETAILER? ISLAMIC STORE ATTRIBUTES FROM THE PERSPECTIVES OF ISLAMIC MARKETING PRINCIPLES.
Copyright ©2013 by International Journal of Sales, Retailing and Marketing Vol. 2 No. 1 2013
3.3 Price
In terms of pricing mechanism, Islam forbids
riba which means interest. Riba is forbidden in
Islamic economic jurisprudence fiqh and is
considered as a major sin. Riba is considered
unjust gains in trade or business, generally
through exploitation. The Qur'an deals with riba
in 12 verses. For instance in Al Baqarah (verse
2:275), “Allah has permitted trade and has
forbidden interest”. Therefore, any pricing
mechanism that incurs interest (usually in credit
terms) is rejected in Islam.
In addition, any extra cost or added features
that might materially change the product or
influence the buyer’s final purchase decisions
needs to be clarified. On the same note, it is not
allowed to change a price without altering the
quality or quantity of the product because this
is considered as cheating. The essence of this
practice is to treat all customers fairly. For
instance, in complementary products – retailers
need to inform the price of both items so that
the customers know the prices of both products
and do not feel deceived when buying either or
both products.
Meanwhile, price discounts offered by retailers
that could benefit consumers in terms of saving
money on items on sale are encouraged
(Abdullah, 2008). It is stated in the Qur’an,
“Those who, when they spend, are not
extravagant and not niggardly, but hold a just
(balance) between those (extremes)” (Al-
Furqan-25:67). On the other hand, Islam forbids
any price manipulation such as hoarding and or
restriction on trade. During festivities, the
supplies of certain goods or products are in high
demand and frequently, suppliers are having
difficulty to meet these demands. Unethical
retailers would normally take this opportunity
to hoard items to raise the price. On the other
hand, to compete aggressively through price
cutting is also not permissible in Islam. Once the
second Caliph Umar Ibn al-Khattab passed by
Hatib ibn Abi Balta'ah and found him selling
raisins at a much lower price with the intention
of putting his competitors to loss. Caliph Umar
Ibn al-Khattab told him: “Either enhance your
rate or get away from our market”.
3.4 Promotion
With regards to promotional activities, it comes
under the same ruling as the product that is
being marketed or sole. If it is something that is
permissible to use and consume, there is
nothing wrong with promoting it. This is based
on the verses of Al Maidah 5:2 where Allah
stated “Help you one another in Al-Birr and
At-Taqwa (virtue, righteousness and piety); but
do not help one another in sin and
transgression. And fear Allah. Verily, Allah is
Severe in punishment”. However, one need to
be cautious that he should not overstep the
limits such as describing the product as other
than what it actually is, because this is
considered lying and Islam forbids any sort of
deceptive promotional behavior. According to
Islamic principles, marketers are required to
“disclose all faults in their goods, whether
obvious or hidden; to do otherwise cannot be
seen “on the surface” and cannot be found out
by the “cursory glance” to the purchaser. In
addition, it is dictated that – “A sale without any
stipulation makes it necessary that the thing
sold should be free from defect”.
Al-Qur’an condemns all forms and shapes of
false assertion, unfounded accusation,
concoction and false testimony (al- Qur’an,
43:19). It is unethical for the salesman to over-
praise his products and attribute to them
qualities which they do not possess (Ibn al-
Ukhuwwah, 1938). Furthermore, giving a false
impression of any kind to promote or sell a
product is strictly prohibited. The Prophet
Muhammad (Peace be upon him) expressly
condemned all manipulative promotional
behavior stating that, “One who cheats us is not
one of us”. Therefore, in promoting the
80 WHAT CONSTITUTES AN ISLAMIC RETAILER? ISLAMIC STORE ATTRIBUTES FROM THE PERSPECTIVES OF ISLAMIC MARKETING PRINCIPLES.
Copyright ©2013 by International Journal of Sales, Retailing and Marketing Vol. 2 No. 1 2013
products or services, Islamic retailers should
follow the following rules of:
avoidance of false and misleading advertising;
rejection of high pressure manipulations, or
misleading sales tactics;
avoidance of sales promotions that use
deception or manipulation.
Any promotional techniques must not use
sexual appeal or false testimonies in their
promotional activities. In determining where to
advertise, the basic principle is that it is not
permissible to sign up for advertising programs
unless one can be certain that it is not
collaborating in non permissible activities such
as in “wild” concerts (where there is a free
mixing of gender, alcohol and revealing of body
parts) as it is not permissible to advertise,
promote or help to spread evil. Otherwise, the
retailer will be a partner in spreading and
propagating haraam activities.
3.5 Location
Finally, in terms of location or distribution, the
meeting together, mixing, and intermingling of
men and women in one place, the crowding of
them together, and the revealing and exposure
of women to men are prohibited. Verse No. 53
of Surah al-Ahzab “...for anything ye want, ask
them from before a screen: that makes for
greater purity for your hearts and for theirs...”
The Prophet Muhammad (May peace and
blessings be upon him) enforced separation of
men and women even at Allah’s most revered
and preferred place, the mosque. Therefore,
retailers must take precautions to avoid
meeting and mixing of men and women as
much as possible while at the same time
achieving desired goals and objectives. This
result can be achieved by designating separate
places assigned for men and women, using
different doors for each or have female staffs
attending female customers.
In “distributing” products and services, Islamic
retailers ought to follow the principles where
there should be:
No manipulation on the availability of a product
for purpose of exploitation;
No coercion in the marketing channel;
No exerting undue influence over the re-sellers
choice to handle a product.
Within the process of distribution itself, Islam
does not permit the usage of packaging designs
that are not safe or inappropriate. The channel
of distribution must not create unnecessary
burden for the final customer in terms of higher
prices or delivery delays.
4. Current Islamic Retail Practice
As time goes by, Muslims customers are seen to
becoming more discerning and require not only
more sophisticated products and services but
also products that conform to the Islamic
teachings. Muslims want and expect to acquire
foods and services according to their religious
tenets, thus, the requirement for syari’ah
compliance has become more prevalent. The
retail industry has been quick to respond to
these changes in customers’ preference. For
example, few multinational hypermarkets are
beginning to do their part in catering to the
Muslims needs, such as displaying halal meat in
a separate freezer. On a global perspective,
Brazilian suppliers have built elaborate halal
chicken slaughtering facilities to export to
Islamic countries. Hand in hand is New Zealand
which is currently the world’s biggest exporter
of halal lamb. Similarly, Netherlands has halal
warehouses, where imported halal goods are
stored away from haram products such as pork
or alcohol.
In small retail stores or groceries stores, haraam
products are normally not “visibly” located or
placed at an obscure location. French Carrefour
in Malaysia implements a very elaborate halal
process to keep halal foods separate. Goods

81 WHAT CONSTITUTES AN ISLAMIC RETAILER? ISLAMIC STORE ATTRIBUTES FROM THE PERSPECTIVES OF ISLAMIC MARKETING PRINCIPLES.
Copyright ©2013 by International Journal of Sales, Retailing and Marketing Vol. 2 No. 1 2013
that are halal or haraam are coded with little
green stickers to alert customers. Clearly,
haraam goods such as those containing alcohol,
pork or tobacco are confined to a glass room at
the back of the store. Further, these haraam
products are handled by staff wearing special
blue gloves and sealed in airtight pink plastic
wrapping after purchase, in order not to
contaminate the main store (Power and
Abdullah, 2009). Mixing halal and haraam
products are not acceptable by Muslims in
Malaysia (although the products are well
wrapped and packed). The company also
operates a halal logistics hub west of Kuala
Lumpur, which have cold-storage facilities,
sterilization units and a lab to test products to
ensure they are halal (Power and Gatsiounis,
2007).
It can also be observed in major high-end
shopping malls in Kuala Lumpur such as Pavilion
and KLCC, where facilities for Muslims are
provided. Most shopping malls provide separate
Muslim prayer rooms for men and women.
There are hair saloons providing exclusive
rooms for female only which is sharia compliant
whereby Muslims ladies have to cover their
hair. Islamic banks in Malaysia for example,
Bank Muamalat assigns separate sitting areas
for ladies and men. In Kelantan, the eastern
part of Malaysia, numerous cashiers are
assigned for separate genders.
Within the food based retail outlet, it is more
straight forward to determine whether an
outlet is an Islamic compliant as JAKIM issues
the halal certification to restaurants that serve
halal food. Hence, in the case of food outlet, the
entry of Western franchised food outlets has
changed the eating landscape in many Muslim
countries, while simultaneously subjecting the
Western food companies to new standards of
halal certification, a process termed halalisation
(Fischer, 2008). However, for non food sector, it
is quite unclear whether the store is “Islamic” or
not. Alternatively, these retailers subjected
themselves to enhance the “tangibility” of the
Islamic positioning through using Islamic or
rather Arabic names of their retail stores,
uniforms or the dress of the staffs and providing
prayer rooms.
5. Managerial and Policy Implications
Our elaborate discussions on what constitutes
an Islamic retailer based on the rules and
guidelines of Islamic syari’ah depicts that this
issue is complicated. Although the main
principles (usul) depicting the rules and
regulation of certain (commercial) activities
(e.g. what is halal) are relatively clear among
the four Islamic School of thought, what
constitutes proper Islamic business practices
(e.g. retailing) is still highly contested, dynamic
and negotiated (khilaf). For example, how
modest dressing is interpreted differs greatly
across Muslims communities and over time. In
addition, the modern and fashionable scarfs or
veil has generated acceptance as well as
criticisms among Islamic clerics as well as
Muslims, rendering the meaning of proper
Islamic dress even more complicated. The
playing of “Islamic” music in business settings or
locations in countries such as Malaysia and
Indonesia are acceptable and may signify an
Islamic store personality. This scenario as
Gilsenan (1990:34) pointed out, a continuation
of ‘beliefs and practices that … (the
“ulama’/scholars)… might consider un-Islamic
but … [are]… regarded as perfectly Islamic by
their practitioners and constantly blended into
popular cultural tradition’. However, the same
practices may invite harsh reconciliation among
enforcement officers and Muslim patrons say in
Saudi Arabia. In addition, in terms of
consumers’ awareness and concerns, it is
observed that Muslim consumers in mixed
populations (where there are mixed numbers of
religious beliefs) tend to be more sensitive and
aware of the issue of halal and haraam

82 WHAT CONSTITUTES AN ISLAMIC RETAILER? ISLAMIC STORE ATTRIBUTES FROM THE PERSPECTIVES OF ISLAMIC MARKETING PRINCIPLES.
Copyright ©2013 by International Journal of Sales, Retailing and Marketing Vol. 2 No. 1 2013
compared to places where Muslims dominated
(as it is assumed that everything sold is halal).
Therefore, given such complexity and
multiplicity, understanding the dynamics of
“Islam in local context” (Eickelman, 1982)
becomes imperative. Businesses need to take
consideration and be sensitive to what is
acceptable at the local context even though the
same practices or products are accepted by
Muslims elsewhere. On the same note, while it
is important that businesses understand Muslim
consumers better, they also need to understand
the intersection of religion with other variables
such as gender, age, income status and so on.
Although the Muslim consumers are linked by
faith, their decision making may differ due to
the influence of these variables. Hence, retailers
need to avoid the stereotypes that all Muslims
think and act the same way or want the same
products and services.
6. Conclusions
Our paper highlights that there are issues which
share common ideals or philosophies especially
in the case of justice and fairness. Businesses
that follow Islamic principles avoid all forms of
injustice and haram and follow an array of
sharia-compliant ethical behaviors and moral
values that promote social solidarity and
welfare. In this paper, we propose that the
attributes of Islamic store includes product,
price, place and promotion strategies based on
Islamic principles. Thus, the product attributes
should be halalal tayyiban, which means only
halal products to be sold and the sales of haram
product is prohibited. In terms of price
attributes, a company’s pricing strategy should
not be exploitative of consumers’ needs or their
unawareness and have any involvement in
interest, gambling and price manipulation.
Promotional strategies of the Islamic retailers is
treated as a seller’s promise to customers, thus
it should not use high-pressure manipulations
or misleading sales tactics. Meanwhile, the
place attributes should ensure that the store is
“orderly” arranged that enables the customers
of different gender to shop without “overly”
mixing or in some instances – complete
separation of the different gender.
Islam prohibits businesses to deceive its
consumers; it urges businesses to treat its
customers and competitors fairly without
resorting to unethical activities. Islamic ethics of
compassion, generosity and giving to the poor
seem to resonate with the notion of corporate
social responsibility (CSR). While, most people
may view the CSR as a Western invention, it is
actually one of the foundations of the Islamic
way of life. Perhaps, one of the most successful
developments in this area is the creation of
“corporate waqf”. ‘Waqf’ means devoting
something for the cause of Allah (God) or the
basic purpose is ‘good task’ for Allah (God).
Johor Corporation (one of Malaysia’s successful
corporations) developed corporate waqf in the
context of business and has been successful in
developing chains of medical clinics, hospitals,
mosques and even micro financing (interest
free start-up funds) for small entrepreneurs. It
is apparent that there are some very interesting
new ways of developing and running businesses
in the Islamic world through applying traditional
Islamic values and religious practice to
corporate life. It is hoped that more studies and
work is done to bridge the knowledge gap in
this area.
References
Abbas, S.Z.M., Hamid, M.A.A., Joher, H. and
Ismail, S. (2003), Factors That Determine
Consumers’ Choice in Selecting Islamic
Financing Products, paper presented at
International Islamic Banking Conference, Prato,
Italy.
83 WHAT CONSTITUTES AN ISLAMIC RETAILER? ISLAMIC STORE ATTRIBUTES FROM THE PERSPECTIVES OF ISLAMIC MARKETING PRINCIPLES.
Copyright ©2013 by International Journal of Sales, Retailing and Marketing Vol. 2 No. 1 2013
Abu, N. K. (2004). Service quality dimensions: a
study on various sizes of grocery retailers–a
conceptual paper. Proceeding of IBBC2004,
Sarawak, Malaysia. 633-642.
Adas, A.B. (2006). The making of
entrepreneurial Islam and the Islamic spirit of
capitalism. Journal for Cultural Research, 10 (2),
113-25.
Ahmad, N. and Haron, S. (2002). Perceptions of
Malaysian corporate customers towards Islamic
banking products and services. International
Journal of Islamic Financial Services, 3 (4), 13-
29.
Alserhan, B. A. (2011). The Principles of Islamic
Marketing. Gower Publishing Company
Dusuki, A.W. and Abdullah, N.I. (2007). Why do
Malaysian customers patronise Islamic banks?.
International Journal of Bank Marketing, 25 (3),
142 – 160.
Engel, F.F., Blackwell, R.D. and Miniard, P.W.
(1995). Consumer Behaviour, Dryden Press.
Eickelman, D.F. (1982). The study of Islam in
local contexts. Contributions to Asian Studies
17, 1–16.
Fischer, J. (2008). Proper Islamic Consumption:
Shopping Among the Malays in Modern
Malaysia. Copenhagen, Denmark: NIAS Press.
Gayatri, Gita; Hume, Margee; Mort, Gillian
Sullivan. (2011). The role of Islamic culture in
service quality research. Asian Journal on
Quality, 12 (1), 35 – 53.
Gilsenan, M. (1990). Recognizing Islam: Religion
and Society in the Modern Middle East. London:
I.B. Tauris.
Haron, S., Ahmad, N., and Planisek, S. (2005).
Bank patronage factors of Muslim and non-
Muslim customers. International Journal of
Bank Marketing, 12 (1), 32-40.
Kearney, A.T. (2007). Addressing the Muslim
market. available at:
www.atkearney.com/images/global/pdf/Addres
singMuslimMarket_S.pdf
Kocturk, T. (2002). Food rules in the Koran.
Scandinavian Journal of Food & Nutrition, 46
(3), 137-139.
JWT (2009). Understanding the Islamic
consumer. available at:
www.wpp.com/NR/rdonlyres/ 0EE122EE-C956-
431A-BFC9-
78BED42011D1/0/marketing_to_muslims.pdf.
Retrieved 10th October 2012.
Lindquist, Jay D., (1974-75). Meaning of Image.
Journal of Retailing, 50 (Winter), 29-38.
McDaniel, S. W., and Burnett, J. J. (1990).
Consumer religiosity and retail store evaluative
criteria. Journal of the Academy of Marketing
Science, 18, 101-112.
Mohd Fauzi, W.I. and Muhammad, N. (2011).
Muslim Consumers’ Expectations of an Islamic
Base Retail Store and their Patronage
Motivation: A Malaysian Perspective. 7th
International Conference on Business,
Management and Economics - ICBME’11
Valparaiso University, 06 - 08 October 2011, in
Çeşme / İzmir – Turkey.
Mokhlis, S. (2009). Relevancy and Measurement
of Religiosity in Consumer Behavior Research.
International Business Research, 2 (2), 75-84.
Moye, L.N. (2000). Influence of Shopping
Orientation, Selected Environmental
Dimensions with Apparel Shopping Scenarios,
and Attitude on Store Patronage for female
consumers, Unpublished PhD Dissertation,
Virginia Polytech Institute
Nasr, V. (2009), Forces of Fortune, Simon, New
York, NY.
Ogilvy and Mather (2010). Brands, Islam and the
new Muslim consumer. available at:
www.ogilvy.com/News/Press-Releases/May-
2010-The-Global-Rise-of-the-New-Muslim-
Consumer.aspx. Retrieved 10th October 2012

84 WHAT CONSTITUTES AN ISLAMIC RETAILER? ISLAMIC STORE ATTRIBUTES FROM THE PERSPECTIVES OF ISLAMIC MARKETING PRINCIPLES.
Copyright ©2013 by International Journal of Sales, Retailing and Marketing Vol. 2 No. 1 2013
Osella, F. and Osella, C. (2009). Muslim
entrepreneurs in public life between India and
the Gulf: making good and going good. Journal
of the Royal Anthropological Institute, S202-
221.
Rosenbloom, B. (1983). Store Image
Development and the question of congruency.
In Darden, W.R. and Luusch, R.F. (Eds).
Patronage Behavior and Retail Management.
Amsterdam: Elsevier Science, 141-149.
Sandikci, O. and Ger, G. (2002). In-between
modernities and postmodernities: investigating
Turkish consumption scape. Advances in
Consumer Research, 29, 465-70.
Shaw, D. S., and Clarke, I. (1998). Culture,
consumption and choice: Towards a conceptual
relationship. Journal of Consumer Studies and
Home Economics, 22 (3), 163-168.
http://dx.doi.org/10.1111/j.1470-
6431.1998.tb00727.x
Sloane-White, P. (2011). Working in the Islamic
economy: Sharia-ization and the Malaysian
workplace. SOJOURN: Journal of Social Issues in
Southeast Asia.
Syed Shah Alam, Rohani Mohd, Badrul Hisham,
(2011). Is religiosity an important determinant
on Muslim consumer behavior in Malaysia?.
Journal of Islamic Marketing, 2 (1), 83 – 96.
Tigert, Douglus J. (1983). Pushing the hot
Buttons for a Successful retailing strategy. In
Patronage Behavior and Retail Management.
Prentice Hall, 251-291.
Wong, L. (2007). Market cultures, the middle
classes and Islam: consuming the market?
Consumption, Markets and Culture, 10 (4), 451-
80.