Embed Size (px)
Citation preview
DOCUMENT RESUME
ED 427 536 FL 025 719
AUTHOR Buron, Lawrence; Beecroft, Erik; Bell, Stephen; Price,Cristofer; Gemmen, Eric
TITLE Prospects: The Congressionally Mandated Study of EducationalGrowth and Opportunity. Final Report on Limited EnglishProficient Students.
INSTITUTION Abt Associates, Inc., Bethesda, MD.SPONS AGENCY Department of Education, Washington, DC. Planning and
Evaluation Service.PUB DATE 1998-02-00NOTE 354p.
PUB TYPE Reports - Descriptive (141)EDRS PRICE MF01/PC15 Plus Postage.DESCRIPTORS Academic Achievement; Comparative Analysis; Cross Sectional
Studies; Elementary Education; Elementary School Students;*English (Second Language); Ethnicity; FamilyCharacteristics; Family Environment; *Federal Programs;Language Proficiency; *Limited English Speaking; *Outcomesof Education; Public Schools; *Student Characteristics
IDENTIFIERS Elementary Secondary Education Act Title I
ABSTRACTAs a reflection of the importance attached to successfully
educating children whose native language is not English, the U.S. Departmentof Education's longitudinal study of Chapter 1 assistance, "Prospects,"includes a component devoted to the analysis of limited-English-proficient(LEP) students. Chapter 1, renamed Title 1 in 1994, is the primary federalprogram of assistance for educating disadvantaged students. This report isthe second of two focused on the LEP population. A cross-sectionaldescription of LEP students and their educational services during the1991-1992 school year appears in Puma and Moss (1995). That analysis isextended in this report by examining the background characteristics,educational experiences, and academic outcomes of LEP students during thefull 4 years of the "Prospects" study, from the school year ending in 1991 tothe school year ending in 1994. A nationally-representative sample of publicschool students in the 3rd grade in the 1990-1991 academic year, and aseparate nationally representative sample of public school students in thefirst grade in the 1991-92 academic year, are tracked through 1994 (Grades 1to 6) to document the experience of LEP students and contrast it with that ofEnglish proficient students. Chapter 1 focuses on defining the LEPpopulation. Chapter 2 discusses the characteristics of LEP students and theirfamilies (ethnicity, language, income, family structure). Chapter 3 focuseson educational services for LEP students, and chapter 4 is concerned with theeducational outcomes of LEP students, with specific focus in Englishproficiency, reading, math, and retention in grade. (Author/VWL)
********************************************************************************
Reproductions supplied by EDRS are the best that can be madefrom the original document.
********************************************************************************
AbtAbt Associates Inc.
55 Wheeler Street
Cambridge, Massachusetts
02138-1168
617 492-7100 telephone
617 492-5219 facsimile
Hampden Square, Suite 500
4800 Montgomery Lane
Bethesda, Maryland
20814-5341
301 913-0500 telephone
301 652-3618 facsimile
640 North LaSalle Street
Suite 400
Chicago, Illinois
60610-3781
312 867-4000 telephone
312 867-4200 facsimile
x4
U.S. DEPARTMENT OF EDUCATIONOffice of Educational Research and Improvement
EDUCATIONAL RESOURCES INFORMATIONCENTER (ERIC)
This document has been reproduced asreceived from the person or organizationoriginating it.
0 Minor changes have been made toimprove reproduction quality.
Points of view or opinions stated in thisdocument do not necessarily representofficial OERI position or policy.
BEST COPY AVAIIABLE
Prospects: TheCongressionallyMandated Study ofEducationalGrowth andOpportunity
Final Report onLimited EnglishProficient Students
February 1998
Prepared forU.S. Department of EducationPlanning and Evaluation Service600 Independence Avenue, S.W.Washington, D.C. 20202
Prepared byLawrence BuronErik BeecroftStephen BellCristofer PriceEric Gemmen
TABLE OF CONTENTS
EXECUTIVE SUMMARY
CHAPTER 1 DEFINING THE LEP POPULATION 1-1
Overview of the Chapter 1-2Legal Context for Provision of Services to LEP Students 1-4The LEP Indicator Variables 1-7Imputation of Missing Data 1-12Overall LEP Status, by Cohort and Year 1-14The Relative Importance of Perceptions Versus Services 1-20The Role of Perceptions and Services in Defining the LEP Population Over
Time 1-26General Trends 1-29Special Cases 1-30
LEP Transitions 1-33Types of Transitions 1-34Entrances into LEP Status 1-37Exits from LEP Status 1-41
Defining LEP Groups and Comparison Groups for Further Analyses 1-44
CHAPTER 2 THE CHARACTERISTICS OF LEP STUDENTS AND THEIRFAMILIES 2-1Other Research on LEP Students' Characteristics 2-1Overview of this Chapter 2-2
The Characteristics of All LEP Students 2-3Ethnicity and Native Language Characteristics 2-3Geographic Distribution 2-3Language Proficiency 2-11
How Do the Resources of Low-Income LEP Students Compare to Those of Low-Income EP Students? 2-22Economic Resources 2-26Family Structure 2-32Parent Involvement and Expectations 2-34Student Attitudes and Self-Perceptions 2-47Changing Schools 2-49
School Poverty and LEP Concentration 2-52Summary 2-58
TABLE OF CONTENTS(continued)
CHAPTER 3 EDUCATIONAL SERVICES FOR LEP STUDENTS 3-1Overview of this Chapter 3-2Interpretation of Weighted Results 3-3A Brief Comment on Imputation Procedures 3-4
Are Educational Services Responsive to the Special Needs of LEP Students? . 3-5Do the schools that LEP students attend run integrated, focused LEP
programs well- supported by and coordinated within the schoolstructure as a whole? 3-5
Do LEP students regular classroom teachers and aides have the appropriatetraining to meet the needs of LEP students? 3-19
Are the instructional services provided in the classroom appropriate to theeducational needs of LEP students? 3-27
Do LEP Students at High-Poverty Schools Receive the Same Quality ofEducational Inputs as EP Students at High-Poverty Schools? 3-52Are the regular classroom reading/English/language arts and math teachers
of LEP students as educated and experienced as the regularclassroom teachers of EP students? 3-53
How does the regular classroom instructional setting for LEP studentscompare to the regular classroom instructional setting of EPstudents? 3-58
Do LEP students have the same access to material resources as EP studentsin the regular reading/English/language arts and mathclassrooms? 3-66
Do LEP Students Receive the Same Instructional Content as EP Students? . . . 3-70Summary 3-84
CHAPTER 4 EDUCATIONAL OUTCOMES FOR LEP STUDENTS 4-1Description of the Outcomes Analyzed 4-2Sample Definitions and Methodology 4-3
Student Outcomes: English Proficiency 4-5Student Outcomes: Reading Achievement Test Scores 4-11
Reading Test Scores for All Students 4-12Reading Test Scores for Low-Income Students 4-16
Student Outcomes: Math Achievement Test Scores 4-18Math Applications Test Scores 4-21Math Computation Test Scores 4-23Math Test Scores for Low-Income Students 4-26
Student Outcomes: Retention in Grade 4-30Parents' Reports of Retention 4-30Retention Based on Observed Grade Sequence 4-33Retention Rates for Low-Income Students 4-35
Summary 4-35
TABLE OF CONTENTS(continued)
POSTSCRIPT
REFERENCES
APPENDIX A
APPENDIX B
APPENDIX C
APPENDIX D
APPENDIX E
APPENDIX F
APPENDIX G
APPENDIX H
APPENDIX I
Procedures for Imputing LEP Status When Data onIndividual Indicators Are Missing
Prospects Study Design
Missing Data Rates for Variables Used to Identify LEPStudents
Treatment of Missing Data
Procedures for Calculating Composite Scores forInstructional Emphasis
Sample Sizes for Outcomes Analyses
Structure of HLM Analysis for Achievement Test Scores
Parameter Estimates for HLM Analysis of Math Test Scores
Teacher Judgements as Measures of Students' EnglishProficiency
LIST OF EXHIBITS
CHAPTER 1
Exhibit 1.1 Prospects 1st and 3rd Grade Cohort Data Collection Points for ThisReport 1-10
Exhibit 1.2 Percent of Sample and National Population of Public SchoolStudents Identified as LEP Based on Indicator Variables inProspects Data, by Cohort and Year 1-15
Exhibit 1.3 Longitudinal Patterns of Inclusion in the LEP Group, by Cohort 1-18Exhibit 1.4 Percent of LEP Students Perceived versus Served as Limited-
English Proficient at Any Point During the Follow-Up Period, byCohort 1-22
Exhibit 1.5 Contribution of Individual Criteria to the LEP Population Duringthe Follow-Up Period: 1st Grade Cohort 1-24
Exhibit 1.6 Contribution of Individual Criteria to the LEP Population Duringthe Follow-Up Period: 3rd Grade Cohort 1-25
Exhibit 1.7 Percent of LEP Students Perceived versus Served as Limited-English Proficient, by Year: 1st Grade Cohort 1-27
Exhibit 1.8 Percent of LEP Students Perceived versus Served as Limited-English Proficient, by Year: 3rd Grade Cohort 1-28
Exhibit 1.9 Transition Patterns Among LEP Students, by Cohort 1-35Exhibit 1.10 Criteria Associated with Entrances into LEP Status, by Cohort and
Year 1-40Exhibit 1.11 Criteria Associated with Exits from LEP Status, by Cohort and
Year 1-42Exhibit 1.12 Population Shares and Maximum Sample Sizes for LEP Subgroups,
by Cohort 1-46
CHAPTER 2
Exhibit 2.1 Race/Ethnicity of LEP and All Other Students 2-4Exhibit 2.2 Native Language for All LEP Students 2-5Exhibit 2.3 Regional Distribution of LEP and All Other Students 2-7Exhibit 2.4 Race/Ethnicity of All LEP Students by Region 2-8Exhibit 2.5 Distribution of LEP Students by State, for States With Largest
Share of LEP Students in Sample, Unweighted 2-9Exhibit 2.6 Urbanicity of LEP and All Other Students 2-10Exhibit 2.7 Teacher Assessments of Native Language Proficiency for All LEP
Students 2-13
LIST OF ExmBrrs(continued)
. CHAPTER 2
Exhibit 2.8
Exhibit 2.9
Exhibit 2.10
Exhibit 2.11
Exhibit 2.12
Exhibit 2.13Exhibit 2.14
Exhibit 2.15
Exhibit 2.16
Exhibit 2.17
Exhibit 2.18
Exhibit 2.19
Exhibit 2.20
Exhibit 2.21
EXhibit 2.22
Exhibit 2.23
Exhibit 2.24
Exhibit 2.25
(continued)
Teacher Assessments of Native Language Proficiency of LEPStudents, By Race/Ethnicity 2-15Teacher Assessments of English Language Proficiency for All LEPStudents 2-16Teacher Assessments of English Language Proficiency of LEPStudents, By Race/Ethnicity 2-18Teacher Assessments of LEP Students' English LanguageProficiency, by Native Language Proficiency 2-20Self-Reported English Language Proficiency for Parents of LEPStudents 2-21Frequency With Which English is Spoken At Home 2-23Teacher Assessments of Students' English Proficiency, by Parents'Assessments Of Their Own English Proficiency 2-24Teacher Assessments of Students' Native Language Proficiency, byParents' Assessments of Their Own English Proficiency 2-25Income Distribution for Low-Income LEP and Low-Income EPFamilies 2-28Educational Attainment of Parents of Low-Income LEP and EPStudents 2-30Employment Status of Parents of Low-Income LEP, Low-IncomeEP, and Non-Low-Income Students 2-31Occupational Status of Parents of Low-Income LEP, Low-IncomeEP, and Non-Low-Income Students 2-33Percent of Low-Income LEP, Low-Income EP, and Non-Low-Income Students in Two-Parent Households 2-35Family Size of Low-Income LEP, Low-Income EP, and Non-Low-Income Students 2-36Average Frequency of Parents' Participation in Academic Activitieswith Their Children, for Parents of Low-Income LEP, Low-IncomeEP, and Non-Low-Income Students 2-38Average Frequency of Parents' Participation in Activities at TheirChildren's School, for Parents of Low-Income LEP, Low-IncomeEP, and Non-Low-Income Students 2-39Time Spent At Home After School With No Adult Present: Low-Income LEP, Low-Income EP, and Non-Low-Income Students 2-40Average Frequency With Which Parents Say They Disagree WithTheir Children About Discipline or Family Rules, for Parents ofLow-Income LEP, Low-Income EP, and Non-Low-IncomeStudents 2-42
7
LIST OF EXHIBITS(continued)
CHAPTER 2
Exhibit 2.26
Exhibit 2.27
Exhibit 2.28
Exhibit 2.29
Exhibit 2.30
Exhibit 2.31
Exhibit 2.32
Exhibit 2.33
Exhibit 2.34
Exhibit 2.35
CHAPTER 3
Exhibit 3.1
Exhibit 3.2
Exhibit 3.3
(continued)
Average Frequency With Which Parents Say They Talk With TheirChild About Expectations for School Performance, for Parents ofLow-Income LEP, Low-Income EP, and Non-Low-IncomeStudents 2-43Average Frequency With Which Parents Say They Talk With TheirChild About Future Plans and Goals, for Parents of Low-IncomeLEP, Low-Income EP, and Non-Low-Income Students 2-44Parents' Expectations of Their Children's Educational Attainment,for Parents of Low-Income LEP, Low-Income EP, and Non-Low-Income Students 2-46Student Attitudes About School, for Low-Income LEP, Low-Income EP, and Non-Low-Income Students 2-48Students' Self-Perceptions, for Low-Income LEP, Low-Income EP,and Non-Low-Income Students 2-50Number of Times Students Changed Schools Within The StudyPeriod, for Low-Income LEP, Low-Income EP, and Non-Low-Income Students 2-51Attendance of High Poverty Schools and School LEPConcentration, for LEP and All Other Students 2-53The Relationship Between School Poverty and School LEPConcentration 2-55Percentage of Low-Income LEP and EP Students Attending High-Poverty Schools 2-56Percentage of LEP Students Attending High Poverty Schools, byRace/Ethnicity 2-57
Percent of LEP Students Attending Schools that Offer SpecificInstructional Services to Meet the Needs of LEP Students, byCohort 3-8Percent of LEP Students Attending Schools with Principals Whohave Specialized Training to Meet the Needs of LEP Students, byCohort 3-10Frequency that LEP Students Attend Schools that Rely on SpecificProcedures to Coordinate Instruction Between ESL/BE and RegularInstructional Staff, by Cohort 3-12
LIST OF EXHIBITS(continued)
CHAPTER 3 (continued)
Exhibit 3.4 Percent of LEP Students Attending Schools that Integrate LEP andEP Students for Academic or Non-Academic Instruction, byCohort 3-14
Exhibit 3.5 Percent of LEP Students Attending Schools that Offer SpecificServices to Parents or Families of LEP Students, by Cohort 3-16
Exhibit 3.6 Parents' Report of Whether They and Their Children are Respectedby School Staff, by Cohort and Students' English Proficiency 3-18
Exhibit 3.7 Percent of LEP Students With Regular Reading/English/LanguageArts Teachers Who are Certified in English-as-a-Second Languageand/or Bilingual Education, by Grade and Cohort 3-21
Exhibit 3.8 Percent of LEP Students With Regular Math Teachers Who areCertified in English-as-a-Second Language and/or BilingualEducation, by Grade and Cohort 3-22
Exhibit 3.9 Percent of LEP Students With Regular Reading/English/LanguageArts Teachers and Aides Who Report Proficiency in thePredominant LM-LEP Non-English Language of the Class, byGrade and Cohort 3-25
Exhibit 3.10 Percent of LEP Students With Regular Math Teachers and AidesWho Report Proficiency in the Predominant LM-LEP Non-EnglishLanguage of the Class, by Grade and Cohort 3-26
Exhibit 3.11 Percent of LEP Students Receiving ESL/BE Instructional Services,by Source of Funding, Grade, and Cohort 3-29
Exhibit 3.12 Percent of LEP Students Receiving ESL/Bilingual InstructionalServices by Prior Year Teachers' Rating of Students' EnglishUnderstanding and Writing Proficiency 3-32
Exhibit 3.13 Percent of LEP Students Who Received ESL/BE InstructionalServices in 1992-1993, and/or 1993-1994 Academic Years byTeacher Rating of Students' English Proficiency in the Spring of1992: 1st Grade Cohort 3-35
Exhibit 3.14 Percent of LEP Students Who Received ESL/BE InstructionalServices in 1992-1993, and/or 1993-1994 Academic Years byTeacher Rating of Students' English Proficiency in the Spring of1992: 3rd Grade Cohort 3-36
Exhibit 3.15 Percent of LEP Students' Regular Classroom Instruction in aLanguage Other than English, by Subject, Grade, and Cohort 3-39
Exhibit 3.16 Percent of LEP Students' Regular Reading/English/Language ArtsClassroom Instruction in a Language Other than English by PriorYear Teacher Ratings of LEP Students' English Understanding andWriting Proficiency 3-41
9
LIST OF EXHIBITS(continued)
CHAPTER 3
Exhibit 3.17
Exhibit 3.18
Exhibit 3.19
Exhibit 3.20
Exhibit 3.21
Exhibit 3.22
Exhibit 3.23
Exhibit 3.24
Exhibit 3.25
Exhibit 3.26
Exhibit 3.27
Exhibit 3.28
(continued)
Percent of LEP Students Receiving Supplementary Instruction inReading/English/Language Arts, by Source of Funding, Grade, andCohort 3-44Percent of LEP Students Participating in Supplementary Instructionin Math, by Source of Funding, Grade, and Cohort 3-45Emphasis on Reading Attitudes by LEP Students' RegularReading/English/Language Arts Teachers in Spring 1992, by Spring1991 Teacher Ratings of Students' English and Native LanguageReading Proficiency, 4th Grade 3-49Emphasis on Reading Comprehension by LEP Students' RegularReading or English/Language Arts Teachers in Spring 1992, bySpring 1991 Teacher Rating of Students' English and NativeLanguage Reading Proficiency, 4th Grade 3-50Emphasis on Writing Attitudes/Skills by LEP Students' RegularReading/English/Language Arts Teachers in Spring 1992, by Spring1991 Teacher Rating of Students' English and Native LanguageWriting Proficiency, 4th Grade 3-51Educational Attainment of Students' Regular Reading/English/Language Arts Teachers in the Spring of 1994, by Cohort, SchoolPoverty, and Students' English Proficiency 3-54Educational Attainment of Students' Regular Math Teachers in theSpring of 1994, by Cohort, School Poverty, and Students' EnglishProficiency 3-55Educational Attainment of Students' Regular Reading/English/Language Arts Classroom Aides in the Spring of 1994, by Cohort,School Poverty, and Students' English Proficiency. 3-56Educational Attainment of Students' Regular Math ClassroomAides in the Spring of 1994, by Cohort, School Poverty, andStudents' English Proficiency 3-57Teaching Experience of Students' Regular Reading/English/Language Arts Teachers in the Spring of 1994, by Cohort, SchoolPoverty, and Students' English Proficiency 3-59Teaching Experience of Students' Regular Math Teachers in theSpring of 1994, by Cohort, School Poverty, and Students' EnglishProficiency 3-60Percent of Students' Regular Reading/English/Language and MathTeachers in the Spring of 1994 Who Have a Permanent, StandardTeaching Certificate in the State that They Teach, by Cohort,School Poverty, and Students' English Proficiency 3-61
1 0
LIST OF EXHIBITS(continued)
CHAPTER 3 (continued)
Exhibit 3.29
Exhibit 3.30
Exhibit 3.31
Exhibit 3.32
Exhibit
Exhibit
Average and Distribution of Reading/English/Language Arts ClassSize for Students in the Spring of 1994, by Cohort, School Poverty,and Students' English Proficiency 3-62Average and Distribution of Math Class Size for Students in theSpring of 1994, by Cohort, School Poverty, and Students' EnglishProficiency 3-63Percent of Students that are Enrolled in Reading/English/LanguageArts and Math Classes Based on Ability in the Spring of 1994, byCohort, School Poverty, and Students' English Proficiency 3-65Percent of Students With Reading/English/Language Arts and MathTeachers that Report Having Sufficient Materials to Meet MostStudents' Needs in 1994, by Cohort, School Poverty, and Students'English Proficiency 3-67
3-68
3.33 Availability of Computer Hardware and Software in Students'Regular Reading/English/Language Arts Class in 1994, by Cohort,School Poverty, and Students' English Proficiency
3.34 Availability of Computer Hardware and Software in Students'Regular Math Class in 1994, by Cohort, School Poverty, andStudents' English ProficiencyEmphasis on Remedial-Typical Skills by LEP Students' RegularReading/English/Language Arts Teachers in Spring 1994, byCohort, School Poverty, and Students' English LanguageProficiency 3-72Emphasis on Applied Skills by LEP Students' RegularReading/English/Language Arts Teachers in Spring 1994, byCohort, School Poverty, and Students' English LanguageProficiency 3-73Emphasis on Writing Attitudes/Skills by LEP Students' RegularReading/English/Language Arts Teachers in Spring 1994, byCohort, School Poverty, and Students' English LanguageProficiency 3-74Emphasis on Communication-Integration Skills by LEP Students'Regular Reading or English/Language Arts Teachers in Spring1994, by Cohort, School Poverty, and Students' English LanguageProficiency 3-75Emphasis on Reading Comprehension by LEP Students' RegularReading or English/Language Arts Teachers in Spring 1994, byCohort, School Poverty, and Students' English LanguageProficiency 3-76
Exhibit 3.35
Exhibit 3.36
Exhibit 3.37
Exhibit 3.38
Exhibit 3.39
3-69
11
LIST OF EXHIBITS(continued)
CHAPTER 3 (continued)
Exhibit 3.40
Exhibit 3.41
Exhibit 3.42
Exhibit 3.43
Exhibit 3.44
Exhibit 3.45
Exhibit 3.46
Exhibit 3.47
CHAPTER 4
Exhibit 4.1
Exhibit 4.2
Exhibit 4.3
Exhibit 4.4
Emphasis on Math Attitudes by Students' Regular Math Teachersin Spring 1994, by School Poverty and Students' English LanguageProficiency Status, 6th Grade 3-78Emphasis on Remedial-Typical Skills by LEP Students' RegularMath Teachers in Spring 1994, by Cohort, School Poverty, andStudents' English Language Proficiency 3-79Emphasis on Advanced Math by LEP Students' Regular MathTeachers in Spring 1994, by Cohort, School Poverty, and Students'English Language Proficiency 3-80Emphasis on Higher Order Thinking Skills by LEP Students'Regular Math Teachers in Spring 1994, by Cohort, School Poverty,and Students' English Language Proficiency 3-81Type of Instructional Materials Used by LEP Students' RegularReading/English/Language Arts Teachers for LM-LEP StudentsCompared to Instructional Materials Used for EP Students inSpring 1994, by Cohort 3-83Type of Instructional Materials Used by LEP Students' MathTeachers for LM-LEP Students Compared to Instructional MaterialsUsed for EP Students in Spring 1994, by Cohort 3-85Frequency of Computer Use in Regular Reading/English/LanguageArts Classes in 1994, by Cohort, School Poverty, and Students'English Language Proficiency 3-86Frequency of Computer Use in Regular Math Classes in 1994, byCohort, School Poverty, and Students' English LanguageProficiency 3-87
Teacher Ratings of Students' English Proficiency, 1st GradeCohort 4-7Teacher Ratings of Students' English Proficiency, 3rd GradeCohort 4-8Growth in Teacher-Assessed English Proficiency by Domain, forStudents Who are LEP in All Years 4-10Reading Comprehension and Vocabulary Subtest Mean Scores forLEP Exiters, LEP Non-Exiters, and EP Students, 1st GradeCohort 4-13
12
LIST OF EXHIBITS(continued)
CHAPTER 4 (continued)
Exhibit 4.5
Exhibit 4.6
Exhibit 4.7
Exhibit 4.8
Exhibit 4.9
Exhibit 4.10
Exhibit 4.11
Exhibit 4.12
Exhibit 4.13
Exhibit 4.14
Exhibit 4.15
Exhibit 4.16
Exhibit 4.17
Reading Comprehension and Vocabulary Subtest Mean Scores forLEP Exiters, LEP Non-Exiters, and EP Students, 3rd GradeCohort 4-15Reading Comprehension and Vocabulary Subtest Mean Scores forLEP Exiters, LEP Non-Exiters, and EP Students, Low IncomeStudents, 1st Grade Cohort 4-17Reading Comprehension and Vocabulary Subtest Mean Scores forLEP Exiters, LEP Non-Exiters, and EP Students, Low IncomeStudents, 3rd Grade Cohort 4-19Math Applications Subtest: HLM Predicted Scores for LEPExiters, LEP Non-Exiters, and EP Students, 1st Grade Cohort 4-22Math Applications Subtest: HLM Predicted Scores for LEPExiters, LEP Non-Exiters, and EP Students, 3rd Grade Cohort 4-24Math Computations Subtest: HLM Predicted Scores for LEPExiters, LEP Non-Exiters, and EP Students, 1st Grade Cohort 4-25Math Computations Subtest: HLM Predicted Scores for LEPExiters, LEP Non-Exiters, and EP Students, 3rd Grade Cohort 4-27Math Applications Subtest: HLM Predicted Scores for LEPExiters, LEP Non-Exiters, and EP Students, Low Income Students,1st Grade Cohort 4-28Math Applications Subtest: HLM Predicted Scores for LEPExiters, LEP Non-Exiters, and EP Students, Low Income Students,3rd Grade Cohort 4-29Math Computations Subtest: HLM Predicted Scores for LEPExiters, LEP Non-Exiters, and EP Students, Low Income Students,1st Grade Cohort 4-31Math Computations Subtest: HLM Predicted Scores for LEPExiters, LEP Non-Exiters, and EP Students, Low Income Students,3rd Grade Cohort 4-32Distribution of Grade Progression Patterns for LEP and EPStudents 4-34Distribution of Grade Progression Patterns for Low-Income LEPand Low-Income EP Students 4-36
13
LIST OF EXHIBITS(continued)
APPENDIX B
Exhibit B.1 Prospects Primary Sampling Strata B-3Exhibit B.2 Prospects Instruments by Survey Year and Cohort B-9Exhibit B.3 Prospects Data Collection Points by Study Cohort B-10
APPENDIX C
Exhibit C.1 Percent of Students in Population with Missing Data on IndividualLEP Components and the Overall LEP Indicator, by Cohort andYear C-1
APPENDIX E
Exhibit E.1 Factor Analysis for Reading/English/Language Arts InstructionalEmphasis, 3rd Grade Cohort, 1992 E-2
Exhibit E.2 Factor Analysis for Reading/English/Language Arts InstructionalEmphasis, 1st Grade Cohort, 1994 E-4
Exhibit E.3 Factor Analysis for Reading/English/Language Arts InstructionalEmphasis, 3rd Grade Cohort, 1994 E-6
Exhibit E.4 Factor Analysis for Math Instructional Emphasis, 1st Grade Cohort,1994 E-8
Exhibit E.5 Factor Analysis for Math Instructional Emphasis, 3rd Grade Cohort,1994 E-9
APPENDIX F
Exhibit F.1 Unweighted and Weighted Sample Sizes for Analysis ofOutcomes F-1
Exhibit F.2 CTBS and SABE Test Status for LEP and All Other Students F-2Exhibit F.3 Number of Tests Taken for Prospects Study, for LEP and All
Other Students F-3Exhibit F.4 CTBS and SABE Test Status for LEP Exiters, LEP Non-Exiters,
and EP Students F-4
14
LIST OF EXHIBITS(continued)
APPENDIX H
Exhibit H.1Exhibit H.2Exhibit H.3Exhibit H.4Exhibit H.5
Exhibit H.6
Exhibit H.7
Exhibit H.8
APPENDIX I
Exhibit 1.1
Exhibit 1.2
Exhibit 1.3
Exhibit 1.4
First Grade Cohort Math Computations Parameter Estimates H-1Third Grade Cohort Math Computations Parameter Estimates H-2First Grade Cohort Math Applications Parameter Estimates H-4Third Grade Cohort Math Applications Parameter Estimates H-5First Grade Cohort Low Income Sample Math ComputationsParameter Estimates H-7Third Grade Cohort Low Income Sample Math ComputationsParameter Estimates H-8First Grade Cohort Low Income Sample Math ApplicationsParameter Estimates H- 1 0
Third Grade Cohort Math Computations Parameter Estimates H-11
The Effect of Imputation on Teacher Assessments of EnglishLanguage Proficiency 1-4
Predictive Power of Prior Years' Values of Teacher AssessedEnglish Language Proficiency 1-6
CTBS Reading Vocabulary Scores by English Proficiency: 1stGrade Cohort 1-8
CTBS Reading Vocabulary Scores by English Proficiency: 3rdGrade Cohort 1-9
1 5
EXECUTIVE SUMMARY
EXECUTIVE SUMMARY
Children with limited English proficiency make up an important and growing share of the
students in U.S. public schools. These studentsmany of them foreign-born or the children of
recent immigrants with limited English proficiencyare expected to acquire the skills and
knowledge that define the public school curriculum while at the same time mastering English as
a second language. The challenge this poses to both students and schools has led to a number
of educational responses (e.g., the spread of bilingual education and English-as-a-second language
instructional practices, federal Title VII funding for supplemental language instruction) and a
good deal of research. It has also led to a number of legal battles, often involving the
interpretation of Title VI of the 1964 Civil Rights Act, which prohibits discrimination on the
basis of national origin. In the most prominent case, Lau v. Nichols (1974), the Supreme Court
ruled that Title VI entitled LEP students to special language-related services to ensure effective
access to education.
As a reflection of the importance attached to successfully educating children whose native
language is not English, the U.S. Department of Education's longitudinal study of Chapter 1
assistance, Prospects, includes a component devoted to the analysis of limited English proficient
(LEP) students. Chapter 1, renamed Title I in 1994, is the primary federal program of assistance
for educating disadvantaged students. The current report is the second of two focused on the
LEP population. A cross-sectional description of LEP students and their educational services
during the 1991-1992 school year appears in Puma and Moss (1995). That analysis is extended
here by examining the background characteristics, educational experiences, and academic
outcomes of LEP students during the full four years of the Prospects study, from the school year
ending in 1991 to the school year ending in 1994. A nationally-representative sample of public
school students in the 3rd grade in the 1990-91 academic year, and a separate nationally
representative sample of public school students in the 1st grade in the 1991-92 academic year,
are tracked through 1994 (grades 1 to 6) to document the experience of LEP students and contrast
it with that of English proficient students.
16ABT ASSOCIATES INC. i
EXECUTIVE SUMMARY
DEFINING THE LEP POPULATION
There are no universally recognized standards for what level of proficiency constitutes
"limited English proficiency"; each state or sometimes even each school district within a state has
its own definition and procedures for identifying LEP students.' For this reason, a broad
definition of the LEP population is adopted for this report based on eight indicator variables in
the Prospects data. All students who meet any of the eight criteria at any point during the
observation period are placed in the overall LEP sample for our analysis. This broad-based
operationalization of LEP status was selected to avoid the risks of undercounting the number of
limited English proficient students in our nation's schools.'
An alternative approach to identifying LEP students would have been to collect
comprehensive data for determining students' level of proficiency in English. Due to resource
constraints this was not possible. However, some basic information on proficiency is available
from a variety of sources.
Three of the eight criteria used to identify LEP students concern perceptions by school
staff that a student has limited English proficiency:
Did the student's primary teacher consider him or her to have limited Englishproficiency?
Did the school choose to test the student in Spanish rather than English becauseof the student's limited English proficiency when Prospects administered astandardized achievement test?
Did the school consider the student unsuitable for testing in either English orSpanish because of the student was not proficient enough in either of theselanguages when Prospects administered a standardized achievement test?
' Although there is no single definition of LEP, there are several definitions used widelyfor example, the TitleVII definition and the definition in a 1970 memorandum from the Office of Civil Rights in the U.S. Departmentof Health, Education, and Welfare. This memorandum is discussed further in Chapter 1 of this report.
2 The approach used in this study to identify LEP students was developed at the request of OBEMLA and withinput from outside experts.
ABT ASSOCIATES INC. ii
17
EXECUTIVE SUMMARY
Another five criteria focus on the receipt of language-related services normally reserved for
students who have limited English proficiency. These criteria ask whether the student was:
Reported by her/his primary teacher as receiving English-as-a-Second language(ESL) instruction due to limited English proficiency;
Reported by her/his primary teacher as receiving bilingual instruction due tolimited English proficiency ;
Reported by her/his primary teacher as having received special services of anunspecified type due to limited English proficiency;
Listed in school records as receiving ESL or bilingual education instruction whileother sources of information indicate this is due to limited English proficiency;and/or
Associated with a specific ESL and/or bilingual education teacher, other than theregular or Chapter 1 teacher, for purposes of Prospects data collection.
The LEP students identified by any of these eight criteria during any of the three or four
years of data collection constitute 9 percent of all students attending public elementary schools.
In any one year, 5.6 to 7.6 percent of public school students meet one or more of the criteria, a
share that declines steadily between the 1st and 6th grades as students gain greater English
language skills. Despite this trend, most students categorized as LEP at some point during the
follow-up period are categorized as LEP by one or more of these measures in all years with
available data.
Use of this broad-based indicator includes some risk of creating a circular definition in
which a student receiving services under local school procedures would be included whether or
not the student is limited English proficient. However, analysis in the course of this report,
including the high proportion of students identified as LEP by multiple measures, indicates that
the findings are robust in the face of such potential overcounts. Since students are also identified
with no regard to services, the net effect may be an overcount or undercount.
18ABT ASSOCIATES INC. iii
EXECUTIVE SUMMARY
Several other aspects of the origins and dynamics of LEP status should be noted:
The most prevalent LEP indicators were receipt of ESL or bilingual educationinstruction and teacher's identification of a student as LEP. More than two-thirdsof LEP students met each of these two criteria at some point during theobservation period.
In any year, from 4.5 to 8.5 percent of the students in the LEP population wereperceived by teachers or administrators as having limited English proficiency butdid not receive any LEP-related services. It is unclear how much of this patternis due to potential limitations in the classification variables and how much is a realabsence of needed assistance.
In any year, from 15 to 23 percent of the students meeting one of our eightcriteria for identifying students as LEP received ESL, bilingual, or other speciallanguage-related services but were not identified by surveyed teachers oradministrators as having limited English proficiency. Perceptions of whether thestudent was LEP were based on the teacher's response to a question of whetherthe student is LEP and school staff s decision whether the student could bemeaningfully tested using a standardized achievement test in English. It is unclearhow much of this pattern is due to potential limitations in the classificationvariables and how much is a real mis-targeting of support services.
Between 13 and 15 percent of LEP students in each elementary school grade movefrom a classification of "LEP" to a classification of "not LEP" by the followingyear. Since there are more LEP students in earlier grades, this translates into 1.1percent of public school students exiting LEP status when moving from 1st to 2ndgrade (about 41,000 students) and 0.8 percent of all public school students makingthis transition when moving from 5th to 6th grade (about 23,000 students) usingour criteria for identifying students as LEP. This suggests an important amountof progress in addressing the English language needs of non-native Englishspeaking students. The great majority of these students never return to the LEPgroup during the study period.
Less than one percent of all public school students move from a classification of"not LEP" to a classification of "LEP" each year. Most of these entrances aretransitory, as the great majority of students who entered LEP status during thestudy period left it again by the end of the study period.
Overall there are growing levels of English proficiency for LEP students: about30 percent of the students categorized as LEP at some point during the observationperiod are no longer classified as LEP at the end of data collection.
ABT ASSOCIATES INC. iv
19
EXECUTIVE SUMMARY
CHARACTERISTICS OF LEP STUDENTS AND THEIR FAMILIES
On many measures of family resources and attributes, LEP students are clearly
disadvantaged even compared to other low-income students. Compared to other students in low-
income families, LEP students tend to: be in families with lower incomes; be more likely to
attend high-poverty schools; and change schools more often. Further, compared to other low-
income parents, LEP students' parents have much less education. On the other hand, poor LEP
students are more likely than other poor students to be in two-parent households. On balance,
however, the relative disadvantages faced by LEP students suggest that, to the extent that the goal
of federal educational policy and resources is to help "level the playing field" for all groups of
students, an argument can be made to target resources toward LEP students.
Specific findings on the disadvantages of LEP students include the following:
LEP students are much more likely than other public school students to attendhigh-poverty schools, and tend to be concentrated in particular schools. Aboutthree-fourths of all LEP students attend high-poverty schools. In contrast, onlyabout one-third of English proficient (EP) students attend high-poverty schools.
LEP students attend schools where the average LEP concentration is about 25percent; in contrast, EP students attend schools where the average LEPconcentration is less than 5 percent. There is also a very strong relationshipbetween school LEP concentration and school poverty. Of schools with LEPconcentrations above 25 percent, almost all are high-poverty schools.
Compared to parents of low-income English proficient students, parents of low-income LEP students on average have much lower levels of education. Less than40 percent of parents of low-income LEP students have a high school education,compared to about 75 percent of parents of low-income EP students.
More than 40 percent of LEP students' parents report a poor command of English.Further, more than 60 percent of LEP students' parents say that a language otherthan English is spoken in their home most of the time. These students musttherefore rely heavily on schools for help in learning English.
ABT ASSOCIATE'S INC. v
20
EXECUTIVE SUMMARY
Parents of low-income LEP students are less likely than parents of low-income EPstudents and parents of higher-income students to participate in activities at theirchildren's school, perhaps because of language barriers or cultural differences.
Low-income LEP students change schools more often than low-income EPstudents and higher-income students.
At the same time, there are at least two positive background indicators for LEP students
compared to other low-income students. These are:
Low-income LEP students are more likely than low-income EP students to comefrom two-parent households.
Parents of low-income LEP students are more likely than parents of other low-income students to talk to their child at least once a week about future plans andgoals.
The Prospects study does not include an independent assessment of the student's
proficiency in English. As a result, this report relies heavily on teacher judgements of student
proficiency. The survey instrument did not require teachers to respond to this question for every
student, and the specific question asking about a student's proficiency does not specify the
context (e.g., "as compared to other students in your class").
The analysis in this report indicates that the teacher judgements of proficiency provide a
valid measure of student proficiency. However, given the dependence of this measure on survey
data, as detailed in this report, there is likely to be some slippage between the teacher report and
the child's actual level of proficiency at both absolute and relative levels. While due to cost and
other factors, such constraints are not uncommon in large scale studies, the data should be
interpreted with the nature of the measurement kept in mind.
EDUCATIONAL SERVICES FOR LEP STUDENTS
Three overarching research questions arise concerning the educational services received
by limited English proficient students:
(1) Are educational services responsive to the special needs of LEP students?
ABT ASSOCIATES INC. vi
21
EXECUTIVE SUMMARY
(2) Do LEP students receive the same quality of educational inputs as EP students?and
(3) Do LEP students receive the same level of instructional content as EP students?
Educational services, along with the home resources of LEP students summarized above, have
a major influence on the educational outcomes of LEP students.
Are educational services responsive to the special needs of LEP Students?
Several school-wide measures of support at the schools LEP students attend are
encouraging:
ESL/BE instructional programs are available in students' grade level at 83 to 91percent of LEP students' schools;
Around 60 percent of LEP students' principals have received training in theeducation of limited English proficient students within the past three years;
Over three-fourths of LEP students' schools have a policy to integrate LEP andEP students for academic subjects, and 95 percent integrate LEP and EP studentsduring non-instructional times; and
Over 90 percent of LEP students' schools provide translation in at least onelanguage other than English for parent/school meetings.
These figures represent an important beginning for a public school system that seeks to
support and nurture all students with limited English proficiency. However, these indicators do
not tell us how many of the LEP students in a particular school benefit from the favorable
practices known to exist somewhere in the school.
A substantial proportion of LEP students' teachers and classroom aides have qualifications
that indicate special training for instructing LEP students, but there appears to be ample room for
increasing the training of LEP students' teachers:
About one-third to one-half of LEP students' regular teachers have a backgroundor training indicating understanding and skills in teaching LEP students, asmeasured by certification in ESL and/or BE instruction or self-reported proficiencyin the predominant non-English language of LM-LEP students in their classrooms.
ABT ASSOCIATES INC. vii
2 2
EXECUTIVE SUMMARY
Of the LEP students with classroom aides, about four-fifths have an aide proficientin the predominant non-English language of the LM-LEP students in their class.
Most students identified as being limited English proficient are provided English-as-a-
second language or bilingual education instruction. Furthermore, consistent with the findings
discussed above that LEP students tend to attend high-poverty schools, about half participate in
supplementary math and reading/English/language arts instruction:
Between 80 and 90 percent of the students identified as limited English proficientin a particular year participated in an ESL and/or bilingual instructional programthat year.
The lower a teacher's assessment of a LEP student's English proficiency in thefirst year, the more subsequent years of ESL/bilingual instructional services thatthe student is likely to receive. For example, 67 percent of LEP students who arerated as having poor or no English understanding proficiency in the 3rd grade(1990-91 year) receive ESL/bilingual instructional services the following threeyears, whereas only 10 percent of LEP students rated as having excellent Englishunderstanding proficiency receive these services the following three years. Inother words, a perceived need for language assistance in the first year of our studyis highly correlated with receipt of special language-related services in subsequentyears.
In addition, an average of about 50 percent of LEP students participated insupplementary instruction in reading/English/language arts, while a slightly lowerproportion participated in supplementary math instruction.
The Chapter 1 program is the primary source of funding for both supplemental math and
reading/English/language arts instruction, and a substantial source of funding for ESL/BE
instructional services.
Do LEP students receive the same quality of educational inputs as EP students?
This study addresses many quantifiable measures relating to the qualifications of
instructors, type of instruction, materials used in instruction, and the setting in which instruction
is provided. However, issues related to the quality of the actual instruction provided to limited
English proficient students remain an important area for future evaluation.
LEP and EP students from high-poverty schools have regular classroom teacherswith similar teaching qualifications, as measured by their educational attainment
ABT ASSOCIATES INC. viii
2 3
EXECUTIVE SUMMARY
and acquisition of permanent teaching certificates. However, LEP students'teachers are somewhat less experienced: more have fewer than ten years ofexperience, and more are in their first year of teaching.
Even after controlling for the high-poverty status of a school, LEP students onaverage are in larger classes than their EP counterparts. However, the averageclass size for LEP students can be misleading because LEP students are morelikely than EP students to be in larger classes and smaller classes.
LEP students are also more likely than EP students to be grouped inreading/English/ language arts classes based on ability, which based on the natureof instruction and its relation to the broader school could be either detrimental totheir progress (if it results in lower expectations) or beneficial in meeting theirparticular English language instruction needs.
Based on measures of the availability of instructional materials, LEP and EPstudents in high-poverty schools appear to have similar physical resourcesavailable to their classroom teachers, although LEP students do appear to be inclasses with slightly better access to computers.
Do LEP students receive the same level of instructional content as EP students?
The skills emphasized by LEP and EP students' regular reading/English/language arts
teachers are similar. To the extent that this measure accurately describes the curriculum taught
to LEP students, this is an encouraging finding that indicates LEP students' limited English
language proficiency may not be seriously constraining the content taught to them. One
exception to this generalization is that LEP students in the 3rd grade in 1994 were more likely
to have teachers who placed moderate rather than major emphasis on reading skills. A second
exception is that LEP students' 6th grade teachers were more likely to place major emphasis on
writing proficiency skills than EP students' teachers. This may indicate that by the 6th grade,
LEP students are ready for basic writing instruction and yet more in need of those skills than
their EP peers.
The instructional emphasis of LEP and EP students' math teachers is also similar within
high-poverty schools, with the exception that EP students' math teachers place somewhat more
emphasis on basic math skills than LEP students' teachers.
ABT ASSOCL4TES INC. ix
2 4
EXECUTIVE SUMMARY
Finally, in 1994, four out of every five 3rd grade LEP students were in regular math and
reading classes where teachers used the same English and non-English instructional materials for
both EP and LEP students. This share increased to nine out of every ten 6th grade LEP students
in that year.
FINDINGS RELATED TO EDUCATIONAL OUTCOMES FOR LEP STUDENTS
Overall, the evidence on educational outcomes, in light of the earlier evidence on the
initial disadvantages faced by LEP students relative to English proficient students, suggests that
LEP students and their schools are able to overcome many obstacles to educational progress. At
the same time, it is important to keep in mind that the comparison group here is other low-income
students. As documented in another recent report from the Prospects study (Puma, et al. 1996),
low-income studentswhether LEP or EPconsistently perform worse than higher-income
students.
Specific findings related to LEP student outcomes include the following:
Overall, after controlling for economic differences between LEP and EP students,the math achievement levels of LEP studentsas measured by test scoresare notso different from those of EP students. LEP exiters in the 1st grade cohortgenerally had higher math test scores than EP students. Further, while somegroups of low-income LEP students had lower initial test scores than low-incomeEP students, there is evidence of catch-up; that is, LEP students' scores movecloser to those of EP students over time. These same general results obtained forreading test scores, although the sample included in the reading score analysis wassomewhat less representative (because it did not include students who took theSpanish language version of the test).
In general, for all the outcomes examined in this chapterEnglish proficiency,reading test scores, math test scores, and grade retentionstudents who developadequate levels of English language proficiency to exit LEP status have morefavorable test and grade promotion outcomes than students with lower levels ofEnglish proficiency.
Further, differences between LEP exiters and students who are LEP in every yearbegin with the first year observed. This suggests that LEP exiters may beginschool with certain advantages over other LEP students and that these non-school
ABT ASSOCIATES INC. X
2 5
EXECUTIVE SUMMARY
factors may play a role in their continued higher achievement. To put it anotherway, where LEP students end up appears to depend strongly on where they start.The results also suggest that LEP students are a heterogeneous group.
We find no clear evidence that LEP students are retained in grade any more orless often than EP students at these grade levels.
ABT ASSOCIATES INC. xi
2 6
CHAPTER I: DEFINING THE LEP POPULATION
CHAPTER I
DEFINING THE LEP POPULATION
Children with limited English proficiency make up an important and growing share of the
students in U.S. public schools. These studentsmany of them foreign-born and/or the children
of recent non-English-speaking immigrantsare expected to acquire the skills and knowledge that
define the public school curriculum while at the same time mastering English as a second
language. The challenge this poses to both students and schools has led to a number of
educational responses (e.g., the spread of Bilingual Education and English-as-a-Second-Language
(ESL) instructional practices, federal Title VII funding for supplemental language instruction) and
a good deal of research.'
As a reflection of the importance attached to successfully educating children whose native
language is not English, the U.S. Department of Education's longitudinal study of Chapter 1
assistance, Prospects, includes a component devoted to the analysis of limited English proficient
(LEP) students.' The current report is the second of two focused on this population. A cross-
sectional description of LEP students and their educational services during the 1991-1992 school
year appears in Puma and Moss (1995). That analysis is extended here by examining the
background characteristics, educational experiences, and academic outcomes of LEP students
during the full four years of the Prospects study, from the school year ending in 1991 to the
school year ending in 1994. We track a nationally-representative cohort of 1st grade students,
and a separate nationally-representative cohort of 3rd grade students, through the elementary
school years (grades 1 to 6) to document the experience of LEP students and contrast it with that
See, for example, Ramirez et al. (1991), Stanford Working Group (1993), Fleischman and Hopstock (1993),and Moss and Puma (1995). Valuable overviews of research on the LEP population appear in Lam (1992) andGonzalez and Maez (1995).
2 Chapter 1 is the primary federal program of assistance for educating disadvantaged students, renamed TitleI in 1994. Prospects' special focus on LEP students was made possible through added data collection funded bythe Department of Education's Office of Bilingual Education and Minority Languages Affairs (OBEMLA).
ABT ASSOCIATES INC. 1-1
2 7
CHAPTER 1: DEFINING THE LEP POPULATION
of English proficient students.' While the analysis includes an assessment of how far LEP
children progress academically during those years, because of resource constraints we do not
attempt to attribute academic progress to specific types of instructional services nor to individual
school or student characteristics. While clearly worthy of study using the Prospects data,
resource constraints leave the question of which instructional practices and school environments
lead to the best student outcomes lies beyond the scope of this analysis.
The report is divided into four chapters. The remainder of Chapter 1 examines the
percentage of students who have limited proficiency in English during the primary school years,
by grade level. This sets the stage for later chapters of the report. Chapter 2 then examines the
non-school characteristics of LEP children in relation to their English proficient peers: their
demographic and language backgrounds, family circumstances (economic and other), and at-home
educational supports. The instructional services provided to LEP students by the nation's public
elementary schools are profiled in Chapter 3 and, where possible, contrasted with services
provided to English proficient students. Chapter 4 completes the picture by documenting the
educational outcomes of LEP studentsoverall and in relation to their English proficient
peersincluding teachers' ratings of English proficiency, standardized test scores, and retention
in grade.
Overview of the Chapter
Our purpose in this initial chapter is to document the percentage of LEP students in U.S.
public schools during each elementary school year (1st through 6th grade)4 and to identify
individual LEP students in the Prospects data set for later analysis. While we touch on important
substantive questions along the way (e.g., which LEP students receive special instructional
services, how many go unidentified in the early years of grade school), our primary goal in this
chapter is to define and identifi, the LEP population that will be the focus of the rest of the
3 The Prospects data do not include a sufficient number of LEP students in the 7th grade cohort to extend theanalysis past the 6th grade. Data on the 1st grade cohort cover only three school years, those ending in 1992, 1993,and 1994. See Appendix B for a full description of the Prospects study design.
This study follows a fixed sample of students over time. This means that the sample is fully representativeof students in the first year for each cohort, but does not take into account later entrants. This issue is explainedin more detail below.
ABT ASSOCIATES INC. 1-2
CHAPTER 1: DEFINING THE LEP POPULATION
report. As explained in more detail below, we are forced to develop our own, research-based
criteria for categorizing students as limited English proficient, since no standard national
definition exists.
We begin the next section with a summary of the legal requirements for providing
instructional services to LEP students. This background provides context for our approach to
identifying LEP students as described in this chapter and the analysis of instructional services
provided to LEP students in Chapter 3. In the following section, we describe the sample to be
analyzed and the measures of limited English proficiency available from the Prospects data,
including their limitations. Using these measures, we then describe the overall size of the LEP
group in each year, and show the proportions of this group reported as LEP in all observed years.
Attention then focuses on the two broad categories of LEP students identifiable in our data: those
perceived by school staff as having limited proficiency in English and those reported as receiving
ESL and/or Bilingual Education services. We show which students fit in both or only one of
these categories at some point during the observation period and provide analogous information
for each of the more detailed criteria used to identify LEP status (e.g., ability to be tested in
English, receipt of specific types of language instruction). This information provides an overall
picture of the relative importance of the various criteria in defining the LEP population for this
study.
We then turn to a more dynamic perspective, analyzing how perceptions of limited
English proficiency and receipt of LEP-related services change over time for those students who
meet our LEP criteria at some point. Next, we look more closely at transitions in and out of the
identified LEP group from year to year. Here, we focus on LEP entrantsthe students who do
not meet any LEP criteria until after the first year of observationand LEP exitersstudents
who are in the LEP group initially but later do not meet any LEP criteria. The sizes and
characteristics of these groups help to provide a sense of how dynamic the LEP population is
during the observation period. A final section of the chapter draws on the earlier analyses to
identify specific subsets of students, both LEP and English proficient, for further analysis in the
remainder of the report.
29ABT ASSOCIATE'S INC. 1-3
CHAPTER 1: DEFINING THE LEP POPULATION
LEGAL CONTEXT FOR PROVISION OF SERVICES TO LEP STUDENTS
There are two primary sources of legal requirements for providing educational services
to LEP students: federal civil rights laws, and state-level statutes.'
Title VI of the 1964 Civil Rights Act, which prohibits discrimination on the basis of
national origin by any entity receiving Federal funds,' and the Equal Education Opportunities
Act of 1974 are the basis for several court decisions requiring special instructional services to
students who are limited English proficient. The most prominent court decision on the rights of
LEP students, and the only such ruling by the U.S. Supreme Court, is Lau v. Nichols (1974).
Justice William Douglas wrote:
There is no equality of treatment merely by providing students with the samefacilities, textbooks, teachers, and curriculum; for students who do not understandEnglish are effectively foreclosedfrom any meaningful education. (Crawford 1995,p. 4.5)
The ruling entitled students covered by the lawsuit to special assistance to enable them to
participate equally in school programs. The ruling supported the former Department of Health,
Education, and Welfare's Office for Civil Rights (OCR) May 25th, 1970 memorandum that
explicitly discussed school districts' responsibilities for providing equal education opportunities
for limited-English proficient students. OCR's May 25th memorandum advised school districts
that:
5 See Crawford (1995) for a more in-depth discussion of federal policy and legal requirements for providingeducational services to LEP students.
6 Most school districts receive federal money through the Chapter 1 (now Title I) program. This programprovides funds for supplemental educational services for children who are educationally deprived due to being froma low-income family or community, criteria met by most LEP students. Although primarily a source of fundingfor supplemental reading and math, Chapter 1/Title I is an important source of funding for supplemental instructionof LEP students (see Chapter 3 of this report). Eligibility rules for Chapter 1 do not mandate specific instructionalmethodologies for teaching LEP students. The Chapter 1 law, in effect during the Prospects study period, requiredthat programs distinguish between educational deprivation and limited English proficiency when determiningeligibility for programming. Title I, adopted as part of the Improving America's Schools Act of 1994, eliminatesthis distinction, so that even more limited English proficient students are likely to benefit from supplementalinstruction from this funding source (Anstrom 1995 and Hoff 1997).
ABT ASSOCIATES INC. 1-4
3 0
CHAPTER 1: DEFINING THE LEP POPULATION
Where the inability to speak and understand the English language excludesnational origin minority group students from effective participation in theeducational program offered by a school district, the district must take affirmativesteps to rectib) the language deficiency in order to open its instructional programto these students.
When investigating complaints and conducting Title VI compliance reviews for LEP
students, the Department of Education's Office for Civil Rights first determines whether language
minority students are able to participate effectively in the regular instructional program. If
language minority students are not able to effectively participate, the school district has a
responsibility to identify students whose lack of English language skills precludes them from
effective participation and to provide them with instruction that will enable them to: acquire
English language skills, and master the content knowledge and skills that are being taught to all
children. School districts have a great deal of flexibility in developing and implementing
alternative language programs to meet the needs of their LEP students.
In considering whether there is a need for a school district to provide an alternative
language program and whether the program is likely to be effective, factors that OCR is likely
to examine include whether:
The district has identified all LEP students who need special language assistance;
The district has ensured the placement of LEP students in appropriate programs;
All LEP students who need a special language assistance program are beingprovided such a program;
The district has taken steps to modify a program for LEP students when thatprogram is not working;
The district ensures that LEP students are not mis-assigned to classes for studentswith disabilities because of their inability to speak and understand English; and
The district ensures that parents who are not proficient in English are providedwith appropriate and sufficient information about all school activities.
31 ABT ASSOCIATES INC. 1-5
CHAPTER 1: DEFINING THE LEP POPULATION
In reviewing alternative programs, OCR also considers the following questions:
Is the alternative program based upon an educational theory that is recognized assound or as a legitimate experimental theory by some experts in the field?
Are the programs and practices reasonably calculated to implement effectively theeducational theory adopted?
Has the alternative program succeeded, after a reasonable period of time, inproducing results indicating that students' language barriers are actually beingovercome, and if not, has the program been appropriately modified?
These questions are based upon the analysis in Castenada v. Pickard, 658 F.2d 989 (5th
Cir. 1981) which OCR adopted in its September 27, 1991 policy memorandum entitled "Update
on Schools' Obligation Towards National Origin Minority Students with Limited-English-
Proficiency."
In addition to the general requirements for all school districts inherent in the Title VI
compliance review, local court decisions affect the provision of services in certain school districts.
For example, a lawsuit brought by Aspira, a Puerto Rican advocacy group, against the City of
New York in 1974, resulted in a ruling guaranteeing bilingual instruction for LEP students whose
native language is Spanish.
The second source of legal requirements for provision of instructional services to LEP
students is state statutes. A majority of states have passed laws explicitly permitting native-
language instruction, about 20 percent of states require bilingual education under certain
circumstances. A few states have laws prohibiting instruction in a language other than English,
but Crawford (1995, p.42) states that the English-only laws are no longer enforced.
In summary, the legal requirements for providing instructional services for LEP students
during the Prospects study period are as follows:
To comply with Title VI of the Civil Rights Act, school districts receiving anyfederal funding are required to have procedures to identify LEP students,accurately assess their English-language skills for appropriate placement, andcompetently provide special assistance to LEP students that will allow LEPstudents the same access to educational services as English proficient students.
ABT ASSOCIATES INC. 1-6
CHAPTER 1: DEFINING THE LEP POPULATION
The type of special assistance to LEP students required for compliance with TitleVI is not prescribed, but court decisions have guaranteed specific instructionalmethodologies (e.g., bilingual education) for LEP students in some school districts.
Some state statutes mandate bilingual education services for LEP students undercertain circumstances.
While most schools receive some federal funds, school districts not receivingfederal funding are not required by Title VI of the Civil Rights Act to provide anyspecial assistance to LEP students.
THE LEP INDICATOR VARIABLES
Throughout the chapter, we apply the broadest possible definition of limited English
proficiency as the starting point for examining the LEP population. Thus, a student is classified
as LEP in a given year if the Prospects data indicate:
Receipt of special services due to a student's limited English proficiency;or
A perception on the part of school staff that the student has limitedproficiency in English.
Thus, either the receipt of special services or the perception that special services might be
appropriate qualifies a student for inclusion in the LEP sample.
Our use of receipt of special services, such as ESL/BE services, as an indication that a
student is limited English proficient is supported by findings reported in the Prospects Interim
LEP Report (Moss and Puma, 1995) on the procedures schools use to determine entry into and
exit from ESL/Bilingual programs. Moss and Puma found that almost all schools attended by
LEP students in 1991-92 used multiple indicators of English proficiency skills for entry and exit
decisions, usually including objective tests of English and cognitive proficiency. Furthermore,
about 85 percent of LEP students attended schools that used four or more indicators for entry and
exit decisions. In both cohorts, the most common indicators used for entry into ESL/BE services
are (in order of usage): English tests of oral and/or aural proficiency, home surveys of non-
English use, non-English tests of oral and/or aural proficiency, assessments of English reading
proficiency, and assessments of non-English reading proficiency. Schools rely even more heavily
3 3ABT ASSOCIA7ES INC. 1-7
CHAPTER 1: DEFINING THE LEP POPULATION
on tests in English for determining exit from ESL/BE services. The most common indicators for
exit from ESL/BE services are: tests of English oral/aural proficiency, tests of English reading
proficiency, achievement tests in content subjects conducted in English, teacher judgements, and
input from parents.
Because we do not have Prospects data on some of the most common indicators schools
use for placement into and out of ESL/BE programs, we developed other procedures for
identifying LEP students. The first general indicator we use to identify LEP students is receipt
of ESL/BE services. That is, we take the outcome of a school's assessment of a student's
English language proficiencywhether or not a student receives ESL/BE servicesas an
indicator of whether the student is limited English proficient.
As stated at the beginning of this section, we also use teacher judgements of students'
English proficiency as an indicator of students' proficiency status. We use this additional
indicator of students' English proficiency for several reasons: a student may be receiving special
assistance due to limited English proficiency that the school does not classify as ESL/BE
instruction, some schools may not provide special assistance to LEP students (see the section
above on legal requirements), and we may have missing or erroneous data on whether or not a
student receives special LEP-related services.
While not ideal from the standpoint of educational practice, nor equivalent to an in-depth
assessment of actual English language abilities for each child, this "working definition" of the
LEP population is the best one available from the data. Not only are the Prospects data limited
in how well they measure actual language proficiency, there are no generally recognized standards
for what level of proficiency constitutes "limited English proficiency." Each state has its own
definition (see Cheung and Solomon 1991), and how a definition is implemented is likely to vary
within a state. In light of this situation, we choose to categorize a student as LEP when any of
the indicators available to us in the data suggest that she or he might have limited proficiency in
English. This broad definition allows us to examine the interaction between perceived language
ABT ASSOCIATES INC. 1-8
3 4
CHAPTER 1: DEFINING THE LEP POPULATION
needs and the receipt of LEP-related services when defining the subset of students for whom
limited English language proficiency has some sort of special significance.'
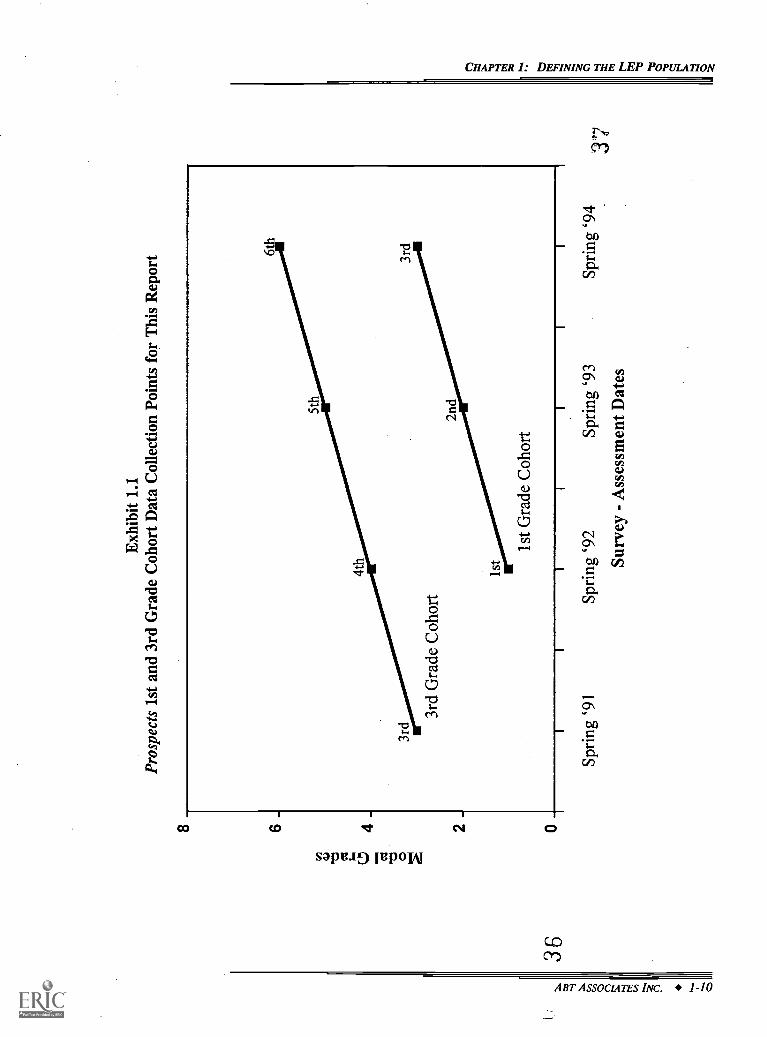
Most of the analysis in this chapter is based on the individuals who are part of the LEP
group, so defined, at some point during the observation period, i.e., those students who are
classified as LEP in one or more of the years in which they are observed. Exhibit 1.1 shows the
grade level and year that students included in this report were assessed in the Prospects study (see
Appendix B for a full description of the sample design). A nationally-representative cohort of
1st grade students is observed for three years (1992-1994), while a separate nationally-
representative cohort of 3rd grade students is observed for four years (1991-1994). For both
groups, we restrict our attention to those individuals who are in the Prospects database throughout
the follow-up period, excluding students who move out of the study schools and are not
followed.' As a result of these selection rules, the LEP analysis sample in this chapter includes:
Students in the 1st grade cohort who meet one or more of the LEP criteria ineither 1st, 2nd, or 3rd grade, and who are in the Prospects database in all threeyears; and
Students in the 3rd grade cohort who meet one or more of the LEP criteria in anyof grades three through six, and who are in the Prospects database in all fouryears.
Several variables in the Prospects data set identify students who received LEP-related
services.' These variables indicate whether a student was:
More graduated defmitions of limited English proficiency could also be considered, to differentiate amongstudents with different levels of English language ability within the overall LEP group. We rejected this course forseveral reasons: (i) we do not have sufficient faith in any of the individual LEP indicator variables used to rely onthem as the basis for making fine-tuned distinctions regarding the degree of language ability; (ii) adopting multiplecategories of LEP students would substantially complicate later analyses, where just maintaining an overall two-waydistinction between LEP and non-LEP generates a large number of numbers to be considered; and (iii) the inclusionof all possible gradations of "LEPness" that accompanies our broad "LEP/not LEP" dichotomy conforms best tothe goal of considering in this report everyone for whom English language proficiency has some sort of specialsignificance.
8 All numbers presented in this report are weighted to take into account students who moved. We followed arandom sample of students who moved, and weighted these students so that they represent all movers. Thisprocedure ensures that movers do not bias our sample.
9 See Appendix A for the exact wording of the questions used to collect these variables.
ABT ASSOCIATES INC. 1-9
35
36
Exh
ibit
1.1
Pros
pect
s 1s
t and
3rd
Gra
de C
ohor
t Dat
a C
olle
ctio
n Po
ints
for
Thi
s R
epor
t
Surv
ey -
Ass
essm
ent D
ates
37
CHAPTER 1: DEFINING THE LEP POPULATION
Reported (by her/his primary teacher) as having received ESL instruction;
Reported (by her/his primary teacher) as having received Bilingual Educationinstruction;
Reported (by her/his primary teacher) as having received special services of anunspecified type due to limited English proficiency;
Listed in school records as receiving ESL or Bilingual Education instruction;and/or
Associated with a specific ESL and/or Bilingual Education teacher (other than theregular or Chapter 1 teacher) when the Prospects study sought to collect additionalinformation from teachers.'°
Of these five variables, school records of the receipt of ESL or Bilingual Education
instruction should encompass the most students, for two reasons. First, unlike the earlier teacher-
reported variables on the list, this indicator includes both ESL and Bilingual Education services
in one place, which cannot be separated in our abstracts from school records. The school records
indicator is also the only LEP variable that covers the entire school year; all of the other
indicatorsincluding those related to school staff perceptionsapply to the point in time when
data were collected for the Prospects study (in the spring of each year).
Though less comprehensive, teacher reports of receipt of special services are important
to distinguish between ESL and Bilingual Education instruction and, potentially, to identify
recipients of ESL and Bilingual Education services not documented by abstracts from school
records. Association with a particular ESL and/or Bilingual Education teacher during Prospects
data collection provides an additional opportunity to identify recipients of LEP-related services
who may have been overlooked by the other four measures."
Perceptions of limited English proficiency are indicated by three variables provided by
school staff during each year of the study:'2
'° This indicator is not available for the 1994 school year.
" Association with a bilingual education teacher, however, does not imply that a student is LEP, because itencompasses native English speakers in two-way bilingual programs. Consequently, this criterion alone was notsufficient to categorize a student as LEP for purposes of this study. See Appendix A for more details.
12 See Appendix A for the exact wording of the questions used to collect these variables.
ABT ASSOCIATES INC. 1-11
CHAPTER I: DEFINING THE LEP POPULATION
Did the student's primary teacher consider him or her to be limited Englishproficient?
Did the school consider the student unsuitable for testing in either English orSpanish when Prospects administered a standardized achievement test for reasonsof English language proficiency?
Did the school prefer testing in Spanish rather than English when Prospectsadministered a standardized achievement test?
Schools were urged to allow testing of all students in English (using McGraw-Hill's CTBS test
instrument) or, failing that, in Spanish (using McGraw-Hill's SABE instrument)."
It is not clear how exacting primary teachers were in classifying students as limited
English proficient. They were simply asked (on the Student Profile) whether the student was
"limited-English-proficient," with no defmition stated in the question. This would seem to allow
for a range of definitions of LEP, from broad to narrow, depending on the teacher. A narrow
definition was intended, however, since instructions at the beginning of the questionnaire defined
LEP students as those "whose native language is other than English and whose skills in listening
to, spealdng, reading, or writing English are such that he/she derives little benefit from school
instruction in English." Data presented later in the chapter show that teacher designation as LEP
occurred more frequently than the other two indicators of perceived LEP status, perhaps
suggesting that some teachers adopted a fairly broad or more reliable definition of "limited-
English-proficient."
IMPUTATION OF MISSING DATA
Large scale survey studies, particularly those conducted over a period of several years
typically have substantial amounts of missing data. This is the result of individuals who move
13 These and other data collection instruments from the Prospects study are described in Appendix B, anoverview of the Prospects study design.
ABT ASSOCIATES INC. 1-12
3 9
CHAPTER 1: DEFINING THE LEP POPULATION
out of the scope of the study, a respondent's refusal to fill out a survey at one or more points
during the repeated data collections, nonresponse to specific survey questions, or other factors.
Often the missing data is disproportionately concentrated in particular parts of the group
being studied. For example, in many studies, LEP students have been excluded, or only those
LEP students with higher levels of English language have been included. For some variables in
the Prospects study, there were substantial levels of missing data for some of the variables that
are important for analyzing the education of limited English proficient students.
When data is not missing at random, analysis of the raw data or of weighted data that
does not take this into account often leads to seriously misleading analyses and results.
To avoid this problem, this studylike most large scale longitudinal studieshas used
imputed data. (See Appendices A, D, and I for details.) Like most surveys, the instruments for
this study included instructions for respondents to skip certain questions that did not apply to
them. The imputation procedures included filling in these legitimate skips with data values
consistent with other information in the survey. This type of imputation was done for the survey
question on teachers' judgements of LEP students' English proficiency. Because of the way the
questions were asked and the amount of imputation, there is some uncertainty about the
percentage of LEP students judged to have "excellent" English proficiency (see Appendix I).
While the data can identify the likely range, we cannot pinpoint it exactly within that range.
While great caution was used in developing and assessing the imputation quality, the
procedure necessarily rests on various methodological assumptions. In some cases the imputation
had little or no impact on the patterns found in the analytic data set as compared to the raw data.
In a few cases the imputation leads to substantial changes. (For example, see the discussion in
Appendix I and Exhibit 1.1 in particular.) Although the imputation results have been verified
through comparisons with the raw data, analysis of covariation with related variables and other
procedures, there is necessarily a level of ambiguity regarding where in this range the actual
underlying value of a variable falls. As in any other report, the results should be read keeping
in mind the possible impacts of missing data and imputation on findings.
ABT ASSOCIATES INC. 1-13
4 0
CHAPTER 1: DEFINING THE LEP POPULATION
OVERALL LEP STATUS, BY COHORT AND YEAR
We begin by calculating the size of the overall LEP population. Exhibit 1.2 shows the
percent of all students in the sample (from unweighted data) and in the population of all U.S.
public school students (from weighted data) classified as LEP by one or more of the eight
indicator variables listed above, by cohort and year.'4 As can be seen from the final row listed
for each cohort in Exhibit 1.2, about 18 percent of the sample andfollowing
weighting-9 percent of the nation's population of public school students are categorized as LEP
at some point in the follow-up period. This is the group of central interest in this report.'
For both cohorts, the percent of students identified as LEP in any of the three (or four)
years of the study-9 percentis substantially higher than the percent of students identified as
LEP in any single yearabout 6.5 percent on average. This is because students leave LEP status
over time.' Thus the population of students who are of concern to policy makers is
substantially larger than estimates based on a point in time.
Looking down the columns in Exhibit 1.2, we see a gradual decline in the percentage of
students in the LEP group across grade levels, from 7.6 percent of the public school population
in the 1st grade to 5.6 percent in the 6th grade (a decline across cohorts of about 25 percent in
the number of LEP students). Both the decline and its gradual nature are expected: some
number of students should acquire full proficiency in English for the first time in any given year,
though many students will not, taking instead several years to reach this major learning milestone.
14 The figures in Exhibit 1.2 and elsewhere in the chapter are based on edited data. Missing values for aparticular LEP indicator are replaced by imputed values, following procedures described in Appendix A.Appendix C shows the percentage of cases affected by these procedures, which is generally small.
15 Ideally, we would like to broaden our focus to include students who meet our LEP criteria in other yearsoutside those covered by the Prospects data. This would be particularly useful for students in the third grade cohortwho may have met one or more criteria in earlier grades but no longer do so by the time we observe them. Dataon English proficiency and receipt of special services in the years prior to sample entry are too limited to makedistinctions between "previously LEP" and "never LEP" students on this basis.
16 Other research indicates that, on average, it takes five to ten years for non-native speakers of English todevelop enough proficiency to catch up with their native-English speaking peers (Thomas and Collier 1997; Collier1995; Cummins, 1981).
ABT ASSOCIATES INC. 1-14
41
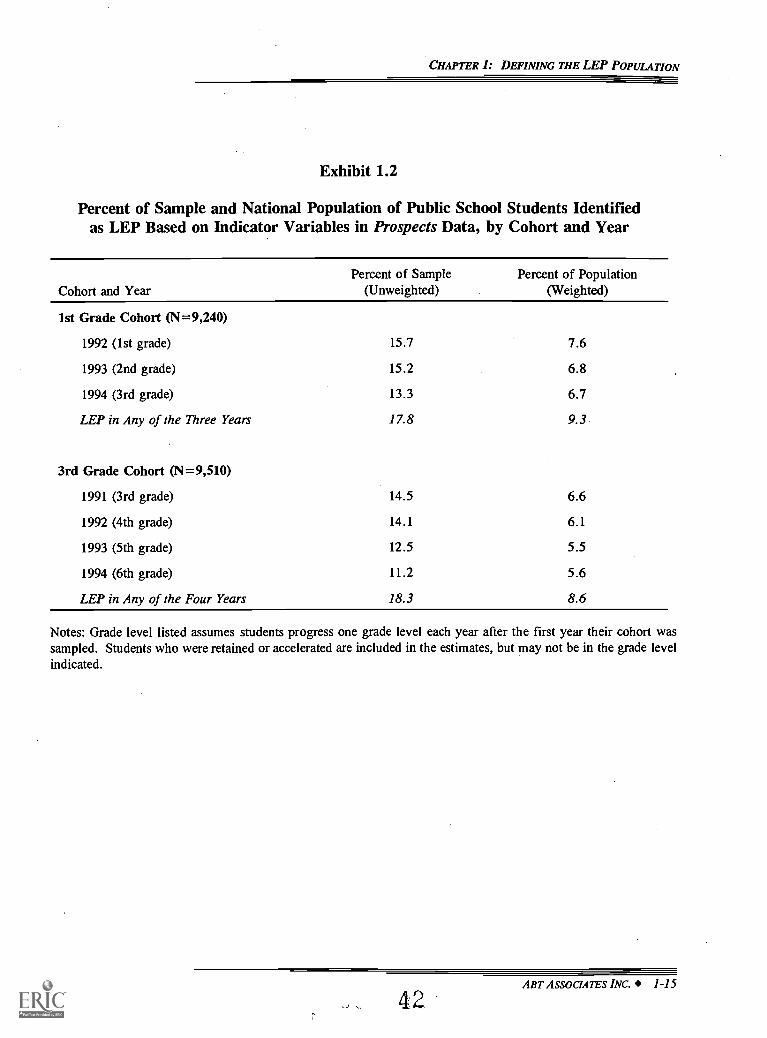
CHAPTER 1: DEFINING THE LEP POPULATION
Exhibit 1.2
Percent of Sample and National Population of Public School Students Identifiedas LEP Based on Indicator Variables in Prospects Data, by Cohort and Year
Cohort and YearPercent of Sample
(Unweighted)Percent of Population
(Weighted)
1st Grade Cohort (N=9,240)
1992 (1st grade) 15.7 7.6
1993 (2nd grade) 15.2 6.8
1994 (3rd grade) 13.3 6.7
LEP in Any of the Three Years 17.8 9.3
3rd Grade Cohort (N=9,510)
1991 (3rd grade) 14.5 6.6
1992 (4th grade) 14.1 6.1
1993 (5th grade) 12.5 5.5
1994 (6th grade) 11.2 5.6
LEP in Any of the Four Years 18.3 8.6
Notes: Grade level listed assumes students progress one grade level each year after the first year their cohort wassampled. Students who were retained or accelerated are included in the estimates, but may not be in the grade levelindicated.
ABT ASSOCIATES INC. 1-15
42
CHAPTER 1: DEFINING THE LEP POPULATION
Thus, we would expect still further declines in later years (i.e., past 6th grade), though we cannot
follow any students that far in the available data.
Our estimates of the LEP population by grade are consistent with other estimates for the
same time period." Fleischman and Hopstock (1993, p.10) report that 7.9 percent of first
graders were LEP in the fall of 1991 compared to our estimate of 7.6 percent in the spring of
1992.18'19 Similarly, Fleischman and Hopstock report 6.0 percent of third graders were LEP
in the fall of 1991, compared to our estimate of 6.1 percent in the spring of 1991. Their estimates
for elementary school students in the fall of 1991 also show a decline in the percent of LEP
students at higher grade levels similar to the decline in our estimates. Overall, these results are
closer than might be expected given the different methodologies."
Other sources of estimates of the LEP population for the same time period do not report
their estimates by grade level, and hence are not strictly comparable to our estimates, but
nevertheless appear generally consistent with our estimates. For example, Han et al. (1997, p.8),
using data from the national Schools and Staffmg Survey, estimate that 6 percent of elementary
school students are limited English proficient in the 1993-94 academic year. Averaging the
grade-level data from the two Prospects cohorts over the 1991 to 1994 period results in a
comparable estimate of 6.4 percent of elementary school students being LEP. Based on 1990
Decennial Census data on households, GAO (1994, p.34) reports that 5.2 percent of five to
17 See Hopstock and Bucaro (1993) for a summary of estimates of the LEP student population.
18 The spring of 1992 is the first date that data on our LEP indicators are available for the 1st grade cohort,whereas data are available for the 3rd grade cohort starting in the spring of 1991 (see Exhibit 1.1).
19 Although Prospects surveys were administered in the spring, the LEP indicator variable from school records,receipt of ESL/BE services, refer to the student's status at any time during the academic year.
20 The Prospects study follows two groups of students over a three (1st grade cohort from 1992 to 1994) or fouryear period (3rd grade cohort from 1991 to 1994), while Fleischman and Hopstock examine each different gradecohort for the same year, 1991. In addition, our estimates are from surveys administered by on-site interviewersto teachers and school staff on the status of individual students, whereas Fleischman and Hopstock's estimates arefrom a mail survey of LEP coordinators (or their equivalents) at local school districts on the aggregate percent ofstudents who are limited English proficient in each grade.
ABT ASSOCIATE'S INC. 1-16
4 3
CHAPTER 1: DEFINING THE LEP POPULATION
seventeen-year-olds are LEP, but they do not report grade- or age-specific estimates to compare
to our estimates for elementary school grades.2'
In looking at patterns over time, we adopt the convention in this report of labeling each
year's results as though all students remained on grade level throughout the follow-up period.
For example, that we call the third year of follow-up for the 1st grade cohort "3rd grade," even
though some of the students in that cohort may be in 2nd grade in that year, i.e., they did not
advance on grade level during 1st or 2nd grade. We should also note that in longitudinal samples
of this sort, later years of data are not fully representative of the grade level to which they
pertain. Thus, for example, 1994 data for the 1st grade cohort do not represent all public school
3rd graders in the nation even with universal advancement on grade level, since some number
of students enter U.S. public schools between the 1st and 3rd grades but are not included in the
sample.
This latter point is particularly important to bear in mind when comparing 1994's
"3rd grade" findings for the 1st grade cohort, which are not representative of all 3rd graders in
the nation in that year, with 1991's 3rd grade findings for the 3rd grade cohort, which are
nationally representative for 1991. Both the sample and calendar year used to derive the results
shift at the 3rd grade "seam" in the data: from 1994 data for a nationally representative sample
of 1992's 1st graders to 1991 data for a nationally representative sample of 1991's 3rd graders.
Because of these shifts, we will hold comparisons across cohorts to a minimum in this report
andwhen usedinterpret them as only suggestive of how a single group of students would have
progressed had they been tracked continuously throughout their grade school years during the
1990s. It is not appropriate to treat these data as though they provide information on a single
cohort for grades 1 through 6.
The overall pattern of year-by-year results in Exhibit 1.2 masks some important changes
for individual students. Exhibit 1.3 uses longitudinal profiles of LEP status for individual
students to show the share of the population in each of three subgroupsstudents who are:
21 The estimate from the 1990 Census is a count of the number of children age 5 to 17 who spoke a languageother than English in the home and who were rated as speaking English less than "very well." Although widelycited as an estimate of the LEP population, it has two major shortcomings: it addresses only one dimension ofEnglish proficiency, speaking; and it is based on subjective rankings of a child's English speaking proficiency bysomeone who may not be knowledgeable of grade-appropriate proficiency levels.
ABT ASSOCIATE'S INC. 1-17
44
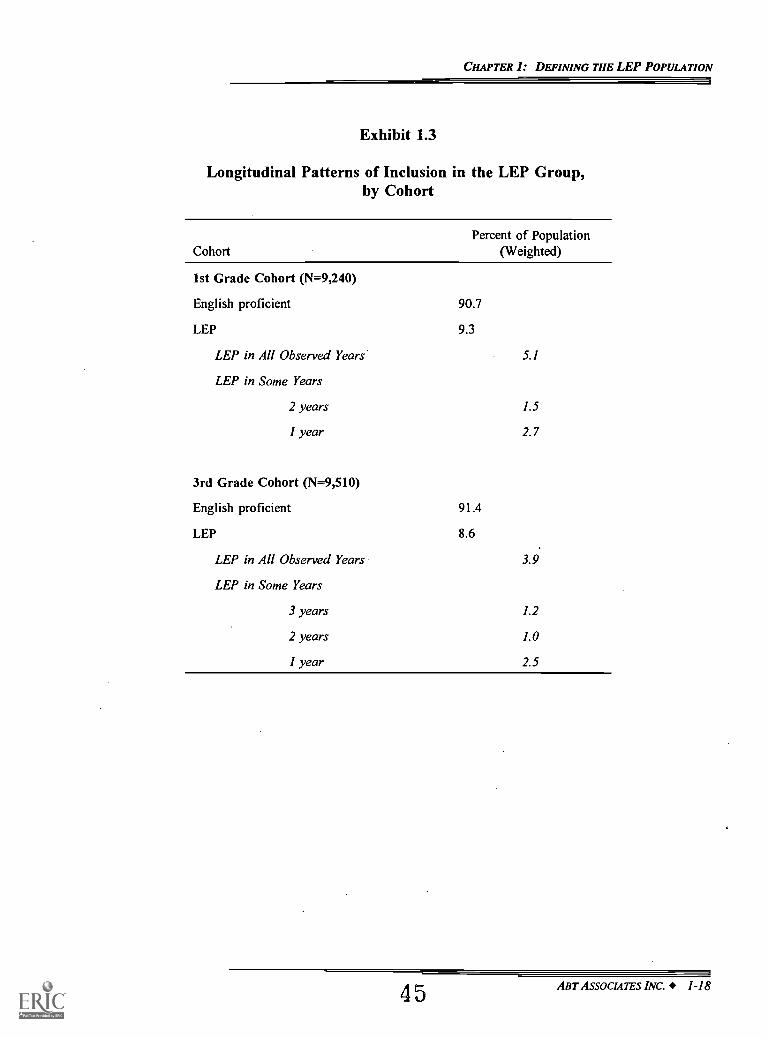
CHAPTER I: DEFINING THE LEP POPULATION
Exhibit 1.3
Longitudinal Patterns of Inclusion in the LEP Group,by Cohort
CohortPercent of Population
(Weighted)
1st Grade Cohort (W9,240)
English proficient 90.7
LEP 9.3
LEP in All Observed Years 5.1
LEP in Some Years
2 years 1.5
1 year 2.7
3rd Grade Cohort (W9,510)
English proficient 91.4
LEP 8.6
LEP in All Observed Years 3.9
LEP in Some Years
3 years 1.2
2 years 1.0
1 year 2.5
4 5ABT ASSOCIATES INC. 1-18
CHAPTER I: DEFINING THE LEP POPULATION
Categorized as LEP in all observed years;
Categorized as LEP in some but not all observed years; and
Categorized as LEP in none of the observed years.'
The first point to note from the exhibit is that the great majority of elementary students
were not categorized as LEP at any time during the study period: 90.7 percent of the 1st grade
cohort, and 91.4 percent of the 3rd grade cohort. These percentages would likely be somewhat
lower were a single cohort of students tracked continuously through all 6 elementary school years,
since some of the 1st grade cohort students not categorized as LEP in grades 1 through 3 might
have been so categorized in later years (were more data available) and, similarly, some of the
3rd grade cohort students not categorized as LEP in grades 3 through 6 might have been so
categorized in earlier years. Even recognizing this possibility, it seems likely that close to
90 percent of all public school students neither receive special LEP-related services nor are
considered by school staff to be limited English proficient throughout their first six years of grade
school.
Exhibit 1.3 shows the prominence of students who are classified as LEP in all observed
years among the students classified as LEP in any one year. For example, of the 6.7 to
7.6 percent of the 1st grade cohort categorized as LEP in any particular year (see Exhibit 1.2),
5.1 percent are the same students: those listed as "LEP in All Observed Years" in Exhibit 1.3.
Similarly, of the 5.5 to 6.6 percent of the 3rd grade cohort listed as LEP in specific years (see
Exhibit 1.2), 3.9 percent are the same students. In all, one-half to three-fourths of the students
classified as LEP in any one year are classified as LEP in all years of the follow-up period.
Presumably, this share would fall somewhat if we were to track a single cohort over all six years
from grade 1 to grade 6, since classification in the LEP group might not occur in some other
year. The central point seems likely to hold nonetheless: a sizeable fraction of the students
perceived and/or served by their schools as LEP at some point during their elementary years are
perceived and/or served as LEP throughout those years.
n For simplicity, we suppress sample-based percentages in this exhibit and the remainder of the report, focusinginstead on (weighted) population estimates.
4 6ABT ASSOCIATES INC. 1-19
CHAPTER 1: DEFINING THE LEP POPULATION
Other research indicates that, on average, it takes five to ten years for non-native speakers
of English to develop enough proficiency to catch up with their typical native-English speaking
peers, as measured by grade-level-appropriate academic tests in English (Thomas and Collier
1997; Collier 1995; Cummins, 1981).23 Given these research findings, it is not surprising that
our data show a majority of LEP students remaining LEP for the duration of our study: we
observe students for three or four years, not enough time for most students with limited
proficiency in English to become proficient.
Exhibit 1.3 also shows that an important number of students are classified as LEP in some
but not all observed years: almost half of the LEP students in the 1st grade cohort, and over half
of the LEP students in the 3rd grade cohort. This subset includes students whose classification
as LEP ends during the observation period, as well as those who become classified as LEP for
the first time in later years of the study period. This category also includes some students whose
classification as LEP or English proficient (EP) made more than one transition during the follow-
up period (e.g., LEP in year 1, EP in year 2, and LEP again in year 3). Transitions out of and
into LEP status are discussed in more detail later in this chapter.
THE RELATIVE IMPORTANCE OF PERCEPTIONS VERSUS SERVICES
What is the relationship between staff perceptions of students' proficiency in English and
receipt of LEP-related services? What is the relative contribution of each of the eight LEP
indicators described earlier to identifying the sample of LEP students for this study? We address
these issues in this section.
To simplify the analysis, we confine our attention to the students categorized as LEP at
some point during the follow-up period, omitting for the time being the "Not LEP" group shown
in Exhibit 1.3. With this exclusion, our findings in the remainder of the current chapter are based
on the 1,642 students in the 1st grade cohort who were perceived and/or served as LEP in at least
Thomas and Collier (1997) suggest that the catch-up period is five to seven years for LEP students with atleast two years of native language instruction in their home country, and seven to ten years for LEP students withno formal schooling in their native language.
ABT ASSOCIATES INC. 1-20
4 7
CHAPTER 1: DEFINING THE LEP POPULATION
one of the three years of follow-up, and on the 1,739 students in the 3rd grade cohort who were
perceived and/or served as LEP in at least one of the four years of follow-up.
Within these two groups, the upper panel of Exhibit 1.4 shows that, for the purposes of
our analysis, we identify students as LEP more often because they receive language-related
services than because their teachers (or other school staff) identify them as LEP.24 Around
90 percent of the LEP population in each cohort received a LEP-related service during the study
period, while more than 25 percent were not identified by any surveyed teacher as LEP during
the study. Because of missing data, the 25 percent estimate is likely an overestimate of the
percent of students receiving LEP services, but not perceived by their teacher as LEP. To the
extent that teachers would have identified students as LEP in some of the cases where teacher
reports are missing, the percent served but not perceived would be lower than 25 percent. The
multiple indicators discussed above that are used by schools for student entry and exit from
services (such as test results and teacher input) probably provide more precise measurement of
student ability to understand, speak, read, and write English in classroom contexts than a single
teacher survey question. However, teacher perception of student language background and ability
is important for understanding the educational process.
The lower panel of the exhibit adds some details to these patterns. It shows the
percentage of LEP students in each cohort that met both of the broad criteria for inclusion in the
sampleperceptions and servicesat some point during the follow-up period, as well as the
percentage meeting only one of those criteria. As can be seen in the first row of the lower panel,
nearly two-thirds of all LEP students were both perceived as LEP and received LEP-related
services at some point during the follow-up period (although not necessarily in the same year).25
This indicates a fairly strong correspondence between these two broad categories of perceived
LEP needs versus LEP services.
The process we use in this study to identify students as LEP provides no information about the processschools use to select students for entry into or exit from ESL or bilingual services. On the latter issue, see thediscussion earlier in this chapter or the interim report for this study (Moss and Puma 1995, pp. 4-7 through 4-10).
25 The next section of the chapter looks at the extent to which LEP perceptions and services overlap in a givenyear.
48ABT ASSOCIATES INC. 1-21
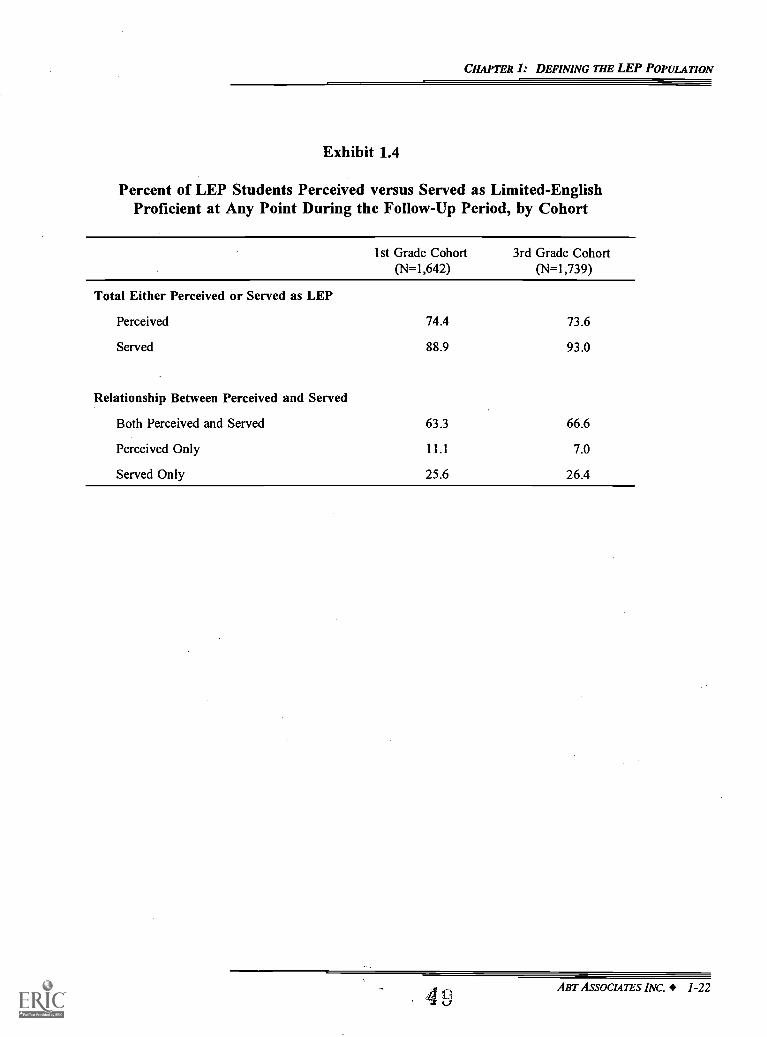
CHAPTER 1: DEFINING THE LEP POPULATION
Exhibit 1.4
Percent of LEP Students Perceived versus Served as Limited-EnglishProficient at Any Point During the Follow-Up Period, by Cohort
1st Grade Cohort(N=1,642)
3rd Grade Cohort(N=1,739)
Total Either Perceived or Served as LEP
Perceived 74.4 73.6
Served 88.9 93.0
Relationship Between Perceived and Served
Both Perceived and Served 63.3 66.6
Perceived Only 11.1 7.0
Served Only 25.6 26.4
41)ABT ASSOCIATES INC. 1-22
CHAPTER 1: DEFINING THE LEP POPULATION
However, it is also clear that an important share of the LEP population was either
perceived as LEP, but never received LEP-related services during the study period based on
available data, or was never reported as perceived as LEP by school staff but did receive services.
These two subgroupsthe latter much larger than the formerconstitute important subsets of
LEP students. We look at the breakdown of these two groups by yearand consider the reasons
why students may fall into these two groupslater in the chapter.
Exhibits 1.5 and 1.6 show the contribution of the eight individual LEP criteria in defining
the two broad categories of perception and service receipt and, hence, the overall LEP population.
Here, the criteria are ordered by prevalence within each broad category. Separate tables are
provided for each cohort. The first column of each table shows the extent to which the LEP
population met each of the individual criteria at some point during the study period. This column
sums to more than 100 percent because most students categorized as LEP met more than one
criterion. The second colunm shows the amount by which the size of the overall LEP population
would decrease if a particular criterion were removed. For example, if the criterion
"Identified as LEP by teacher" in row 1 of Exhibit 1.5 were removed, the LEP population for
the 1st grade cohort would drop 8.9 percentage points.
As can be seen, each of the eight LEP criteria were met by at least one in five LEP
students for both the 1st and 3rd grade cohorts. Further, the ordering of the criteria by
importance (i.e., prevalence) is the same for the two cohorts within the two broad categories of
perception and service. For both cohorts, the most important criteria (in the sense of being met
most often) are receipt of ESL or Bilingual Education instruction as indicated by school
records,' and the teacher' s identification of a student as LEP. More than two-thirds of the LEP
population met each of these criteria at some point during the follow-up period.
2.6 As noted earlier, receipt of bilingual education instruction by itself was not sufficient to categorize a studentas LEP for this study. See Appendix A for details.
50 ABT ASSOCIATES INC. 1 -23
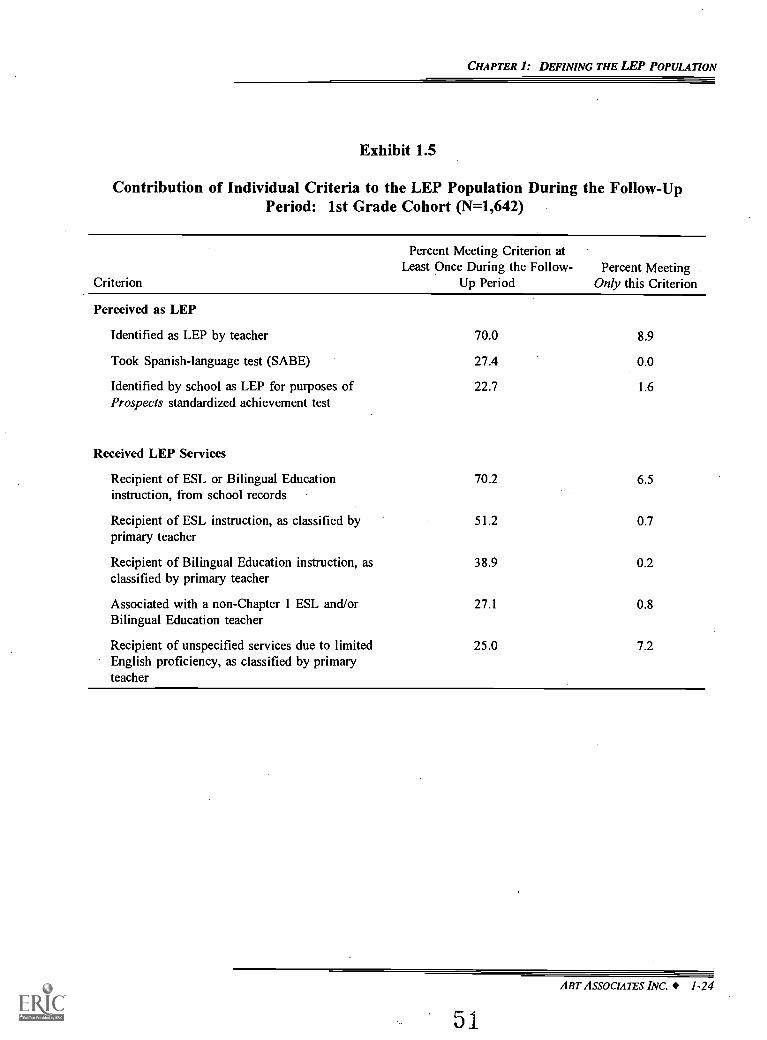
CHAPTER 1: DEFINING THE LEP POPULATION
Exhibit 1.5
Contribution of Individual Criteria to the LEP Population During the Follow-UpPeriod: 1st Grade Cohort (N=1,642)
Criterion
Percent Meeting Criterion atLeast Once During the Follow-
Up PeriodPercent Meeting
Only this Criterion
Perceived as LEP
Identified as LEP by teacher 70.0 8.9
Took Spanish-language test (SABE) 27.4 0.0
Identified by school as LEP for purposes of 22.7 1.6Prospects standardized achievement test
Received LEP Services
Recipient of ESL or Bilingual Educationinstruction, from school records
70.2 6.5
Recipient of ESL instruction, as classified byprimary teacher
51.2 0.7
Recipient of Bilingual Education instruction, asclassified by primary teacher
38.9 0.2
Associated with a non-Chapter 1 ESL and/or 27.1 0.8Bilingual Education teacher
Recipient of unspecified services due to limited 25.0 7.2English proficiency, as classified by primaryteacher
ABT ASSOCIATES INC. 1-24
51
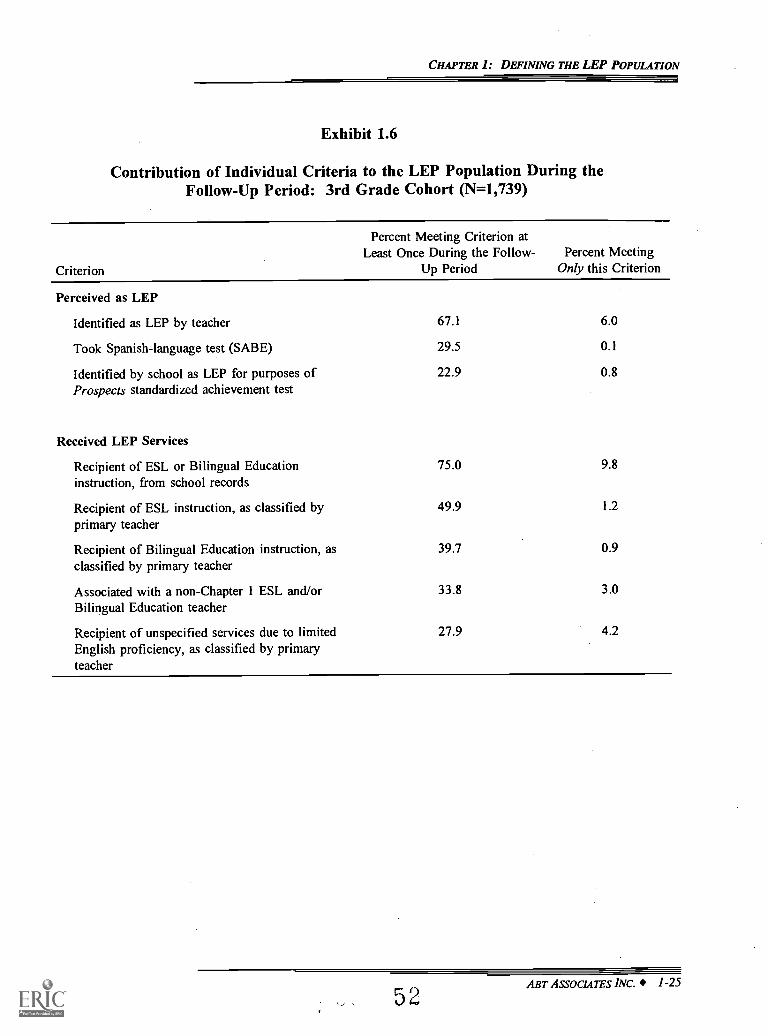
CHAPTER 1: DEFINING THE LEP POPULATION
Exhibit 1.6
Contribution of Individual Criteria to the LEP Population During theFollow-Up Period: 3rd Grade Cohort (N=1,739)
Criterion
Percent Meeting Criterion atLeast Once During the Follow-
Up PeriodPercent Meeting
Only this Criterion
Perceived as LEP
Identified as LEP by teacher 67.1 6.0
Took Spanish-language test (SABE) 29.5 0.1
Identified by school as LEP for purposes of 22.9 0.8
Prospects standardized achievement test
Received LEP Services
Recipient of ESL or Bilingual Educationinstruction, from school records
75.0 9.8
Recipient of ESL instruction, as classified byprimary teacher
49.9 1.2
Recipient of Bilingual Education instruction, asclassified by primary teacher
39.7 0.9
Associated with a non-Chapter 1 ESL and/or 33.8 3.0
Bilingual Education teacher
Recipient of unspecified services due to limited 27.9 4.2English proficiency, as classified by primaryteacher
52ABT ASSOCIATES INC. 1-25
CHAPTER 1: DEFINING THE LEP POPULATION
The same two criteria make the biggest unique contributions to the LEP population as
well, as shown in the second column of the exhibits.' By this measurethe marginal
contribution of a given factor once all other factors have been taken into accountthe most
important criterion for defining the LEP population differs by cohort. For the 1st grade cohort
(Exhibit 1.5), it is identification as LEP by the student's primary teacher, with receipt of various
types of LEP-related services (unspecified teacher-reported services, ESL or Bilingual Education
instruction in school records) next in importance. This pattern is essentially reversed for the
3rd grade cohort (Exhibit 1.6), where receipt of ESL or Bilingual Education instruction in school
records makes the largest marginal contribution, followed by teacher identification as LEP. In
each case, the single largest contributor to the overall LEP group accounts for less than
10 percent of the full LEP population on its own. The five least important LEP criteria (those
not mentioned in the above discussion) each have very small effects on the size of the overall
LEP population; eliminating any one would reduce the LEP group by at most 3 percent.'
THE ROLE OF PERCEPTIONS AND SERVICES IN DEFINING THE LEP POPULATION OVER TIME
The previous section looked at the importance of perceptions and services in defining the
LEP population over the study period as a whole. This section takes a dynamic perspective,
considering the importance of each set of factors year by year and to see how their relative
importance changes over time.
The basic approach is to revisit the information from Exhibit 1.4 on a year-by-year basis,
in separate tables for each cohort (Exhibits 1.7 and 1.8, respectively). The top panel of each
exhibit shows the percentages of the LEP population that fall into each of the two broad
categories of LEP indicatorsperceptions and LEP serviceseach year. The bottom panel then
27 The figures in the second column of Exhibits 1.4 and 1.5 are not additive. For example, while the fivesmallest numbers in that column sum to less than 10 percent, it is not the case that eliminating all five criteria wouldreduce the LEP sample by less than 10 percent. This is because some students are identified by multiple criteria,but only within these five smallest criteria. Therefore, eliminating the five smallest criteria would cause additionalstudents to be dropped from the sample besides the students actually counted in column 2.
28 As noted earlier, association with a non-Chapter 1 ESL and/or Bilingual Education teacher was not measuredin 1994. This may slightly reduce the contribution of this criterion to the overall LEP population.
53ABT ASSOCIATES INC. 1-26
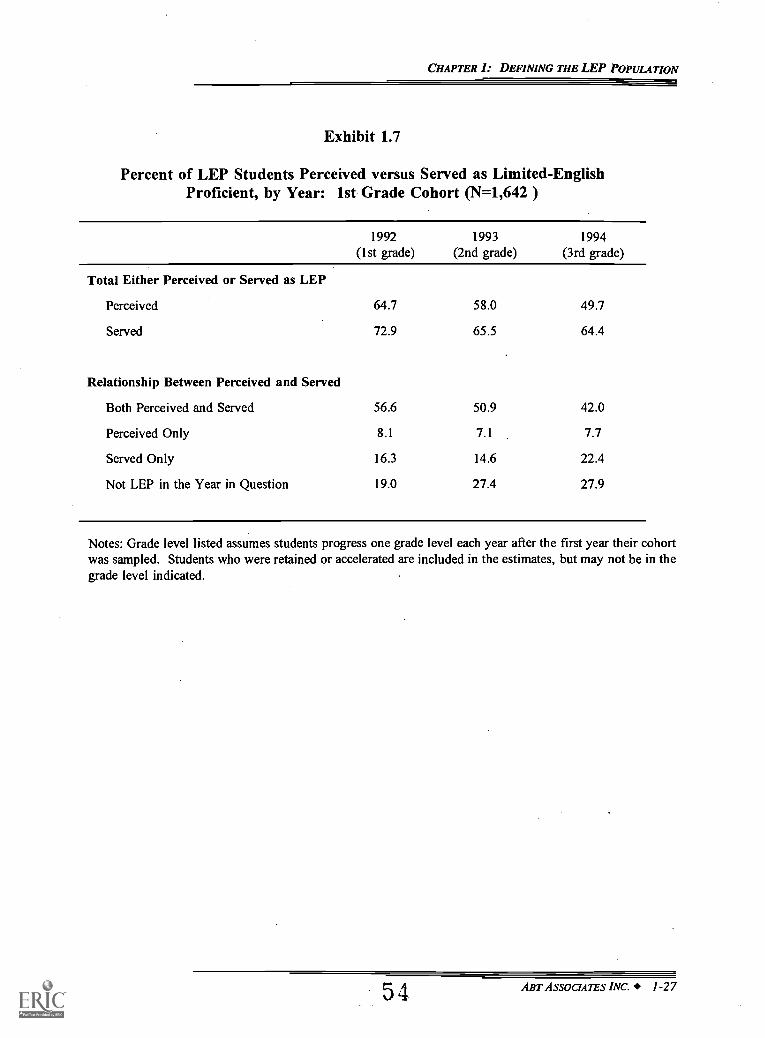
CHAPTER 1: DEFINING THE LEP POPULATION
Exhibit 1.7
Percent of LEP Students Perceived versus Served as Limited-EnglishProficient, by Year: 1st Grade Cohort (N=1,642 )
1992(1st grade)
1993(2nd grade)
1994(3rd grade)
Total Either Perceived or Served as LEP
Perceived 64.7 58.0 49.7
Served 72.9 65.5 64.4
Relationship Between Perceived and Served
Both Perceived and Served 56.6 50.9 42.0
Perceived Only 8.1 7.1 7.7
Served Only 16.3 14.6 22.4
Not LEP in the Year in Question 19.0 27.4 27.9
Notes: Grade level listed assumes students progress one grade level each year after the first year their cohortwas sampled. Students who were retained or accelerated are included in the estimates, but may not be in thegrade level indicated.
5 4 ABT ASSOCIATES INC. 1 -27
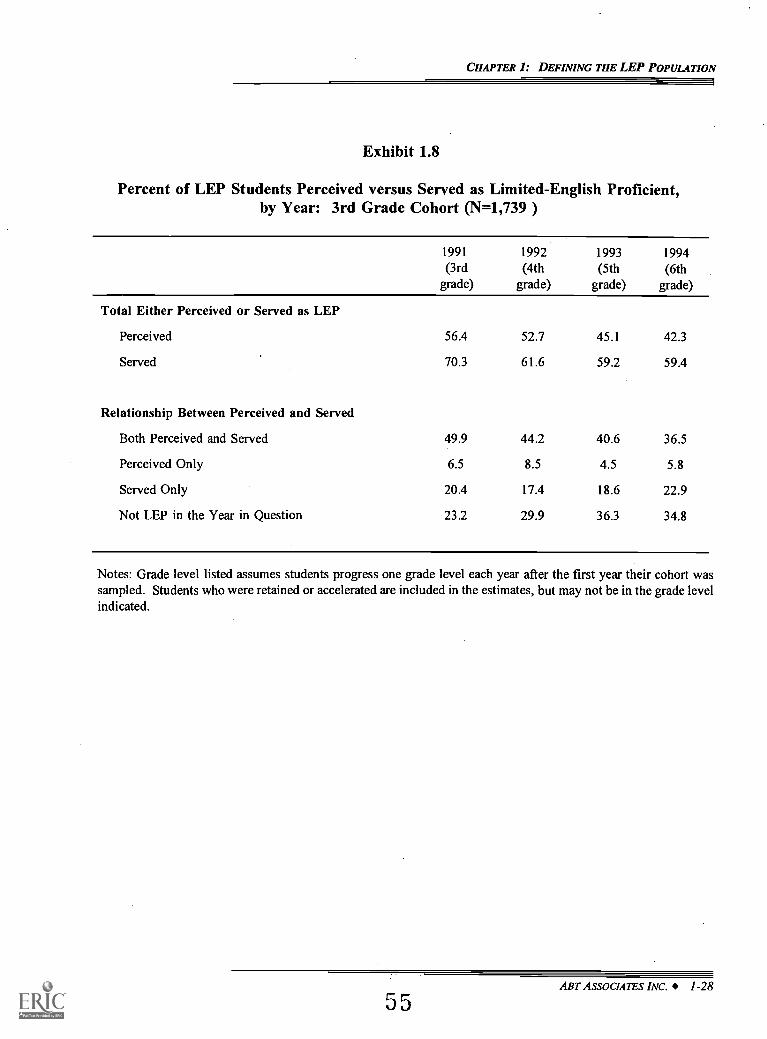
CHAPTER 1: DEFINING THE LEP POPULATION
Exhibit 1.8
Percent of LEP Students Perceived versus Served as Limited-English Proficient,by Year: 3rd Grade Cohort (N=1,739 )
1991
(3rdgrade)
1992(4th
grade)
1993(5th
grade)
1994(6th
grade)
Total Either Perceived or Served as LEP
Perceived 56.4 52.7 45.1 42.3
Served 70.3 61.6 59.2 59.4
Relationship Between Perceived and Served
Both Perceived and Served 49.9 44.2 40.6 36.5
Perceived Only 6.5 8.5 4.5 5.8
Served Only 20.4 17.4 18.6 22.9
Not LEP in the Year in Question 23.2 29.9 36.3 34.8
Notes: Grade level listed assumes students progress one grade level each year after the first year their cohort wassampled. Students who were retained or accelerated are included in the estimates, but may not be in the grade levelindicated.
ABT ASSOCIATES INC. 1-28
5 5
CHAPTER I: DEFINING THE LEP POPULATION
divides the LEP population for each year into four categories: students both perceived and served
as LEP; those perceived but not served; those served but not perceived; and those not categorized
as LEP at all in the year in question.
General Trends
As students move from little or no proficiency in English to the proficiency levels
required to perform well in core curriculum courses conducted in Englishtypically developing
understanding and oral proficiency more rapidly than proficiency in reading and writingwe
would expect services criteria to be more important than teacher reports in identifying the total
number of LEP students. This should be particularly true for students with higher levels of
English proficiency.
As we saw in Exhibit 1.4 for the study period as a whole, Exhibits 1.7 and 1.8 show that
in any given year the services criteria are more prominent in defining the LEP population than
the perceptions criteria. For the 1st grade cohort, Exhibit 1.7 shows that the percent of the LEP
population that meets the perceptions criteria ranges from 64.7 percent in the 1st grade to
49.7 percent in the 3rd grade, while the percentage that meets the services criteria ranges from
72.9 percent in the 1st grade to 64.4 percent in the 3rd grade. Similarly, Exhibit 1.8 shows 56.4
to 42.3 percent of the 3rd grade cohort meeting the perceptions criteria each year between
3rd and 6th grade, while the percentage meeting the services criteria ranges from 70.3 to
59.4 percent over the same interval. Within these ranges, receipt of LEP-related services has less
of a downward trend over time than does perceived LEP status for both cohorts.
As with the overall percentages presented in Exhibit 1.4, the lower panels of Exhibits 1.7
and 1.8 indicate that the students in the LEP population are most likely to be in both the services
and perceptions categories in any single year, or in neither category. Perceptions without services
constitute the least common combination in any year, while services without perceptions are
somewhat more common. Thus, as we saw in the aggregate data, perceptions and services
coincide for mostbut by no means allLEP students in any given year.
Within these broad parameters, the share of students both perceived and served as LEP
tends to decline over time. For the 1st grade cohort, the lower panel of Exhibit 1.7 shows a drop
from 56.6 percent in the 1st grade to 42.0 percent in the 3rd grade, while for the 3rd grade
5 6ABT ASSOCIATES INC. 1-29
CHAPTER I: DEFINING THE LEP POPUIATION
cohort, Exhibit 1.8 shows a decline from 49.9 percent in the 3rd grade to 36.5 percent in the 6th
grade. A possible reason why there is less agreement over time between perceptions and services
is that, as students become more proficient in English, perceptions (and survey responses) about
whether a student is LEP may become more ambiguous. There are no clear trends in the size
of the other two categories of LEP students: those perceived but not served, and those served
but not perceived.
Special Cases
These last two categories of students represent intriguing subsets of the LEP population.
The lower panels of Exhibits 1.7 and 1.8 show that, in any year, from 4.5 to 8.5 percent of the
students in the LEP population are perceived by teachers or administrators as having limited
English proficiency but receive no LEP-related services.29 That such a group exists is not
surprising, given resource limitations in many schools and the need for a minimum number of
LEP students at a particular grade level if special services are to be offered effectively and
efficiently." That it includes about one in every eight students perceived by school staff as
having limited English proficiency in a given year has important policy implications,3' but still
confirms that most perceived LEP needs are being addressed (at least to some degree). This
pattern remains fairly stable across grade levels, ranging from a high of one in six students with
perceived needs receiving no reported services in the 4th grade, to a low of one in ten in the 5th
grade.
As discussed in the earlier section on legal requirements for special services to LEP
students, it is possible that a student may be accurately identified as LEP, but the school is not
legally required nor inclined to provide special services. For example, while most public schools
receive at least some federal funding, a school district that does not receive federal funding is not
29 An earlier Prospects report found that the likelihood of receiving no LEP services was higher in schools withfewer LEP students (see Moss and Puma 1995, Exhibit A4.5).
In Chapter 3 we consider the overall availability of LEP-related services at each grade level.
The one-in-eight figure comes from comparing, the percentage of LEP students categorized as "PerceivedOnly" in row 2 of the lower panels of Exhibits 1.6 and 1.7 with the sum of that row and the previous row.
ABT ASSOCIATES INC. 1-30
57
CHAPTER I: DEFINING THE LEP POPULATION
required to meet Title VI requirements for special assistance to LEP students and may choose to
immerse the student in the standard EP curriculum at their school.
There are several reasons related to the way the data were collected that could lead to
over- or under-counts of the number of LEP students who are perceived as LEP but do not
receive LEP-related services. The figures presented in Exhibits 1.4, 1.7, and 1.8 may exaggerate
the extent of unmet need to the degree that:
Abstracts from school records and other indicators of service receipt failed toidentify special LEP-related services received by some of the students perceivedas LEP;
Primary teachers used an overly broad definition of limited English proficiencywhen completing the Student Profile; or
Bilingual Spanish-English students with full English proficiency were at timestested in Spanish for the Prospects study and, thus, were categorized as LEP here,when in fact they did not need LEP-related services.
Conversely, it is possible though less likely that the estimates given here understate the
degree of unmet need, if:
School staff applied inappropriately narrow definitions of limited Englishproficiency in completing the Student Profile and in deciding which studentsshould take the Prospects standardized tests in English; or
Unmet needs for ESL or Bilingual Education were not recognized by school staff,or were no longer present when data on staff perceptions were collected in theSpring of each year (but were present earlier in the year).
School staff may have low expectations for student levels of English proficiencyin their school. The main Prospects study, for example, reports that gradingexpectations for academic performance were lower in high poverty schools (e.g.,A-level work in poor schools was rated as C-level work in non-poor schools).
Somewhat more surprising is the significant share of LEP students reported as receiving
LEP-related services whom teachers and administrators did not report on the teacher survey as
having limited English proficiency. This group ranges from 14.6, to 22.9 percent of the overall
LEP group in any year, or a little more than one in every three students reported as receiving
ABT ASSOCIATES INC. 1-31
58
CHAPTER 1: DEFINING THE LEP POPULATION
LEP-related services.' This pattern remains fairly stable across grade levels, ranging from a
low of one in every 4.5 1st and 2nd grade students receiving services that have no perceived
need, to a high of one in every 2.5 6th grade students.
How could so many of the students provided with ESL and Bilingual Education services
be outside the group perceived as limited English proficient? The way the Prospects data were
collected may figure into the explanation. For example, some of the students receiving LEP-
related services early in the school year may no longer have been limited English proficient when
we collected data on perceptions in the spring." Or, they may have had limited English
proficiency sufficient to justify services, but not so severe as to rule out English-language testing
for Prospects or to cause their primary classroom teachers to categorize them as LEP.
Conversely, it is possible that school records mistakenly indicate the receipt of ESL or Bilingual
Education services when neither need nor services was present.
In addition to all of these data-related explanations, we must also consider the possibility
that an important number of students, from 1.4 to 2.1 percent of the entire student body during
the study years, received ESL and/or Bilingual Education services even though they were
perceived by school staff as having little or no limited English proficiency.34 Later chapters of
the report shed some light on this vital question. For now, we reemphasize that the reported
figures may substantially exaggerate the extent of services to students who are not limited English
proficient because:
Abstracts from school records cover, in part, a time period prior to that whenperceptions of limited English proficiency were measured;
32 The one-in-three figure comes from comparing the percentage of LEP students categorized as "Served Only"in row 3 of lower panels of Exhibits 1.6 and 1.7 with the sum of that row and the first row of the panel.
n Data on ESL and Bilingual Education instruction abstracted from school records were intended to includeservices received at any point during the current school year, at least in the 1992, 1993, and 1994 rounds of datacollection. The intention (and practice) is not so clear in 1991, when abstracted data may have picked up onlycurrent services. Even in that year (3rd grade for the 3rd grade cohort), 20.4 percent of the LEP group fell intothe "Served Only" category (see row 3 of the lower panel of Exhibit 1.7).
34 The 1.4 to 2.1 percent range is derived by multiplying the percent of LEP students in this category (from row3 of the lower panels of Exhibits 1.6 and 1.7) by the share of the overall cohort classified as LEP (fromExhibit 1.2).
ABT ASSOCIATES INC. 1-32
5 9
CHAPTER 1: DEFINING THE LEP POPULATION
Abstracts from school recordsand other indicators of service receipt, such asassociation with a specific ESL or Bilingual Education teacher, or teacher reportsof service receiptmay occasionally show services when none were received, dueto data errors; or
Limited English proficient students may have occasionally been tested in English(i.e., with the CTBS) and not identified as LEP by their primary teacher (perhapsdue to survey nonresponse) even though they were (appropriately) receiving LEP-related services.
Each of these situations seems likely to have played some part in the reported data, particularly
the first factor concerning the timing of data collection. Unfortunately, we have no way of
gauging how much the three factors combined have skewed our measures of services without
needs upward.
Conversely, the findings presented here may understate the extent of services to English
proficient students. While less likely, this could occur if:
Due to missing data, abstracts, teacher reports, and teacher associations failed toidentify some of the students who received ESL or Bilingual Education servicesamong those who were not perceived as LEP; or
Test-taking patterns and teacher reports indicated that some of the studentsreceiving LEP-related services had limited English proficiency when, in fact, theydid not.
Neither of these situationsEnglish proficient students whose service receipt was not reported,
and English proficient students overlooked because they were misreported as LEPseems likely
to have occurred very often, making it likely that, on net, LEP-related services to EP students are
somewhat exaggerated rather than under-reported in the available data.
LEP TRANSITIONS
In looking at the LEP population over time, students whose LEP classification changes
during the period of observation form intriguing subgroups for further analysis. Those whose
classification changes from "LEP" to "not LEP" are of obvious policy interest, since schools seek
to increase the English proficiency of LEP students until they no longer fall into this category.
6 0 ABT ASSOCIATES INC. 1-33
CHAPTER I: DEFINING THE LEP POPULATION
It is also important to understand why some students' classifications switch from "not LEP" to
"LEP," since an important concern for these students is whether they should have been
recognized as LEP and/or received LEP-related services in a prior year.35 This section looks
at the shares of the LEP population that experience each of these transitions, and at the individual
criteria associated with exits and entrances from the "LEP" category.
Types of Transitions
Exhibit 1.9 shows the timing of exits from and entrances into the "LEP" category for both
cohorts. The first column gives the percent of the LEP population that:
Made no observed transitions into or out of the LEP group (i.e., was categorizedas "LEP" in all observed years);
Exited the "LEP" classification during the study period; or
Entered the "LEP" classification during the study period.
It also indicates the year of transition in each case. Students whose classifications changed more
than once are counted twice, once for each transition. For example, if a student's classification
changed from "LEP" to "not LEP" in the 2nd grade then returned to "LEP" in the 3rd grade, s/he
is counted in both of these rows.
The second and third columns of the exhibit show the extent to which multiple transitions
occur. For example, the second column shows that 2.5 percent of the LEP population for the
1st grade cohort left the "LEP" category in the 2nd grade but returned to it in the 3rd grade.
Most of the cells in the second and third columns do not contain any entries either because the
category does not apply (e.g., those who enter the "LEP" classification cannot "Reenter Later")
or because our data end before we have an opportunity to observe re-entrances or later exits (e.g.,
35 All students whose classification shifts from "not LEP" to "LEP" during the study period have been observedas "not LEP"i.e., as neither perceived as LEP nor receiving LEP servicesin at least one prior year. This doesnot mean, however, that they were neither recognized nor served as LEP in all previous years, since they may havebeen recognized and/or served prior to the advent of data collection. This is most likelythough still fairlyunlikelyfor students in the 3rd grade cohort, whose LEP classification in grades 1 and 2 was not observed.
ABT ASSOCIA7ES INC. 1-34
61
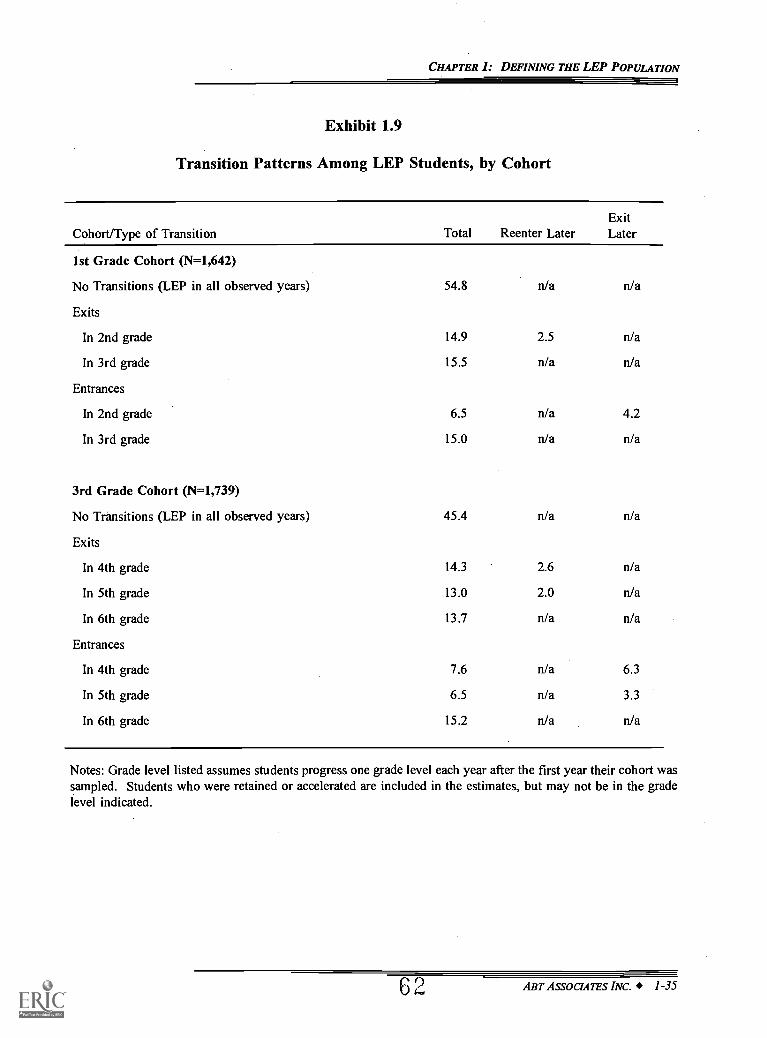
CHAPTER I: DEFINING THE LEP POPULATION
Exhibit 1.9
Transition Patterns Among LEP Students, by Cohort
Cohort/Type of Transition Total Reenter LaterExitLater
1st Grade Cohort (N=1,642)
No Transitions (LEP in all observed years) 54.8 n/a
Exits
In 2nd grade 14.9 2.5 n/a
In 3rd grade 15.5 n/a n/a
Entrances
In 2nd grade 6.5 n/a 4.2
In 3rd grade 15.0 n/a n/a
3rd Grade Cohort (N=1,739)
No Transitions (LEP in all observed years) 45.4 n/a n/a
Exits
In 4th grade 14.3 2.6 n/a
In 5th grade 13.0 2.0 n/a
In 6th grade 13.7 n/a n/a
Entrances
In 4th grade 7.6 n/a 6.3
In 5th grade 6.5 n/a 3.3
In 6th grade 15.2 n/a n/a
Notes: Grade level listed assumes students progress one grade level each year after the first year their cohort wassampled. Students who were retained or accelerated are included in the estimates, but may not be in the gradelevel indicated.
6 0 ABT ASSOCIATES INC. 1-35
CHAPTER 1: DEFINING THE LEP POPULATION
students whose classification changed from "LEP" to "not LEP" in the 3rd grade cannot reenter
later because we do not observe them for any more years).
Similar to Exhibit 1.3, the first column of Exhibit 1.9 shows that the LEP population is
quite dynamic: only about half of the students in the LEP population remained in the LEP group
throughout the study period.' The percentage without transitions is smaller for the 3rd grade
cohort (45.4 percent) than the 1st grade cohort (54.8 percent) in part because there is an
additional year of data for the former group. For both cohorts, 20 to 30 percent of all students
categorized as "LEP" at some point during the study period underwent a change in their LEP
classification in a given year.
The first column of the exhibit also shows that, in most years, a larger proportion of the
overall LEP group exited the "LEP" category than entered it. This is consistent with the net
outflow of LEP students over time shown in Exhibit 1.2. This tendency was not universal,
however: the 3rd grade cohort showed more entrances than exits during the 6th grade year, a
reversal that accounts for the small net increase in the size of the LEP group in the 6th grade (see
Exhibit 1.2). It seems likely that anomalies in the 1994 data account for at least some portion
of this increase, since 1994 data for the 1st grade cohort also show an unusually high percentage
of entrances compared to exits.
The second and third columns of Exhibit 1.9 reveal two other important findings
concerning multiple transitions in and out of the "LEP" category. First, the great majority of
students who are initially classified as "LEP" and leave that group are never returned to the
"LEP" group during the study period. For example, two-thirds of the students in the 3rd grade
cohort who exited the "LEP" group in the 4th grade were not put back in that classification by
the data in the 5th or 6th grades.' Second, the great majority of students that are not initially
36 Our procedures for handling missing data may have affected this result to a slight degree. Missing dataforced us to impute certain LEP criteria in particular years. (Appendix A provides details of the imputationprocedures.) Since one goal of the imputation rules was to minimize transitions from or to LEP status, all reportedtransitions in Exhibit 1.8 are based on observed data. Additional transitions might also have occurred, in years withmissing data; if so, the rates of transition shown in the exhibit understate the true extent of movement within theLEP population to some degree.
37 This proportion is calculated as 1 (4.6/14.3), where 14.3 refers to the percentage of the overall LEPpopulation in the 3rd grade cohort that exited the "LEP" category in 4th grade, and 4.6 is the percent of thatpopulation put back in the "LEP" group in a later year of the study (i.e., in the Sth or 6th grade).
ABT ASSOCIATES INC. 1-36
6 3
CHAPTER I: DEFINING THE LEP POPULATION
classified as "LEP" but who enter that group in the second or third year of observation have been
taken out of the "LEP" category again before the end of the study period. For example, three-
fourths of the students classified as entering the "LEP" group in the 2nd grade left that
classification again in the 3rd grade
In sum, students who were initially categorized as "LEP" but later change classifications
are likely to remain "not LEP" through the end of the observed data, while those who are first
classified as "LEP" later in the study period are likely to leave that group again before the end
of our observations. In both instances, there is a strong tendency for students whose LEP
classification makes a transition to leave the "LEP" category before the study period ends.
Entrances into LEP Status
Based on the figures in Exhibit 1.9, we can infer that less than 1 percent of all public
elementary school students move from a classification of "not LEP" to classification of "LEP"
each year between the 2nd and 6th grades.' As noted earlier, most of these entrances are
transitory. Others may reflect random variations in the measured data that occasionally but
inevitably arise in longitudinal data sets. Still, the group as a whole is important: apparently,
some number of students meet teachers' English proficiency standards and get no special LEP
services in one year, then fail to meet those standards or start to receive special services (or both)
the next year."
Several different factors could account for switches in LEP classification of this kind,
some more likely than others:
This proportion is calculated as 4.2/6.5, where 6.5 is the percentage of the overall population in the firstgrade cohort classified as leaving the "LEP" group in the second grade, and 4.2 is the percentage of that populationthat was taken out of the "LEP" category later in the study period (i.e., in the third grade).
" This estimate is the midpoint of the range that can be calculated from numbers in Exhibits 1.2 and 1.9. Thisrange is derived by multiplying the percent of the overall LEP population that enters the "LEP" classification ineach year (from the first column of the entrances panels of Exhibit 1.9) times the percent of students meeting ourcriteria for coding as LEP in any one of the study years, by cohort (from Exhibit 1.2), producing figures between0.6 percent and 1.3 percent.
4° LEP students are concentrated in the elementary grades, so this number is likely to be smaller for highergrade levels.
6 4 ABT ASSOCIATES INC. 1-37
CHAPTER 1: DEFINING THE LEP POPULATION
Some students may have high enough levels of English proficiency that there issome ambiguity about whether to provide special services or whether they havelimited proficiency in English;
Even for students whose proficiency in English is clearly limited, there may beadministrative discretion (that varies from year to year) in categorizing them asLEP or providing special services;
To the extent that service receipt alone defines the LEP population absentperceptions of limited English proficiency, a student could enter the "LEP"classification when previously unavailable LEP services become available the nextschool year or at a higher grade level;
As the English language skills required for classroom performance grow withsuccessive grade levels, schools may apply progressively more stringent standardsto identify students as LEP at higher grade levels;
An absolute decline in a student's English language ability could occur from yearto year; or
Over time, a school may have raised its standards for English proficiency (andperhaps for other instructional outcomes).
We found support for the first possibility: students entering our LEP category after the first year
tend to have higher levels of English proficiency. Late entrants were twice as likely as other LEP
students to be rated by their primary teacher as having excellent proficiency in understanding,
speaking, reading, and writing English. Late entrants were also more likely to be classified as
non-LEP in the following year relative to students identified as LEP from all previous years of
data, further evidence that the former group are "borderline" cases." On the other hand, half
of the late entrants were identified as having less than excellent English proficiency by their
primary teacher, an indication that special language related services would be appropriate.
The second and third factors above also seem like plausible explanations for late entrants,
and may have important implications for how schools serve LEP students.
While we cannot distinguish among these various scenarios, we can consider the reasons
students are included in the "LEP" category following a year in which they did not meet any of
41 Late entrants were also more likely than other LEP students to: be in schools with lower concentrations ofLEP students; take the English version rather than the Spanish version of standardized tests; and have higheraveragestandardized test scores.
ABT ASSOCIATES INC. 1-38
6 5
CHAPTER I: DEFINING THE LEP POPULATION
the eight LEP criteria. Exhibit 1.10 shows the specific criteria met in each year of LEP entry,
by cohort.42 Multiple criteria are reported for some students, leading to percentages that sum
to more than 100 though, not surprisingly, most of the students newly classified as "LEP" met
just one of the eight criteria in the year of entry.'
In general, perceptions of limited English proficiency and receipt of LEP-related services
are both important in moving a previously "not LEP" student into the "LEP" category. As seen
in the first row of each of the panels of Exhibit 1.10, more students enter the "LEP" subgroup
by being identified by their teacher as LEP or receiving ESL or Bilingual Education instruction,
as reported in school records, than by any other means. These two factorsa change in teacher
perceptions from one year to the next, and the beginning of supplemental services for students
not previously categorized as LEPeach account for 25 to 57 percent of LEP entries at each
grade level. In part, changes in LEP classification for the latter reason may reflect changes in
the availability of ESL services across different school years and grade levels. Similarly, the
change in primary teacher that almost accompanies movement from grade to gradecombined
with differences among teachers in English proficiency standardscould account for a good
many of the LEP entries attributable to changes in teacher perceptions.
Not nearly as many students enter the "LEP" category through changes in the other six
indicator variables. Most common are those whose status changes because their teachers report
that they received services of an unspecified type because of limited English proficiency (see last
row of the exhibit), a factor which contributes to 13 to 49 percent of all entries into the "LEP"
classification. The other five criteria play much smaller roles in the transition into "LEP" status,
and variations in importance among the factors by grade level show no obvious patterns.
Whatever their origins, the movement of students from a year classified as "not LEP" to
a year classified as "LEP" makes an important contribution to the long-term dynamics of the LEP
42 Percentages in Exhibit 1.9 (and Exhibit 1.10 which follows) are rounded to the nearest percentage point toavoid spurious precision. The samples used hereLEP entrants and exitsare much smaller (145 to 381 students)than those analyzed earlier in the chapter.
43 No data are available on the fmal criterion, association with a non-Chapter 1 ESL or bilingual educationteacher, for 1994 entrants.
66 ABT ASSOCIATE'S INC. 1-39
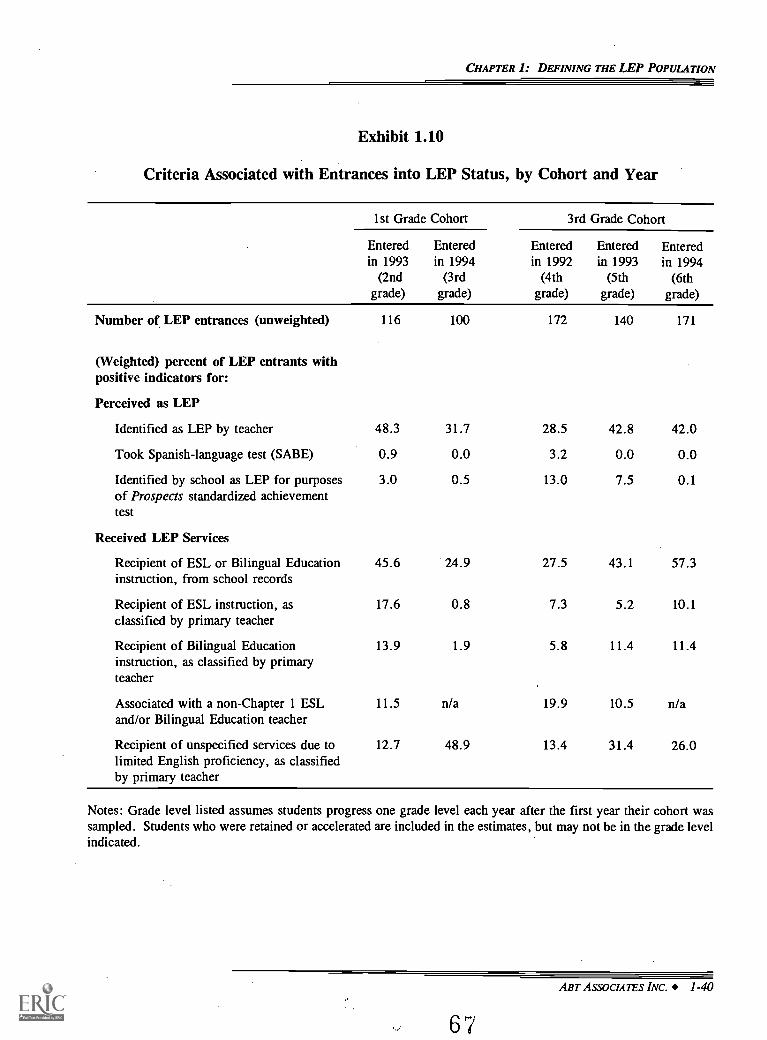
CHAPTER I: DEFINING THE LEP POPULATION
Exhibit 1.10
Criteria Associated with Entrances into LEP Status, by Cohort and Year
1st Grade Cohort 3rd Grade Cohort
Enteredin 1993
(2ndgrade)
Enteredin 1994
(3rdgrade)
Enteredin 1992
(4thgrade)
Enteredin 1993
(5thgrade)
Enteredin 1994
(6thgrade)
Number of LEP entrances (unweighted) 116 100 172 140 171
(Weighted) percent of LEP entrants withpositive indicators for:
Perceived as LEP
Identified as LEP by teacher 48.3 31.7 28.5 42.8 42.0
Took Spanish-language test (SABE) 0.9 0.0 3.2 0.0 0.0
Identified by school as LEP for purposesof Prospects standardized achievementtest
3.0 0.5 13.0 7.5 0.1
Received LEP Services
Recipient of ESL or Bilingual Educationinstruction, from school records
45.6 24.9 27.5 43.1 57.3
Recipient of ESL instruction, asclassified by primary teacher
17.6 0.8 7.3 5.2 10.1
Recipient of Bilingual Educationinstruction, as classified by primaryteacher
13.9 1.9 5.8 11.4 11.4
Associated with a non-Chapter 1 ESLand/or Bilingual Education teacher
11.5 n/a 19.9 10.5 n/a
Recipient of unspecified services due tolimited English proficiency, as classifiedby primary teacher
12.7 48.9 13.4 31.4 26.0
Notes: Grade level listed assumes students progress one grade level each year after the first year their cohort wassampled. Students who were retained or accelerated are included in the estimates, but may not be in the grade levelindicated.
ABT ASSOCIATES INC. 1-40
6 7
CHAPTER I: DEFINING THE LEP POPULATION
population. Without this partial offset to exits from the "LEP" group, the proportion of students
classified as LEP would decline much more sharply by grade level than shown in Exhibit 1.2.
Exits from LEP Status
The figures in Exhibit 1.9 consistently show that between 13 to 15 percent of LEP
students in elementary school move from a classification of "LEP" to a classification of "not
LEP" by the following year. Since there are more LEP students in the earlier grades, this
translates into 1.1 percent of public school students moving from LEP to not LEP between '1st
and 2nd grades (about 41,000 students), and 0.8 percent of all public school students moving
from LEP to not LEP between 5th and 6th grades (about 23,000 students), based on our criteria
for identifying students as LEP. This represents an important amount of progress in addressing
the English language needs of non-native English speaking students in the U.S. public school
system. As noted earlier, most exits from the LEP category are permanent, at least within the
confines of the study period: at most one in five of the students who leave LEP status return to
it during the next 1 or 2 years.
Perhaps the most obvious reason that students would leave the "LEP" category defined
by our data is improvement in English language skills; this, after all, is the central purpose of
LEP services. However, as with entrances, some recorded exits may be due to random variations
in the measured data. Other reasons for leaving the "LEP" group involve real changes in the
school'sas opposed to the student'ssituation, including:
Administrative discretion in categorizing or serving students as LEP from year toyear;
A decrease in the school's LEP standards; and
Decreases in the extent of LEP services offered in a particular year or grade level.
As with our earlier examination of the reasons students entered our LEP category
following a year they did not meet any of the eight LEP criteria, we can examine the proximate
reasons for exiting our LEP category by considering the LEP criteria met in the year prior to exit
(see Exhibit 1.11). Many students met multiple criteria in the year prior to exit (an average of
ABT ASSOCIATES INC. 1-41
6 8
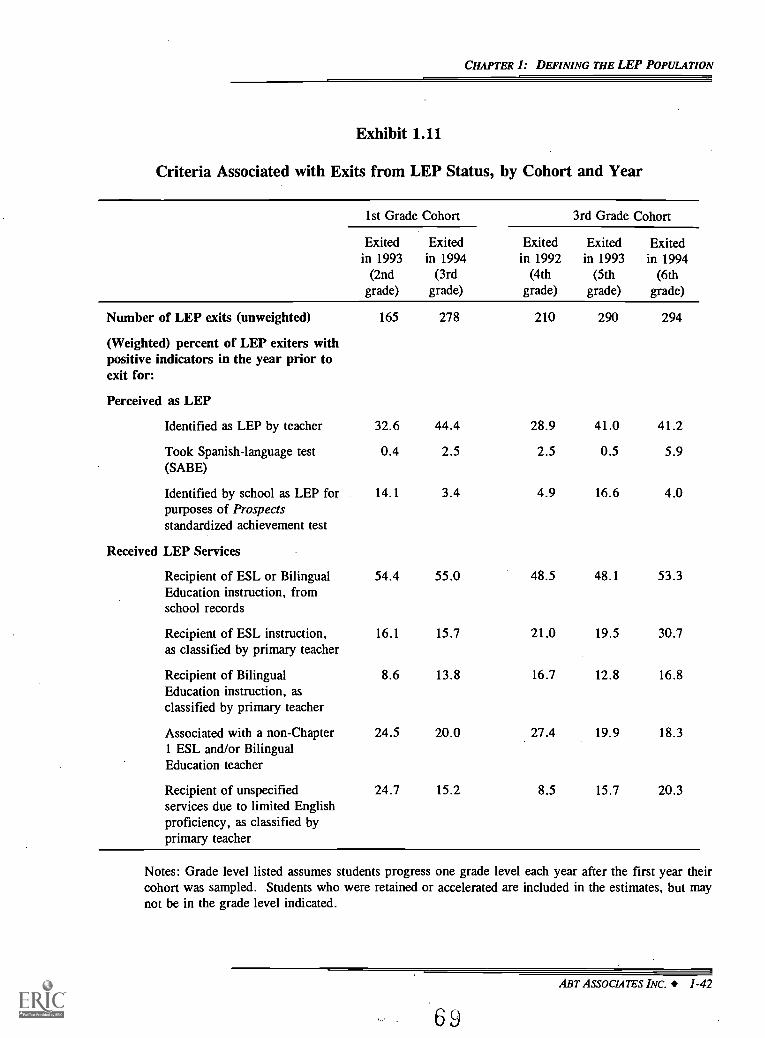
CHAPTER 1: DEFINING THE LEP POPULATION
Exhibit 1.11
Criteria Associated with Exits from LEP Status, by Cohort and Year
1st Grade Cohort 3rd Grade Cohort
Exitedin 1993
(2ndgrade)
Exitedin 1994
(3rdgrade)
Exitedin 1992
(4thgrade)
Exitedin 1993
(5thgrade)
Exitedin 1994
(6thgrade)
Number of LEP exits (unweighted) 165 278 210 290 294
(Weighted) percent of LEP exiters withpositive indicators in the year prior toexit for:
Perceived as LEP
Identified as LEP by teacher 32.6 44.4 28.9 41.0 41.2
Took Spanish-language test 0.4 2.5 2.5 0.5 5.9(SABE)
Identified by school as LEP forpurposes of Prospectsstandardized achievement test
14.1 3.4 4.9 16.6 4.0
Received LEP Services
Recipient of ESL or Bilingual 54.4 55.0 48.5 48.1 53.3Education instruction, fromschool records
Recipient of ESL instruction,as classified by primary teacher
16.1 15.7 21.0 19.5 30.7
Recipient of Bilingual 8.6 13.8 16.7 12.8 16.8Education instruction, asclassified by primary teacher
Associated with a non-Chapter 24.5 20.0 27.4 19.9 18.31 ESL and/or BilingualEducation teacher
Recipient of unspecifiedservices due to limited Englishproficiency, as classified byprimary teacher
24.7 15.2 8.5 15.7 20.3
Notes: Grade level listed assumes students progress one grade level each year after the first year theircohort was sampled. Students who were retained or accelerated are included in the estimates, but maynot be in the grade level indicated.
ABT ASSOCIATES INC. 1-42
6 9
CHAPTER I: DEFINING THE LEP POPULATION
1.4 to 1.8 criteria, depending on the year), leading to percentages in the exhibit that sum to
substantially more than 100. In part for this reason, a wider range of criteria account for
noticeable shares of the LEP exits than was true of LEP entrances.
Unlike entrances, receipt of LEP services plays a visibly larger role in explaining exits
from our LEP defmition than do staff perceptions. The single most common reason for exit is
the discontinuance of ESL or Bilingual Education instruction as reported in school records: 48
to 55 percent of all exits from our LEP defmition followed a year in which services were
reported using this measure. The next most important factor accounting for exits is teacher
identification: 29 to 44 percent of the students who cease to meet any LEP criteria in a given
year were classified by their teacher in the previous year as having limited English proficiency.
It is not surprising that removal of these two criteriaschool records of services and teacher
perceptionsleads to a large share of LEP exits, since the same two criteria are also the most
common reasons for classification as "LEP" in the first place (see Exhibit 1.5).
All of the other measures of service receipt play a smaller but non-trivial role in moving
students out of our LEP category.° The remaining two indicators that school staff perceive a
student to be LEP, having the student take the Spanish-language version of the Prospects tests
or the judgement that the student's English proficiency is not sufficient to take the tests, are
rarely present as LEP indicators the year before a student exits our LEP category. There any
obvious patterns across grade levels in the relative importance of the different LEP factors in
accounting for LEP exits.
Overall, about 30 percent of all students categorized as LEP at some point in the
observation period were no longer classified as "LEP" at the end of data collection (see
Exhibits 1.7 and 1.8, final row and column). This does not mean that 30 percent of students
categorized as LEP achieved English proficiency at the end of the study period, or that 70 percent
were not English proficient. Exits from LEP status depend not just on proficiency standards
(which can differ from school to school) but also on the types of programs and language-related
44 One of the eight LEP criteriaassociation with a non-Chapter 1 ESL and/or bilingual education teacherisnot available in the 1994 data. As a result, every student classified as leaving the "LEP" category in 1994 and whomet this criterion in 1993 is counted in Exhibit 1.10 as having this factor associated with exit. Even so, thepercentage of LEP students exiting for this reason is generally lower in 1994 than in other years, suggesting thatthe omission of this variable has little effect on the tendencies discussed here.
7 0ABT ASSOCIATE'S INC. 1-43
CHAPTER 1: DEFINING THE LEP POPUIATION
services that school offer. In addition to test-based proficiency measures which typically measure
general language skills, exiting also depends on the ability of a student to succeed in learning
curriculum content in classrooms where all instruction is in English. Curricula differ on how
quickly they are designed to transition students into completely English language classrooms, and
the transition may not be related to improvements in English proficiency. For example, a
transitional bilingual education program strives to teach students English so that they can attend
classes taught only in English as soon as possible. These programs typically take two to three
years before the transition is made. On the other hand, developmental bilingual education
programs strive to build proficiency in both English and students' first language, and students
may be in these programs for a longer period of time.
Other research (e.g., Thomas and Collier 1997, Ramirez 1991, and De Avila 1997)
suggests that it takes five to seven years for a student to acquire proficiency in a second language
(as measured by performing at or above the 50th percentile on standardized tests in English),'
which is consistent with our finding that most students identified as LEP remain classified as LEP
for the three or four years (depending on cohort) of the Prospects study. That research also cites
school-level influences on academic success for LEP students, including "cognitively complex
on-grade-level academic instruction" in students' first language or in English.
DEFINING LEP GROUPS AND COMPARISON GROUPS FOR FURTHER ANALYSES
Understanding the size and dynamics of the LEP population is important as background
to later analyses of LEP student characteristics, services, and outcomes. It also provides a basis
for deciding how best to subdivide the student population when comparing LEP and English
proficient students on these factors. Based on the above analysis, we propose to focus the
remainder of the report on two primary comparisons:
Students observed as LEP at some point in the follow-up period, compared withthose who are not, for the 1st grade cohort; and
45 The same research fmds that students with at least two years of native language instruction in their homecountry acquire English proficiency more quickly than students with no native language instruction.
ABT ASSOCIATES INC. 1-44
7 1
CHAPTER 1: DEFINING THE LEP POPULATION
Students observed as LEP at some point in the follow-up period, compared withthose who are not, for the 3rd grade cohort.
Most of the questions surrounding limited English proficient students in U.S. public schools focus
on the first of the two populations in each comparison. These are the students who at some point
during their grade school years are known to have met one or more of the eight LEP service or
perception criteria developed here. Even defined this broadly, the population of interest
constitutes only around 9 percent of the entire student body (see Exhibit 1.12).
For many purposes, it will be useful to contrast LEP students with the rest of the students
in their cohort, as was done in the previous LEP report based on Prospects data (see Puma and
Moss, 1995). The sharpest contrasts can be drawn by excluding LEP students from the
comparison sample and comparing mutually exclusive "LEP" and "not LEP" subpopulations. In
some of our analyses, we will further fine tune the comparison groups by contrasting LEP and
EP students from low-income families. We define low-income families as families with an
average annual family income less than 185 percent of the poverty level, adjusted for family size
(see Exhibit F.1 for sample sizes). The estimates for students from families with higher incomes
will also be shown for completeness. For other analyses, such as the comparison of the quality
and type of educational services provided to students, we will compare LEP students at high-
poverty schools to EP students at high-poverty schools (see Exhibit 2.32 for sample sizes). A
high-poverty school is defined as a school where over half of the students are eligible for free
or reduced-price school lunches. Again, we also present the estimates for students from lower-
poverty schools for completeness.
It will also be useful at times to contrast students who, based on the Prospects' LEP
indicator variables, are identified as being LEP in the early period of the study and as English
proficient in the later period of the study, to the other LEP students: to use our earlier
terminology, to contrast LEP "exiters" to those who do not exit. This juxtapositionas well as
a three-way comparison of exiters, LEP, and English proficient studentswill help to illustrate
the varied experiences of LEP students.
In contrast, we will combine students who enter the "LEP" classification and remain there
throughout the observation period with those who are classified as "LEP" throughout for
7 2ABT ASSOCIATES INC. 1 -45
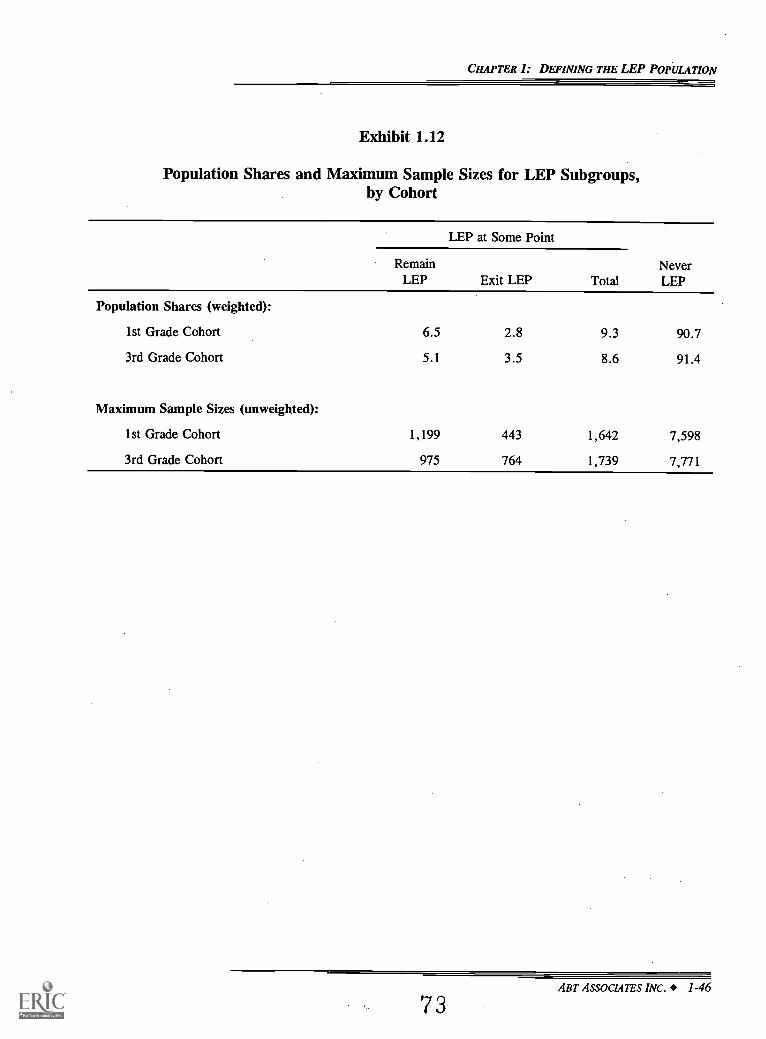
CHAPTER I: DEFINING THE LEP POPULATION
Exhibit 1.12
Population Shares and Maximum Sample Sizes for LEP Subgroups,by Cohort
LEP at Some Point
RemainLEP Exit LEP Total
NeverLEP
Population Shares (weighted):
lst Grade Cohort 6.5 2.8 9.3 90.7
3rd Grade Cohort 5.1 3.5 8.6 91.4
Maximum Sample Sizes (unweighted):
1st Grade Cohort 1,199 443 1,642 7,598
3rd Grade Cohort 975 764 1,739 7,771
ABT ASSOCIATES INC. 1 -46
73
CHAPTER I: DEFINING THE LEP POPULATION
comparison purposes. Like those who do not exit during the study period, these "enterers" were
in the LEP population when last observed and, therefore, could exhibit many of the same
characteristics. They also form a subgroup too small to analyze separately.
Exhibit 1.12 shows the population shares and potential sample sizes for each of the three
LEP subgroups that emerge from this framework, by cohort. It also indicates the dimensions of
the overall split between the LEP and English proficient students, which we would expect to
provide the foundation for most of our analyses. As can be seen, each of the desired subgroups
represents an importantthough sometimes smallcomponent of the overall student population.
It should also be noted that the sample sizes shown in the exhibit represent the maximum
number of individuals in each subgroup that could be available for analysis. Instrument and item
nonresponse will reduce these counts somewhat. Fortunately, oversampling of heavily language-
minority schools provides fairly large LEP samples as a starting point, allowing us to isolate most
of the populations shown in the exhibit.
7 4 ABT ASSOCMTES INC. 1-47
CHAPTER 2: THE CHARACTERISTICS OF LEP STUDENTS AND THEIR FAMILIES
CHAPTER 2
THE CHARACTERISTICS OF LEP STUDENTS AND THEIR FAMILIES
This chapter focuses primarily on demographic and other characteristics of LEP students
and their families, and addresses a key research question: what resourcesdefined broadlydo
LEP students bring with them to school? The background of LEP students is the starting point
for schools. Because home resources are likely to influence educational outcomes for LEP
students, understanding this background is important to understanding the challenges that schools
face in achieving positive outcomes for LEP students. To provide a more complete picture of
LEP students' background, however, we include in this chapter a brief examination of the extent
to which LEP students attend schools that are high-poverty and have high concentrations of LEP
students.
For purposes of this chapter, resources are broadly defined to include not just economic
factors but also language background, home supports, parent involvement and expectations,
student attitudes and self-perceptions, and school mobility, because all these factors may influence
educational outcomes.
Other Research on LEP Students' Characteristics
Very few attempts have been made to get a nationally representative picture of the
characteristics of LEP students and their families, and none have looked at as broad a range of
characteristics as in the Prospects study.' Much of the debate on LEP students and outcomes
has focused on data from cross-sectional sources and aggregate data that does not allow adequate
analysis of student instruction and outcomes. Because it is nationally representative and
longitudinal, Prospects is valuable both in providing new information about LEP students and
potentially for policy improvement.
Two of the most ambitious recent studies of LEP and language minority students are Burkheimer, et al.(1989) and Ramirez et al. (1991).
ART ASSOCIATES INC. 2-1
7 5
CHAPTER 2: THE CHARACTERISTICS OF LEP STUDENTS AND THEIR FAMILIES
Overview of this Chapter
For most of the analysis in this chapter we compare low-income LEP students to low-
income English-proficient (EP) students, to get a sense of the extent to which LEP students differ
from their economic peers. We begin the analysis, however, by examining characteristics for
which such a comparison is less relevant; i.e., race, native language, geographic distribution, and
language proficiency. These results provide the most basic picture of LEP students in the U.S.:
what schools they go to, where they are from, where they live, and how well they speak both
English and their native language. The second section in this chapter addresses the issue ofhow
low-income LEP students differ from low-income English proficient students. We address this
question on a number of dimensions, including income, parent education and employment, family
structure, parent involvement and expectations, student attitudes and self-perceptions, and school
mobility. These results demonstrate the extent to which LEP students are more disadvantaged
than EP students in similar economic circumstances. The third section in this chapter provides
a school-level perspective, showing the extent to which LEP students attend high-poverty schools
and schools with high concentrations of LEP students. The chapter ends with a brief summary
of key findings.
As in every chapter in this report, the primary sample of interest is students who are
categorized as LEP in any year of the observation period. In this chapter we further focus many
of our findings on the subset of the primary sample of LEP students who are in low-income
families (families with an average annual family income less than 185 percent of the poverty
level, adjusted for family size), which includes about 85 percent of all LEP students. This allows
us to disentangle, at least partly, the characteristics associated with limited English proficiency
from the characteristics associated with low income.
All tabulations in this chapter are based on population weights. These weighted
tabulations provide a nationally representative picture of both LEP students and all public school
students.
As in most of this report, missing data have been imputed for the variables used in this
chapter. Appendix D describes the imputation process.
ABT ASSOCIATES INC. 2-2
76
CHAPTER 2: THE CHARACTEIUSTICS OF LEP STUDENTS AND THEIR FAMILIES
THE CHARACTERISTICS OF ALL LEP STUDENTS
This section provides a basic description of the entire LEP population, for characteristics
that are especially relevant to LEP students. In the subsequent section we focus on low-income
LEP students and how they differ from low-income EP students, but it is helpful to start with a
basic picture of the entire LEP population.
Ethnicity and Native Language Characteristics
As can be seen from Exhibit 2.1, the vast majority of LEP students in our samplei.e.,
students who this study defines as LEP in at least one year of the studyare Hispanic. Across
both the 1st and 3rd grade cohorts, nearly three-fourths of all LEP students are of Hispanic
origin. The second-largest ethnicity among LEP students is Asian, representing more than one-
tenth of the LEP population across each of the 1st and 3rd grade cohorts. White and Black non-
Hispanic LEP students constitute relatively small portions (approximately seven and five percent,
respectively) of the LEP population.2 The racial/ethnic distributions of LEP students across
cohorts are very similar. The preponderance of LEP students of Hispanic origin means that most
of the findings for LEP students in this report hold also for Hispanic LEP students.3
The distribution of native languages among LEP students closely follows the distribution
of LEP student ethnicities. Exhibit 2.2 shows that Spanish is the native language for nearly
75 percent of LEP students, and Asian languages (Chinese, Japanese, Korean, Filipino,
Vietnamese, other Asian) together comprise about 13 percent of LEP students' native languages.
Geographic Distribution
LEP students in the United States are largely concentrated in the West and South; together
these regions include 80 percent of LEP students. (The regions in this study follow the U.S.
Census Bureau definitions. Exhibit B.1 in Appendix B lists the states in each Census region.)
2 Data collected from schools do not include country of origin for white LEP students and black, non-HispanicLEP students.
3 Because there is no other racial/ethnic group of sufficient size in our sample, findings presented in this reportby race/ethnicity are only presented for Hispanic and Asian students.
ABT ASSOCIATES INC. 2-3
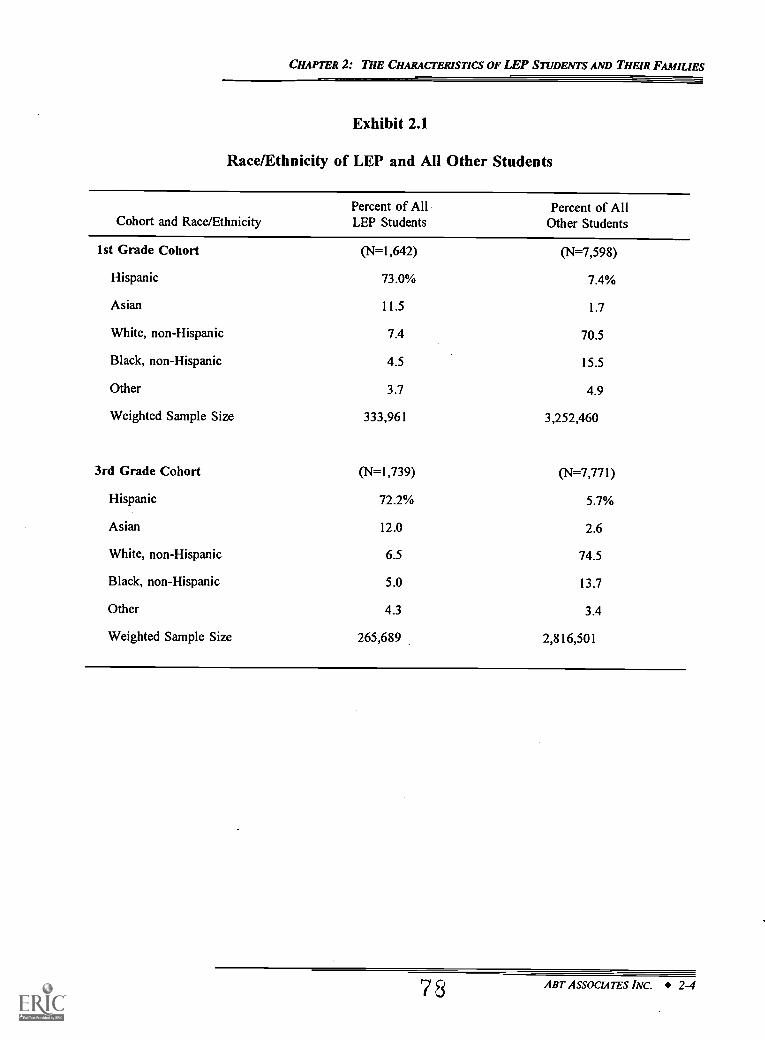
CHAPTER 2: THE CHARACTERISTICS OF LEP STUDENTS AND THEIR FA.MILIES
Exhibit 2.1
Race/Ethnicity of LEP and All Other Students
Cohort and Race/EthnicityPercent of AllLEP Students
1st Grade Cohort (N=1,642)
Hispanic 73.0%
Asian 11.5
White, non-Hispanic 7.4
Black, non-Hispanic 4.5
Other 3.7
Weighted Sample Size 333,961
3rd Grade Cohort (N=1,739)
Hispanic 72.2%
Asian 12.0
White, non-Hispanic 6.5
Black, non-Hispanic 5.0
Other 4.3
Weighted Sample Size 265,689
Percent of AllOther Students
(N=7,598)
7.4%
1.7
70.5
15.5
4.9
3,252,460
(N=7,771)
5.7%
2.6
74.5
13.7
3.4
2,816,501
7 8 ABT ASSOCIATES INC. 2-4
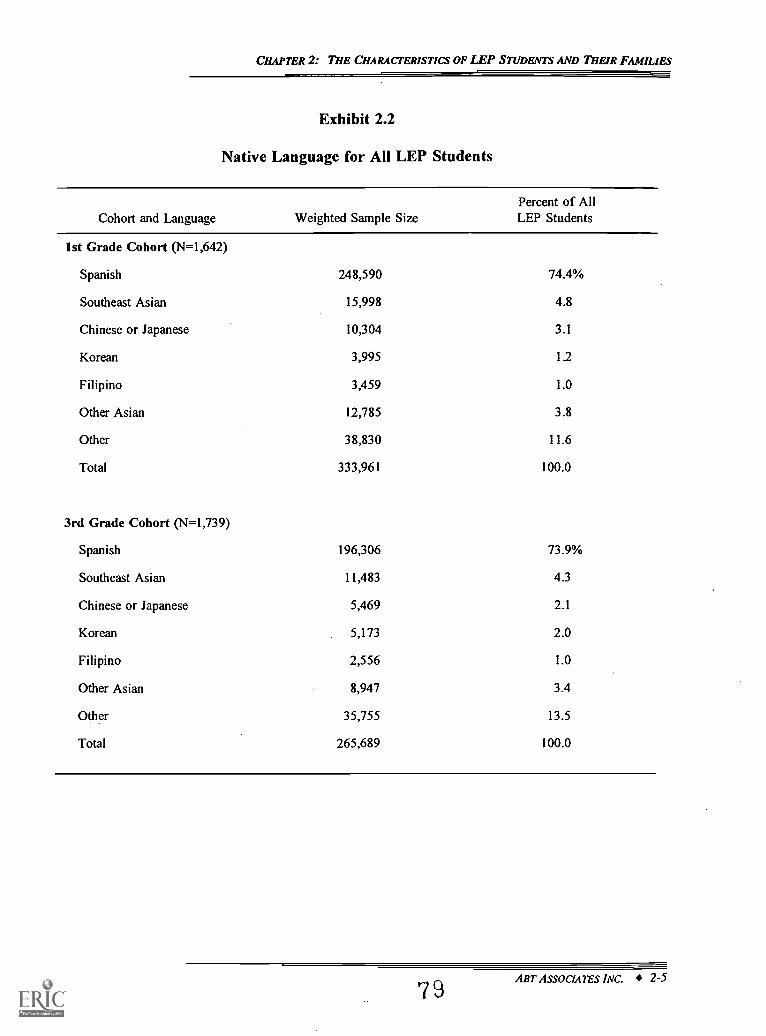
CHAPTER 2: THE CHARACTERISTICS OF LEP STUDENTS AND THEIR FAMILIES
Exhibit 2.2
Native Language for All LEP Students
Cohort and Language Weighted Sample SizePercent of AllLEP Students
1st Grade Cohort (N=1,642)
Spanish 248,590 74.4%
Southeast Asian 15,998 4.8
Chinese or Japanese 10,304 3.1
Korean 3,995 1.2
Filipino 3,459 1.0
Other Asian 12,785 3.8
Other 38,830 11.6
Total 333,961 100.0
3rd Grade Cohort (N=1,739)
Spanish 196,306 73.9%
Southeast Asian 11,483 4.3
Chinese or Japanese 5,469 2.1
Korean 5,173 2.0
Filipino 2,556 1.0
Other Asian 8,947 3.4
Other 35,755 13.5
Total 265,689 100.0
7 9ABT ASSOCIATES INC. 2-5
CHAPTER 2: THE CHARACTERISTICS OF LEP STUDENTS AND THEIR FAMILIES
As Exhibit 2.3 shows, in both cohorts the great majority of LEP students are in the West and
South regions. About 85 percent of all LEP students live in the West or South, with about half
of all LEP students in the West region alone. Slightly more than 10 percent of the LEP student
population lives in the Northeast region, while only about five percent lives in the Midwest
region.'
Broken out by ethnicity, the regional distribution of Hispanic LEP students is quite similar
to the regional distribution for all LEP students, as shown in Exhibit 2.4. This is not surprising
given that Hispanic students make up about three-fourths of the LEP sample. The residence of
Asian students, however, is more evenly distributed across regions, with the West still being the
largest, and the South and Northeast having a roughly equal share across cohorts.
Exhibit 2.5 shows the five states in our sample with the largest share of LEP students.
Although the sample is nationally representative by region, it is not nationally representative by
state, because not all states were included in the study sample. Therefore the exhibit presents
unweighted numbers. It is nevertheless useful to know where the majority of the LEP students
in our sample live. Overall, California accounts for close to 20 percent of the LEP students in
this study, with another 12 percent living in Texas. New York, Pennsylvania and Georgia also
had significantalbeit much smallerLEP concentrations. Within each cohort, these five states
with the most LEP students account for about half of all the (unweighted) LEP students in the
study.
In terms of urbanicity, LEP students are somewhat more likely to attend urban than
suburban schools, and only a small fraction attend schools in rural areas. Exhibit 2.6 shows that,
across cohorts, slightly more than half of the LEP population lives in urban areas, a little over
40 percent live in suburban areas, with only about five percent in rural areas. Compared to other
public school students, LEP students are much more likely to attend urban schools. Because
urban schools tend to have higher levels of poverty and violence, their urban concentration means
that LEP students face an additional educational disadvantage beyond their limited English
proficiency.
4 Compared to all other students in the sample (i.e., English proficient students), LEP students are more likelyto be located in the West and less likely to be located in the other three regions.
ABT ASSOCIATES INC. 2-6
8 0
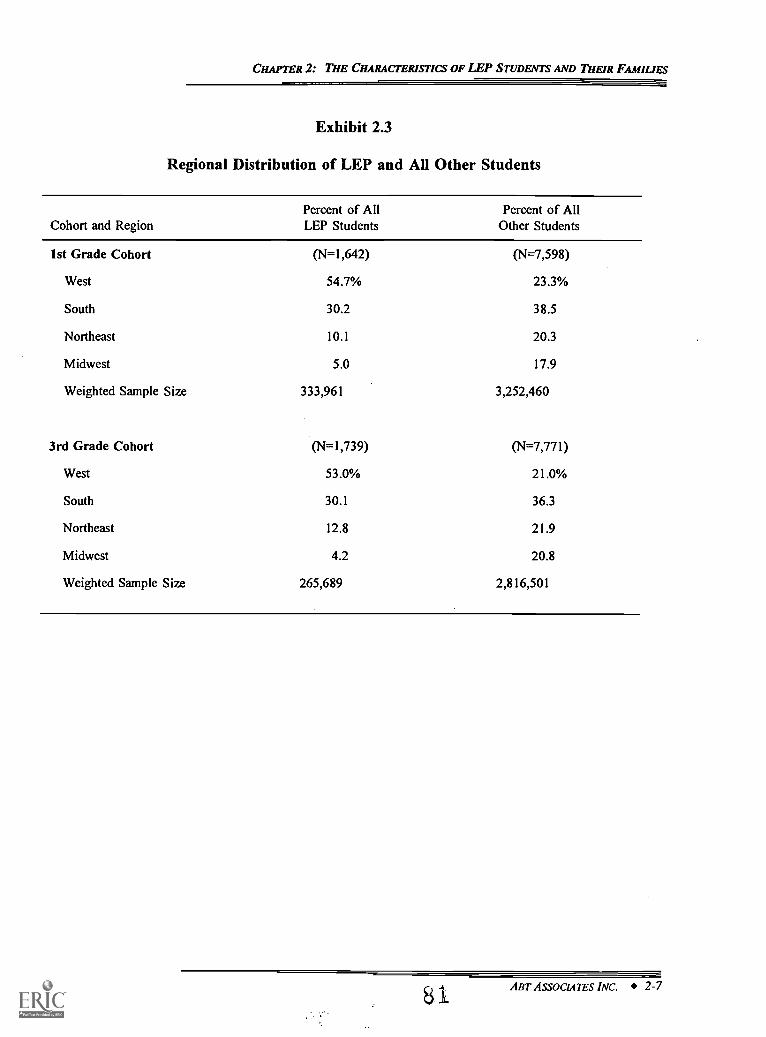
CHAPTER 2: THE CHARACTERISTICS OF LEP STUDENTS AND THEIR FAMILIES
Exhibit 2.3
Regional Distribution of LEP and All Other Students
Cohort and RegionPercent of AllLEP Students
Percent of AllOther Students
1st Grade Cohort (N=1,642) (N=7,598)
West 54.7% 23.3%
South 30.2 38.5
Northeast 10.1 20.3
Midwest 5.0 17.9
Weighted Sample Size 333,961 3,252,460
3rd Grade Cohort (W1,739) (N=7,771)
West 53.0% 21.0%
South 30.1 36.3
Northeast 12.8 21.9
Midwest 4.2 20.8
Weighted Sample Size 265,689 2,816,501
81ABT ASSOCIATES INC. 2-7
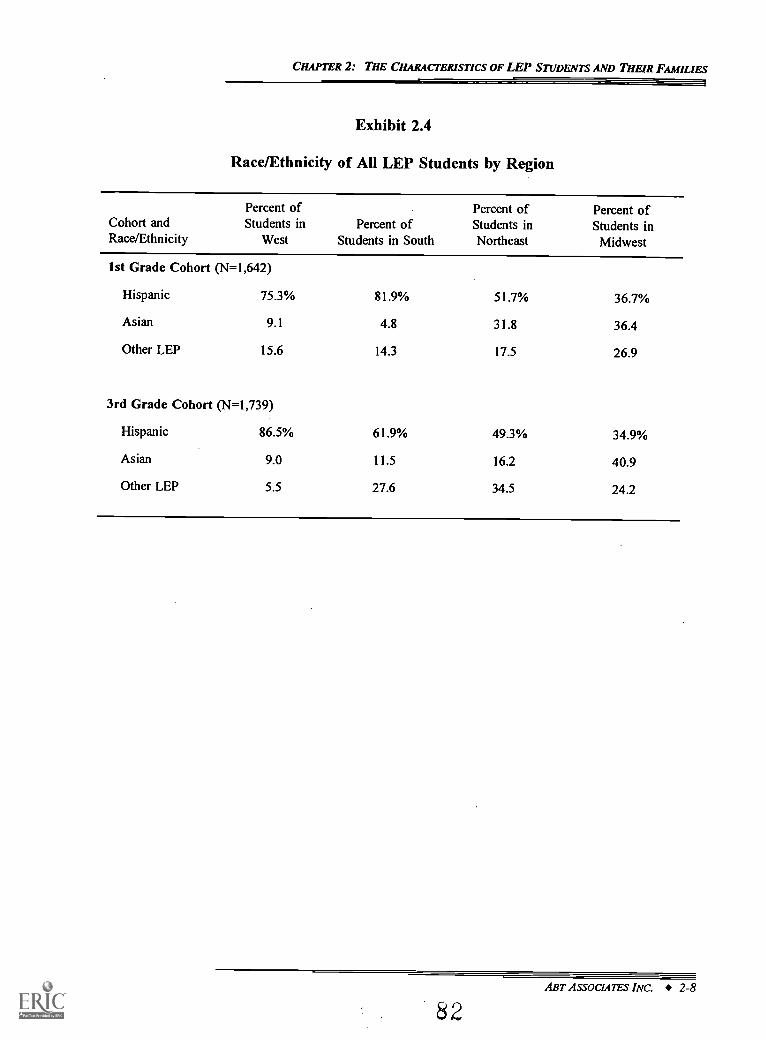
CHAPTER 2: THE CHARACTERISTICS OF LEP STUDENTS AND THEIR FAMILIES
Exhibit 2.4
Race/Ethnicity of All LEP Students by Region
Cohort andRace/Ethnicity
Percent ofStudents in
WestPercent of
Students in South
Percent ofStudents inNortheast
Percent ofStudents in
Midwest
1st Grade Cohort (N=1,642)
Hispanic 75.3% 81.9% 51.7% 36.7%
Asian 9.1 4.8 31.8 36.4
Other LEP 15.6 14.3 17.5 26.9
3rd Grade Cohort (N=1,739)
Hispanic 86.5% 61.9% 49.3% 34.9%
Asian 9.0 11.5 16.2 40.9
Other LEP 5.5 27.6 34.5 24.2
ABT ASSOCIATES INC. 2-8
82
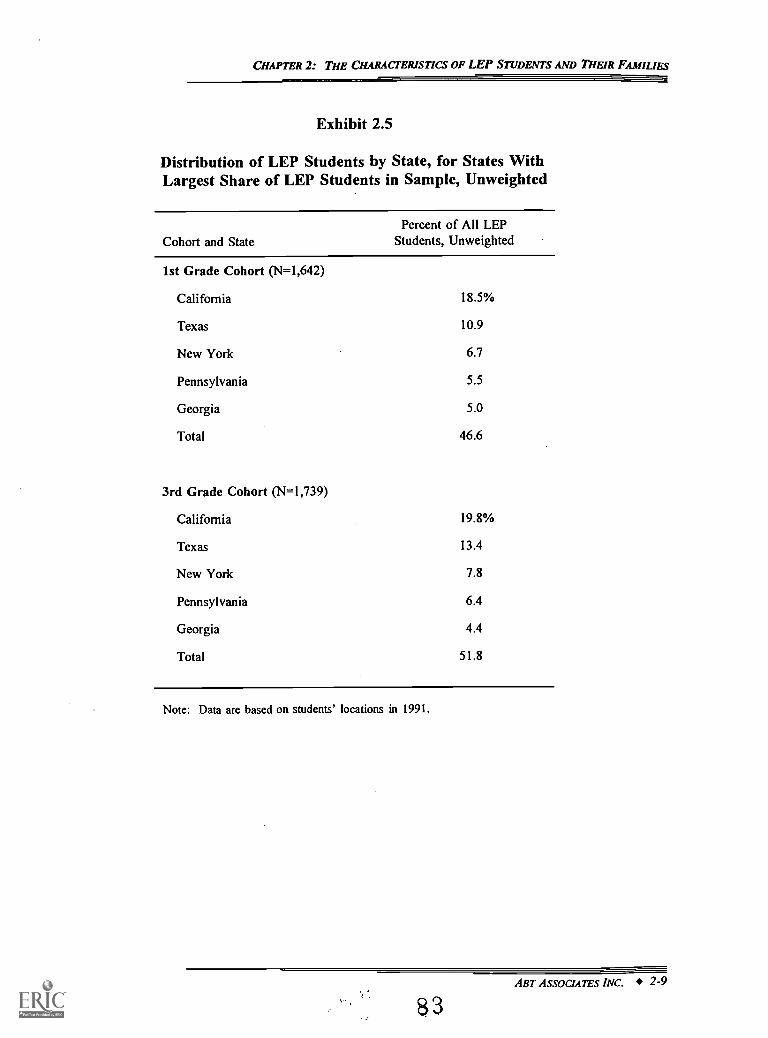
CHAPTER 2: THE CHARACTERISTICS OF LEP STUDENTS AND THEIR FAMILIES
Exhibit 2.5
Distribution of LEP Students by State, for States WithLargest Share of LEP Students in Sample, Unweighted
Cohort and StatePercent of All LEP
Students, Unweighted
1st Grade Cohort (N=1,642)
California 18.5%
Texas 10.9
New York 6.7
Pennsylvania 5.5
Georgia 5.0
Total 46.6
3rd Grade Cohort (N=1,739)
California 19.8%
Texas 13.4
New York 7.8
Pennsylvania 6.4
Georgia 4.4
Total 51.8
Note: Data are based on students' locations in 1991.
ABT ASSOCIATES INC. 2-9
83
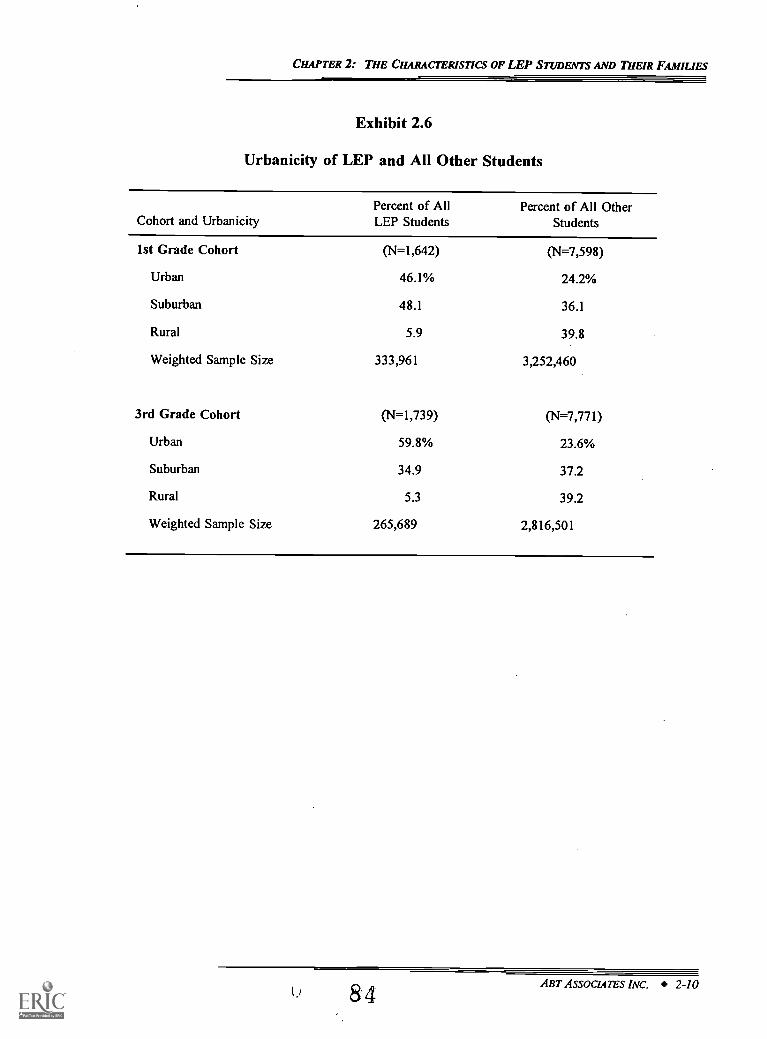
CHAPTER 2: THE CHARACTERISTICS OF LEP STUDENTS AND THEIR FAMILIES
Exhibit 2.6
Urbanicity of LEP and All Other Students
Cohort and UrbanicityPercent of AllLEP Students
Percent of All OtherStudents
1st Grade Cohort (N=1,642) (N=7,598)
Urban 46.1% 24.2%
Suburban 48.1 36.1
Rural 5.9 39.8
Weighted Sample Size 333,961 3,252,460
3rd Grade Cohort (N=1,739) (N=7,771)
Urban 59.8% 23.6%
Suburban 34.9 37.2
Rural 5.3 39.2
Weighted Sample Size 265,689 2,816,501
1.) 8 4ABT ASSOCIATE'S INC. 2-10
CHAPTER 2: THE CHARACTERISTICS OF LEP STUDENTS AND THEIR FAMIUES
Language Proficiency
This section examines the native and English language proficiencies of LEP students in
the earliest available year of our study, and the English language proficiency of their parents.5
(Students' English language proficiency is also a key outcome examined in Chapter 4.) These
variables are indicators of the language "resources" of LEP students at the earliest point of
observation in this study. Higher levels of English proficiency at a point in time mean students
are that much closer to becoming fully proficient in English. Greater native language proficiency
may provide a cognitive base for acquiring a second language and, other things equal, may be
positively associated with academic achievement (Bankston and Zhou 1995). Finally, parents
with greater English proficiency may be better able to help their children acquire English
language skills.
Students' Native Language Proficiency. Teachers were asked to characterize students'
proficiency in their native language along four domains of increasing complexity: understanding,
speaking, reading, and writing. Survey questions on the reading and writing abilities of first
graders and other young students tap general perceptions of readiness to read and write as well
as the actual performace for those few students who do read or write at some level at those ages.
Despite this constraint, the questions provide a rough measure of readiness to learn and
performance in those areas.
Using teachers' assessments is perhaps the simplest approach to assessing native language
proficiency. A disadvantage of this approach is that it relies on the subjective judgements of a
large number of teachers, which clouds comparisons across students. That is, teachers may have
used different comparison groups in answering the language ability questions; teachers may have
compared LEP students to other LEP students, to all other students in their classroom, or to
students in other grades. Further, many of these teachers are likely not proficient in students'
5 For the 1st grade cohort the earliest point of observation is the spring of 1992, which is the end of the 1stgrade. Only test score data were collected for this cohort in 1991 (in the fall). For the 3rd grade cohort the earliestpoint of observation is the spring of 1991, which is the end of the 3rd grade.
ABT ASSOCIATES INC. 2-11
85
CHAPTER 2: THE CHARACTERISTICS OF LEP STUDENTS AND THEIR FAMILIES
native languages, which makes it difficult to assess proficiency accurately.' Although these
assessments must be interpreted with caution, they may be useful as rough benchmarks of
students' native language proficiency, and as measures of how teachers view LEP students' native
language proficiency. (See Appendix I for a detailed analysis of the validity of teacher
judgements of English proficiency.)
As shown in Exhibit 2.7, although about 50 to 60 percent of LEP students across both
cohorts are judged by their teachers to have good or excellent proficiency in understanding and
speaking their native language, proficiency in reading and writing is much lower. Only about
20 percent of LEP students in the 1st grade cohort, and 25 percent in the 3rd grade cohort, are
judged to have good or excellent proficiency in reading or writing their native language. This
may be because some LEP students emigrated to the U.S. when they were very young, so they
did not have enough time to master their native language. It may also be that teachers are
unlikely to characterize students this young as having mastered any language, especially not in
terms of reading and writing. Averaging across the four skills, more than one-fourth of the LEP
students in both cohorts are judged to have poor or no native language proficiency, which may
be expected to impede their acquisition of English proficiency, other things being equal (Thomas
and Collier 1997, Ramirez 1991, De Avila 1997, and Cummins 1981).
Comparing LEP students' native language proficiency across cohorts could in principle
show whether native language proficiency tends to improve or decline with age. Other research
suggests that, on average, native language proficiency may decline with age, especially if
students' native language skills are not developed in school (Wong Fillmore 1991).
But a cross-cohort comparison is complicated by the possibility of a compositional
difference between the two cohorts. Every year some students exit LEP status. If the students
who exit LEP status by the end of first or second grade tend to have relatively weaker native
language proficiency (and relatively stronger English proficiency), then students who remain LEP
in third grade might have stronger native language proficiency on average than students who are
6An analysis based on data from the 1988 National Education Longitudinal Study of 1988 found that teachers
are less likely to identify students as being language minority than are the students themselves (U.S. Department ofEducation 1992). It is unclear, however, what effect this tendency might have on teacher assessments of students'native language proficiency See also U.S. Department of Education 1997.
ABT ASSOCIATES INC. 2-12
86
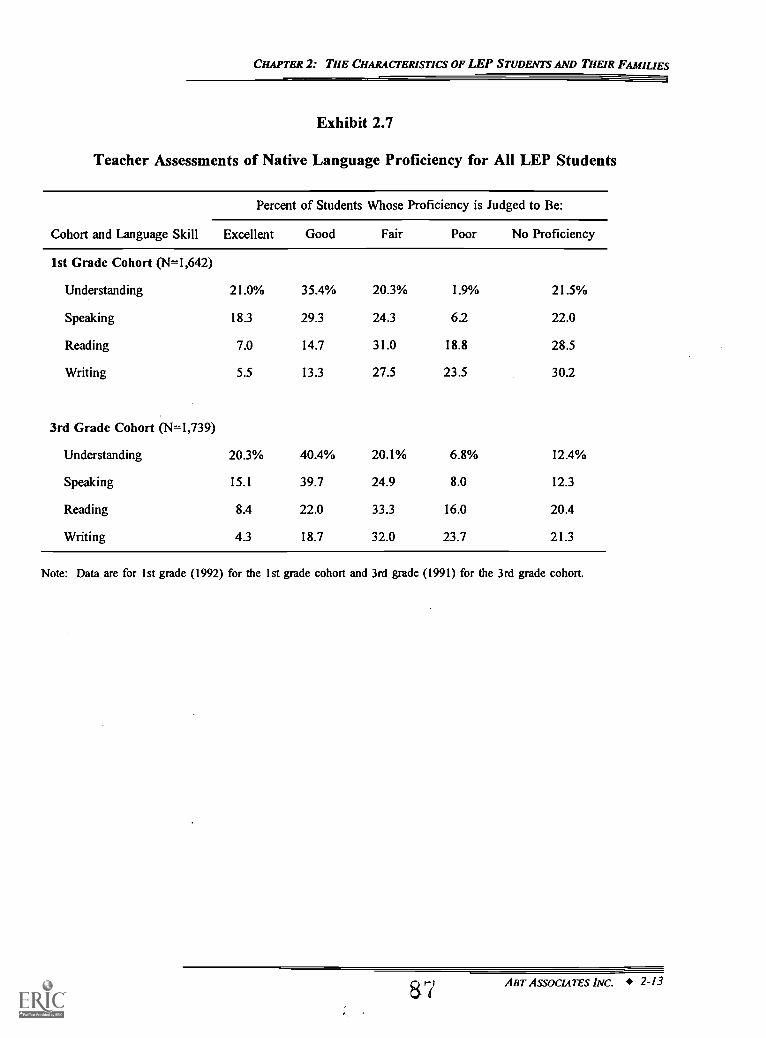
CHAPTER 2: THE CHARACTERISTICS OF LEP STUDENTS AND THEIR FAMILIES
Exhibit 2.7
Teacher Assessments of Native Language Proficiency for All LEP Students
Percent of Students Whose Proficiency is Judged to Be:
Cohort and Language Skill Excellent Good Fair Poor No Proficiency
1st Grade Cohort (N=1,642)
Understanding 21.0% 35.4% 20.3% 1.9% 21.5%
Speaking 18.3 29.3 24.3 6.2 22.0
Reading 7.0 14.7 31.0 18.8 28.5
Writing 5.5 13.3 27.5 23.5 30.2
3rd Grade Cohort (14=1,739)
Understanding 20.3% 40.4% 20.1% 6.8% 12.4%
Speaking 15.1 39.7 24.9 8.0 12.3
Reading 8.4 22.0 33.3 16.0 20.4
Writing 4.3 18.7 32.0 23.7 21.3
Note: Data are for 1st grade (1992) for the 1st grade cohort and 3rd grade (1991) for the 3rd grade cohort.
8,7ABT ASSOCIATES INC. 2-13
CHAPTER 2: THE CHARACTERISTICS OF LEP STUDENTS AND THEIR FAMIUES
LEP in the first grade. If so, we would expect that the 3rd grade cohort LEP students would
have greater native language proficiency in the third grade than 1st grade cohort LEP students
in the first grade.'
In fact the data show this pattern: LEP students in the 1st grade cohort are more likely
to be judged as having no proficiency in their native language, compared to the 3rd grade cohort.
An alternative explanation to the compositional effect just advanced is that native language skills
may tend to improve over time, at least in the early elementary years. This could occur through
native language instruction in school, or through use of the native language at home.'
Teacher assessments of native language proficiency are fairly similar for Hispanic and
Asian LEP students, as shown in Exhibit 2.8, except that slightly more Hispanic students are
judged to have good or excellent native language proficiency. One way in which this might
occur is if Hispanic students are more likely to live in ethnically homogeneous neighborhoods.
For the most part, though, in the view of their teachers, both Hispanic and Asian LEP students
bring about the same level of native language skills to school.
Students' English Language Proficiency. Teachers were asked to assess students'
English language proficiency in the same way as native language proficiency, judging separately
on the domains of understanding, speaking, reading, and writing.' Exhibit 2.9 shows that,
consistent with other research on second language acquisition, proficiency in understanding and
speaking precedes proficiency in reading and writing. (See for example D'Avila 1997. This
same pattern holds for native language proficiency, as shown earlier in Exhibit 2.7.) Exhibit 2.9
also shows that teachers generally judge LEP students to be more proficient in English than in
their native language. (See Exhibit 2.7 for comparison.) For example, over 40 percent of the
LEP students in each cohort were rated as having good or excellent proficiency in writing
7Another reason why 3rd grade cohort LEP students might have greater initial native language proficiency
is if they are on average more recent immigrants to the U.S.
The native language proficiency of 3rd grade cohort LEP students appears to improve slightly from 3rd gradeto 4th grade. In third grade about 37 percent of LEP students are judged to have good or excellent native languageproficiency, and in fourth grade the corresponding figure is 42 percent.
9 Appendix I examines in detail the validity of teacher judgements of students' English proficiency.
ABT ASSOCIATES INC. 2-14
8 8
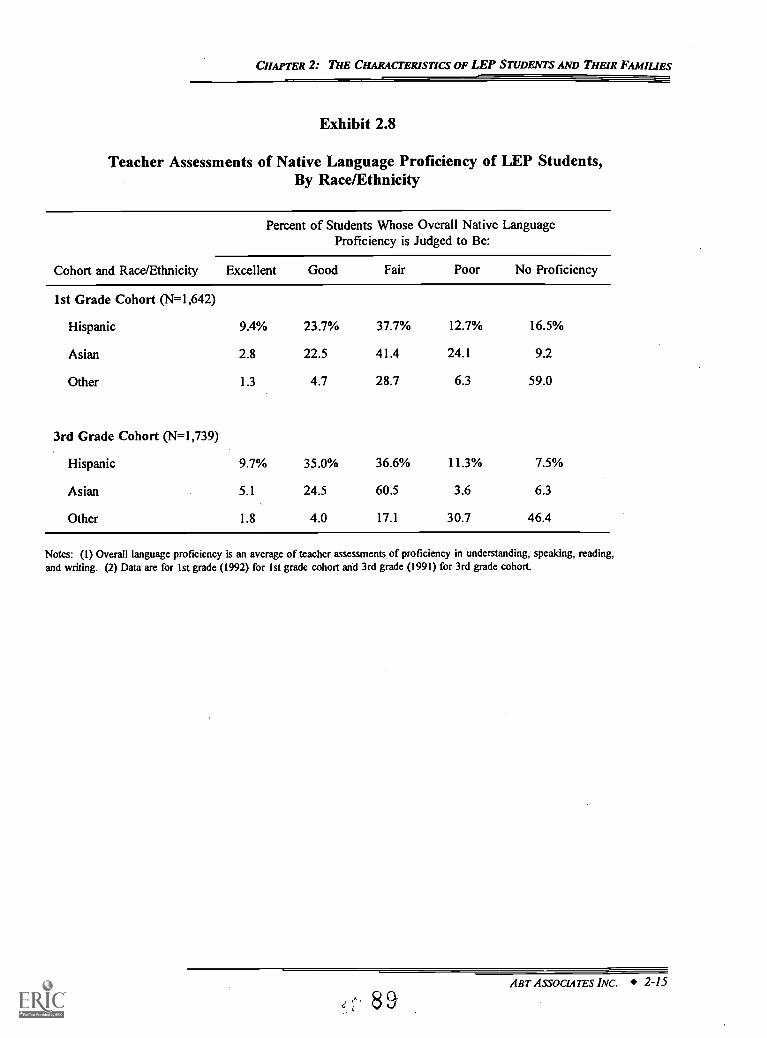
CHAPTER 2: THE CHARACTERISTICS OF LEP STUDENTS AND THEIR FAMILIES
Exhibit 2.8
Teacher Assessments of Native Language Proficiency of LEP Students,By Race/Ethnicity
Percent of Students Whose Overall Native LanguageProficiency is Judged to Be:
Cohort and Race/Ethnicity Excellent Good Fair Poor No Proficiency
1st Grade Cohort (N=1,642)
Hispanic 9.4% 23.7% 37.7% 12.7% 16.5%
Asian 2.8 22.5 41.4 24.1 9.2
Other 1.3 4.7 28.7 6.3 59.0
3rd Grade Cohort (N=1,739)
Hispanic 9.7% 35.0% 36.6% 11.3% 7.5%
Asian 5.1 24.5 60.5 3.6 6.3
Other 1.8 4.0 17.1 30.7 46.4
Notes: (1) Overall language proficiency is an average of teacher assessments of proficiency in understanding, speaking, reading,and writing. (2) Data are for 1st grade (1992) for 1st grade cohort and 3rd grade (1991) for 3rd grade cohort.
ABT ASSOCIATES INC. 2-15
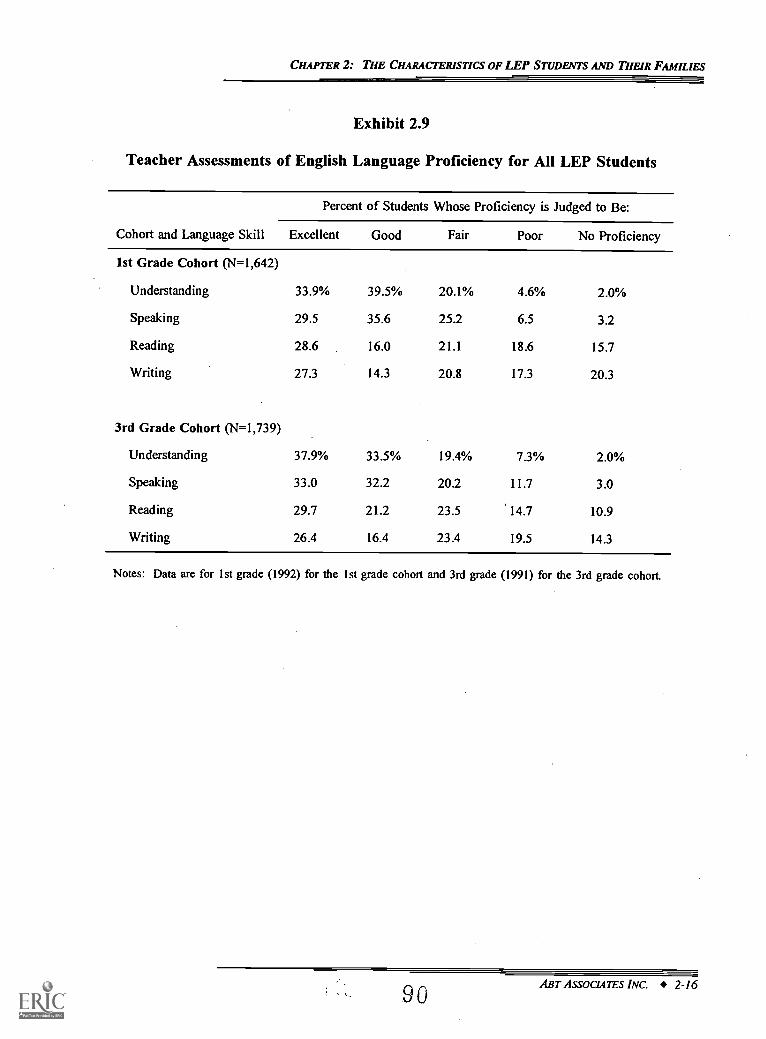
CHAPTER 2: THE CHARACTERISTICS OF LEP STUDENTS AND THEIR FAMILIES
Exhibit 2.9
Teacher Assessments of English Language Proficiency for All LEP Students
Percent of Students Whose Proficiency is Judged to Be:
Cohort and Language Skill Excellent Good Fair Poor No Proficiency
1st Grade Cohort (N=1,642)
Understanding 33.9% 39.5% 20.1% 4.6% 2.0%
Speaking 29.5 35.6 25.2 6.5 3.2
Reading 28.6 16.0 21.1 18.6 15.7
Writing 27.3 14.3 20.8 17.3 20.3
3rd Grade Cohort (N=1,739)
Understanding 37.9% 33.5% 19.4% 7.3% 2.0%
Speaking 33.0 32.2 20.2 11.7 3.0
Reading 29.7 21.2 23.5 14.7 10.9
Writing 26.4 16.4 23.4 19.5 14.3
Notes: Data are for 1st grade (1992) for the 1st grade cohort and 3rd grade (1991) for the 3rd grade cohort
9 0ABT ASSOCIATES INC. 2-16
CHAPTER 2: THE CHARACTERISTICS OF LEP STUDENTS AND THEIR FAMILIES
English, compared to approximately 20 percent with good or excellent proficiency in writing their
native language.
This provides a rough benchmark of the student's knowledge of her home language.
Since many of these LEP students have had little or no formal education in that home language,
it is not surprising that many have little or no proficiency in reading or writing that language.
Since many teachers in the survey have little occasion to interact with the child in the child's
mother tongue (and many of the surveyed teachers have little or no proficiency in the child's
language), the teacher survey response should be taken as a rough benchmark for estimating these
language skills. Analyses of survey results suggest that there are often considerable measurement
errors in survey reports by teachers and others of a child's language background.m Finally, as
noted at other points in this report, while a child may have limited knowledge of her mother
tongue, she may still benefit from support in English language classrooms because her knowledge
of the English language skills required to understand what is taught and to successfully complete
assignments in English is often limited.
There is little difference in the proficiency patterns for the 1st and 3rd grade cohorts,
which supports the possibility of a composition effect, as discussed earlier. We expect English
language proficiency to improve over time, so the fact that the 1st and 3rd grade cohorts are
similar suggests that the LEP students in the 3rd grade cohort may have started 1st grade with
lower levels of English proficiency than those of the 1st grade cohort, or that LEP students in
the 3rd grade cohort may have come to the U.S. more recently than LEP students in the 1st grade
cohort. Further supporting for a composition effect is the fact that English proficiency for the
3rd grade cohort grows considerably from 3rd to 4th grade, from 51 percent judged good or
excellent to 61 percent (not shown in the exhibit).
Unlike for native language proficiency, there are clear differences in teachers' assessments
of the English proficiency of Hispanic and Asian students. As Exhibit 2.10 shows, in both
cohorts about two-thirds of Asian students are judged to have good or excellent English
proficiency, compared to well under half of Hispanic students.
io See, for example, U.S. Department of Education 1997b, and U.S. Department of Education 1992.
91 ABT ASSOCIATES INC. 2-17
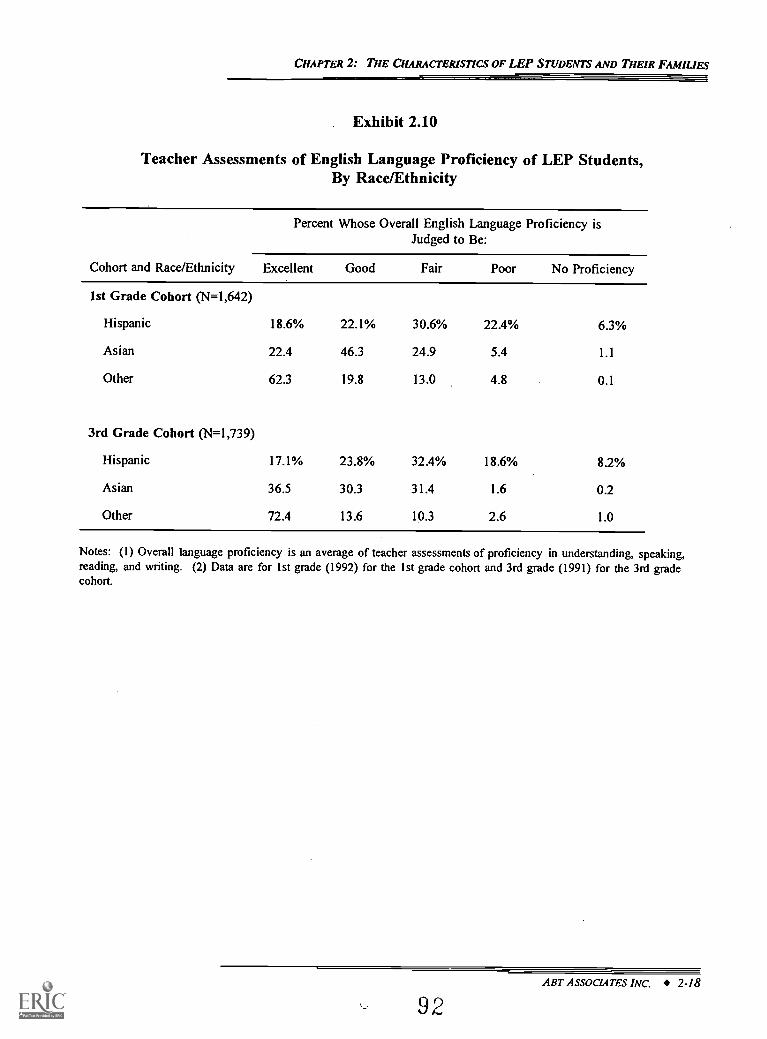
CHAPTER 2: THE CHARACTERISTICS OF LEP STUDENTS AND THEIR FAMILIES
. Exhibit 2.10
Teacher Assessments of English Language Proficiency of LEP Students,By Race/Ethnicity
Percent Whose Overall English Language Proficiency isJudged to Be:
Cohort and Race/Ethnicity Excellent Good Fair Poor No Proficiency
1st Grade Cohort (N=1,642)
Hispanic 18.6% 22.1% 30.6% 22.4% 6.3%
Asian 22.4 46.3 24.9 5.4 1.1
Other 62.3 19.8 13.0 4.8 0.1
3rd Grade Cohort (N=1,739)
Hispanic 17.1% 23.8% 32.4% 18.6% 8.2%
Asian 36.5 30.3 31.4 1.6 0.2
Other 72.4 13.6 10.3 2.6 1.0
Notes: (1) Overall language proficiency is an average of teacher assessments of proficiency in understanding, speaking,reading, and writing. (2) Data are for 1st grade (1992) for the 1st grade cohort and 3rd grade (1991) for the 3rd gradecohort.
ABT ASSOCIATES INC. 2-18
92
CHAPTER 2: THE CHARACTERISTICS OF LEP STUDENTS AND THEIR FAMILIES
Exhibit 2.11 shows the relationship between students' native language and English
proficiency. There is a weak negative correlation between native and English proficiency for
both cohorts, but it exists because of the sizeable fraction of students who are judged to have no
proficiency in their native language and excellent proficiency in English. It may be that some
of these students should not be classified as LEP." When this subgroup is eliminated, there is
essentially no correlation between native language and English proficiency.
Students without a firm knowledge of either their native langimge or English may face
particularly serious educational challenges. Fortunately, the fraction of LEP students who have
poor or no proficiency in both languages is small: 3 percent in the 1st grade cohort and 5 percent
in the 3rd grade cohort (not shown in exhibit). Because native language proficiency may aid in
the acquisition of English proficiency, this small group of LEP students may be expected to take
longer on average to become English proficient (Thomas and Collier 1997, Ramirez 1991, De
Avila 1997, and Cummins 1981).
Parents' English Language Proficiency and Use of English at Home. Slightly more
than half of the parents of LEP students report that they have some command of English.
However, Exhibit 2.12 shows that a large fraction of LEP students' parentsmore than one-third
in the 1st grade cohort and close to one-half in the 3rd grade cohortconsider their English
language skills to be weak.' Students from these households are likely to rely heavily on
schools for improving their English proficiency, although parental support is doubtless important
to students' acquisition of English. The exhibit also shows that parents in the 3rd grade cohort
report a slightly weaker command of English. This could be due to a possible compositional
difference between LEP students in the two cohorts, as noted earlier.
It is possible that some fraction of these students are native English speakers in programs such as two-waybilingual programs. As explained in Appendix A, we used a two-step process to try to exclude these students fromour LEP definition. But, generally speaking, some small degree of measurement error can be expected with surveydata.
12 The percentage of LEP students' parents with weak English skills may be underestimated here for tworeaso' ns. First, other research on adults has found a tendency to overstate English proficiency as judged byperformance on standardized tests (U.S. Department of Education 1993). Second, in sample members' householdswhere two parents had different levels of English proficiency, the survey respondent may have more likely been theparent with better English proficiency.
9 3ART ASSOCIATES INC. 2-19
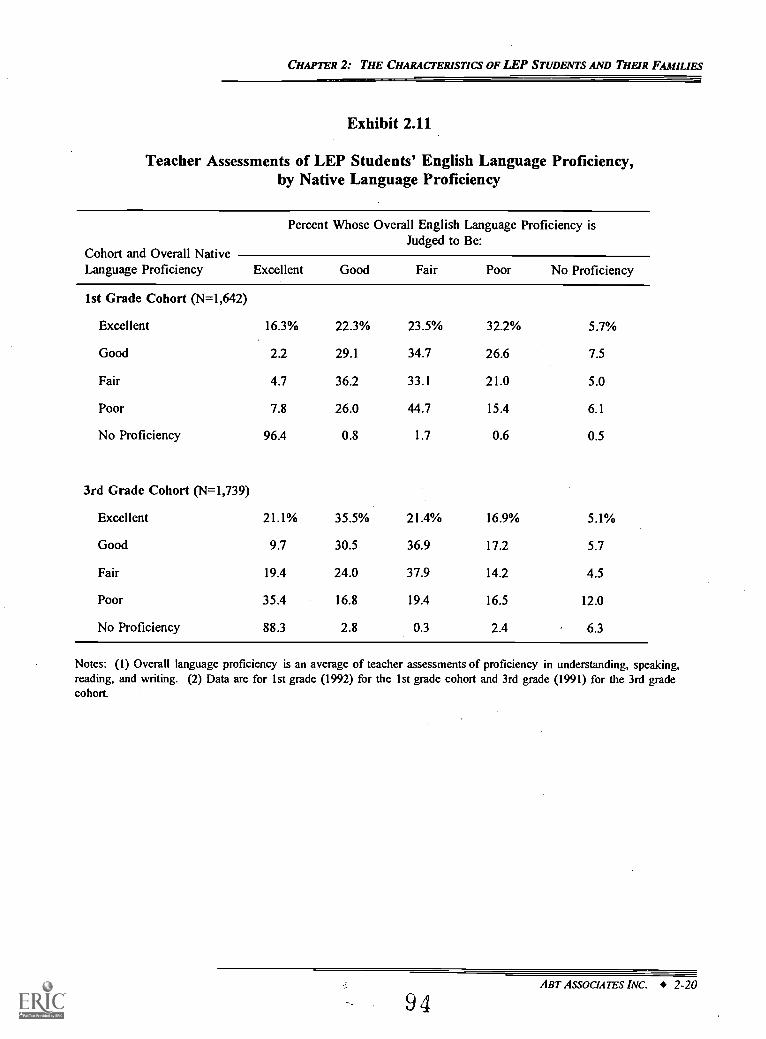
CHAPTER 2: THE CHARACTERISTICS OF LEP STUDENTS AND THEIR FAMILIES
Exhibit 2.11
Teacher Assessments of LEP Students' English Language Proficiency,by Native Language Proficiency
Percent Whose Overall English Language Proficiency isJudged to Be:
Cohort and Overall NativeLanguage Proficiency Excellent Good Fair Poor No Proficiency
1st Grade Cohort (N=1,642)
Excellent 16.3% 22.3% 23.5% 32.2% 5.7%
Good 2.2 29.1 34.7 26.6 7.5
Fair 4.7 36.2 33.1 21.0 5.0
Poor 7.8 26.0 44.7 15.4 6.1
No Proficiency 96.4 0.8 1.7 0.6 0.5
3rd Grade Cohort (N=1,739)
Excellent 21.1% 35.5% 21.4% 16.9% 5.1%
Good 9.7 30.5 36.9 17.2 5.7
Fair 19.4 24.0 37.9 14.2 4.5
Poor 35.4 16.8 19.4 16.5 12.0
No Proficiency 88.3 2.8 0.3 2.4 6.3
Notes: (1) Overall language proficiency is an average of teacher assessments of proficiency in understanding, speaking,reading, and writing. (2) Data are for 1st grade (1992) for the 1st grade cohort and 3rd grade (1991) for the 3rd gradecohort.
ABT ASSOCIATES INC. 2-20
9 4
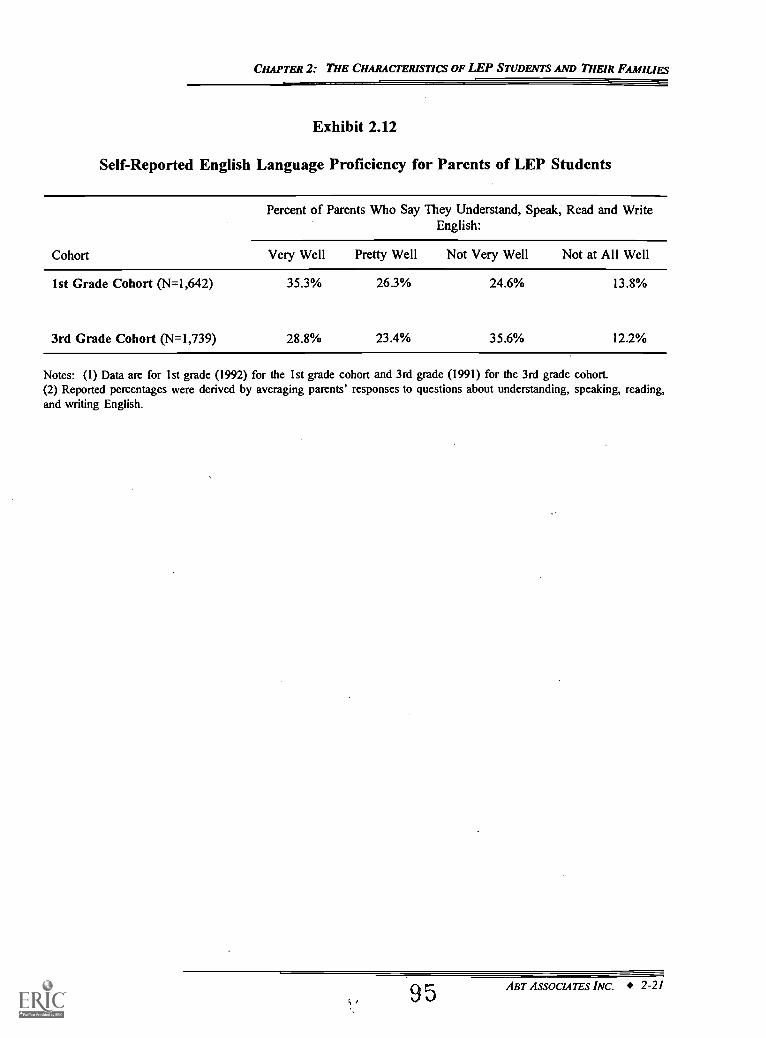
CHAPTER 2: THE CHARACTERISTICS OF LEP STUDENTS AND THEIR FAMILIES
Exhibit 2.12
Self-Reported English Language Proficiency for Parents of LEP Students
Percent of Parents Who Say They Understand, Speak, Read and WriteEnglish:
Cohort Very Well Pretty Well Not Very Well Not at All Well
1st Grade Cohort (N=1,642) 35.3% 26.3% 24.6% 13.8%
3rd Grade Cohort (N=1,739) 28.8% 23.4% 35.6% 12.2%
Notes: (1) Data are for 1st grade (1992) for the 1st grade cohort and 3rd grade (1991) for the 3rd grade cohort.(2) Reported percentages were derived by averaging parents' responses to questions about understanding, speaking, reading,and writing English.
95 ABT ASSOCIATES INC. 2-21
CHAPTER 2: THE CHARACTERISTICS OF LEP STUDENTS AND THEIR FAMILIES
Another measure of parents' English proficiency is the frequency with which English is
spoken at home. Exhibit 2.13 shows that a sizeable minority of LEP studentsabout 25 percent
in each cohortlive in homes where English is spoken "hardly ever" or "never," according to
their parents. This reinforces the conclusion above that a significant proportion of LEP students
are likely to rely heavily on schools for developing English proficiency.
Perhaps not surprisingly, there is a clear positive relationship between the English
proficiency of parents and their children. For example, as shown in Exhibit 2.14, among parents
in the 1st grade cohort who say they speak English "not at all well," 43 percent have children
whose English proficiency is judged as poor or none, while only 11 percent of these same parents
have children whose English proficiency is judged as good or excellent. The same pattern holds
for the 3rd grade cohort, although it is not as pronounced. Overall, the strong association
between parents' self-assessments and teachers' judgements of students suggests that, despite their
potential limitations, teacher assessments of language proficiency have some validity.
There is a similarly strong relationship between parents' English language proficiency and
students' native language proficiency. The more proficient parents are in English, the less
proficient are their children in their native language, as shown in Exhibit 2.15. For example,
among parents in the 1st grade cohort who say they speak English "not at all well," 53 percent
have children whose native language proficiency is judged as good or excellent, while only
16 percent of these same parents have children whose native language proficiency is judged as
poor or none. This pattern is even stronger for the 3rd grade cohort. Both the student and parent
data are consistent with trends of growing proficiency in English and loss of native language
skills. As with English proficiency, the validity of teacher assessments of native language
proficiency is buttressed by their association with parents' self-assessments.
How Do THE RESOURCES OF LOW-INCOME LEP STUDENTS COMPARE TO THOSE OF Low-INCOME EP STUDENTS?
This section examines the extent to which the resources of low-income LEP students differ
from low-income EP students, where resources are broadly defined to include economic
resources, home supports, parent involvement and expectations, student attitudes and self-
\. 9 6
ABT ASSOCIATES INC. 2-22
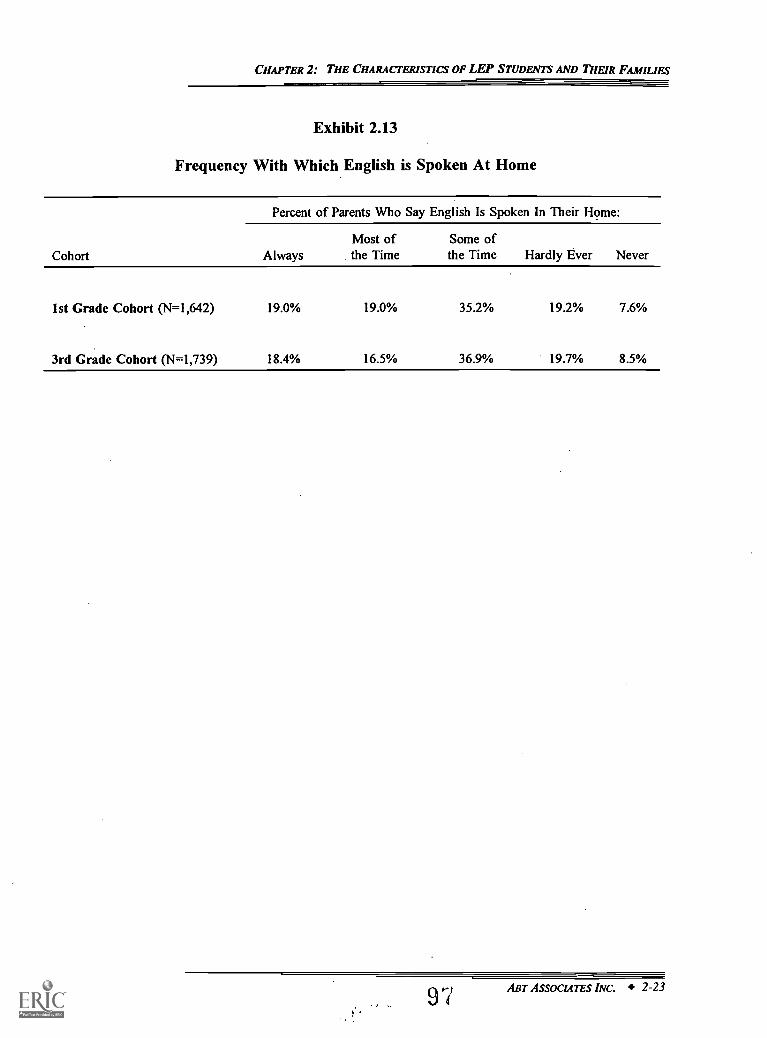
CHAPTER 2: THE CHARACTERISTICS OF LEP STUDENTS AND THEIR FAMILIES
Exhibit 2.13
Frequency With Which English is Spoken At Home
Percent of Parents Who Say English Is Spoken In Their Home:
Cohort AlwaysMost ofthe Time
Some ofthe Time Hardly Ever Never
1st Grade Cohort (N=1,642)
3rd Grade Cohort (N=1,739)
19.0%
18.4%
19.0%
16.5%
35.2%
36.9%
19.2%
19.7%
7.6%
8.5%
ABT ASSOCIATES INC. 2-23
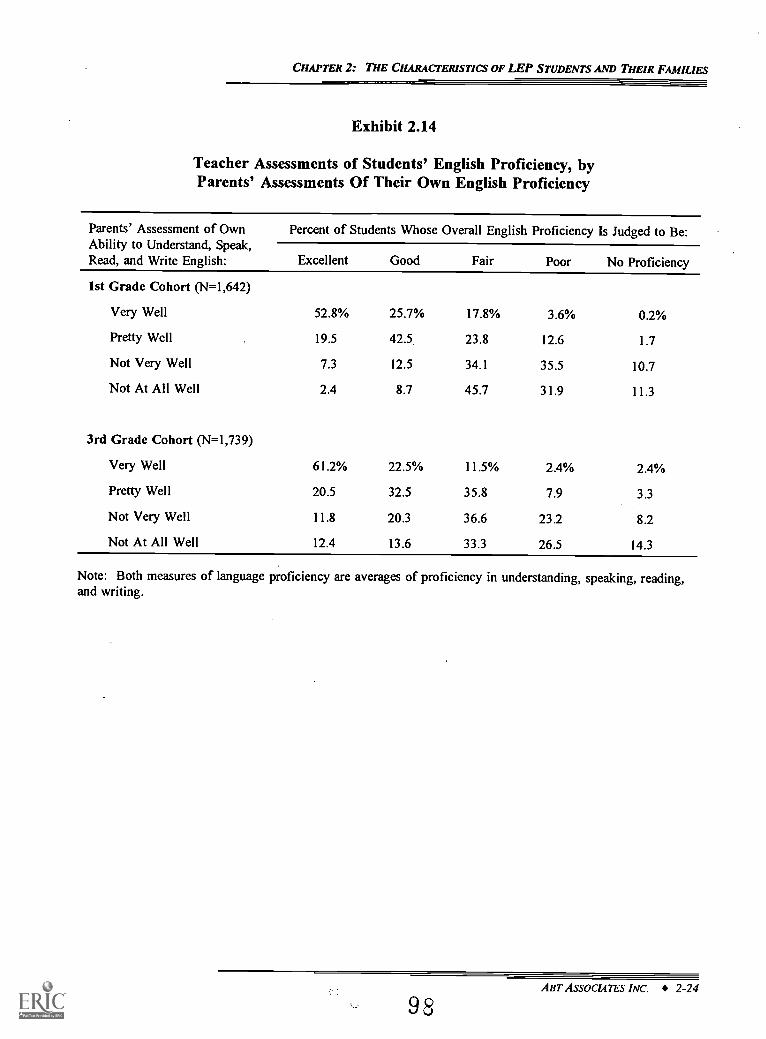
CHAPTER 2: THE CHARACTERISTICS OF LEP STUDENTS AND THEIR FAMIUES
Exhibit 2.14
Teacher Assessments of Students' English Proficiency, byParents' Assessments Of Their Own English Proficiency
Parents' Assessment of OwnAbility to Understand, Speak,Read, and Write English:
Percent of Students Whose Overall English Proficiency Is Judged to Be:
Excellent Good Fair Poor No Proficiency
1st Grade Cohort (N=1,642)
Very Well 52.8% 25.7% 17.8% 3.6% 0.2%
Pretty Well 19.5 42.5 23.8 12.6 1.7
Not Very Well 7.3 12.5 34.1 35.5 10.7
Not At All Well 2.4 8.7 45.7 31.9 11.3
3rd Grade Cohort (N=1,739)
Very Well 61.2% 22.5% 11.5% 2.4% 2.4%
Pretty Well 20.5 32.5 35.8 7.9 3.3
Not Very Well 11.8 20.3 36.6 23.2 8.2
Not At All Well 12.4 13.6 33.3 26.5 14.3
Note: Both measures of language proficiency are averages of proficiency in understanding, speaking, reading,and writing.
ABT ASSOCIATES INC. 2-24
9 8
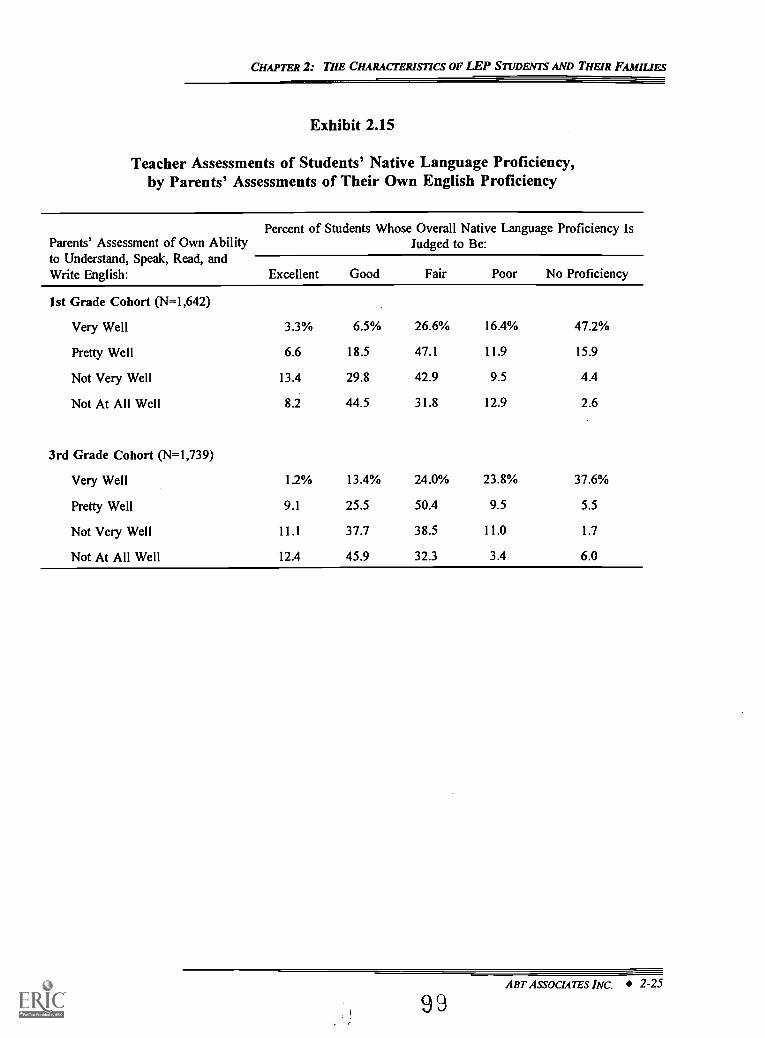
CHAPTER 2: THE CHARACTERISTICS OF LEP STUDENTS AND THEIR FAMILIES
Exhibit 2.15
Teacher Assessments of Students' Native Language Proficiency,by Parents' Assessments of Their Own English Proficiency
Parents' Assessment of Own Abilityto Understand, Speak, Read, andWrite English:
Percent of Students Whose Overall Native Language Proficiency IsJudged to Be:
Excellent Good Fair Poor No Proficiency
1st Grade Cohort (14=1,642)
Very Well 3.3% 6.5% 26.6% 16.4% 47.2%
Pretty Well 6.6 18.5 47.1 11.9 15.9
Not Very Well 13.4 29.8 42.9 9.5 4.4
Not At All Well 8.2 44.5 31.8 12.9 2.6
3rd Grade Cohort (N=1,739)
Very Well 1.2% 13.4% 24.0% 23.8% 37.6%
Pretty Well 9.1 25.5 50.4 9.5 5.5
Not Very Well 11.1 37.7 38.5 11.0 1.7
Not At All Well 12.4 45.9 32.3 3.4 6.0
ABT ASSOCIATES INC. 2-25
9 9
CHAPTER 2: THE CHARACTERISTICS OF LEP STUDENTS AND THEIR FAMILIES
perceptions, and continuity of school and residence. Together these factors provide a picture of
the home resources that may support students' educational achievement. Conceptually, student
achievement may be thought of as a function of both school and home inputs. This section
examines the home inputs, and Chapter 3 examines the school inputs provided to LEP students.
Unlike the previous section, where we presented results for all LEP students, in this
section we focus on the low-income population, comparing disadvantaged LEP students to their
economic peers, in an attempt to disentangle LEP status from economic status.'3 In other
words, because LEP students are more likely to come from low-income households than are EP
public school students, any differences we find between all LEP students and all EP students may
be due primarily to their differing economic circumstances. By attempting to control for
economic circumstances, we can get a clearer understanding of the extent to which LEP students
differ from EP students for non-economic reasons. Further, low-income LEP studentson average
are likely to be in greater need of compensatory education than are non-low-income students.
For the purposes of this chapter, "low-income" families are defined as those with an
average annual family income less than 185 percent of the poverty level, adjusted for family
size.'4 As noted at the beginning of this chapter, about 85 percent of LEP students in both
cohorts fall within this definition of low-income, compared to only about 50 percent of EP
students, illustrating the importance of controlling for differences in income.
Economic Resources
This subsection compares the family income, education, and employment status of low-
income LEP families to those of low-income EP families, to see whether LEP students are
economically disadvantaged even relative to other low-income students.
13The exhibits in this section include all other public school students as an additional comparison group, to
show how low-income studentsboth LEP and EPdiffer from all non-low-income students. These three groupstogether include all students in the study sample.
14Thi. is s similar to the eligibility standard for reduced-price school lunch.
ABT ASSOCIATES INC. 2-26
100
CHAPTER 2: THE CHARACTERISTICS OF LEP STUDENTS AND THEIR FAMILIES
Family Income. Although we use the same income ceiling to define low-income families
in both the LEP and EP groups (i.e., 185 percent of the poverty line for the relevant family size),
the distribution of income within the ceiling is different for the tWo groups. Exhibit 2.16 shows
that the distribution of income is more skewed to the right for families of low-income EP
students compared to families of low-income LEP students. This means that, although focusing
on low-income students goes a long way toward controlling for economic differences between
LEP and EP students, it is not a perfect control. The comparison group, although low-income,
is somewhat better off economically than low-income LEP students. This fact should be kept in
mind when examining the results in the remainder of this chapter.
Some immigrants enter the U.S. with relatively high levels of education and career
experience. While their family incomes might be quite low immediately after coming to the U.S.,
they may grow rapidly as they settle into careers or as their businesses develop. In some cases,
a family's income may grow rapidly as more family members work full time. For such families,
an income estimate during an early year of the study may not provide accurate information
regarding their family income over a longer period.
Is there evidence of faster income growth for low-income LEP families than for low-
income EP families? This might occur if some recent immigrants take a step down economically
when they first arrive in the U.S., but move up more quickly than low-income EP families.
Comparing the average growth of family income for low-income LEP and EP families, we find
no evidence of different income growth rates during the duration of this study. Specifically, we
calculate the average ratios of 1993 to 1992 income for the 1st grade cohort, and 1993 to 1991
income for the 3rd grade cohort. Within cohorts, the ratios of LEP and EP families are very
similar (1.09 versus 1.08 in the 1st grade cohort, and 1.11 versus 1.11 in the 3rd grade cohort,
not shown), so there is no evidence that LEP families have faster income growth. This is a short
time span, however; to more adequately address this issue, a longer time series would be needed.
Parent Education and Employment. Parent education and employment can be viewed
as economic resources, in that these factors tend to be strongly correlated with family income.
In addition, parent education is likely to influence parents' expectations of their children's
educational achievement, and children's own expectations, as well as parents' ability to help their
children in school. Compared to parents of low-income EP students, parents of low-income LEP
0ABT ASSOCIATES INC. 2-27
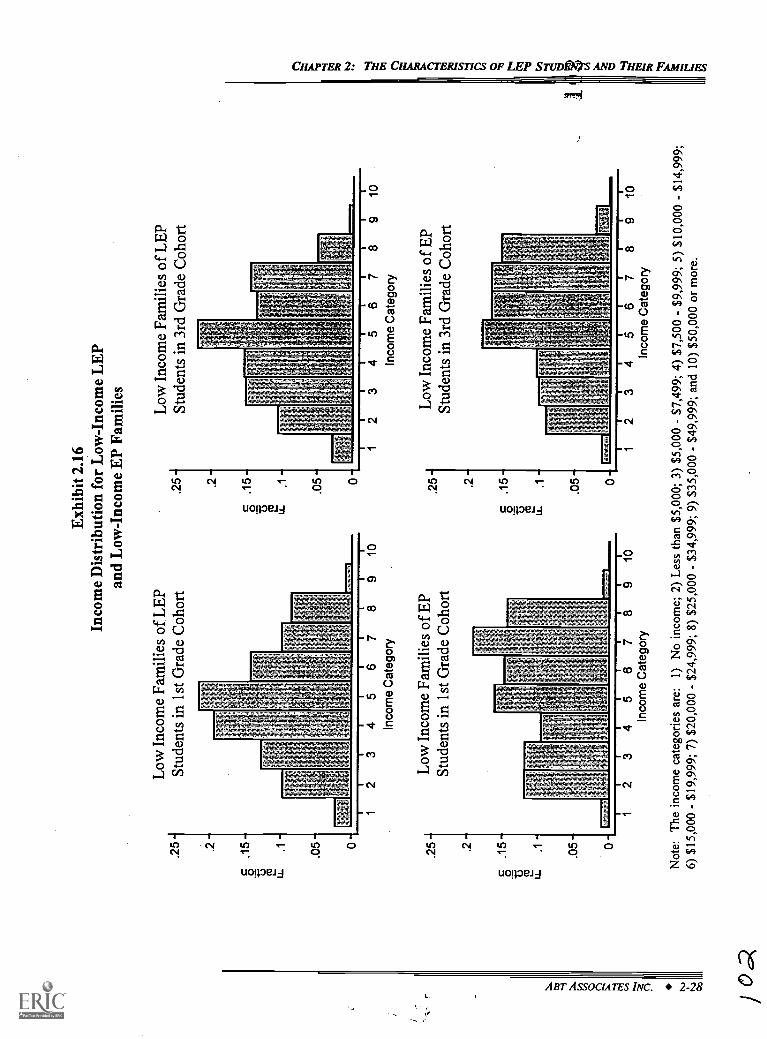
oo j 0,Q
Exh
ibit
2.16
Inco
me
Dis
trib
utio
n fo
r L
ow-I
ncom
e L
EP
and
Low
-Inc
ome
EP
Fam
ilies
Low
Inc
ome
Fam
ilies
of
LE
PSt
uden
ts in
1st
Gra
de C
ohor
t.2
5 .2
E .1
5
Low
Inc
ome
Fam
ilies
of
LE
PSt
uden
ts in
3rd
Gra
de C
ohor
t
.25 .2
c 015
Li.
.1
345
6In
com
e C
ateg
ory
Low
Inc
ome
Fam
ilies
of
EP
Stud
ents
in 1
st G
rade
Coh
ort
.25 .2
23
A A
76
910
Inco
me
Cat
egor
y
Low
Inc
ome
Fam
ilies
of
EP
Stud
ents
in 3
rd G
rade
Coh
ort
34
56
7A
6In
com
e C
ateg
ory
Inco
me
Cat
egor
y
Not
e: T
he in
com
e ca
tego
ries
are
:1)
No
inco
me;
2)
Les
s th
an $
5,00
0; 3
) $5
,000
- $
7,49
9; 4
) $7
,500
- $9
,999
; 5)
$10,
000
- $1
4,99
9;6)
$15
,000
- $
19,9
99; 7
) $2
0,00
0 -
$24,
999;
8)
$25,
000
- $3
4,99
9; 9
) $3
5,00
0-
$49,
999;
and
10)
$50
,000
or
mor
e.
CHAPTER 2: THE CHARACTERISTICS OF LEP STUDElVTS AND THEIR FAMILIES
students on average have much lower levels of education." Exhibit 2.17 shows that, for
example, only about one-third of the fathers of low-income LEP students across cohorts graduated
from high school, compared to three-fourths of the fathers of low-income EP students.'6 The
same exhibit shows that the difference is just as large for mothers. These very large differences
confer a clear disadvantage on LEP students.
Are there differences in education levels between mothers and fathers, particularly for LEP
families? This might occur, for example, if other cultures place more value on fathers' than
mothers' education. Comparing the education levels of mothers and fathers, there is surprisingly
little evidence that mothers have less education than fathers for any of the groups (low-income
LEP, low-income EP, non-low-income)."
In terms of employment status, there are some differences for the mothersbut not the
fathersof low-income LEP and EP students. Exhibit 2.18 shows that, for both cohorts, mothers
of low-income LEP students may be somewhat less likely than mothers of low-income EP
students to work outside the home. Combining both cohorts, about 44 percent of low-income
LEP mothers are homemakers, compared with about 33 percent of low-income EP mothers. This
difference is due to LEP mothers being less likely than EP mothers to work full- or part-time,
rather than to differences in unemployment or other status (e.g., students). This may be the result
of immigrant families maintaining cultural differences with regard to women working outside the
home, or may be involuntary (possibly due to language barriers).
In contrast, there are no sizeable differences in the employment status of low-income LEP
and EP fathers. The same exhibit shows that 82 to 86 percent of fathers in the two low-income
groups work full-time. There are, however, differences in employment status between low-
income and non-low-income fathers: about 97 percent of non-low-income fathers report full-time
15 We use the terms parent, mother, and father as shorthand for male and female parent or guardian. A smallfraction of the respondents to the parent questionnaire may have been adults other than parents or guardians.
16 The parent question that was the source of these data made no distinction between U.S. schools and non-U.S.schools, so we presume that LEP parents reported their educational attainment regardless of whether the schools werein the U.S.
17 This result is not affected by imputation of missing data; i.e., the pre-imputed data also show little evidenceof a difference in education levels between mothers and fathers.
ABT ASSOCIATES INC. 2-29
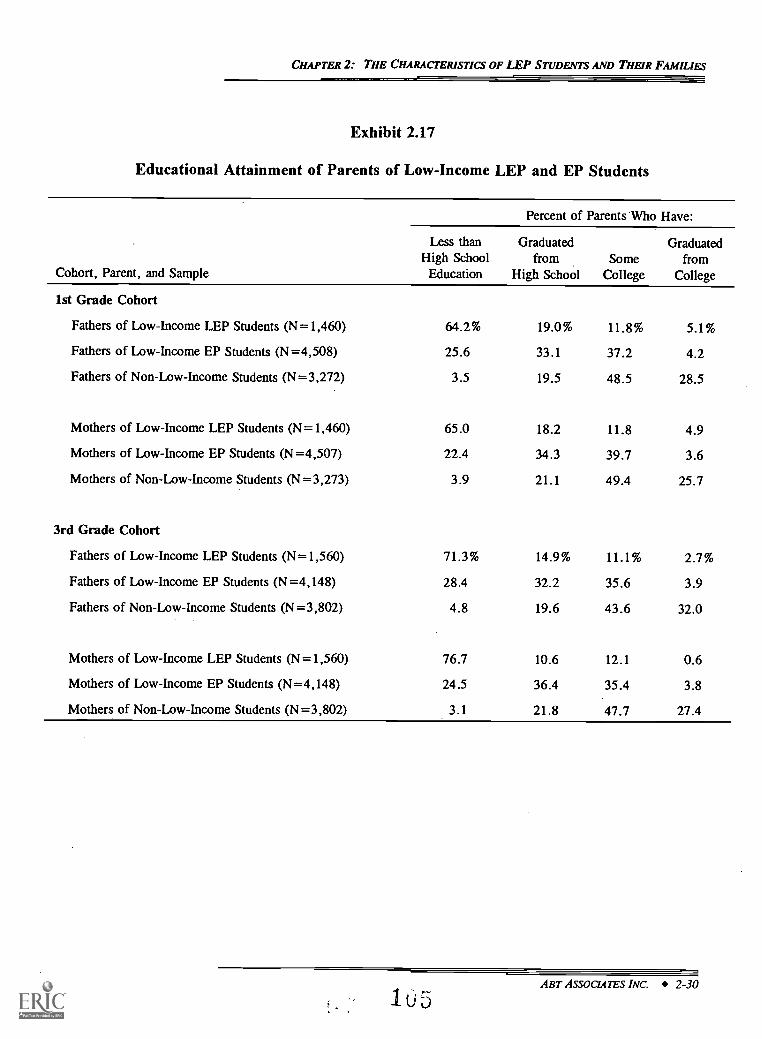
CHAPTER 2: THE CHARACTERISTICS OF LEP STUDENTS AND THEIR FAMILIES
Exhibit 2.17
Educational Attainment of Parents of Low-Income LEP and EP Students
Cohort, Parent, and Sample
Percent of Parents Who Have:
Less thanHigh SchoolEducation
Graduatedfrom
High SchoolSome
College
Graduatedfrom
College
1st Grade Cohort
Fathers of Low-Income LEP Students (N=1,460) 64.2% 19.0% 11.8% 5.1%
Fathers of Low-Income EP Students (N=4,508) 25.6 33.1 37.2 4.2
Fathers of Non-Low-Income Students (N=3,272) 3.5 19.5 48.5 28.5
Mothers of Low-Income LEP Students (N=1,460) 65.0 18.2 11.8 4.9
Mothers of Low-Income EP Students (N=4,507) 22.4 34.3 39.7 3.6
Mothers of Non-Low-Income Students (N=3,273) 3.9 21.1 49.4 25.7
3rd Grade Cohort
Fathers of Low-Income LEP Students (N=1,560) 71.3% 14.9% 11.1% 2.7%
Fathers of Low-Income EP Students (N=4,148) 28.4 32.2 35.6 3.9
Fathers of Non-Low-Income Students (N=3,802) 4.8 19.6 43.6 32.0
Mothers of Low-Income LEP Students (N=1,560) 76.7 10.6 12.1 0.6
Mothers of Low-Income EP Students (N=4,148) 24.5 36.4 35.4 3.8
Mothers of Non-Low-Income Students (N=3,802) 3.1 21.8 47.7 27.4
ABT ASSOCIATES INC. 2-30
105
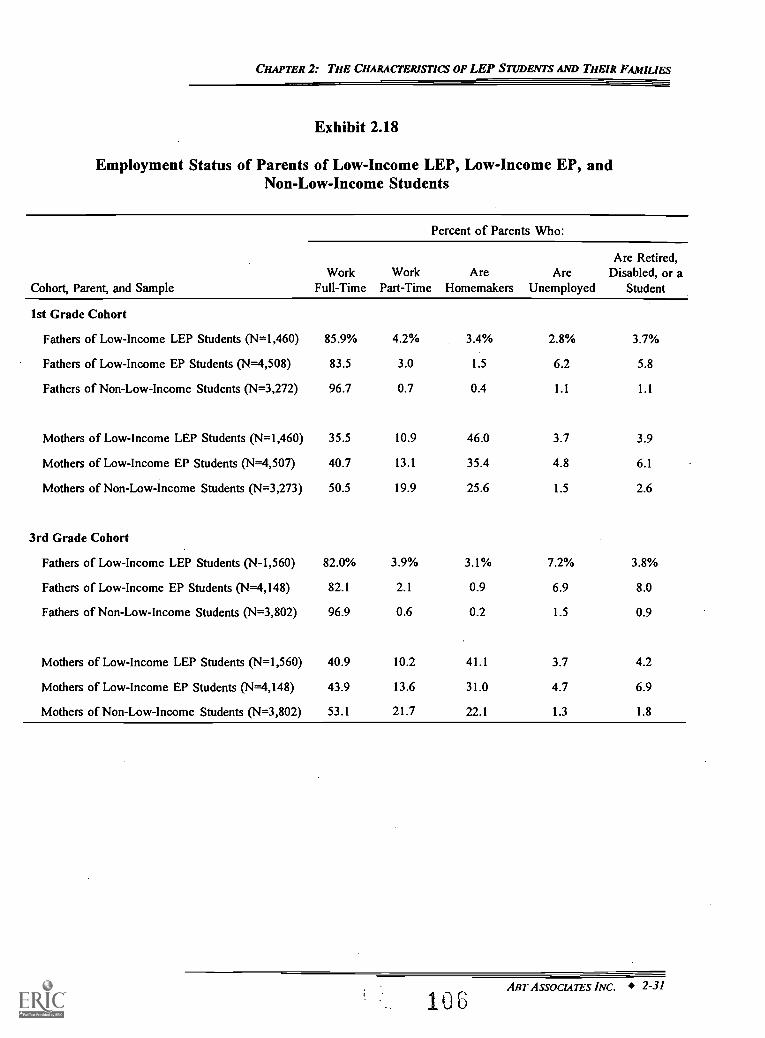
CHAPTER 2: THE CHARACTERISTICS OF LEP STUDENTS AND THEIR FAMILIES
Exhibit 2.18
Employment Status of Parents of Low-Income LEP, Low-Income EP, andNon-Low-Income Students
Cohort, Parent, and Sample
Percent of Parents Who:
WorkFull-Time
WorkPart-Time
AreHomemakers
AreUnemployed
Are Retired,Disabled, or a
Student
1st Grade Cohort
Fathers of Low-Income LEP Students (N=1,460) 85.9% 4.2% 3.4% 2.8% 3.7%
Fathers of Low-Income EP Students (N=4,508) 83.5 3.0 1.5 6.2 5.8
Fathers of Non-Low-Income Students (N=3,272) 96.7 0.7 0.4 1.1 1.1
Mothers of Low-Income LEP Students (N=1,460) 35.5 10.9 46.0 3.7 3.9
Mothers of Low-Income EP Students (N=4,507) 40.7 13.1 35.4 4.8 6.1
Mothers of Non-Low-Income Students (N=3,273) 50.5 19.9 25.6 1.5 2.6
3rd Grade Cohort
Fathers of Low-Income LEP Students (N-1,560) 82.0% 3.9% 3.1% 7.2% 3.8%
Fathers of Low-Income EP Students (N=4,148) 82.1 2.1 0.9 6.9 8.0
Fathers of Non-Low-Income Students (N=3,802) 96.9 0.6 0.2 1.5 0.9
Mothers of Low-Income LEP Students (N=1,560) 40.9 10.2 41.1 3.7 4.2
Mothers of Low-Income EP Students (N=4,148) 43.9 13.6 31.0 4.7 6.9
Mothers of Non-Low-Income Students (N=3,802) 53.1 21.7 22.1 1.3 1.8
ABT ASSOCIATES INC. 2-31
106
CHAPTER 2: THE CHARACTERISTICS OF LEP STUDENTS AND THEIR FAMILIES
employment. Further, less than 2 percent of non-low-income fathers report being unemployed,
compared with 6 to 7 percent of low-income fathers. Higher unemployment rates for low-income
fathers is consistent with these groups occupying a relatively disadvantaged position in the labor
market. The employment and unemployment rates do not vary much across the years of the
study (not shown).
Much education research has found that parent occupation is often a relatively strong
predictor of a child's performance in school. We translated the occupations reported by parents
into a conunonly used occupational status scale.' We created a composite measure of the
occupational status of mothers and fathers by averaging across both parents. Parents of low-
income LEP students on average hold jobs with lower occupational prestige than parents of low-
income EP students. Exhibit 2.19 shows a difference of about 8 points between the two groups
in each cohort, out of a total range on this scale of 63 points (and a standard deviation of about
15 points). Both of these groups have jobs that on average are much lower on the occupational
status scale than jobs held by non-low-income parents. Other research with the Prospects
database has found parents' occupational status to be correlated with students' educational
achievement, independent of students' English language skills.
Taken together, the education and employment levels of LEP students' parents show that
these families are at a clear economic disadvantage, even compared to other low-income families,
because of their much lower educational attainment, lower average incomes, and lower
occupational status. In terms of economic resources, LEP students do not operate on a level
playing field compared to other students, even other low-income students.
Family Structure
This section compares low-income LEP and EP students on the extent to which they are
in two-parent households, and average family size. In general, we expect that greater parental
resources are available in two-parent households, so that children in these households may be
18The Duncan scale, which varies from 0 to 100, is defined for 503 detailed occupational categories in the
1980 Census, and is based on the educational attainments and income for workers in those occupations. Thereforeit serves as a crude measure of socioeconomic status based on occupation. For details on the scale, see Nakao andTreas (1990). We converted the occupations in the Prospects parent survey to the scale score for similar occupations.
ABT ASSOCIATES INC. 2-32
1 U 7
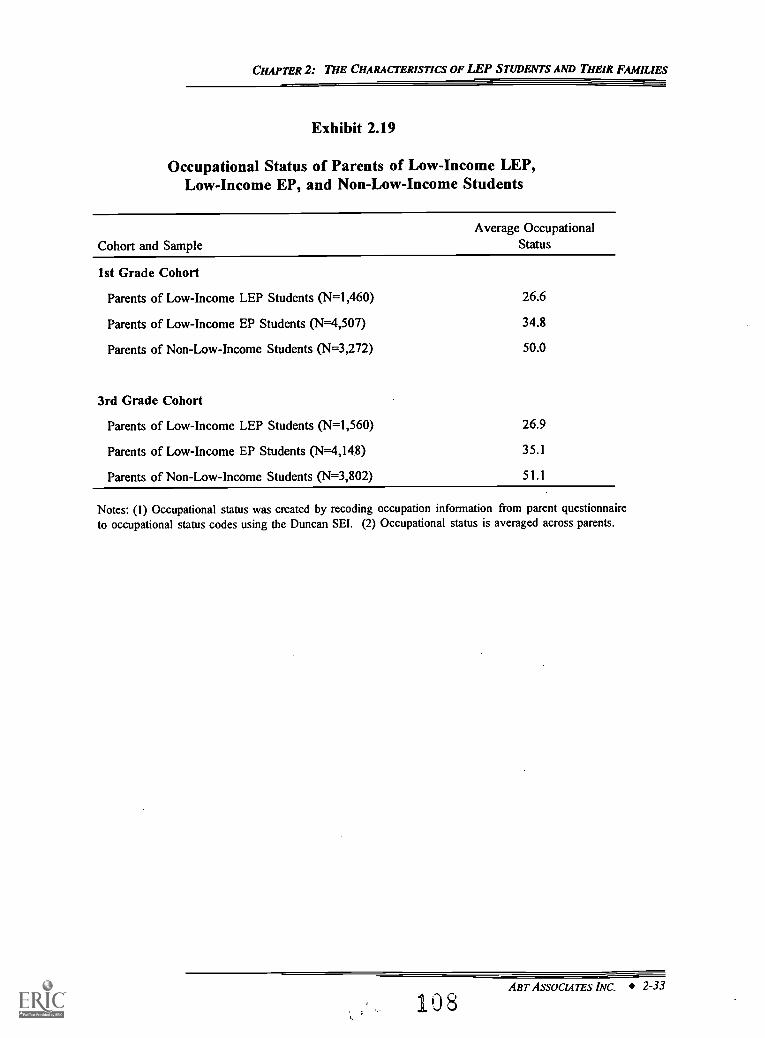
CHAPTER 2: THE CHARACTERISTICS OF LEP STUDENTS AND THEIR FAMILIES
Exhibit 2.19
Occupational Status of Parents of Low-Income LEP,Low-Income EP, and Non-Low-Income Students
Average OccupationalCohort and Sample Status
1st Grade Cohort
Parents of Low-Income LEP Students (N=1,460) 26.6
Parents of Low-Income EP Students (N=4,507) 34.8
Parents of Non-Low-Income Students (N=3,272) 50.0
3rd Grade Cohort
Parents of Low-Income LEP Students (N=1,560) 26.9
Parents of Low-Income EP Students (N=4,148) 35.1
Parents of Non-Low-Income Students (N=3,802) 51.1
Notes: (I) Occupational status was created by recoding occupation information from parent questionnaireto occupational status codes using the Duncan SEI. (2) Occupational status is averaged across parents.
ART ASSOCIATES INC. 2-33
108
CHAPTER 2: THE CHARACTERISTICS OF LEP STUDENTS AND THEIR FAMILIES
advantaged relative to children in single-parent households.' Exhibit 2.20 shows that low-
income LEP students are more likely than low-income EP students to come from two-parent
households. For example, in the first grade cohort, 88 percent of low-income LEP students are
in two-parent households, compared with 77 percent of low-income EP students. On this
dimension, LEP students appear to be relatively advantaged.
The role of family size in children's well-being is less clear. Children in smaller families
may benefit from more concentrated parental support (ignoring differences in whether there are
one or two parents), although children can also benefit from the presence ofand interaction
withsiblings.20 Exhibit 2.21 shows that low-income LEP students have larger families than
low-income EP students; the average difference is about three-fourths of aperson. LEP students
are much more likely than low-income EP students to be in large families (6 or more
individuals). Across cohorts, more than 50 percent of low-income LEP students are in families
with six or more individuals, compared to 25 to 30 percent of low-income EP students and only
about 12 percent of non-low income students. LEP students in large families are likely to be
more disadvantaged economically, because per capita income falls on average as family size
increases.
Parent Involvement and Expectations
Beyond the more tangible factors of income, parent employment and education, and family
structure, parental behaviors and attitudes can play vital roles in a student's success in school.
We look at parent involvement in their child's education from three perspectives: participation
in academic activities outside of school; participation in school activities; and expectations about
academic outcomes. The fact that these behaviors are more difficult to measure than more
material resources does not imply that they are less important. We expect each of these factors
may be positively related to successful educational outcomes.
19A single-parent household is defined as one in which the parent or guardian is the only adult in the home.
The analysis variable was averaged across the years of the study.
20This assumes that, on average, larger families have a lower parent:children ratio. The parent questionnaire
asks about total household members, and does not ask separately about children and adults.
ABT Assocums INC. 2-34
k 109
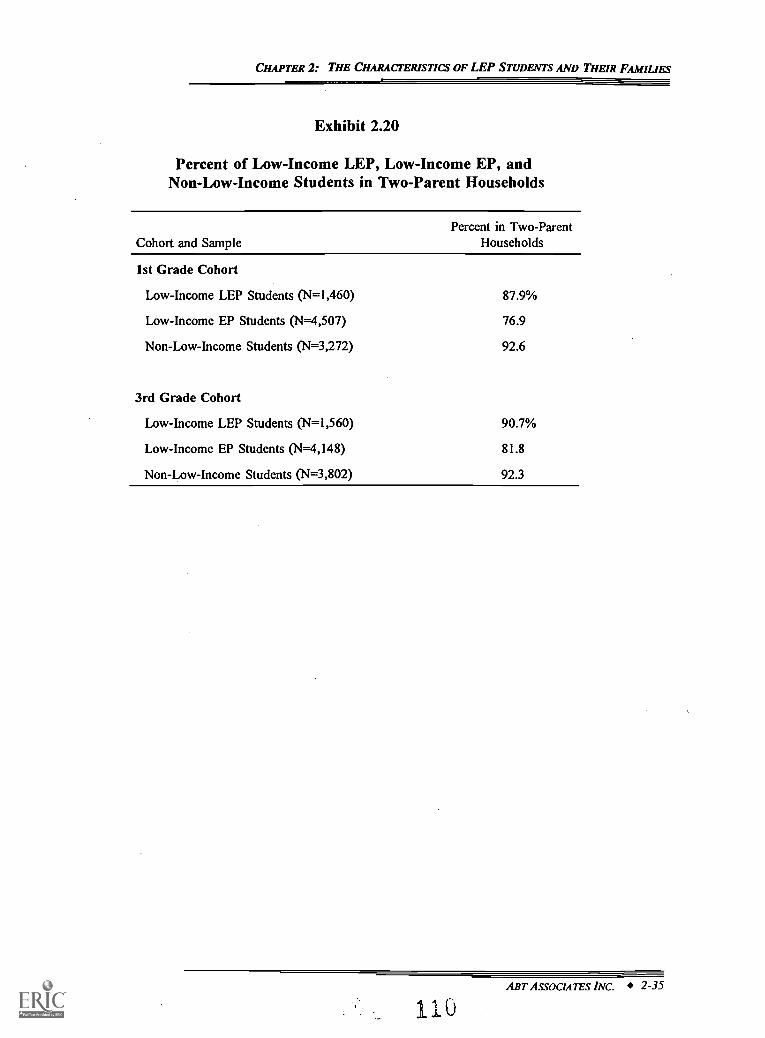
CHAPTER 2: THE CHARACTERISTICS OF LEP STUDENTS AND THEIR FAMILIES
Exhibit 2.20
Percent of Low-Income LEP, Low-Income EP, andNon-Low-Income Students in Two-Parent Households
Cohort and SamplePercent in Two-Parent
Households
1st Grade Cohort
Low-Income LEP Students (N=1,460) 87.9%
Low-Income EP Students (N=4,507) 76.9
Non-Low-Income Students (N=3,272) 92.6
3rd Grade Cohort
Low-Income LEP Students (N=1,560) 90.7%
Low-Income EP Students (N=4,148) 81.8
Non-Low-Income Students (N=3,802) 92.3
ABT ASSOCIATES INC. 2-35
11 0
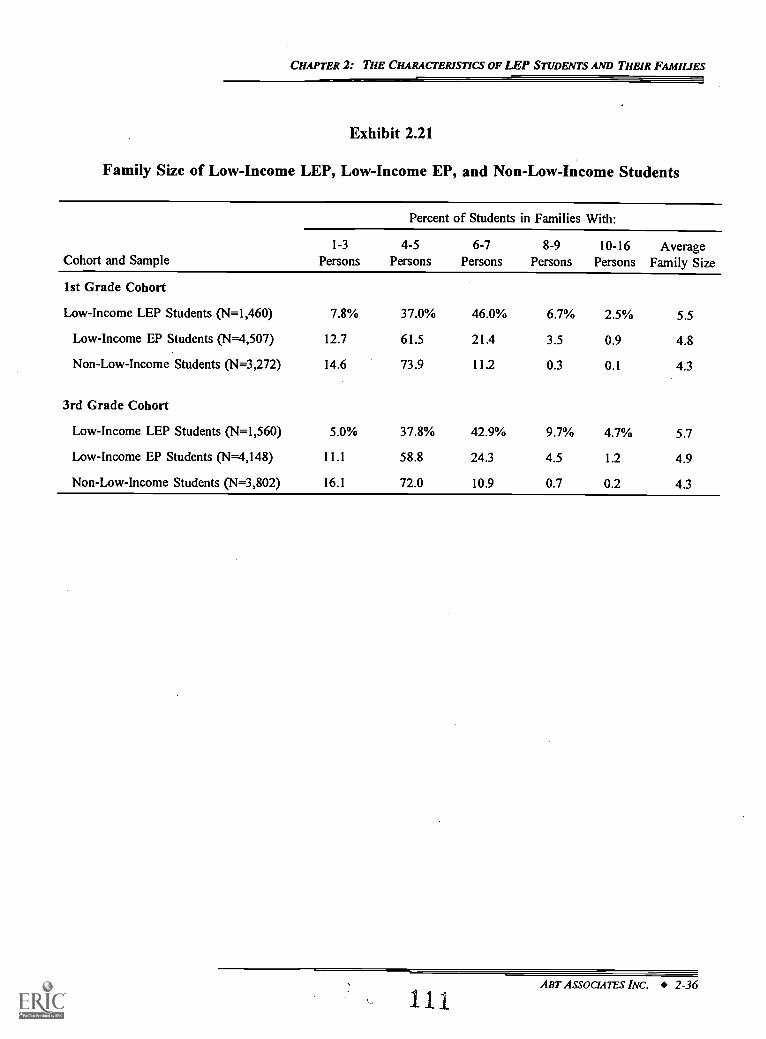
CHAPTER 2: THE CHARACTERISTICS OF LEP STUDENTS AND THEIR FAMILIES
Exhibit 2.21
Family Size of Low-Income LEP, Low-Income EP, and Non-Low-Income Students
Cohort and Sample
Percent of Students in Families With:
1-3
Persons4-5
Persons6-7
Persons8-9
Persons10-16
PersonsAverage
Family Size
1st Grade Cohort
Low-Income LEP Students (N=1,460) 7.8% 37.0% 46.0% 6.7% 2.5% 5.5
Low-Income EP Students (N=4,507) 12.7 61.5 21.4 3.5 0.9 4.8
Non-Low-Income Students (N=3,272) 14.6 73.9 11.2 0.3 0.1 4.3
3rd Grade Cohort
Low-Income LEP Students (N=1,560) 5.0% 37.8% 42.9% 9.7% 4.7% 5.7
Low-Income EP Students (14=4,148) 11.1 58.8 24.3 4.5 1.2 4.9
Non-Low-Income Students (N=3,802) 16.1 72.0 10.9 0.7 0.2 4.3
, ABT ASSOCIATES INC. 2-36
1 1_ 1
CHAPTER 2: THE CHARACTERISTICS OF LEP STUDENTS AND THEIR FAMILIES
Parent Involvement. We examine parent involvement outside school in children's
academic activities by looking at the frequency with which parents engage in such activities as:
helping with homework or checking that it is done; reading with their children; talking about
school events and subject matter; and talking about expectations and goals. More specifically,
we constructed an average of parent responses on the frequency of these activities. Exhibit 2.22
shows that parents of low-income LEP students are no less likely to participate in the academic
activities of their children outside school than are parents of low-income EP students. Across
both cohorts and all three groups there is no apparent difference in parent involvement.
The results for parent participation in school activities are somewhat different. The
measure used is an average of the frequency with which parents have visited their children's
school to do any of the following: have a formal conference or informal talk with teacher or
principal; observe a play, sporting event or concert; volunteer for a school project or trip; observe
or volunteer in the classroom; or participate in a parent-teacher organization or advisory
committee. Most of these activities require some parent initiative (as opposed to the school
contacting parents), and all could be beneficial to the child. Exhibit 2.23 shows that parents of
low-income LEP students are more likely than parents of low-income EP childrenand much
more likely than parents of non-low-income childrennever to participate in activities at their
children's school. Language barriers or cultural differences are possible reasons for the apparent
lesser involvement of LEP parents.2'
Another measure of parental support is the amount of time alone children spend after
school with no adult present. Less time alone indicates, on average, greater interaction between
the child and other adults, and more opportunity to foster educational (or language) development.
This measure was taken from student responses. Exhibit 2.24 shows that, relative to low-income
EP students, low-income LEP students in both cohorts spend a greater amount of time alone per
day at home. Forty-four percent of the low-income LEP students in the 1st grade cohort spend
at least some time home after school with no adult, compared with 38 percent of low-income EP
21 Exhibit 2.23 also shows that, for low-income LEP and EP students, parent participation declines acrosscohorts: parents in the 3rd grade cohort are more likely than parents in the 1st grade cohort never to participate inactivities at their children's school. Within each cohort, however, there is no evidence of a decline in parentparticipation over time (results not shown).
ts. 112ABT ASSOCIATES INC. 2-37
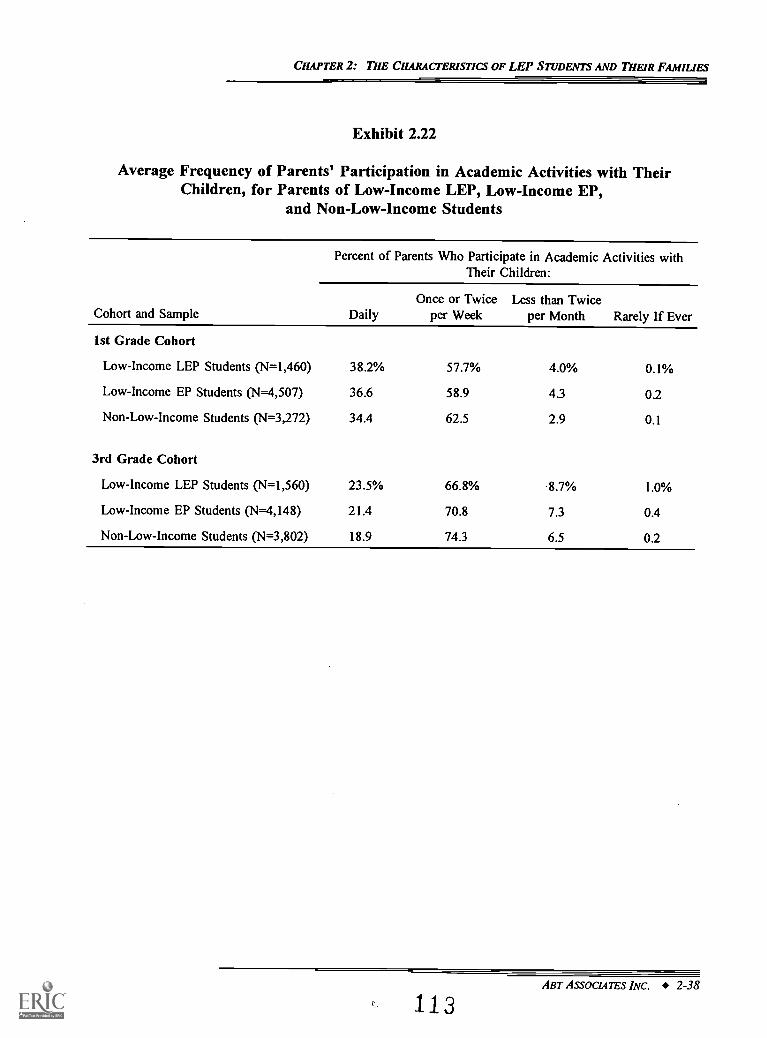
CHAPTER 2: THE CHARACTERISTICS OF LEP STUDENTS AND THEIR FAMILIES
Exhibit 2.22
Average Frequency of Parents' Participation in Academic Activities with TheirChildren, for Parents of Low-Income LEP, Low-Income EP,
and Non-Low-Income Students
Percent of Parents Who Participate in Academic Activities withTheir Children:
Cohort and Sample DailyOnce or Twice
per WeekLess than Twice
per Month Rarely If Ever
1st Grade Cohort
Low-Income LEP Students (N=1,460) 38.2% 57.7% 4.0% 0.1%
Low-Income EP Students (N=4,507) 36.6 58.9 4.3 0.2
Non-Low-Income Students (N=3,272) 34.4 62.5 2.9 0.1
3rd Grade Cohort
Low-Income LEP Students (N=1,560) 23.5% 66.8% 8.7% 1.0%
Low-Income EP Students (N=4,148) 21.4 70.8 7.3 0.4
Non-Low-Income Students (N=3,802) 18.9 74.3 6.5 0.2
ABT ASSOCIATES INC. 2-38
113
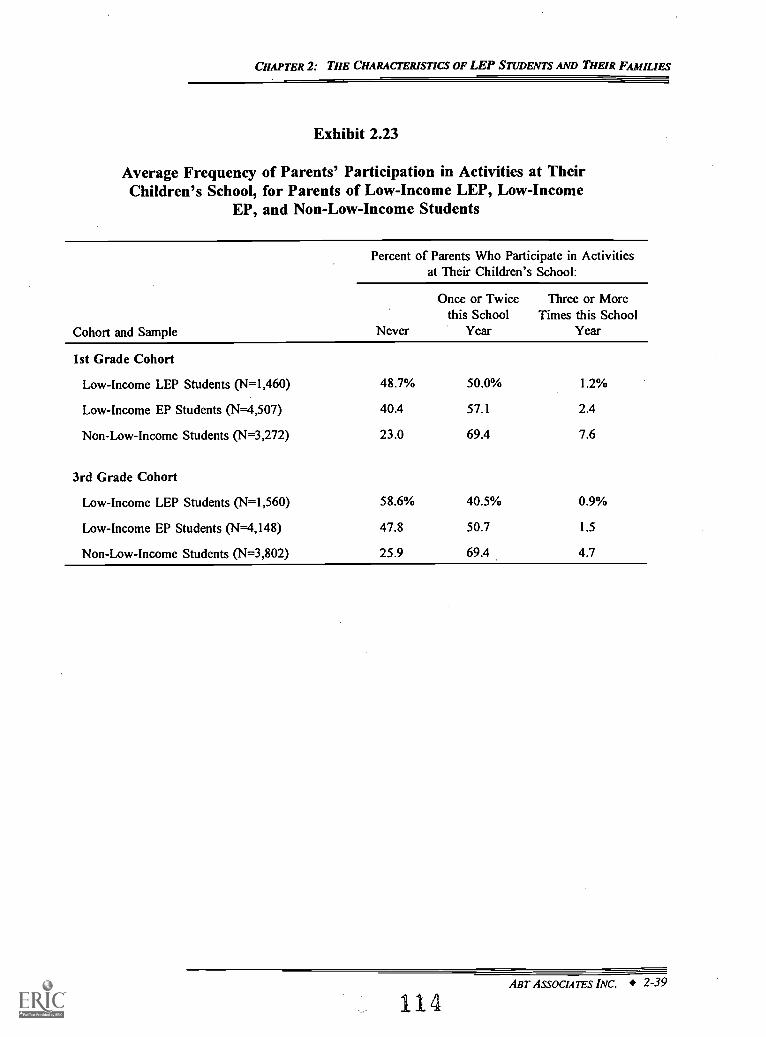
CHAPTER 2: THE CHARACTERISTICS OF LEP STUDENTS AND THEIR FAMILIES
Exhibit 2.23
Average Frequency of Parents' Participation in Activities at TheirChildren's School, for Parents of Low-Income LEP, Low-Income
EP, and Non-Low-Income Students
Percent of Parents Who Participate in Activitiesat Their Children's School:
Cohort and Sample Never
Once or Twicethis School
Year
Three or MoreTimes this School
Year
1st Grade Cohort
Low-Income LEP Students (N=1,460) 48.7% 50.0% 1.2%
Low-Income EP Students (N=4,507) 40.4 57.1 2.4
Non-Low-Income Students (N=3,272) 23.0 69.4 7.6
3rd Grade Cohort
Low-Income LEP Students (N=1,560) 58.6% 40.5% 0.9%
Low-Income EP Students (N=4,148) 47.8 50.7 1.5
Non-Low-Income Students (N=3,802) 25.9 69.4 4.7
ABT ASSOCIATES INC. 2-39
114
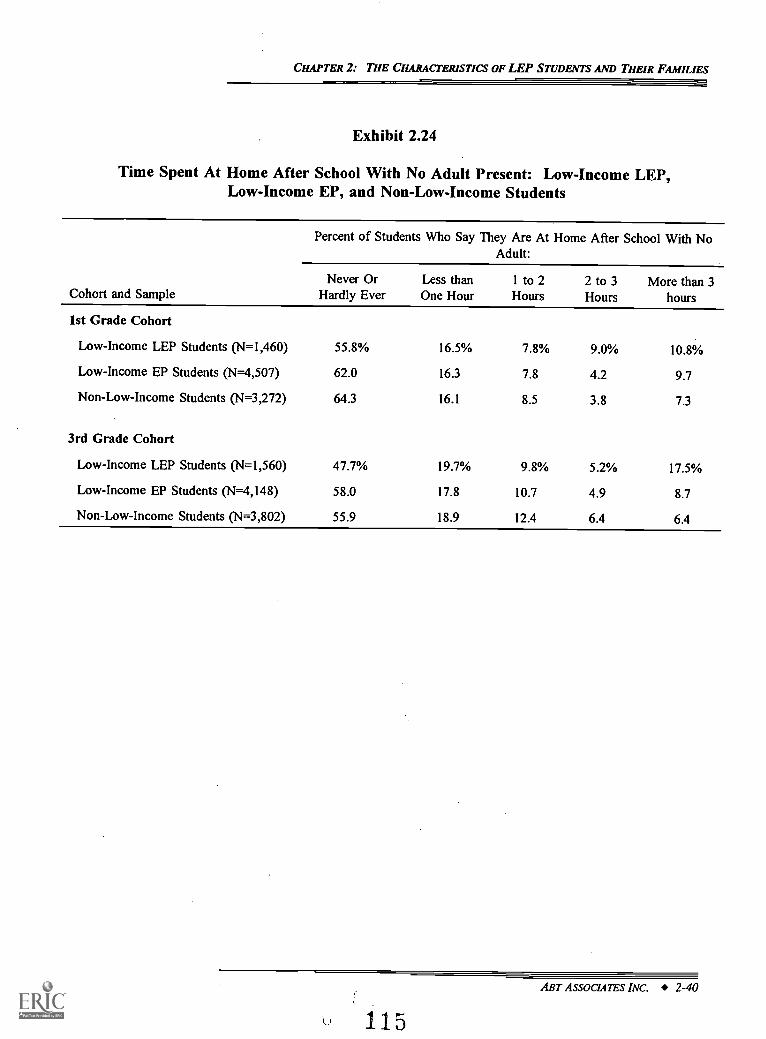
CHAPTER 2: THE CHARACTERISTICS OF LEP STUDENTS AND THEIR FAMILIES
Exhibit 2.24
Time Spent At Home After School With No Adult Present: Low-Income LEP,Low-Income EP, and Non-Low-Income Students
Percent of Students Who Say They Are At Home After School With NoAdult:
Cohort and SampleNever Or
Hardly EverLess thanOne Hour
1 to 2Hours
2 to 3Hours
More than 3hours
1st Grade Cohort
Low-Income LEP Students (N=1,460) 55.8% 16.5% 7.8% 9.0% 10.8%
Low-Income EP Students (N=4,507) 62.0 16.3 7.8 4.2 9.7
Non-Low-Income Students (N=3,272) 64.3 16.1 8.5 3.8 7.3
3rd Grade Cohort
Low-Income LEP Students (N=1,560) 47.7% 19.7% 9.8% 5.2% 17.5%
Low-Income EP Students (N=4,148) 58.0 17.8 10.7 4.9 8.7
Non-Low-Income Students (N=3,802) 55.9 18.9 12.4 6.4 6.4
ABT ASSOCIATES INC. 2-40
115
CHAPTER 2: THE CHARACTERISTICS OF LEP STUDENTS AND THEIR FAMILIES
students.' The difference is similar in the 3rd grade cohort: 53 percent of low-income LEP
students compared to 42 percent of low-income EP students. Greater time alone for low-income
LEP students may be a result of the poorer economic situation (and presumably lower wages) for
families with LEP children, which requires spending more time working outside the home. This
result is probably not due to differences in family structure across these groups, because LEP
students are more likely to be in larger, two-parent households than are low-income EP students,
and more likely to have a mother who does not work outside the home.
Parent Expectations. As measures of parents' expectations forand attitudes
towardtheir children, we examine parent-reported measures of: how often parents and child
disagree about rules; how often parents talk to their child about academic expectations; how often
parents talk to their child about future plans and goals; parents' expectations about whether their
child will graduate from college; parents' expectations about their child's future grades in school;
and whether parents are saving money for child's college education.
Exhibit 2.25 shows that low-income LEP families may be less likely to disagree about
rules than low-income EP families. In the 1st grade cohort, 43 percent of low-income LEP
families disagree about rules at least once or twice per week, compared to 56 percent of low-
income EP families. The differences are just as large for the 3rd grade cohort. This may be a
reflection of cultural differences. There are no clear differences in this measure between Hispanic
and Asian students (not shown).
Parents of low-income LEP and EP students do not differ much in how often they speak
with their child about school expectations. Exhibit 2.26 shows that LEP parents are no less likely
than low-income EP parents to speak daily with their child about school expectations. Further,
both groups of parents of low-income students speak more frequently with their children about
school expectations than do parents of non-low-income students. It may be that low-income
parents see education as a vehicle for their children to escape their disadvantaged status.
On a closely related measure, parents of low-income LEP students are more likely to talk
to their child at least once a week about future plans and goals. Exhibit 2.27 shows that this
22 For the 1st grade cohort, this information is available only for 1994, when most of these students were in3rd grade. For the 3rd grade cohort, information on time alone is available for three years, corresponding to 3rd,4th, and 5th grades.
116 ABT ASSOCL4TES INC. 2-41
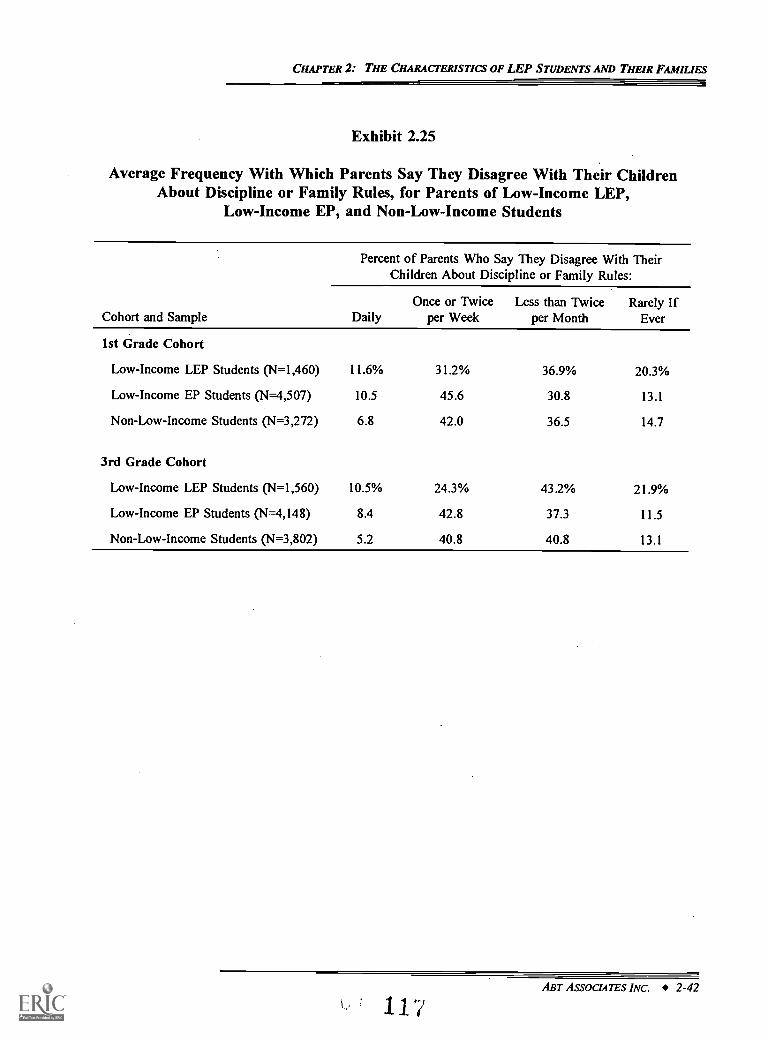
CHAPTER 2: THE CHARACTERISTICS OF LEP STUDENTS AND THEIR FAMILIES
Exhibit 2.25
Average Frequency With Which Parents Say They Disagree With Their ChildrenAbout Discipline or Family Rules, for Parents of Low-Income LEP,
Low-Income EP, and Non-Low-Income Students
Percent of Parents Who Say They Disagree With TheirChildren About Discipline or Family Rules:
Cohort and Sample DailyOnce or Twice
per WeekLess than Twice
per MonthRarely If
Ever
1st Grade Cohort
Low-Income LEP Students (N=1,460) 11.6% 31.2% 36.9% 20.3%
Low-Income EP Students (N=4,507) 10.5 45.6 30.8 13.1
Non-Low-Income Students (N=3,272) 6.8 42.0 36.5 14.7
3rd Grade Cohort
Low-Income LEP Students (N=1,560) 10.5% 24.3% 43.2% 21.9%
Low-Income EP Students (N=4,148) 8.4 42.8 37.3 11.5
Non-Low-Income Students (N=3,802) 5.2 40.8 40.8 13.1
ABT ASSOCIATES INC. 2-42
117
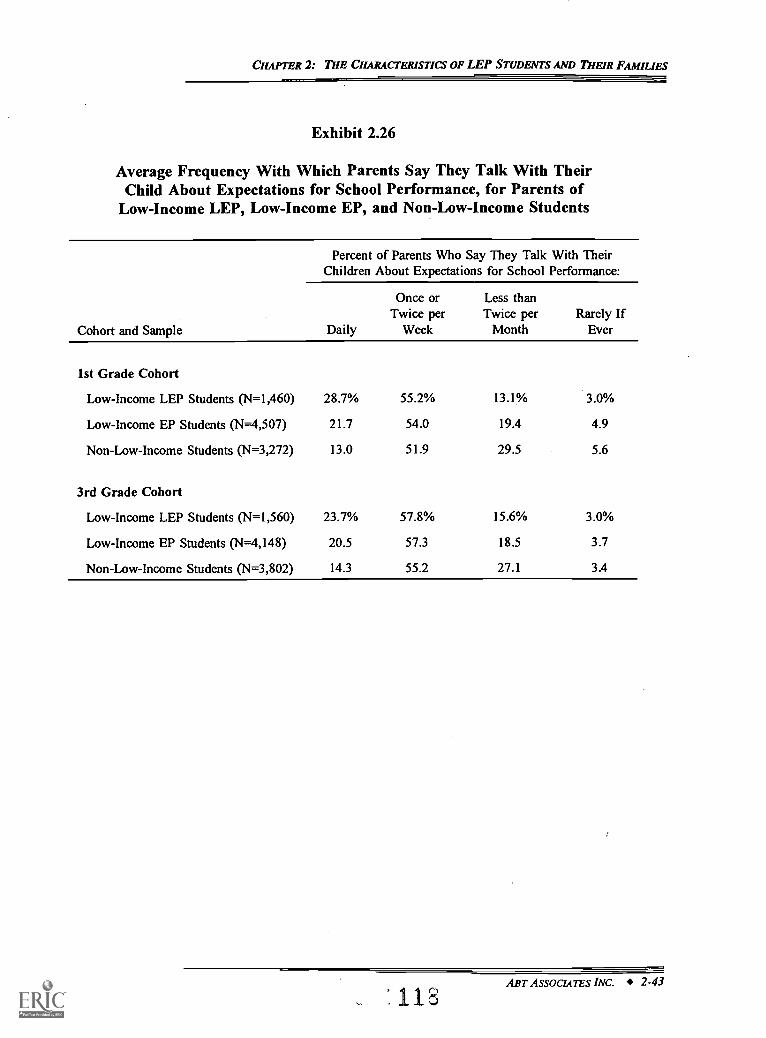
CHAPTER 2: THE CHARACTERISTICS OF LEP STUDENTS AND THEIR FAMILIES
Exhibit 2.26
Average Frequency With Which Parents Say They Talk With TheirChild About Expectations for School Performance, for Parents of
Low-Income LEP, Low-Income EP, and Non-Low-Income Students
Cohort and Sample
Percent of Parents Who Say They Talk With TheirChildren About Expectations for School Performance:
Once or Less thanTwice per Twice per Rarely If
Daily Week Month Ever
1st Grade Cohort
Low-Income LEP Students (N=1,460) 28.7% 55.2% 13.1% 3.0%
Low-Income EP Students (14=4,507) 21.7 54.0 19.4 4.9
Non-Low-Income Students (N=3,272) 13.0 51.9 29.5 5.6
3rd Grade Cohort
Low-Income LEP Students (N=1,560) 23.7% 57.8% 15.6% 3.0%
Low-Income EP Students (N=4,148) 20.5 57.3 18.5 3.7
Non-Low-Income Students (N=3,802) 14.3 55.2 27.1 3.4
ABT ASSOCIATES INC. 2-43
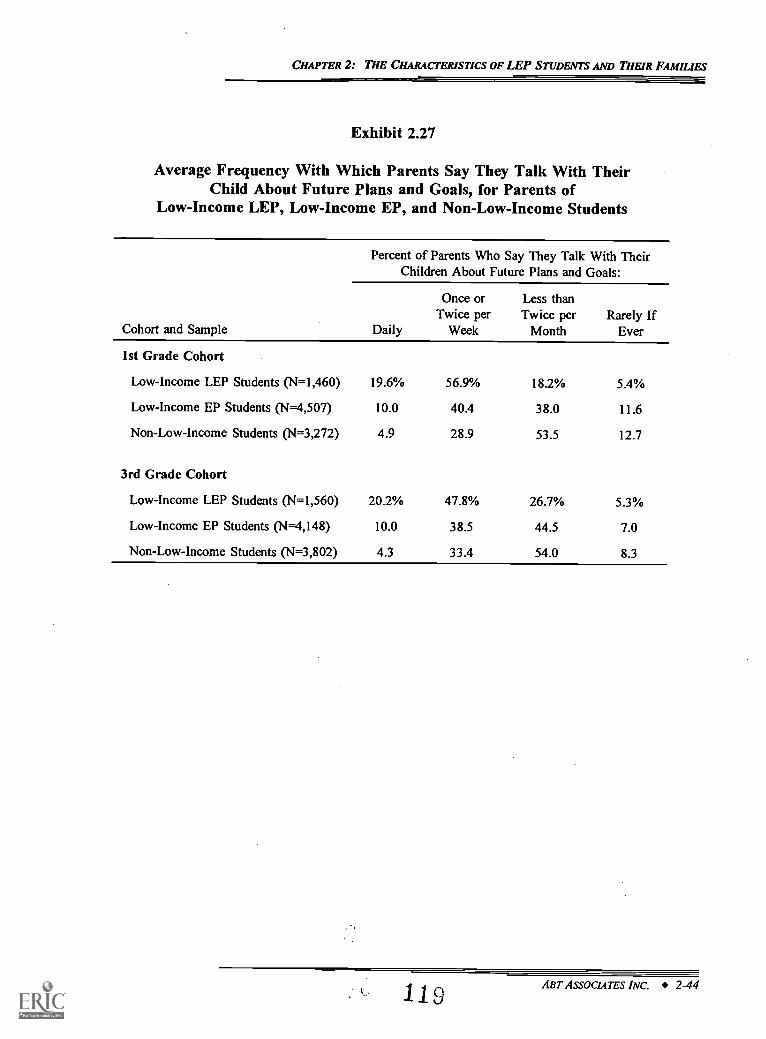
CHAPTER 2: THE CHARACTERISTICS OF LEP STUDENTS AND THEIR FAMIUES
Exhibit 2.27
Average Frequency With Which Parents Say They Talk With TheirChild About Future Plans and Goals, for Parents of
Low-Income LEP, Low-Income EP, and Non-Low-Income Students
Cohort and Sample
Percent of Parents Who Say They Talk With TheirChildren About Future Plans and Goals:
Once or Less thanTwice per Twice per Rarely If
Daily Week Month Ever
1st Grade Cohort
Low-Income LEP Students (N=1,460) 19.6% 56.9% 18.2% 5.4%
Low-Income EP Students (N=4,507) 10.0 40.4 38.0 11.6
Non-Low-Income Students (N=3,272) 4.9 28.9 53.5 12.7
3rd Grade Cohort
Low-Income LEP Students (N=1,560) 20.2% 47.8% 26.7% 5.3%
Low-Income EP Students (N=4,148) 10.0 38.5 44.5 7.0
Non-Low-Income Students (N=3,802) 4.3 33.4 54.0 8.3
119 An' ASSOCIATES INC. 2-44
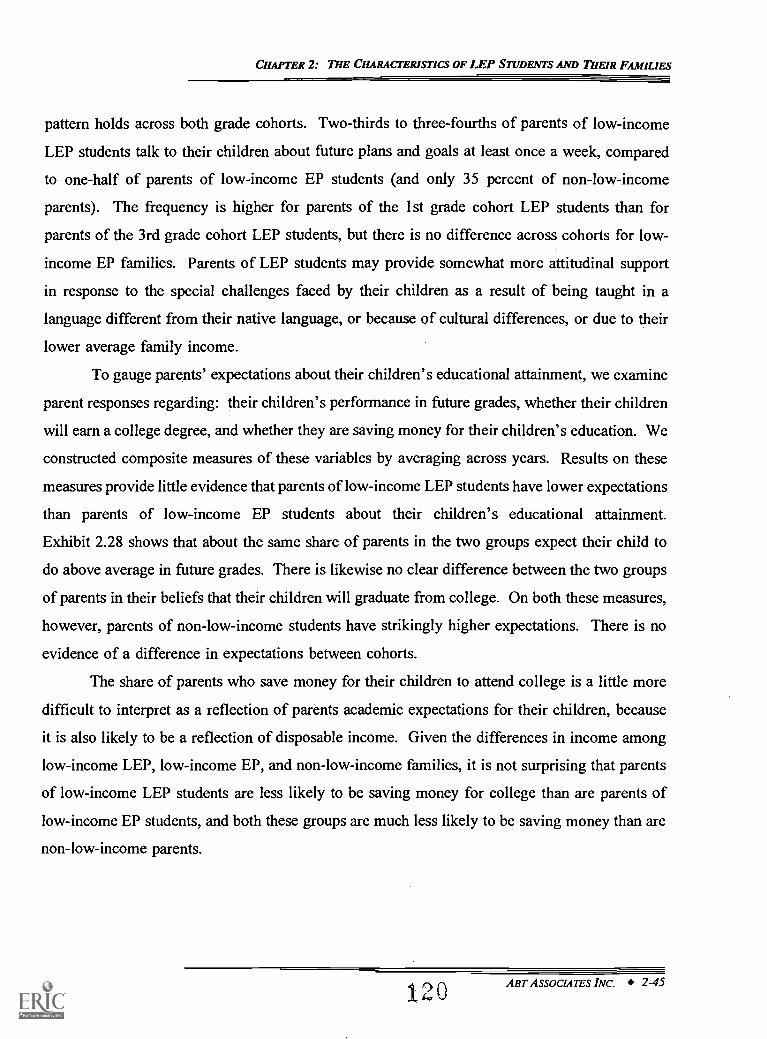
CHAPTER 2: THE CHARACTERISTICS OF LEP STUDENTS AND THEIR FAMILIES
pattern holds across both grade cohorts. Two-thirds to three-fourths of parents of low-income
LEP students talk to their children about future plans and goals at least once a week, compared
to one-half of parents of low-income EP students (and only 35 percent of non-low-income
parents). The frequency is higher for parents of the 1st grade cohort LEP students than for
parents of the 3rd grade cohort LEP students, but there is no difference across cohorts for low-
income EP families. Parents of LEP students may provide somewhat more attitudinal support
in response to the special challenges faced by their children as a result of being taught in a
language different from their native language, or because of cultural differences, or due to their
lower average family income.
To gauge parents' expectations about their children's educational attainment, we examine
parent responses regarding: their children's performance in future grades, whether their children
will earn a college degree, and whether they are saving money for their children's education. We
constructed composite measures of these variables by averaging across years. Results on these
measures provide little evidence that parents of low-income LEP students have lower expectations
than parents of low-income EP students about their children's educational attainment.
Exhibit 2.28 shows that about the same share of parents in the two groups expect their child to
do above average in future grades. There is likewise no clear difference between the two groups
of parents in their beliefs that their children will graduate from college. On both these measures,
however, parents of non-low-income students have strikingly higher expectations. There is no
evidence of a difference in expectations between cohorts.
The share of parents who save money for their children to attend college is a little more
difficult to interpret as a reflection of parents academic expectations for their children, because
it is also likely to be a reflection of disposable income. Given the differences in income among
low-income LEP, low-income EP, and non-low-income families, it is not surprising that parents
of low-income LEP students are less likely to be saving money for college than are parents of
low-income EP students, and both these groups are much less likely to be saving money than are
non-low-income parents.
120 ABT ASSOCIATES INC. 2-45
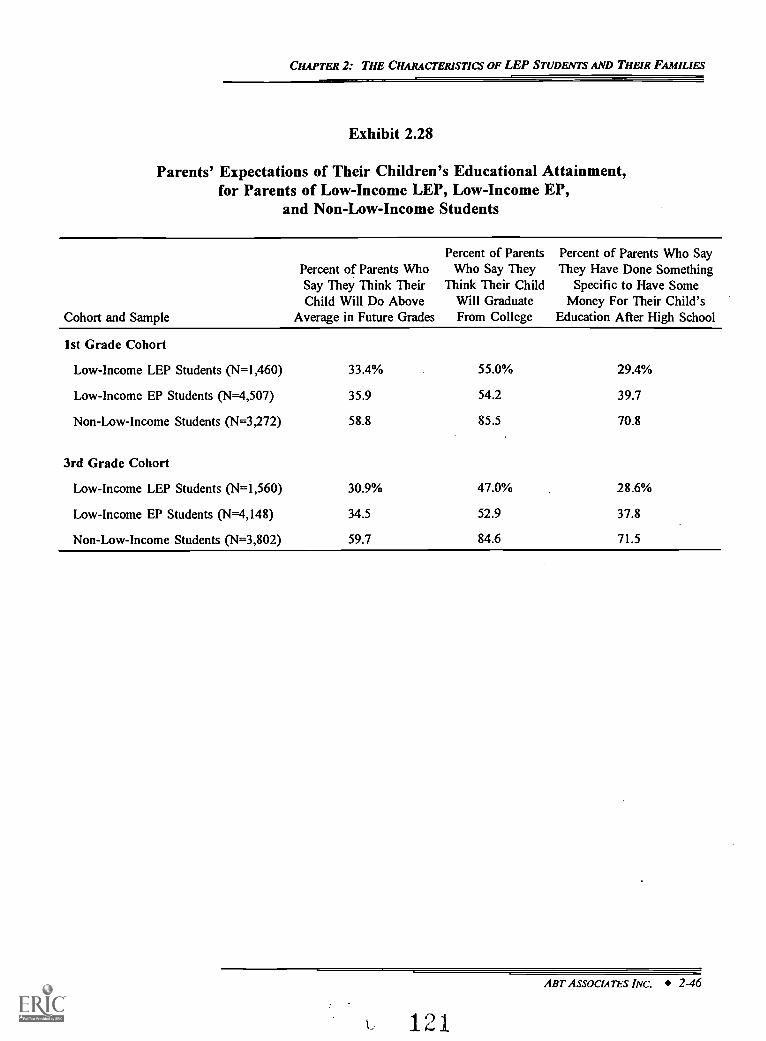
CHAPTER 2: THE CHARACTERISTICS OF LEP STUDENTS AND THEIR FAMILIES
Exhibit 2.28
Parents' Expectations of Their Children's Educational Attainment,for Parents of Low-Income LEP, Low-Income EP,
and Non-Low-Income Students
Cohort and Sample
Percent of Parents WhoSay They Think TheirChild Will Do Above
Average in Future Grades
1st Grade Cohort
Low-Income LEP Students (N=1,460) 33.4%
Low-Income EP Students (N=4,507) 35.9
Non-Low-Income Students (N=3,272) 58.8
3rd Grade Cohort
Low-Income LEP Students (N=1,560) 30.9%
Low-Income EP Students (N=4,148) 34.5
Non-Low-Income Students (N=3,802) 59.7
L 10
Percent of ParentsWho Say They
Think Their ChildWill GraduateFrom College
Percent of Parents Who SayThey Have Done Something
Specific to Have SomeMoney For Their Child's
Education After High School
1
55.0% 29.4%
54.2 39.7
85.5 70.8
47.0% 28.6%
52.9 37.8
84.6 71.5
ABT ASSOCIATES INC. 2-46
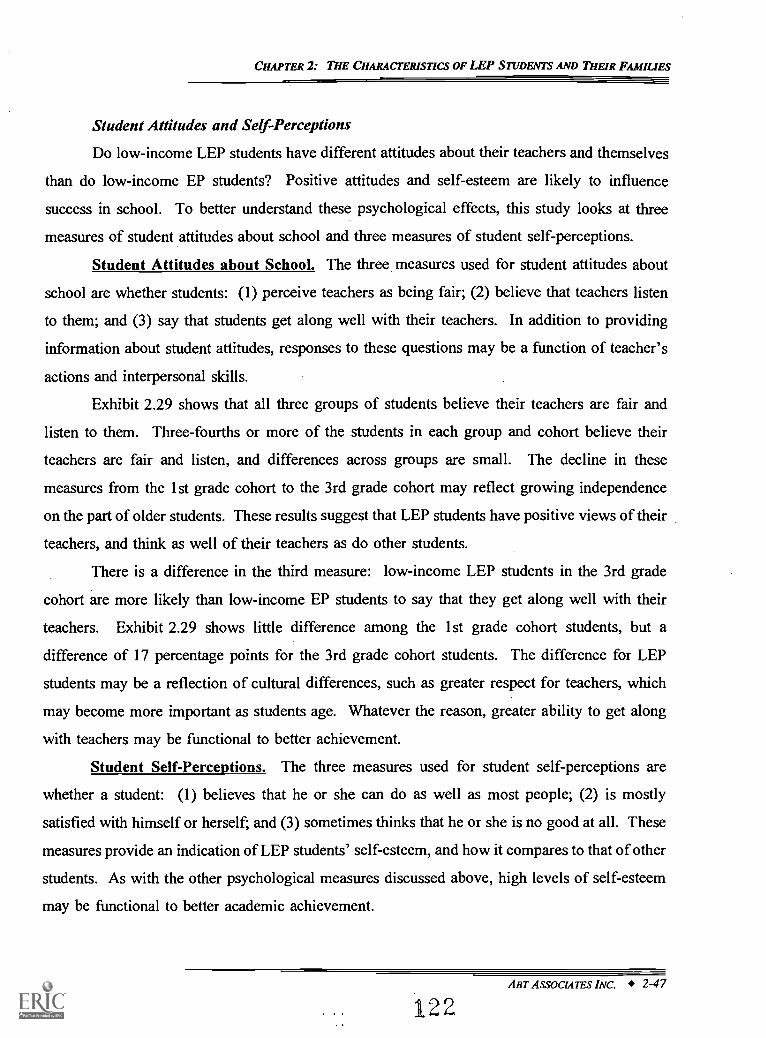
CHAPTER 2: THE CHARACTERISTICS OF LEP STUDENTS AND THEIR FAMILIES
Student Attitudes and Self-Perceptions
Do low-income LEP students have different attitudes about their teachers and themselves
than do low-income EP students? Positive attitudes and self-esteem are likely to influence
success in school. To better understand these psychological effects, this study looks at three
measures of student attitudes about school and three measures of student self-perceptions.
Student Attitudes about School. The three measures used for student attitudes about
school are whether students: (1) perceive teachers as being fair; (2) believe that teachers listen
to them; and (3) say that students get along well with their teachers. In addition to providing
information about student attitudes, responses to these questions may be a function of teacher's
actions and interpersonal skills.
Exhibit 2.29 shows that all three groups of students believe their teachers are fair and
listen to them. Three-fourths or more of the students in each group and cohort believe their
teachers are fair and listen, and differences across groups are small. The decline in these
measures from the 1st grade cohort to the 3rd grade cohort may reflect growing independence
on the part of older students. These results suggest that LEP students have positive views of their
teachers, and think as well of their teachers as do other students.
There is a difference in the third measure: low-income LEP students in the 3rd grade
cohort are more likely than low-income EP students to say that they get along well with their
teachers. Exhibit 2.29 shows little difference among the 1st grade cohort students, but a
difference of 17 percentage points for the 3rd grade cohort students. The difference for LEP
students may be a reflection of cultural differences, such as greater respect for teachers, which
may become more important as students age. Whatever the reason, greater ability to get along
with teachers may be functional to better achievement.
Student Self-Perceptions. The three measures used for student self-perceptions are
whether a student: (1) believes that he or she can do as well as most people; (2) is mostly
satisfied with himself or herself; and (3) sometimes thinks that he or she is no good at all. These
measures provide an indication of LEP students' self-esteem, and how it compares to that of other
students. As with the other psychological measures discussed above, high levels of self-esteem
may be functional to better academic achievement.
ABT ASSOCIATES INC. 2-47
122
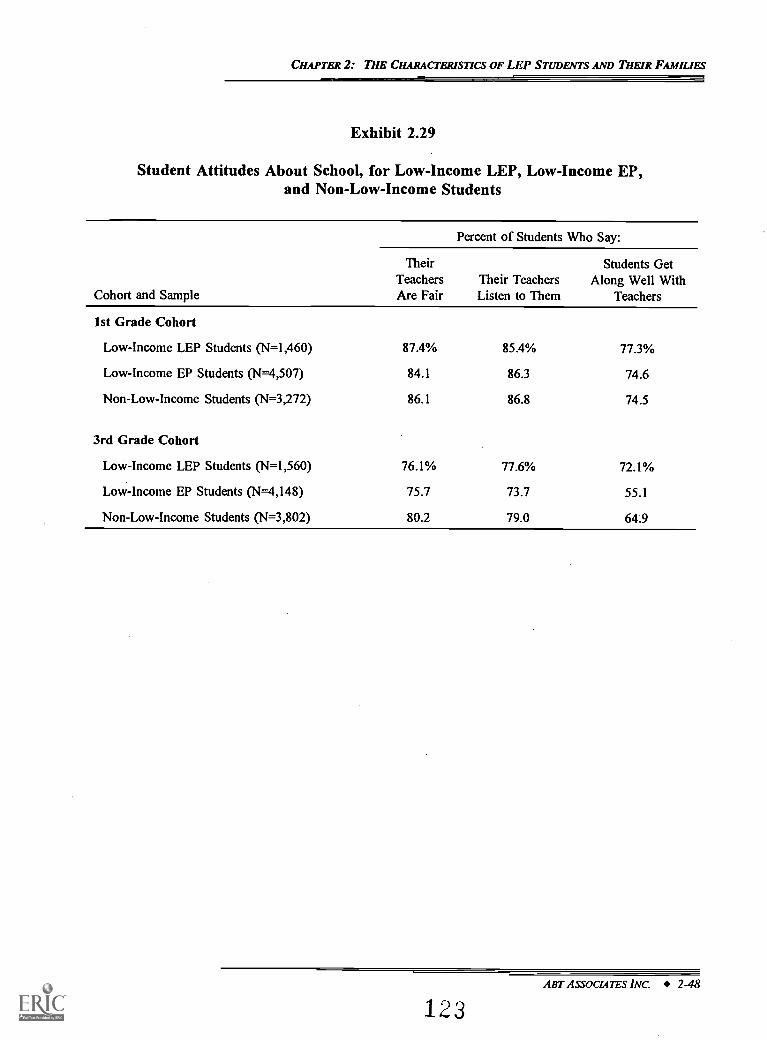
CHAPTER 2: THE CHARACTERISTICS OF LEP STUDENTS AND THEIR FAMILIES
Exhibit 2.29
Student Attitudes About School, for Low-Income LEP, Low-Income EP,and Non-Low-Income Students
Cohort and Sample
Percent of Students Who Say:
Their Students GetTeachers Their Teachers Along Well WithAre Fair Listen to Them Teachers
1st Grade Cohort
Low-Income LEP Students (N=1,460) 87.4% 85.4% 77.3%
Low-Income EP Students (N=4,507) 84.1 86.3 74.6
Non-Low-Income Students (N=3,272) 86.1 86.8 74.5
3rd Grade Cohort
Low-Income LEP Students (W1,560) 76.1% 77.6% 72.1%
Low-Income EP Students (N=4,148) 75.7 73.7 55.1
Non-Low-Income Students (N=3,802) 80.2 79.0 64.9
ABT ASSOCL4TES INC. 2-48
123
CHAPTER 2: THE CHARACTERISTICS OF LEP STUDENTS AND THEIR FAMILIES
On all of these measures and for both cohorts, low-income LEP students show lower
levels of self-esteem than other low-income students, although in most cases the difference is
small. Further, both these groups score below the non-low-income group. Exhibit 2.30 shows
that, although at least three-fourths of the low-income LEP students in both cohorts believe that
they can do as well as most people and are satisfied with themselves, the share of low-income
LEP students who believe this is smaller than the share of low-income EP and non-low-income
students. Similarly, a larger percentage of LEP students think sometimes that they are no good
at all, compared to the other two groups. For example, 44 percent of low-income LEP students
in the 1st grade cohort agree with this statement, compared to 35 percent of low-income EP
students. The lower scores for LEP students may reflect the greater challenges they face. Not
only do they tend to be disproportionately in high-poverty schools, but they face the additional
challenges of learning in a language that is not their primary language and, for some LEP
students, adapting to a culture that is not their native culture. Whatever the cause, lower self-
esteem may impede LEP students' educational progress.
Changing Schools
On balance, students who change schools more frequently may be at a disadvantage
compared to non-movers, because they are less likely to get a continuous and consistent stream
of educational services, and have to adjust more often to new learning and social environments.
This may be even more of a problem for LEP than for EP students because the former need all
the same services as the latter, plus special English language services. We examine school
mobility by counting the number of times students change schools over the study period.
Because we have three years of data for the 1st grade cohort and four years of data for the 3rd
grade cohort, we can observe students changing schools no more than twice in the 1st grade
cohort and three times in the 3rd grade cohort.
Exhibit 2.31 shows that low-income LEP students may change schools more often than
low-income EP students and non-low-income students. Forty-three percent of low-income LEP
students in the first grade cohort change schools during the observation period, compared to
34 and 18 percent of low-income EP and all other students, respectively. If 40 percent of LEP
students change schools between first and third grade, it seems likely that, over the course of the
1 4 ABT ASSOCIATES INC. 2-49
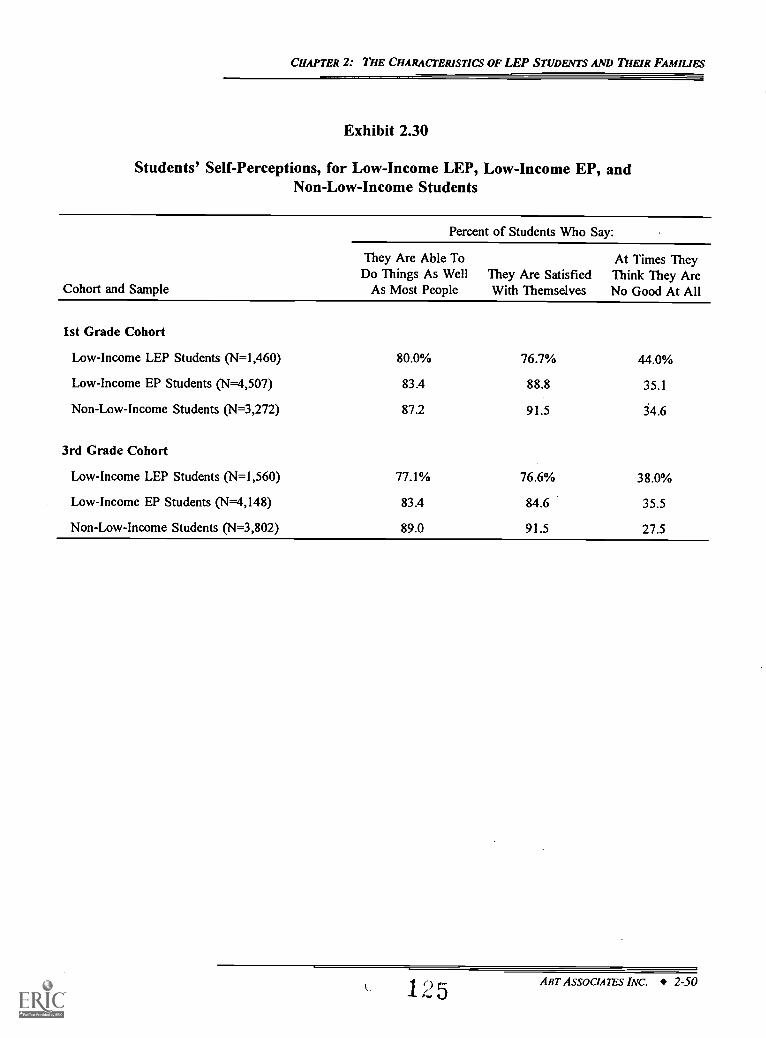
CHAPTER 2: THE CHARACTERISTICS OF LEP STUDENTS AND THEIR FAMILIES
Exhibit 2.30
Students' Self-Perceptions, for Low-Income LEP, Low-Income EP, andNon-Low-Income Students
Cohort and Sample
Percent of Students Who Say:
They Are Able To At Times TheyDo Things As Well They Are Satisfied Think They Are
As Most People With Themselves No Good At All
1st Grade Cohort
Low-Income LEP Students (N=1,460) 80.0% 76.7% 44.0%
Low-Income EP Students (N=4,507) 83.4 88.8 35.1
Non-Low-Income Students (N=3,272) 87.2 91.5 34.6
3rd Grade Cohort
Low-Income LEP Students (N=1,560) 77.1% 76.6% 38.0%
Low-Income EP Students (N=4,148) 83.4 84.6 35.5
Non-Low-Income Students (N=3,802) 89.0 91.5 27.5
1 25 ABT ASSOCIATES' INC. 2-50
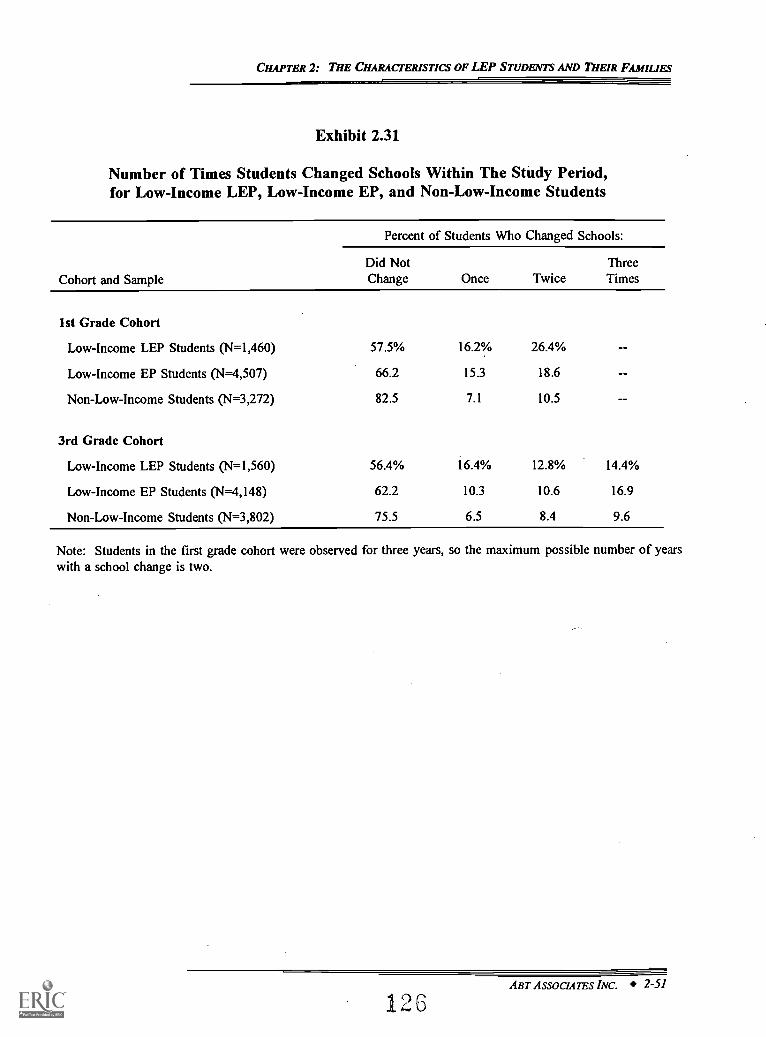
CHAPTER 2: THE CHARACTERISTICS OF LEP STUDENTS AND THEIR FAMILIES
Exhibit 2.31
Number of Times Students Changed Schools Within The Study Period,for Low-Income LEP, Low-Income EP, and Non-Low-Income Students
Cohort and Sample
Percent of Students Who Changed Schools:
Did Not ThreeChange Once Twice Times
1st Grade Cohort
Low-Income LEP Students (N=1,460) 57.5% 16.2% 26.4%
Low-Income EP Students (N=4,507) 66.2 15.3 18.6
Non-Low-Income Students (N=3,272) 82.5 7.1 10.5
3rd Grade Cohort
Low-Income LEP Students (W1,560) 56.4% 16.4% 12.8% 14.4%
Low-Income EP Students (N=4,148) 62.2 10.3 10.6 16.9
Non-Low-Income Students (N=3,802) 75.5 6.5 8.4 9.6
Note: Students in the first grade cohort were observed for three years, so the maximum possible number of yearswith a school change is two.
ABT ASSOCIATES INC. 2-51
CHAPTER 2: THE CHARACTERISTICS OF LEP STUDENTS AND THEIR FAMILIES
entire five or six elementary years, half or more of low-income LEP students will change schools.
LEP students may change schools more than other students because of their parents' relatively
tenuous position in the labor market, which may lead to more frequent job turnover. Whatever
the explanation, the high mobility rates of LEP students may slow down their acquisition of
English language and cognitive skills, other things equal, and therefore is another potential
disadvantage faced by LEP students.
SCHOOL POVERTY AND LEP CONCENTRATION
In this section we describe the schools that LEP students attend in terms of two
characteristics: concentration of school poverty and school LEP concentration. The results in
this section will show the extent to which LEP students are disadvantaged by being in high-
poverty schools, and will show the difficulty of disentangling family poverty, school poverty, and
school LEP concentration. This school-level perspective complements the individual-level
characteristics discussed in the previous sections of this chapter; both perspectives are useful in
understanding LEP students' backgrounds.
To what extent do LEP students attend high-poverty schools? To answer this question,
we classify a school as "high poverty" if at least one-half of the students are eligible for free or
reduced-price meals.' Exhibit 2.32 shows that about three-fourths of all LEP students in both
cohorts attend high-poverty schools. In contrast, only about one-third of all EP students attend
high-poverty schools. LEP students are clearly attending schools with high concentrations of
poor students.
To what extent do LEP students attend schools with high concentrations of LEP students?
The last column of Exhibit 2.32 shows that the LEP students in our sample attend schools where
the average LEP concentration is about 25 percent. In contrast, the EP students in our sample
attend schools where the average LEP concentration is under 5 percent. The average school LEP
23 The National School Lunch Program and the National School Breakfast Program subsidize meals served bypublic and private schools to eligible low-income children. Generally, children are eligible for free meals if theirfamily income is below 130 percent of the Federal poverty line, and are eligible for reduced price meals if theirfamily income is between 130 and 185 percent of the poverty line. This measure of school poverty is used relativelyoften in educational research.
ABT ASSOCIATES INC. 2-52
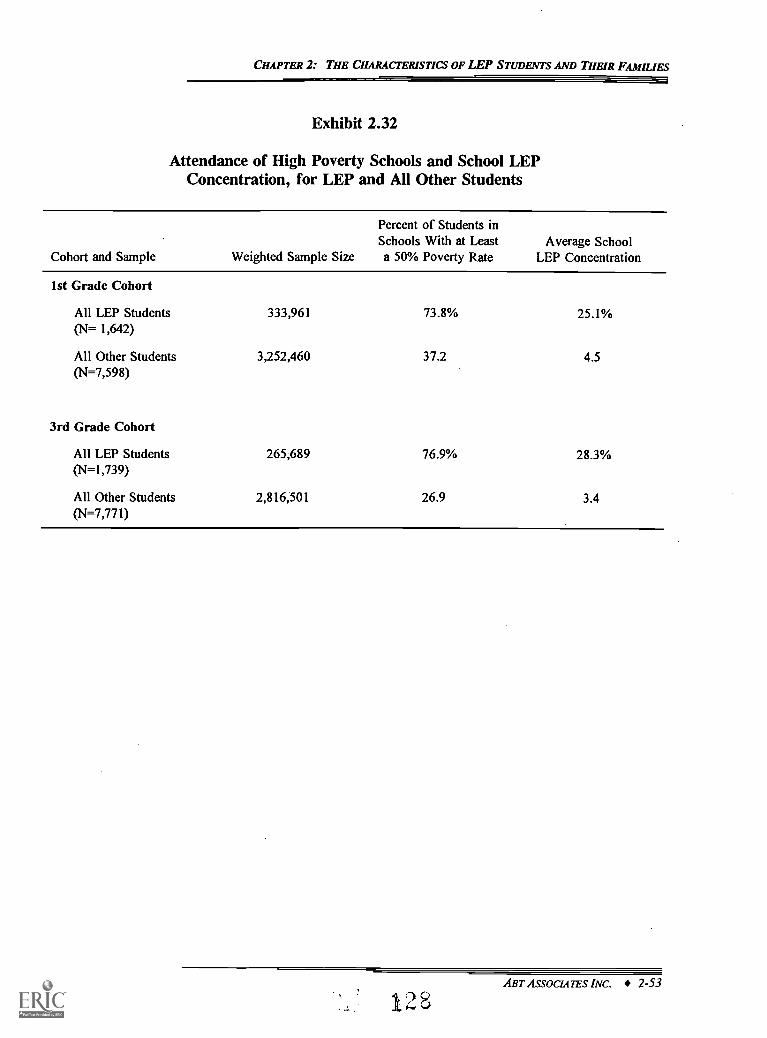
CHAPTER 2: THE CHARACTERISTICS OF LEP STUDENTS AND THEIR FAMILIES
Exhibit 2.32
Attendance of High Poverty Schools and School LEPConcentration, for LEP and All Other Students
Cohort and Sample Weighted Sample Size
Percent of Students inSchools With at Leasta 50% Poverty Rate
Average SchoolLEP Concentration
1st Grade Cohort
All LEP Students 333,961 73.8% 25.1%(N= 1,642)
All Other Students 3,252,460 37.2 4.5(N=7,598)
3rd Grade Cohort
All LEP Students 265,689 76.9% 28.3%(N=1,739)
All Other Students 2,816,501 26.9 3.4(N=7,771)
ABT ASSOCIATES INC. 2-53
128
CHAPTER 2: THE CHARACTERISTICS OF LEP STUDENTS AND THEIR FAMILIES
concentration for all students in the sample is about 6 percent (not shown). It is clear that there
is a certain amount of segregation of LEP students, i.e., they tend to be concentrated in particular
schools. An advantage of this is that LEP students may be more likely to receive appropriate
language services where there are a sufficient number of LEP students, because of economies of
scale. The problem, however, as shown above, is that LEP students are concentrated in high-
poverty schools.
How strong is the relationship between school LEP concentration and school poverty?
Exhibit 2.33 shows a very strong association between these two; schools with high LEP
concentrations are almost invariably high-poverty schools. Across both cohorts, more than
90 percent of all students in schools with high (greater than 25 percent) LEP concentrations are
also in high-poverty schools. This relationship is mirrored at the other end of the scale, where
roughly three-fourths of all students in schools with low LEP concentrations (less than or equal
to 5 percent) are not in high-poverty schools. In sum, the greater the concentration of LEP
students, the greater the likelihood that a school contains a high concentration ofpoor students.
To a large extent, this association reflects the fact that the overwhelming majority of LEP
students are in low-income families, and children in low-income families tend to go to high-
poverty schools. Exhibit 2.34 shows the strong relationship between school poverty and family
poverty. Over 80 percent of LEP students from low-income families attend high-poverty schools.
However, the corresponding number for EP students is much lower: combining both cohorts, less
than 50 percent of EP students from low-income families attend high-poverty schools. This
means that low-income LEP students are much more likely to go to high-poverty schools than
are low-income EP students. LEP students are disadvantaged by the schools that they attend,
even compared to their EP economic peers.
Subdividing the sample of LEP students by race or ethnicity shows that Hispanic LEP
students are much more likely than Asian LEP students to attend high-poverty schools.
Exhibit 2.35 shows that, across both cohorts, about 85 percent of Hispanic LEP students are in
high-poverty schools, compared to about 45 percent of Asian LEP students.
ABT ASSOCL47ES INC. 2-54
129
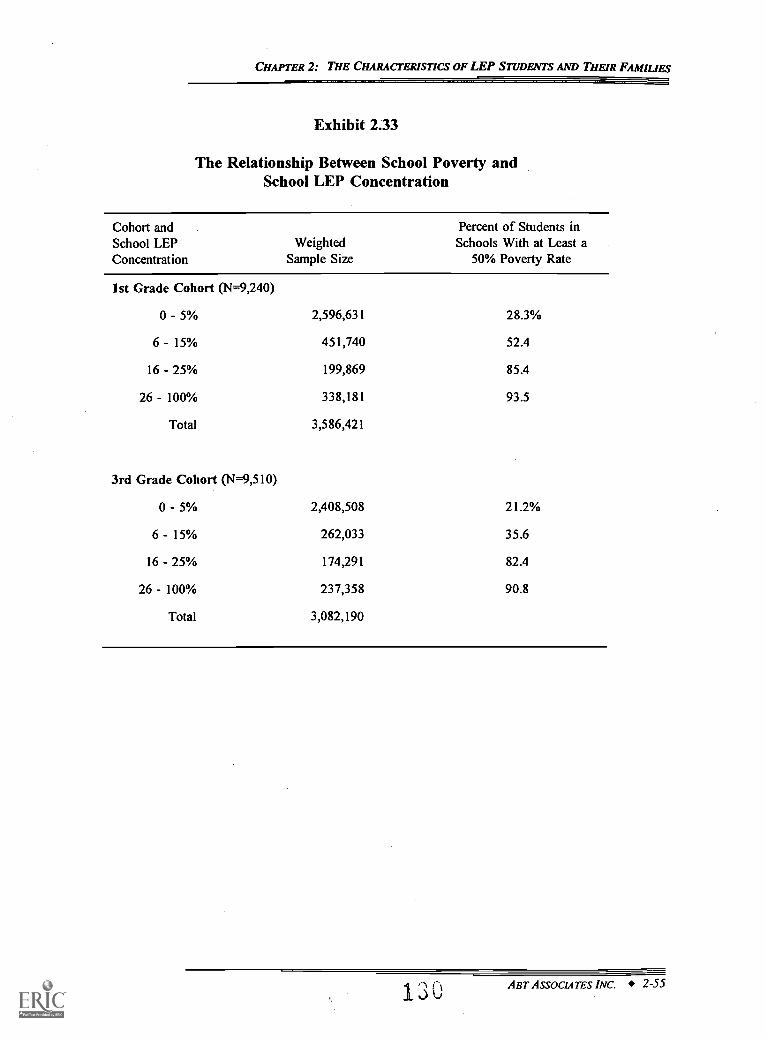
CHAPTER 2: THE CHARACTERISTICS OF LEP STUDENTS AND THEIR FAMILIES
Exhibit 233
The Relationship Between School Poverty andSchool LEP Concentration
Cohort andSchool LEPConcentration
WeightedSample Size
Percent of Students inSchools With at Least a
50% Poverty Rate
1st Grade Cohort (N=9,240)
0 - 5%
6 - 15%
16 - 25%
2,596,631
451,740
199,869
28.3%
52.4
85.4
26 - 100% 338,181 93.5
Total 3,586,421
3rd Grade Cohort (N=9,510)
0 - 5% 2,408,508 21.2%
6 - 15% 262,033 35.6
16 - 25% 174,291 82.4
26 - 100% 237,358 90.8
Total 3,082,190
4 '30 ABT ASSOCIATES INC. 2-55
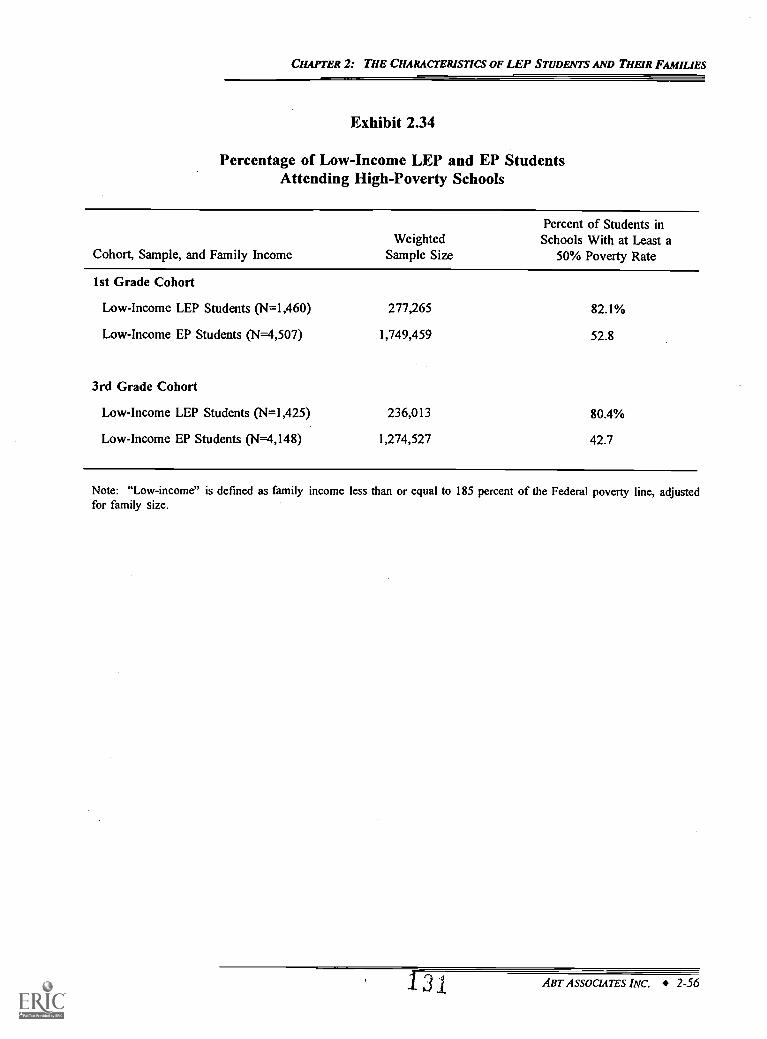
CHAPTER 2: THE CHARACTERISTICS OF LEP STUDENTS AND THEIR FAMILIES
Exhibit 2.34
Percentage of Low-Income LEP and EP StudentsAttending High-Poverty Schools
Cohort, Sample, and Family IncomeWeighted
Sample Size
Percent of Students inSchools With at Least a
50% Poverty Rate
1st Grade Cohort
Low-Income LEP Students (N=1,460) 277,265 82.1%
Low-Income EP Students (N=4,507) 1,749,459 52.8
3rd Grade Cohort
Low-Income LEP Students (N=1,425) 236,013 80.4%
Low-Income EP Students (N=4,148) 1,274,527 42.7
Note: "Low-income" is defined as family income less than or equal to 185 percent of the Federal poverty line, adjustedfor family size.
1 31 ABT ASSOCIATES INC. 2-56
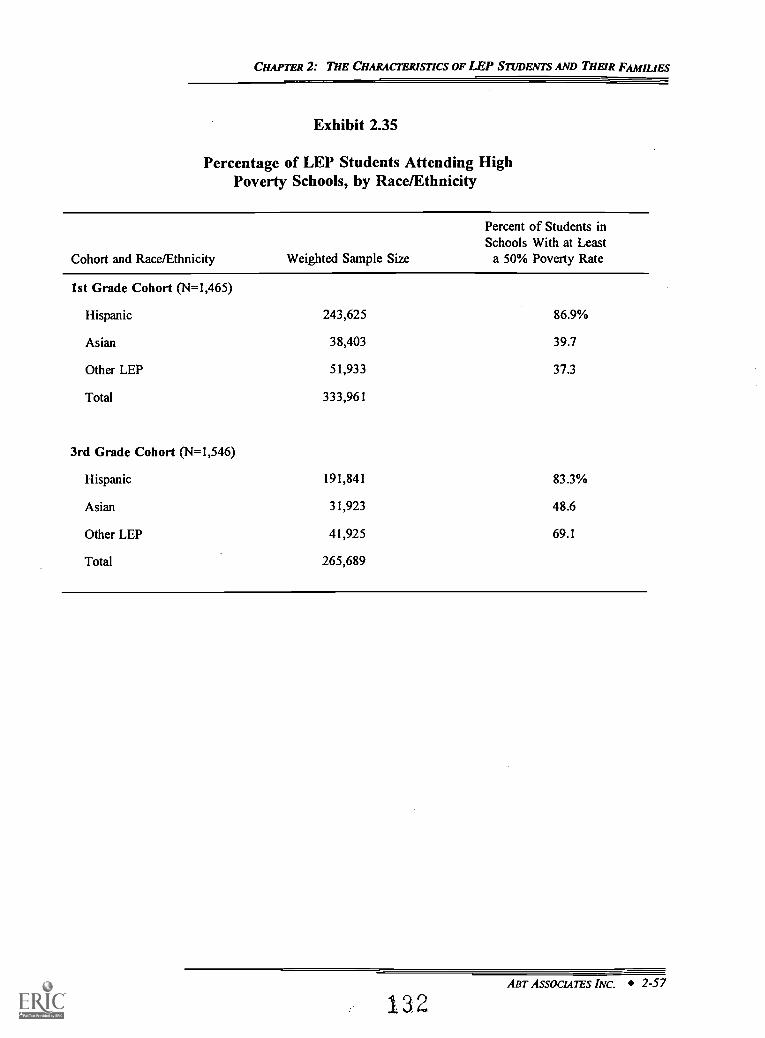
CHAPTER 2: THE CHARACTERISTICS OF LEP STUDENTS AND THEIR FAMILIES
Exhibit 2.35
Percentage of LEP Students Attending HighPoverty Schools, by Race/Ethnicity
Cohort and Race/Ethnicity Weighted Sample Size
Percent of Students inSchools With at Least
a 50% Poverty Rate
1st Grade Cohort (N=1,465)
Hispanic 243,625 86.9%
Asian 38,403 39.7
Other LEP 51,933 37.3
Total 333,961
3rd Grade Cohort (N=1,546)
Hispanic 191,841 83.3%
Asian 31,923 48.6
Other LEP 41,925 69.1
Total 265,689
ABT ASSOCIATES INC. 2-57
132
CHAPTER 2: THE CHARACTERISTICS OF LEP STUDENTS AND THEIR FAMILIES
SUMMARY
The central result of this chapter is that, on many measures of family resources and
characteristics, LEP students are clearly disadvantaged even compared to other low-income
students. This in turn suggests that, to the extent that the goal of federal educational policy and
resources is to help "level the playing field" for all groups of students, an argument could be
made to focus special services on LEP students.
The key findings of this chapter regarding the disadvantages faced by LEP students are:
About three-fourths of all LEP students attend high-poverty schools. In contrast,only about one-third of English proficient (EP) students attend high-povertyschools.
LEP students tend to be concentrated rather than dispersed across schools; andschools with the highest LEP concentrations are almost invariably high-povertyschools. LEP students attend schools where the average LEP concentration isabout 25 percent; in contrast, EP students attend schools where the average LEPconcentration is less than 5 percent. Of schools with LEP concentrations above25 percent, almost all are high-poverty schools. Thus, LEP students are clearlydisadvantaged by the schools they attend.
Compared to parents of low-income EP students, parents of low-income LEPstudents on average have much lower levels of education.
Parents of low-income LEP students are less likely than parents of low-income EPstudents to participate in activities at their children's school, perhaps because oflanguage barriers or cultural differences.
Relative to low-income EP students, low-income LEP students spend a greateramount of time per day alone at home.
Low-income LEP students change schools more often than low-income EPstudents and non-low-income students.
At the same time, the analyses in this chapter found several positive background indicators
for LEP students compared to other low-income students. Among these are:
Low-income LEP students are more likely than low-income EP students to comefrom two-parent households.
ABT ASSOCIATES INC. 2-58
1 3
CHAPTER 2: THE CHARACTERISTICS OF LEP STUDENTS AND THEIR FAMMIES
Parents of low-income LEP students are more likely than parents of other low-income students to talk to their child at least once a week about future plans andgoals.
At least 70 percent of LEP students are judged by their teachers to have good orexcellent proficiency in at least one language.
ABT ASSOCIATES INC. 2-59
134
CHAPTER 3: EDUCATIONAL SERVICES FOR LIMITED ENGLISH PROFICIENT STUDENTS
CHAPTER 3
EDUCATIONAL SERVICES FOR LEP STUDENTS
This chapter focuses on the educational services provided to limited English proficient
(LEP) students in elementary school. We address several important research questions on the
school and classroom setting in which educational services are provided, the quality of the
instructional staff, and the instructional content of classes attended by LEP students. Where
appropriate, we compare the educational services received by LEP students to those received by
English proficient (EP) students. These educational services, along with the characteristics of
LEP students that were covered in the prior chapter, have a major influence on the educational
outcomes of LEP students. But unlike students' characteristics, which are generally beyond the
influence of education policy makers, the services covered in this chapter are affected by local,
state, and federal education policies. The net result of these two factorsstudent outcomesis
examined in the next chapter.
This chapter examines survey reports of teacher credentials, access to instructional
materials and computers, and other factors. While this provides useful measures, it does not
include direct measures of instructional quality, such as how English language (or native
language) instructional materials are actually used in instruction. As various studies of
instructional reform have documented, there is sometimes a nontrivial difference between teacher
survey data and the data from teacher logs, classroom observations or other direct measures.
Nevertheless, as work by Porter et al. (1993) and others has found, teacher survey results provide
useful information for assessing learning opportunity.
As in the rest of the report, the Prospects data that we use in this chapter are, when
appropriately weighted, nationally representative, longitudinal samples of U.S. public school
students in the 1st grade in the fall of the 1991-92 academic year and in 3rd grade in the spring
of the 1990-91 academic year. Data were collected for each cohort through the spring of 1994,
providing three years of data for the 1st grade cohort and four years of data for 3rd grade cohort.
Thus, we have data on the 1st grade cohort as students progress from 1st to 3rd grade, and
similarly for the 3rd grade cohort as students progress from 3rd to 6th grade. In looking at
ABT ASSOCIATES INC. 3-1
135
CHAPTER 3: EDUCATIONAL SERVICES FOR LIMITED ENGLISH PROFICIENT STUDENTS
patterns over time, we adopt the convention in this report of labeling each year's results as though
all students remained on grade level throughout the follow-up period. For example, we call the
second year (1993) of data collection for the 1st grade cohort "2nd grade," even though a small
fraction of the students in that cohort were retained in 1st grade that year and other students
skipped a grade and were in 3rd grade that year. As discussed in Chapter 1, in longitudinal
samples of this sort, later years of data are not fully representative of the grade level to which
they pertain. For example, 1993 data for the 1st grade cohort do not represent all 2nd graders
in the nation even with universal advancement on grade level, since some number of students
enter U.S. public schools between 1st and 2nd grades but are not included in the sample.
It should also be emphasized that the educational services for LEP students in this chapter
pertain only to students who are in elementary school (1st through 6th grade) and may not
generalize to LEP students in higher grades. For information on educational services provided
to middle school and high school students, see Fleischman and Hopstock (1993).
Overview of This Chapter
This chapter consists of three parts, each focusing on a different aspect of LEP students'
elementary school experience. First, we address the question: Are educational services responsive
to the special needs of LEP students? In this section, we examine school-level characteristics,
teachers' qualifications, and instructional services that are appropriate for the special needs of
students with limited English proficiency. The analysis in this section is therefore restricted to
students identified as limited English proficient during the Prospects study period.
Next, we address the question: Do limited English proficient students receive the same
quality of educational inputs as English proficient students? Here we examine general
educational services that are important measures of the quality of education received by LEP and
EP students alike. These include measures of the regular classroom teachers' qualifications, the
classroom instructional setting, and material resources.
Because LEP students on average attend schools with higher rates of family poverty than
do EP students, we restrict our comparison of LEP and EP students to high-poverty schools, in
order to partially disentangle educational differences due to local economic conditions from
ABT ASSOCIATES INC. 3-2
CHAPTER 3: EDUCATIONAL SERVICES FOR LIMITED ENGLISH PROFICIENT STUDENTS
remaining differences associated with limited English language proficiency per se.' We define
a high-poverty school as a school where over half of the enrolled students are eligible for free
or reduced-price school lunches.2 In Chapter 2, we found that about three-fourths of LEP
students were in high-poverty schools, whereas about one-third of EP students were in high-
poverty schools. If we compared the educational services provided to LEP and EP students at
all schools, we wouldin large partbe comparing the services provided at high-poverty schools
(LEP students) to the services provided at lower-poverty schools (EP students), which is not the
focus of this study. For completeness, information on all studentsLEP plus EPin lower-
poverty schools is also presented, but generally not discussed in the text.
Finally, we address the question: Do LEP students receive the same level of instructional
content as EP students? In this section, we examine the skills emphasized by students' regular
math and reading/English/language arts teachers, the types of instructional materials used, and the
use of computers in instruction. As in the prior section, this analysis uses data on the 1993-94
academic year and compares LEP and EP students in high-poverty schools.
Interpretation of Weighted Results
All results reported in this chapter are based on analysis using the Prospects student-level
weights. The weights are designed so that the results for the 1st grade cohort reflect the national
population of public school students in the 1st grade in the Spring of 1992. Similarly, the results
for the 3rd grade cohort reflect the population of public school students in 3rd grade in the Spring
of 1991.3
We chose to compare the educational experience of EP and LEP students based upon comparable levels ofschool-level poverty rather than family poverty because schools are the fundamental structure through which theeducational inputs we analyze in this chapter are delivered.
2 The family-level poverty measure used in Chapter 2 and the school-level poverty measure in this chapter areclosely related. The family-level poverty measure defines a poor family as a family with income below 185 percentof the poverty line, while the school-level poverty measure used here is based upon the percent of students eligiblefor free or reduced-price lunches. The standard eligibility rules for receiving free or reduced-price lunches requiresthe student be from a family with income below 185 percent of the poverty line. A little over 80 percent of LEPstudents from low-income families attend high-poverty schools (see Exhibit 2.34 in Chapter 2).
3 For information about the sample design and weighting procedures, see Bryant (1993).
ABT ASSOCIATES INC. 3-3
137
CHAPTER 3: EDUCATIONAL SERVICES FOR LIMITED ENGLISH PROFICIENT STUDENTS
The Prospects study follows students over time, rather than teachers or schools. Hence,
our analyses of school-, classroom-, or teacher-level characteristics should be interpreted as
reflecting the population of public school students in the nation (as of 1991 or 1992) rather than
the population of schools, classrooms, or teachers. For example, if we examine the proportion
of schools with after-school clubs, the correct interpretation would be that X percent of students
attend schools with after-school clubs, rather than X percent of schools have after-school clubs.
A Brief Comment on Imputation Procedures
As is the case with all longitudinal surveys, especially surveys that attempt to collect a
comprehensive set of variables from many different sources, procedures for dealing with missing
data are of critical importance to the Prospects study. Our procedures for imputing missing data
are described in detail in Appendix D. We performed separate imputations for school
characteristics, classroom- and teacher-level characteristics for each subject and cohort, and
student-level characteristics for each cohort. In each case, we inferred a plausible value for the
missing variable based on values of related variables for the same student (or teacher or
classroom or school) and values of the same variable for other similar observations (other years,
students, teachers, classrooms, or schools). For each set of imputations, two criteria had to be
met before undertaking imputation: there had to be a sufficient number of related variables with
non-missing data for that observation; and there had to be enough observations in the sample as
a whole with non-missing data for the variable being imputed. This means that we still have
small amounts of missing data for which we did not impute. A little over one percent of students
are missing data on school-level characteristics and between three and four percent of students
are missing data on classroom- and teacher-level characteristics. Only a handful of students are
missing data on student-level characteristics. Although it is unlikely that the remaining missing
data are missing at random, they affect only a very small proportion of the overall sample, and
thus are unlikely to substantially affect our results.
ABT ASSOCIATES INC. 3-4
1 3 8
CHAPTER 3: EDUCATIONAL SERVICES FOR LIMITED ENGLISH PROFICIENT STUDENTS
ARE EDUCATIONAL SERVICES RESPONSIVE TO THE SPECIAL NEEDS OF LEP STUDENTS?
In this section, we examine educational inputs that are pertinent to the needs of students
with limited English proficiency to ascertain whether the appropriate services are available and
provided to LEP students, and whether the qualifications of school staff are consistent with
providing for the special needs of LEP students. Because the educational inputs examined in this
section are not relevant to English proficient students, we limit the analysis to students identified
as LEP at any time during the survey period.4
The first subsection examines school-level services and the language background of the
principal leading the school. The second subsection examines the qualifications of the regular
classroom teachers in the classes attended by LEP students. The third subsection examines the
responsiveness of instructional content received by LEP students at various reading and writing
proficiency levels.
Do the schools attended by LEP students have integrated, focused LEP programs well-supported by and coordinated within the school structure as a whole?
School characteristics define the broad environment in which LEP students receive their
education, and therefore are potentially important influences on student outcomes. We examine
the extent to which schools address the special needs of LEP students by looking at the following
measures:
The availability of English-as-a-second language (ESL) and bilingual education(BE) classes;5
The principal's language background and training;
The degree of coordination between regular classroom teachers and specialESL/BE instructors;
See Chapter 1 for a description of our procedures for coding students as LEP at any time using Prospects data.
ESL classes are designed to teach listening, speaking, reading and writing English language skills to limited-English-proficient students. Bilingual education generally means English language instruction supplemented by non-English instruction. Both ESL and bilingual education are used to teach content, not only English language skills.
ABT ASSOCIATES INC. 3-5
1,3 9
CHAPTER 3: EDUCATIONAL SERVICES FOR LIMITED ENGLISH PROFICIENT STUDENTS
The extent of integration of LEP and English proficient students during the courseof the school day;
The availability of services for the families of LEP and other language minoritystudents; and
The degree of respect parents of LEP students feel they and their children receivefrom school staff.
The goal here is to measure the characteristics of the typical school attended by LEP
students. To do this, we first associate each LEP student with the characteristics of his or her
school during each year of the observation period (because students can be in different schools
in different years). Each student's school environment is then averaged across years6 and
weighted according to the share of the population the student represents. We then use these
student-level weighted observations to characterize the environment faced by the typical LEP
student during the study period.
Do LEP students' schools offer classes to meet the specific needs of LEP students?
To address this question, we first examine the availability of ESL/BE instructional services,
funded by Chapter 1 or other sources, in the school and at the grade in which LEP students are
enrolled.' We also look at whether the school offers a program of instruction in the history or
culture associated with the backgrounds of its language minority (LM) and limited English
proficient students.' The quality of services is likely to have important impacts on student
6 If a student attends more than one school during the observation period, we average the characteristics of thedifferent schools. Based on measures of school-level poverty and the percent of students at the school whoare LEP,most LEP students who changed schools moved to a similar school. Two-thirds of LEP students leaving a high-poverty school (a school where more than 50 percent of the students are eligible for a free or reduced-price lunch)moved to a high-poverty school and three-fourths of LEP students leaving a lower-poverty school moved to a lower-poverty school. About half the students moving from a school where more than 15 percent of the students wereLEP moved to a similar school and almost all students moving from a school where less than 15 percent of thestudents were LEP moved to a similar school.
For students who do not stay on grade level in later years of the study, we do not use actual grade level butthe grade they would have attended had they remained on grade level. Some school-level Prospects questions wereasked only for those grades in which students on grade level were enrolled.
An LM student is a student in whose home a non-English language is typically spoken. Such students mayinclude those proficient in English and able to benefit from instruction in academic subjects offered in English aswell as students whose English proficiency is limited. LEP students are a subgroup of LM students and consist of
ABT ASSOCIATES INC. 3-6
140
CHAPTER 3: EDUCATIONAL SERVICES FOR LIMITED ENGLISH PROFICIENT STUDENTS
learning. While this study includes information on access to service and other factors, it does not
include direct measures of service and instructional quality.
As the first row of Exhibit 3.1 indicates, LEP students in 1st through 3rd grade between
1992 and 1994 (in the 1st grade cohort) attended schools that offered ESL/BE instructional
services at their grade level about 91 percent of the time. LEP students in the 3rd grade
cohortwho attended 3rd through 6th grade between 1991 and 1994fiad a little less access to
ESL/BE services, attending schools that offered those services to their grade level about
83 percent of the time. These numbers show that the great majority of students categorized as
LEP at some point during the observation period attend schools with ESL/BE services available
at their grade level in any given year.'
Our estimates of the availability of ESL/bilingual programs at a school are lower than
those reported in Han et al's (1997) study using Schools and Staffing Survey (SASS) data, but
there is a substantial difference in the calculations that is consistent with the difference in
estimates. The SASS report estimates that 97 percent of LEP students attended schools that
offered an ESL or bilingual instructional program in the 1993/94 academic year (p.12). Our
estimates (91 percent for the 1st grade cohort and 83 percent for the 3rd grade cohort) are based
on whether an ESL/bilingual instructional program is offered at the student's grade level. Thus,
if the school offers an ESL/bilingual program, but not at the student's grade level, the Han et al.
estimate counts the student as attending a school where an ESL or bilingual program is available,
whereas our estimate does not count the student as attending a school where an ESL or bilingual
program is available unless it is available in their grade level. Essentially, we have different
indicators of the availability of ESL/BE programs at schools attended by LEP students. This
difference in what each indicator is measuring is consistent with our lower estimate of the
availability of ESL/BE programs at schools attended by LEP students.
The lower half of Exhibit 3.1 shows that LEP students' schools are somewhat less likely
to offer programs of instruction in the history, culture, or ethnic studies associated with the
students whose native language is not English and whose skills in listening to, speaking, reading, or writing Englishare such that he/she derives little benefit from school instruction in English.
9 School districts are required by law to provide language-related services to LEP students who need them, andthe numbers presented in Exhibit 3.1 suggest a high, but not complete, level of compliance with this requirement.
1 1 1ABT ASSOCIATES INC. 3-7
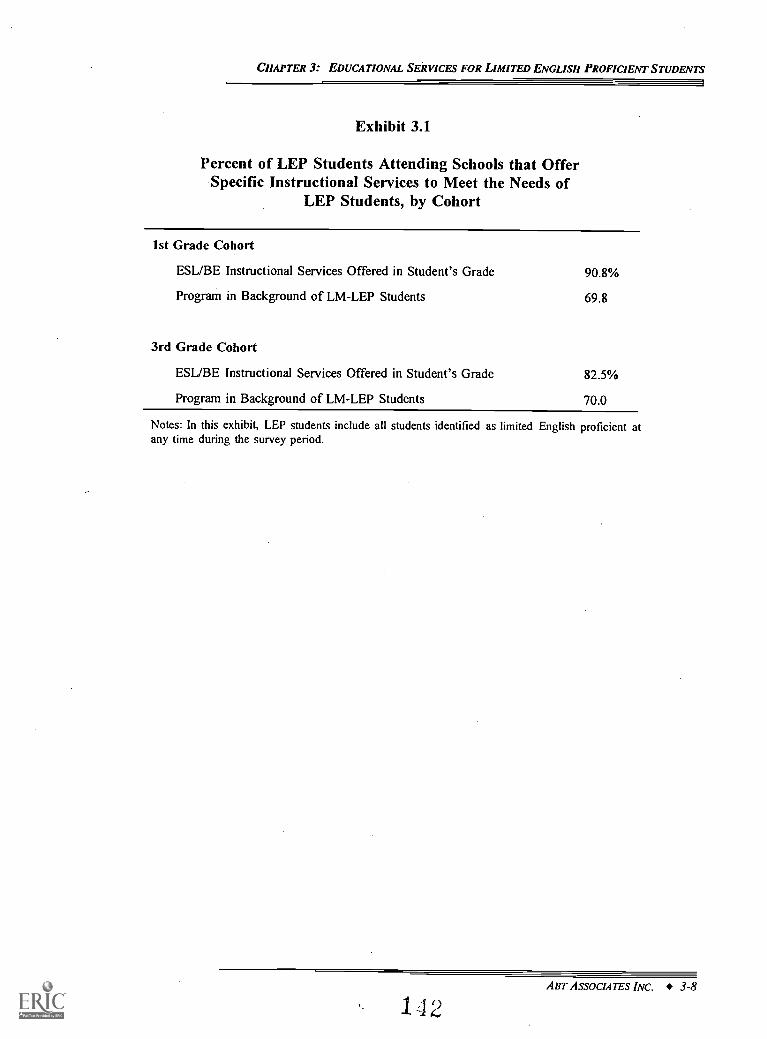
CHAPTER 3: EDUCATIONAL SERVICES FOR LIMITED ENGLISH PROFICIENT STUDENTS
Exhibit 3.1
Percent of LEP Students Attending Schools that OfferSpecific Instructional Services to Meet the Needs of
LEP Students, by Cohort
1st Grade Cohort
ESL/BE Instructional Services Offered in Student's Grade 90.8%
Program in Background of LM-LEP Students 69.8
3rd Grade Cohort
ESL/BE Instructional Services Offered in Student's Grade 82.5%
Program in Background of LM-LEP Students 70.0
Notes: In this exhibit, LEP students include all students identified as limited English proficient atany time during the survey period.
ART ASSOCIATES INC. 3-8
142
CHAPTER 3: EDUCATIONAL SERVICES FOR LIMITED ENGLISH PROFICIENT STUDENTS
background of their LM-LEP students. LEP students attend schools that offer this type of
program 70 percent of the time for both cohorts (i.e., while in the 1st through 5th grades").
Even when offered in a school, however, these programs may not have been provided to the
particular student of interest or cover his or her specific cultural background.
Do LEP students' principals have the appropriate training to be cognizant of the
special needs of students with limited English proficiency? Two measures of the background
and training of principals at schools attended by LEP students that may indicate how well the
principal can provide leadership for a school's LEP-related programs are: whether the principal
has received recent training in ESL/BE education, and whether the principal is proficient in the
predominant non-English language of LM-LEP students at the school. We examine both these
measures below.
As can be seen in Exhibit 3.2, approximately 60 percent of the time between 1991 to 1994
LEP students were in schools with principals who had received training in ESL/BE education
during the past three years. While this indicates that a substantial percentage of LEP students'
principals had received recent training in language-appropriate teaching methods, the principals
were not asked to report the type or extent of this training. Hence, it could be as little as part
of an in-service day, or as much as an advanced degree in bilingual education.
Nearly 30 percent of LEP students' principals report being proficient in the predominant
non-English language of LM-LEP students at their school." Other research has found some
reason to question the accuracy of self-reports of language proficiency (see, e.g., Kirsch et al.
10 This question was not asked in the 1994 questionnaire and so is not available for the 6th grade.
" Principals are only asked about their proficiency in the predominant non-English language of LM-LEPstudents, hence we do not know if the principal is proficient in other non-English languages spoken by LEP studentsat the school. For example, a Korean-speaking student at a school with mostly Spanish-speaking LM-LEP studentsis counted as attending a school where the principal is proficient in the predominant non-English language of LM-LEP students if the principal is proficient in Spanish, even if the principal is not proficient in Korean. Conversely,if the principal is not proficient in Spanish, the student is counted as attending a school where the principal doesnot speak the predominant non-English language of LM-LEP students, even if the principal is proficient in Korean.We cannot tell from our data whether or not these two effects cancel each other out, or whether the estimatedpercent of LEP students with principals who are proficient in the predominant non-English language of LM-LEP
students is an over- or under-estimate of the percent of LEP students with principals who are proficient in thestudents' first language.
143ABT ASSOCIATE'S INC. 3-9
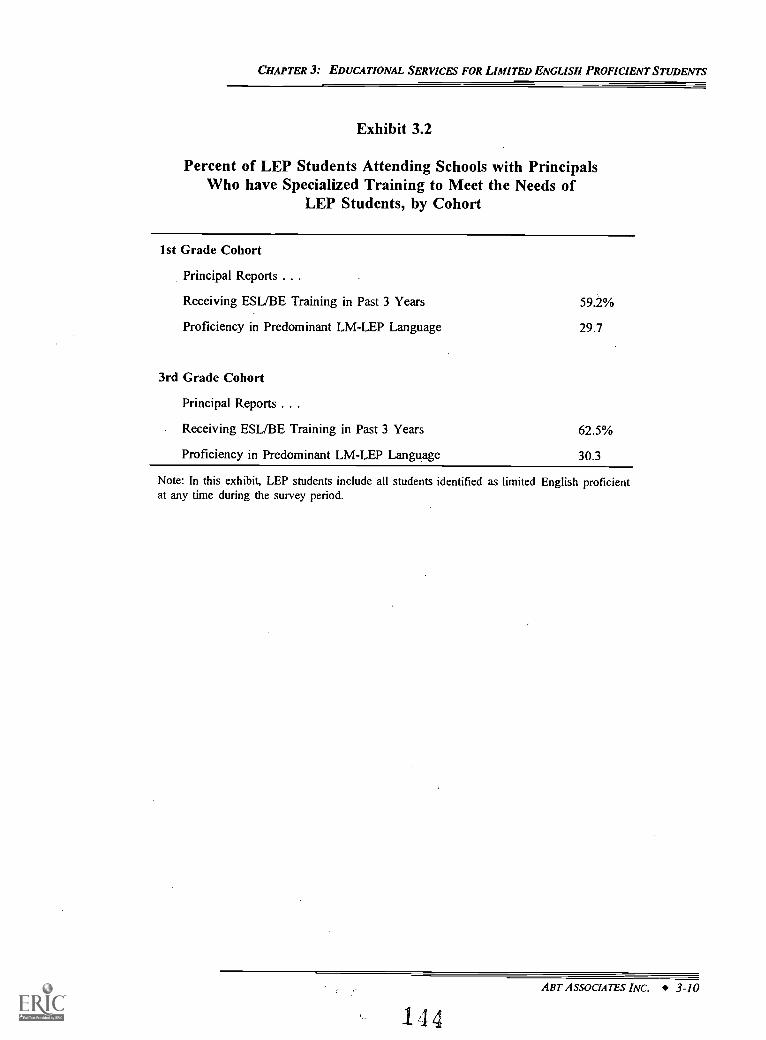
CHAPTER 3: EDUCATIONAL SERVICES FOR LIMITED ENGLISH PROFICIENT STUDENTS
Exhibit 3.2
Percent of LEP Students Attending Schools with PrincipalsWho have Specialized Training to Meet the Needs of
LEP Students, by Cohort
1st Grade Cohort
Principal Reports . . .
Receiving ESL/BE Training in Past 3 Years
Proficiency in Predominant LM-LEP Language
3rd Grade Cohort
Principal Reports . . .
Receiving ESL/BE Training in Past 3 Years
Proficiency in Predominant LM-LEP Language
59.2%
29.7
62.5%
30.3
Note: In this exhibit, LEP students include all students identified as limited English proficientat any time during the survey period.
ABT ASSOCIATES INC. 3-10
144
CHAPTER 3: EDUCATIONAL SERVICES FOR LIMITED ENGLISH PROFICIENT STUDENTS
1993, and Anderson 1982). Still, it is likely that a non-trivial share of LEP students attend
schools where the principal is proficient in the student's native language.
Do ESL/bilingual education and regular classroom staff coordinate their instruction
to LEP students? This question is addressed by looking at school staff responses to a series of
questions asking about the frequency with which specific procedures are used to coordinate
instruction to ESL/BE participants. Frequent consultations to coordinate instruction of LEP
students could substantially enhance the content and teaching effectiveness for LEP students and
allow for effective integration of LEP and EP students' instruction.
As can be seen in Exhibit 3.3, the most common procedure for coordinating instruction
for ESL/BE participants is informal discussions between ESL/BE and regular instructional staff.
In 1st and 2nd grade (1st grade cohort), the Prospects data show that 44 percent of LEP students
are in schools where informal discussions occur between regular and ESL/BE teachers on a daily
basis. LEP students in 3rd through 5th grades (3rd grade cohort) are in such schools 39 percent
of the time.' The table also shows that where daily discussions do not occur, weekly or
monthly discussions usually do. Even so, it is unclear whether all ESL/BE instruction in a given
student's school is coordinated in this fashion, or just some of it. Thus, it is likely that the
figures in the table overstate the extent to which individual students benefit from this type of
coordination, since some may be in schools that provide this coordination daily but in specific
ESL/BE classes that do not.
The more formal and concrete coordination procedures shown in the tablejoint
development of written lesson plans, formal meetings, sharing of written records, and a common
planning periodare far less common. As can be seen in the first column of the exhibit, LEP
students in both cohorts were in schools that utilized these procedures on a daily basis only two
to 18 percent of the time during the 1991 to 1993 period. A substantial share of LEP students
attended schools where these coordination procedures are used at most annually, if at all. For
Though they are derived from the same universe of public elementary schools, the results in the tables candiffer between cohorts for several reasons. Likely the most important reason is that 1st grade cohort LEP studentsattend a somewhat different mix of schools than 3rd grade cohort LEP students. This would occur, for example,if some schools move .students out of the LEP classifications used in this report at an early grade level than otherschools, causing the "LEP rapid exit" schools to be more heavily represented in the 1st grade cohort figures (whichpertain to students classified as LEP in the 1st through 3rd grades) than in the 3rd grade cohort figures (whichpertain to students classified as LEP in the 3rd through 6th grades).
115ABT ASSOCIATES INC. 3-11
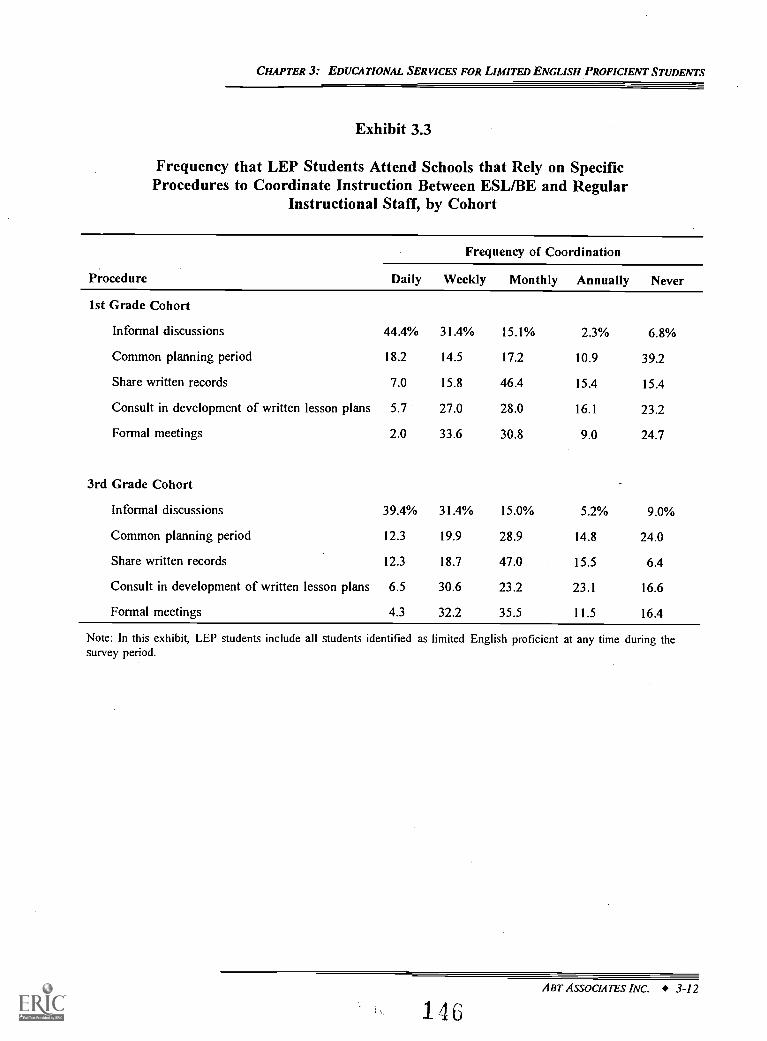
CHAPTER 3: EDUCATIONAL SERVICES FOR LIMITED ENGLISH PROFICIENT STUDENTS
Exhibit 3.3
Frequency that LEP Students Attend Schools that Rely on SpecificProcedures to Coordinate Instruction Between ESL/BE and Regular
Instructional Staff, by Cohort
Procedure
Frequency of Coordination
Daily Weekly Monthly Annually Never
1st Grade Cohort
Informal discussions 44.4% 31.4% 15.1% 2.3% 6.8%
Common planning period 18.2 14.5 17.2 10.9 39.2
Share written records 7.0 15.8 46.4 15.4 15.4
Consult in development of written lesson plans 5.7 27.0 28.0 16.1 23.2
Formal meetings 2.0 33.6 30.8 9.0 24.7
3rd Grade Cohort
Informal discussions 39.4% 31.4% 15.0% 5.2% 9.0%
Common planning period 12.3 19.9 28.9 14.8 24.0
Share written records 12.3 18.7 47.0 15.5 6.4
Consult in development of written lesson plans 6.5 30.6 23.2 23.1 16.6
Formal meetings 4.3 32.2 35.5 11.5 16.4
Note: In this exhibit, LEP students include all students identified as limited English proficient at any time during thesurvey period.
ABT ASSOCIATES INC. 3-12
146
CHAPTER 3: EDUCATIONAL SERVICES FOR LIMITED ENGLISH PROFICIENT STUDENTS
example, nearly two out of five LEP students are in schools where ESL/BE and regular classroom
teachers do not consult with each other in developing a written plan more than once a year and
nearly one-third are in schools where there is at most one formal meeting a year to coordinate
their instruction.
Do LEP students' schools have a policy of integrating LEP students with EP students
through the course of the school day? It may also be important whether students with limited
English proficiency are integrated with their English proficient peers throughout the school day.
It is important for LEP students to receive the same content EP students do, and LEP students
should not be segregated unduly. However, being in the same classroom with English proficient
students poses problems if, due to language, the child is not able to understand what is being
taught. The study did not collect specific data on how and for what reasons students were
integrated. All other things equalincluding access to special ESL/BE serviceswe would
expect LEP students to benefit from greater integration with their EP peers. This benefit could
arise in one of two ways. Integrating LEP students and EP students throughout the day may
benefit LEP students' development of English language and social interaction skills through
interaction with native speakers of English. LEP students who take academic courses with EP
students may also be more likely to be held to the same academic standards as their EP peers.
On the other hand, separating LEP students for academic courses may allow more effective access
to course content if the separation is supported through the use of LEP students' native languages.
If LEP and EP students are separated for academic courses, putting LEP and EP students together
in non-academic classes is a way to avoid segregation. This also provides opportunities for LEP
students to practice understanding and speaking skills in English through interaction with other
students who are proficient in English.
As Exhibit 3.4 shows, LEP students were in schools with a policy of integrating EP and
LEP students for non-academic subjects (art, music) or non-instructional times (lunch, homeroom)
between 95 and 97 percent of the time during the survey period. School policies to integrate LEP
and EP students for academic subjects were less common, however. Excluding language
instruction, about 77 percent of LEP students were in schools that integrated LEP and EP students
for academic subjects. This measure, however, does not reveal the degree of integration (e.g.,
1 17ABT ASSOCIATES INC. 3-13
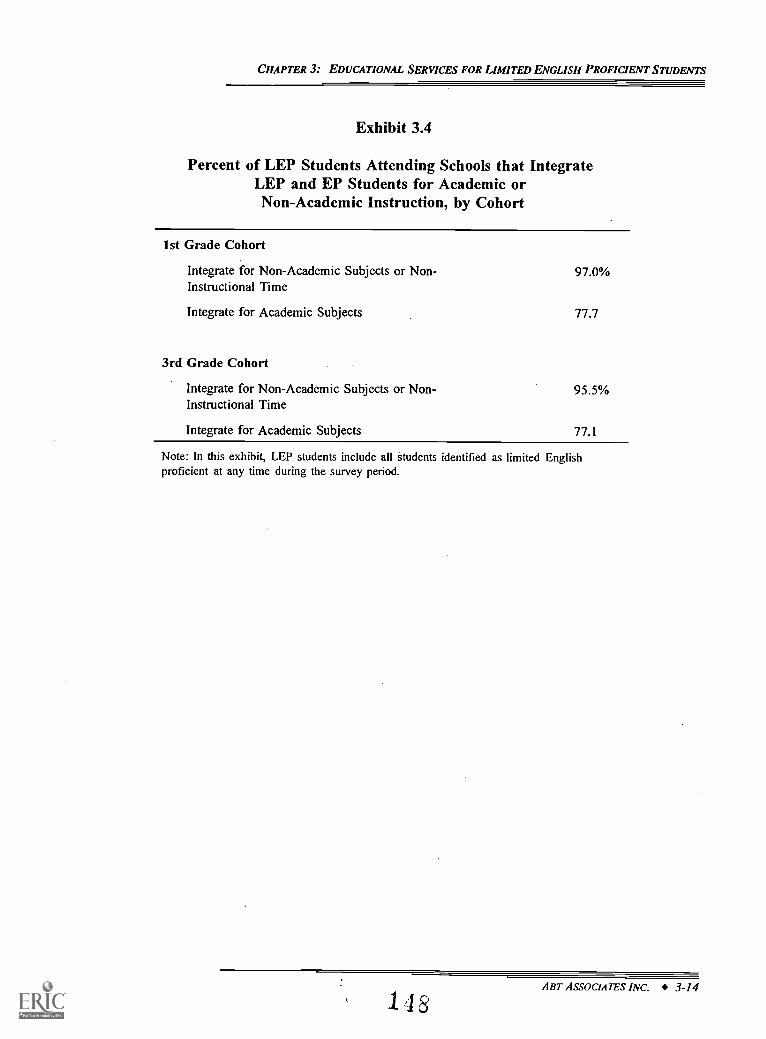
CHAPTER 3: EDUCATIONAL SERVICES FOR LIMITED ENGLISH PROFICIENT STUDENTS
Exhibit 3.4
Percent of LEP Students Attending Schools that IntegrateLEP and EP Students for Academic orNon-Academic Instruction, by Cohort
list Grade Cohort
Integrate for Non-Academic Subjects or Non-Instructional Time
Integrate for Academic Subjects
3rd Grade Cohort
Integrate for Non-Academic Subjects or Non-Instructional Time
Integrate for Academic Subjects
97.0%
77.7
95.5%
77.1
Note: In this exhibit, LEP students include all students identified as limited Englishproficient at any time during the survey period.
ABT ASSOCIATES INC. 3-14
1 4
CHAPTER 3: EDUCATIONAL SERVICES FOR LIMITED ENGLISH PROFICIENT STUDENTS
are LEP and EP students integrated for the entire instructional period for all academic subjects),
nor does it reveal how LEP students are taught in schools that do not integrate instruction.
Does the school provide special services to families of LM-LEP students? The special
services a school provides to aid the families of LEP students is an important indicator of a
school's focus on and dedication to LEP students. These special services help LEP students'
parents monitor their children's education and facilitate their involvement in the school. School
staff were asked a series of questions on the availability of special services for families of LM-
LEP students.
Based on these measures, Exhibit 3.5 shows that about 90 percent of LEP students in both
cohorts were in schools that conducted meetings in the parents' non-English language or made
translation available for parent-teacher and/or parent-school meetings. Of the special services
asked about in the Prospects survey, this is the most common, which is not surprising because
it the only one of our service indicators that is legally required in some programs for limited
English proficient students. While the widespread availability of this service at schools is a very
promising indicator, it does not mean that meetings or translation services were available for
every non-English language spoken by parents of LEP students, or that those services were
available at every meeting.
The table also shows that over half of all LEP students were in schools that made special
home visits to families of LM-LEP students. We have no measure of how many LEP students
received such visits, but the visit's existence at a student's school is a favorable signal of the
school's overall support of LEP students. It is also encouraging that nearly one-quarter of LEP
students attended schools that reported assigning a specific outreach worker to serve as an
ombudsperson for the problems and concerns of LM-LEP families.
Do parents of LEP students believe they and their children are respected by school
staff? Respect for LEP students and their parents may signify a number of things about the
school environment that could have an important influence on the educational experience of LEP
students. The level of respect that parents feel school staff have for them may indicate the extent
to which parents believe their concerns and questions are taken seriously by school staff.
Similarly, the level of respect parents feel the school staff has for their children could indicate
149ABT ASSOCIATES INC. 3-15
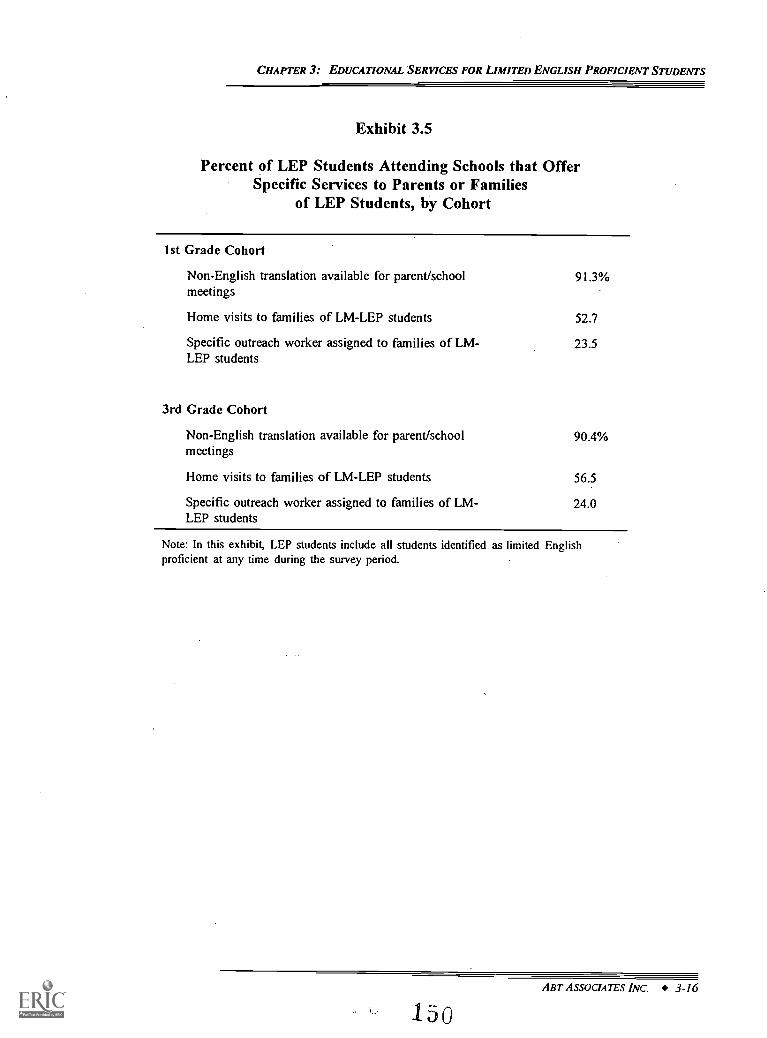
CHAPTER 3: EDUCATIONAL SERVICES FOR LIMITED ENGLISH PROFICIENT STUDENTS
Exhibit 3.5
Percent of LEP Students Attending Schools that OfferSpecific Services to Parents or Families
of LEP Students, by Cohort
1st Grade Cohort
Non-English translation available for parent/school 91.3%meetings
Home visits to families of LM-LEP students 52.7
Specific outreach worker assigned to families of LM- 23.5LEP students
3rd Grade Cohort
Non-English translation available for parent/school 90.4%meetings
Home visits to families of LM-LEP students 56.5
Specific outreach worker assigned to families of LM- 24.0LEP students
Note: In this exhibit, LEP students include all students identified as limited Englishproficient at any time during the survey period.
ABT ASSOCIATES INC. 3-16
150
CHAPTER 3: EDUCATIONAL SERVICES FOR LIMITED ENGLISH PROFICIENT STUDENTS
whether parents think the needs of their child are being recognized and whether a sincere effort
is being made to meet their child's needs.
To analyze these factors, we examined LEP parents' level of agreement to the statements:
"I am respected by the teachers and principal" and "My child is respected by the teachers and
principal."' We also examined the responses of the parents of English proficient students for
comparison with the parents of LEP students.
As can be seen in Exhibit 3.6, almost all studentsat least 96 percentattended schools
where parents strongly agreed or agreed that they and their children were respected by school
staff. Parents of LEP students are just as likely as parents of EP students to say that school staff
respect them and their children." This result suggests that respect for students and their parents
is not perceived by either parents of EP or LEP students as a particular problem, although the
fact that virtually every response was positive suggests the possibility of some degree of positive
response bias.
Summary. Do the schools that LEP students attend run integrated, focused LEP
programs well supported by and coordinated within the school structure as a whole? The
evidence from the Prospects study presented in this section generally supports this proposition,
though it must be qualified in an important respect.
Several schoolwide measures of support for LEP students show initially encouraging
evidence: the availability of ESL/BE instruction, principals' language background, coordination
and integration of LEP and EP instruction, and support and respect for the families of LEP
students. Sixty to 100 percent of LEP students attend schools with favorable indicators in each
of these areas. These figures represent an important beginning for a public school system that
seeks to support and nurture all students with limited English proficiency.
But these findings do not of themselves demonstrate broad support for the needs of
individual LEP students, or even the average LEP student. As noted in our discussion of the
13 The parent responses reported here are from the Parent Questionnaire, which was not administered in the lastyear of the study, 1994. Unlike the data used in the rest of the analyses, missing parent responses were notimputed; hence about 13 percent of all the students' parents are not included in this particular analysis.
14 Cultural differences between the parents of LEP students and parents of EP students may also lead to differentlevels of perceived respect for identical treatment by school staff. Some parents of LEP students are from culturesthat may be more respectful of authority than is typical in the United States.
ABT ASSOCIATES INC. 3-17
151
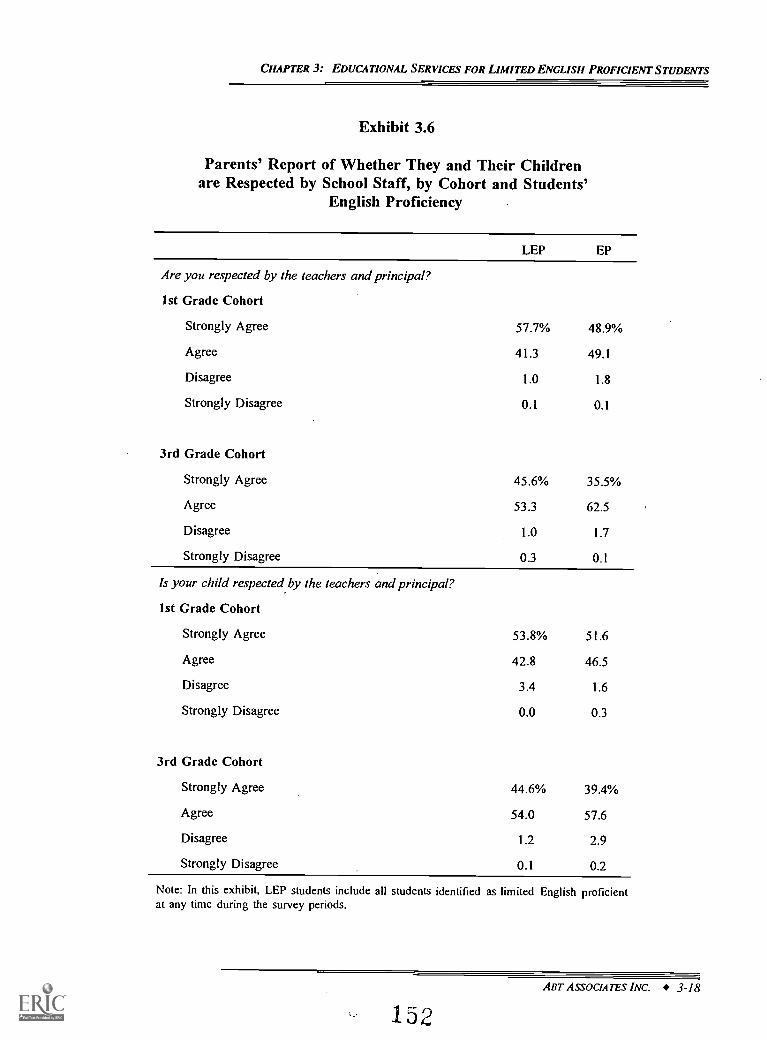
CHAPTER 3: EDUCATIONAL SERVICES FOR LIMITED ENGLISH PROFICIENT STUDENTS
Exhibit 3.6
Parents' Report of Whether They and Their Childrenare Respected by School Staff, by Cohort and Students'
English Proficiency
LEP EP
Are you respected by the teachers and principal?
1st Grade Cohort
Strongly Agree 57.7% 48.9%
Agree 41.3 49.1
Disagree 1.0 1.8
Strongly Disagree 0.1 0.1
3rd Grade Cohort
Strongly Agree 45.6% 35.5%
Agree 53.3 62.5
Disagree 1.0 1.7
Strongly Disagree 0.3 0.1
Is your child respected by the teachers and principal?
1st Grade Cohort
Strongly Agree 53.8% 51.6
Agree 42.8 46.5
Disagree 3.4 1.6
Strongly Disagree 0.0 0.3
3rd Grade Cohort
Strongly Agree 44.6% 39.4%
Agree 54.0 57.6
Disagree 1.2 2.9
Strongly Disagree 0.1 0.2
Note: In this exhibit, LEP students include all students identified as limited English proficientat any time during the survey periods.
ABT ASSOCIATES INC. 3-18
152
CHAPTER 3: EDUCATIONAL SERVICES FOR LIMITED ENGLISH PROFICIENT STUDENTS
results, we cannot tell from the Prospects data how many of the LEP students in a particular
school benefit from favorable practices and policies known to exist somewhere in the school.
Thus, our analysis of school enviromnent paints a somewhat incomplete picture: schools are
supportive to a degreeperhaps a large degreebut we do not know how many of their LEP
students benefit from this support. Extension of the analysis to the in-school experience of
individual LEP students in subsequent sections of the chapter will address this limitation of the
generally encouraging schoolwide indicators presented here.
Do LEP students regular classroom teachers and aides have the appropriate trainingto meet the needs of LEP students?
In this section, we focus on two measures of teacher training that indicate preparedness
to meet the needs of students with limited English proficiency: ESL/BE certifications earned, and
proficiency in languages other than English spoken by students in their class.' The results
reported in this section are for LEP students' regular classroom math and reading/English/
language arts teachers for all years covered by the Prospects study.
Although we only report results for LEP students' primary math and
reading/English/language arts teachers (who can be funded by standardor supplementary sources),
we examine the available data for additional Chapter 1-funded teachers and aides and additional
ESL/BE teachers and aides funded by programs other than Chapter 1. Results for these groups
are not reported here, because data for these instructors have high unusually high missing
ratesbetween 20 and 60 percentthat make results difficult to interpret due to potential missing
data bias and the inherently smaller sample sizes involved. Nevertheless, to try to paint the
complete picture of LEP students' teacher qualifications, we do include qualitative reports of
these results for instructors with non-missing data.
Are LEP students' regular classroom teachers certified in ESL and/or BE? A key
issue is whether or not the teachers of LEP students have specialized training to provide services
IS General qualification of instructors are covered in a later section, where we compare LEP and EP studentsfrom high-poverty schools.
ABT ASSOCIATES' INC. 3-19
133
CHAPTER 3: EDUCATIONAL SERVICES FOR LIMITED ENGLISH PROFICIENT STUDENTS
to students who are not fully proficient in the English language. These skills could substantially
enhance educational outcomes for LEP students. As Han et al. (1997, p.16) note:
There is almost universal agreement that teacher training and preparation in thesubject area in which he or she is assigned to teach are among the most importantcharacteristics of a qualified teacher.
Certification in English-as-a-second language and bilingual education are two indicators of
specialized training, and hence two indicators of the quality of LEP students' teachers. One
limitation of these indicators is that some states do not offer certification in ESL/BE, so
specialized training acquired by teachers in these states will not be measured with these
indicators.'
Exhibit 3.7 shows that between one-third and one-half of LEP students' regular
reading/English/language arts teachers in the elementary school grades are certified in ESL and/or
BE. Of the teachers certified, there is roughly an even split between teachers certified in ESL
and BE, ESL only, and BE only. In the later elementary school grades, teachers are more likely
to be certified in ESL only. For example, in 6th grade, 27 percent of LEP students' regular
reading/English/language arts teachers are certified in ESL only, while three percent are certified
in ESL and BE, and another six percent are certified in.BE only.'7
Exhibit 3.8 presents ESL/BE certification information for regular math teachers. A
smaller percentage of LEP students' math teachers than reading/English/language arts teachers
are certified in ESL or BE: 66 percent of LEP students' 1st grade math teachers are certified in
neither ESL nor BE, and by 6th grade 90 percent of the regular math classes are headed by a
teacher who is certified in neither ESL nor BE. For math teachers, bilingual education is the
more common area of training, with over one-fourth of students' 1st grade teachers certified in
BE (including teachers certified in both ESL and BE), a rate that generally decreases as the grade
level increases to a low of eight percent for teachers of 6th grade students.
16 Whitten et al. (1995, pp. 9-11) lists states by whether they offer certification in bilingual education, ESL,or related areas.
" The finding that teachers of LEP students in later elementary school grades are more likely to be certifiedin ESL only is consistent with patterns reported by Fleischman and Hopstock (1993, p.46) across elementary andmiddle schools.
AsT Assocums INC. 3-20
154
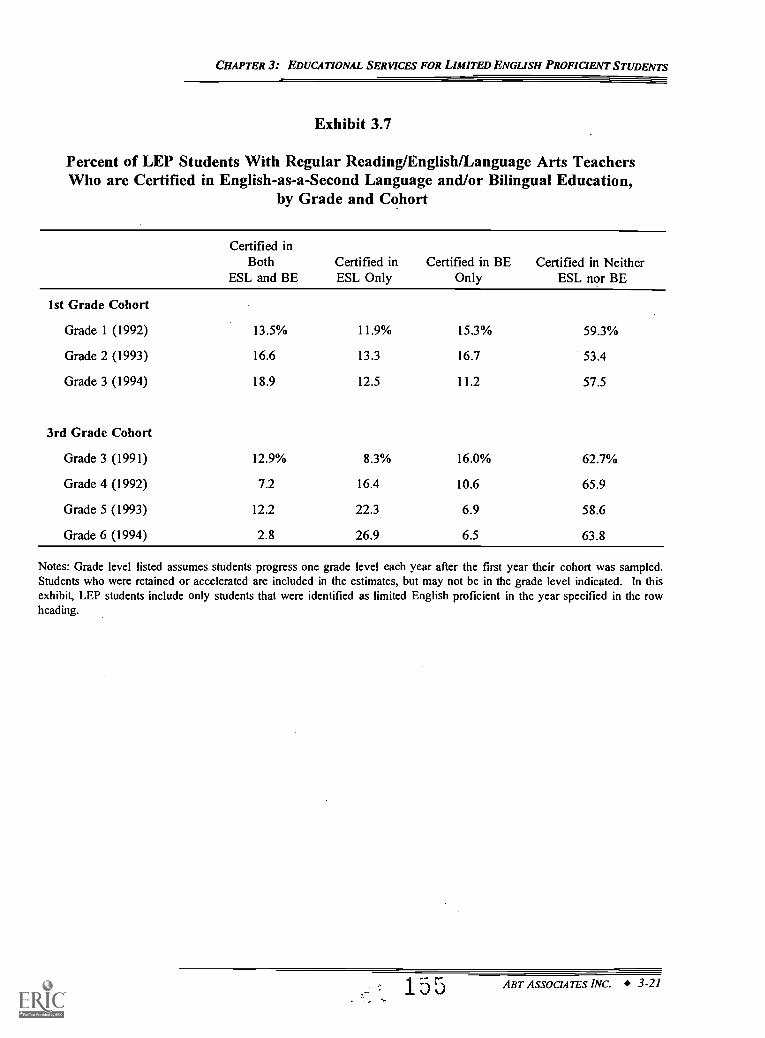
CHAPTER 3: EDUCATIONAL SERVICES FOR LIMITED ENGLISH PROFICIENT STUDENTS
Exhibit 3.7
Percent of LEP Students With Regular Reading/English/Language Arts TeachersWho are Certified in English-as-a-Second Language and/or Bilingual Education,
by Grade and Cohort
Certified inBoth
ESL and BECertified inESL Only
Certified in BEOnly
Certified in NeitherESL nor BE
1st Grade Cohort
Grade 1 (1992) 13.5% 11.9% 15.3% 59.3%
Grade 2 (1993) 16.6 13.3 16.7 53.4
Grade 3 (1994) 18.9 12.5 11.2 57.5
3rd Grade Cohort
Grade 3 (1991) 12.9% 8.3% 16.0% 62.7%
Grade 4 (1992) 7.2 16.4 10.6 65.9
Grade 5 (1993) 12.2 22.3 6.9 58.6
Grade 6 (1994) 2.8 26.9 6.5 63.8
Notes: Grade level listed assumes students progress one grade level each year after the first year their cohort was sampled.Students who were retained or accelerated are included in the estimates, but may not be in the grade level indicated. In thisexhibit, LEP students include only students that were identified as limited English proficient in the year specified in the rowheading.
155 ABT ASSOCIATES INC. 3-21
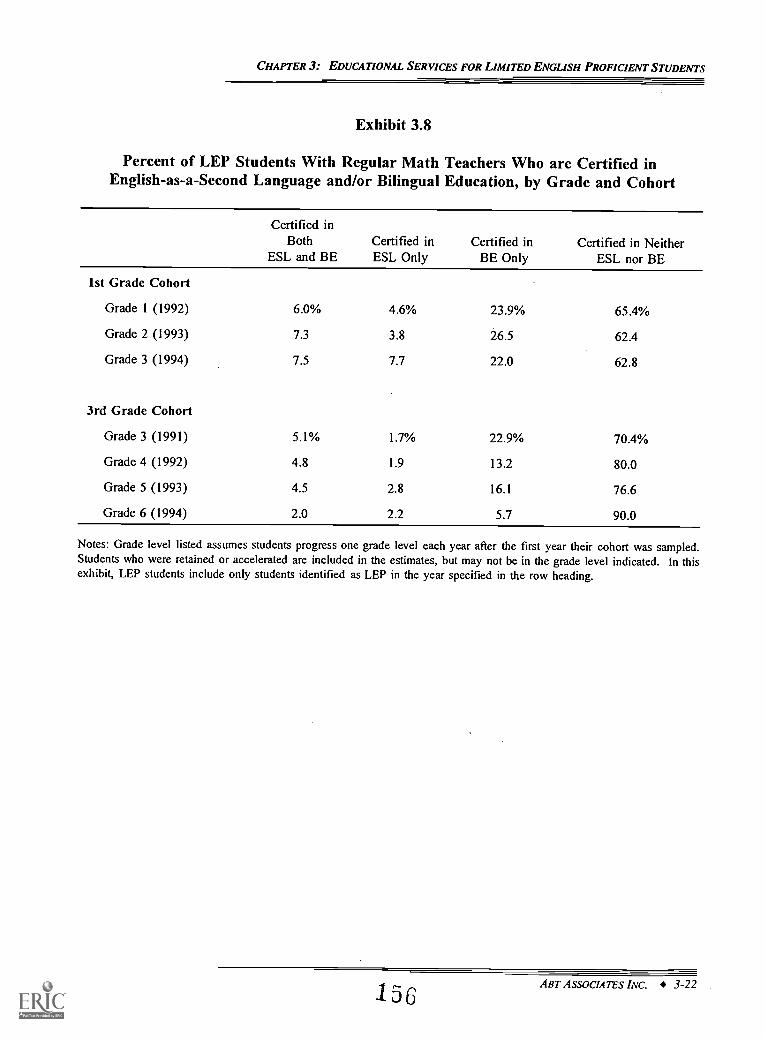
CHAPTER 3: EDUCATIONAL SERVICES FOR LIMITED ENGLISH PROFICIENT STUDENTS
Exhibit 3.8
Percent of LEP Students With Regular Math Teachers Who are Certified inEnglish-as-a-Second Language and/or Bilingual Education, by Grade and Cohort
Certified inBoth
ESL and BECertified inESL Only
Certified inBE Only
Certified in NeitherESL nor BE
1st Grade Cohort
Grade 1 (1992) 6.0% 4.6% 23.9% 65.4%
Grade 2 (1993) 7.3 3.8 26.5 62.4
Grade 3 (1994) 7.5 7.7 22.0 62.8
3rd Grade Cohort
Grade 3 (1991) 5.1% 1.7% 22.9% 70.4%
Grade 4 (1992) 4.8 1.9 13.2 80.0
Grade 5 (1993) 4.5 2.8 16.1 76.6
Grade 6 (1994) 2.0 2.2 5.7 90.0
Notes: Grade level listed assumes students progress one grade level each year after the first year their cohort was sampled.Students who were retained or accelerated are included in the estimates, but may not be in the grade level indicated. In thisexhibit, LEP students include only students identified as LEP in the year specified in the row heading.
156ABT ASSOCIATES INC. 3-22
CHAPTER 3: EDUCATIONAL SERVICES FOR LIMITED ENGUSH PROFICIENT STUDENTS.
Additional analyses of special Chapter 1 and ESL/BE instructors show similar patterns of
certification to those reported here (not shown in exhibits). This suggests that the results shown
here for regular classroom teachers are indicative of all LEP students' instructors for these
subj ects.
Fleischman and Hopstock (1993, page 46) report that 16 percent of elementary school
teachers of LEP students during the 1991-92 academic year were certified in bilingual education
and 10 percent were certified in ESL. These estimates are smaller than our estimates because
they have the teacher as the unit of observation, whereas our estimates have the student as the
unit of observation. Therefore a teacher with 20 LEP students in his or her classY counts
approximately 20 times as much in our estimates as a teacher with one LEP student, whereas both
count the same amount in Fleischman and Hopstock's estimates. The differences between the
numbers imply that LEP students' teachers are more likely to be certified in ESL or bilingual
education when they have more LEP students in their class. Consistent with this implication, Han
et al. (1997, page 18) found that 20 percent of teachers with classes composed of more than
50 percent LEP students had earned an academic degree in ESL or bilingual education (a more
stringent indicator of specialized training than certification) compared to one percent of teachers
with fewer than 10 percent LEP students."
One reason that so many LEP students have teachers without special training is the
difficulty in finding teachers that have these qualifications. Henke et al. (1996) found that one-
fourth of public schools reported they had vacancies for an ESL or bilingual education position
in 1994. Among the schools with a vacancy, 26 percent reported they would find it difficult or
impossible to fill the vacancy.
Are LEP students' regular classroom teachers and aides proficient in the students'
native language? Teachers' proficiency in the native language of the students in their classroom
is another indicator of the qualifications and specialized training that are beneficial to students
with limited English proficiency. A teacher who is proficient in the native language of a LEP
'8 Han el al. (1997) also report a broader measure of specialized training of teachers, whether teachers havereceived any training in teaching LEP students. They found that one-third of elementary school teachers with LEPstudents in their class reported they had received some specialized training and that nearly 87 percent of teacherswith more than 50 percent LEP students in the class had reported receiving specialized training.
157 Aar ASSOCIATES INC. 3-23
CHAPTER 3: EDUCATIONAL SERVICES FOR LIMITED ENGUSH PROFICIENT STUDENTS
student may have an easier time communicating with the student, be more aware of the linguistic
differences between the student's native language and English, and be more sensitive to the
student's cultural background. Furthermore, proficiency in the student's native language may also
facilitate meetings with the student's parents, allowing parents to be more actively involved in
their child's education.
The proportion of LEP students' reading/English/language arts teachersand aides reporting
proficiency in the predominant LM-LEP language of their class is shown in Exhibit 3.9, while
math teachers' and aides' reported proficiency is show in Exhibit 3.10. Note that language
proficiency is self-reported and that teachers are only asked about their proficiency in the
predominant LM-LEP language of their class, so we do not know if they are proficient in the first
language of LEP students who do not speak the predominant LM-LEP language.
The first columns of Exhibits 3.9 and 3.10 show that between 32 and 46 percent of the
LEP students' reading/English/language arts and math teachers are proficient in the predominant
LM-LEP language of the class in 1st through 5th grade. However, the proportion of LEP
students' 6th grade teachers that report proficiency declines to 20 percent for
reading/English/language arts classes and 16 percent for math.
As can be seen in the second column of the exhibits, classroom aides are far more likely
to be proficient in the predominant LM-LEP language than teachers. Of the LEP students in
classes with classroom aides, between 64 and 89 percent have math and reading/English/language
arts aides who are proficient in the predominant native language of LEP students in their class.
This large contrast between aides and teachers suggests that one of the roles of the aides in these
classes is to facilitate communication, and hence learning, with LEP students.'
The proportion of special Chapter 1 and ESL/BE instructors who are proficient in the
predominant non-English language of LEP students in their classes (not shown in exhibits) are
more similar to the patterns of classroom aides than of teachers. This suggests that some LEP
students have sources for non-English instruction beyond what can be inferred from the analysis
of their regular classroom teachers and aides, and thatdespite having similar certification levels
19 Fleischman and Hopstock (1993, P. 40) also suggest that aides in LEP students' classrooms are more likelythan teachers to be proficient in students' native languages.
ABT ASSOCL4TES INC. 3-24
1 5 S
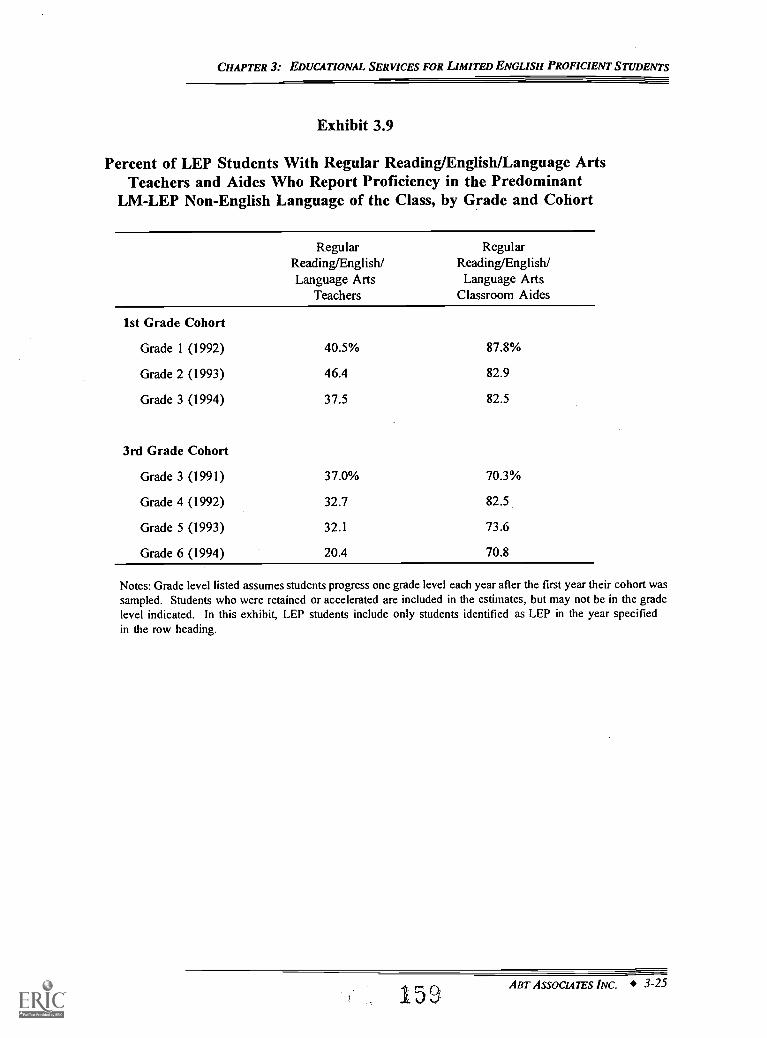
CHAPTER 3: EDUCATIONAL SERVICES FOR LIMITED ENGLISH PROFICIENT STUDENTS
Exhibit 3.9
Percent of LEP Students With Regular Reading/English/Language ArtsTeachers and Aides Who Report Proficiency in the Predominant
LM-LEP Non-English Language of the Class, by Grade and Cohort
RegularReading/English/Language Arts
Teachers
RegularReading/English/Language Arts
Classroom Aides
1st Grade Cohort
Grade 1 (1992) 40.5% 87.8%
Grade 2 (1993) 46.4 82.9
Grade 3 (1994) 37.5 82.5
3rd Grade Cohort
Grade 3 (1991) 37.0% 70.3%
Grade 4 (1992) 32.7 82.5
Grade 5 (1993) 32.1 73.6
Grade 6 (1994) 20.4 70.8
Notes: Grade level listed assumes sttidents progress one grade level each year after the first year their cohort wassampled. Students who were retained or accelerated are included in the estimates, but may not be in the gradelevel indicated. In this exhibit, LEP students include only students identified as LEP in the year specifiedin the row heading.
159ABT ASSOCIATES INC. 3-25
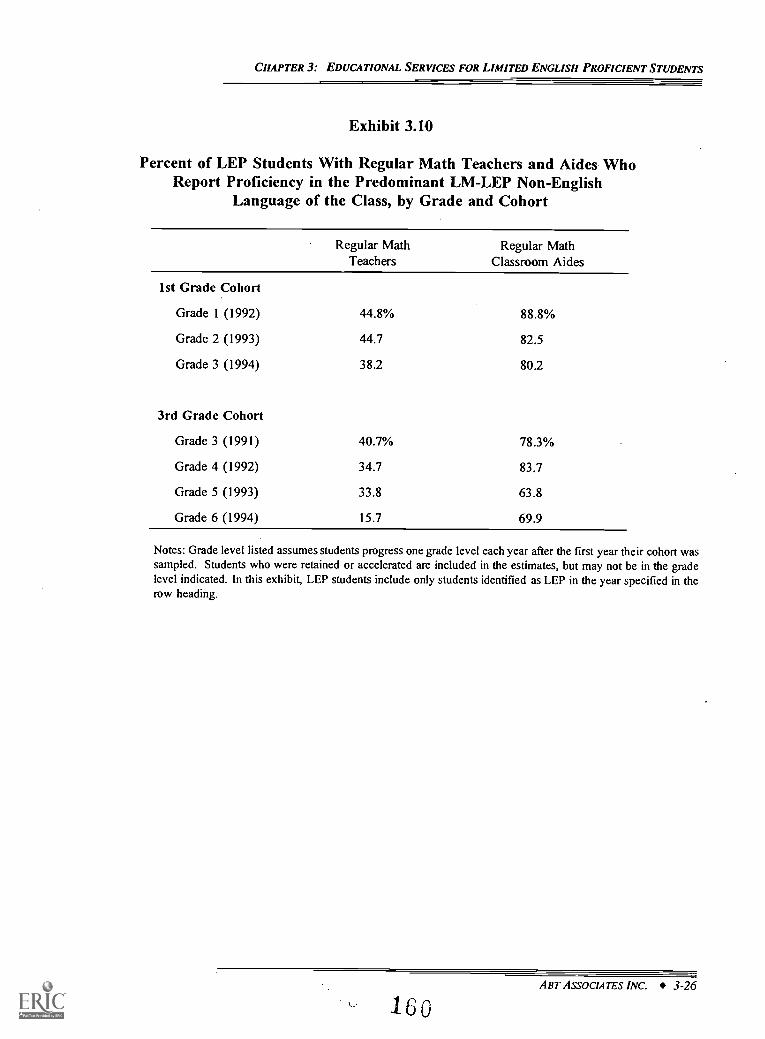
CHAPTER 3: EDUCATIONAL SERVICES FOR LIMITED ENGLISH PROFICIENT STUDENTS
Exhibit 3.10
Percent of LEP Students With Regular Math Teachers and Aides WhoReport Proficiency in the Predominant LM-LEP Non-English
Language of the Class, by Grade and Cohort
Regular MathTeachers
Regular MathClassroom Aides
1st Grade Cohort
Grade 1 (1992) 44.8% 88.8%
Grade 2 (1993) 44.7 82.5
Grade 3 (1994) 38.2 80.2
3rd Grade Cohort
Grade 3 (1991) 40.7% 78.3%
Grade 4 (1992) 34.7 83.7
Grade 5 (1993) 33.8 63.8
Grade 6 (1994) 15.7 69.9
Notes: Grade level listed assumes students progress one grade level each year after the first year their cohort wassampled. Students who were retained or accelerated are included in the estimates, but may not be in the gradelevel indicated. In this exhibit, LEP students include only students identified as LEP in the year specified in therow heading.
ABT ASSOCIATES INC. 3-26
1 6 0
CHAPTER 3: EDUCATIONAL SERVICES FOR LIMITED ENGLISH PROFICIENT STUDENTS
in ESL and BE methodsadditional Chapter 1 and ESL/BE teachers are more qualified in the
native languages of many LEP students than are regular classroom teachers.
Are the instructional services provided in the classroom appropriate to the educationalneeds of LEP students?
As our most direct measure of LEP-focused instructional practice, we start this analysis
with indicators of LEP student participation in ESL/bilingual instruction in each elementary
school year. Wherever possible, we identify the source of funding for this instruction. The next
set of analyses compare teacher ratings of LEP students' English proficiency and subsequent
provision of ESL/BE services. Following up on these analyses, we examine the proportion of
instruction that is provided in a non-English language as part of a bilingual educational format.
Finally, we investigate LEP student receipt of supplementary instructional services in math and
reading/English/language arts for all grades and years covered in the Prospects study. Here
again, we distinguish between Chapter 1-funded instruction and other sources of funding.
In the final part of this section, we compare the specific needs of LEP students, as
indicated by their primary teacher's rating of their English and native language proficiency, to
teachers' reports of the skills emphasized in classroom instruction during the subsequent year, for
those students moving from 3rd to 4th grade between the 1991-92 and 1992-93 school years.
Do LEP students receive ESL/bilingual instructional services? Although there is
controversy in the educational literature about the right mix of English, native language, and ESL
instruction to provide to students with limited English proficiency, many researchers and
practitioners agree that LEP students need some ESL and/or bilingual instruction to progress in
step with their native English-speaking peers.' Instructional models range from "immersion"
programs conducted completely in English to "two-way" or "developmental" programs which
seek to build full proficiency of all students in two languages (e.g., English and Chinese). Other
instructional models include ESL programs that provide special instructional approaches and
supports to learn English, "early exit" bilingual programs that emphasize a quick exit into classes
20 See August and Hakuta (1997), Crawford (1995), Hakuta (1986, 1990), Krashen (1991), and Lam (1992) fora summary of the research findings and debate over ESL, bilingual education, and English-immersion programs.
ABT ASSOCIATES INC. 3-27
161
CHAPTER 3: EDUCATIONAL SERVICES FOR LIMITED ENGLISH PROFICIENT STUDENTS
conducted entirely in English, and "late exit" bilingual programs that provide more first language
support before placing the student into classes conducted entirely in English.
In practice, there are few sites that implement any of these models in pure form. Courses
which are formally developmental bilingual programs often include large instructional components
in English. Conversely, classrooms which are formally "immersion" or ESL frequently include
substantial modifications of instruction and language use to support language learning. Moreover,
the research indicates that language learners typically develop understanding and speaking
proficiency in a new language faster than reading and writing ability in the new languageandthat development of full proficiency in all these areas takes in excess of five years.'
Exhibit 3.11 shows the proportion of LEP students in each year and grade that are
reported to receive either ESL or bilingual instruction. These services are disaggregated by
funding source, where the source of funding is identifiable in the data.'
As can be seen in the last column of the exhibit, all but 12 to 25 percent of the LEP
students in any elementary grade level receive ESL or BE services. This is consistent with other
findings in the literature. Macias (1996, p. 2) reports that 24 percent of K-12 LEP students in
the 1994-95 academic year are not served by a special program designed to meet their needs.
Han et. al's (1997, p. 15) findings indicate that 23 percent of elementary school students did not
receive ESL instruction and 55 percent are not taught a subject in their native language in the
1993-94 academic year, but the data as reported by Han do not permit estimation of what percent
of students receive neither of these services. Using a definition of special services for LEP
students broader than just ESL or bilingual education programs (e.g., including tutoring and a
21 See August and Hakuta (1997) and Ramirez et al. (1991) for more discussion of these topics.
A student is identified as a Chapter 1 participant in ESL/bilingual services if school records indicate that heor she received Chapter 1 ESL/BE instruction. A student is identified as receiving non-Chapter 1 fundedESL/bilingual instruction if the school records indicated that he or she received non-Chapter 1 funded ESL/BEinstruction or had an ESL/BE teacher or aide (by definition, not funded by Chapter 1). The "unknown fundingsource" category includes all the students identified as receiving ESL/BE services by their primary teacher due totheir limited English Proficiency, but for whom school records do not indicate the source of funding. SchoolwideChapter 1 is indicated if the student is identified as receiving ESL/BE services from any of the above sources andthe student is also in a school participating in the Chapter 1 schoolwide program.
ABT ASSOCIATES INC. 3-28
162
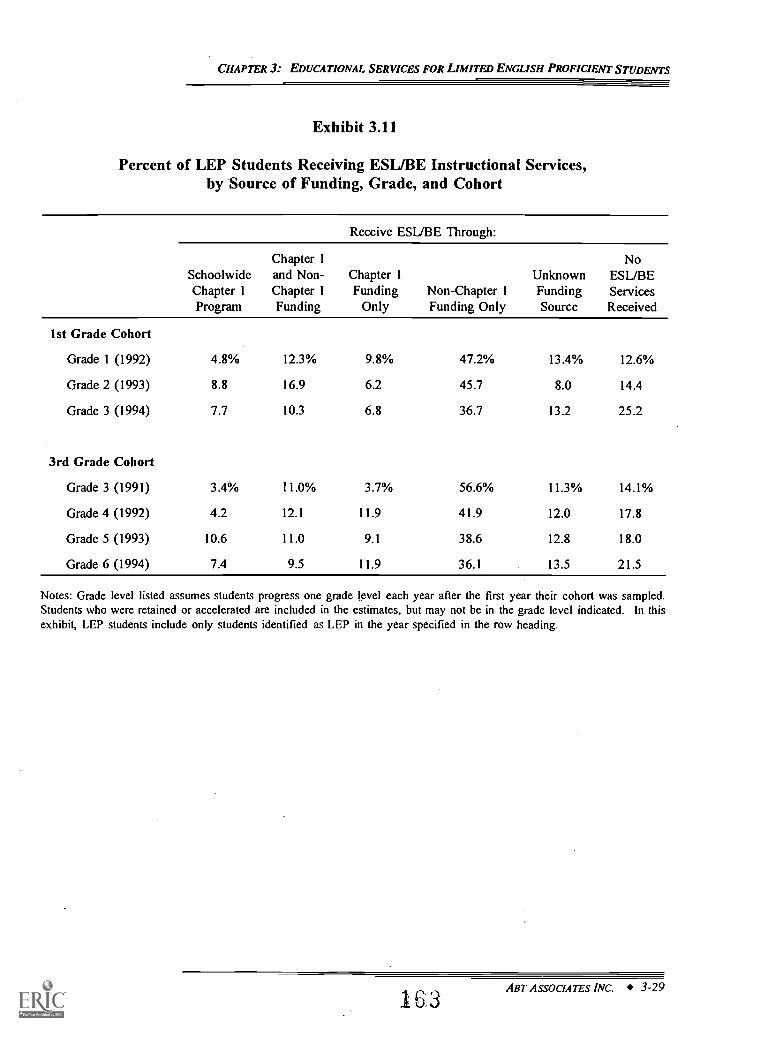
CHAPTER 3: EDUCATIONAL SERVICES FOR LIMITED ENGLISH PROFICIENT STUDENTS
Exhibit 3.11
Percent of LEP Students Receiving ESL/BE Instructional Services,by Source of Funding, Grade, and Cohort
Receive ESL/BE Through:
SchoolwideChapter 1Program
Chapter 1and Non-Chapter 1Funding
Chapter 1Funding
OnlyNon-Chapter 1Funding Only
UnknownFundingSource
NoESL/BEServicesReceived
1st Grade Cohort
Grade 1 (1992) 4.8% 12.3% 9.8% 47.2% 13.4% 12.6%
Grade 2 (1993) 8.8 16.9 6.2 45.7 8.0 14.4
Grade 3 (1994) 7.7 10.3 6.8 36.7 13.2 25.2
3rd Grade Cohort
Grade 3 (1991) 3.4% 11.0% 3.7% 56.6% 11.3% 14.1%
Grade 4 (1992) 4.2 12.1 11.9 41.9 12.0 17.8
Grade 5 (1993) 10.6 11.0 9.1 38.6 12.8 18.0
Grade 6 (1994) 7.4 9.5 11.9 36.1 13.5 21.5
Notes: Grade level listed assumes students progress one grade level each year after the first year their cohort was sampled.Students who were retained or accelerated are included in the estimates, but may not be in the grade level indicated. In thisexhibit, LEP students include only students identified as LEP in the year specified in the row heading.
163ABT ASSOCIATES INC. 3-29
CHAPTER 3: EDUCATIONAL SERVICES FOR LIMITED ENGLISH PROFICIENT STUDENTS
special aide for LEP students), Fleischman and Hopstock (1993, p. 24) found that only 3 to
12 percent of LEP students did not receive instructional services specific to LEP students?'
Exhibit 3.11 shows the Chapter 1 program is a substantial funding source for ESL/BE
services. Depending on the year and cohort, between one-fifth and one-third of the students
receive Chapter 1 funded ESL/bilingual instruction. Nevertheless, in contrast to supplemental
services for math and reading/English/language arts (discussed below), the primary source of
funding for ESL/bilingual instruction is from sources other than Chapter 1. On average, nearly
three times as many LEP students receive ESL/BE instruction funded by non-Chapter 1 sources
as receive such services funded by Chapter 1. (ESL/BE services funded by both sources are
included in both counts for this calculation.) Between 47 and 68 percent of LEP students receive
ESL/bilingual instruction funded by non-Chapter 1 sources, whereas between 15 and 24 percent
receive these services funded by the Chapter 1 program, depending on the year and grade. An
additional 3 to 11 percent of LEP students receive ESL/bilingual instruction at a school operating
a Chapter 1 schoolwide program. Overall, the share of non-served students appears to be rising
over the years of the study (1991 to 1994) as non-Chapter 1 funded ESL/BE services declines.'
Although specific non-Chapter 1 funding sources cannot be identified in the Prospects data,
Fleischman and Hopstock's (1993, p. 22) findings suggest state funds for LEP services are the
primary source; however, in our calculations, other federal (e.g., Title VII) and local sources of
funding are also included in this category.
Are teacher ratings of a LEP students' English proficiency related to the provision
of ESL/bilingual instructional services in the subsequent year? The level of English
proficiency of students with limited English proficiency ranges from those with little or no
knowledge of the English language to students who are almost as proficient as students for whom
English is their native language. To distinguish the different levels of LEP students' proficiency,
teachers were asked to separately assess their LEP students' understanding, speaking, reading, and
writing proficiency in English. For each of these skills, teachers were asked to categorize each
23 The range for Fleischman and Hopstock's results is due to nine percent of the students having instructionalservices categorized together as either "completely unknown" or "Special services for LEPs: Type unknown."
This pattern could, in part, be an artifact of our data. The ESL/BE questionnaire was not administered inthe Spring of 1994, hence one of our possible indicators of receipt of ESL/BE services is not available.
ABT ASSOCIATES INC. 3-30
164
CHAPTER 3: EDUCATIONAL SERVICES FOR LIMITED ENGLISH PROFICIENT STUDENTS
student's English proficiency into one of five broad categories: excellent, good, fair, poor, or
none. In other words, teachers were not asked to make precise estimates of their students'
proficiency level. It is also a subjective measure and thus the implicit scale may vary across
teachers (e.g., one teacher may rate a student as "excellent" while another teacher would have
ranked the same student's proficiency as "good"). In our examination of this measure (see
Appendix I), we found it to be a reliable measure of proficiency. For example, students'
proficiency ratings were highly correlated with their ratings in other years (assessed by different
teachers), the parent's English proficiency and use of English in the home, and with objective
measures such as reading test scores.25 Nevertheless, these categories contain a wide range of
proficiency levels, both because there are only a few categories and because of some inter-teacher
variation.
In sum, all the measures we examined showed the expected relationship with teacher
ratings of English proficiency. The correlation with reading test scores is weak, but the
association with other variables is strong. Based in part on this evidence we believe teacher
ratings to be more than adequate for addressing questions in this report such as, "Are students
with lower levels of English proficiency more likely to receive language-related services?" and
"Do students who exit LEP status have higher levels of English proficiency than students who
remain LEP?" However, because of the possibility of bias due to measurement error, we are less
confident that teacher judgements provide accurate estimates of the percentage of LEP students
at different levels of English proficiency.
We used these proficiency measures to address the question of whether the provision of
ESL/bilingual instructional services is related to need. If so, we would expect that the lower the
level of English proficiency, the more likely are students to receive language-related services.
Exhibit 3.12 confirms this expectation. The exhibit compares teachers' assessments of LEP
students' English language understanding and writing proficiency at the end of the school year
to whether students receive ESL/Bilingual instructional services in the subsequent year. The
We did not use reading test scores as our measure of English proficiency, because they also measurecognitive ability and because, in each year, a large fraction of LEP students did not take the English-language testas part of the Prospects study.
Am' ASSOCIATES INC. 3-31
165
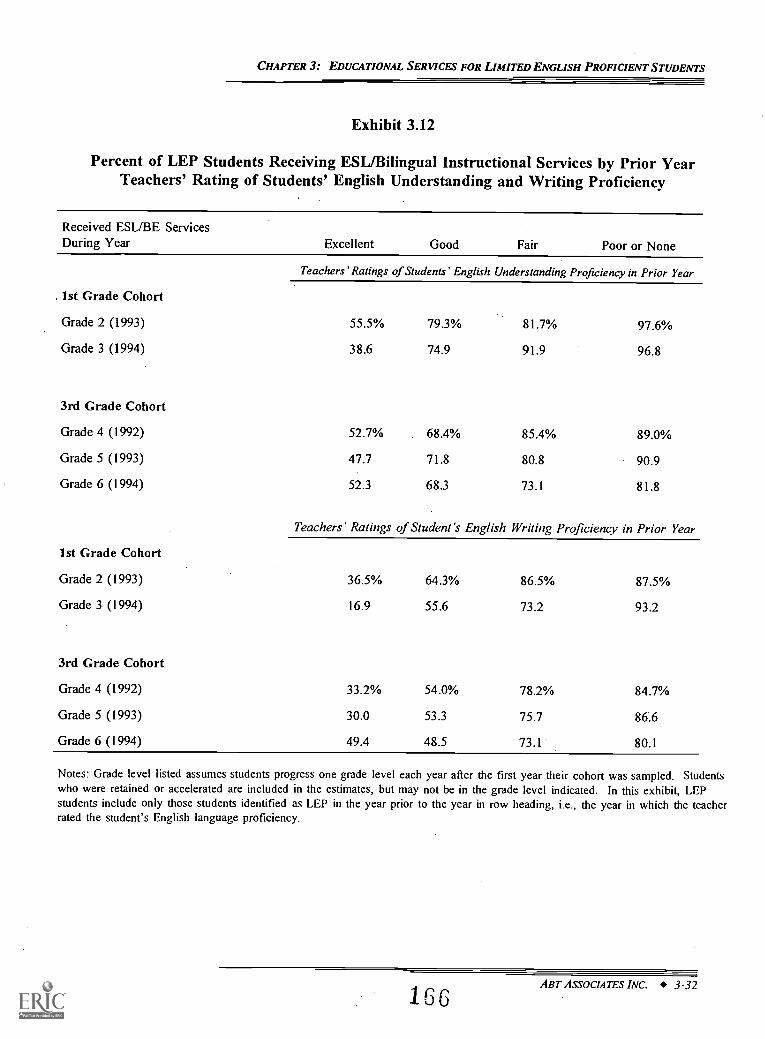
CHAPTER 3: EDUCATIONAL SERVICES FOR LIMITED ENGLISH PROFICIENT STUDENTS
Exhibit 3.12
Percent of LEP Students Receiving ESL/Bilingual Instructional Services by Prior YearTeachers' Rating of Students' English Understanding and Writing Proficiency
Received ESL/BE ServicesDuring Year Excellent Good Fair Poor or None
. 1st Grade Cohort
Teachers Ratings of Students' English Understanding Proficiency in Prior Year
Grade 2 (1993) 55.5% 79.3% 81.7% 97.6%
Grade 3 (1994) 38.6 74.9 91.9 96.8
3rd Grade Cohort
Grade 4 (1992) 52.7% 68.4% 85.4% 89.0%
Grade 5 (1993) 47.7 71.8 80.8 90.9
Grade 6 (1994) 52.3 68.3 73.1 81.8
Teachers' Ratings of Student's English Writing Proficiency in Prior Year
1st Grade Cohort
Grade 2 (1993) 36.5% 64.3% 86.5% 87.5%
Grade 3 (1994) 16.9 55.6 73.2 93.2
3rd Grade Cohort
Grade 4 (1992) 33.2% 54.0% 78.2% 84.7%
Grade 5 (1993) 30.0 53.3 75.7 86.6
Grade 6 (1994) 49.4 48.5 73.1 80.1
Notes: Grade level listed assumes students progress one grade level each year after the first year their cohort was sampled. Studentswho were retained or accelerated are included in the estimates, but may not be in the grade level indicated. In this exhibit, LEPstudents include only those students identified as LEP in the year prior to the year in row heading, i.e., the year in which the teacherrated the student's English language proficiency.
1_66ABT ASSOCIATES INC. 3-32
CHAPTER 3: EDUCATIONAL SERVICES FOR LIMITED ENGLISH PROFICIENT STUDENTS
exhibit shows that teachers' assessments of their students' English proficiency is highly correlated
with whether or not the student receives ESL/bilingual instructional services the following year.
The upper half of Exhibit 3.12 shows that about 97 percent of 1st grade cohort students
and between 80 and 90 percent of 3rd grade cohort students who a teacher rated as having poor
or no English understanding proficiency receive ESL/bilingual instructional services in the
subsequent year. In contrast, depending on the grade and cohort, 38 to 55 percent of the students
who are judged to have excellent English proficiency receive ESL/bilingual instruction in the
subsequent year. The lower panel of the exhibit shows that an even larger difference in receipt
of language services for different levels of teacher-assessed writing proficiency.26
The substantial portion of students with excellent English understanding and/or writing
proficiency ratings that receive ESL/bilingual instruction in the following year are likely a diverse
group. It includes students who are not yet ready for the same instructional services as their
native English-speaking peers as well as fully English proficient students in developmental
bilingual education programs.
In sum, the lower the teacher s assessment of a student's English proficiency, the more
likely the student is to receive ESL/bilingual instructional services in the following year.
Conversely, the higher the teacher's assessment of a student's English proficiency, the less likely
the student is to receive ESL/bilingual instructional services in the following year. In other
words, ESL/bilingual services are allocated according to perceived need. While this pattern is
reassuring, it does not imply that the amount of language-related services is adequate or
inadequate; the Prospects data cannot answer this question.
Are teacher ratings of LEP students' English Proficiency in the first year related to
the number of subsequent years of ESL/bilingual instructional services? Here, we compare
teacher ratings of LEP students' English understanding and writing proficiency in 3rd grade
(1st grade for 1st grade cohort) to the receipt of ESL/bilingual instructional services in the
following three years (two years for the 1st grade cohort). Like the analysis in the prior section
We also did analysis based upon teacher's ratings of student's English speaking and reading proficiency.Consistent with the degree of difficulty of these skills, the results using English speaking proficiency are similar tothe results for English understanding proficiency and the results for English reading proficiency are virtually thesame as the results for English writing proficiency.
167 ABr AssoCIA7ES INC. 3-33
CHAPTER 3: EDUCATIONAL SERVICES FOR LIMITED ENGLISH PROFICIENT STUDENTS
which compared teacher ratings of English proficiency at the end of each year to the provision
of ESL/bilingual instructional services in the following year, this is a general indication of
whether provision of these services are related to the needs of LEP students. The difference here
is that we calculate the number of years a student receives ESL/bilingual instructional services
(rather than just services in the subsequent year) and we only use the teachers' ratings of English
proficiency in the first year (rather than each year) because it provides the longest follow-up
period. Another difference is that the sample for this analysis includes all students identified as
LEP at any time during the Prospects study, not just in the year the teacher rated the students'
English proficiency. We only have data on the provision of services in the three subsequent years
(two for the 1st grade cohort), but previously cited literature on language development shows that
it takes five to seven years for most LEP students to become fully proficient in English. It
should also be noted that students in a two-way developmental bilingual program which teaches
proficiency in English and a second language will continue to receive ESL/bilingual services even
when they are fully proficient in English. Nevertheless, if in most programs ESL/bilingual
instructional services are provided only to students who are not fully English proficient, we would
expect students' English proficiency to be related to the number of subsequent years of ESL/BE
services.
Exhibits 3.13 (1st grade cohort) and 3.14 (3rd grade cohort) confirm this expectation:
years of subsequent ESL/bilingual instruction is correlated with teacher ratings of English
proficiency in the first year. The upper half of Exhibit 3.13 shows that nearly every LEP student
(94 percent) who is rated as having poor or no English writing proficiency at the end of the
1st grade receives ESL/bilingual instructional services the following two years, with another
4 percent receiving ESL/bilingual instructional services for one more year during the study
period.27 In contrast, only 18.5 percent of LEP students rated as having excellent English
understanding proficiency receive these services in both of the subsequent two years, suggesting
" The 94 percent figure suggests that up to 6 percent of these students may have transitioned out of language-related services by the 3rd grade. However, this fraction could be an overestimate for two reasons: (1) the studentmay receive ESL/bilingual services in later grades not covered by the Prospects study; and (2) students who receiveESL/bilingual instruction in one year could have received these services not in 2nd but in 3rd grade, so they maynot have transitioned out of ESL/bilingual services by the 3rd grade. This caveat also applies for the rest of theanalysis in this section on transitions out of ESL/bilingual instructional services.
ABT ASSOCIATES INC. 3-34
168
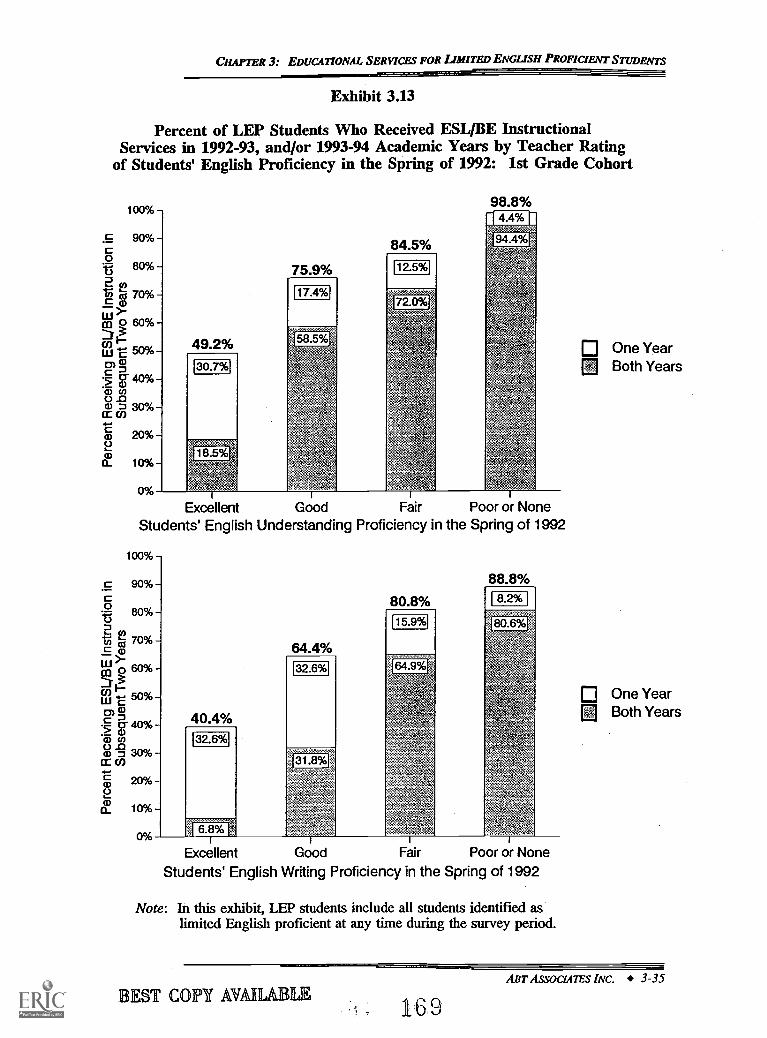
CHAPTER 3: EDUCATIONAL SERVICES FOR LIMITED ENGLISH PROFICIENT STUDENTS
Exhibit 3.13
Percent of LEP Students Who Received ESL/BE InstructionalServices in 1992-93, and/or 1993-94 Academic Years by Teacher Rating
of Students' English Proficiency in the Spring of 1992: 1st Grade Cohort
100%
90%c
76.80%
2 0,70%c
Wcci 0 60%
w 50%o)c-5 g 4.0%.6 coo .0
30%CC CO
c) 20%2a)0_ 10%
0%
98.8%
Excellent Good Fair Poor or NoneStudents' English Understanding Proficiency in the Spring of 1992
100%
0%
40.4%132.6%1
6.8% if
64.4%32.6%
31.8%
80.8%15.9%
Excellent Good Fair Poor or None
Students' English Writing Proficiency in the Spring of 1992
Note: In this exhibit, LEP students include all students identified aslimited English proficient at any time during the survey period.
o One YearBoth Years
El One YearBoth Years
EST COPY AVAHABLE169
ABT ASSOCIATES INC. 3-35
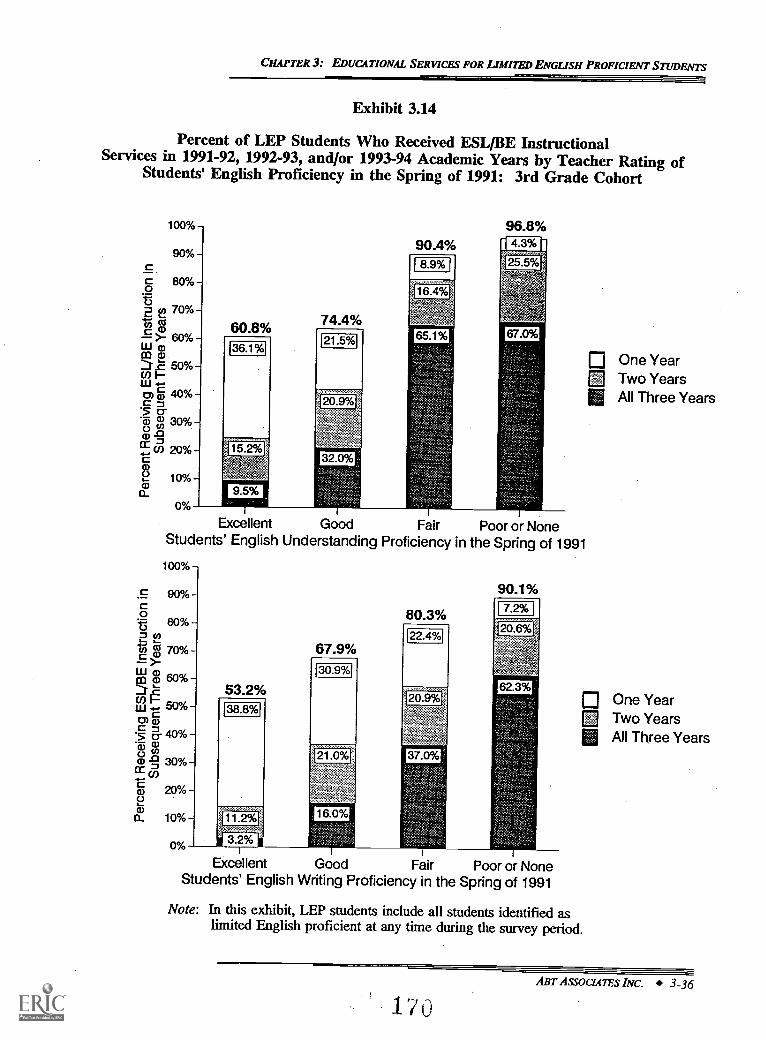
CHAPTER 3: EDUCATIONAL SERVICES FOR LIMITED ENGLISH PROFICIENT STUDENTS
Exhibit 3.14
Percent of LEP Students Who Received ESL/BE InstructionalServices in 1991-92, 1992-93, and/or 1993-94 Academic Years by Teacher Rating of
Students' English Proficiency in the Spring of 1991: 3rd Grade Cohort
100%
90%cc 80%o
-
-
cnc r 60% -wm
50% -(I) I-w 4E.
w 40% -'5 a*cT) :N 30% -a) -a
EC
§ 10%
ocx,
60.8% 74.4%
90.4%1 8.9%1
96.8%
Excellent Good Fair Poor or NoneStudents' English Understanding Proficiency in the Spring of 1991
100% -
90% -c
80% -
gi 70%
win 2 60%_c
cw
c 40%cr
a) -0 30%cc
a) 20%
a_ 10% -
0%
53.2%138.8%
67.9%
80.3%
90.1%
One YearTwo YearsAll Three Years
0 One Year0 Two Years
All Three Years
Excellent Good Fair Poor or NoneStudents' English Writing Proficiency in the Spring of 1991
Note: In this exhibit, LEP students include all students identified aslimited English proficient at any, time during the survey period.
ABT AssociarEs INC. 3-36
1 0
CHAPTER 3: EDUCATIONAL SERVICES FOR LIMITED ENGUSH PROFICIENT STUDENTS
that a large fraction of these students have transitioned out of ESL/bilingual instructional services
by the 3rd grade.
The bottom half of Exhibit 3.13 shows the relationship between teacher ratings of English
writing proficiency and subsequent receipt of ESL/bilingual instructional services. It shows the
same general pattern as was found for understanding proficiency: the more proficient the student
is in the first year the less likely he or she is to receive ESL/bilingual instructional services in
subsequent years. Writing proficiency in English is dependent upon a higher level of English
language development than understanding proficiency, hence a rating of excellent English writing
proficiency is usually a stronger indication of a high level of English language development than
is a rating of excellent English understanding proficiency. For this reason we expect that a
smaller proportion of the LEP students with high levels of English writing proficiency will
subsequently receive ESL/BE services than we found for students with high levels of
understanding proficiency. Our findings match this expectation. For example, only 7 percent
of LEP students rated by their teacher as having excellent English writing proficiency in the
1st grade receive ESL/bilingual services by the 3rd grade, compared to 19 percent of the students
rated as having excellent understanding proficiency.
Exhibit 3.14 shows the analogous relationship between teacher ratings of LEP students'
English proficiency and subsequent receipt of ESL/bilingual instructional services for the 3rd
grade cohort. For this cohort, we have the advantage of observing the services they receive for
three years after the teachers rate their English proficiency. The findings for the 3rd grade cohort
are the same as the 1st grade cohort, with the additional year of data showing a continuation of
the trend found in the two years of data for the 1st grade cohort: the higher the teacher rating
of LEP students' English proficiency, the fewer the subsequent years of ESL/bilingual
instructional services.
The upper half of Exhibit 3.14 shows that 3 percent of LEP students rated as having little
or no English understanding proficiency in the 3rd grade do not receive ESL/bilingual instruction
in the 4th grade, whereas 39 percent of LEP students rated as having excellent understanding
proficiency do not receive these services in the 4th grade. By the 6th grade, 33 percent of LEP
students with little or no understanding proficiency in the 3rd grade are not receiving
ESL/bilingual services, compared to 90 percent of LEP students with excellent understanding in
ABT ASSOCIATES INC. 3-37
171
CHAPTER 3: EDUCATIONAL SERVICES FOR LIMITED ENGLISH PROFICIENT STUDENTS
proficiency in the 3rd grade. The bottom half of Exhibit 3.14 shows similar results for teacher
ratings of students' English writing proficiency: almost 97 percent of the LEP students rated as
having excellent English writing proficiency in the 3rd grade transitioned out of language-related
services by the 6th grade.
In sum, the lower a student's level of English proficiency, the greater the number of
subsequent years of ESL/bilingual instructional services. Like the findings in the previous
section, this pattern indicates that ESL/bilingual services are allocated according to perceived
need. Nevertheless, this analysis does not indicate whether the amount of language-related
services is adequate or inadequate: the Prospects data cannot answer this question.
What proportion of LEP students' instruction is provided in a language other than
English? For limited English proficient students, instruction in the native language may allow
continuation of their cognitive development and subject mastery in step with their English
proficient peers until their proficiency in English is sufficient to allow them to benefit fully from
instruction in English. The optimal mix of instruction in a student's native language and in
English is an open question, and probably varies across students depending on, among other
things, their proficiency level in both languages, their prior education, and their parents' education
and language proficiency.
The optimal mix also varies across instructional programs. For example, a developmental
bilingual education program that seeks to build LEP and EP students' proficiency in both English
and a second language may continue to provide instruction in both languages as students progress
through school. In contrast, a program whose goal is to build LEP student proficiency only in
English would decrease the amount of instruction in a language other than English as a student
progresses through school.
The top half of Exhibit 3.15 shows that, in the 1st grade cohort, between 20 and
25 percent of instruction in regular math and reading/English/language arts classes is provided
in a non-English language across all three grades.' The bottom half of Exhibit 3.15 shows that
LEP students in the 3rd grade cohort receive about 20 percent of their instruction in a non-
28 Teachers were asked to estimate the percent of their class instruction that was conducted in students' non-English language(s). In classrooms where LEP students speak more than one non-English language, some (or all)of the non-English instruction will not be in the first language of particular LEP students.
ABT ASSOCIATES INC. 3-38
172
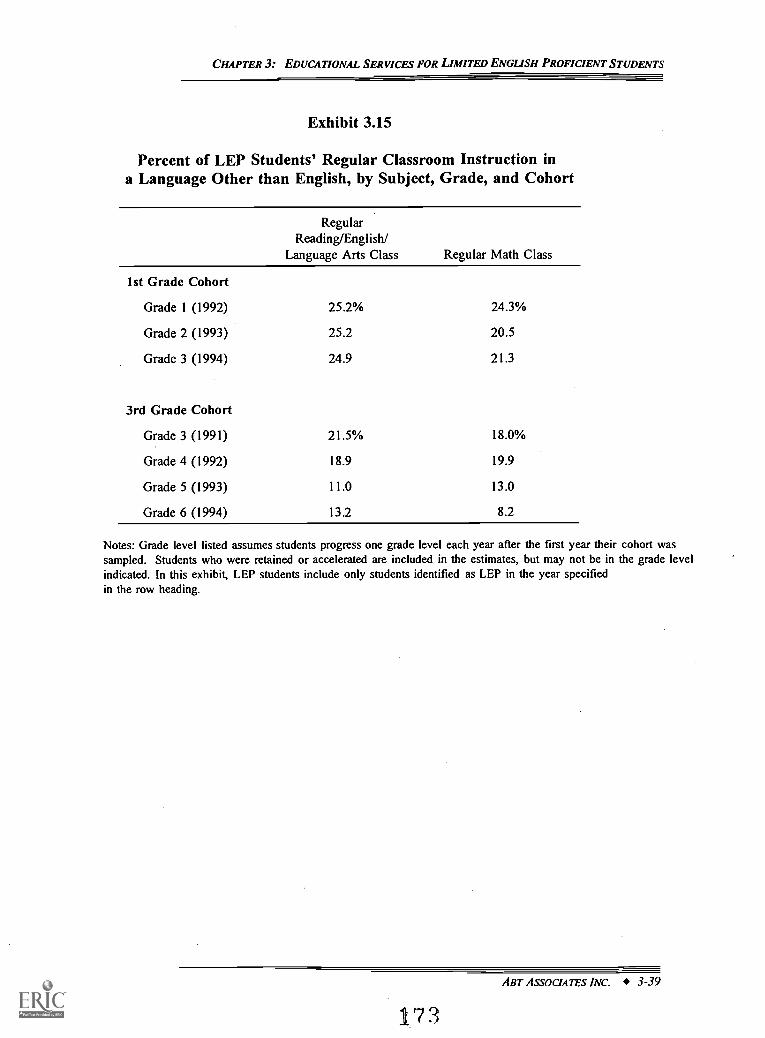
CHAPTER 3: EDUCATIONAL SERVICES FOR LIMITED ENGLISH PROFICIENT STUDENTS
Exhibit 3.15
Percent of LEP Students' Regular Classroom Instruction ina Language Other than English, by Subject, Grade, and Cohort
RegularReading/English/
Language Arts Class Regular Math Class
1st Grade Cohort
Grade 1 (1992) 25.2% 24.3%
Grade 2 (1993) 25.2 20.5
Grade 3 (1994) 24.9 21.3
3rd Grade Cohort
Grade 3 (1991) 21.5% 18.0%
Grade 4 (1992) 18.9 19.9
Grade 5 (1993) 11.0 13.0
Grade 6 (1994) 13.2 8.2
Notes: Grade level listed assumes students progress one grade level each year after the first year their cohort wassampled. Students who were retained or accelerated are included in the estimates, but may not be in the grade levelindicated. In this exhibit, LEP students include only students identified as LEP in the year specifiedin the row heading.
ABT ASSOCIATES INC. 3-39
173
CHAPTER 3: EDUCATIONAL SERVICES FOR LIMITED ENGLISH PROFICIENT STUDENTS
English language in 3rd grade, but it decreases to between 8 and 13 percent by 5th and 6th grade.
Reading/English/language arts instruction is somewhat more likely to be provided in a non-
English language than math instruction at most grade levels.
As one would expect, the proportion of instruction in a non-English language by special
Chapter 1 and ESL/BE instructors is somewhat higher (figures not shown in exhibie9) than for
the regular classroom teachers examined here. This suggests that LEP students whose regular
classroom teacher is supplemented by an additional Chapter 1 or ESL/BE instructor may receive
more non-English instruction than indicated by Exhibit 3.15.
Is the proportion of instruction provided in a non-English language related to prior
assessments of LEP students' English language proficiency? Before becoming proficient in
English, students with limited English proficiency may need to have part or all of their instruction
in their native language in order to keep pace with their native English-speaking peers in terms
of content. As LEP students become proficient in English, they may be able to benefit fully from
all or nearly all instruction in English, but may be taught some time in a language other than
English to continue to develop and reinforce their bilingual skills. This study did not examine
how the student's native language is used in the classroom. Native language instruction varies
from teaching subject content in that language to providing instructions in the native language
to help the students do their work in English. In practice, there are few pure models of how the
students' native language is used in instruction.
In Exhibit 3.16, we examine the relationship between the amount of the regular
reading/English/language arts instruction that is in a language other than English and the prior
year teachers' assessments of students' English language understanding and writing
proficiency.3° Exhibit 3.16 shows two clear patterns. First, looking across the rows, it shows
29 As mentioned earlier, estimates for Chapter 1-funded teachers and aides and non-Chapter 1-funded ESL/BEteachers and aides are not reported in the text because data for these instructors have unusually high missing rates(between 20 and 60 percent), which creates a potential for bias. In addition, the relevant sample sizes are small.
30 We present only the results based on teacher assessments of students' understanding and writing proficiency,because these two skills span the spectrum of English proficiency skills. Results (not shown) for teacherassessments of students' English speaking proficiency are similar to the results shown for English understandingproficiency, while results based on students' reading proficiency (not shown) are almost exactly the same as theresults shown for English writing proficiency.
174 ABT ASSOCIATES INC. 3-40
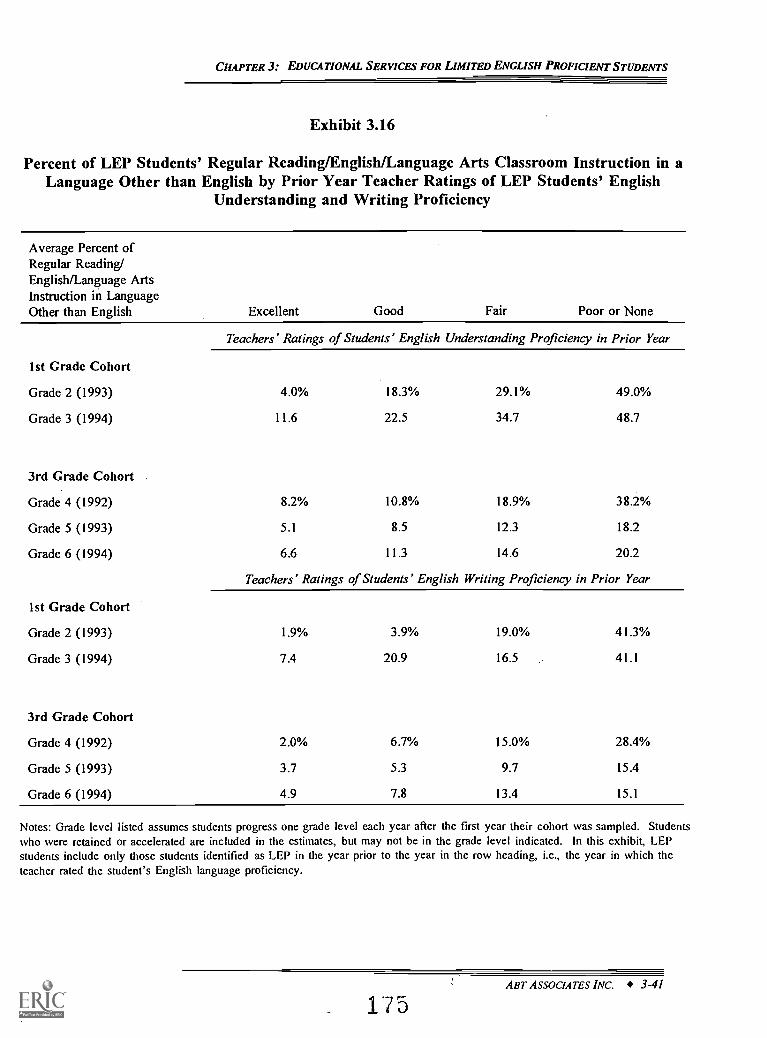
CHAPTER 3: EDUCATIONAL SERVICES FOR LIMITED ENGLISH PROFICIENT STUDENTS
Exhibit 3.16
Percent of LEP Students' Regular Reading/English/Language Arts Classroom Instruction in aLanguage Other than English by Prior Year Teacher Ratings of LEP Students' English
Understanding and Writing Proficiency
Average Percent ofRegular Reading/English/Language ArtsInstruction in LanguageOther than English Excellent Good Fair Poor or None
Teachers' Ratings of Students' English Understanding Proficiency in Prior Year
1st Grade Cohort
Grade 2 (1993) 4.0% 18.3% 29.1% 49.0%
Grade 3 (1994) 11.6 22.5 34.7 48.7
3rd Grade Cohort
Grade 4 (1992) 8.2% 10.8% 18.9% 38.2%
Grade 5 (1993) 5.1 8.5 12.3 18.2
Grade 6 (1994) 6.6 11.3 14.6 20.2
Teachers' Ratings of Students' English Writing Proficiency in Prior Year
1st Grade Cohort
Grade 2 (1993) 1.9% 3.9% 19.0% 41.3%
Grade 3 (1994) 7.4 20.9 16.5 41.1
3rd Grade Cohort
Grade 4 (1992) 2.0% 6.7% 15.0% 28.4%
Grade 5 (1993) 3.7 5.3 9.7 15.4
Grade 6 (1994) 4.9 7.8 13.4 15.1
Notes: Grade level listed assumes students progress one grade level each year after the first year their cohort was sampled. Studentswho were retained or accelerated are included in the estimates, but may not be in the grade level indicated. In this exhibit, LEPstudents include only those students identified as LEP in the year prior to the year in the row heading, i.e., the year in which theteacher rated the student's English language proficiency.
ABT ASSOCIATES INC. 3-41
175
CHAPTER 3: EDUCATIONAL SERVICES FOR LIMITED ENGLISH PROFICIENT STUDENTS
that the lower the teachers' assessment of the students' English understanding or writing
proficiency, the more of the subsequent year's instruction that is provided in a language other
than English. For example, the first row of the exhibit shows that LEP students who are rated
as having excellent English understanding proficiency while in the first grade receive, on average,
only four percent of their instruction in a language other than English in the following year.
Students who are rated as having poor or no English reading proficiency in the first grade receive
an average of 49 percent of their instruction in a language other than English in the following
year. These results suggest that the amount of native language instruction provided is related to
need.
The second pattern evident from Exhibit 3.16 is that for students with the lowest ratings
of English understanding or writing proficiency, poor or none (the last colunm of the exhibit),
the amount of instruction in a language other than English declines as the elementary
school grade level rises. For example, looking down the last column of the exhibit, an average
of nearly 49 percent of instruction is in a language other than English in the second grade for
students rated as having poor or no English understanding proficiency in the prior year, while in
the sixth grade, an average of only 20 percent of the instruction is in a language other than
English for similarly rated students in the prior year. This may reflect changes in instruction or
be an indication that the scale on which teachers rate students' English proficiency is higher for
the higher grades, so that students in the later elementary grades with low ratings of English
understanding or writing proficiency can still benefit from instruction in English.
Do LEP students receive supplementary assistance funded by Chapter 1 in math and
reading/English/language arts? In Chapter 2, we found that 85 percent of LEP students are
from families with incomes below 185 percent of the poverty line and nearly three out of four
attend schools where more than half of the students are eligible for free or reduced-price lunches.
These measures of economic disadvantage suggest that many LEP students will be eligible for
and in need of supplementary services funded through the Chapter 1 program or other
ABT ASSOCIATES INC. 3-42
CHAPTER 3: EDUCATIONAL SERVICES FOR LIMITED ENGLISH PROFICIENT STUDENTS
supplementary programs.' Indeed, Exhibit 3.11 showed that a substantial proportion of students
identified as limited English proficient in a particular year receive ESL/BE instruction funded by
Chapter 1. We explore this issue further in Exhibits 3.17 and 3.18 by looking at funding sources
for other types of supplementary instruction.
Exhibit 3.17 contains LEP students' grade-by-grade participation rates in reading/English/
language arts supplementary assistance, while Exhibit 3.18 does the same for supplementary math
assistance. Befitting their limited English language proficiency, we see that LEP students are
more likely to receive supplementary assistance in reading/English/language arts than in math.
Depending on the year and grade, between 25 and 47 percent of students identified as LEP in a
particular year participate in supplemental Chapter 1 reading/English/language arts instruction (see
Exhibit 3.17), whereas only 18 to 37 percent participate in Chapter 1 math programs
(Exhibit 3.18). An additional 4 to 13 percent are enrolled in schools operating as a Chapter 1
schoolwide program.'
It is clear from the exhibits that the Chapter 1 program is a primary source of funding for
supplemental services' for LEP students in both math and reading/English/language arts. On
average, over eight times as many LEP students receive supplemental services in these core
subjects funded by Chapter 1 than funded by other sources. In addition, an average of
nine percent of LEP students are in schools operating as a Chapter 1 schoolwide program.
31 Puma et al. (1997) report the Chapter 1 program operated as follows at the time of the study in the early1990s:
The U.S. Department of Education distributed Chapter 1 funds directly to counties based on thenumber of poor children aged 5-17 identified in the decennial census, with an adjustment usinga state average per-pupil erpenditure factor intended to recognize the cost of living differencesacross states. The money was then suballocated to school districts in proportion to the numberof children from low-income families in each district. Within the school district, a school waseligible for Chapter 1 assistance if its attendance area had a poverty rate that was relatively highfor that district. In general, districts selected the schools that ranked highest in poverty, but thelaw allowed districts several alternatives to a strict ranking. Finally, within selected schools,individual students were selected for services on the basis of their educational need, rather thanon the basis of their parents' financial status. (p.6).
32 Because of the nature of schoolwide programs, the fungibility of Chapter 1 funding, and the lack of detailedfinancial data, we cannot determine which types of services students receive as a result of the Chapter 1 Schoolwideprogram. Since Chapter 1 Schoolwide funds can be used to enhance all curricula, we count these students asparticipating in both supplementary reading/English/language arts instruction and supplementary math instruction.
33 In this chapter, supplemental services are defined as services funded by supplemental sources, such ascompensatory education programs like Chapter 1 or programs targeted for students with special instructional needssuch as Title VII (targeted to LM students), and services provided to students with special needs such as state fundedremedial math or special education services.
ABT ASSOCIATES INC. 3-43
177
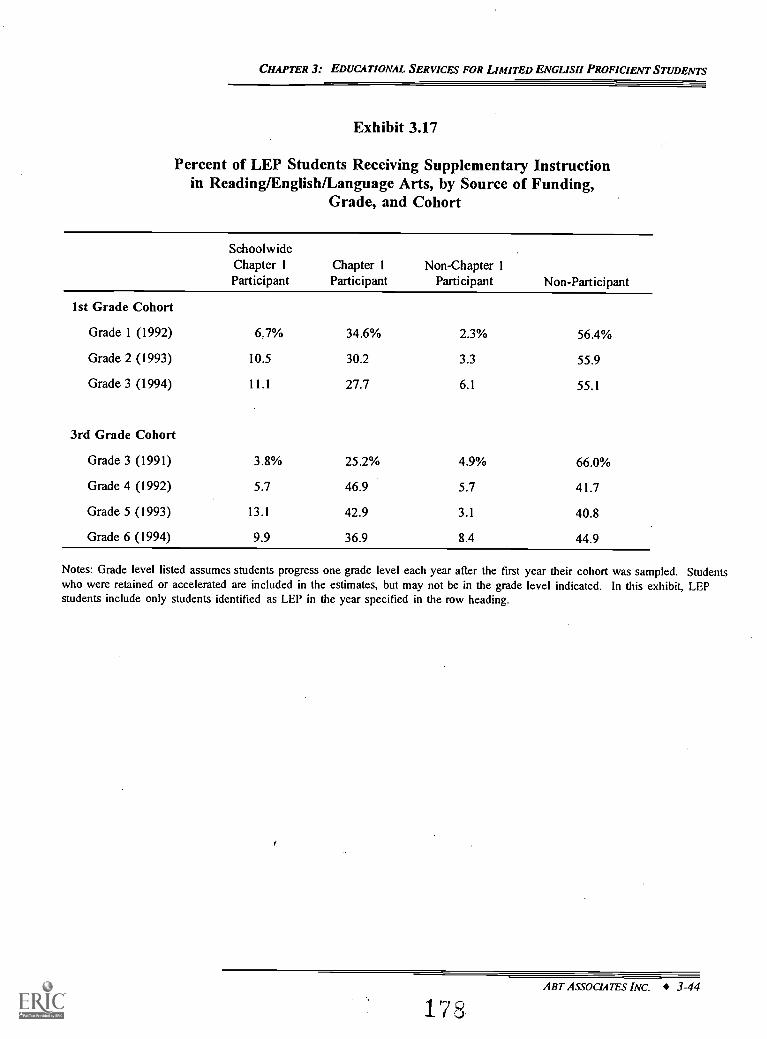
CHAPTER 3: EDUCATIONAL SERVICES FOR LIMITED ENGLISH PROFICIENT STUDENTS
Exhibit 3.17
Percent of LEP Students Receiving Supplementary Instructionin Reading/English/Language Arts, by Source of Funding,
Grade, and Cohort
SchoolwideChapter 1Participant
Chapter 1Participant
Non-Chapter 1Participant Non-Participant
1st Grade Cohort
Grade 1 (1992) 6.7% 34.6% 2.3% 56.4%
Grade 2 (1993) 10.5 30.2 3.3 55.9
Grade 3 (1994) 11.1 27.7 6.1 55.1
3rd Grade Cohort
Grade 3 (1991) 3.8% 25.2% 4.9% 66.0%
Grade 4 (1992) 5.7 46.9 5.7 41.7
Grade 5 (1993) 13.1 42.9 3.1 40.8
Grade 6 (1994) 9.9 36.9 8.4 44.9
Notes: Grade level listed assumes students progress one grade level each year after the first year their cohort was sampled. Studentswho were retained or accelerated are included in the estimates, but may not be in the grade level indicated. In this exhibit, LEPstudents include only students identified as LEP in the year specified in the row heading.
Aar ASSOCIATES INC. 3-44
178
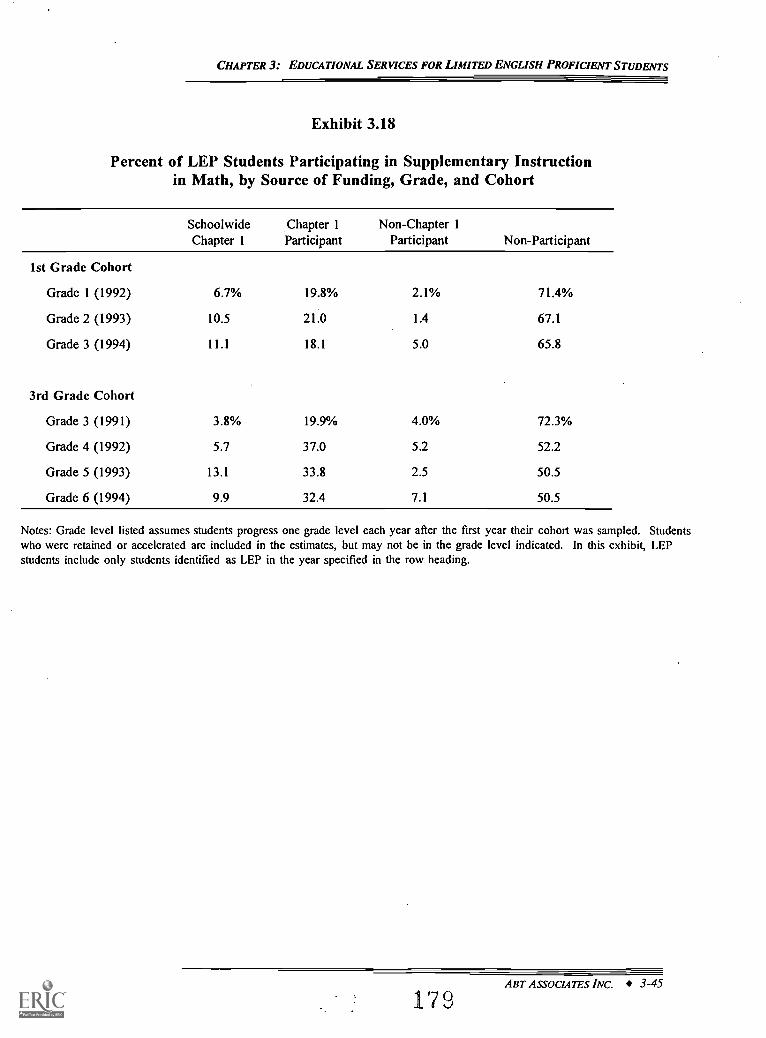
CHAPTER 3: EDUCATIONAL SERVICES FOR LIMITED ENGLISH PROFICIENT STUDENTS
Exhibit 3.18
Percent of LEP Students Participating in Supplementary Instructionin Math, by Source of Funding, Grade, and Cohort
SchoolwideChapter 1
Chapter 1Participant
Non-Chapter 1Participant Non-Participant
1st Grade Cohort
Grade 1 (1992) 6.7% 19.8% 2.1% 71.4%
Grade 2 (1993) 10.5 21.0 1.4 67.1
Grade 3 (1994) 11.1 18.1 5.0 65.8
3rd Grade Cohort
Grade 3 (1991) 3.8% 19.9% 4.0% 72.3%
Grade 4 (1992) 5.7 37.0 5.2 52.2
Grade 5 (1993) 13.1 33.8 2.5 50.5
Grade 6 (1994) 9.9 32.4 7.1 50.5
Notes: Grade level listed assumes students progress one grade level each year after the first year their cohort was sampled. Studentswho were retained or accelerated are included in the estimates, but may not be in the grade level indicated. In this exhibit, LEPstudents include only students identified as LEP in the year specified in the row heading.
ABT ASSOCIATES INC. 3-45
1 '7 (
CHAPTER 3: EDUCATIONAL SERVICES FOR LIMITED ENGLISH PROFICIENT STUDENTS
The exhibits also show a general upward trend in the proportion of LEP students who
receive supplementary services in core subjects as they progress through elementary school. For
example, 44 percent of LEP students receive supplemental reading/English/language arts
instruction from all sources in 1st grade in 1991, while 55 percent of LEP students in 6th grade
in 1994 receive supplemental reading/English/language arts instruction. These trends may
indicate that the students who continue to be identified as LEP by school staff as they progress
through school are the more economically and educationally needy students and therefore most
often in need of supplemental instruction. This upward trend in the percentage of LEP students
in the later grades who receive supplemental services may also indicate the rising cognitive
demands of coursework in content areas in higher grades, or instructional failure in the
earlier grades.
In summary, Chapter 1 is a major source of funding for supplemental services for LEP
children. Averaged across grades and cohorts, Chapter 1 funds supplementary instruction for
about one-fourth of LEP students in ESL/BE instruction, for one-third in math instruction, and
for over two-fifths in reading/English/language arts instruction (see Exhibits 3.11, 3.17, and 3.18).
Overall, the Prospects data indicate that during the survey period over 60 percent of the 1st grade
cohort students received some type of instruction funded by Chapter 1 and 70 percent of the
3rd grade cohort received Chapter 1 funded instruction (figures not shown in exhibit). In
addition, the importance of Chapter 1 in providing critical instructional services to LEP students
has probably grown since the last year of the survey, 1994, because of changes in the Chapter
1 program (now called Title I). Schools are no longer required to distinguish between limited
English language proficiency and educational deprivation when providing Chapter 1 services,
which is expected to lead to greater participation of LEP students in Title I (see Anstrom 1995,
Hoff 1997).34
Anstrom (1995) explains the change as follows:The previous Chapter I law required that programs distinguish between educational deprivationand limited English proficiency when determining eligibility forprogramming (Section 1014 Idifl]).The new legislation eliminates this requirement thus paving the way for greater inclusion of LEPstudents in Title I services. (p. 4)
ABT ASSOCIATES INC. 3-46
180
CHAPTER 3: EDUCATIONAL SERVICES FOR LIMITED ENGLISH PROFICIENT' STUDENTS
Does the emphasis on reading skills vary by a LEP student's English language
reading proficiency? Does it vary by the student's native language reading proficiency?
Here, we address one of the most fundamental topics in educational practice: Do students receive
instructional services in the classroom that are responsive to their educational needs? To address
this question, we compare the teacher's report of the reading skills that are emphasized in his or
her classroom (i.e., instructional service) with the rating of the student's English and native
language reading proficiency by the student's primary teacher in the previous year (i.e.,
educational need). This analysis is undertaken for students identified as LEP while in the
4th grade in 1992, based on proficiency ratings from the previous year.'
Factor analysis was used to summarize general categories of skills emphasized by
individual teachers, based on their responses to the degree of emphasis placed on 25 skills a
teacher might emphasize in a 4th grade reading/English/language arts classroom. (See Appendix E
for a discussion of factor analysis methods and results.) We identified two primary factors
related to reading skills, which we labelled Reading Attitudes and Reading Comprehension.
Composite scores were formed for both of these factors by averaging the teacher's response to
the amount of emphasis he or she gives to the skills associated with each factor. Reading
Attitudes is composed of three items that measure the emphasis a teacher places on the students'
confidence and appreciation of reading.' Reading Comprehension is composed of seven items
that indicate the degree to which the teacher emphasizes students' comprehension of facts and
details from their reading as well as their ability to draw inferences and separate fact from
opinion. Together, these two variables capture the emphasis a teacher places on reading skills
in the 4th grade.
35 We chose to do this analysis for the 3rd grade cohort using 1991 proficiency ratings and 1992 instructionalemphases because each of the other combinations of consecutive years of data had a drawback in one of the twomeasures. We did not use the 1992 proficiency rating/1993 instructional emphasis in the Prospects sample becausethe 1993 question on instructional emphasis is a binary variableteach/do not teach and hence the items did not fitthe factors used in the factor analysis (see below) as well for that year. Similarly, we did not use the 1993proficiency rating/1994 instructional emphasis because the question on native language proficiency was only on thesurvey in 1991 and 1992. The 1st grade cohort was not in the survey in the Spring of 1991, hence, we could onlydo the 1991/1992 analysis for the 3rd grade cohort.
'6 The Reading Attitudes factor is a composite score based on the degree of emphasis the teacher reports placingon: developing an appreciation for reading and the desire to read; developing student' confidence in their ability toread; and improving students' understanding of the value of reading in everyday life. See Appendix E for detailson the factor analysis methods and results.
181 ABT AssocIATEs INC. 3-47
CHAPTER 3: EDUCATIONAL SERVICES FOR LIMITED ENGLISH PROFICIENT STUDENTS
Exhibit 3.19 shows the relationship between LEP students' reading proficiency ratings in
3rd grade and the level of emphasis their reading/English/language arts teachers place on Reading
Attitudes in the 4th grade. As can be seen, the teachers' emphasis on Reading Attitudes does not
vary much with either the English or native language reading proficiency rating of LEP students.
Regardless of students' proficiency level, about nine out of ten LEP students are in classes where
the regular reading/English/language arts teacher places major emphasis on skills associated with
Reading Attitudes.
On the other hand, Reading Comprehension, which embodies more advanced reading
skills, is clearly not emphasized as much by the teachers of LEP students with poor or no English
reading proficiency (see top panel of Exhibit 3.20). Only one-third of the LEP students rated as
having poor or no English proficiency in the prior year have teachers that place major emphasis
on Reading Comprehension, compared to over half of other LEP students. Ratings of native
language proficiency are not correlated with the emphasis teachers place on Reading
Comprehension, however (see bottom panel of Exhibit 3.20).
Does the emphasis on writing skills vary with a LEP student's English language
writing proficiency? Does it vary with the student's native language writing proficiency?
Here we compare teachers' reports of writing skills that are emphasized in their classes with the
rating of LEP students' English and native language writing proficiency by the child's regular
classroom teacher in the previous year.
Using the procedure described above for reading skills, we created one composite score,
labelled Writing Attitudes/Skills, that measures the emphasis a teacher places on basic writing
skills in the 4th grade. Writing Attitudes/Skills is composed of six items that a teacher might
emphasize, including grammar, spelling, and developing students' confidence and appreciation
for writing.
Exhibit 3.21 shows the relationship between the emphasis on Writing Attitudes/Skills in
the 4th grade (in the Spring of 1992) and students' prior-year ratings of English and native
language writing proficiency. As can be seen in the upper panel of the exhibit, LEP students
rated as having excellent English writing proficiency are less likely to be in classes where Writing
Skills/Attitudes are a major emphasis the following year. Only 31 percent of these students are
in such classes, compared to nearly half of all other LEP students. Conversely, the higher the
ABT Assocmms INC. 3-48
182
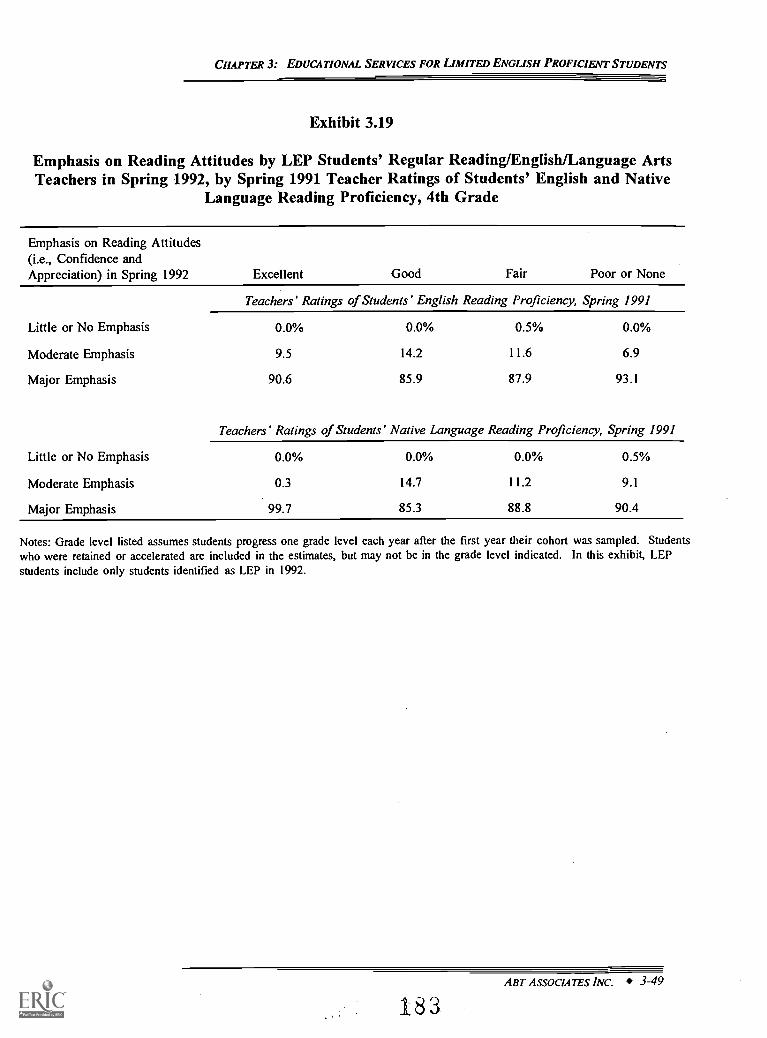
CHAPTER 3: EDUCATIONAL SERVICES FOR LIMITED ENGLISH PROFICIENT STUDENTS
Exhibit 3.19
Emphasis on Reading Attitudes by LEP Students' Regular Reading/English/Language ArtsTeachers in Spring 1992, by Spring 1991 Teacher Ratings of Students' English and Native
Language Reading Proficiency, 4th Grade
Emphasis on Reading Attitudes(i.e., Confidence andAppreciation) in Spring 1992 Excellent Good Fair Poor or None
Teachers' Ratings of Students' English Reading Proficiency, Spring 1991
Little or No Emphasis 0.0% 0.0% 0.5% 0.0%
Moderate Emphasis 9.5 14.2 11.6 6.9
Major Emphasis 90.6 85.9 87.9 93.1
Teachers' Ratings of Students' Native Language Reading Proficiency, Spring 1991
Little or No Emphasis 0.0% 0.0% 0.0% 0.5%
Moderate Emphasis 0.3 14.7 11.2 9.1
Major Emphasis 99.7 85.3 88.8 90.4
Notes: Grade level listed assumes students progress one grade level each year after the first year their cohort was sampled. Studentswho were retained or accelerated are included in the estimates, but may not be in the grade level indicated. In this exhibit, LEPstudents include only students identified as LEP in 1992.
ABT ASSOCIATES' INC. 3-49
183
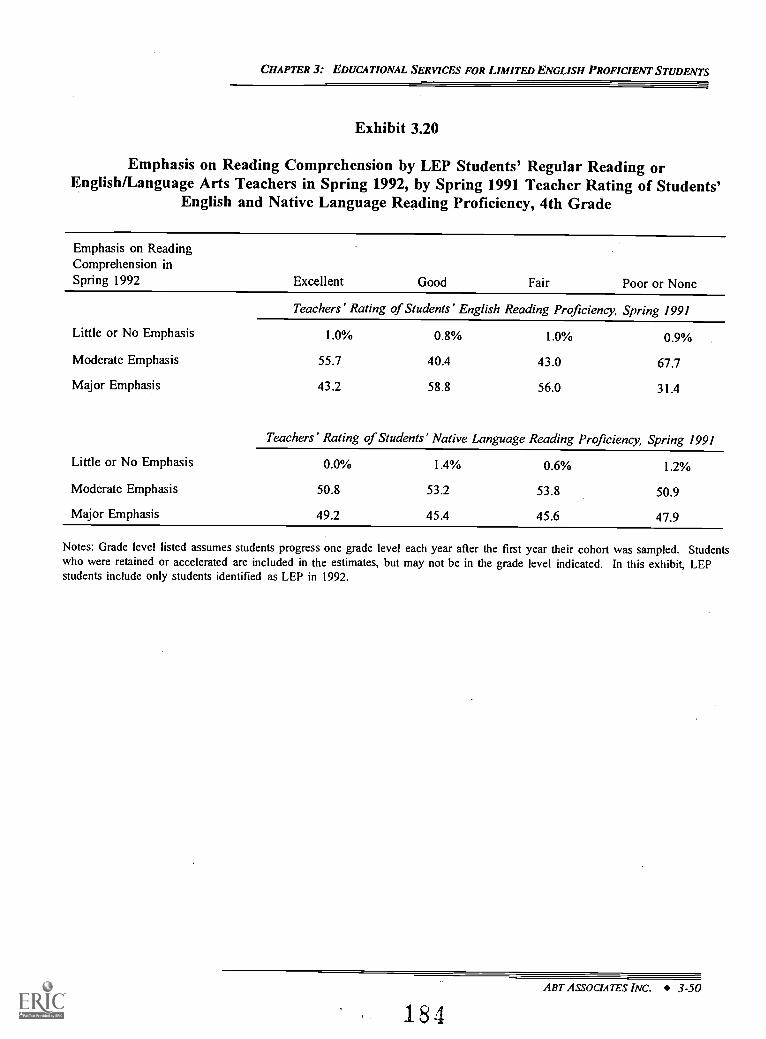
CHAPTER 3: EDUCATIONAL SERVICES FOR LIMITED ENGLISH PROFICIENT STUDENTS
Exhibit 3.20
Emphasis on Reading Comprehension by LEP Students' Regular Reading orEnglish/Language Arts Teachers in Spring 1992, by Spring 1991 Teacher Rating of Students'
English and Native Language Reading Proficiency, 4th Grade
Emphasis on ReadingComprehension inSpring 1992 Excellent Good Fair Poor or None
Teachers' Rating of Students' English Reading Proficiency, Spring 1991
Little or No Emphasis 1.0% 0.8% 1.0% 0.9%
Moderate Emphasis 55.7 40.4 43.0 67.7
Major Emphasis 43.2 58.8 56.0 31.4
Teachers' Rating of Students' Native Language Reading Proficiency, Spring 1991
Little or No Emphasis 0.0% 1.4% 0.6% 1.2%
Moderate Emphasis 50.8 53.2 53.8 50.9
Major Emphasis 49.2 45.4 45.6 47.9
Notes: Grade level listed assumes students progress one grade level each year after the first year their cohort was sampled. Studentswho were retained or accelerated are included in the estimates, but may not be in the grade level indicated. In this exhibit, LEPstudents include only students identified as LEP in 1992.
ABT ASSOCIATES INC. 3-50
184
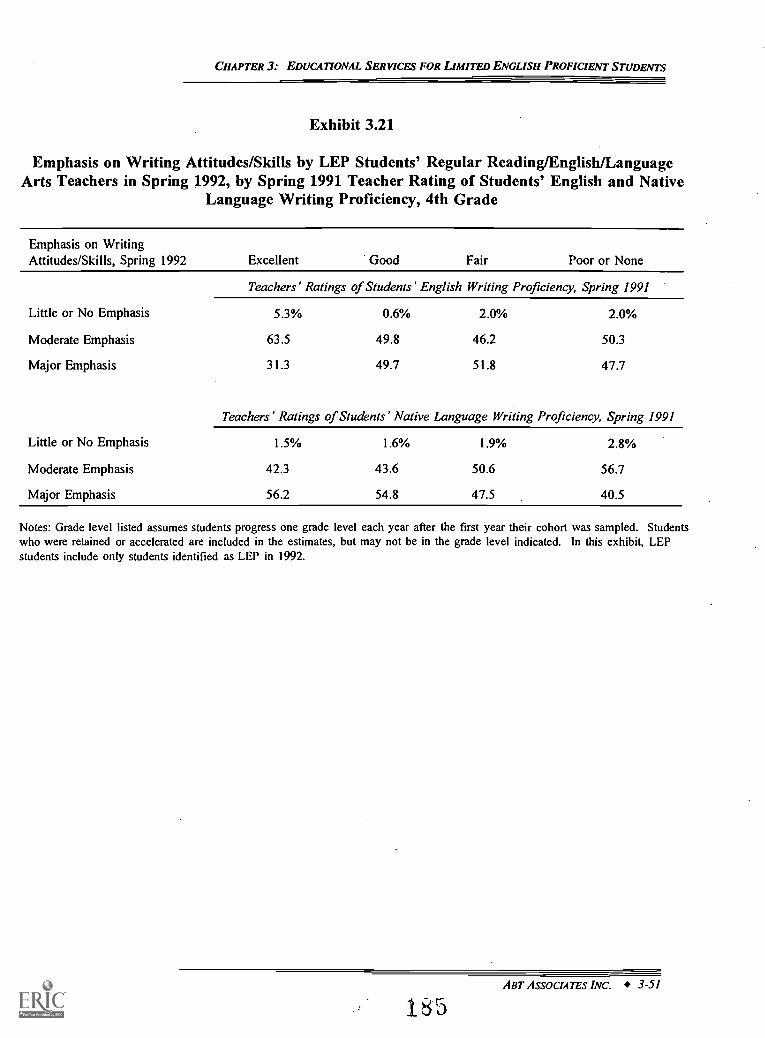
CHAPTER 3: EDUCATIONAL SERVICES FOR LIMITED ENGLISH PROFICIENT STUDENTS
Exhibit 3.21
Emphasis on Writing Attitudes/Skills by LEP Students' Regular Reading/English/LanguageArts Teachers in Spring 1992, by Spring 1991 Teacher Rating of Students' English and Native
Language Writing Proficiency, 4th Grade
Emphasis on WritingAttitudes/Skills, Spring 1992 Excellent Good Fair Poor or None
Teachers' Ratings of Students' English Writing Proficiency, Spring 1991
Little or No Emphasis 5.3% 0.6% 2.0% 2.0%
Moderate Emphasis 63.5 49.8 46.2 50.3
Major Emphasis 31.3 49.7 51.8 47.7
Teachers' Ratings of Students' Native Language Writing Proficiency, Spring 1991
Little or No Emphasis 1.5% 1.6% 1.9% 2.8%
Moderate Emphasis 42.3 43.6 50.6 56.7
Major Emphasis 56.2 54.8 47.5 40.5
Notes: Grade level listed assumes students progress one grade level each year after the first year their cohort was sampled. Studentswho were retained or accelerated are included in the estimates, but may not be in the grade level indicated. In this exhibit, LEPstudents include only students identified as LEP in 1992.
ABT ASSOCIATES INC. 3-51
CHAPTER 3: EDUCATIONAL SERVICES FOR LIMITED ENGLISH PROFICIENT STUDENTS
students' native language writing proficiency (bottom panel), the greater the likelihood of being
in a class with major emphasis on Writing Attitude/Skills. Here, about 41 percent of LEP
students rated as having poor or no writing proficiency in their native language are inreading/English/language arts classes that placed major emphasis on Writing Attitudes/Skills,
compared to over half of the other students.
Overall, our findings on the responsiveness of 4th grade instruction to the 3rd grade
English and native language proficiency of LEP students reveal some interesting patterns.
Surprisingly, LEP students rated as having poor English reading proficiency in 3rd grade are less
likely to be in a 4th grade class that places major emphasis on Reading Comprehension than are
other LEP students. It may be that the higher level reading skills represented by the Reading
Comprehension measure are seen as an inappropriate area of emphasis for students still struggling
with the basics of reading in English. A similar pattern arises regarding native language writing
proficiency: LEP students rated as having poor native language writing proficiency in the
3rd grade are less likely than other students to be in a 4th grade class that emphasizes Writing
Attitudes/Skills. Finally, LEP students rated as having excellent English writing proficiency in
the 3rd grade are less likely to be in a class that emphasizes Writing Attitudes/Skills in the
4th grade, perhaps because the skills have already been amply developed.
Do LEP STUDENTS AT HIGH-POVERTY SCHOOLS RECEIVE THE SAME QUALITY OFEDUCATIONAL INPUTS AS EP STUDENTS AT HIGH-POVERTY SCHOOLS?
To further examine the types of instruction received by LEP students, we next compare
the general educational inputs of LEP students with EP students on a number of dimensions for
3rd and 6th graders in the 1993-94 academic year, including the education and experience of
regular classroom teachers and aides, class size, and the availability of instructional materials.
Generally, these variables reveal something about the quality of instructional inputs provided to
LEP and EP students alike. For this analysis, LEP students from high-poverty schools are
compared to EP students from high-poverty schools. As discussed earlier in the chapter, a high-
poverty school is defined to be a school where at least 50 percent of the student body is eligible
for free or reduced-price lunches.
Aer ASSOCIATES INC. 3-52
186
CHAPTER 3: EDUCATIONAL SERVICES FOR LIMITED ENGLISH PROFICIENT STUDENTS
Are the regular classroom reading/Englishganguage arts and math teachers of LEPstudents as educated and experienced as the regular classroom teachers of EP students?
We begin by considering the education and experience of students' primary classroom
teachers and aides. We also look in this section at teachers' standard certification levels, as a
further indicator of instructional quality.
Do LEP students' reading and math teachers have the same educational background
as teachers of EP students? The highest academic degree attained by a teacher is one measure
of the quality of instructional services provided to students. As Exhibits 3.22 and 3.23 show, in
high-poverty schools, there is no substantial difference in the educational attainment of LEP
students' and EP students' regular classroom teachers (reading\English\language arts or math) for
either cohort. On this indicator of instructional quality, LEP students and EP students appear
similar.
Do LEP students' regular reading and math aides have the same educational
background as EP students' aides?" Exhibits 3.24 and 3.25 show the patterns of educational
attainment for classroom aides. In the 1st grade cohort, the aides in the regular
reading/English/reading arts classrooms of 3rd grade LEP students appear to have had less formal
education than the aides in EP students' classrooms. In particular, only about 13 percent of the
reading instructional aides in LEP students' regular classrooms had at least some college
education, compared to nearly 30 percent for their EP counterparts in similarly economically
disadvantaged schools. The opposite pattern appears to hold for 6th grade students in 1994
(3rd grade cohort), where LEP students' aides appear more likely to have some college training
relative to EP students' aides. Results for math classroom aides are similar (see Exhibit 3.25).
Do LEP students' reading and math teachers have the same amount of teaching
experience as EP students' teachers? Teaching experience is a second dimension by which to
gauge the quality of teachers providing regular instruction to LEP and EP students. More
experienced teachers have presumably had time to fine-tune effective teaching methods to meet
the needs of the various students enrolled in their class. As can be seen in
37 The sample sizes (not shown in the exhibit) for classroom aides' education are quite small (less than 50) forsome cells; the results therefore need to be interpreted cautiously.
ART ASSOCIATES INC. 3-53
137
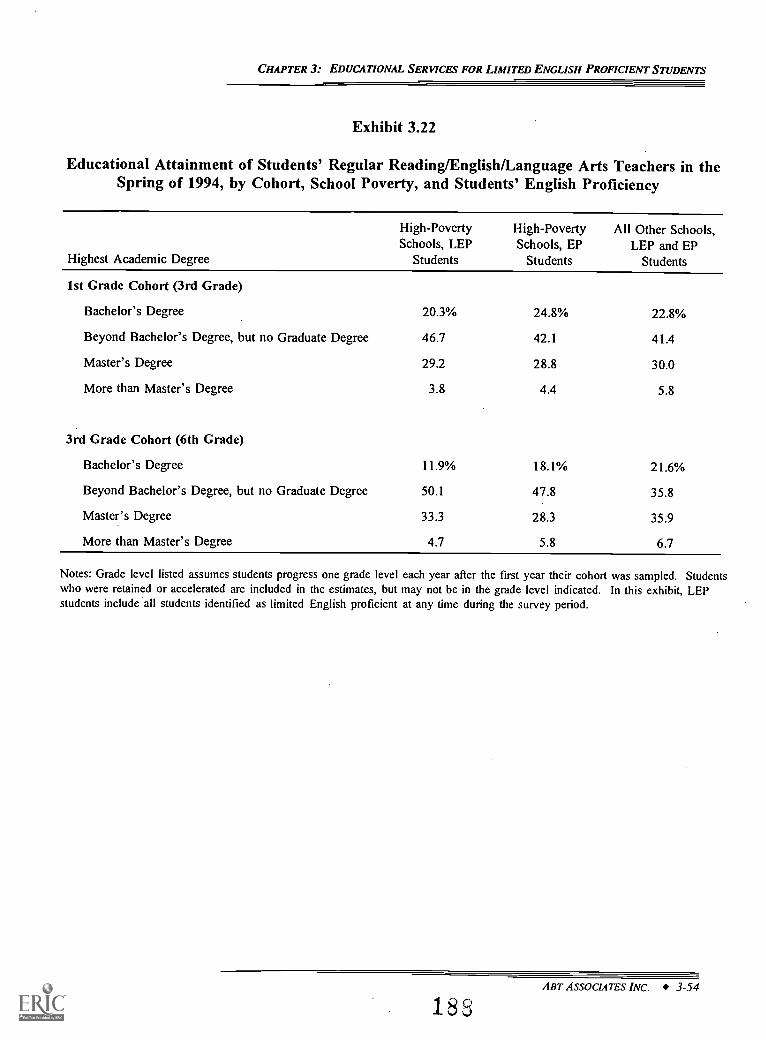
CHAPTER 3: EDUCATIONAL SERVICES FOR LIMITED ENGLISH PROFICIENT STUDENTS
Exhibit 3.22
Educational Attainment of Students' Regular Reading/English/Language Arts Teachers in theSpring of 1994, by Cohort, School Poverty, and Students' English Proficiency
Highest Academic Degree
High-PovertySchools, LEP
Students
High-PovertySchools, EP
Students
All Other Schools,LEP and EP
Students
1st Grade Cohort (3rd Grade)
Bachelor's Degree 20.3% 24.8% 22.8%
Beyond Bachelor's Degree, but no Graduate Degree 46.7 42.1 41.4
Master's Degree 29.2 28.8 30.0
More than Master's Degree 3.8 4.4 5.8
3rd Grade Cohort (6th Grade)
Bachelor's Degree 11.9% 18.1% 21.6%
Beyond Bachelor's Degree, but no Graduate Degree 50.1 47.8 35.8
Master's Degree 33.3 28.3 35.9
More than Master's Degree 4.7 5.8 6.7
Notes: Grade level listed assumes students progress one grade level each year after the first year their cohort was sampled. Studentswho were retained or accelerated are included in the estimates, but may not be in the grade level indicated. In this exhibit, LEPstudents include all students identified as limited English proficient at any time during the survey period.
ART ASSOCL4TES INC. 3-54
188
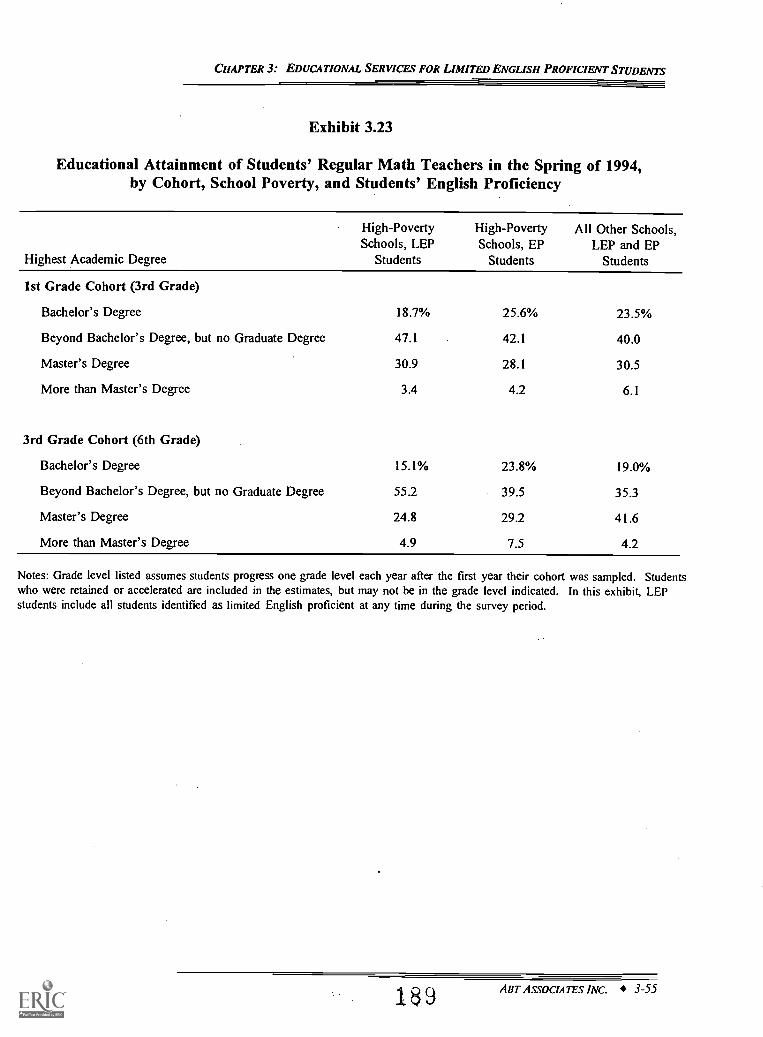
CHAPTER 3: EDUCATIONAL SERVICES FOR LIMITED ENGLISH PROFICIENT STUDENTS
Exhibit 3.23
Educational Attainment of Students' Regular Math Teachers in the Spring of 1994,by Cohort, School Poverty, and Students' English Proficiency
Highest Academic Degree
High-PovertySchools, LEP
Students
High-PovertySchools, EP
Students
All Other Schools,LEP and EP
Students
1st Grade Cohort (3rd Grade)
Bachelor's Degree 18.7% 25.6% 23.5%
Beyond Bachelor's Degree, but no Graduate Degree 47.1 42.1 40.0
Master's Degree 30.9 28.1 30.5
More than Master's Degree 3.4 4.2 6.1
3rd Grade Cohort (6th Grade)
Bachelor's Degree 15.1% 23.8% 19.0%
Beyond Bachelor's Degree, but no Graduate Degree 55.2 39.5 35.3
Master's Degree 24.8 29.2 41.6
More than Master's Degree 4.9 7.5 4.2
Notes: Grade level listed assumes students progress one grade level each year after the first year their cohort was sampled. Studentswho were retained or accelerated are included in the estimates, but may not be in the grade level indicated. In this exhibit, LEPstudents include all students identified as limited English proficient at any time during the survey period.
1.0 ABT ASSOCIATES INC. 3-55
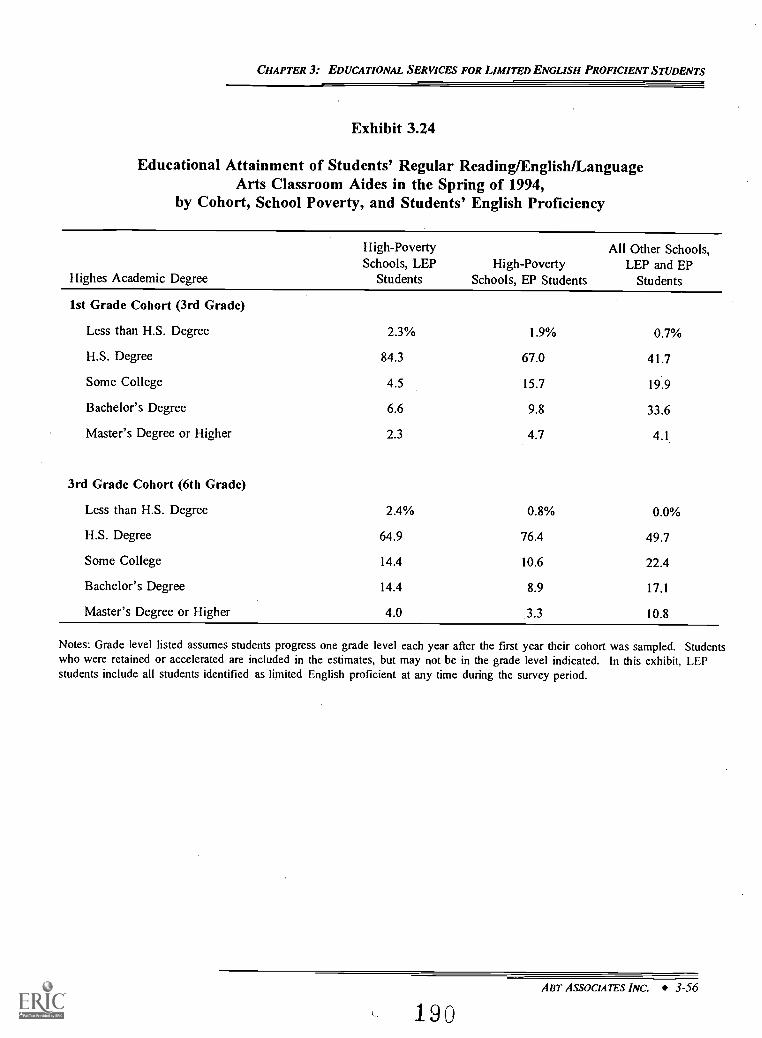
CHAPTER 3: EDUCATIONAL SERVICES FOR LIMITED ENGLISH PROFICIENT STUDENTS
Exhibit 3.24
Educational Attainment of Students' Regular Reading/English/LanguageArts Classroom Aides in the Spring of 1994,
by Cohort, School Poverty, and Students' English Proficiency
Highes Academic Degree
High-PovertySchools, LEP
StudentsHigh-Poverty
Schools, EP Students
All Other Schools,LEP and EP
Students
1st Grade Cohort (3rd Grade)
Less than H.S. Degree 2.3% 1.9% 0.7%
H.S. Degree 84.3 67.0 41.7
Some College 4.5 15.7 19.9
Bachelor's Degree 6.6 9.8 33.6
Master's Degree or Higher 2.3 4.7 4.1
3rd Grade Cohort (6th Grade)
Less than H.S. Degree 2.4% 0.8% 0.0%
H.S. Degree 64.9 76.4 49.7
Some College 14.4 10.6 22.4
Bachelor's Degree 14.4 8.9 17.1
Master's Degree or Higher 4.0 3.3 10.8
Notes: Grade level listed assumes students progress one grade level each year after the first year their cohort was sampled. Studentswho were retained or accelerated are included in the estimates, but may not be in the grade level indicated. In this exhibit, LEPstudents include all students identified as limited English proficient at any time during the survey period.
Au ASSOCIATES INC. 3-56
190
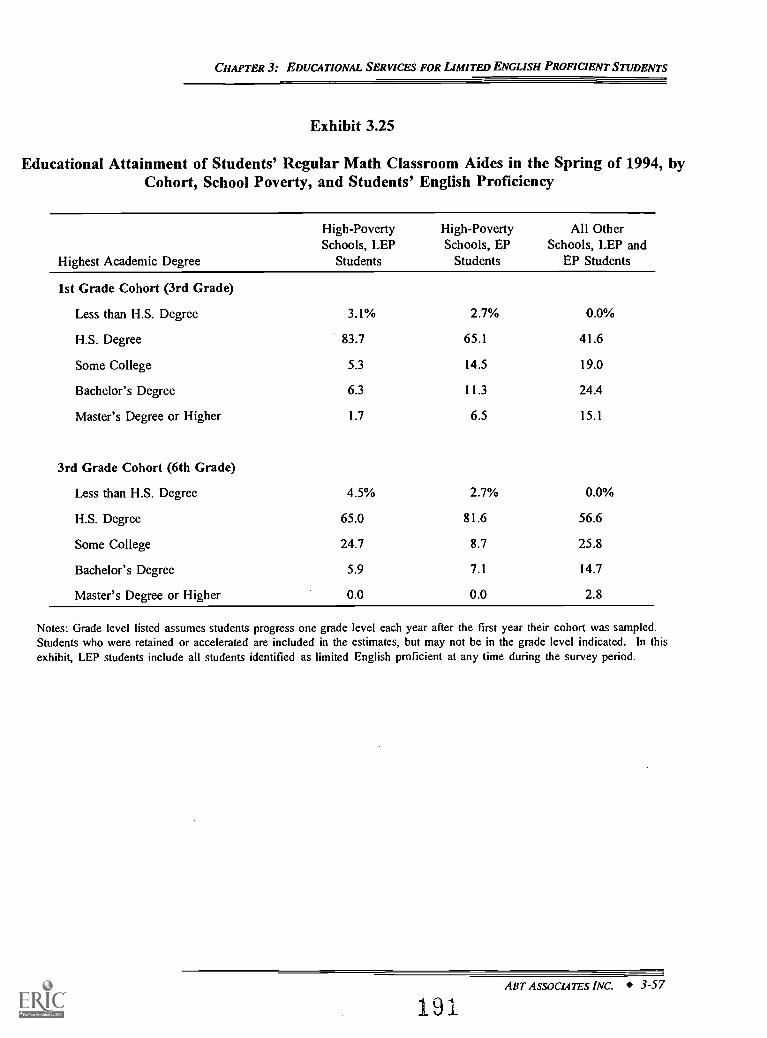
CHAPTER 3: EDUCATIONAL SERVICES FOR LIMITED ENGLISH PROFICIENT STUDENTS
Exhibit 3.25
Educational Attainment of Students' Regular Math Classroom Aides in the Spring of 1994, byCohort, School Poverty, and Students' English Proficiency
Highest Academic Degree
High-PovertySchools, LEP
Students
High-PovertySchools, EP
Students
All OtherSchools, LEP and
EP Students
1st Grade Cohort (3rd Grade)
Less than H.S. Degree 3.1% 2.7% 0.0%
H.S. Degree 83.7 65.1 41.6
Some College 5.3 14.5 19.0
Bachelor's Degree 6.3 11.3 24.4
Master's Degree or Higher 1.7 6.5 15.1
3rd Grade Cohort (6th Grade)
Less than H.S. Degree 4.5% 2.7% 0.0%
H.S. Degree 65.0 81.6 56.6
Some College 24.7 8.7 25.8
Bachelor's Degree 5.9 7.1 14.7
Master's Degree or Higher 0.0 0.0 2.8
Notes: Grade level listed assumes students progress one grade level each year after the first year their cohort was sampled.Students who were retained or accelerated are included in the estimates, but may not be in the grade level indicated. In thisexhibit, LEP students include all students identified as limited English proficient at any time during the survey period.
An' ASSOCIATES INC. 3-57
191
CHAPTER 3: EDUCATIONAL SERVICES FOR LIMITED ENGLISH PROFICIENT STUDENTS
Exhibits 3.26 and 3.27, LEP students in high-poverty schools are consistently, across subject and
cohort, more likely to have teachers with less than 10 years of experience than EP students at
high-poverty schools. A somewhat more tenuous, but noticeable pattern is that LEP students'
teachers are more likely than EP students' teachers to be in their first year of teaching (with the
exception of 6th grade reading).
Are LEP students' teachers as likely as EP students' teachers to have a permanent
standard teaching certification? A final indicator of teacher quality, having a permanent
standard teaching certificate, varies little by students' English proficiency?' Exhibit 3.28 shows
that about 90 percent of teachers meet this minimal training and competency requirement. There
is no substantial difference in the acquisition of permanent teaching certificates between LEP
students' and EP students' teachers for either reading or math teachers.
How does the regular classroom instructional setting for LEP students compare to theregular classroom instructional setting of EP students?
Settings, as well as teachers, can influence instructional results. Here, we compare LEP
and EP students in terms of class size and ability grouping as the primary measures of
instmctional setting.
Are LEP students in smaller or larger classes than EP students? Smaller class sizes
allow the teacher to provide more individual instruction and feedback to each student, and oblige
students to participate more in classroom activities. A recent review of the Tennessee study of
classroom size found that being in classes with fewer than 17 students in the early
elementary grades is correlated with better cognitive outcomes in later grades (Mosteller 1995).
The individual attention and encouragement to participate that smaller classes allow may be
especially important for limited English proficient students.
Exhibit 3.29 (reading/English/language arts) and 3.30 (math) show the average class sizes
and the percent of students attending classes with fewer than 18 students, between 18 and 25
students, and 26 or more students. The most striking finding is that in high-poverty schools, LEP
38 In the Prospects survey, teachers without teaching certificates were not asked whether they were workingtoward a teaching certificate. School administrators were not asked whether the scarcity of certified teachers ledthem to hire uncertified teachers.
ART ASSOCIATES INC. 3-58
192
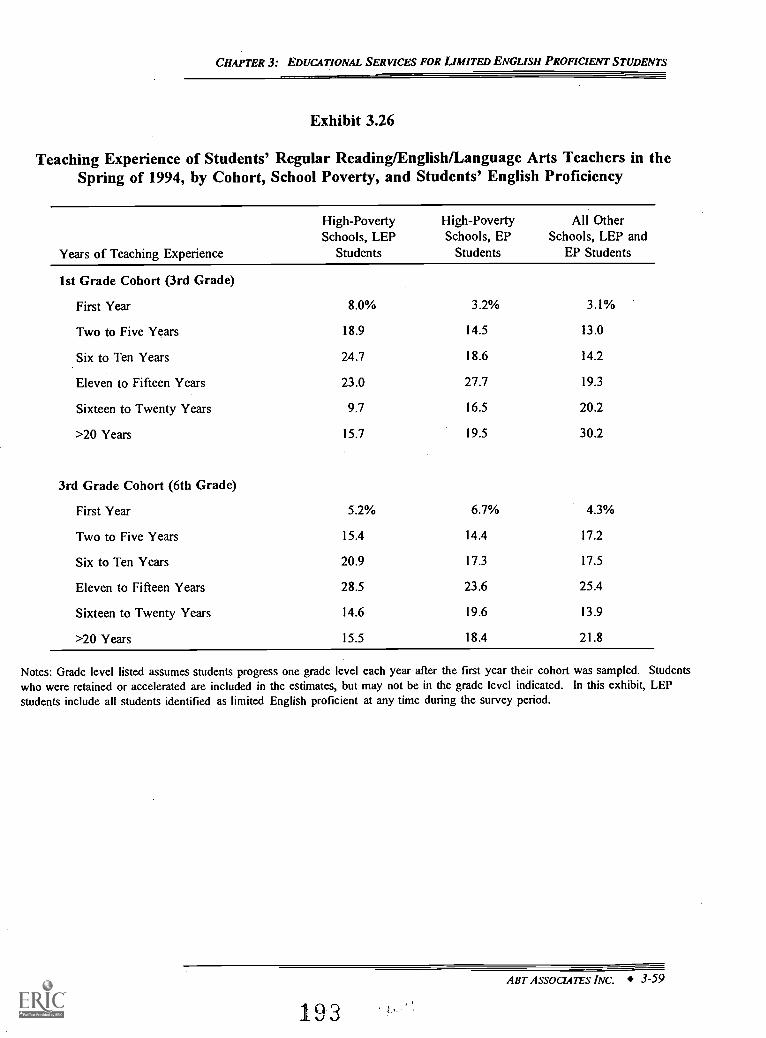
CHAPTER 3: EDUCATIONAL SERVICES FOR LIMITED ENGLISH PROFICIENT STUDENTS
Exhibit 3.26
Teaching Experience of Students' Regular Reading/English/Language Arts Teachers in theSpring of 1994, by Cohort, School Poverty, and Students' English Proficiency
Years of Teaching Experience
High-PovertySchools, LEP
Students
High-PovertySchools, EP
Students
All OtherSchools, LEP and
EP Students
1st Grade Cohort (3rd Grade)
First Year 8.0% 3.2% 3.1%
Two to Five Years 18.9 14.5 13.0
Six to Ten Years 24.7 18.6 14.2
Eleven to Fifteen Years 23.0 27.7 19.3
Sixteen to Twenty Years 9.7 16.5 20.2
>20 Years 15.7 19.5 30.2
3rd Grade Cohort (6th Grade)
First Year 5.2% 6.7% 4.3%
Two to Five Years 15.4 14.4 17.2
Six to Ten Years 20.9 17.3 17.5
Eleven to Fifteen Years 28.5 23.6 25.4
Sixteen to Twenty Years 14.6 19.6 13.9
>20 Years 15.5 18.4 21.8
Notes: Grade level listed assumes students progress one grade level each year after the first year their cohort was sampled. Studentswho were retained or accelerated are included in the estimates, but may not be in the grade level indicated. In this exhibit, LEPstudents include all students identified as limited English proficient at any time during the survey period.
ABT ASSOCIATES INC. 3-59
193
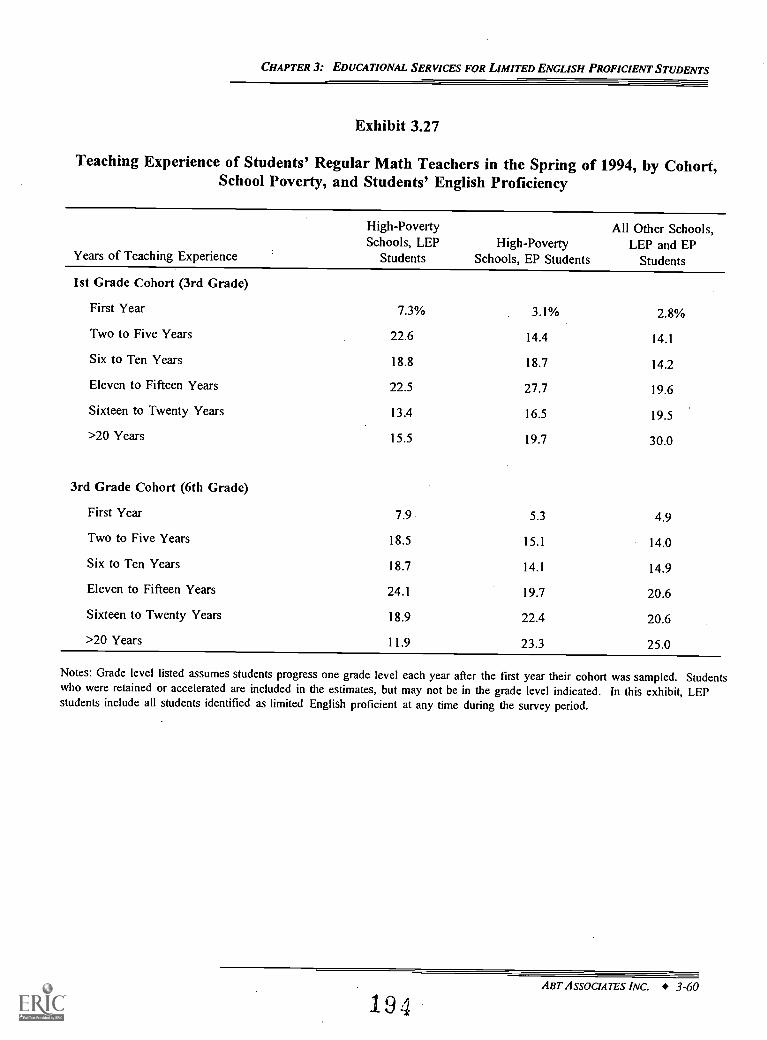
CHAPTER 3: EDUCATIONAL SERVICES FOR LIMITED ENGLISH PROFICIENT STUDENTS
Exhibit 3.27
Teaching Experience of Students' Regular Math Teachers in the Spring of 1994, by Cohort,School Poverty, and Students' English Proficiency
Years of Teaching Experience
High-PovertySchools, LEP
StudentsHigh-Poverty
Schools, EP Students
All Other Schools,LEP and EP
Students
1st Grade Cohort (3rd Grade)
First Year 7.3% 3.1% 2.8%
Two to Five Years 22.6 14.4 14.1
Six to Ten Years 18.8 18.7 14.2
Eleven to Fifteen Years 22.5 27.7 19.6
Sixteen to Twenty Years 13.4 16.5 19.5
>20 Years 15.5 19.7 30.0
3rd Grade Cohort (6th Grade)
First Year 7.9 5.3 4.9
Two to Five Years 18.5 15.1 14.0
Six to Ten Years 18.7 14.1 14.9
Eleven to Fifteen Years 24.1 19.7 20.6
Sixteen to Twenty Years 18.9 22.4 20.6
>20 Years 11.9 23.3 25.0
Notes: Grade level listed assumes students progress one grade level each year after the first year their cohort was sampled. Studentswho were retained or accelerated are included in the estimates, but may not be in the grade level indicated. In this exhibit, LEPstudents include all students identified as limited English proficient at any time during the survey period.
AM' ASSOCIATES INC. 3-60
194
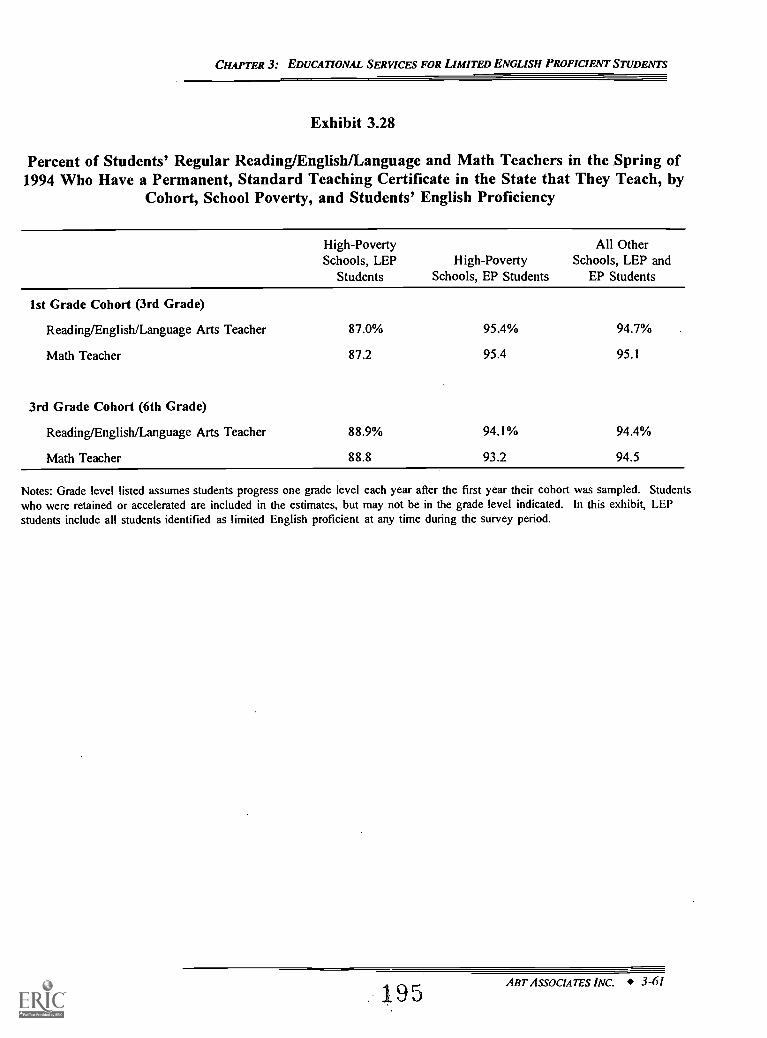
CHAPTER 3: EDUCATIONAL SERVICES FOR LIMITED ENGLISH PROFICIENT STUDENTS
Exhibit 3.28
Percent of Students' Regular Reading/English/Language and Math Teachers in the Spring of1994 Who Have a Permanent, Standard Teaching Certificate in the State that They Teach, by
Cohort, School Poverty, and Students' English Proficiency
High-PovertySchools, LEP
StudentsHigh-Poverty
Schools, EP Students
All OtherSchools, LEP and
EP Students
1st Grade Cohort (3rd Grade)
Reading/English/Language Arts Teacher 87.0% 95.4% 94.7%
Math Teacher 87.2 95.4 95.1
3rd Grade Cohort (6th Grade)
Reading/English/Language Arts Teacher 88.9% 94.1% 94.4%
Math Teacher 88.8 93.2 94.5
Notes: Grade level listed assumes students progress one grade level each year after the first year their cohort was sampled. Studentswho were retained or accelerated are included in the estimates, but may not be in the grade level indicated. In this exhibit, LEPstudents include all students identified as limited English proficient at any time during the survey period.
195ABT ASSOCIATES INC. 3-61
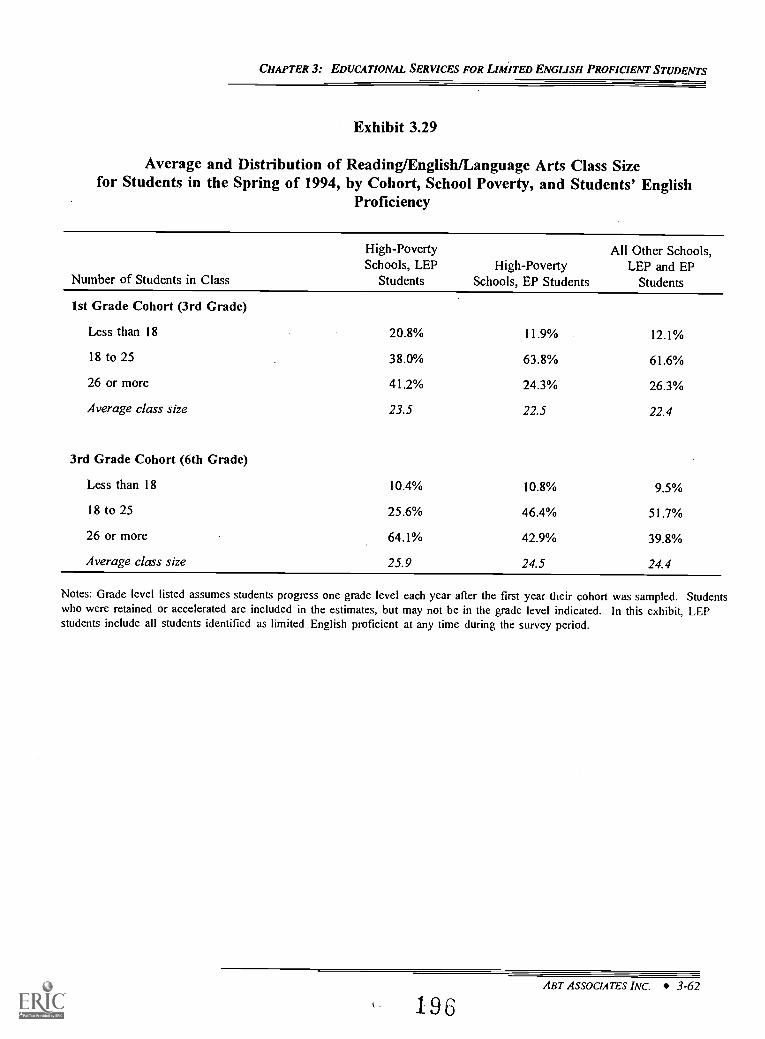
CHAPTER 3: EDUCATIONAL SERVICES FOR LIMITED ENGLISH PROFICIENT STUDENTS
Exhibit 3.29
Average and Distribution of Reading/English/Language Arts Class Sizefor Students in the Spring of 1994, by Cohort, School Poverty, and Students' English
Proficiency
Number of Students in Class
High-PovertySchools, LEP
StudentsHigh-Poverty
Schools, EP Students
All Other Schools,LEP and EP
Students
1st Grade Cohort (3rd Grade)
Less than 18 20.8% 11.9% 12.1%
18 to 25 38.0% 63.8% 61.6%
26 or more 41.2% 24.3% 26.3%
Average class size 23.5 22.5 22.4
3rd Grade Cohort (6th Grade)
Less than 18 10.4% 10.8% 9.5%
18 to 25 25.6% 46.4% 51.7%
26 or more 64.1% 42.9% 39.8%
Average class size 25.9 24.5 24.4
Notes: Grade level listed assumes students progress one grade level each year after the first year their cohort was sampled. Studentswho were retained or accelerated are included in the estimates, but may not be in the grade level indicated. In this exhibit, LEPstudents include all students identified as limited English proficient at any time during the survey period.
ABT ASSOCIATES INC. 3-62
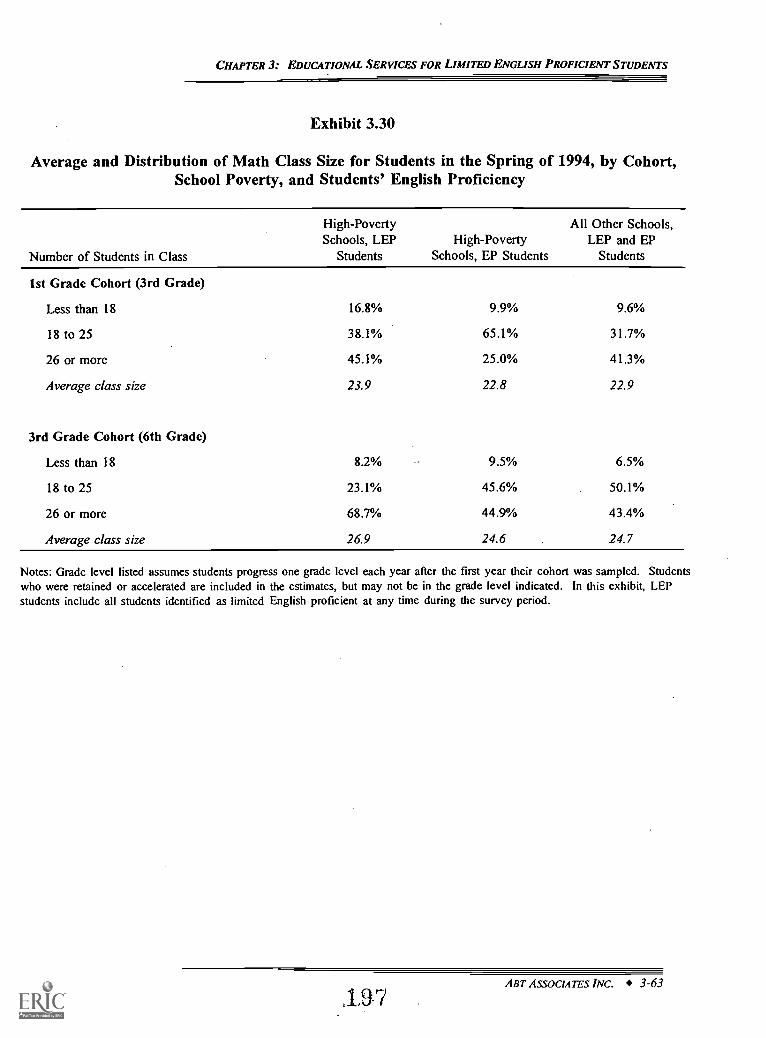
CHAPTER 3: EDUCATIONAL SERVICES FOR LIMITED ENGLISH PROFICIENT STUDENTS
Exhibit 3.30
Average and Distribution of Math Class Size for Students in the Spring of 1994, by Cohort,School Poverty, and Students' English Proficiency
Number of Students in Class
High-PovertySchools, LEP
StudentsHigh-Poverty
Schools, EP Students
All Other Schools,LEP and EP
Students
1st Grade Cohort (3rd Grade)
Less than 18 16.8% 9.9% 9.6%
18 to 25 38.1% 65.1% 31.7%
26 or more 45.1% 25.0% 41.3%
Average class size 23.9 22.8 22.9
3rd Grade Cohort (6th Grade)
Less than 18 8.2% 9.5% 6.5%
18 to 25 23.1% 45.6% 50.1%
26 or more 68.7% 44.9% 43.4%
Average class size 26.9 24.6 24.7
Notes: Grade level listed assumes students progress one grade level each year after the first year their cohort was sampled. Studentswho were retained or accelerated are included in the estimates, but may not be in the grade level indicated. In this exhibit, LEPstudents include all students identified as limited English proficient at any time during the survey period.
ABT ASSOCIATES INC. 3-63
127
CHAPTER 3: EDUCATIONAL SERVICES FOR LIMITED ENGLISH PROFICIENT STUDENTS
students are one and a half times more likely than EP students to be in the largest classes, despite
the special needs of low- income limited English proficient students. In 3rd grade (1st grade
cohort in 1994), over two-fifths of LEP students attended English and math classes with more
than 26 students whereas only one-fourth of EP students were in classes that large. The estimates
for 6th graders (3rd grade cohort in 1994) are equally striking: two-thirds of LEP students are
in the largest classes, but less than half of the EP students are in classes that large. Surprisingly
and more encouraging, LEP students in the 1st grade cohort are also almost twice as likely to be
in classes with fewer than 18 students, classroom sizes the Mosteller study found to be associated
with better cognitive outcomes in later grades. EP students in the 3rd grade cohort are as likely
as LEP students to be in classes with fewer than 18 students.
Are LEP students more likely than EP students to be enrolled in classes based on
ability? Grouping students in classes based on abilitywhile beneficial for other reasonsmaybe a detriment to low-achieving students to the extent that it results in lower academic
expectations and stigmatizes low-achieving students. On the other hand, grouping students based
on ability may stimulate higher-ability students, provide all students with instruction appropriately
targeted for their ability level, and keep lower-ability students from becoming discouraged. In
some cases, short term grouping by ability or pullout instruction (such as Reading Recovery) may
also be an effective option to bring students up to speed in subjects they would have a hard time
catching up on in a regular setting.
Students' regular math and reading teachers were asked if students were enrolled in their
class based on ability. Their responses are summarized in Exhibit 3.31. LEP students in high-
poverty schools were more likely than EP students in high-poverty schools to be in
reading/English/language art classes that enrolled students based on ability. In 3rd grade, LEP
students were grouped by ability in their reading classes 34 percent of the time, while EP students
were grouped by ability 24 percent of the time. A similar pattern holds for 3rd grade math
classes, where 26 percent of LEP students and 17 percent of EP students were enrolled in classes
based on ability.
For the 3rd grade cohort, the likelihood of being grouped by ability in the 6th grade is
similar for EP and LEP students in high-poverty schools.
19 3ABT ASSOCIATES INC. 3-64
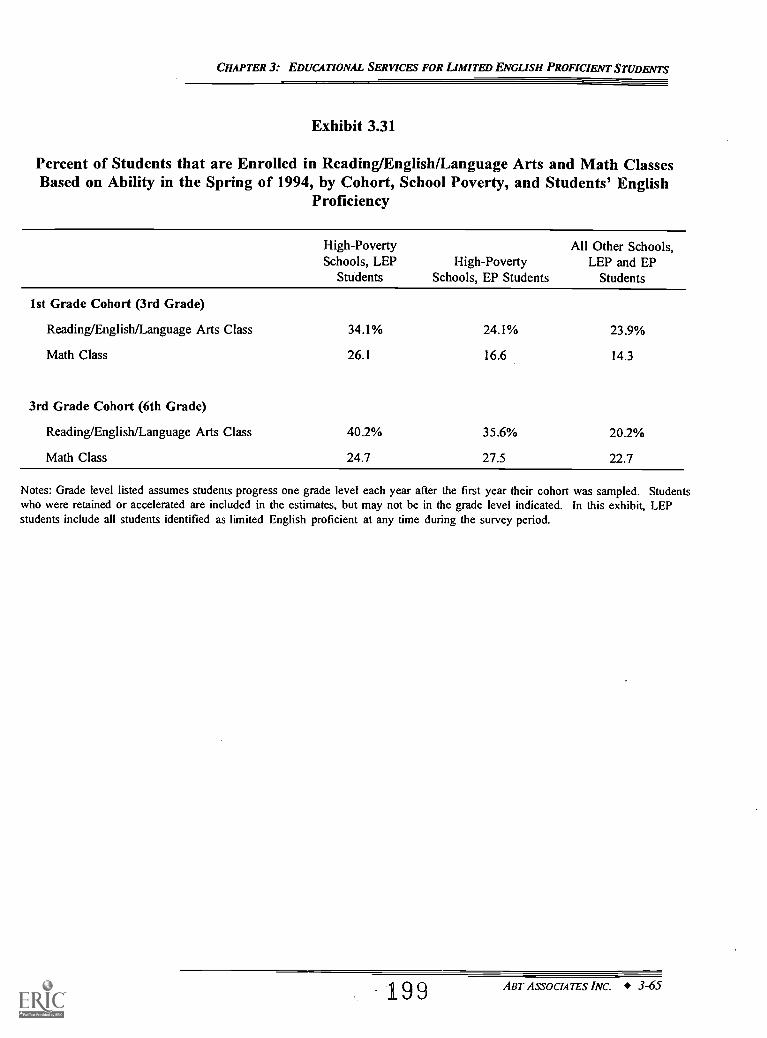
CHAPTER 3: EDUCATIONAL SERVICES FOR LIMITED ENGLISH PROFICIENT STUDENTS
Exhibit 3.31
Percent of Students that are Enrolled in Reading/English/Language Arts and Math ClassesBased on Ability in the Spring of 1994, by Cohort, School Poverty, and Students' English
Proficiency
High-PovertySchools, LEP
StudentsHigh-Poverty
Schools, EP Students
All Other Schools,LEP and EP
Students
1st Grade Cohort (3rd Grade)
Reading/English/Language Arts Class 34.1% 24.1% 23.9%
Math Class 26.1 16.6 14.3
3rd Grade Cohort (6th Grade)
Reading/English/Language Arts Class 40.2% 35.6% 20.2%
Math Class 24.7 27.5 22.7
Notes: Grade level listed assumes students progress one grade level each year after the first year their cohort was sampled. Studentswho were retained or accelerated are included in the estimates, but may not be in the grade level indicated. In this exhibit, LEPstudents include all students identified as limited English proficient at any time during the survey period.
199 ABT ASSOCIATES INC. 3-65
CHAPTER 3: EDUCATIONAL SERVICES FOR LIMITED ENGLISH PROFICIENT STUDENTS
Do LEP students have the same access to material resources as EP students in theregular reading/English/language arts and math classrooms?
A final indicator of instructional quality concerns access to physical resources, such as
instructional materials and computers.
Do students' regular teachers believe that they have sufficient materials to meet their
students' instructional needs? The regular math and reading teachers of all students in the
Prospects survey were asked whether they believed they had sufficient instructional materials to
meet most students' instructional needs. Their responses are summarized in Exhibit 3.32. In
high-poverty schools, both LEP and EP students' teachers are equally likely to report that they
do not have sufficient materials for instruction: around one-fourth report insufficient materials.
Students in higher income schools (i.e., all other students) are a little better off; only 15 percent
of their teachers report that they do not have sufficient instructional materials to meet most of
their students' needs.
Are there differences between LEP and EP students in the availability of computers
for instructional purposes? Computers and related instructional materials are a costly
investment for schools, but computers have become a vital educational tool. Introducing
computers to students at a young age, and utilizing computer programs as teaching tools is
important in its own right, but also may be a general indicator of the quality of physical resources
available to students in the classroom.
We examined several measures of the availability of computers in the students' regular
reading and math classes: teachers' reports on whether sufficient computers and computer
software are available for instruction, and the number of computers available to the class. These
measures are reported in Exhibit 3.33 (reading/English/language arts) and Exhibit 3.34 (math).
Taken together, all of these measures indicate that in high-poverty schools LEP students have
slightly but uniformly better access to computers than EP students. For example, 6th grade LEP
students are in classrooms with access to an average of 8.5 computers for both reading and math
while EP students have access to an average of only 6.9 computers per class for reading and 6.3
computers for math. The modestly larger class sizes attended by LEP students in high-poverly
schools (shown earlier in Exhibits 3.29 and 3.30) offset some of the advantage of having more
computers available per class. These results on the availability of computers are also an
<? 0ART ASSOCIATES INC. 3-66
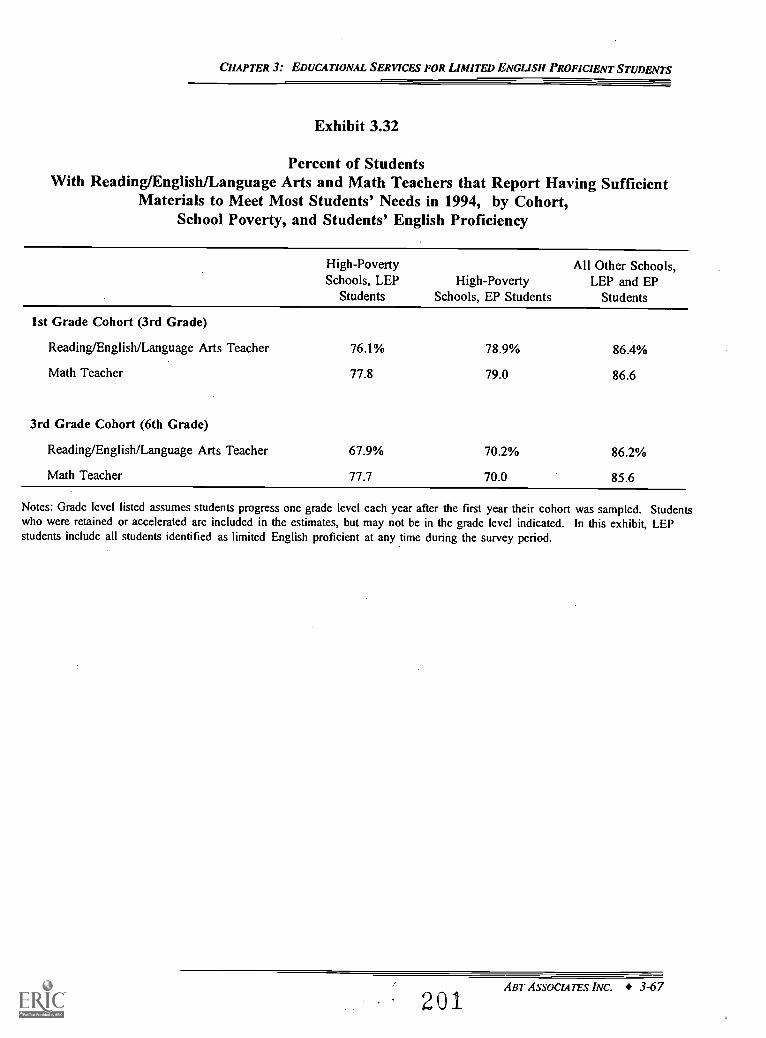
CHAPTER 3: EDUCATIONAL SERVICES FOR LIMITED ENGLISH PROFICIENT STUDENTS
Exhibit 3.32
Percent of StudentsWith Reading/English/Language Arts and Math Teachers that Report Having Sufficient
Materials to Meet Most Students' Needs in 1994, by Cohort,School Poverty, and Students' English Proficiency
High-PovertySchools, LEP
StudentsHigh-Poverty
Schools, EP Students
All Other Schools,LEP and EP
Students
1st Grade Cohort (3rd Grade)
Reading/English/Language Arts Teacher 76.1% 78.9% 86.4%
Math Teacher 77.8 79.0 86.6
3rd Grade Cohort (6th Grade)
Reading/English/Language Arts Teacher 67.9% 70.2% 86.2%
Math Teacher 77.7 70.0 85.6
Notes: Grade level listed assumes students progress one grade level each year after the first year their cohort was sampled. Studentswho were retained or accelerated are included in the estimates, but may not be in the grade level indicated. In this exhibit, LEPstudents include all students identified as limited English proficient at any time during the survey period.
ABT ASSOCIATES INC. 3-67
201
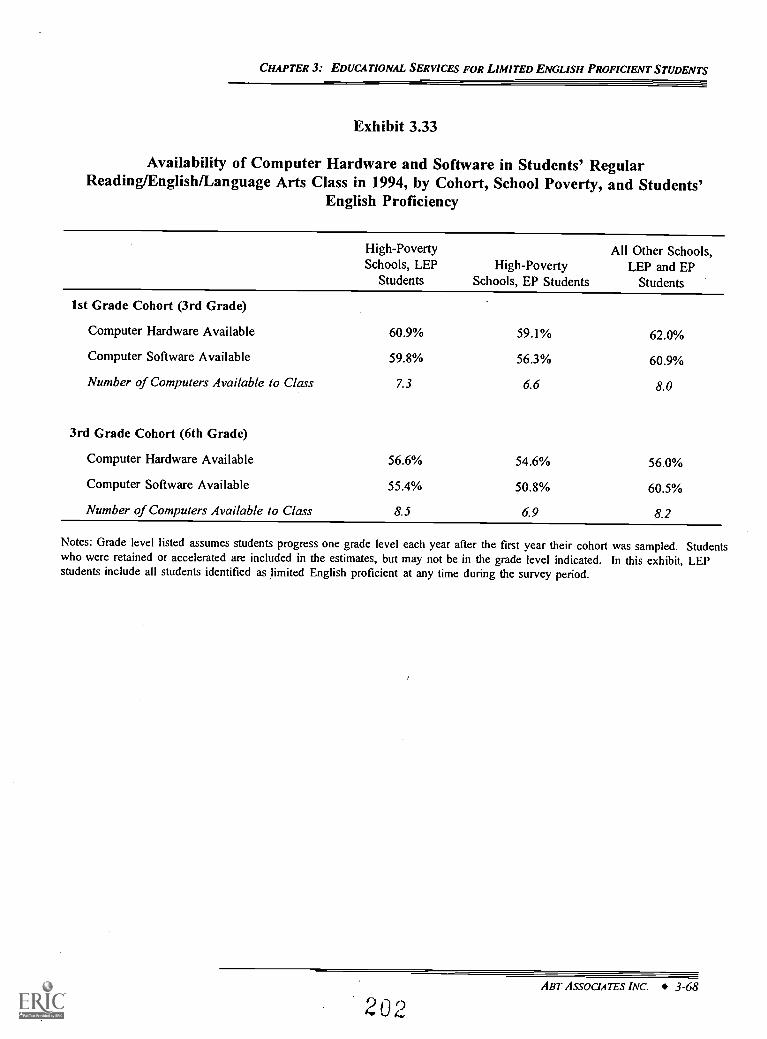
CHAPTER 3: EDUCATIONAL SERVICES FOR LIMITED ENGLISH PROFICIENT STUDENTS
Exhibit 3.33
Availability of Computer Hardware and Software in Students' RegularReading/English/Language Arts Class in 1994, by Cohort, School Poverty, and Students'
English Proficiency
High-PovertySchools, LEP
StudentsHigh-Poverty
Schools, EP Students
All Other Schools,LEP and EP
Students
1st Grade Cohort (3rd Grade)
Computer Hardware Available 60.9% 59.1% 62.0%
Computer Software Available 59.8% 56.3% 60.9%
Number of Computers Available to Class 7.3 6.6 8.0
3rd Grade Cohort (6th Grade)
Computer Hardware Available 56.6% 54.6% 56.0%
Computer Software Available 55.4% 50.8% 60.5%
Number of Computers Available to Class 8.5 6.9 8.2
Notes: Grade level listed assumes students progress one grade level each year after the first year their cohort was sampled. Studentswho were retained or accelerated are included in the estimates, but may not be in the grade level indicated. In this exhibit, LEPstudents include all students identified as limited English proficient at any time during the survey period.
ABT ASSOCIATES INC. 3-68
202
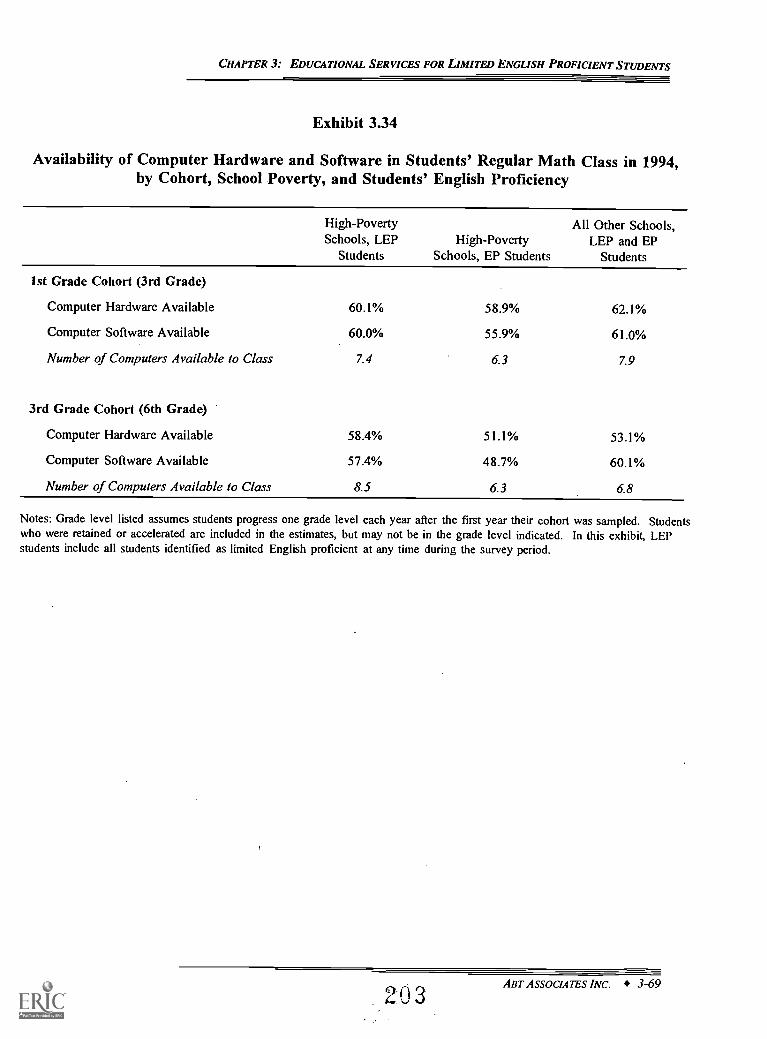
CHAPTER 3: EDUCATIONAL SERVICES FOR LIMITED ENGLISH PROFICIENT STUDENTS
Exhibit 3.34
Availability of Computer Hardware and Software in Students' Regular Math Class in 1994,by Cohort, School Poverty, and Students' English Proficiency
High-PovertySchools, LEP
StudentsHigh-Poverty
Schools, EP Students
All Other Schools,LEP and EP
Students
1st Grade Cohort (3rd Grade)
Computer Hardware Available 60.1% 58.9% 62.1%
Computer Software Available 60.0% 55.9% 61.0%
Number of Computers Available to Class 7.4 6.3 7.9
3rd Grade Cohort (6th Grade)
Computer Hardware Available 58.4% 51.1% 53.1%
Computer Software Available 57.4% 48.7% 60.1%
Number of Computers Available to Class 8.5 6.3 6.8
Notes: Grade level listed assumes students progress one grade level each year after the first year their cohort was sampled. Studentswho were retained or accelerated are included in the estimates, but may not be in the grade level indicated. In this exhibit, LEPstudents include all students identified as limited English proficient at any time during the survey period.
203ART ASSOCIATES INC. 3-69
CHAPTER 3: EDUCATIONAL SERVICES FOR LIMITED ENGLISH PROFICIENT STUDENTS
incomplete story, because they say nothing about either the quality of computers in these
classrooms, or even more importantly about how the computers are used in instruction.
Computers can be used as expensive flash cards for drill purposes or more efficiently for
interactive programs in cognitively demanding subjects such as writing, math or science. The
way computers are used for instruction is a critical element in assessing whether LEP students
are benefitting as much as their EP peers from the availability of computers, but this information
is not available in our data.
Do LEP STUDENTS RECEIVE THE SAME INSTRUCTIONAL CONTENT AS EP STUDENTS?
Because of the need to become proficient in English at the same time they are learning
subject content, limited English proficient students may receive a watered-down version of the
curriculum relative to their EP peers. This raises the risk that, in terms of content, LEP students
may progress through school at a slower pace than their EP peers. To address this issue, we
compare the instructional content of LEP students' classes to those of EP students in this final
section of the Chapter.
Do the regular reading/English/language arts teachers of LEP students emphasize the
same skills as teachers of EP students? Factor analysis was undertaken to help bundle the
multitude of skills a reading/English/language arts teacher might emphasize into a more
manageable, and meaningful, grouping of primary skills emphasized in instruction. (See
Appendix E for a description of factor analysis methods and results.) This analysis, using
teachers responses on the degree to which they emphasize 25 different skills, was done separately
for teachers of 1st grade cohort students (in 3rd grade) and 3rd grade cohort students (in
6th grade) to reflect differences in developmentally appropriate skills at each grade level.
Our analysis indicates that the instructional emphasis of the regular
reading/English/language arts teachers can be broken down into five factors. Composite scores
were formed for each of these factors by averaging the teacher's response to the amount of
emphasis he or she gives to the skills associated with each factor. These composite scores
indicate how much emphasis is placed on certain reading and writing skills taught by teachers
in their classrooms. The Remedial-Typical composite score measures the emphasis on basic
ABT ASSOCIATES INC. 3-70
204
CHAPTER 3: EDUCATIONAL SERVICES FOR LIMITED ENGLISH PROFICIENT STUDENTS
reading skills, such as reading readiness, word analysis, and vocabulary, as well as listening skills
and following directions. The Application composite is an indicator of the level of emphasis on
functional applications, such as learning note-taking skills, study skills, or life skills. The Writing
Attitudes-Skills score measures emphasis placed on basic writing skills, grammar, and spelling in
addition to developing students' confidence and appreciation for writing. The Communication-
Integration score indicates the emphasis on communication skills such as oral communication,
reading aloud, and creative projects such as plays or skits. This factor also indicates an emphasis
on integrating reading and writing projects, such as having students write about literature and
integrating reading into other areas of the curriculum. Finally, the Reading Comprehension factor
indicates a teacher's emphasis on students' comprehension of facts and details from their reading,
as well as their ability to draw inferences and separate fact from opinion.
Exhibits 3.35 to 3.39 compare these five factors between LEP and EP students in high-
poverty schools. They show that, in general, the instructional emphases of regular
reading/English/language arts classroom teachers of LEP and EP students are very similar. For
3rd grade students in high-poverty schools, the only substantial differences are that teachers of
LEP students are more likely to place moderate rather than major emphasis on skills embodied
in the Remedial-Typical and Reading Comprehension factors. The Remedial-Typical factor is
composed of basic skills needed for reading and writing in the English language, while the
Reading Comprehension factor is composed of advanced skills in understanding written materials.
The lesser emphasis that LEP students' teachers put on these skills in the 3rd grade relative to
EP students' teachers may be an indication that LEP teachers do not think their students are ready
for these normally grade-level appropriate skills. The related finding that 6th grade LEP teachers
are slightly more likely than EP students' teachers to emphasize these skills supports the
interpretation that LEP students trail their EP peers in their readiness to be taught these skills in
3rd grade.
Teachers of LEP and EP students in the 6th grade also emphasize similar skills in their
instruction. The main differences are that LEP students' teachers are more likely to put major
emphasis on the skills embodied in the Writing-Attitude factor and the Communication-
Integration skills factor than EP students' teachers. Both of these factors contain writing
proficiency skills. Hence their emphasis by LEP students' teachers in the 6th grade may indicate
205L
ABT ASSOCIATES INC. 3-71
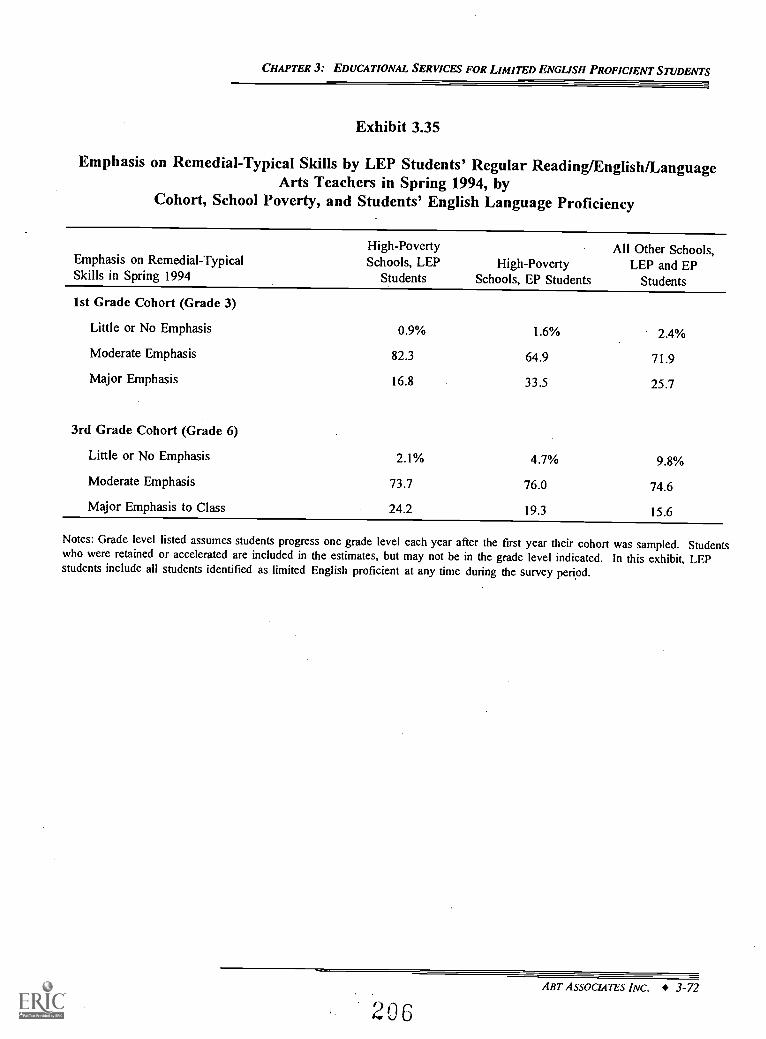
CHAPTER 3: EDUCATIONAL SERVICES FOR LIMITED ENGLISH PROFICIENT STUDENTS
Exhibit 3.35
Emphasis on Remedial-Typical Skills by LEP Students' Regular Reading/English/LanguageArts Teachers in Spring 1994, by
Cohort, School Poverty, and Students' English Language Proficiency
Emphasis on Remedial-TypicalSkills in Spring 1994
High-PovertySchools, LEP
StudentsHigh-Poverty
Schools, EP Students
All Other Schools,LEP and EP
Students
1st Grade Cohort (Grade 3)
Little or No Emphasis 0.9% 1.6% 2.4%
Moderate Emphasis 82.3 64.9 71.9
Major Emphasis 16.8 33.5 25.7
3rd Grade Cohort (Grade 6)
Little or No Emphasis 2.1% 4.7% 9.8%
Moderate Emphasis 73.7 76.0 74.6
Major Emphasis to Class 24.2 19.3 15.6
Notes: Grade level listed assumes students progress one grade level each year after the first year their cohort was sampled. Studentswho were retained or accelerated are included in the estimates, but may not be in the grade level indicated. In this exhibit, LEPstudents include all students identified as limited English proficient at any time during the survey period.
ABT ASSOCIATES INC. 3-72
206
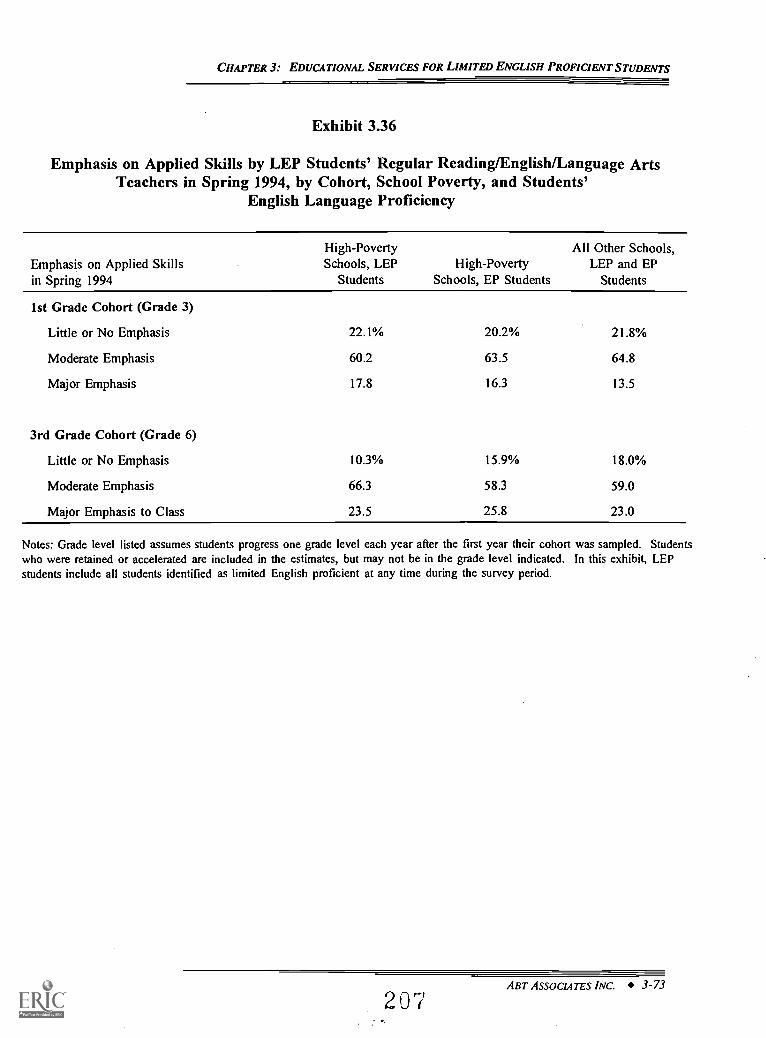
CHAPTER 3: EDUCATIONAL SERVICES FOR LIMITED ENGLISH PROFICIENT STUDENTS
Exhibit 3.36
Emphasis on Applied Skills by LEP Students' Regular Reading/English/Language ArtsTeachers in Spring 1994, by Cohort, School Poverty, and Students'
English Language Proficiency
Emphasis on Applied Skillsin Spring 1994
High-PovertySchools, LEP
StudentsHigh-Poverty
Schools, EP Students
All Other Schools,LEP and EP
Students
1st Grade Cohort (Grade 3)
Little or No Emphasis 22.1% 20.2% 21.8%
Moderate Emphasis 60.2 63.5 64.8
Major Emphasis 17.8 16.3 13.5
3rd Grade Cohort (Grade 6)
Little or No Emphasis 10.3% 15.9% 18.0%
Moderate Emphasis 66.3 58.3 59.0
Major Emphasis to Class 23.5 25.8 23.0
Notes: Grade level listed assumes students progress one grade level each year after the first year their cohort was sampled. Studentswho were retained or accelerated are included in the estimates, but may not be in the grade level indicated. In this exhibit, LEPstudents include all students identified as limited English proficient at any time during the survey period.
ABT ASSOCIATES INC. 3-73
207
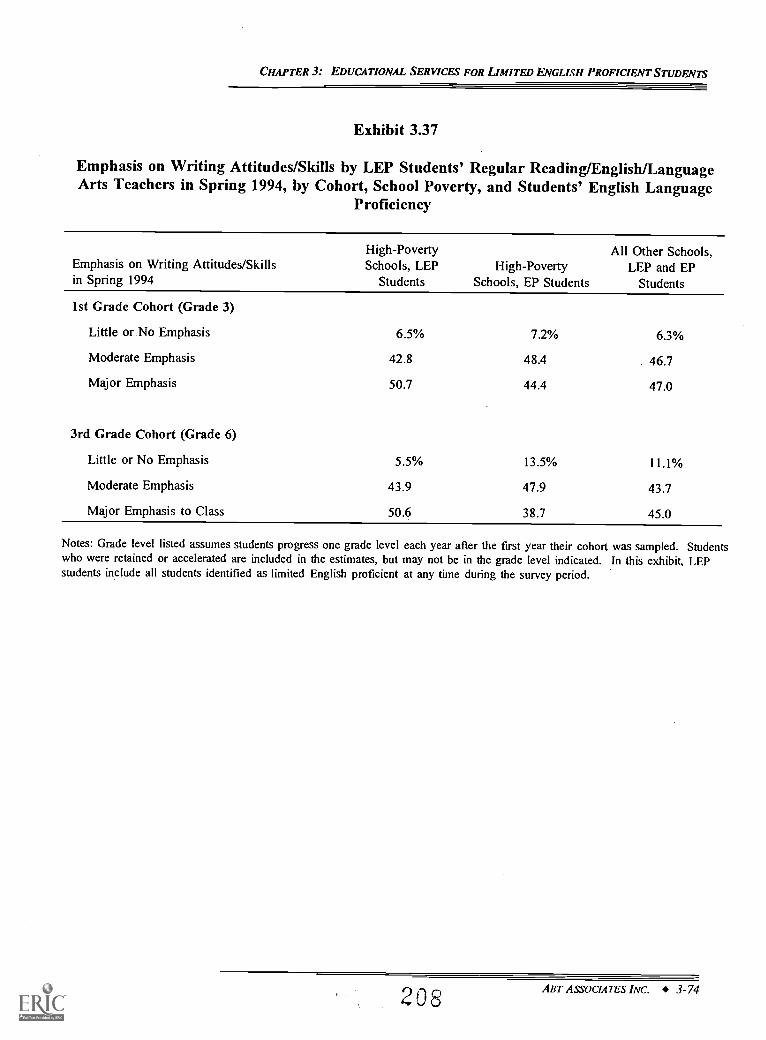
CHAPTER 3: EDUCATIONAL SERVICES FOR LIMITED ENGLISH PROFICIENT STUDENTS
Exhibit 3.37
Emphasis on Writing Attitudes/Skills by LEP Students' Regular Reading/English/LanguageArts Teachers in Spring 1994, by Cohort, School Poverty, and Students' English Language
Proficiency
Emphasis on Writing Attitudes/Skillsin Spring 1994
High-PovertySchools, LEP
StudentsHigh-Poverty
Schools, EP Students
All Other Schools,LEP and EP
Students
1st Grade Cohort (Grade 3)
Little or No Emphasis 6.5% 7.2% 6.3%
Moderate Emphasis 42.8 48.4 46.7
Major Emphasis 50.7 44.4 47.0
3rd Grade Cohort (Grade 6)
Little or No Emphasis 5.5% 13.5% 11.1%
Moderate Emphasis 43.9 47.9 433
Major Emphasis to Class 50.6 38.7 45.0
Notes: Grade level listed assumes students progress one grade level each year after the first year their cohort was sampled. Studentswho were retained or accelerated are included in the estimates, but may not be in the grade level indicated. In this exhibit, LEPstudents include all students identified as limited English proficient at any time during the survey period.
208 ABT ASSOCIATES INC. 3-74
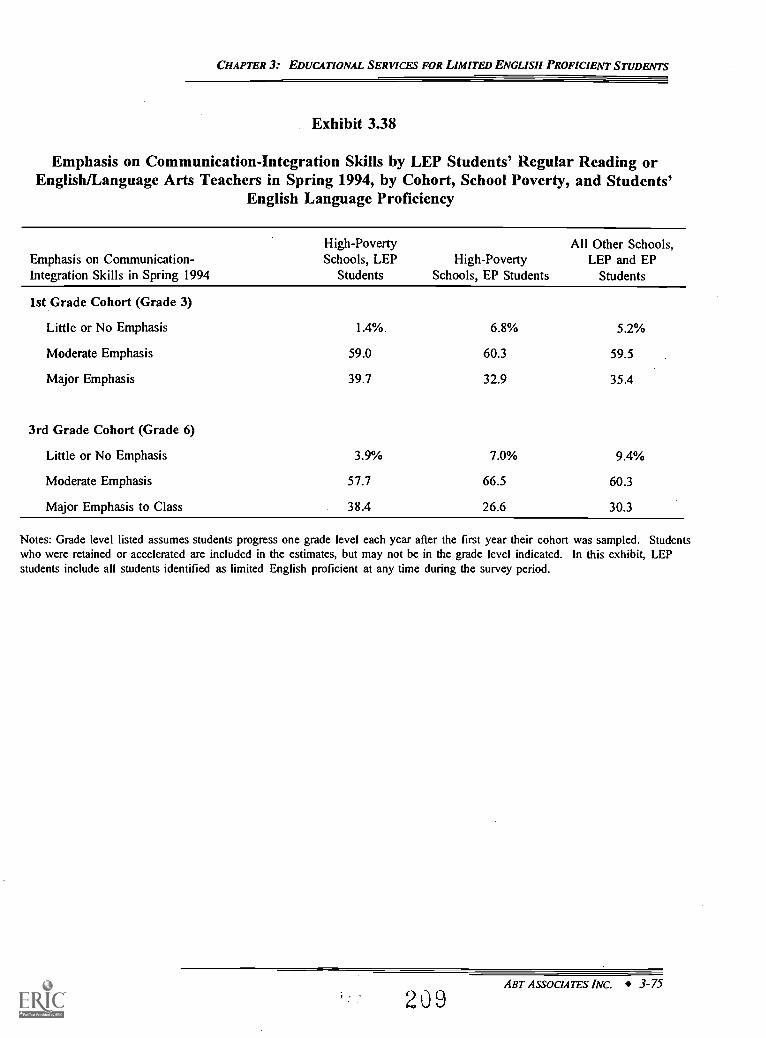
CHAPTER 3: EDUCATIONAL SERVICES FOR LIMITED ENGLISH PROFICIENT STUDENTS
Exhibit 3.38
Emphasis on Communication-Integration Skills by LEP Students' Regular Reading orEnglish/Language Arts Teachers in Spring 1994, by Cohort, School Poverty, and Students'
English Language Proficiency
Emphasis on Communication-Integration Skills in Spring 1994
High-PovertySchools, LEP
StudentsHigh-Poverty
Schools, EP Students
All Other Schools,LEP and EP
Students
1st Grade Cohort (Grade 3)
Little or No Emphasis 1.4% 6.8% 5.2%
Moderate Emphasis 59.0 60.3 59.5
Major Emphasis 39.7 32.9 35.4
3rd Grade Cohort (Grade 6)
Little or No Emphasis 3.9% 7.0% 9.4%
Moderate Emphasis 57.7 66.5 60.3
Major Emphasis to Class 38.4 26.6 30.3
Notes: Grade level listed assumes students progress one grade level each year after the first year their cohort was sampled. Studentswho were retained or accelerated are included in the estimates, but may not be in the grade level indicated. In this exhibit, LEPstudents include all students identified as limited English proficient at any time during the survey period.
ABT ASSOCIATES INC. 3-75
209
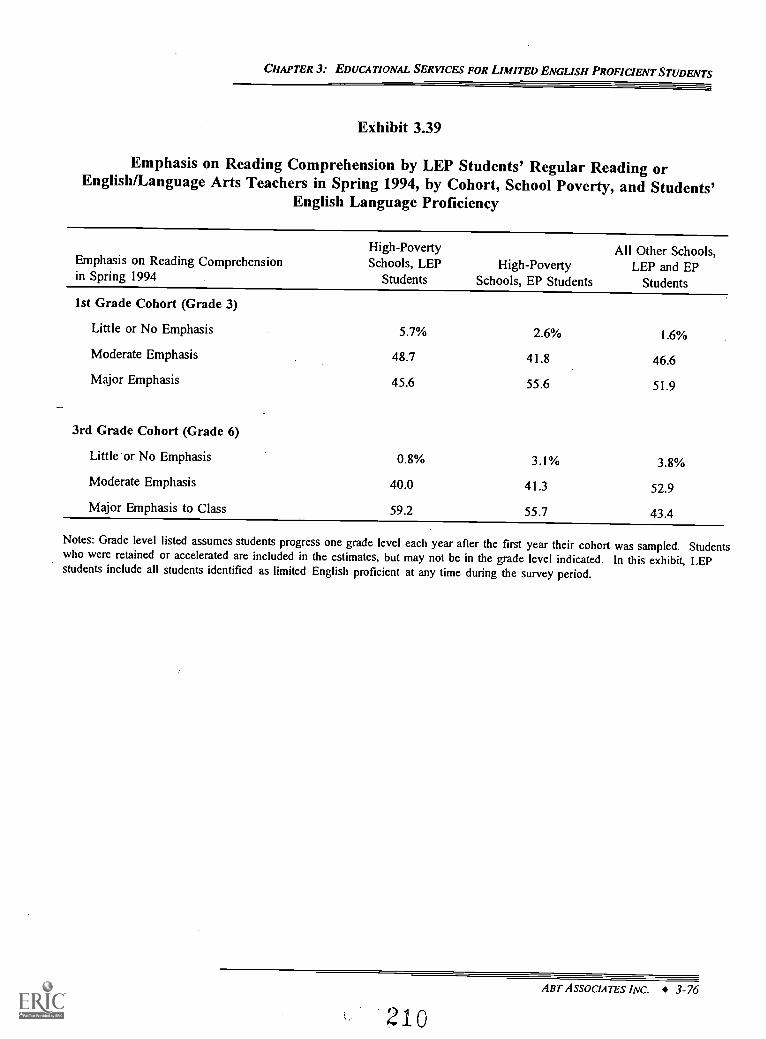
CHAPTER 3: EDUCATIONAL SERVICES FOR LIMITED ENGLISH PROFICIENT STUDENTS
Exhibit 3.39
Emphasis on Reading Comprehension by LEP Students' Regular Reading orEnglish/Language Arts Teachers in Spring 1994, by Cohort, School Poverty, and Students'
English Language Proficiency
Emphasis on Reading Comprehensionin Spring 1994
High-PovertySchools, LEP
StudentsHigh-Poverty
Schools, EP Students
All Other Schools,LEP and EP
Students
1st Grade Cohort (Grade 3)
Little or No Emphasis 5.7% 2.6% 1.6%
Moderate Emphasis 48.7 41.8 46.6
Major Emphasis 45.6 55.6 51.9
3rd Grade Cohort (Grade 6)
Little or No Emphasis 0.8% 3.1% 3.8%
Moderate Emphasis 40.0 41.3 52.9
Major Emphasis to Class 59.2 55.7 43.4
Notes: Grade level listed assumes students progress one grade level each year after the first year their cohort was sampled. Studentswho were retained or accelerated are included in the estimates, but may not be in the grade level indicated. In this exhibit, LEPstudents include all students identified as limited English proficient at any time during the survey period.
ART ASSOCIATES INC. 3-76
210
CHAPTER 3: EDUCATIONAL SERVICES FOR LIMITED ENGLISH PROFICIENT STUDENTS
that LEP students trail their EP peers in written communication skills at this point, the most
difficult communication skill in elementary school.
Do regular math teachers of LEP students emphasize the same skills as teachers of
EP students? Using the same procedures described above for instructional emphasis in
reading/English/language arts, composite scores were created to summarize the primary skills
emphasized in regular math classes in the spring of 1994. Factor analysis shows the instructional
emphasis of math teachers can be broken down into four primary factors.39 (See Appendix E
for details on the results of the factor analysis.) These composite scores indicate how much
emphasis is put on certain math skills taught by teachers in their classrooms. The Math Attitudes
score indicates a teacher's emphasis on students developing an appreciation and confidence in
their abilities to do math and to make math enjoyable and applicable to life. The Remedial-
Typical score is an indicator of the focus on basic math skills, such as an emphasis on learning
basic facts and concepts, whole numbers, fractions, and measurement. The Advanced Math score
measures the exposure provided to more advanced math instruction such as geometry, algebra,
trigonometry, or statistics. Higher-Order Thinking includes an emphasis on reasoning, analytic
skills and problem solving.
Exhibits 3.40 to 3.43 compare these composite scores between LEP and EP students in
high-poverty schools. They show that, in general, the teachers of EP and LEP students
emphasize similar skills in both the 3rd and 6th grades. Some differences do arise, however.
EP students' math teachers in 3rd and 6th grade report major emphasis on Remedial-Typical
skills more often than LEP students' teachers. In the 3rd grade, this difference in major emphasis
is reflected in a higher proportion of LEP students' teachers reporting moderate emphasis and
little or no emphasis relative to EP students' teachers. In contrast, LEP students' teachers in the
6th grade are less likely to report little or no emphasis than EP students' teachers, but much more
likely to report moderate emphasis.
For 3rd graders in 1994, the model did not fit well for the fourth factor, math attitudes; hence, only threefactors are included for 3rd graders in this report.
ABT ASSOCIATES INC. 3-77
211
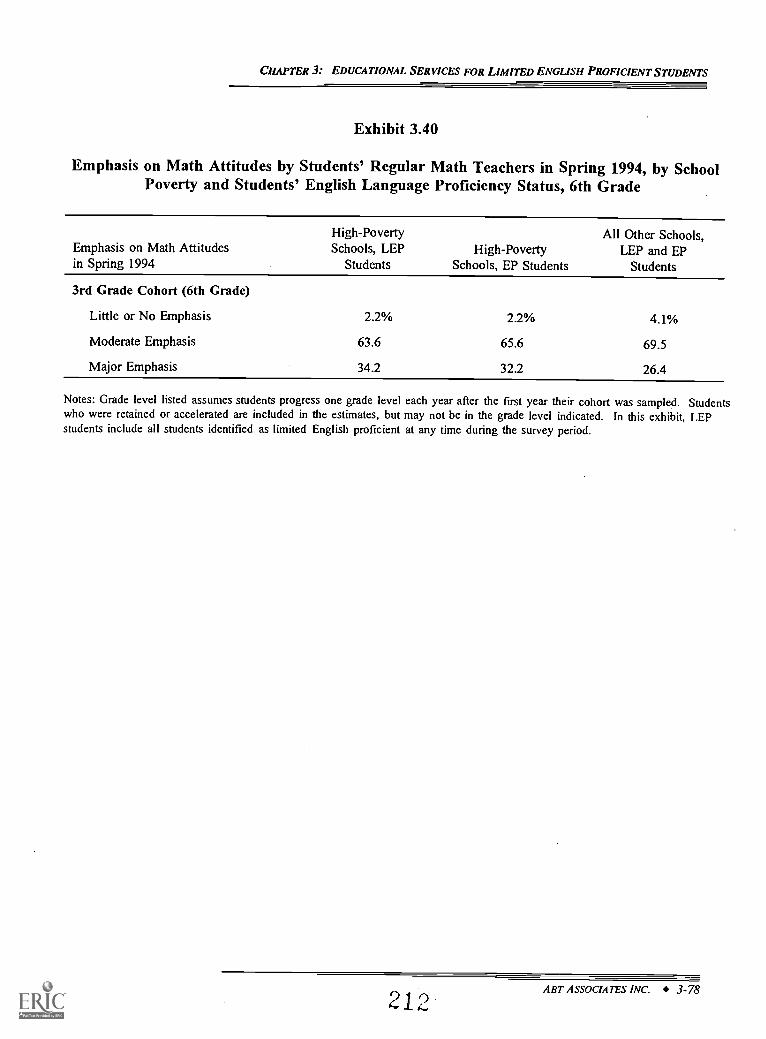
CHAPTER 3: EDUCATIONAL SERVICES FOR LIMITED ENGLISH PROFICIENT STUDENTS
Exhibit 3.40
Emphasis on Math Attitudes by Students' Regular Math Teachers in Spring 1994, by SchoolPoverty and Students' English Language Proficiency Status, 6th Grade
Emphasis on Math Attitudesin Spring 1994
High-PovertySchools, LEP
StudentsHigh-Poverty
Schools, EP Students
All Other Schools,LEP and EP
Students
3rd Grade Cohort (6th Grade)
Little or No Emphasis 2.2% 2.2% 4.1%
Moderate Emphasis 63.6 65.6 69.5
Major Emphasis 34.2 32.2 26.4
Notes: Grade level listed assumes students progress one grade level each year after the first year their cohort was sampled. Studentswho were retained or accelerated are included in the estimates, but may not be in the grade level indicated. In this exhibit, LEPstudents include all students identified as limited English proficient at any time during the survey period.
212ABT ASSOCIATES INC. 3-78
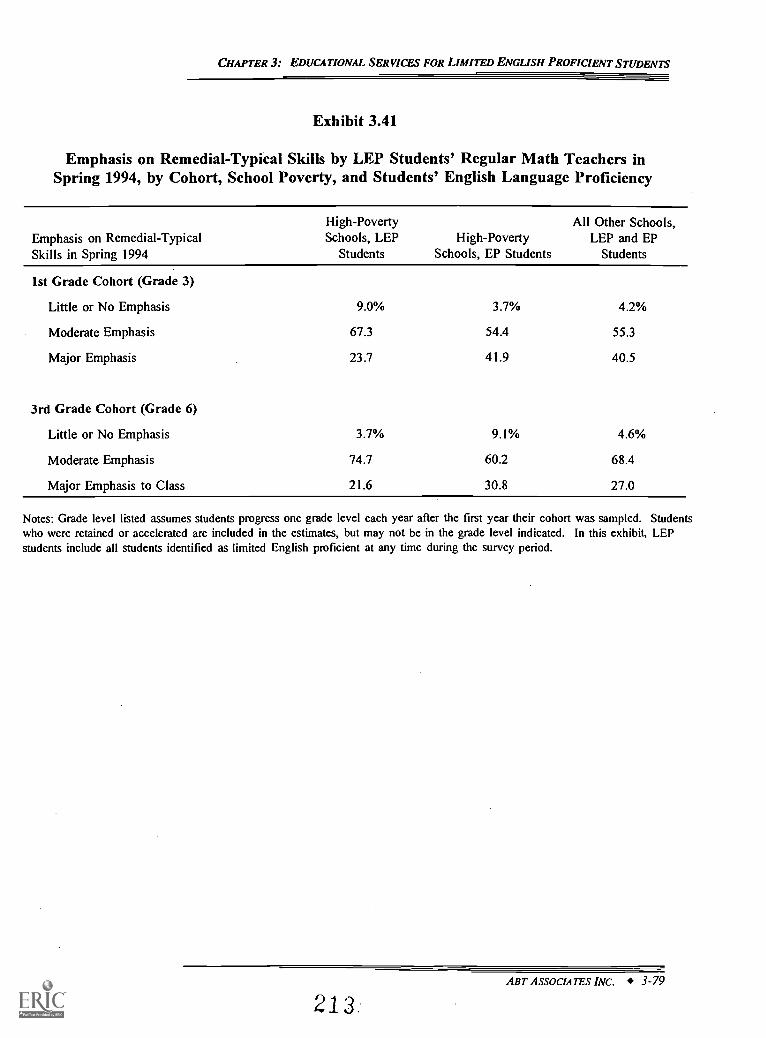
CHAPTER 3: EDUCATIONAL SERVICES FOR LIMITED ENGLISH PROFICIENT STUDENTS
Exhibit 3.41
Emphasis on Remedial-Typical Skills by LEP Students' Regular Math Teachers inSpring 1994, by Cohort, School Poverty, and Students' English Language Proficiency
Emphasis on Remedial-TypicalSkills in Spring 1994
High-PovertySchools, LEP
StudentsHigh-Poverty
Schools, EP Students
All Other Schools,LEP and EP
Students
1st Grade Cohort (Grade 3)
Little or No Emphasis 9.0% 3.7% 4.2%
Moderate Emphasis 67.3 54.4 553
Major Emphasis 23.7 41.9 40.5
3rd Grade Cohort (Grade 6)
Little or No Emphasis 3.7% 9.1% 4.6%
Moderate Emphasis 74.7 60.2 68.4
Major Emphasis to Class 21.6 30.8 27.0
Notes: Grade level listed assumes students progress one grade level each year after the first year their cohort was sampled. Studentswho were retained or accelerated are included in the estimates, but may not be in the grade level indicated. In this exhibit, LEPstudents include all students identified as limited English proficient at any time during the survey period.
ABT ASSOCIATES INC. 3-79
213
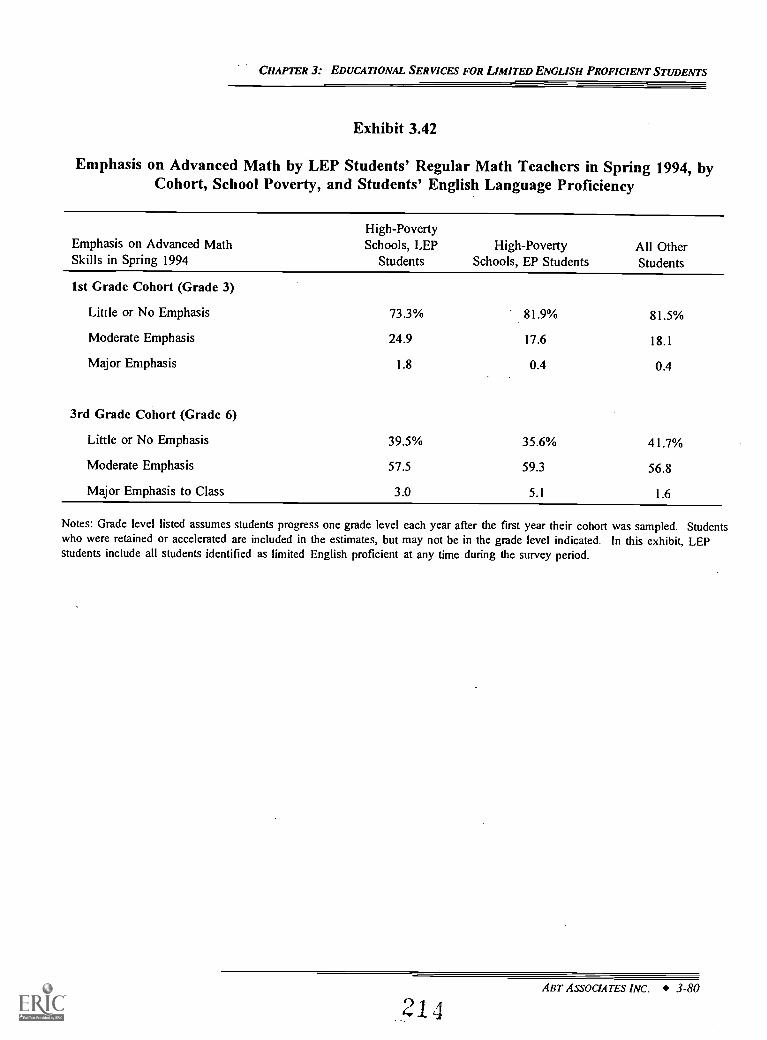
CHAPTER 3: EDUCATIONAL SERVICES FOR LIMITED ENGLISH PROFICIENT STUDENTS
Exhibit 3.42
Emphasis on Advanced Math by LEP Students' Regular Math Teachers in Spring 1994, byCohort, School Poverty, and Students' English Language Proficiency
Emphasis on Advanced MathSkills in Spring 1994
High-PovertySchools, LEP
StudentsHigh-Poverty
Schools, EP StudentsAll OtherStudents
1st Grade Cohort (Grade 3)
Little or No Emphasis 73.3% 81.9% 81.5%
Moderate Emphasis 24.9 17.6 18.1
Major Emphasis 1.8 0.4 0.4
3rd Grade Cohort (Grade 6)
Little or No Emphasis 39.5% 35.6% 41.7%
Moderate Emphasis 57.5 59.3 56.8
Major Emphasis to Class 3.0 5.1 1.6
Notes: Grade level listed assumes students progress one grade level each year after the first year their cohort was sampled. Studentswho were retained or accelerated are included in the estimates, but may not be in the grade level indicated. In this exhibit, LEPstudents include all students identified as limited English proficient at any time during the survey period.
An' ASSOCIATES INC. 3-80
21 4
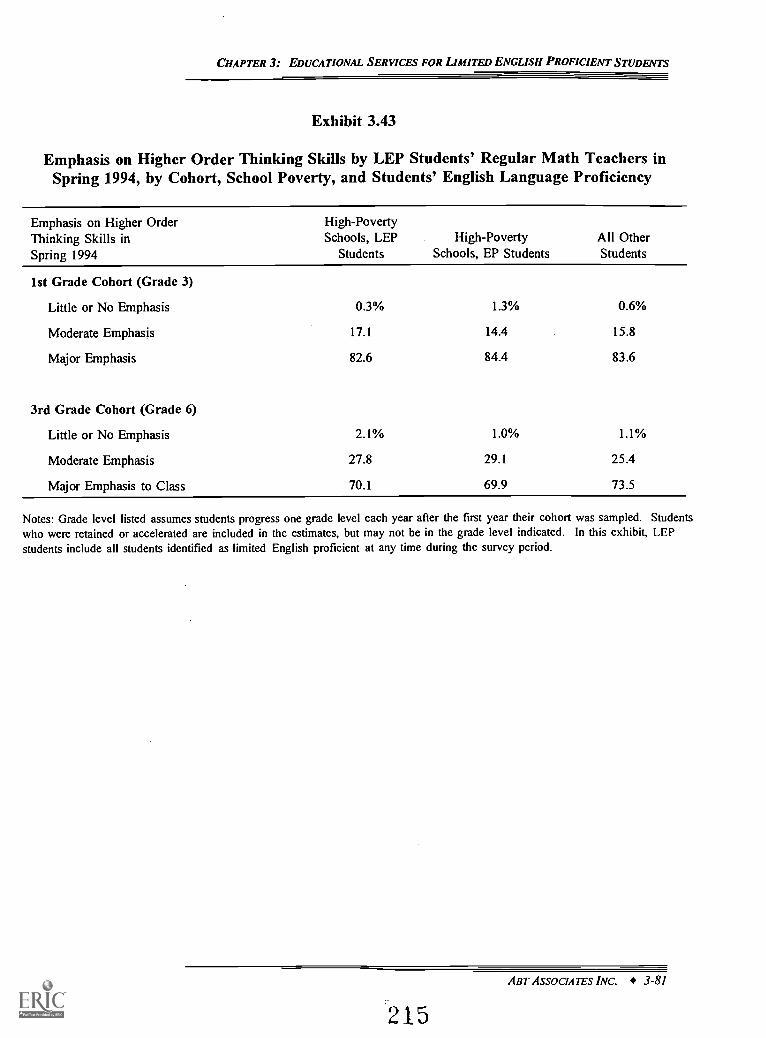
CHAPTER 3: EDUCATIONAL SERVICES FOR LIMITED ENGLISH PROFICIENT STUDENTS
Exhibit 3.43
Emphasis on Higher Order Thinking Skills by LEP Students' Regular Math Teachers inSpring 1994, by Cohort, School Poverty, and Students' English Language Proficiency
Emphasis on Higher OrderThinking Skills inSpring 1994
High-PovertySchools, LEP
StudentsHigh-Poverty
Schools, EP StudentsAll OtherStudents
1st Grade Cohort (Grade 3)
Little or No Emphasis 0.3% 1.3% 0.6%
Moderate Emphasis 17.1 14.4 15.8
Major Emphasis 82.6 84.4 83.6
3rd Grade Cohort (Grade 6)
Little or No Emphasis 2.1% 1.0% 1.1%
Moderate Emphasis 27.8 29.1 25.4
Major Emphasis to Class 70.1 69.9 73.5
Notes: Grade level listed assumes students progress one grade level each year after the first year their cohort was sampled. Studentswho were retained or accelerated are included in the estimates, but may not be in the grade level indicated. In this exhibit, LEPstudents include all students identified as limited English proficient at any time during the survey period.
ABT ASSOCIATES INC. 3-81
215
CHAPTER 3: EDUCATIONAL SERVICES FOR LIMITED ENGLISH PROFICIENT STUDENTS
Are the classroom instructional materials used in regular math and reading/English/
language arts classes the same for LM-LEP students as EP students? Teachers were asked
to choose the responses (from the four combinations of English/non-English and same/different
materials) to best describe how the principal instructional materials used for their LM-LEP
students compare with the principal materials used with English proficient students. Possible
responses are listed in the row labels of Exhibit 3.44.
Use of the same materials for LEP students and EP students is an indication that LEP
students are receiving the same level of academic content as their EP peers while they are
developing their English-language skills. Nevertheless, this is not always feasible even when the
instructional program is designed to teach the same level of content to LEP and EP students. A
LEP student's English language proficiency may not be adequate to learn from the English
material or the material may not be available in the student's first language. Even in math, the
use of the same English-language materials may not always be feasible: while some mathematical
skills are not language dependent (e.g., arithmetic calculations), some are (e.g., word problems).
Research (Cantieni and Tremblay, 1979; and Ramirez, Mather, and Chiodo, 1994) on elementary
school children found that to adequately comprehend some mathematical problems requires
language skills ahead of the reading ability at that grade level. This means that even in math
class, the importance of instructional materials that reflect the students' language background may
differ depending on the grade level and math level being taught. In sum, it is not always better
for LEP students to be using the same materials as their EP peers.
Exhibit 3.44 shows that nearly four-fifths of the regular 3rd grade reading/English/
language arts teachers of LEP students reported using the exact same instructional materials for
their LM-LEP students as for EP students. Twenty-one percent of these teachers reported using
non-English versions of the same materials, and nearly 17 percent reported using non-English
materials that are different from the materials used for EP students. By the 6th grade, LEP
students' teachers were less likely to rely on non-English material and more likely to use the
same instructional materials for their LM-LEP and EP students. By this point, only 6 percent
reported using non-English materials that are different than the materials used by EP students,
10 percentage points less than the LEP students' teachers in 3rd grade. In both grades, about one
out of every five teachers reported using English language materials that are specifically designed
for non-native English speakers.
ABT ASSOCIATES INC. 3-820416
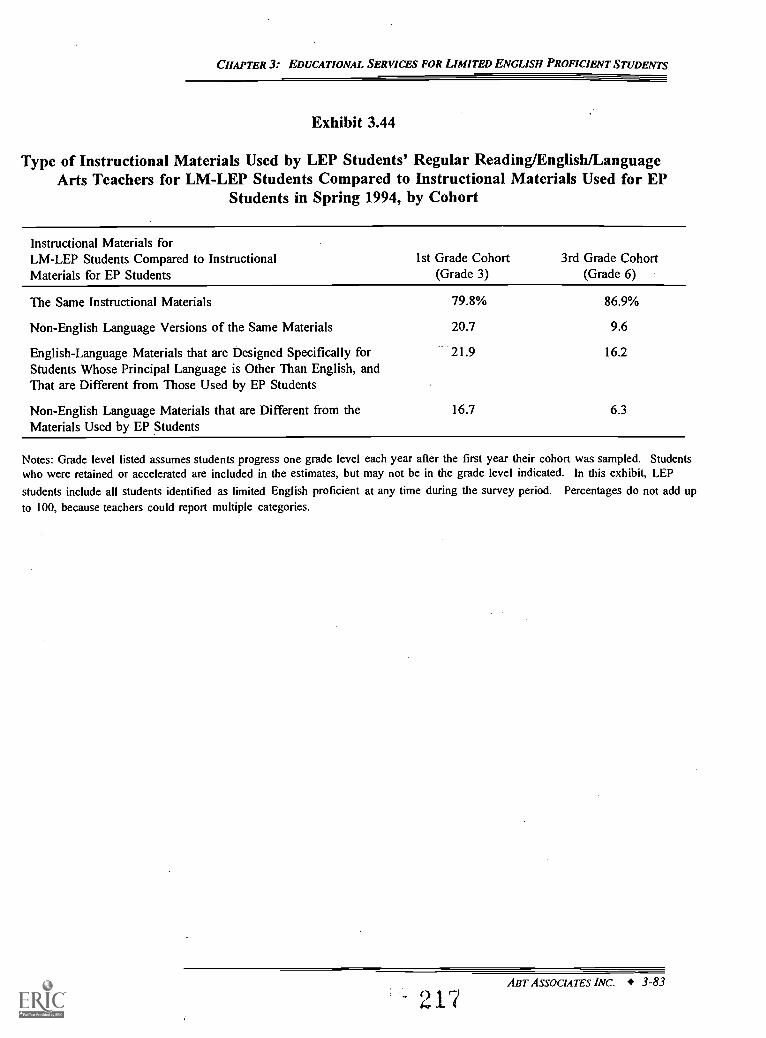
CHAPTER 3: EDUCATIONAL SERVICES FOR LIMITED ENGLISH PROFICIENT STUDENTS
Exhibit 3.44
Type of Instructional Materials Used by LEP Students' Regular Reading/English/LanguageArts Teachers for LM-LEP Students Compared to Instructional Materials Used for EP
Students in Spring 1994, by Cohort
Instructional Materials forLM-LEP Students Compared to InstructionalMaterials for EP Students
1st Grade Cohort(Grade 3)
3rd Grade Cohort(Grade 6)
The Same Instructional Materials 79.8% 86.9%
Non-English Language Versions of the Same Materials 20.7 9.6
English-Language Materials that are Designed Specifically for 21.9 16.2Students Whose Principal Language is Other Than English, andThat are Different from Those Used by EP Students
Non-English Language Materials that are Different from the 16.7 6.3Materials Used by EP Students
Notes: Grade level listed assumes students progress one grade level each year after the first year their cohort was sampled. Studentswho were retained or accelerated are included in the estimates, but may not be in the grade level indicated. In this exhibit, LEP
students include all students identified as limited English proficient at any time during the survey period. Percentages do not add upto 100, because teachers could report multiple categories.
ABT ASSOCIATES INC. 3-83
217
CHAPTER 3: EDUCATIONAL SERVICES FOR LIMITED ENGLISH PROFICIENT STUDENTS
As can be seen in Exhibit 3.45, the patterns for regular math classes are similar to those
for reading/English/language arts classes, except that the trend towards using the exact same
materials for LM-LEP and EP students by the 6th grade is even stronger. Ninety-two percent
of LEP students' 6th grade teachers report using English versions of the same materials for LM-
LEP students and EP students, and only 6 percent report using materials designed for native
speakers of a non-English language.
Do LEP students' classroom teachers use computers in the curriculum as frequently
as teachers of EP students? In an earlier section of this chapter, we found that LEP students
in high-poverty schools had slightly better access to computer resources than EP students in high-
poverty schools. As noted earlier, many LEP students are in classes with somewhat larger class
size. Information on how these computers are used, and their impact on learning was not
collected in this study. Here, we examine how prevalent computer usage is in the curriculum,
by analyzing teacher-reported use of computers in the classroom. The results are shown in
Exhibit 3.46 (reading/English/language arts) and Exhibit 3.47 (math). In high-poverty schools,
reported computer use by LEP students' regular teachers is very similar to that of EP students'
regular teachers, with a slightly higher percent of LEP students' teachers reporting frequent or
everyday use of computers. This difference is strongest in 6th grade reading/English/language
arts classes, where 45 percent of LEP students' teachers report using a computer often or every
day while only 35 percent of EP students teachers report that frequency of computer usage.
Apparently LEP students in high-poverty schools are in a slightly better position than their EP
peers regarding both computer access and computer usage.
SUMMARY
In this chapter, we organized our analysis around three overarching questions regarding
the responsiveness, quality, and content of educational services received by LEP students in
elementary school. Here, we summarize our findings for LEP students in elementary schools on
these three issues.
218ABT ASSOCIATES INC. 3-84
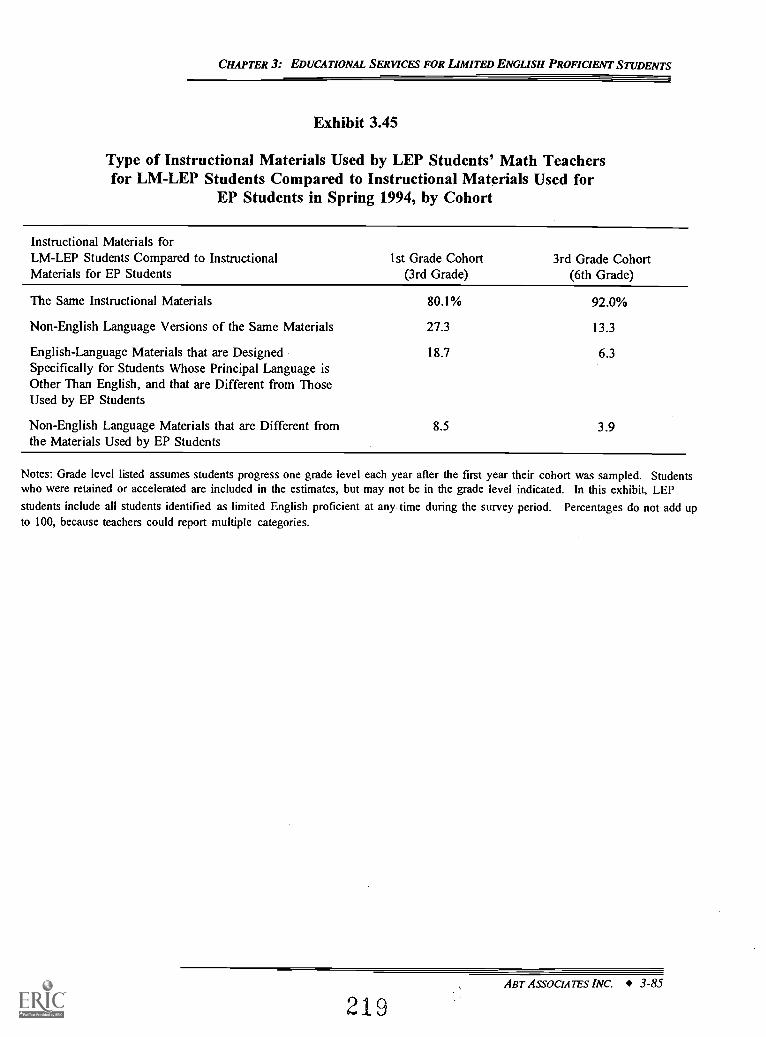
CHAPTER 3: EDUCATIONAL SERVICES FOR LIMITED ENGLISH PROFICIENT STUDENTS
Exhibit 3.45
Type of Instructional Materials Used by LEP Students' Math Teachersfor LM-LEP Students Compared to Instructional Materials Used for
EP Students in Spring 1994, by Cohort
Instructional Materials forLM-LEP Students Compared to InstructionalMaterials for EP Students
1st Grade Cohort(3rd Grade)
3rd Grade Cohort(6th Grade)
The Same Instructional Materials 80.1% 92.0%
Non-English Language Versions of the Same Materials 27.3 13.3
English-Language Materials that are Designed 18.7 6.3Specifically for Students Whose Principal Language isOther Than English, and that are Different from ThoseUsed by EP Students
Non-English Language Materials that are Different fromthe Materials Used by EP Students
8.5 3.9
Notes: Grade level listed assumes students progress one grade level each year after the first year their cohort was sampled. Studentswho were retained or accelerated are included in the estimates, but may not be in the grade level indicated. In this exhibit, LEPstudents include all students identified as limited English proficient at any time during the survey period. Percentages do not add upto 100, because teachers could report multiple categories.
ABT ASSOCIATES INC. 3-85
219
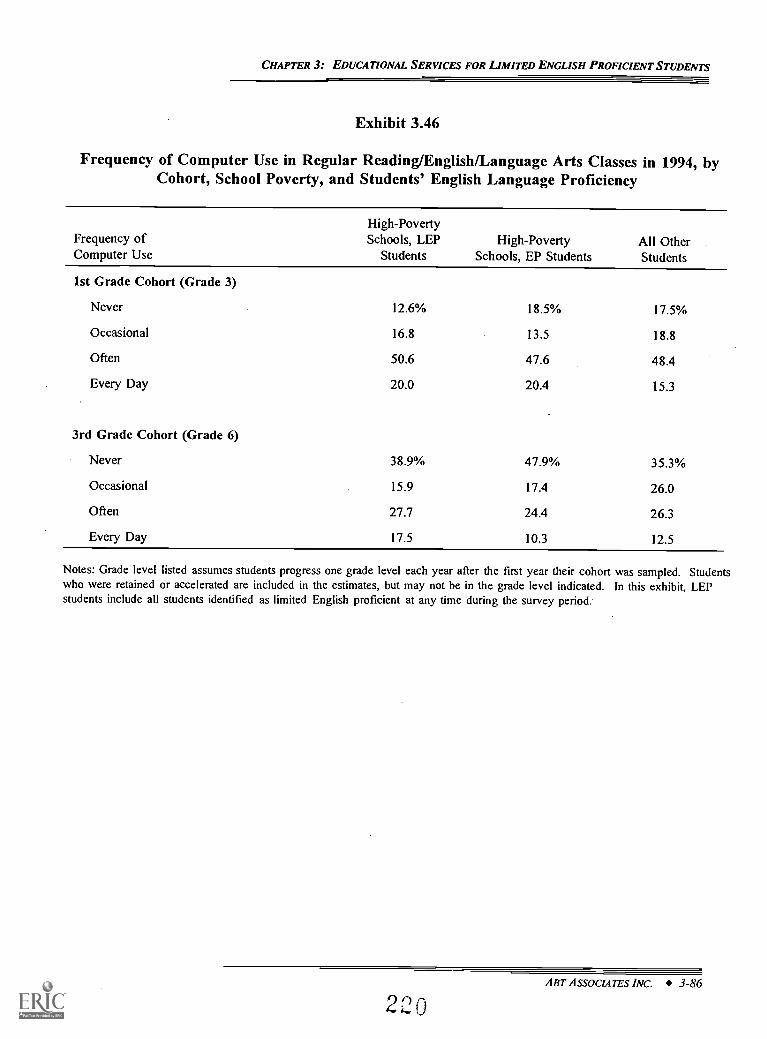
CHAPTER 3: EDUCATIONAL SERVICES FOR LIMITED ENGLISH PROFICIENT STUDENTS
Exhibit 3.46
Frequency of Computer Use in Regular Reading/English/Language Arts Classes in 1994, byCohort, School Poverty, and Students' English Language Proficiency
Frequency ofComputer Use
High-PovertySchools, LEP
StudentsHigh-Poverty
Schools, EP StudentsAll OtherStudents
1st Grade Cohort (Grade 3)
Never 12.6% 18.5% 17.5%
Occasional 16.8 13.5 18.8
Often 50.6 47.6 48.4
Every Day 20.0 20.4 15.3
3rd Grade Cohort (Grade 6)
Never 38.9% 47.9% 35.3%
Occasional 15.9 17.4 26.0
Often 27.7 24.4 26.3
Every Day 17.5 10.3 12.5
Notes: Grade level listed assumes students progress one grade level each year after the first year their cohort was sampled. Studentswho were retained or accelerated are included in the estimates, but may not be in the grade level indicated. In this exhibit, LEPstudents include all students identified as limited English proficient at any time during the survey period.
ABT AssoCIATES INC. 3-86
220
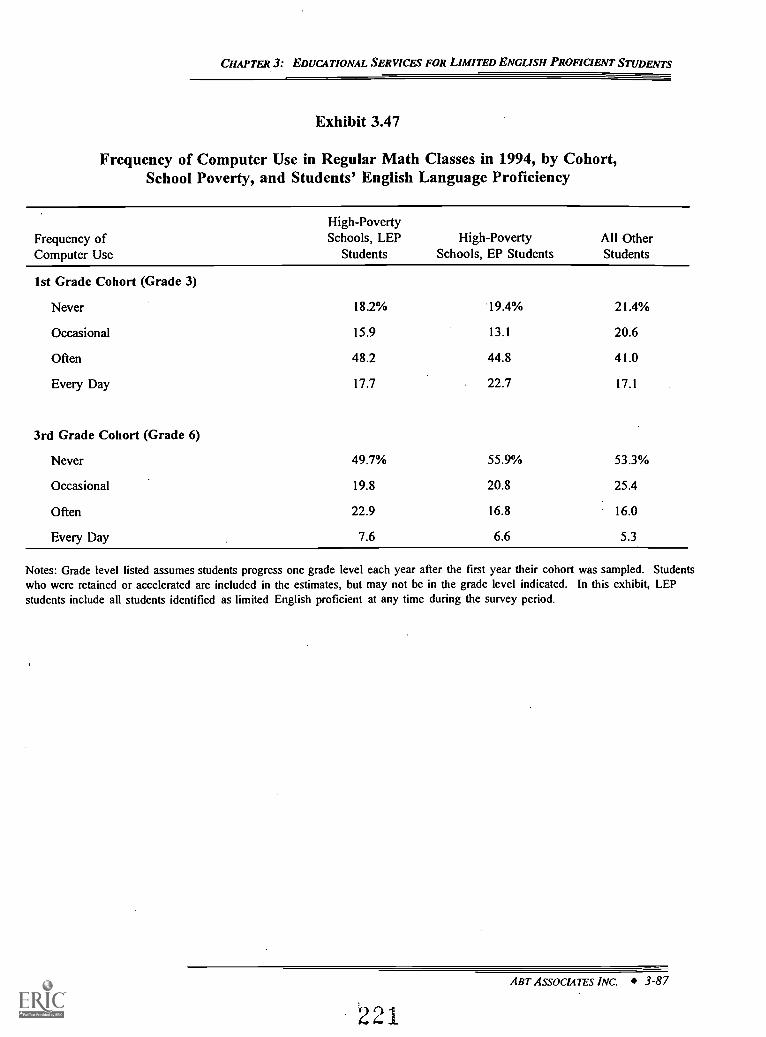
CHAPTER 3: EDUCATIONAL SERVICES FOR LIMITED ENGLISH PROFICIENT STUDENTS
Exhibit 3.47
Frequency of Computer Use in Regular Math Classes in 1994, by Cohort,School Poverty, and Students' English Language Proficiency
Frequency ofComputer Use
High-PovertySchools, LEP
StudentsHigh-Poverty
Schools, EP StudentsAll OtherStudents
1st Grade Cohort (Grade 3)
Never 18.2% 19.4% 21.4%
Occasional 15.9 13.1 20.6
Often 48.2 44.8 41.0
Every Day 17.7 22.7 17.1
3rd Grade Cohort (Grade 6)
Never 49.7% 55.9% 53.3%
Occasional 19.8 20.8 25.4
Often 22.9 16.8 16.0
Every Day 7.6 6.6 5.3
Notes: Grade level listed assumes students progress one grade level each year after the first year their cohort was sampled. Studentswho were retained or accelerated are included in the estimates, but may not be in the grade level indicated. In this exhibit, LEPstudents include all students identified as limited English proficient at any time during the survey period.
ABT ASSOCIATES INC. 3-87
2 21
CHAPTER 3: EDUCATIONAL SERVICES FOR LIMITED ENGLISH PROFICIENT STUDENTS
Are educational services responsive to the special needs of LEP Students?
School-level. Several schoolwide measures of support for LEP students show initially
encouraging evidence: the availability of ESL/BE instruction within the school, principal's
language background, coordination and integration of LEP and EP instruction, and support and
respect for the families of LEP students. Sixty to 100 percent of LEP students attend schools
with favorable indicators in each of these areas. These figures represent an important beginning
for a public school system that seeks to support and nurture all students with limited English
proficiency. These indicators do not tell us how many of the LEP students in a particular school
benefit from the favorable practices known to exist somewhere in the school.
Classroom teacher. About one-third to one-half of LEP students' regular teachers have
a background or training indicating understanding and skills in teaching LEP students, as
measured by certification in ESL and/or BE instruction or proficiency in the predominant non-
English language of LM-LEP students in their classrooms. While this represents a substantial
proportion of LEP students' teachers, it leaves ample room for increasing the qualifications of
teachers who have LEP students in their class. Of the LEP students with classroom aides, about
four-fifths had an aide proficient in the predominant non-English language of the LM-LEP
students in their class.
Instructional services. Between 80 and 90 percent of the students identified as limited
English proficient in a particular year participated in an ESL/BE instructional program that year.
In addition, about 50 percent of LEP students participated in supplementary instruction in
reading/English/language arts, while slightly fewer participated in supplementary math instruction.
Chapter 1 funding is the primary source of funding for both supplemental math and
reading/English/language arts instruction, and a substantial source of funding for ESL/BE
instructional services. These service levels appear encouraging for meeting the needs of LEP
students.
Do limited English proficient students receive the same quality of educational inputs asEnglish proficient students?
Teacher Quality Indicators. LEP and EP students from high-poverty schools have
regular classroom teachers with similar teaching qualifications, as measured by their educational
ABT ASSOCIATES INC. 3-88
CHAPTER 3: EDUCATIONAL SERVICES FOR LIMITED ENGLISH PROFICIENT STUDENTS
attainment and acquisition of permanent teaching certificates. However, LEP students' teachers
are somewhat less experienced: more have fewer than ten years of experience, and more are in
their first year of teaching.
Instructional Setting. One finding that could be detrimental to the educational
achievement of LEP students is that they are more likely than EP students to be in large classes,
even after controlling for the high-poverty status of the student's school. LEP students are also
more likely to be grouped in reading/English/language arts based on ability, which could be either
detrimental to their progress (if it results in lower expectations) or more appropriate to meet their
English language instruction needs.
Instructional Materials. Based on measures of the availability of instructional materials,
LEP and EP students in high-poverty schools appear to have similar physical resources at school,
although LEP students do appear to be in classes with slightly better access to computers.
Do LEP students receive the same level of instructional content as EP students?
Instructional Emphasis. In general, the skills emphasized by LEP and EP students'
regular reading/English/language arts teachers are similar. To the extent that this accurately
describes the curriculum administered to LEP students, this is an encouraging finding that
indicates LEP students' limited English language proficiency may not be seriously limiting the
skills taught to them. One exception to this generalization is that LEP students in the 3rd grade
in 1994 were more likely to have teachers that place moderate rather than major emphasis on two
composite measures of reading skills. A second exception is that LEP students' 6th grade
teachers are more likely to place major emphasis on writing proficiency skills than EP students'
teachers. This may indicate that, by the 6th grade, LEP students are ready for basic writing
instruction and yet more in need of those skills than their EP peers.
The instructional emphasis of LEP and EP students math teachers is also similar within
high-poverty schools, with the exception that EP students' math teachers place somewhat more
emphasis on basic math skills than do LEP students' teachers.
Instructional Materials. In 1994, four-fifths of 3rd grade LEP students were in regular
math and reading classes where teachers used the same English and non-English instructional
materials for both EP and LEP students. This rate increased to nine out every 10 6th grade LEP
ABT ASSOCIATES INC. 3-89
223
CHAPTER 3: EDUCATIONAL SERVICES FOR LIMITED ENGLISH PROFICIENT STUDENTS
students in that year. This is an encouraging indication that the curriculum is not being
diminished for LEP students.
Use of the same instructional materials may not always mean the same access to what is
being taught. On the one hand, it is important for LEP students to receive the same level of
instruction as native speakers of English. However, some would argue that LEP students need
materials specifically geared toward their linguistic skills and needs to effectively understand what
is being taught. In some cases, use of the same materials may not lead to the equal opportunity
to learn the course content.
Computer Use. Finally, consistent with the patterns of availability of computer resources,
LEP students' teachers are slightly more likely to include computer usage as a regular part of
their instructional curriculum than teachers of EP students in similarly high-poverty schools. This
difference is strongest in 6th grade reading/EnglisWlanguage arts classes.
In sum, on many of the measures examined here, LEP students are reported to have levels
of access to educational materials and services at levels roughly equivalent to those of other
students in high poverty schools. There are some potentially important differences. For example,
more than two out of three sixth grade LEP students are in math classes with 26 or more
students, compared to slightly less than one out of two for other students in both poverty and
other schools. In addition, this survey data does not provide information on how effectively the
available resources are used for instruction.
Aar ASSOCIATES INC. 3-90
CHAPTER 4: EDUCATIONAL OUTCOMES FOR LEP STUDENTS
CHAPTER 4
EDUCATIONAL OUTCOMES FOR LEP STUDENTS
This chapter looks at the educational outcomes of LEP students, building on the results
presented in the previous chapters. As we have seen in earlier chapters, LEP students face large
challenges to educational success beyond the need to build proficiency in English. These include
attending schools with high concentrations of high-poverty and limited English proficient
students, low levels of parent education, and low family incomes. The main Prospects report
(Puma et al. 1997) generally finds that:
School poverty concentration is associated with lower academic performance.
Academic standards vary between high- and low-poverty schools. For example,when measured against standardized test scores, a grade of "A" in a high-povertyschool is equivalent to a grade of about "C" in a low-poverty school.
How did LEP students fare? This chapter examines the school and learning outcomes for LEP
students.
The report began with a description of how the nationally-representative sample of LEP
students was defined for this study. Next we described LEP students in terms of non-school
factors (student and family characteristics) that might influence educational outcomes, and then
described school- and classroom-level factors that might also influence educational outcomes.
In this chapter, we analyze outcomes descriptively over time, comparing LEP and English
Proficient (EP) students and looking at different groups of LEP students. Because of resource
constraints, we do not try to link outcomes to the inputs described earlier in the report, or to
calculate the impact of school services on student achievement.
In the remainder of this section we provide a brief description of each of the four types
of outcomes to be considered, the subsamples of students analyzed, and the methodology that was
used. Each of the subsequent sections discusses one of the four student outcomes. The chapter
ends with a summary of key findings.
ABT ASSOCIATES INC. 4-1
CHAPTER 4: EDUCATIONAL OUTCOMES FOR LEP STUDENTS
Description of the Outcomes Analyzed
This chapter examines four types of educational outcomes for LEP students: teacher
assessments of English language proficiency; standardized student achievement test scores in
reading; standardized student achievement test scores in math; and grade retention. These
outcomes were chosen because they are among the most important outcomes for LEP students
that can be analyzed with the Prospects data, and because they are heterogeneous enough to
provide a broad picture of how LEP students fare in their elementary years.
Teacher Ratings of Students' English Language Proficiency. We analyzed English
language proficiency utilizing teacher judgements of student proficiency in understanding,
speaking, reading, and writing English. Teachers rated LEP students on a five-level scale,
ranging from no English proficiency to excellent English proficiency. Chapter 2 notes the
potential drawbacks of relying on subjective teacher assessments of English proficiency. Despite
their subjectivity, we believe these measures provide useful information about how the English
proficiency of different groups of LEP students improves over time. Of particular interest are
contrasts between students who exit LEP status by the end of the observation period and students
who remain LEP throughout the same time period.
Student Achievement Test Scores in Reading. We examined achievement test scale
scores for two subscales of the Comprehensive Test of Basic Skills (CTBS-4) tests developed by
CTB/McGraw-Hillreading vocabulary and reading comprehension.' The main challenge in
analyzing test scores for LEP students is that not all LEP students can be tested in English.
Some of the students defined as LEP for this study took the CTBS in English, while other
Spanish-speaking LEP students took a Spanish version of the CTBS (called the Spanish
Assessment of Basic Education, or SABE). For this analysis, we focus only on students who
took the CTBS at least once during the study; we do not use SABE reading scores because of
difficulties in accurately linking CTBS and SABE reading scores. We compare mean reading test
The reading vocabulary subtest measures various skills related to constructing and expressing the meaning ofvocabulary words, such as selecting synonyms, identifying the meaning of prefixes and suffixes, and completingsentences with the appropriate vocabulary words. The reading comprehension subtest measures students' skillsprimarily in extracting information from passages and identifying main ideas.
ABT ASSOCIATES INC. 4-2
226
CHAPTER 4: EDUCATIONAL OUTCOMES FOR LEP STUDENTS
scores over time for: LEP exiters compared to students who remain LEP; all LEP students
compared to all EP students; and low-income LEP students compared to low-income EP students.
Student Achievement Test Scores in Math. We also examined two CTBS-4 subscale
tests in mathmath applications and math computations.' Unlike for the reading test scores, our
analysis of math test scores includes both the CTBS and SABE scores. For this analysis
CTB/McGraw-Hill converted the SABE math scores to their CTBS equivalent. Our assumption
underlying this analysis is that the CTBS and SABE math scores are more likely to be
comparable than are the CTBS and SABE reading test scores.' As with reading scores, we
compare: LEP exiters to students who remain LEP; all LEP students to all EP students; and low-
income LEP students to low-income EP students.
Grade Retention. There are two sources of information on grade retention in the
Prospects data set. The first source is the parent questionnaire, on which parents were asked if
their child had ever been retained in a grade. The second source is obtained directly from the
sequence of grade progressions for each of the students over the years they were observed. For
example, if a student was in 1st grade in 1991, in 2nd grade in 1992, and 2nd grade again in
1993, then he or she was classified as retained in the 2nd grade for this measure. Both measures
of grade retention were analyzed.
Sample Definitions and Methodology
In this chapter we look at outcomes for all LEP students andin the case of test scores
and grade retentionfor low-income LEP students. The analogous comparison groups in this
chapter are all EP students and low-income EP students. For this purpose, low-income students
are defined as those students from low-income families (families with an average annual family
2 The math applications subtest is multiple choice, and focuses on skills such as problem solving, number theory,measurement, and geometry. The math computations subtest measures arithmetic computation skills involving wholenumbers, decimals, fractions, and integers.
The degree to which the math tests in Spanish and English are comparable depends in part on the extent towhich the tests are language dependent. The more language dependent are the tests, the more difficult it is to makethem comparable. For the most part the math tests administered for Prospects were not heavily language dependent.The math computations subtest focuses on arithmetic, and the math applications subtest, at least in the early grades,relies more on graphic representations than words. For a general discussion of the degree to which mathematicsteaching is language dependent, see Mather and Chiodo (1994).
ABT ASSOCIATES INC. 4-3
CHAPTER 4: EDUCATIONAL OUTCOMES FOR LEP STUDENTS
income less than 185 percent of the poverty level, adjusted for family size) in low-income schools
(schools in which at least one-half of the students are eligible for free or reduced-price meals).
Since both family poverty and school poverty can exert important influences on student outcomes,
controlling for both factors at once provides a better basis for comparing LEP and EP students.
The low-income student subsample so defined includes a majority of LEP students4and the
most important LEP students from the standpoint of compensatory educationand allows us to
isolate outcome differences based on LEP status independent of economic factors. The chapter
also presents outcomes for the entire LEP group. Exhibit F.1 in Appendix F shows the
unweighted and weighted sample sizes for the groups examined in this chapter.
An important difference between the analyses presented in this chapter and those discussed
in previous chapters of this report is that here we examine outcomes for subgroups of LEP
students defined by patterns of LEP status over time. Identifying subgroups in this way is useful
in illustrating the heterogeneity of outcomes for LEP students, just as it helped to illustrate the
composition of the LEP population in Chapter 1. The two key subgroups of interest in this
chapter are students who are LEP in every year of the study, and students who begin as LEP but
who exit LEP status by the end of the study. The latter group is further subdivided according
to the year of exit from LEP status.' For the 1st grade cohort, therefore, the key subgroups are
(with the unweighted number of students in parentheses):6
LEP111: students who were classified as LEP in 1992, 1993 and 1994 (N=4,087);
LEP110: students who were classified as LEP in 1992 and 1993 but not in 1994(N-201); and
4 Based on the definition of low-income used in this chapter, low-income LEP students comprise 80percent ofall LEP students in the data set (i.e., on an unweighted basis) and 69 percent of all LEP students in the population(i.e., on a weighted basis) averaged across cohorts.
5 These subgroups together include the great majority of LEP students, more than 85 percent. Outcomes forother LEP studentsthose who are not identified as LEP in the first year of the studyare not presented separatelybut are included in the results for all LEP students and for low-income LEP students.
The numbers in parentheses are the number of all LEP students in each group. The number of low-incomeLEP students in each group is smaller.
ABT ASSOCIATES INC. 4-4
228
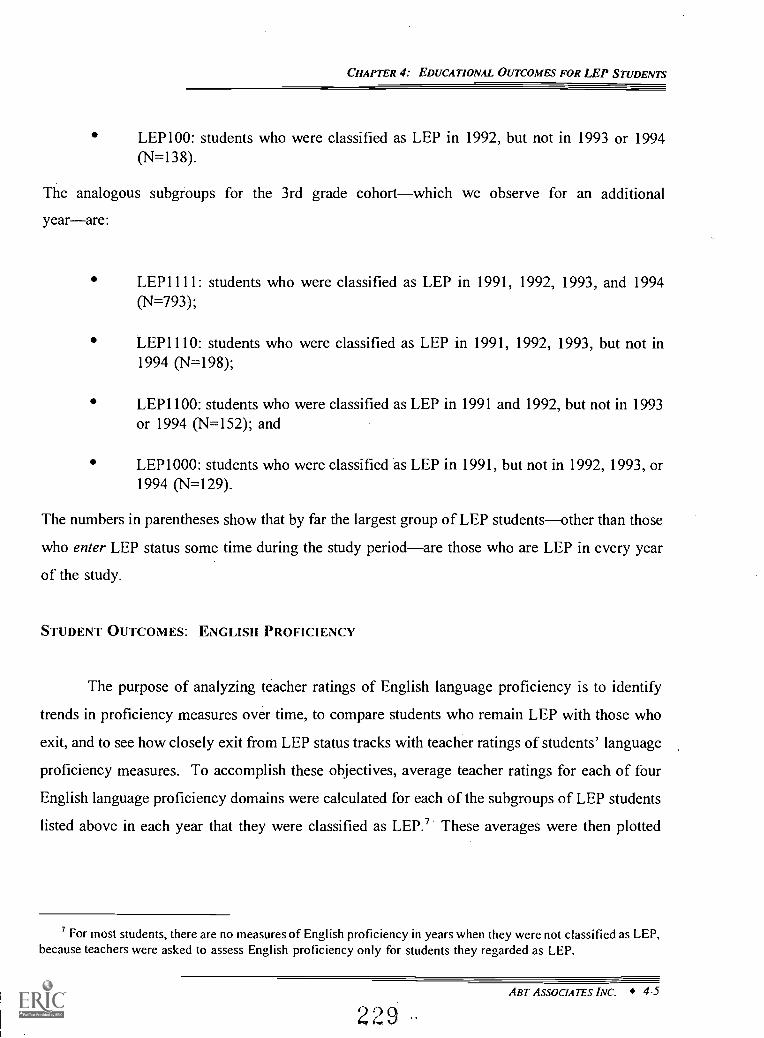
CHAPTER 4: EDUCATIONAL OUTCOMES FOR LEP STUDENTS
LEP100: students who were classified as LEP in 1992, but not in 1993 or 1994(N=138).
The analogous subgroups for the 3rd grade cohortwhich we observe for an additional
yearare:
LEP1110: students who were classified as LEP in 1991, 1992, 1993, but not in1994 (N=198);
LEP1111: students who were classified as LEP in 1991, 1992, 1993, and 1994(N=793);
LEP1100: students who were classified as LEP in 1991 and 1992, but not in 1993or 1994 (N=152); and
LEP1000: students who were classified as LEP in 1991, but not in 1992, 1993, or1994 (N=129).
The numbers in parentheses show that by far the largest group of LEP studentsother than those
who enter LEP status some time during the study periodare those who are LEP in every year
of the study.
STUDENT OUTCOMES: ENGLISH PROFICIENCY
The purpose of analyzing teacher ratings of English language proficiency is to identify
trends in proficiency measures over time, to compare students who remain LEP with those who
exit, and to see how closely exit from LEP status tracks with teacher ratings of students' language
proficiency measures. To accomplish these objectives, average teacher ratings for each of four
English language proficiency domains were calculated for each of the subgroups of LEP students
listed above in each year that they were classified as LEP.' These averages were then plotted
For most students, there are no measures of English proficiency in years when they were not classified as LEP,because teachers were asked to assess English proficiency only for students they regarded as LEP.
ABT ASSOCIATES INC. 4-5
229
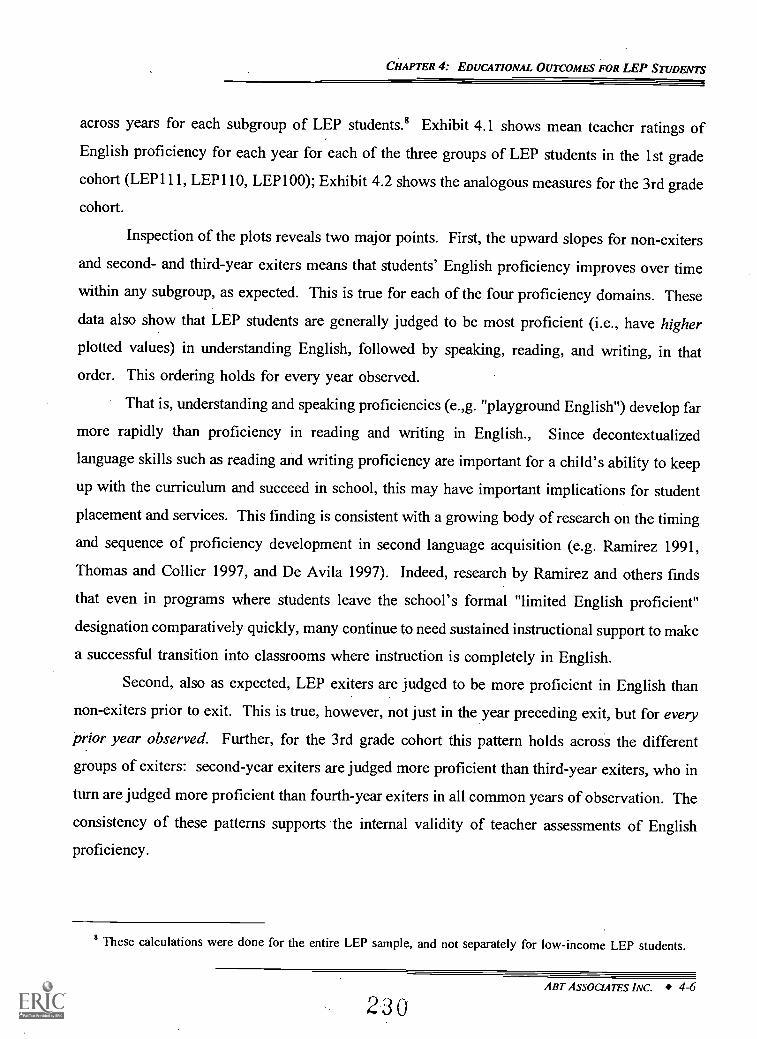
CHAPTER 4: EDUCATIONAL OUTCOMES FOR LEP STUDENTS
across years for each subgroup of LEP students.' Exhibit 4.1 shows mean teacher ratings of
English proficiency for each year for each of the three groups of LEP students in the 1st grade
cohort (LEP111, LEP110, LEP100); Exhibit 4.2 shows the analogous measures for the 3rd grade
cohort.
Inspection of the plots reveals two major points. First, the upward slopes for non-exiters
and second- and third-year exiters means that students' English proficiency improves over time
within any subgroup, as expected. This is true for each of the four proficiency domains. These
data also show that LEP students are generally judged to be most proficient (i.e., have higher
plotted values) in understanding English, followed by speaking, reading, and writing, in that
order. This ordering holds for every year observed.
That is, understanding and speaking proficiencies (e.,g. "playground English") develop far
more rapidly than proficiency in reading and writing in English., Since decontextualized
language skills such as reading and writing proficiency are important for a child's ability to keep
up with the curriculum and succeed in school, this may have important implications for student
placement and services. This finding is consistent with a growing body of research on the timing
and sequence of proficiency development in second language acquisition (e.g. Ramirez 1991,
Thomas and Collier 1997, and De Avila 1997). Indeed, research by Ramirez and others finds
that even in programs where students leave the school's formal "limited English proficient"
designation comparatively quickly, many continue to need sustained instructional support to make
a successful transition into classrooms where instruction is completely in English.
Second, also as expected, LEP exiters are judged to be more proficient in English than
non-exiters prior to exit. This is true, however, not just in the year preceding exit, but for every
prior year observed. Further, for the 3rd grade cohort this pattern holds across the different
groups of exiters: second-year exiters are judged more proficient than third-year exiters, who in
turn are judged more proficient than fourth-year exiters in all common years of observation. The
consistency of these patterns supports the internal validity of teacher assessments of English
proficiency.
These calculations were done for the entire LEP sample, and not separately for low-income LEP students.
ABT ASSOCIATES INC. 4-6
230
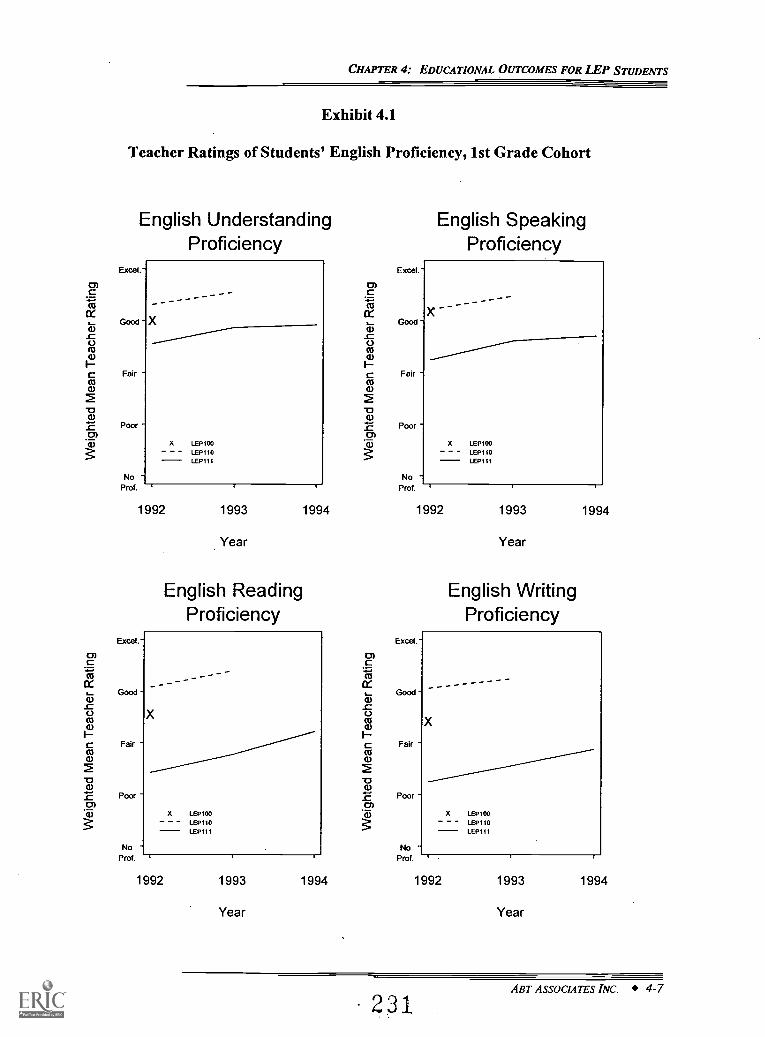
CHAPTER 4: EDUCATIONAL OUTCOMES FOR LEP STUDENTS
Exhibit 4.1
Teacher Ratings of Students' English Proficiency, 1st Grade Cohort
English UnderstandingProficiency
Excel.-
Good
Fair
Poor
- -
X LEP100
LEP110
LEPIII
NoProf. '
1992 1993
Year
English ReadingProficiency
1994
Excel
Good -
Fair
Poor
English SpeakingProficiency
Excel.-
Good -
Fair
Poor -
--
X LEP100
LEPII0
LEP111
NoProf. '
1992
Excel.-
1993
Year
English WritingProficiency
1994
Good
Fair -
Poor
-
X LEP100
LEPII0
LEP111
No -Prof. '
1992 1993
Year
1994
X LEP100
LEP110
LEP111
NoProf.
1992 1993
Year
1994
231ART ASSOCIATES INC. 4-7
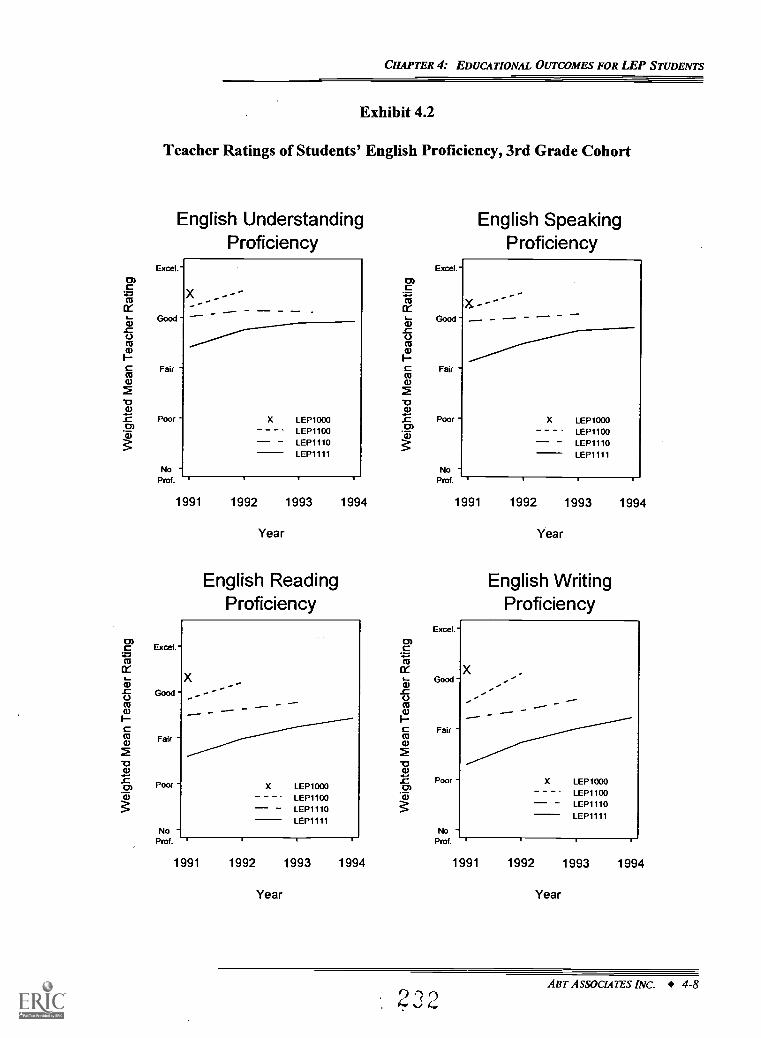
CHAPTER 4: EDUCATIONAL OUTCOMES FOR LEP STUDENTS
Exhibit 4.2
Teacher Ratings of Students' English Proficiency, 3rd Grade Cohort
English UnderstandingProficiency
Excel."
Good -
Fair -
Poor
English SpeakingProficiency
Excel.-
Good -
Fair
Poor -X LEP1000LEP1100LEP1110LEP1111
NoProf.
1991 1992 1993
Year
1994
English ReadingProficiency
Excel.-
XGood
Fair -
Poor - X LEP1000LEP1100LEP1110LEP1111
No -Poof. '
1991 1992 1993
Year
1994
X LEP1000LEP1100LEP1110LEP1111
NoProf.
1991 1992 1993
Year
English WritingProficiency
1994
1991 1992 1993
Year
1994
0 0 ABT ASSOCIATES INC. 4-8
CHAPTER 4: EDUCATIONAL OUTCOMES FOR LEP STUDENTS
Because these results show that LEP exiters start out with considerably higher levels of
proficiency than do students who remain LEP, they suggest that exit from LEP status is strongly
related to where a student starts in the observation period, andfor the first grade cohort that
starts out near school entrythat non-school factors may be important in explaining how long
it takes children to leave LEP status.
Comparing average teacher ratings across cohorts, we see little difference. That is, the
3rd grade cohort, despite being older, was not judged to have higher first-year levels of English
proficiency than the 1st grade cohort. As discussed in Chapter 2, this could be evidence of a
compositional difference between the LEP students in the two cohorts. That is, because every
year some fraction of LEP students improve their English proficiency enough to exit LEP status,
students who are still LEP in the third grade may on average have begun school with more
limited English proficiency than other LEP students. A related possibility is that some fraction
of LEP students in the 3rd grade cohort may have entered U.S. schools after the first grade. The
lack of a large difference between cohorts in first-year English proficiency is also consistent,
however, with the hypothesis that teacher ratings are to some extent relative to expectations for
the grade level.
The next exhibit focuses on the subgroup of students who are LEP in every year of the
study. For this subgroup, we have proficiency measures for every year of the study, which
enables us to examine how proficiency develops over time across different domains. Compared
to other LEP students, this group has a lower level of English proficiency in the first year of the
study (as shown in Exhibits 4.1 and 4.2), which means the patterns for this group are likely not
to be representative of the patterns for all LEP students. Nevertheless, students who are LEP for
every year of the study are a sizeable fraction of all students identified as LEP (66 and 46 percent
of the 1st and 3rd grade cohort LEP students, respectively), and an important group from a policy
perspective.
Exhibit 4.3 shows that proficiency in understanding and speaking English precedes
proficiency in reading and writing. At the same time, there is some evidence of catch-up; growth
in reading and writing proficiency is greater than growth in understanding and speaking ability.
For the 3rd grade cohort, growth in proficiency slows over time for all domains. For the 1st
grade cohort, growth in proficiency slows for understanding and speaking, but not for reading and
ART ASSOCIATES INC. 4-9
233
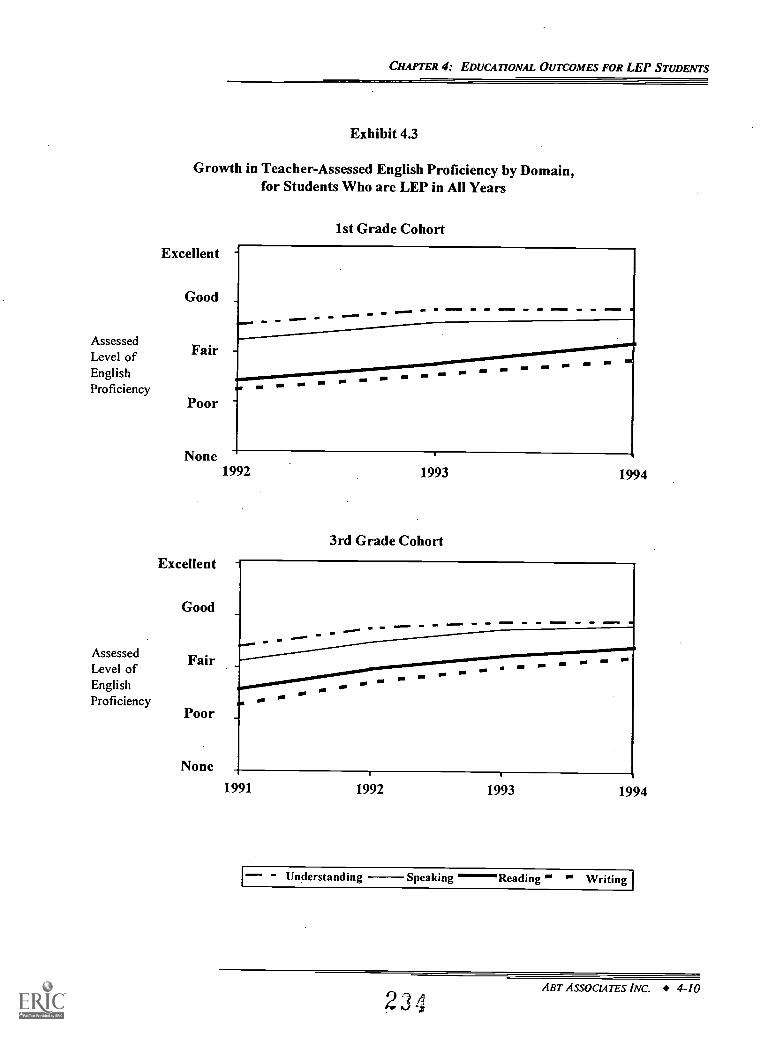
Understanding Speaking Reading " Writing I
AssessedLevel ofEnglishProficiency
AssessedLevel ofEnglishProficiency
CHAPTER 4: EDUCATIONAL OUTCOMES FOR LEP STUDENTS
Exhibit 4.3
Growth in Teacher-Assessed English Proficiency by Domain,for Students Who are LEP in All Years
1st Grade Cohort
Excellent
Good
Fair
Poor
None
3rd Grade Cohort
1991 1992 1993 1994
234ABT ASSOCIATES INC. 4-10
CHAPTER 4: EDUCATIONAL OUTCOMES FOR LEP STUDENTS
writing; evidently these very young students are still on the steep part of the learning curve for
reading and writing. The general pattern of achievement growth rates that slow over time is
typical of results from other studies of student achievement. The patterns of acquisition of
language proficiency are also consistent with other research; see for example De Avila (1997).
Based on the limited information available, it is difficult to determine how long it will take these
students to achieve English proficiency on a par with native English speakers, but the trajectories
shown suggest that these students on average will reach "good" levels of proficiency in all four
domains in approximately six to seven years overall (i.e., three years beyond the last year of
observation). This duration is also consistent with other research; for summaries of this research
see Collier (1995).
STUDENT OUTCOMES: READING ACHIEVEMENT TEST SCORES
In this section, we analyze standardized achievement test scores in reading. This analysis
includes only those LEP students who took the CTBS at least once during the Prospects study,
so the reading scores reported here represent the achievement of those LEP students who were
judged by their teachers to be capable of testing in English. As a result, this subsample of LEP
students who took the CTBS test are likely to have higher levels of English proficiency than the
LEP sample as a whole. (The analysis of mathematics achievement in the next section includes
the full LEP subsample.) We examine growth in mean test scores over time and differences in
mean scores across certain groups of students. This analysis shows that students who are LEP
in all years of the study score below both EP students and students who exit LEP status. LEP
exiters' scores are closer to those of EP students and, for the 1st grade cohort, there is evidence
that the gap in scores between these two groups narrows over time.
About 69 percent of LEP students in the 1st grade cohort and 90 percent of LEP students
in the 3rd grade cohort took the CTBS at least once during the study.' The remaining LEP
9 About 1.5 percent of students identified as EP in each year did not take the CTBS during the study period, andare therefore also excluded from this analysis. Appendix F shows the percentage of students who took the CTBSor SABE tests.
ABT ASSOCIATES INC. 4-11
2'35
CHAPTER 4: EDUCATIONAL OUTCOMES FOR LEP STUDENTS
studentsmany of whom took the Spanish-language version of the CTBS'were excluded
from this analysis of reading test scores, because of concerns about comparability between the
CTBS and SABE reading tests.
Two CTBS reading tests were administered, covering vocabulary and comprehension.
Questions on the reading vocabulary test ranged from recognizing the name of an item pictured
in the early elementary grade tests, to knowing the meaning of a word in the context of a passage
in the later elementary grade tests. Questions on the reading comprehension test ranged from
circling pictures that answer questions about a short passage read to the student in the earliest
elementary school grade tests, to questions that require a student to analyze a passage in the later
elementary school grade tests."
Reading Test Scores for All Students
The top panel of Exhibit 4.4 shows the average reading vocabulary scale scores' for all
1st grade cohort students who took the CTBS in at least one year of the Prospects study. The
scores are reported separately for: students who were identified as LEP in all years (grades 1
through 3); LEP exiters (those who were LEP in grades 1 and 2 only, or in grade I only); and
students who were English proficient in all years. At least 95 percent of LEP exiters and "never
LEP" students took the CTBS one or more times. However, only 54 percent of the students
identified as LEP in all years took the CTBS at least once (see Appendix F, Exhibit F.4).
Therefore, results for this latter group (the majority of LEP students) may not be representative.
'° If school staff judged that a student's limited English proficiency did not allow him or her to be meaningfullytested in English, and if a student's first language was Spanish, they were administered a Spanish-language testbattery, the Spanish Assessment of Basic Education (SABE). If a LEP student's first language was not Spanish andschool staff judged that the English-language version of the test would not be meaningful, the student was not testedin that year.
" For more information on the types of questions on each test, see CTB's Test Coordinator's Handbook (1990).
12 Scale scores are the only test scores used in this report. Scale scores are units on a single equal-interval scalethat is applied across all levels of the test regardless of grade or time of year of testing. These scores are expressedas numbers that may range from 0 through 999. Hence, these scores can be compared across grade levels and a 10-point difference has the same meaning at every level of the scale. For more information on scale scores, see CTB'sTechnical Bulletin (1989).
ABT ASSOCIATES INC. 4-12
2 30
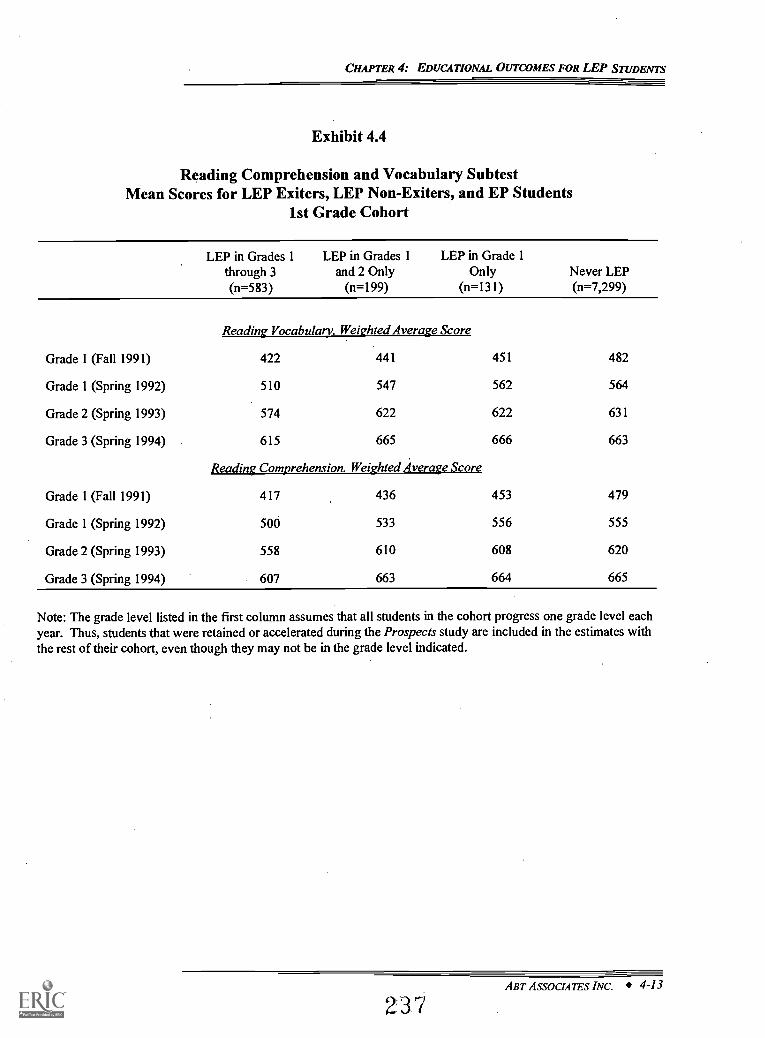
CHAPTER 4: EDUCATIONAL OUTCOMES FOR LEP STUDENTS
Exhibit 4.4
Reading Comprehension and Vocabulary SubtestMean Scores for LEP Exiters, LEP Non-Exiters, and EP Students
1st Grade Cohort
LEP in Grades 1through 3(n=583)
LEP in Grades 1 LEP in Grade 1and 2 Only Only
(n=199) (n=131)Never LEP(n=7,299)
Reading Vocabulary. Weighted Average Score
Grade 1 (Fall 1991) 422 441 451 482
Grade 1 (Spring 1992) 510 547 562 564
Grade 2 (Spring 1993) 574 622 622 631
Grade 3 (Spring 1994) 615 665 666 663
Reading Comprehension. Weighted Average Score
Grade 1 (Fall 1991) 417 436 453 479
Grade 1 (Spring 1992) 500 533 556 555
Grade 2 (Spring 1993) 558 610 608 620
Grade 3 (Spring 1994) 607 663 664 665
Note: The grade level listed in the first column assumes that all students in the cohort progress one grade level eachyear. Thus, students that were retained or accelerated during the Prospects study are included in the estimates withthe rest of their cohort, even though they may not be in the grade level indicated.
ABT ASSOCIATES INC. 4-13
237
CHAPTER 4: EDUCATIONAL OUTCOMES FOR LEP STUDENTS
The first column of the exhibit shows that average scores for students identified as LEP
in all three grades rise from 422 in the fall of 1st grade to 615 in the spring of 3rd grade. These
scores are consistently below those of LEP exiters and EP students. On the other hand, the
scores for LEP exiterswhich start out 30 to 40 points below those of EP studentsare
comparable to those of EP students by the end of the study period."
The bottom panel of Exhibit 4.4 shows a very similar story for the average reading
comprehension test scores for the same groups of 1st grade cohort students. Students identified
as LEP in all three years score well below LEP exiters and EP students in every year. But LEP
exiters catch up to EP students, and by 3rd grade LEP exiters have the same mean reading
comprehension scores as EP students.
Exhibit 4.5 presents the analogous information for the 3rd grade cohort. Nearly all LEP
exiters and EP students, and 81 percent of students identified as LEP in all four years, took the
CTBS at least once (see Exhibit F.4 in Appendix F).
As was true for the 1st grade cohort, students in the 3rd grade cohort who were identified
as LEP in all four years had lower reading scores than LEP exiters and EP students.'4 The size
of the gap between "always" LEP students and EP students is similar to the gap for the 1st grade
cohort. Unlike for the 1st grade cohort, however, LEP exiters' scores do not catch up to the
scores of EP students. This result is consistent with a compositional difference between LEP
students in the 1st and 3rd grade cohorts, as discussed in Chapter 2. Finally, earlier LEP
exiterswho typically entered the study with higher levels of proficiency in Englishhave
consistently higher scores than later LEP exiters.
Overall, the reading results suggest that, as with the main study findings for Chapter 1,
programs as then configured were not fully closing the gap in performance among students.
" Standard deviations are largest for EP students and smallest for students who were LEP in all years. Forexample, standard deviations for reading vocabulary for EP students in the 1st grade cohort are about 60 points,compared to about 45 points for students who are LEP in all years. Standard deviations are about 15 to 20 pointslarger for reading comprehension than for reading vocabulary. CTB's Technical Bulletin (1989) also shows thatstandard deviations of reading test scores decline with grade level.
14 Standard deviations in reading test scores are smaller for the 3rd grade cohort than for the 1st grade cohort,although the patterns are similar. Standard deviations for reading vocabulary for EP students in the 3rd grade cohortare about 50 points, compared to about 40 points for students who are LEP in all years. For reading comprehension,standard deviations are about 60 points for EP students and 40 points for students who are LEP in all years.
ABT ASSOCIATES INC. 4-14
238
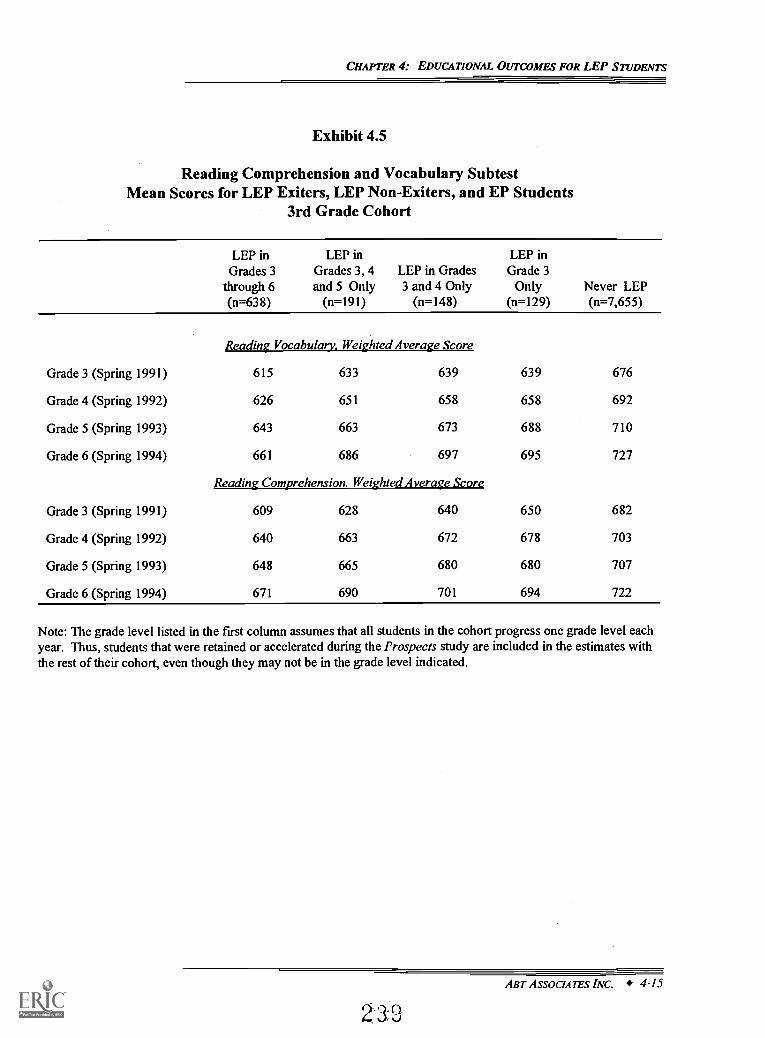
CHAPTER 4: EDUCATIONAL OUTCOMES FOR LEP STUDENTS
Exhibit 4.5
Reading Comprehension and Vocabulary SubtestMean Scores for LEP Exiters, LEP Non-Exiters, and EP Students
3rd Grade Cohort
LEP in LEP in LEP inGrades 3 Grades 3, 4 LEP in Grades Grade 3
through 6 and 5 Only 3 and 4 Only Only Never LEP(n=638) (n=191) (n=148) (n=129) (n=7,655)
Reading Vocabulary. Weighted Average Score
Grade 3 (Spring 1991) 615 633 639 639 676
Grade 4 (Spring 1992) 626 651 658 658 692
Grade 5 (Spring 1993) 643 663 673 688 710
Grade 6 (Spring 1994) 661 686 697 695 727
Reading Comprehension. Weighted Average Score
Grade 3 (Spring 1991) 609 628 640 650 682
Grade 4 (Spring 1992) 640 663 672 678 703
Grade 5 (Spring 1993) 648 665 680 680 707
Grade 6 (Spring 1994) 671 690 701 694 722
Note: The grade level listed in the first column assumes that all students in the cohort progress one grade level eachyear. Thus, students that were retained or accelerated during the Prospects study are included in the estimates withthe rest of their cohort, even though they may not be in the grade level indicated.
/ler ASSOCIATES INC. 4-15
2 3 9
CIL4PTER 4: EDUCATIONAL OUTCOMES FOR LEP STUDENTS
Students who were identified as LEP by the study during each year of the study started with
lower reading scores. While they made important gains, they continued to have lower scores than
their EP schoolmates during every year of the study. On the other hand, students who exited
LEP status quickly tended to start with higher levels of English proficiency than students who
did not change LEP status. By the end of the study these exiters did not perform very differently
from their EP counterparts.
The persistence of initial differences in outcomes for most LEP students is consistent with
other results in this report and suggests that, at least during the three to four year period covered
by this study, where a student starts has an important influence on where he or she ends up.
Reading Test Scores for Low-Income Students
We also examined CTBS reading test scores for low-income LEP and EP students. As
explained earlier in this chapter, low-income students are defined as those in families with an
average annual income less than 185 percent of the poverty level and who attend low-income
schools (i.e., schools in which at least one-half of the students are eligible for free or reduced-
price meals). Restricting the analysis to low-income students allows us to control partly for the
greater level of economic disadvantage faced by LEP students relative to EP students.
Exhibit 4.6 shows that, as with the results above, students who are LEP in all years
consistently score below EP students and LEP exiters. 'There appears to be some catch up during
the first grade year: the gap is larger in the beginning of grade 1 than at the end of grade 1,
although the gap is stable thereafter. On the other hand, there is no evidence of a gap between
LEP exiters and EP students. After controlling for low-income status, LEP exiters in the 1st
grade cohort generally have the same, or slightly higher, reading test scores as their EP
counterparts in every year. This suggests that differences in economic status are part of the
reason for the differences in test scores between LEP exiters and EP students seen in the previous
section.'
15 Standard deviations in reading test scores are about 5 points smaller for low-income students compared to allstudents. The patterns are similar to those for all students: standard deviations are smaller for "always" LEP studentsthan for EP students, and are smaller for reading vocabulary than for reading comprehension.
ABT ASSOCIATES INC. 4-16
210
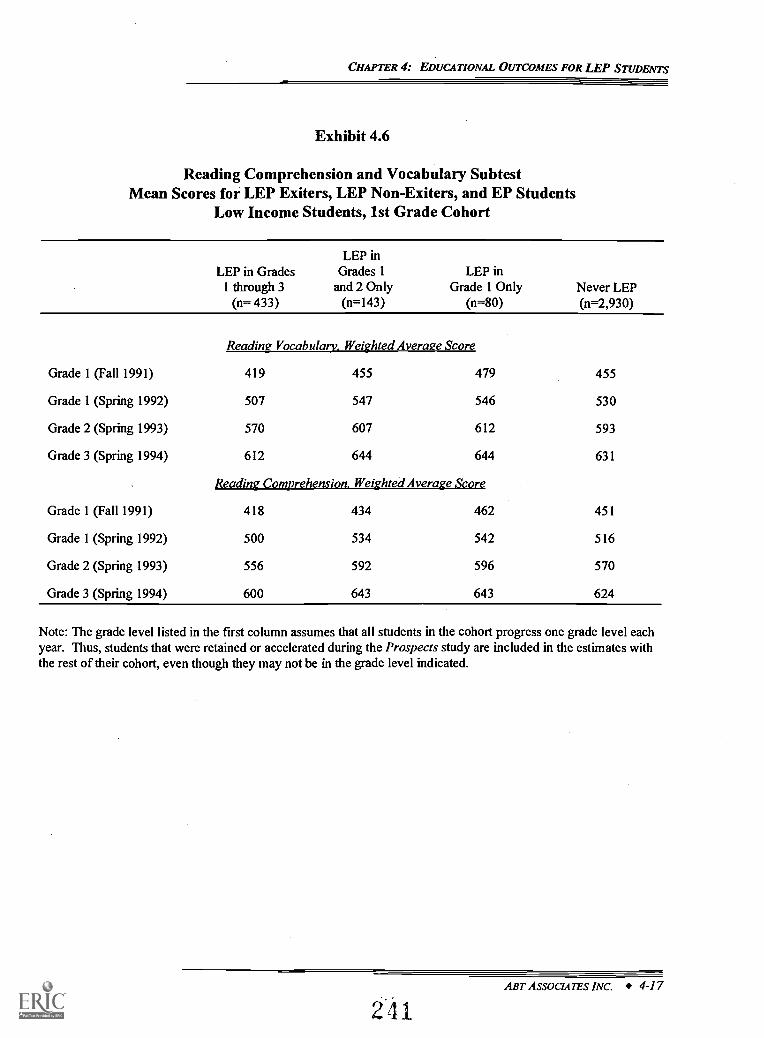
CHAPTER 4: EDUCATIONAL OUTCOMES FOR LEP STUDENTS
Exhibit 4.6
Reading Comprehension and Vocabulary SubtestMean Scores for LEP Exiters, LEP Non-Exiters, and EP Students
Low Income Students, 1st Grade Cohort
LEP inLEP in Grades Grades 1 LEP in
1 through 3 and 2 Only Grade 1 Only Never LEP(n= 433) (n=143) (n=80) (n=2,930)
Reading Vocabulary. Weighted Average Score
Grade 1 (Fall 1991) 419 455 479 455
Grade 1 (Spring 1992) 507 547 546 530
Grade 2 (Spring 1993) 570 607 612 593
Grade 3 (Spring 1994) 612 644 644 631
Reading Comprehension. Weighted Average Score
Grade 1 (Fall 1991) 418 434 462 451
Grade 1 (Spring 1992) 500 534 542 516
Grade 2 (Spring 1993) 556 592 596 570
Grade 3 (Spring 1994) 600 643 643 624
Note: The grade level listed in the first column assumes that all students in the cohort progress one grade level eachyear. Thus, students that were retained or accelerated during the Prospects study are included in the estimates withthe rest of their cohort, even though they may not be in the grade level indicated.
ABT ASSOCIATES INC. 4- 1 7
241
CHAPTER 4: EDUCATIONAL OUTCOMES FOR LEP STUDENTS
The results for low-income students in the 3rd grade cohort, shown in Exhibit 4.7, are
generally similar. Again, scores for students who are LEP in all years are lower than those for
LEP exiters and EP students. The initial test scores for LEP exiters are below those of EP
students, but LEP exiters catch up or come very close by the end of the observation period. As
with the 1st grade cohort, these results, compared with the results of the previous section, suggest
that LEP students' greater economic disadvantage is partly responsible for their test scores being
lower than those of EP students.
STUDENT OUTCOMES: MATH ACHIEVEMENT TEST SCORES
In addition to CTBS reading scores, we analyzed CTBS scale scores for math applications
(SSMA) and math computation (SSMC). There are two key differences between the math and
reading test analyses. First, the math test analysis includes students who took the SABE; their
scores were converted to CTBS equivalents.' This was not done for reading scores because
of concerns about comparability between the CTBS and SABE. Second, and in part because of
the lesser concern about comparability, we used hierarchical linear models (HLM) for the math
score analysis, a more rigorous approach than computing mean test scores.
Hierarchical linear modeling is a form of regression analysis that is appropriate when, as
in the Prospects context, the outcomes of interest occur within a multilevel structure. For
example, the Prospects study collected test scores at multiple time points for the same student,
for multiple students in the same classroom, and for multiple classrooms in the same school.
Hierarchical models take into account this natural nesting process to provide a more detailed
picture of how test scores differ. Unlike simpler approaches, hierarchical models can estimate
the extent to which test score differences are related to person-level characteristics as opposed to
classroom-level or school-level factors. For a detailed discussion of how hierarchical linear
models can be used to analyze test scores for the Prospects sample, see Puma et al. (1996).
16 Exhibits F.2 and F.3 in Appendix F provide detail on the number of LEP and EP students who took the CTBSand SABE tests, and the number of times students took these tests. In brief, nearlyevery LEP student in our sample(98 percent) took the CTBS or SABE at least once during the study period, and most students took the tests onmultiple occasions.
ART ASSOCIATES INC. 4-18
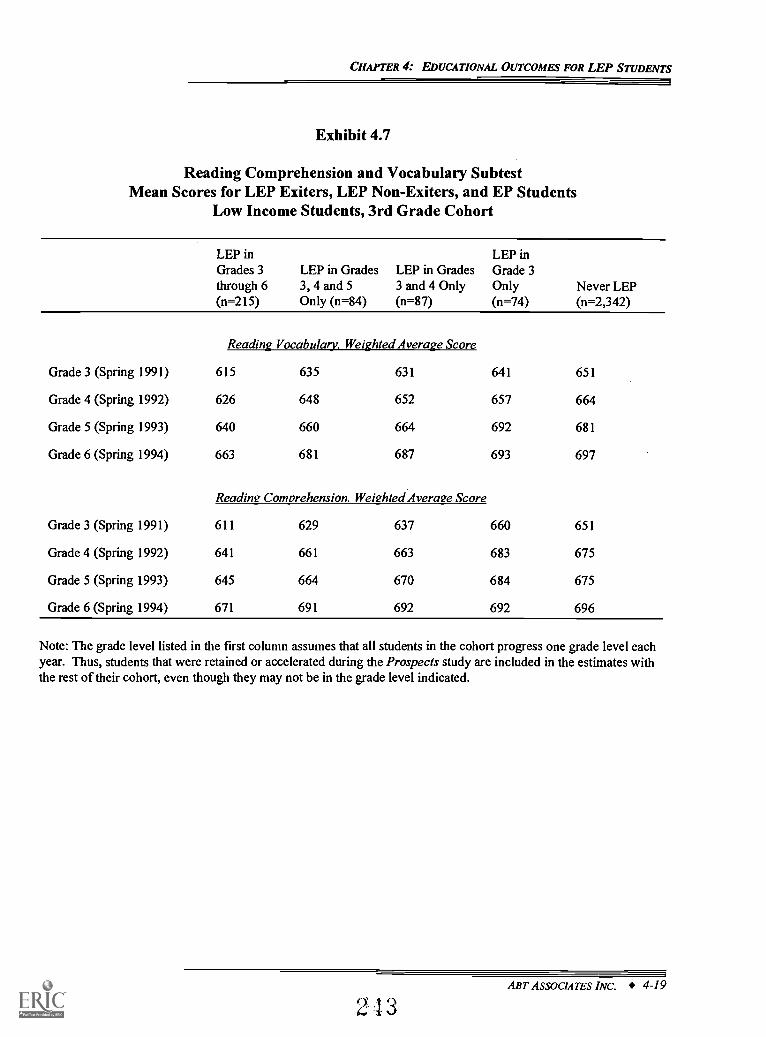
CHAPTER 4: EDUCATIONAL OUTCOMES FOR LEP STUDENTS
Exhibit 4.7
Reading Comprehension and Vocabulary SubtestMean Scores for LEP Exiters, LEP Non-Exiters, and EP Students
Low Income Students, 3rd Grade Cohort
LEP inGrades 3through 6(n=215)
LEP in Grades3, 4 and 5Only (n=84)
LEP in Grades3 and 4 Only(n=87)
LEP inGrade 3Only(n=74)
Never LEP(n=2,342)
Reading Vocabulary. Weighted Average Score
Grade 3 (Spring 1991) 615 635 631 641 651
Grade 4 (Spring 1992) 626 648 652 657 664
Grade 5 (Spring 1993) 640 660 664 692 681
Grade 6 (Spring 1994) 663 681 687 693 697
Reading Comprehension. Weighted Average Score
Grade 3 (Spring 1991) 611 629 637 660 651
Grade 4 (Spring 1992) 641 661 663 683 675
Grade 5 (Spring 1993) 645 664 670 684 675
Grade 6 (Spring 1994) 671 691 692 692 696
Note: The grade level listed in the first column assumes that all students in the cohort progress one grade level eachyear. Thus, students that were retained or accelerated during the Prospects study are included in the estimates withthe rest of their cohort, even though they may not be in the grade level indicated.
ABT ASSOCIATES INC. 4-19
2 13
CHAPTER 4: EDUCATIONAL OUTCOMES FOR LEP STUDENTS
The approach used in this report differs from the approach in the main Prospects report
in that here we do not include multiple explanatory variables in the models; instead, test scores
are modeled solely as a function of increasing grade level (which, for non-retained students, is
equivalent to modeling test scores as a function of time). So the model employed here shows
how math test scores increase with each grade level, and how initial test scores differ across
subgroups of LEP students and EP students. The advantage of a hierarchical model in this
context, compared to simply calculating mean test scores at each grade level, is that the model
allows us to determine when differences in test scores between groups of students (e.g., LEP
exiters versus nonexiters) are meaningful (i.e., statistically significant). See Appendix G for a
description of the structure of the model used in this chapter.
Separate models were fit for each math scale score in each cohort and for two contrasting
samples: all LEP students compared to all EP students, and low-income LEP students compared
to low-income EP students. Estimates for LEP students were derived separately for non-exiters
and for the several types of exiters.
We began this analysis by estimating exploratory models to identify the appropriate
functional form for growth in test scores. On average, CTBS scale score gains were greater from
1st to 2nd grade than from 2nd to 3rd grade." Estimating a model with a linear function of
grade is appealing because of its simplicity and familiarity to most readers. Therefore, we used
an appropriate linearizing transformation for the 1st grade cohort data to take into account the
steeper slope from 1st to 2nd grade than from 2nd to 3rd grade."
The discussion that follows focuses first on the math applications and computations results
for all LEP students compared to all EP students, and then discusses the results for the analogous
low-income groups.
17 No such differences were found in the data for the 3rd grade cohort.
18 This means that the cohort parameter estimates shown in Appendix H are for transformed data. To see, forexample, how many points LEP111 students were below EP students in the first grade, one needs to transform thepredictions back to the original scale. Further details on this transformation can be found in Puma et al. (1996).
ABT ASSOCIATES INC. 4-20
2 14
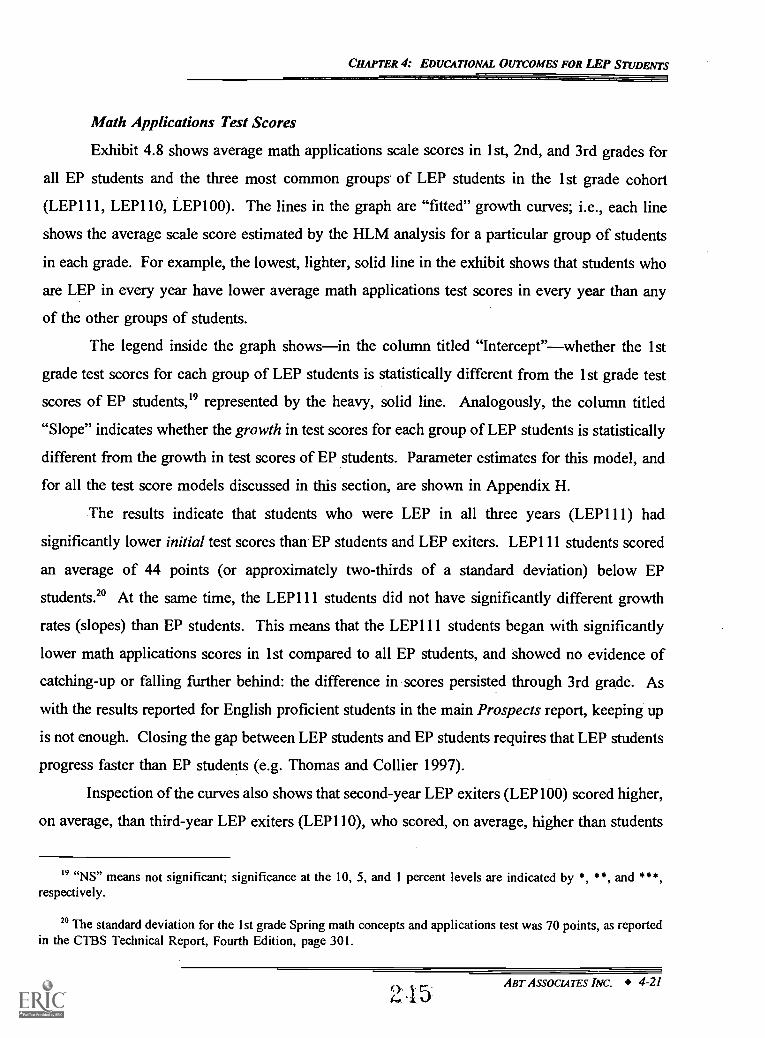
CHAPTER 4: EDUCATIONAL OUTCOMES FOR LEP STUDENTS
Math Applications Test Scores
Exhibit 4.8 shows average math applications scale scores in 1st, 2nd, and 3rd grades for
all EP students and the three most common groups. of LEP students in the 1st grade cohort
(LEP111, LEP110, LEP100). The lines in the graph are "fitted" growth curves; i.e., each line
shows the average scale score estimated by the HLM analysis for a particular group of students
in each grade. For example, the lowest, lighter, solid line in the exhibit shows that students who
are LEP in every year have lower average math applications test scores in every year than any
of the other groups of students.
The legend inside the graph showsin the column titled "Intercept"whether the 1st
grade test scores for each group of LEP students is statistically different from the 1st grade test
scores of EP students,'9 represented by the heavy, solid line. Analogously, the column titled
"Slope" indicates whether the growth in test scores for each group of LEP students is statistically
different from the growth in test scores of EP students. Parameter estimates for this model, and
for all the test score models discussed in this section, are shown in Appendix H.
The results indicate that students who were LEP in all three years (LEP111) had
significantly lower initial test scores than EP students and LEP exiters. LEP111 students scored
an average of 44 points (or approximately two-thirds of a standard deviation) below EP
students." At the same time, the LEP111 students did not have significantly different growth
rates (slopes) than EP students. This means that the LEP111 students began with significantly
lower math applications scores in 1st compared to all EP students, and showed no evidence of
catching-up or falling further behind: the difference in scores persisted through 3rd grade. As
with the results reported for English proficient students in the main Prospects report, keeping up
is not enough. Closing the gap between LEP students and EP students requires that LEP students
progress faster than EP students (e.g. Thomas and Collier 1997).
Inspection of the curves also shows that second-year LEP exiters (LEP100) scored higher,
on average, than third-year LEP exiters (LEP110), who scored, on average, higher than students
19 "NS" means not significant; significance at the 10, 5, and 1 percent levels are indicated by *, **, and ***,respectively.
20 The standard deviation for the 1st grade Spring math concepts and applications test was 70 points, as reportedin the CTBS Technical Report, Fourth Edition, page 301.
I 5-
ABT ASSOCIATES INC. 4-21
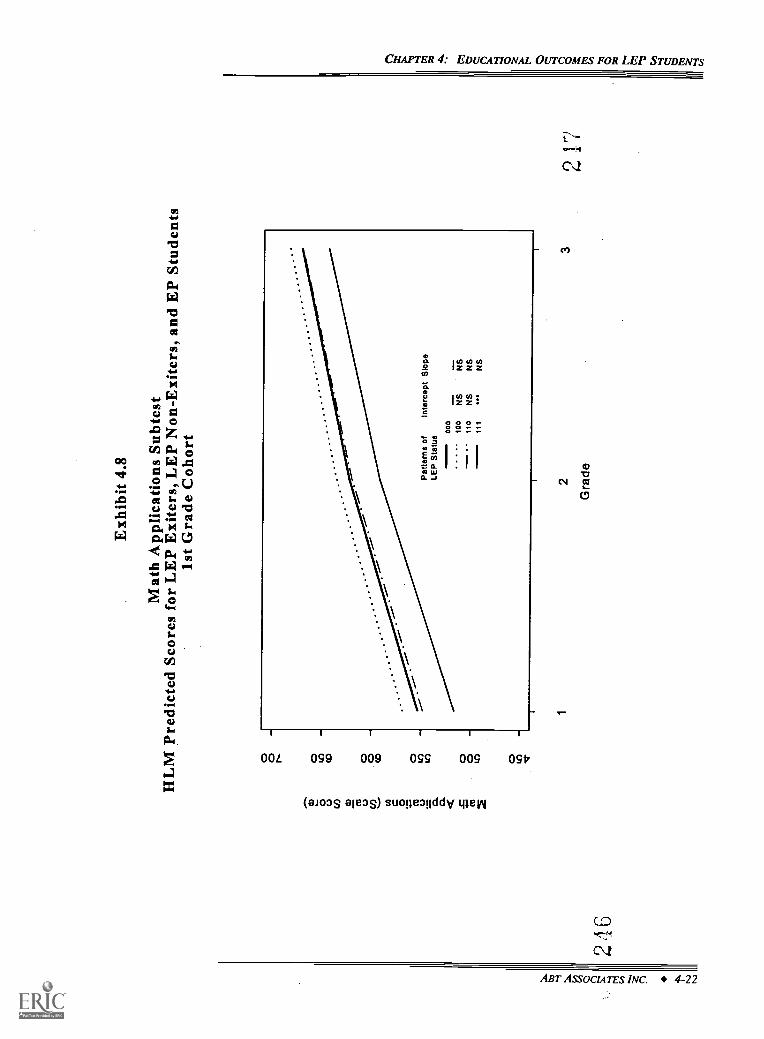
246
Exh
ibit
4.8
Mat
h A
pplic
atio
ns S
ubte
stH
LM
Pre
dict
ed S
core
s fo
r L
EP
Exi
ters
, LE
P N
on-E
xite
rs, a
nd E
P St
uden
tsls
t Gra
de C
ohor
t
12
Gra
de3
21
CHAPTER 4: EDUCATIONAL OUTCOMES FOR LEP STUDENTS
who were LEP in all three years (LEP111), a pattern repeated below in other exhibits. Although
second-year LEP exiters (LEP100) had estimated average scores that were higher than those of
EP students, there were no statistically significant differences in the estimated intercepts and
slopes of this group of LEP exiters relative to those of all EP students. Nevertheless, this is the
same pattern of results (LEP non-exiters having lower outcomes in every year than LEP exiters)
as for teacher assessments of English proficiency, presented earlier in the chapter.
Exhibit 4.9 presents the analogous information for math applications test scores for the
3rd grade cohort. The pattern of results here is generally similar to that for the 1st grade cohort:
at each time point LEP non-exiters scored significantly below EP students, and below LEP
exiters. Unlike the 1st grade cohort, all of the groups of LEP students shown on the 3rd grade
cohort plot had significantly lower initial test scores than EP students.
There is, however, some evidence of catch-up for students in this cohort: the growth rate
in test scores for LEP non-exiters, and for third- and fourth-year exiters, was significantly higher
than that of EP students, although the point estimates are fairly small (about 5 scale score points
gained per year). LEP students were still scoring below EP students in the 6th grade, on average,
but the gap was not as great as it had been in 3rd grade.
As with English proficiency ratings in the 3rd grade cohort, those who left LEP status
sooner scored better. Taken together, the math applications results are somewhat more
encouraging for the 3rd grade cohort than for the 1st grade cohort.
Math Computation Test Scores
Exhibit 4.10 shows the estimated growth curves and parameter estimates for the math
computation scores of the 1st grade cohort, again comparing all LEP students to all EP students.
(Results for low-income students are reported in the next section.) Although the pattern of
growth curves looks similar to the pattern for the math applications test score analysis, presented
above, there are some differences in statistical significance. The test scores of LEP nonexiters
do not differ significantlyeither in initial level or growth ratefrom the scores of all EP
students. On the other hand, second year-exiters (LEP100) and third year-exiters (LEP110) had
significantly higher initial test scores (intercept levels) than EP students. Among the subgroups
of LEP students, early exiters scored higher than later exiters, who scored higher than non-exiters,
ABT ASSOCIATES INC. 4-23
248
2 10
Exh
ibit
4.9
Mat
h A
pplic
atio
ns S
ubte
stH
LM
Pre
dict
ed S
core
s fo
r L
EP
Exi
ters
, LE
PN
on-E
xite
rs, a
nd E
P St
uden
ts3r
d G
rade
Coh
ort
CO
tit t
s..r
eA
...,
or.-
.: .
......
..
Pat
tern
s of
LEP
Sta
tus
0000
1100
1110
1111
Inte
rcep
tS
lope
NS
34
Gra
de
56
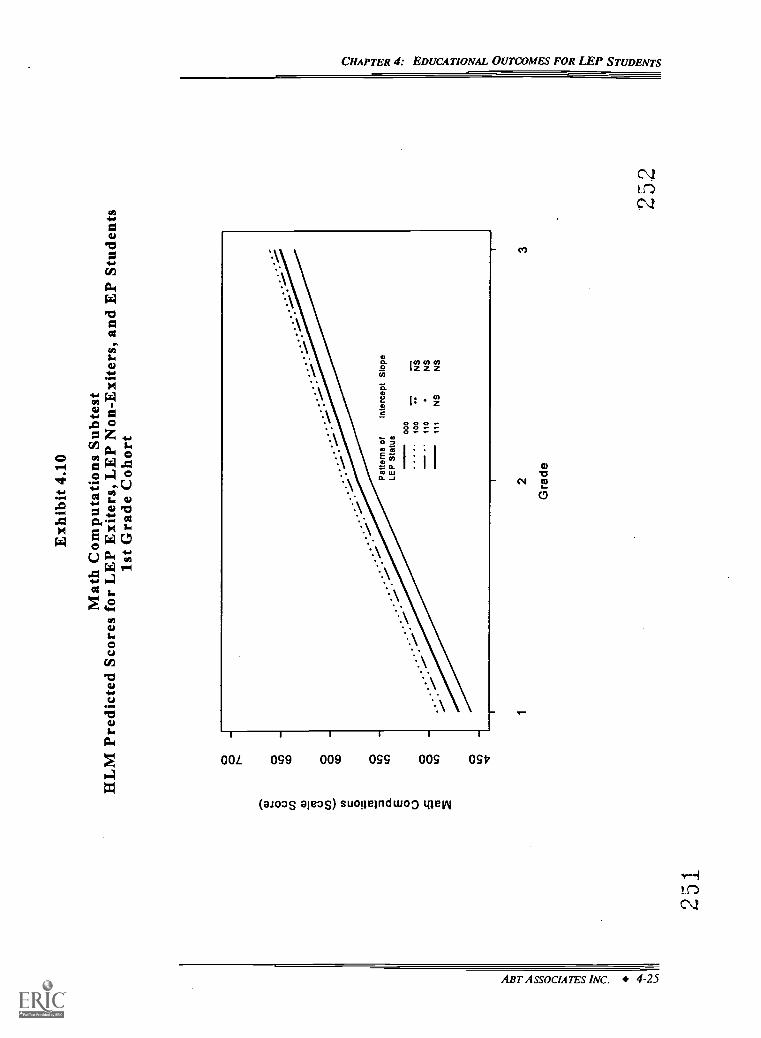
251
Exh
ibit
4.10
Mat
h C
ompu
tatio
ns S
ubte
stH
LM
Pre
dict
ed S
core
s fo
r L
EP
Exi
ters
, LE
P N
on-E
xite
rs, a
nd E
P St
uden
ts1s
t Gra
de C
ohor
t
0 Co
LI"
L()
Pat
tern
s of
Inte
rcep
t Slo
peLE
P S
tatu
s
12
Gra
de
3
252
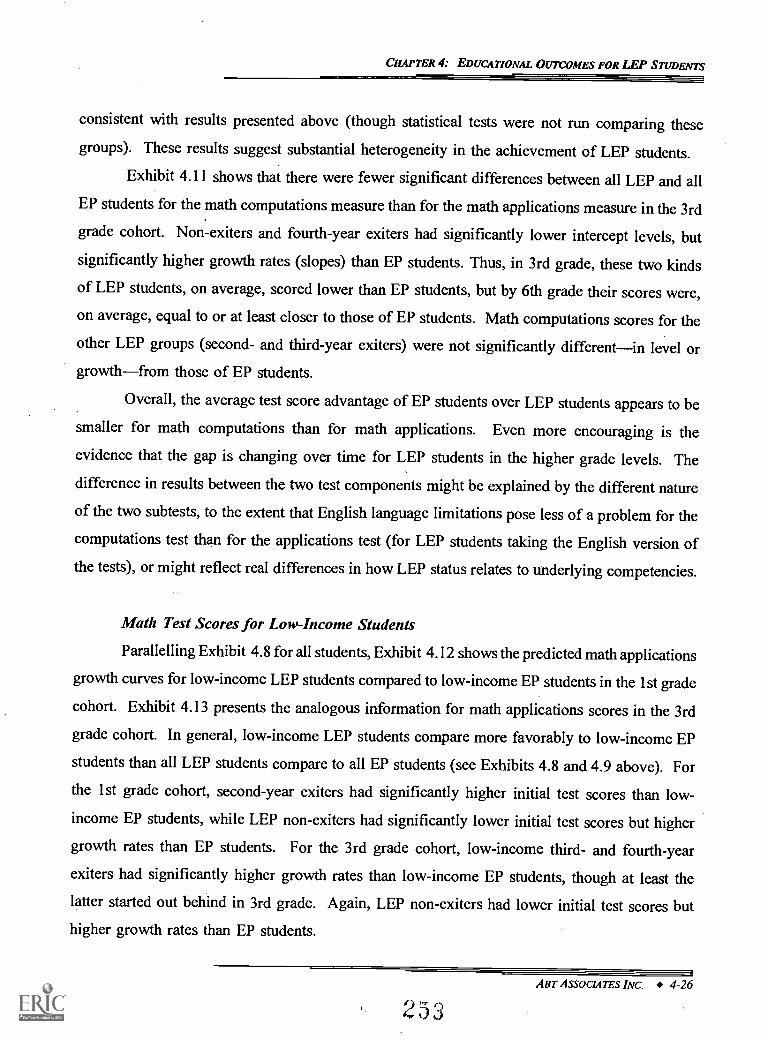
CHAPTER 4: EDUCATIONAL OUTCOMES FOR LEP STUDENTS
consistent with results presented above (though statistical tests were not run comparing these
groups). These results suggest substantial heterogeneity in the achievement of LEP students.
Exhibit 4.11 shows that there were fewer significant differences between all LEP and all
EP students for the math computations measure than for the math applications measure in the 3rd
grade cohort. Non-exiters and fourth-year exiters had significantly lower intercept levels, but
significantly higher growth rates (slopes) than EP students. Thus, in 3rd grade, these two kinds
of LEP students, on average, scored lower than EP students, but by 6th grade their scores were,
on average, equal to or at least closer to those of EP students. Math computations scores for the
other LEP groups (second- and third-year exiters) were not significantly differentin level or
growthfrom those of EP students.
Overall, the average test score advantage of EP students over LEP students appears to be
smaller for math computations than for math applications. Even more encouraging is the
evidence that the gap is changing over time for LEP students in the higher grade levels. The
difference in results between the two test components might be explained by the different nature
of the two subtests, to the extent that English language limitationspose less of a problem for the
computations test than for the applications test (for LEP students taking the English version of
the tests), or might reflect real differences in how LEP status relates to underlying competencies.
Math Test Scores for Low-Income Students
Parallelling Exhibit 4.8 for all students, Exhibit 4.12 shows the predicted math applications
growth curves for low-income LEP students compared to low-income EP students in the 1st grade
cohort. Exhibit 4.13 presents the analogous information for math applications scores in the 3rd
grade cohort. In general, low-income LEP students compare more favorably to low-income EP
students than all LEP students compare to all EP students (see Exhibits 4.8 and 4.9 above). For
the 1st grade cohort, second-year exiters had significantly higher initial test scores than low-
income EP students, while LEP non-exiters had significantly lower initial test scores but higher
growth rates than EP students. For the 3rd grade cohort, low-income third- and fourth-year
exiters had significantly higher growth rates than low-income EP students, though at least the
latter started out behind in 3rd grade. Again, LEP non-exiters had lower initial test scores but
higher growth rates than EP students.
ABT ASSOCIATES INC. 4-26
233
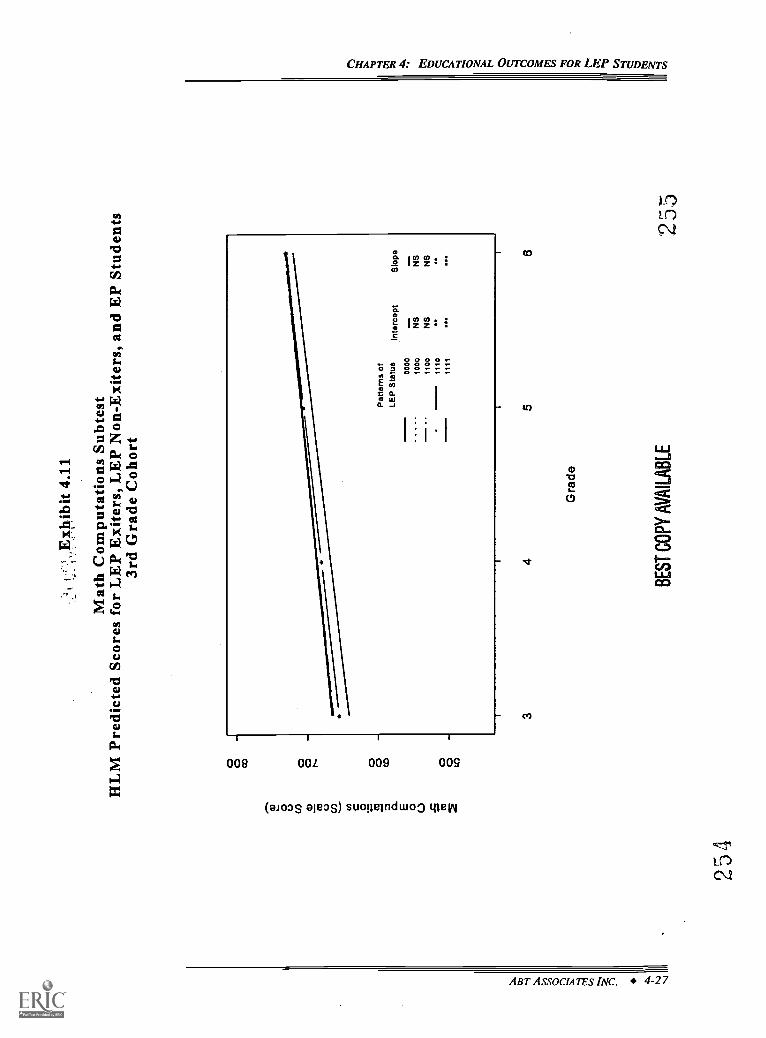
254
1E
xhib
it 4.
11
Mat
h C
ompu
tatio
ns S
ubte
stH
LM
Pre
dict
ed S
core
s fo
r L
EP
Exi
ters
, LE
P N
on-E
xite
rs, a
nd E
P St
uden
ts3r
d G
rade
Coh
ort
34
Gra
de
BE
ST
CO
PY
AV
AIL
AB
LE
56
255
o 4.
.Exh
ibit.
41:1
2
Mat
h A
pplic
atio
ns S
ubte
stA
LM
Pre
dict
ed S
core
s fo
r L
EP
Exi
ters
, LE
PN
on-E
xite
rs, a
nd E
P St
uden
tsL
ow I
ncom
e St
uden
ts1s
t Gra
de C
ohor
t
2
Gra
de
BE
ST
CO
PY
AV
AIL
AB
LE
3
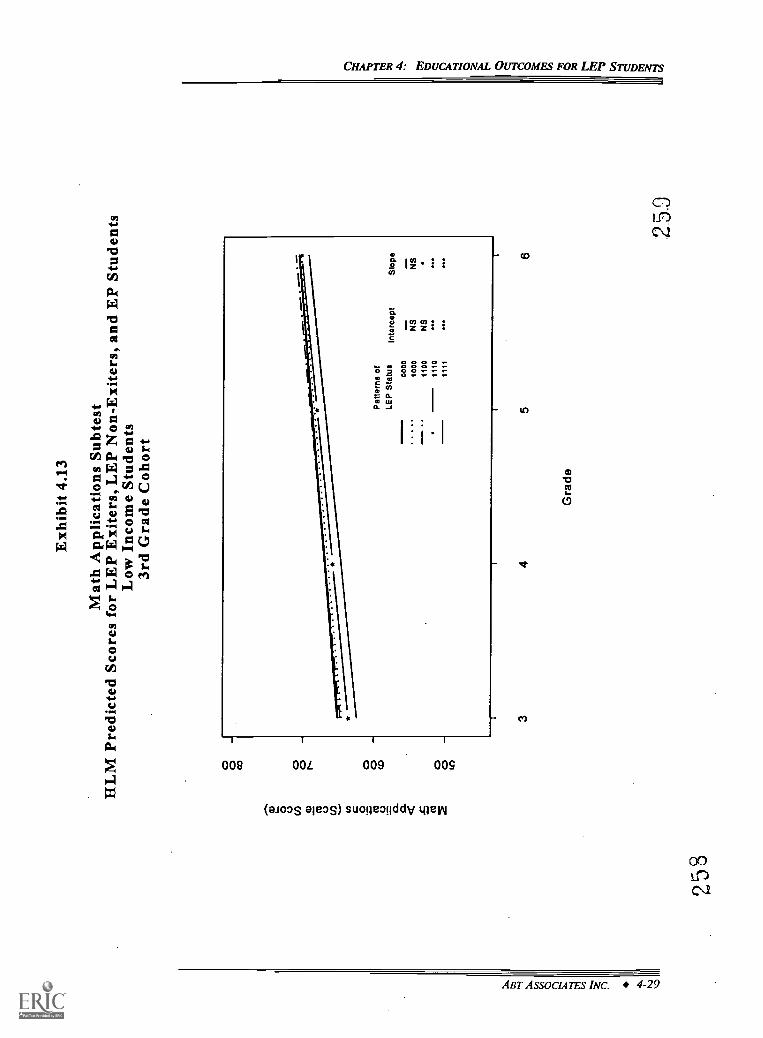
258
Exh
ibit
4.13
Mat
h A
pplic
atio
ns S
ubte
stH
LM
Pre
dict
ed S
core
s fo
r L
EP
Exi
ters
, LE
P N
on-E
xite
rs, a
nd E
P St
uden
tsL
ow I
ncom
e St
uden
ts3r
d G
rade
Coh
ort
34
Gra
de
56
250
CHAPTER 4: EDUCATIONAL OUTCOMES FOR LEP STUDENTS
Exhibit 4.14 shows growth curves for the math computation scores of low-income students
in the 1st grade cohort. Exhibit 4.15 shows the analogous information for low-income students
in the 3rd grade cohort. In the 1st grade cohort, low-income LEP exiters had significantly higher
initial test scores than low-income EP students, while LEP non-exiters were not significantly
different from low-income EP students. In the 3rd grade cohort, both LEP non-exiters and
fourth-year exiters had higher growth rates than low-income EP students, although non-exiters
also had lower initial computation scores in 3rd grade. The other two groups of LEP exiters did
not differ significantly from EP students.
These results suggest that, overall, after controlling for economic differences between LEP
and EP students, the math achievement levels of LEP studentsas measured by test scoresisnot so different from that of EP students. Where low-income LEP students have lower initial
scores, there is evidence that they move closer to low-income EP students over time.
STUDENT OUTCOMES: RETENTION IN GRADE
Grade retention is an important predictor of future educational success. Prior research has
shown that students who have been retained are more likely to subsequently drop out of school
(see, for example, Fine 1986; Wehlage and Rutter 1986).
As mentioned at the beginning of this chapter, we examined two measures of retention
in grade. First, parents were asked if their child had ever been retained in grade. Second, we
constructed an indicator of grade retention based on students' observed grade progression over
the course of the study. Because the first measure covers all years in school, and the second
measure covers only the years of this study, we expect higher retention rates from the first
measure. The results presented below confirm this expectation.
Parents' Reports of Retention
For the 1st grade cohort, 19 percent of all LEP students and 14 percent of all EP students
were retained in grade. For the 3rd grade cohort, this rises to 25 percent of LEP and 17 percent
of EP students, according to parents' reports.
ABT ASSOCIATE'S INC. 4-30
2 0
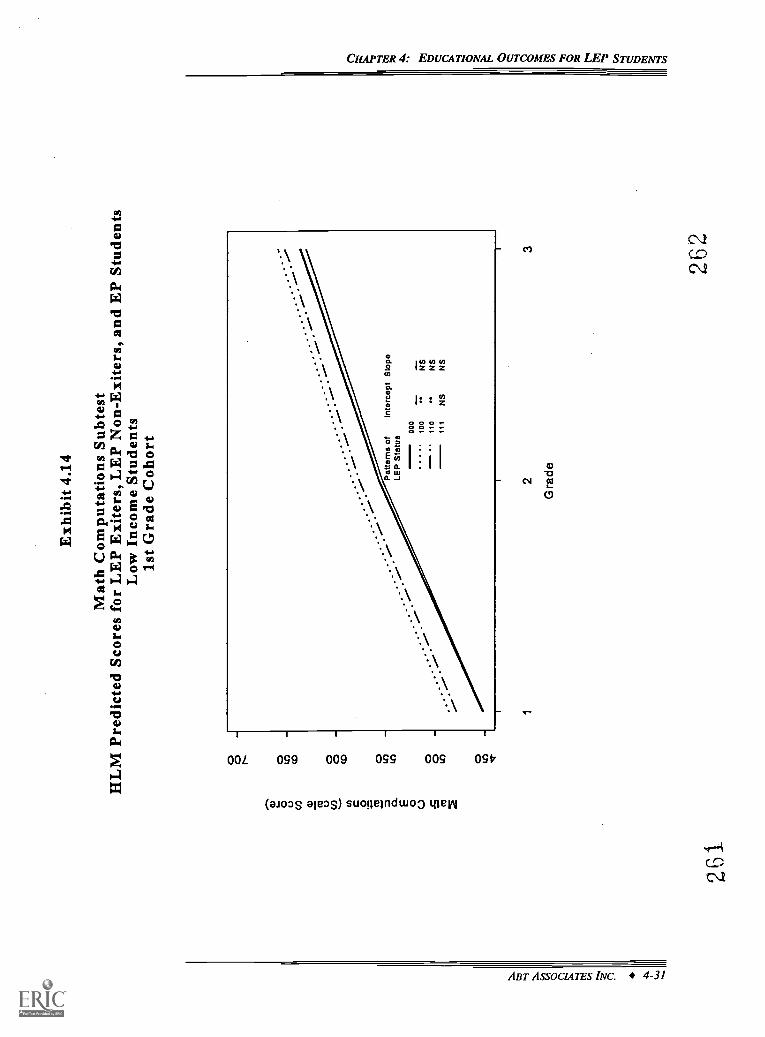
261
Exh
ibit
4.14
Mat
h C
ompu
tatio
ns S
ubte
stH
LM
Pre
dict
ed S
core
s fo
r L
EP
Exi
ters
, LE
P N
on-E
xite
rs, a
nd E
P St
uden
tsL
ow I
ncom
e St
uden
ts1s
t Gra
de C
ohor
t
141
(I) co a 0
.
.'0
:0;
Pat
tern
s of
LEP
Sta
tus
000
100
110
111
Inte
rcep
t Slo
pe
NS
NS
NS
NS
2
Gra
de
3
262
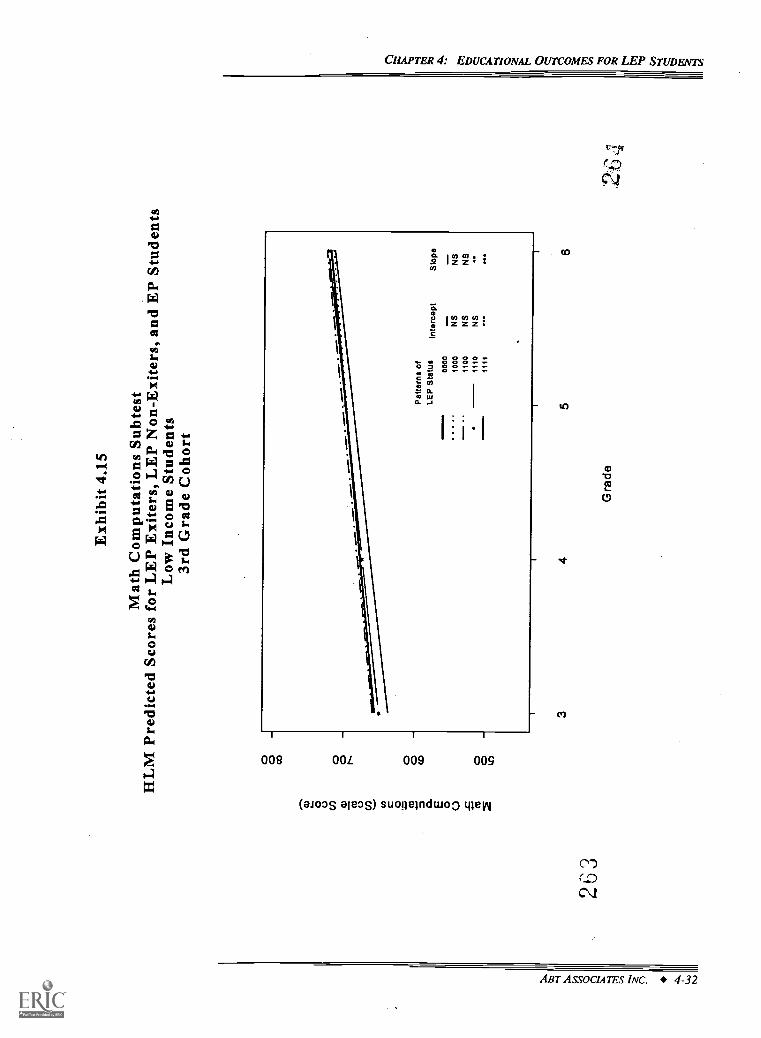
2 6
3
Exh
ibit
4.15
Mat
h C
ompu
tatio
ns S
ubte
stH
LM
Pre
dict
ed S
core
s fo
r L
EP
Exi
ters
, LE
PN
on-E
xite
rs, a
nd E
P St
uden
tsL
ow I
ncom
e St
uden
ts3r
d G
rade
Coh
ort
34
Gra
de
56
CHAPTER 4: EDUCATIONAL OUTCOMES FOR LEP STUDENTS
It is not surprising that the estimates for this cumulative measure of retention are higher
for the 3rd grade cohort, because these students have been in school longer and therefore had
more opportunities to be retained. The differences between the estimated retention rates for LEP
and EP students are probably not large enough to be statistically meaningful, given the small
unweighted sample size.
Retention Based on Observed Grade Sequence
For students in the 1st grade cohort, the normal and expected sequence of grades is to
advance from 1st to 2nd to 3rd grade over the three years of the Prospects study. But, for
example, students who repeat 1st grade in the second year have an observed grade sequence of
1st grade, 1st grade, 2nd grade. For convenience, we use the following notation to refer to
students that followed particular grade sequences: "123" refers to students that followed the
normal grade sequence, "112" refers to students who repeated 1st grade, "122" refers to students
who repeated second grade, and so on.
Analogous notation was used to show grade progression for the 3rd grade cohort. For
example, students who followed the normal sequence of third to fourth to fifth to sixth grade over
the four years of the study are indicated as "3456."
Exhibit 4.16 shows the weighted frequencies of all LEP and all EP students in both the
1st and 3rd grade cohorts who followed the normal sequence, or repeated 1st, 2nd, 3rd, 4th, or
5th grade. Also shown is a breakdown of frequencies for LEP students according to their
patterns of LEP status (i.e., always LEP, second-year exiter, third-year exiter, all other). The
exhibit shows that, for the 1st grade cohort, similar percentages of LEP and EP students (about
6 percent) repeated 1st or 2nd grade.
For the 3rd grade cohort, less than 5 percent of LEP students and less than 3 percent of
EP students were retained in 3rd, 4th, or 5th grade. The exhibit also suggests that yearly
retention rates were generally higher for the 1st grade cohort than for the 3rd grade cohort,
although the differences here are small and the pattern is not entirely consistent. In general, then,
the grade sequence data provide no evidence that LEP students as a whole are retained more often
than all EP students. Further, there are no consistent differences in retention rates among LEP
non-exiters and second- and third-year LEP exiters.
ABT ASSOCIATES INC. 4-33
265
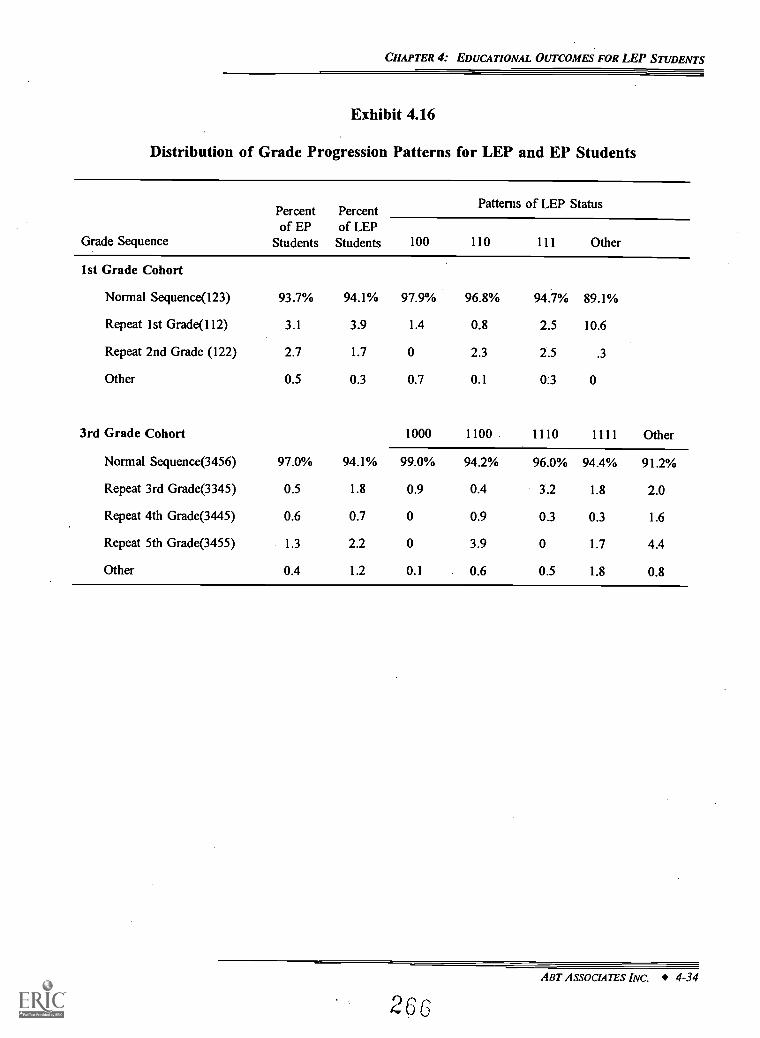
CHAPTER 4: EDUCATIONAL OUTCOMES FOR LEP STUDENTS
Exhibit 4.16
Distribution of Grade Progression Patterns for LEP and EP Students
Grade Sequence
Percentof EP
Students
Percentof LEP
Students
Patterns of LEP Status
100 110 111 Other
1st Grade Cohort
Normal Sequence(123) 93.7% 94.1% 97.9% 96.8% 94.7% 89.1%
Repeat 1st Grade(112) 3.1 3.9 1.4 0.8 2.5 10.6
Repeat 2nd Grade (122) 2.7 1.7 0 2.3 2.5 .3
Other 0.5 0.3 0.7 0.1 0.3 0
3rd Grade Cohort 1000 1100 1110 1111 Other
Normal Sequence(3456) 97.0% 94.1% 99.0% 94.2% 96.0% 94.4% 91.2%
Repeat 3rd Grade(3345) 0.5 1.8 0.9 0.4 3.2 1.8 2.0
Repeat 4th Grade(3445) 0.6 0.7 0 0.9 0.3 0.3 1.6
Repeat 5th Grade(3455) 1.3 2.2 0 3.9 0 1.7 4.4
Other 0.4 1.2 0.1 0.6 0.5 1.8 0.8
ABT ASSOCIATES INC. 4-34
266
CHAPTER 4: EDUCATIONAL OUTCOMES FOR LEP STUDENTS
Retention Rates for Low-Income Students
The grade retention patterns for low-income students are similar to the retention rates
above, for all LEP and EP students.
Parents' Reports of Retention: Low-Income Students. Similar percentages of low-
income LEP and low-income EP students were ever retained according to parents' reports. In
the 1st grade cohort, 20 percent of LEP students and 23 percent of EP students were reported to
have repeated a grade. In the 3rd grade cohort, parents said that 27 percent of low-income LEP
students and 28 percent of low-income EP students had ever been retained.' Somewhat
surprisingly, these results do not suggest higher retention rates for low-income students compared
to all students. But the results are consistent with the results above in finding no clear evidence
of higher retention rates for LEP students. If anything, LEP outcomes for retention are more
closely aligned with those of EP students after controlling for economic status.
Retention Based on Grade Sequence: Low-Income Students. Exhibit 4.17 shows that
about 4 percent of low-income LEP students and 10 percent of low-income EP students in the
1st grade cohort were retained based on the observed grade sequence measure (excluding the
"other" category). The same exhibit shows that about 4 percent of low-income LEP and low-
income EP students repeated 3rd, 4th, or 5th grade. As with all the other results, there is no
evidence that LEP students had higher rates of retention.
SUMMARY
The key findings of this chapter are:
Overall, after controlling for economic differences between LEP and EP students,the math achievement levels of LEP studentsas measured by test scoresare notso different from those of EP students. LEP exiters in the 1st grade cohortgenerally had higher math test scores than EP students. Further, while somegroups of low-income LEP students had lower initial test scores than low-income
21 Data were missing on this measure for 15 percent of LEP and 10 percent of EP students in the 1st gradecohort. In the 3rd grade cohort the percentages of missing data were 8 and 6, respectively.
ABT ASSOCIATES INC. 4-35
267
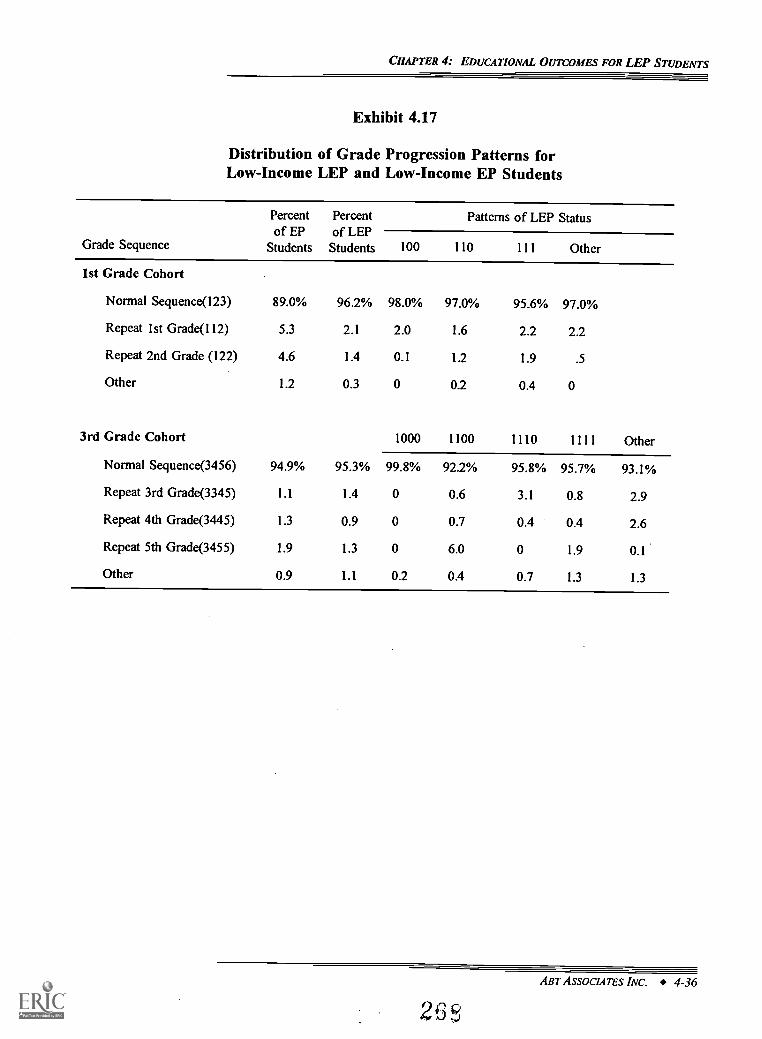
CHAPTER 4: EDUCATIONAL OUTCOMES FOR LEP STUDENTS
Exhibit 4.17
Distribution of Grade Progression Patterns forLow-Income LEP and Low-Income EP Students
Grade Sequence
Percentof EP
Students
Percentof LEPStudents
Patterns of LEP Status
100 110 111 Other
1st Grade Cohort
Normal Sequence(123) 89.0% 96.2% 98.0% 97.0% 95.6% 97.0%
Repeat 1st Grade(112) 5.3 2.1 2.0 1.6 2.2 2.2
Repeat 2nd Grade (122) 4.6 1.4 0.1 1.2 1.9 .5
Other 1.2 0.3 0 0.2 0.4 0
3rd Grade Cohort 1000 1100 1110 1111 Other
Normal Sequence(3456) 94.9% 95.3% 99.8% 92.2% 95.8% 95.7% 93.1%
Repeat 3rd Grade(3345) 1.1 1.4 0 0.6 3.1 0.8 2.9
Repeat 4th Grade(3445) 1.3 0.9 0 0.7 0.4 0.4 2.6
Repeat 5th Grade(3455) 1.9 1.3 0 6.0 0 1.9 0.1
Other 0.9 1.1 0.2 0.4 0.7 1.3 1.3
ABT ASSOCIATES INC. 4-36
268
CHAPTER 4: EDUCATIONAL OUTCOMES FOR LEP STUDENTS
EP students, there is evidence of catch-up; that is, LEP students' scores movecloser to those of EP students over time. These same general results obtained forreading test scores, although the sample included in the reading score analysis wassomewhat less representative (because it did not include SABE test takers).
In general, for all the outcomes examined in this chapterEnglish proficiency,reading test scores, math test scores, and grade retentionLEP exiters have morefavorable outcomes than students who are LEP in every year of the study.
Further, differences between LEP exiters and students who are LEP in every yearbegin with the first year observed. This suggests that LEP exiters may beginschool with certain advantages over other LEP students and that these non-schoolfactors may play a role in their continued higher achievement. To put it anotherway, where LEP students end up appears to depend strongly on where they start.The results also suggest that LEP students are a heterogeneous group.
We find no clear evidence that LEP students are retained in grade any more orless often than EP students.
269 ABT ASSOCIATES INC. 4-37
POSTSCRIPT: LESSONS LEARNED AND AREAS FOR ADDITIONAL RESEARCH
POSTSCRIPT
LESSONS LEARNED AND AREAS FOR ADDITIONAL RESEARCH
This section presents some suggestions for future studies of LEP students, based on our
experience with the Prospects study. Most of these suggestions have to do with measurement
and collection of specific types of information, but we also make a few observations about study
design. These observations are most relevant for other large-scale studies of LEP students
involving collection of data at the student level.
Data Measurement and Collection
We believe that the following are important data collection goals for studies of LEP
students:
The instruments for collecting data on language-related services should capture the
wide variety of classroom practices. As other research has shown, a wide variety of
instructional approaches are used to provide language-related services to LEP students. (See for
example, Fleischman and Hopstock 1993.) There is not a simple split between bilingual
education and English immersion approaches; there are many models in between and what
happens in schools is likely to be a mix of different approaches. LEP students in the same
classroom may even receive different language-related services, according to their needs. Data
collection instruments must be able to provide accurate measurement in the face of this diversity.
If a study's goal is to collect data on language-related services for a large sample of LEP students
through teacher surveys, then it may be desirable to include as a study component some field
observations of classroom practices, for a representative sample of schools and classrooms. This
64 ground level" view of services could be used to design a data collection instrument that would
capture important distinctions in service provision.
In addition, as this study reports, a student's initial level of proficiency is a strong
predictor of proficiency in subsequent years while the student is building full proficiency in
English. Instructional practice (including access to language related services) often bases program
270ABT ASSOCIATES INC. PS-I
POSTSCRIPT: LESSONS LEARNED AND AREAS FOR ADDITIONAL RESEARCH
assignments on the student's initial level of proficiency in English. That is, students are usually
not randomly assigned to different programs but placed differentially, reflecting their level of
proficiency when they enter the program. This has implications for evaluating the effectiveness
of various instructional approaches for LEP students.'
It may also be important to distinguish between services available and services received.
If the intent of a study is to analyze data on services received at the student level, it will likely
not be sufficient to collect data on language-related services at the grade level or even at the
classroom level. For example, a school may offer bilingual education in grades four through six,
but that does not imply that a particular student received those services. As another example, if
a student does not receive language-related services in a particular year, it matters whether the
reason is that the student is no longer considered LEP, or that the school does not offer language-
related services at that grade level.
Examples of other dimensions that may be important to measure are:
How much language-related services do students receive? The provision ofservices is defined not just by the types of services, but also by the intensity ofeach. Ideally it would be useful to know how students spend their entire schoolday, in terms of time spent on each content area and by the language ofinstruction. (The former element is useful for comparing the content received byLEP students to that received by comparable EP students.)
How do language-related services change over time? Because the acquisition ofEnglish proficiency typically takes a number of years, and because services willchange as proficiency improves in different domains, it is useful to measureservices received over time, rather than just at a point in time.
Although collecting accurate data on the provision of language related services
should be a key focus, collecting information on instructional content is also critical. The
educational outcomes of LEP students depend not just on the type or amount of language
services, but also on the instructional content that schools provide to these students. A key
question for understanding the educational services provided to LEP students is whether these
students have the same opportunities to learn the same level of material in each subject area as
EP students at the same grade level.
See, for example, Smith (1997), and Meyer and Feinberg (1992).
2 71ABT ASSOCIATES INC. PS-2
POSTSCRIPT: LESSONS LEARNED AND AREAS FOR ADDITIONAL RESEARCH
If teacher judgements are to be the principal source for measures of language
proficiency, efforts must be made to verify their validity and level of measurement
accuracy. This study relied primarily on teacher assessments of students' language proficiency.
We believe these measures are valid, in part because they generate patterns of English proficiency
growth that are consistent with other research, and because they are correlated with other
indicators of proficiency such as standardized test scores and LEP exit rates. But teacher
assessments of language proficiency have some drawbacks: they may be more accurate for
assessing students' English proficiency than for assessing native language proficiency, especially
when teachers are not themselves proficient in students' native languages; and they are subjective,
which means that two teachers may make different assessments of the same student's proficiency.
With respect to the former, at a minimum the study should collect information on teachers' own
proficiency in the students' language. With respect to the latter, study designers should provide
a clear set of standards for teachers to use in assessing proficiency, and these standards should
be established for each of the proficiency domains. The standards should also be explicit about
the appropriate reference group (e.g., other LEP students at the same grade level, native-English
speakers at the same grade level).
An objective test of language proficiency is an alternative to using teacher judgements to
measure language proficiency. Such a test is likely to measure proficiency more accurately, but
it is also considerably more expensive to administer such a test than to ask teachers about
students' language proficiency. Intermediate options include: administering an objective test to
a subsample of study members, and using the results to benchmark teacher judgements; or
attempting to utilize existing test score data from schools that have administered their own
language proficiency tests. If teacher judgements are used, it is important to assess their validity.
Absent resource constraints, the ideal approach would be to have multiple measures of language
proficiency.
Where possible, teacher survey-based measures of student language proficiency should be
validated utilizing more direct measures of student language proficiency. Where possible, such
measures should also be used in a multiple indicator approach (utilizing additional survey
questions, school records, or other measures) to strengthen measurement quality. The methods
used to identify LEP students should be sensitive to legal requirements and other definitions of
ABT ASSOCIATES INC. PS-3
POSTSCRIPT: LESSONS LEARNED AND AREAS FOR ADDITIONAL RESEARCH
LEP (e.g., the Title VII definition). It is important to capture the non-served LEP students, as
well as those served.
The method used to identify students as LEP for study purposes should be sensitive
to the processes used by district and school staff to identify students as LEP. Not only do
states use different definitions of when a student should be classified as LEP, definitions and
processes used to identify students as LEP can differ even across schools in the same school
district. Further, although teachers do not make the formal designations of students as LEP, they
determine the specific instructional activities for each student in their classroom, and the services
provided may vary even for LEP students in the same classroom. Both the school-level and
teacher classifications are useful, so one approach (used in this study) is to collect information
on LEP status at the school-level and from the appropriate teachers. An advantage of this
approach is that it identifies all and only those students who are the object of schools' efforts to
increase proficiency. A disadvantage is that comparisons of LEP students across areas may be
misleading to the extent that standards are different. It may be possible to supplement this
approach by also including an absolute standard that could be used to make comparisons across
sites.'
An alternative is to develop an objective measure, such as a standardized test of English
proficiency, that can be applied to all sample members. Drawbacks of such an approach are that
it is relatively expensive, and it may not identify the students who are the target of language-
related services.
Depending on the goals of the particular study, it may be helpful to collect information
not just on which students are LEP, but also on how schools identify students as LEP, and how
schools determine that students are no longer LEP. Knowing something about these processes
can be useful in designing a study, particularly for ensuring that the relevant data will be
collected. This will enable researchers to define LEP statusincluding entry andexitaccurately.
2 If receipt of language-related services is used as a way to identify students as LEP, it is important to be ableto distinguish between LEP and EP students in bilingual programs. In other words, the fact that a student is in abilingual program does not imply that the student has limited English proficiency.
ABT ASSOCIATES INC. PS-4
2 7 3
POSTSCRIPT: LESSONS LEARNED AND AREAS FOR ADDITIONAL RESEARCH
Family characteristics and the home environment can have strong influences on
educational outcomes, and therefore should bepart of the data collection. The results in this
chapter suggest strongly that educational outcomes are determined in part by what students bring
to school with them; i.e., by their home environment and language background. Development
of strategies for mastering language takes place early in the lives of children; it is fostered by
such things as family conversations and routine reading of books and other materials. Other
potential "determinants" of language proficiency include the language background of parents and
language use in the home, length of time in the U.S., and various measures of socioeconomic
status. Beyond this, the effectiveness of language-related services during the observation period
may be conditioned by students' prior educational experiences. If the goal of a study is to
explain differences in outcomes for LEP students, it is important to collect these types of
information, not just data on what happens in school during the study period.
As context for a study to determine the effectiveness of language-related services
funded by Chapter 1 and perhaps Title VII, it would be useful to collect information on
how Chapter 1 and Title VII funds are used to provide services to LEP students. The fact
that Chapter 1 is a funding stream rather than a specific set of services makes it difficult to model
the process by which Chapter 1 funds affect student outcomes, and therefore difficult to measure
the effectiveness of the program. But if such an effort is deemed worthwhile, a logical starting
point is to collect detailed data on how Chapter 1 funds are used to provide services to LEP
students. This would include both language-related and non-language-related services, and
follow-up services after students are no longer classified as LEP. Among other uses, such a study
could inform the development of a model to measure program effectiveness. The effort would
likely involve collecting information at the district and school level, and perhaps at the state level.
Strang and Carlson (1991) is an example of such a study, based on a sample of fourteen school
districts.
ABT ASSOCIATES INC. PS-5
2 7
POSTSCRIPT: LESSONS LEARNED AND AREAS FOR ADDITIONAL RESEARCH
Research Design
Both broad and narrow studies of LEP students are needed. No single study, even
one as ambitious as Prospects, can achieve all of the goals above. Some research questions are
best addressed by studies that focus on a smaller sample of students and examine that sample
intensively. Other research questions require a larger and more broadly representative sample of
LEP students. The trade-off between the two types of studies is depth versus representativeness.
Both types of studies are needed. It is also possible to integrate the two approaches by
embedding a narrow study within a broader one.'
Accurately measuring program impacts requires extraordinary efforts to identify a
comparison group. For many policy makers concerned about LEP students the research question
of greatest interest is, "Does the Chapter 1 program improve educational outcomes for LEP
students?" A necessary condition for answering this question is a research design that identifies
a well-matched comparison group. As noted above, it is also desirable to have accurate data on
how Chapter 1 funds are used. The best approach to measuring effectiveness from a research
standpoint is likely to be a random assignment design. Virtually every major study of LEP
students to date, including Prospects, has been a nonexperimental study. The limitation of such
studies in this context is that it is difficult to identify a comparison group that is as disadvantaged
as the students receiving Chapter 1 services. Consequently most simple comparisons of Chapter 1
students with other students, even other low-income students, will show lower outcomes for
Chapter 1 students. Even with a careful statistical analysis, it is very difficult to control fully for
the greater level of disadvantage of Chapter 1 students compared to other students. Well-
executed random assignment designs eliminate this problem.
A random assignment design would need to address both ethical concerns and the multi-
level nature of school organization. These issues have been resolved in other random assignment
studies of educational interventions, so they should be resolvable in this context. One approach
to addressing ethical concerns might be to vary not the level of Chapter 1 funds but the uses to
which they are put. For example, it might be possible to vary the share of Chapter 1 funds used
for language-related services versus other services. Such variation would mirror what likely
3 See Meyer and Feinberg (1992) for recommendations on research design for studies of LEP students.
ABT ASS0CL4TE5 INC. PS-6
275
POSTSCRIPT: LESSONS LEARNED AND AREAS FOR ADDITIONAL RESEARCH
occurs naturally, either because of differences in approach (e.g., early exit versus late exit), or
due to other constraints (such as the inability to find and hire certified ESL or BE teachers). The
multi-level nature of schoolingthe fact that students are grouped within classrooms and
classrooms are grouped within schoolsmay complicate the analysis of impacts, but probably
does not lessen the usefulness of a random assignment design. If it is impractical to randomly
assign students within a classroom, it may be possible to randomly assign classrooms within
schools, or schools themselves.
ABT ASSOCIATES INC. PS-7
276
REFERENCES
REFERENCES
Anderson, Pamela L. 1982. "Self-Esteem in the Foreign Language: A Preliminary Investigation."Foreign Language Annals, 15(2): 109-114.
Anstrom, Kris. 1996. "Defining the Limited-English Proficient Student Population." Directionsin Language and Education, 1(9). Washington DC: The National Clearinghouse for BilingualEducation.
Anstrom, Kris. 1995. "New Directions for Chapter 1/Title I." Directions in Language Education,1(7). Washington DC: The National Clearinghouse for Bilingual Education.
August, Diane, and Kenji Hakuta, eds. 1997. Improving Schooling for Language-Minority Children,National Research Council: Washington DC: National Academy Press.
Bankston, Carl L., and Min Zhou. 1995. "Effects of Minority-Language Literacy on the AcademicAchievement of Vietnamese Youth in New Orleans." Sociology of Education, 68: 1-17.
Bryant, Edward C. 1993. Prospects: The Congressionally Mandated Study of Educational Growthand Opportunity. Technical Report #1: Sampling Procedures for the Baseline and FirstFollow-Up Surveys. Washington DC: U.S. Department of Education.
Burkheimer, Jr., G.J., A.J. Conger, G.H. Dunteman, B.G. Elliot, and K.A. Mowbray. 1989.Effectiveness of Services for Language-Minority and Limited English Proficient Students.Research Triangle Park, North Carolina: Research Triangle Institute.
Cantieni, G. and R. Tremblay. 1979. "The Use of Concrete Mathematical Situations in LearningSecond Language: A Duel Learning Concept." in H.T. Trueba and C. Barnett Mizahi (eds.),Bilingual Education and the Professional. Rowley, MA: Newbury House, 246-255.
Cheung, 0. and L.W. Solomon. 1991. Summary of State Practices Concerning the Assessment ofand the Data Collection about Limited English Proficient (LEP) Students. Washington DC:Council of Chief State School Officers.
Collier, Virginia P. 1995. "Acquiring a Second Language for School." Directions in Languageand Education, 1(4). Washington, DC: The National Clearinghouse for Bilingual Education.
Crawford, James. 1995. Bilingual Education: History, Politics, Theory and Practice. Los Angeles,CA: Bilingual Educational Services, Inc.
CTB Macmillan/McGraw-Hill. 1990. CTBS Test Coordinator's Handbook, Fourth Edition.Monterey, California: CTB Macmillan/McGraw-Hill School Publishing Company.
CTB Macmillan/McGraw-Hill. 1989. Comprehensive Test of Basic Skills, Fourth Edition: TechnicalBulletin 1. Monterey, California: CTB Macmillan/McGraw-Hill School PublishingCompany.
2 7ABT ASSOCIATES INC.
REFERENCES
Cummins, J. 1981. "The Role of Primary Language Development in Promoting EducationalSuccess for Language Minority Students." in Schooling and Language Minority Students (pp.3-49). Sacramento, CA: California Department of Education.
De Avila, Edward. 1997. "Setting Expected Gains for Non and Limited English ProficientStudents." Directions in Language and Education, 11. Washington, DC: The NationalClearinghouse for Bilingual Education.
Development Associates, Special Issues Analysis Center. 1993. Annual Report, Year One,Literature Review. Arlington, VA: Development Associates, Inc.
Fine, M. 1986. "Why Urban Adolescents Drop Into and Out of Public High School." TeachersCollege Record, 87: 393-409.
Fleischman, Howard L., and Paul J. Hopstock. 1993. Descriptive Study of Services to LimitedEnglish Proficient Students: Summary of Findings and Conclusions. Washington, DC: U.S.Department of Education.
General Accounting Office. 1994. Limited English Proficiency: A Growing and Costly EducationalChallenge Facing Many School Districts (GAO/HEHS-94-38). Washington DC: GeneralAccounting Office.
Gonzalez, Gustavo, and Lento Maez, eds. 1995. Compendium of Research on Bilingual Education.Washington, DC: The National Clearinghouse for Bilingual Education.
Halcuta, Kenji. 1990. Bilingualism and Bilingual Education: A Research Perspective, OccasionalPaper Series. Washington DC: National Center for Bilingual Education.
Hakuta, Kenji. 1986. Mirror of Language: The Debate on Bilingualism. New York: Basic Books.
Han, Mei, David Baker, and Carlos Rodriguez. 1997. A Profile of Policies and Practices forLimited English Proficient Students: Screening Methods, Program Support, and TeacherTraining [SASS 1993-4]. Washington, DC: U.S. Department of Education, National Centerfor Education Statistics (NCES 97-472).
Henke, Robin R., Susan P. Choy, Sonya Geis, and Steven P. Broughman. 1996. Schools andStaffing in the United States: A Statistical Profile, 1993-1994. Washington, DC: U.S.Department of Education, National Center for Education Statistics (NCES 96-124).
Hoff, David J. 1997. "Title I Dollars to LEP Pupils on the Increase." Education Week, June 11.
Hopstock, Paul J. and B. Bucaro. 1993. A Review and Analysis of Estimates of LEP StudentPopulation. Washington DC: U.S. Department of Education.
Kirsch, Irwin S., Ann Jungeblut, Lynn Jenkins, and Andrew Kolstad. 1993. Adult Literacy inAmerica: A First Look at the Results of the National Adult Literacy Survey.. Washington,DC: U.S. Department of Education, National Center for Education Statistics.
ABT ASSOCIATES INC.I) Pry (,)4
REFERENCES
Krashen, Stephen. 1991. Bilingual Education: A Focus on Current Research, Occasional Papersin Bilingual Education, no. 3. Washington DC: The National Clearinghouse for BilingualEducation.
Lam, Tony C. M. 1992. "Review of Practices and Problems in the Evaluation of BilingualEducation," Review of Educational Research, 62(2): 181-203.
Macias, Reynaldo F. 1996. Summary Report of the Survey of the States' Limited English ProficientStudents and Available Educational Programs and Services, 1994-1995. Washington, DC:U.S. Department of Education (Contract No. T295005001).
Mather, Jeanne Ramirez Corpus, and Chiodo. 1994. "A Mathematical Problem: How Do WeTeach Mathematics to LEP Elementary Students?" The Journal of Educational issues ofLanguage Minority Students, 13: 1-12.
Meyer, Michael, and Stephen Fienberg, eds. 1992. Assessing Evaluation Studies: The Case ofBilingual Education Strategies. Washington, DC: National Academy Press.
Moss, Marc, and Michael Puma. 1995. Prospects: First Year Report on Language Minority andLimited English Proficient Students. Washington, DC: U.S. Department of Education.
Mosteller, Frederick. 1995. "The Tennessee Study of Class Size in the Early School Grades." TheFuture of Children, 5(2): 113-127.
Nakao, K., and J. Treas. 1992. "The 1989 Socioeconomic Index of Occupations: Constructionfrom the 1989 Occupational Prestige Scores." (General Social Survey Methodological ReportNo. 74.) Chicago: University of Chicago, National Opinion Research Center.
Porter, Andrew C., Michael W. Kirst, Eric J. Osthoff, John L. Smithson, and Steven A. Schneider.1993. Reform Up Close: An Analysis of High School Mathematics and Science Classrooms.Final Report to the NSF on Grant #SPA-8953446 to the Consortium for Policy Research inEducation.
Puma, Michael, Nancy Karweit, Cristofer Price, Anne Ricciuti, William Thompson, and MichaelVaden-Kiernan. 1997. Prospects: Student Outcomes, Final Report. Washington, DC: U.S.Department of Education.
Puma, Michael, Nancy Karweit, Robert Kornfeld, Cristofer Price, Anne Ricciuti, WilliamThompson, and Michael Vaden-Kiernan. 1996. Prospects: Final Report, Volume I .Washington, DC: U.S. Department of Education.
Ramirez, J. David, Sandra D. Yuen, and Dena R. Ramey. 1991. Final Report: Longitudinal Studyof Structured English Immersion Strategy, Early-Exit and Late-Exit Transitional BilingualEducation Programs for Language-Minority Students. San Mateo, CA: Aguirre International.
Ramirez, Jeanne, Corpus Mather, and John J. Chiodo. 1994. A Mathematical Problem: How Do WeTeach Mathematics to LEP Elementary Students?" The Journal of Educational Issues ofLanguage Minority Students, 13: 1-12.
ABT ASSOCIATES INC.
279
REFERENCES
Smith, H. 1997. "How Many Years to Second Language Fluency?" WATESOL News, 28(2).
Stanford Working Group (Kenji Hakuta, chair). 1993. Federal Education Programs for Limited-English-Proficient Students: A Blueprint for the Second Generation. Stanford, CA: StanfordUniversity.
Thomas, Wayne P., and Virginia P. Collier. 1997. "School Effectiveness for Language MinorityStudents." Washington DC: The National Clearinghouse for Bilingual Education.
U.S. Department of Education, National Center for Education Statistics. 1997. Measurement ErrorStudies at the National Center for Educational Statistics. (NCES 97-464) Washington DC:U.S. Department of Education.
U.S. Department of Education, National Center for Education Statistics. 1997b. NationalEducationLongitudinal Study of 1988: NELS:88 Survey Item Evaluation Report. (NCES 97-052)Washington DC: U.S. Department of Education.
U.S. Department of Education, National Center for Education Statistics. 1993. Adult Literacy inAmerica. Washington DC: U.S. Department of Education.
U.S. Department of Education, National Center for Education Statistics. 1992. LanguageCharacteristics and Academic Achievement: A Look at Asian and Hispanic Eighth Gradersin NELS:88. (NCES 92-479) Washington DC: U.S. Department of Education.
U.S. Department of Education. Office for Civil Rights. 1992. The Provision of an EqualEducation Opportunity to Limited English Proficient Students. Washington DC: U.S.Department of Education.
U.S. Department of Education. Office for Civil Rights. 1991. Policy Update on Schools'Obligations Toward National Origin Minority Students With Limited-English Proficiency (LEPstudents). Memorandum by Michael L. Williams, Assistant Secretary for Civil Rights datedSeptember 27.
U.S. Department of Health, Education, and Welfare. Office for Civil Rights. 1970. Identificationof Discrimination and Denial of Services on the Basis of National Origin. Memorandum byStanley J. Pottinger, Director of the Office for Civil Rights, dated May 25.
Wehlage, G., and R. Rutter. 1986. "Dropping Out: How Much Do Schools Contribute to theProblem?" Teachers College Record, 87: 374-392.
Whitten, Carol P., Laura Lathrop, Katherine Hayes, and Paul Longo. 1995. Review of theLiterature Relevant to the Education of Secondary School Students (Grades 9-12) Who AreLimited in English Proficiency. Washington, DC: DevTech Systems, Inc.
Wong Fillmore, Lily. 1991. "When Learning a Second Language Means Losing the First." EarlyChildhood Research Quarterly, 6: 323-346.
280 ABT ASsoCIATES INC.

APPENDIX A
PROCEDURES FOR IMPUTING LEP STATUS WHEN DATA ON INDIVIDUAL
INDICATORS ARE MISSING
281
APPENDIX A: PROCEDURES FOR IMPUTING LEP STATUS WHEN DATA ON INDIVIDUAL INDICATORS ARE MLSSING
PROCEDURES FOR IMPUTING LEP STATUS WHEN DATA
ON INDIVIDUAL INDICATORS ARE MISSING
Determination of LEP status for any sample member in any year involves three stages:
Classification of individual LEP indicator variables;
Imputation of missing values for those variables; and
Derivation of overall LEP status.
Imputation of missing values is essential when conducting longitudinal analysis. Absentimputations, the total sample size for the longitudinal file would decline substantially as missing datacompound across years. With eight source variables needed in each year--and some of those derivedfrom several other variables (see below)--the potential for sample reduction grows quite large in athree- to four-year follow-up period if different sample members have missing data each year. Thisis true even when missing data rates are quite low for individual variables.'
Because of the high potential that data are not missing at random (MAR), imputation is alsonecessary to mitigate statistical bias that would result from analysis conducted for only thoseindividuals with complete data. That is, imputation is necessary to maintain the ability of oursamples to represent the populations of U.S. public school students from which they were drawn(1st graders in 1992, 3rd graders in 1991).
STAGE 1: CLASSIFICATION OF INDIVIDUAL LEP INDICATORS
We rely on eight variables, called the components of LEP, to classify a student as LEP or EP.A component can indicate the student is LEP, EP', or the component can be missing. The followingdescribes each component and our procedure for classifying its value:
Appendix C presents missing data rates for each of the LEP indicator variables used in the analysis.
2 We write that the student is classified as "EP" or "not LEP" by particular components, but most of the componentscannot provide conclusive evidence that a student is not LEP. That is, each of the components can indicate a studentis LEP, but the absence of an indicator does not necessarily indicate a student is EP. For example, knowing that astudent participates in an English-as-a-second-language class is overwhelming evidence that a student has limitedEnglish proficiency, but a LEP student may not participate in an ESL class, because they are not available at their gradelevel or the school does not use this instructional method for LEP students, hence not participating in an ESL class isnot conclusive evidence that a student is English proficient.
ABT ASSOCIATES INC.
282
A-I
APPENMX A: PROCEDURES FOR IMPUTING LEP STATUS WHEN DATA ON INDIVIDUAL INDICATORS ARE MISSING
English- and Spanish-language limited for purpose of standardized testing: Thelanguage limited variable is a designation (by the school) of whether the studentcould be meaningfully tested on an English- or Spanish- language cognitive test.'This variable is a composite of two variables from the Survey Control File. Astudent is classified as LEP by this component if s/he took neither theComprehensive Test of Basic Skills (CTBS) nor the Spanish Assessment of BasicEducation (SABE) for the Prospects study and was designated (by the school) aslanguage limited for the purpose of standardized testing. Otherwise the student isclassified as EP by this component. There is no designation of missing for thisvariable, because for students who took neither the SABE nor the CTBS, we can notdifferentiate between a negative response (no language limitation) and a non-response (missing data).
SABE: This variable indicates whether or not a student took the Spanish-languagecognitive test. This variable is derived from an indicator variable on the SurveyControl File that indicates whether or not the student took the SABE for theProspects study. A student is classified as LEP if s/he took the SABE test and EPotherwise. There is no designation of missing for this variable.
Teacher identifies as LEP: This variable indicates whether or not the student'sprimary teacher believes the student is a limited English proficient student. Teacherswere provided with an appropriate definition of a LEP student in the instructions tothe Student Profile Questionnaire. The instructions defined LEP students as those"whose native language is other than English and whose skills in listening to,speaking, reading, or writing English are such that he/she derives little benefit fromschool instruction in English." The actual question on the Student Profile (question16 in 1994) simply asks the teacher whether the student was "limited Englishproficient," with no definition stated in the question. By this component, a studentis classified as LEP if the teacher responds that the student is limited-Englishproficient; EP if the teacher responds that the student is not limited-Englishproficient; and missing if the teacher did not answer the question.
Teacher indicates receipt of ESL services: This variable is an indication ofwhether or not the student's primary teacher says that the student received English-as-a-Second-Language (ESL) instruction due to limited English proficiency. By thiscomponent, a student is classified as LEP if the teacher indicates the student receivesESL services; EP if the teacher indicates the student does not receive ESL services;and missing if the teacher did not answer the question. This variable is from theStudent Profile Questionnaire (question 19a in 1994).
3 In the Prospects study, achievement tests were available in only English or Spanish.
ABT ASSOCIATES INC. A-2
283
APPENDIX A: PROCEDURES FOR IMPUTING LEP STATUS WHEN DATA ON INDIVIDUAL INDICATORS ARE MISTING
Teacher indicates receipt of bilingual education services: This variable is anindication of whether or not the student's primary teacher says that the studentreceived bilingual education (BE) instruction. By this component, a student isclassified as LEP if the teacher indicates the student receives BE services; EP if theteacher indicates the student does not receive BE services; and missing if the teacherdid not answer the question. This variable is from the Student Profile Questionnaire(questions 19b and 19c in 1994).
Teacher indicates receipt of unspecified services due to limited Englishproficiency: This variable is an indication of whether or not the student's primaryteacher responds that the student received academic services due to limited Englishproficiency, but does not specify the type of services. If the teacher indicates thestudent receives ESL and/or BE services, the student is not classified as LEP by thiscomponent (because they are already classified as LEP by one of the above twocomponents). Otherwise, a student is classified as LEP if the teacher indicates thestudent receives services due to limited English proficiency, but does not specify thetype of service; EP if the teacher indicates the student does not receive services dueto limited English proficiency; and missing if the teacher did not answer the question.This variable is from the Student Profile Questionnaire (question 18 in 1994).
ESL or bilingual education services from school records: Identifying a student asLEP by this component is a two-step process. In the first step, we rely on twocomposite variables from the student's school records that indicate whether or a nota student receives ESL and/or Bilingual Education services funded through either theChapter 1 program or another source. A student is classified as "possibly LEP" inthe first step if either of the composite variables indicates that s/he received ESL orBilingual Education services. If both the composite variables are present, and neitherindicates that the student received ESL or Bilingual Education services, the studentis classified as EP. If both composite variables are missing-- or either of thecomposite variables is missing and the composite variable that is present does notindicate LEP-- this component is classified as missing. Both composite variables arefrom the Student Abstract Questionnaire (questions 22 and 23a in 1994).
The first step can only classify a student as "possibly LEP" rather than LEP, becausethe data extracted from school records does not indicate that the student is inbilingual education classes due to limited English proficiency (as the comparabledata on the student profile, filled out by the students' primary teacher does), henceit is possible that the first step indicator can falsely identify some native Englishspeakers as LEP students. This could occur if a native English speaking student isintegrated with LEP students to become bilingual or serve as a role model, or if anative English speaker is taking a foreign language class. Hence, in order to identifya student as LEP by this criteria, the student must meet the first-step criterion as"possibly LEP" and also meet one of the second-step criteria.
The second step criteria are: the student is identified as LEP by one of the otherseven components used to identify a LEP student in at least one of the years coveredby the survey; the student's parent reports a non-English language is spoken in thehome most or all of the time (question 70 on the 1993 parent questionnaire); the
ABT ASSOCIATES INC A-3
4
APPENDL It A: PROCEDURES FOR IMPUTING LEP STATUS WHEN DATA ON INDIVIDUAL INDICATORS ARE MISSING
student reports learning another language before English (question 12 on the 1994Student Questionnaire); or the student's teacher indicates the student is a languageminority student (question 15 on the 1994 Student Profile).
ESL teacher: The ESL variable indicates if a student is designated for instructionby an ESL and/or Bilingual Education teacher who is not the student's regular orChapter 1 teacher. This variable is from the school records and is contained on theSurvey Control File. A student is classified as LEP for this component if s/he isdesignated for instruction by an ESL or Bilingual Education teacher who is not thestudent's regular or Chapter 1 teacher; and classified as EP otherwise. There is nodesignation of missing for this variable. Also, the data for this component was notcollected in 1994, hence this component is not used to identify LEP students in 1994.
STAGE 2: IMPUTING VALUES FOR MISSING INDICATORS
In this stage, the missing values for each component variable are imputed to values of "LEP"or "not LEP." The basis of these imputations is clearest at the component level, and is strengthenedby exploiting the longitudinal nature of the data, using information from years in which a componentindicator is observed to impute its value in other (missing) years. Imputations only affect missingcomponents; hence, observed data are never changed through imputation.
In general, we let the available data dictate our imputation rules. Two patterns in the non-missing data provide some general guidelines:
Most LEP students in any year remain LEP the following year, and most EP studentsremain EP.
In any given year, the great majority of all students are EP on any criterion.
The first pattern observed in the data leads to two guidelines for imputation:
Impute so as to minimize the number of transitions between LEP and EP status; and
Impute the student's earlier year status if the observed data in the years surroundingthe missing year indicate a transition.
When the above two guidelines cannot decide the matter, we establish a third guideline based on theabove mentioned observation that most students are EP on any criterion:
Impute EP.4
Operationally, these three guidelines result in a three-part imputation procedure for eachsample member and LEP component.
4 These three guidelines imply that we do not impute a student's status as LEP in a given year, unless the observeddata indicate the student is LEP in at least one of the other years.
ABT ASSOCIATES INC. A-4
c-
APPENDIX A: PROCEDURES FOR IMPUTING LEP STATUS WHEN DATA ON INDIVIDUAL INDICATORS ARE MISSING
If data on a component are available for that sample member in an adjoining year oryears and these years do not conflict: Fill in missing values to minimize the number of transitionsbetween LEP and EP for that variable. For example, if a student has missing data for an indicatorin the second year of a time series and the indicator variable equals "LEP" in the first and third year,impute a value of LEP for the middle year. Similar rules apply when the first and last year of a timeseries equal "not LEP", or if another position in the sequence is missing (and the surrounding yearsdo not conflict), or if more than one year--but not all years--are missing.
If the component is missing in a middle year and the surrounding years conflict: Thissituation arises only in the middle year of a three-year sequence, when available data indicate LEPon one side of that year and EP on the other. This configuration will necessarily produce one andonly one transition, regardless of what value one imputes to the middle year. So the "minimizetransitions" principle cannot decide the case. Here, we follow our second guideline to impute thestudent's status in the prior year. For example, if a student is identified as LEP in the first year andEP in the third year, but the data on the middle year are missing, impute LEP for the middle year.
If the component is missing in all years: Impute EP in all years, following the observedpattern that a majority of students are EP in any given year.
STAGE 3: CLASSIFYING THE STUDENT AS LEP OR EP
Once missing data on individual LEP indicator variables is imputed at Stage 2, overallclassification of a student as LEP or EP is straightforward:
If any one of the eight component variables indicates that the student is LEP, thestudent is classified as LEP.
If all eight components indicate the student is EP (i.e., do not provide evidence thestudent is LEP), the student is classified as EP.5
5 As an earlier footnote explained, if any one component does not indicate a student as LEP, it does not necessarilyimply the student is EP. However, if all eight components do not provide evidence that the student is LEP, then thatis strong evidence that the student is EP.
ABT ASSOCIATES INC. A-5
286
APPENDIX B
PROSPECTS STUDY DESIGN
287
APPENDIX B: PROSPECTS STUDY DESIGN
PROSPECTS STUDY DESIGN
Prospects data provide a unique resource for examining critical policy issues related toChapter 1, and for assessing a broad range of issues related to student and school educationaloutcomes. The Prospects study was developed in compliance with Section 1462 of the 1988Hawkins-Stafford Amendments to the Elementary and Secondary Education Act, Public Law 100-297. This Congressional mandate required a "national longitudinal" assessment of the impact ofChapter 1 based on a comparison of the "educational achievement of those children with significantparticipation in Chapter 1 and comparable children who did not receive Chapter 1 services." Themandate further stated that the study "should be conducted throughout the country in urban,suburban and rural areas and shall be of sufficient size and scope to assess and evaluate the effectof the program in all regions of the country," and that the impact of Chapter 1 should be examinedon a broad array of domains of interest including "academic achievement, delinquency rates, truancy,and school dropout rates."
To meet the Congressional mandate and the project schedule established by the U.S.Department of Education (ED), the collection of longitudinal data for Prospects was originallyplanned to be completed within a five-year period, beginning with baseline data collection in 1991and ending with a final follow up survey at the end of the 1995-96 school year. (A provision in thelegislation concerning follow up of young adults from age 18 to 25 was rescinded by Congress in1990.) The original study design consisted of three longitudinal student cohorts:
1st grade cohort: 10,820 students beginning 1st grade in the fall of 1991;
3rd grade cohort: 10,333 students enrolled in the 3rd grade in the 1990-91school year; and,
7th grade cohort: 7,214 students in the 7th grade during the 1990-91 schoolyear.
Each student was administered an annual achievement test, and those students in the 3rd grade orbeyond were asked to complete a questionnaire about themselves and their experiences in and outof school. One parent (or guardian) for each sampled student was also asked to complete aquestionnaire about the student's home environment. In addition, the sampled students' regularclassroom teachers for reading/language art/English and mathematics, and (if any) the Chapter 1reading/language arts/English or mathematics teachers (or aides) were also asked to provideinformation on classroom instruction and other educational activities. Data from regular and Chapter1 teachers (or aides) on learning activities were intended to be linked to the student-level data.
ABT ASSOCIATES INC. B-I
288
APPENDIX B: PROSPECTS STUDY DESIGN
Finally, information was also collected from school principals, Chapter 1 district coordinators, andstudents' school records.
The Prospects Sample Design. The main goal of the sample design was to ensure that thelongitudinal surveys included a sufficient number of Chapter 1 participants (with substantiallongitudinal exposure to the program "treatment") and a sufficient number of comparablydisadvantaged children who did not have significant participation in the program. Consequently,the overall Prospects sample involved relatively fewer districts and schools, and relatively largersamples of students selected within a school. Thus, the Prospects sample was designed primarilyto support analysis of program effects rather than maximizing sampling efficiency for reportingnational statistical estimates of program characteristics.'
Under the provisions of a separate contract to determine the Prospects research design,several sample designs were evaluated for their suitability to meet the objectives of the study andfor their cost effectiveness. The recommended design, and the one adopted by ED, included largesamples (approximately 12,000) of students in the initial 1st grade and 3rd grade cohorts, and asignificantly smaller sample (7,000 students) for the 1991 7th grade cohort.
Three stages of sampling were implemented for Prospects: [1] selection of a sample ofschool districts; [2] selection of a sample of schools within sampled districts; and finally, ifnecessary to limit the total number of students in a grade selected from any one school, [3] samplingof students in the designated grades within sampled schools. (See below for details on within-schoolsampling of students.) Stratification was used to improve sample efficiency at each stage. In thefirst stage of sampling, 120 districts were drawn from across all major strata, including the fourCensus regions (as prescribed by ED) and three levels of urbanization. Major sampling strata usedfor district selection are described in Exhibit B.1. Within strata, districts were selected proportionateto a measure of size (MOS) reflecting the estimated number of economically disadvantaged students,a measure highly correlated with district eligibility criteria for participation in Chapter 1.
Once the sample of districts was selected, district officials were canvassed to obtaininformation about the concentrations of disadvantaged students (i.e., those eligible for free orreduced price school lunches) and Limited English Proficient (LEP) students in each of their schools.Using information from the district canvass, schools in the sampled districts were then stratifiedbased upon their proportions of poor and LEP children, and schools with higher concentrations wereselected with higher probabilities. This approach increased the proportion of economicallydisadvantaged districts and schools in the sample compared to their proportion in the population,
I See Bryant, E.C., Chu, A. and Hansen, M (1991) Prospects: The Congressionally Mandated study of EducationalGrowth and Opportunity. Sample Design. Bethesda, MD: Abt Associates Inc.
ABT ASSOCIATES INC. B-2
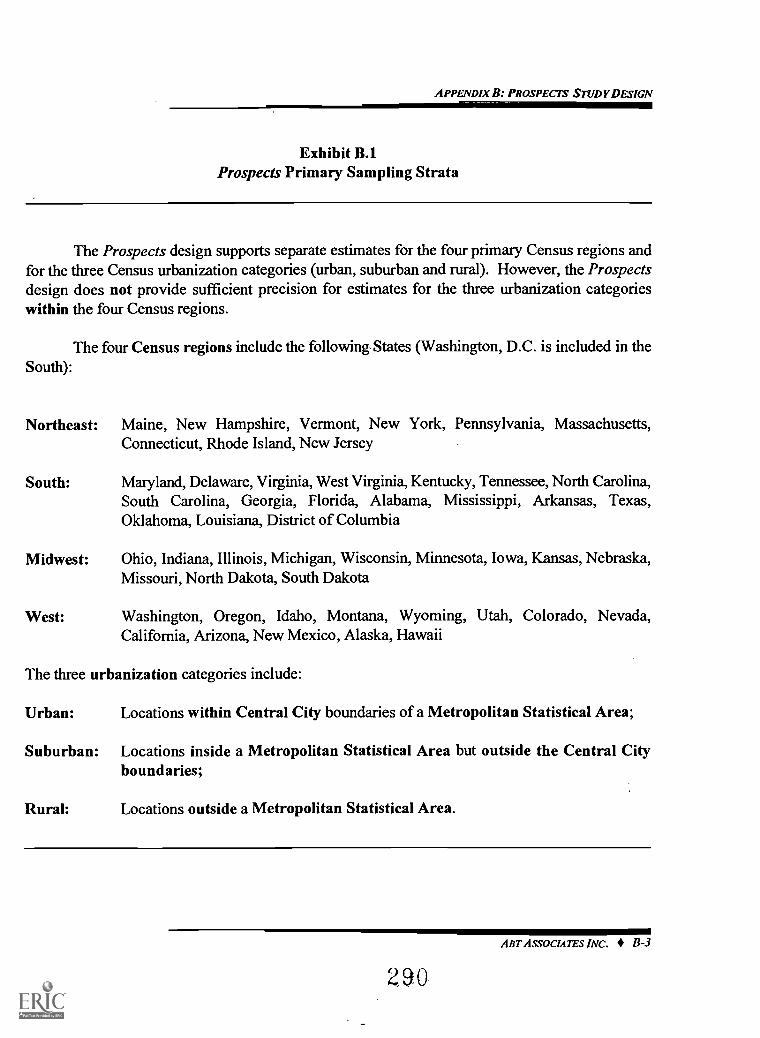
APPENDIX B: PROSPECTS STUDY DESIGN
Exhibit B.1Prospects Primary Sampling Strata
The Prospects design supports separate estimates for the four primary Census regions andfor the three Census urbanization categories (urban, suburban and rural). However, the Prospectsdesign does not provide sufficient precision for estimates for the three urbanization categorieswithin the four Census regions.
The four Census regions include the following States (Washington, D.C. is included in theSouth):
Northeast: Maine, New Hampshire, Vermont, New York, Pennsylvatha, Massachusetts,Connecticut, Rhode Island, New Jersey
South: Maryland, Delaware, Virginia, West Virginia, Kentucky, Tennessee, North Carolina,South Carolina, Georgia, Florida, Alabama, Mississippi, Arkansas, Texas,Oklahoma, Louisiana, District of Columbia
Midwest: Ohio, Indiana, Illinois, Michigan, Wisconsin, Minnesota, Iowa, Kansas, Nebraska,Missouri, North Dakota, South Dakota
West: Washington, Oregon, Idaho, Montana, Wyoming, Utah, Colorado, Nevada,California, Arizona, New Mexico, Alaska, Hawaii
The three urbanization categories include:
Urban: Locations within Central City boundaries of a Metropolitan Statistical Area;
Suburban: Locations inside a Metropolitan Statistical Area but outside the Central Cityboundaries;
Rural: Locations outside a Metropolitan Statistical Area.
ABT ASSOCIATES INC. B-3
290
APPENDIX B: PROSPECTS STUDY DESIGN
thus ensuring that the Prospects sample would include sufficient numbers of students eligible forand/or participating in Chapter 1 programs and in services specifically targeted at LEP students (i.e.,Title VII).
The twelve largest public school districts were included in the Prospects sample withcertainty (i.e., selection probability = 1.0). In most districts three schools were selected: twoelementary schools and one middle or junior high school. However, to prevent excessive variabilityin the selection probabilities for schools and students, the four largest districts were selected withcertainty.' This procedure reduces the difference in the selection probability for a student attendinga school in one of the country's largest school districts and the selection probability for anotherstudent who attends a school in a smaller city, or a suburban or rural area. In the case of the fourlargest school systems, the numbers of schools selected ranged between six and ten. In total, 372schools were selected for the Prospects core sample for the spring 1991 survey of the third andseventh grade cohorts. Of this total, 247 of the selections contained 1st and/or 3rd grades, while 137contained 7th grades. Only 12 schools in the core sample contained only 1st grade students, 7schools contained only 3rd grade students, and 12 schools contained all three selected grades.
The initial sample of districts and schools was designed to permit a predicted non-cooperation rate of 20 percent. However, after the sample was selected and during the district andschool recruitment process, ED's Office of General Counsel ruled that districts and schools receivingChapter 1 funds were required to participate in the evaluation. As a result over 95 percent of thesampled districts agreed to participate, a result that threatened to increase baseline data collectioncosts over budget amounts. To keep the sample size within statistical and budget parameters, inMarch of 1991 the sample of districts and schools was reduced by approximately 10 percent. Thereductions in the sample were done randomly from strata containing districts and schools with thelowest percentages of disadvantaged students. Schools in "certainty" districts, and the stratum ofschools with high percentages of LEP were excluded from this sample reduction.
Within most sampled schools, all students enrolled in all classrooms containing the targetsample grades were included in the sample; only in schools with exceptionally large gradeenrollments were students subsampled. The Prospects study thus includes all enrolled studentswithin designated grades in sampled schools, with no exclusions on the basis of disability, lack ofEnglish proficiency, or any other reason. As explained in more detail below, certain types ofsampled students were excused from specific data collection activities (e.g., cognitive testing or self-
2 Within the citywide New York City School District, six separate substrata of schools were formed. Four substrataof schools were formed in the next three largest citywide districts, Los Angeles, Chicago, and Philadelphia. Forestimating sample sizes, this is equivalent to considering New York to be three districts, and Los Angeles, Chicago, andPhiladelphia to be two districts.
ABT ASSOCIATES INC. B-4
APPENDIX B: PROSPECTS STUDY DESIGN
administered questionnaire administrations) if school staff identified them as unable to participatebecause of disabilities or lack of proficiency in the English or Spanish languages, or if a student'sparent(s) refused to permit their participation. However, with the exception of parental refusals, allbasic data elements (e.g., program participation information from student records, teacherevaluations, etc.) were collected for "excused" students wherever possible. Each sampled studentis re-evaluated for ability to participate in each data collection activity for each follow-up survey.For example, if a formerly "excused" LEP student is classified by school officials as able tocomplete a questionnaire or test in English or Spanish, that student will be included in the surveyand assessment sessions for the current survey wave.
Because the Prospects design selected all students within a grade, no special procedures wereused to attempt to augment the subsamples of special population groups. Thus, Special Educationstudents, migrant students, Gifted and Talented students, and members of racial and ethnicsubgroups (such as African Americans, Asian or Pacific Islanders, Native Americans or AlaskanNatives, and students of Hispanic descent) are included in the sample in proportion to their numbersin the Prospects school sample. A sample supplement sponsored by ED's Office of BilingualEducation and Minority Language Affairs (described below) increased the proportion of schools inthe sample with high concentrations of LEP students, and thus increased the proportions of thesestudents in the sample.
In a small number of schools, enrollment sizes in designated grades were so large thatsubsampling of students within schools was required. Subsampling was done differently forelementary schools, which typically have self-contained classrooms, and for middle or junior highschools where the seventh grade cohort was selected. If the enrollment in a 3rd grade exceeded 125students, four intact classrooms were selected at random from the list of five or more classrooms.This procedure usually yielded a sample of about 75 students. If a departmentalized middle or juniorhigh school's 7th grade enrollment exceeded 125 students, a sample of 75 students was selected fromthe entire 7th grade student roster. For the fall 1991 baseline assessment of 1st graders, if the gradeenrollment exceeded 100 students, three intact classrooms were sampled. The average sample sizeper school was approximately 70 students.
As indicated above, no restrictions were placed on the eligibility of students for the Prospectssample. However, at each sampled school, student rosters were annotated by school staff to identifystudents who were classified as LEP or as physically-, emotionally-, behaviorally- or learning-disabled. These children were included in the Prospects sample, but in consultation withknowledgeable school staff, were excused from both achievement testing and completion of self-administered questionnaires. LEP students judged by school staff to have adequate proficiency inthe Spanish langimge were asked to complete self-administered Spanish-language questionnaires (ifthey were in the 3rd grade or above), and were tested using a Spanish-language achievement testbattery (the Spanish Assessment of Basic Education or SABE) that has been calibrated to the
ABT ASSOCIATES INC. B-5
292
APPENDIX B: PROSPECTS STUDY DESIGN
English-language Comprehensive Test of Basic Skills, Version 4 (CTBS/4). With the exception ofthe self-administered questionnaires and cognitive tests, every attempt was made to complete theremainder of the Prospects data collection protocol for all LEP and disabled students in the sample.
Schools Serving LEP Students. Analysis of the sample design developed to serve the coredescriptive and evaluation objectives for the Prospects study indicated that the 1st and 3rd gradestudent samples would include too few students classified as having Limited Proficiency in English(LEP) for separate analyses of these students. To increase the number of LEP students, the Officeof Bilingual Education and Minority Language Affairs (OBEMLA) supported a supplementarysample of 25 additional schools containing 1st and/or 3rd grade students, and having highconcentrations (over 25 percent) of LEP students. Data collection activities parallel those used inthe core Prospects sample of schools.
Survey Instruments. Eleven types of data collection instruments were used in the Prospectsurveys:
District Chapter 1 Coordinator Questionnaire -- District Chapter 1 Coordinatorswere asked to complete a self-administered questionnaire focusing primarily onsystem-wide policies and administrative operations likely to affect all schoolbuildings within the district.
School Principal Questionnaire -- The School Principal Questionnaire was aself-administered form which required principals to report statistical information ontheir schools similar to the type generally required by state Departments of Education(e.g., enrollment data). The questionnaire also included questions related to eachprincipal's role, background, experience, and credentials, school policies,administrative leadership and decision-making techniques, perspective on teachers'attitudes, major challenges to the school staff, and information on Chapter 1 andother compensatory education programs and practices.
Characteristics of Schools and Programs Questionnaire (CS&P) -- Thisquestionnaire could be completed by the principal or delegated to otherknowledgeable staff. This instrument focused primarily on the overall structure andorganization of the school as well as the economic, sociological and demographicfeatures of the school, its staff, and its student body.
Regular Classroom Teacher Questionnaires -- The Regular Classroom TeacherQuestionnaire collected detailed classroom-level information about the regularinstructional program provided to the sampled students.
ART ASSOCIATES INC. B-6
293
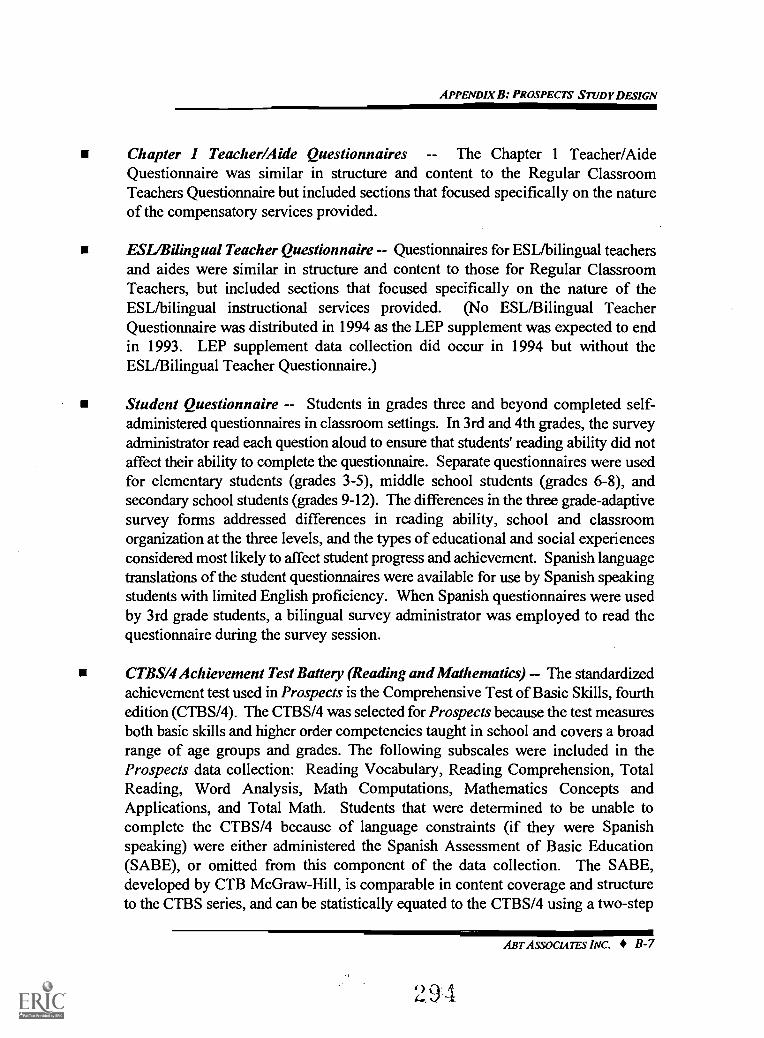
APPENDIX B: PROSPECTS STUDY DESIGN
Chapter 1 Teacher/Aide Questionnaires -- The Chapter 1 Teacher/AideQuestionnaire was similar in structure and content to the Regular ClassroomTeachers Questionnaire but included sections that focused specifically on the natureof the compensatory services provided.
ESI/Bilingual Teacher Questionnaire Questionnaires for ESL/bilingual teachersand aides were similar in structure and content to those for Regular ClassroomTeachers, but included sections that focused specifically on the nature of theESL/bilingual instructional services provided. (No ESL/Bilingual TeacherQuestionnaire was distributed in 1994 as the LEP supplement was expected to endin 1993. LEP supplement data collection did occur in 1994 but without theESL/Bilingual Teacher Questionnaire.)
Student Questionnaire -- Students in grades three and beyond completed self-administered questionnaires in classroom settings. In 3rd and 4th grades, the surveyadministrator read each question aloud to ensure that students' reading ability did notaffect their ability to complete the questionnaire. Separate questionnaires were usedfor elementary students (grades 3-5), middle school students (grades 6-8), andsecondary school students (grades 9-12). The differences in the three grade-adaptivesurvey forms addressed differences in reading ability, school and classroomorganization at the three levels, and the types of educational and social experiencesconsidered most likely to affect student progress and achievement. Spanish languagetranslations of the student questionnaires were available for use by Spanish speakingstudents with limited English proficiency. When Spanish questionnaires were usedby 3rd grade students, a bilingual survey administrator was employed to read thequestionnaire during the survey session.
CTBS/4 Achievement Test Battery (Reading and Mathematics) The standardizedachievement test used in Prospects is the Comprehensive Test of Basic Skills, fourthedition (CTBS/4). The CTBS/4 was selected for Prospects because the test measuresboth basic skills and higher order competencies taught in school and covers a broadrange of age groups and grades. The following subscales were included in theProspects data collection: Reading Vocabulary, Reading Comprehension, TotalReading, Word Analysis, Math Computations, Mathematics Concepts andApplications, and Total Math. Students that were determined to be unable tocomplete the CTBS/4 because of language constraints (if they were Spanishspeaking) were either administered the Spanish Assessment of Basic Education(SABE), or omitted from this component of the data collection. The SABE,developed by CTB McGraw-Hill, is comparable in content coverage and structureto the CTBS series, and can be statistically equated to the CTBS/4 using a two-step
ABT ASSOCIATES INC. B-7
n:
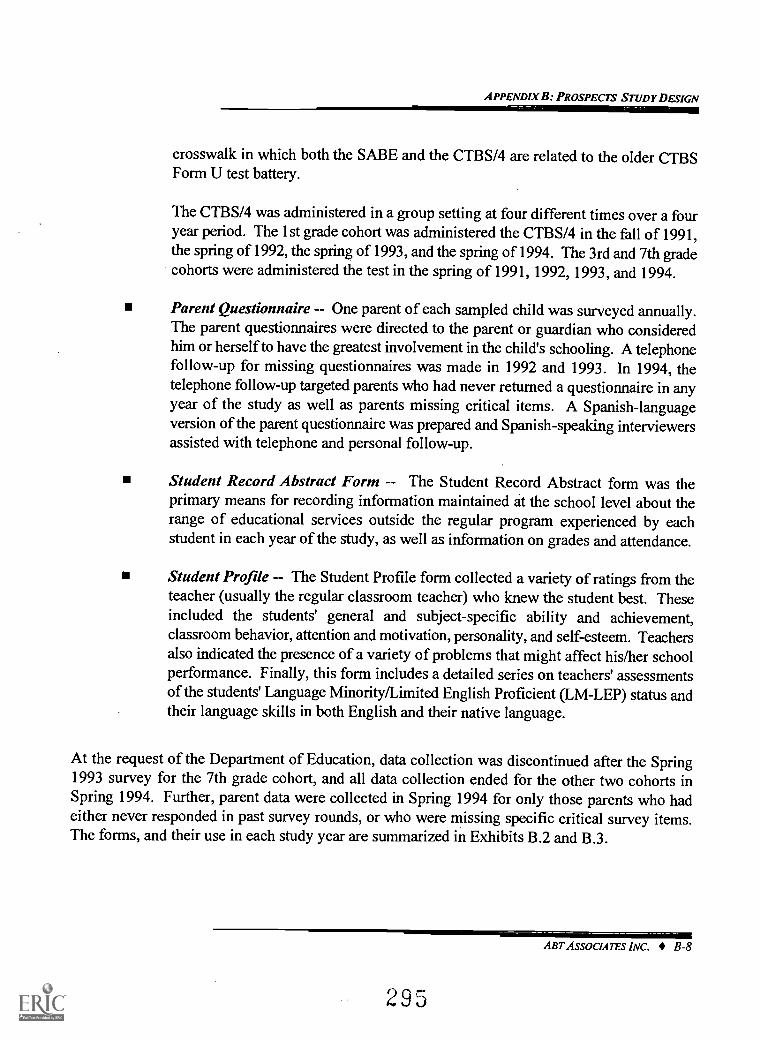
APPENDIX B: PROSPECTS STUDY DESIGN
crosswalk in which both the SABE and the CTBS/4 are related to the older CTBSForm U test battery.
The CTBS/4 was administered in a group setting at four different times over a fouryear period. The 1st grade cohort was administered the CTBS/4 in the fall of 1991,the spring of 1992, the spring of 1993, and the spring of 1994. The 3rd and 7th gradecohorts were administered the test in the spring of 1991, 1992, 1993, and 1994.
Parent Questionnaire-- One parent of each sampled child was surveyed annually.The parent questionnaires were directed to the parent or guardian who consideredhim or herself to have the greatest involvement in the child's schooling. A telephonefollow-up for missing questionnaires was made in 1992 and 1993. In 1994, thetelephone follow-up targeted parents who had never returned a questionnaire in anyyear of the study as well as parents missing critical items. A Spanish-languageversion of the parent questionnaire was prepared and Spanish-speaking interviewersassisted with telephone and personal follow-up.
Student Record Abstract Form -- The Student Record Abstract form was theprimary means for recording information maintained at the school level about therange of educational services outside the regular program experienced by eachstudent in each year of the study, as well as information on grades and attendance.
Student Profile -- The Student Profile form collected a variety of ratings from theteacher (usually the regular classroom teacher) who knew the student best. Theseincluded the students' general and subject-specific ability and achievement,classroom behavior, attention and motivation, personality, and self-esteem. Teachersalso indicated the presence of a variety of problems that might affect his/her schoolperformance. Finally, this form includes a detailed series on teachers' assessmentsof the students' Language Minority/Limited English Proficient (LM-LEP) status andtheir language skills in both English and their native language.
At the request of the Department of Education, data collection was discontinued after the Spring1993 survey for the 7th grade cohort, and all data collection ended for the other two cohorts inSpring 1994. Further, parent data were collected in Spring 1994 for only those parents who hadeither never responded in past survey rounds, or who were missing specific critical survey items.The forms, and their use in each study year are summarized in Exhibits B.2 and B.3.
ABT ASSOCIATES INC. 8-8
295
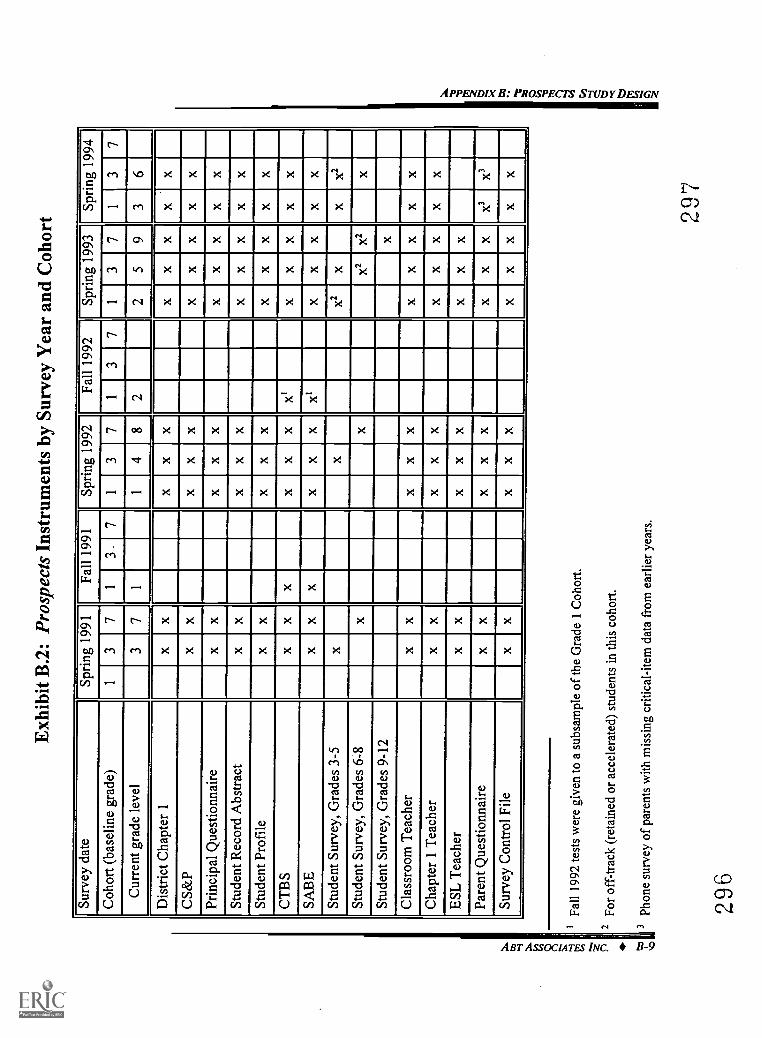
5-) et,
Exh
ibit
B.2
: Pro
spec
ts I
nstr
umen
ts b
y Su
rvey
Yea
r an
d C
ohor
t
Surv
ey d
ate
Spen
g 19
91Fa
ll 19
91Sp
eng
1992
Fall
1992
Spri
ng 1
993
Spen
g 19
94C
ohor
t (ba
selin
e gr
ade)
13
71
3.7
13
71
37
13
71
37
Cur
rent
gra
de le
vel
37
I1
48
22
59
36
Dis
tric
t Cha
pter
1x
xx
xx
xx
xx
x
CS&
Px
xx
xx
xx
xx
x_
Prin
cipa
l Que
stio
nnai
rex
xx
xx
xx
xx
x
Stud
ent R
ecor
d A
bstr
act
xx
xx
xx
xx
xx
Stud
ent P
rofi
lex
xx
xx
xx
xx
xC
TB
Sx
xx
xx
xxl
xx
xx
xSA
BE
xx
xx
xx
x'x
xx
xx
Stud
ent S
urve
y, G
rade
s 3-
5x
xx2
XX
X2
Stud
ent S
urve
y, G
rade
s 6-
8x
xx2
X2
X
Stud
ent S
urve
y, G
rade
s 9-
12x
-_
Cla
ssro
om T
each
erx
xx
xx
xx
xx
x
Cha
pter
1 T
each
erx
xx
xx
xx
xx
xE
SL T
each
erx
xx
xx
xx
x
Pare
nt Q
uest
ionn
aire
xx
xx
-x
xx
xx3
X3
Surv
ey C
ontr
ol F
ilex
xx
xx
xx
xx
x
2
Fall
1992
test
s w
ere
give
n to
a s
ubsa
mpl
e of
the
Gra
de 1
Coh
ort.
For
off-
trac
k (r
etai
ned
or a
ccel
erat
ed)
stud
ents
in th
is c
ohor
t.
3 Ph
one
surv
ey o
f pa
rent
s w
ith m
issi
ng c
ritic
al-i
tem
dat
a fr
om e
arlie
rye
ars.
296
297
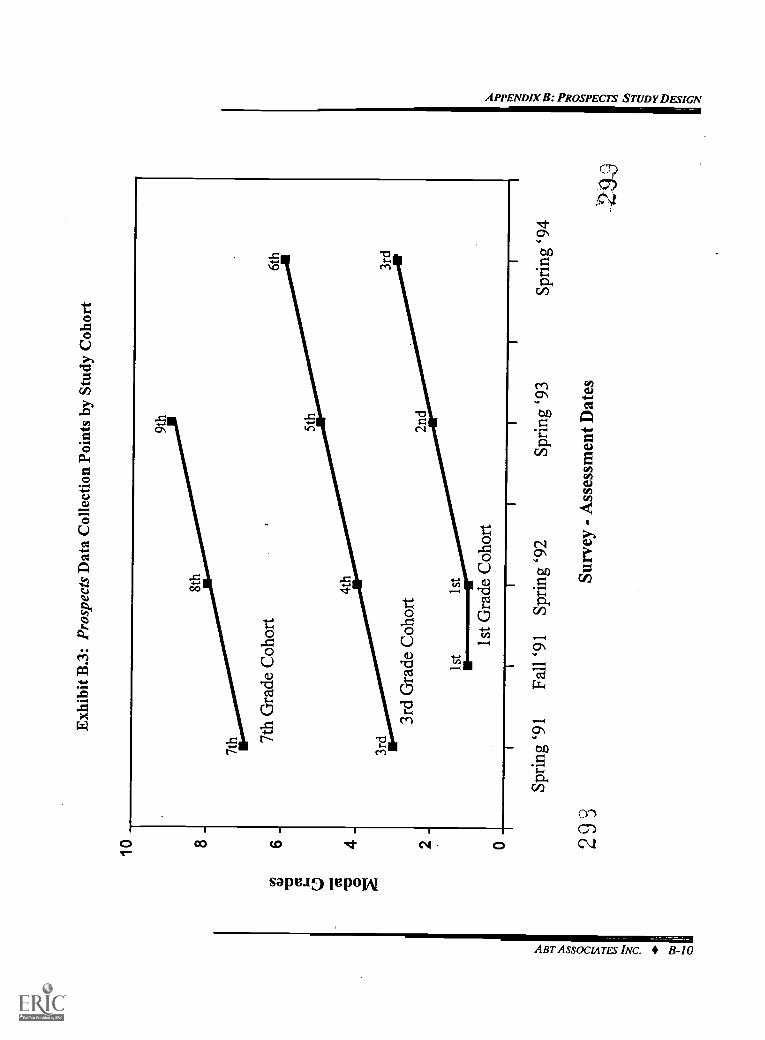
Exh
ibit
B.3
: Pro
spec
ts D
ata
Col
lect
ion
Poin
tsby
Stu
dy C
ohor
t
2 9
r" .3
Spri
ng '9
1Fa
ll '9
1Sp
ring
'92
Surv
ey -
Ass
essm
ent D
ates
I1
Spri
ng '9
4
APPENDIX C
MISSING DATA RATES FOR
VARIABLES USED TO IDENTIFY LEP STUDENTS
3 0 0
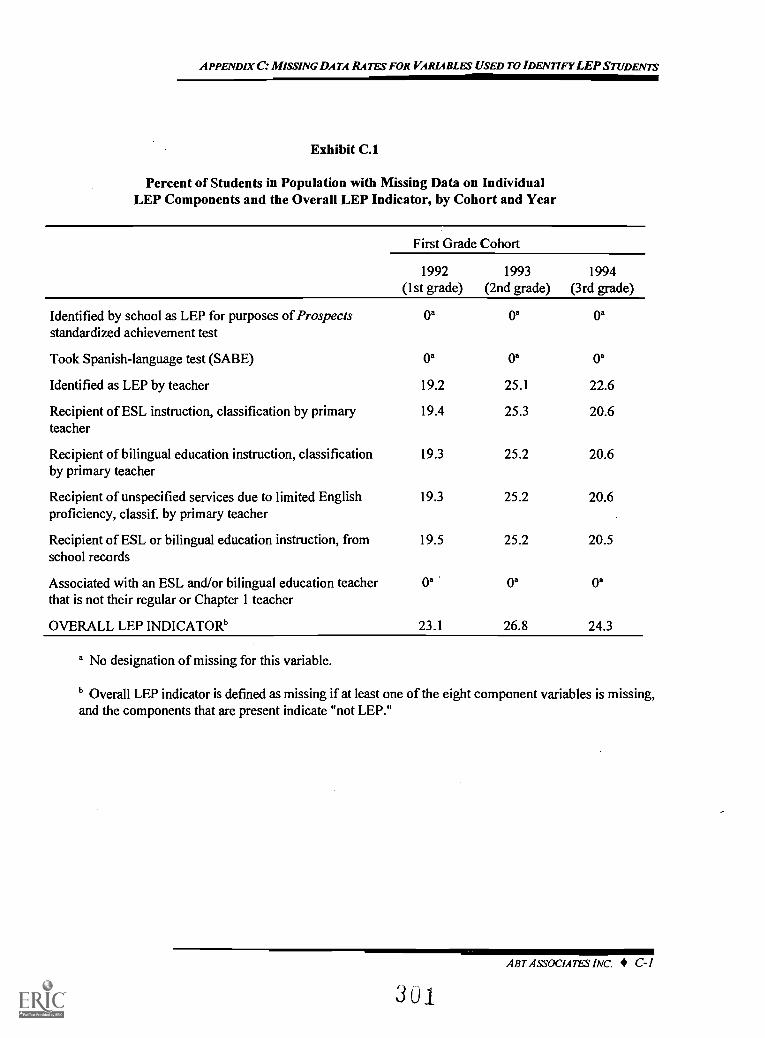
APPENDIX C: MISSING DATA RATES FOR VARIABLES USED TO IDENTIFY LEP STUDENTS
Exhibit C.1
Percent of Students in Population with Missing Data on IndividualLEP Components and the Overall LEP Indicator, by Cohort and Year
First Grade Cohort
1992(1st grade)
1993(2nd grade)
1994(3rd grade)
Identified by school as LEP for purposes of Prospectsstandardized achievement test
0' oa oa
Took Spanish-language test (SABE) Oa Oa Oa
Identified as LEP by teacher 19.2 25.1 22.6
Recipient of ESL instruction, classification by primaryteacher
19.4 25.3 20.6
Recipient of bilingual education instruction, classificationby primary teacher
19.3 25.2 20.6
Recipient of unspecified services due to limited Englishproficiency, classif. by primary teacher
19.3 25.2 20.6
Recipient of ESL or bilingual education instruction, fromschool records
19.5 25.2 20.5
Associated with an ESL and/or bilingual education teacherthat is not their regular or Chapter 1 teacher
Oa Oa Oa
OVERALL LEP INDICATOR' 23.1 26.8 24.3
No designation of missing for this variable.
Overall LEP indicator is defined as missing if at least one of the eight component variables is missing,and the components that are present indicate "not LEP."
ABT ASSOCIATES INC. C-1
3 U 1
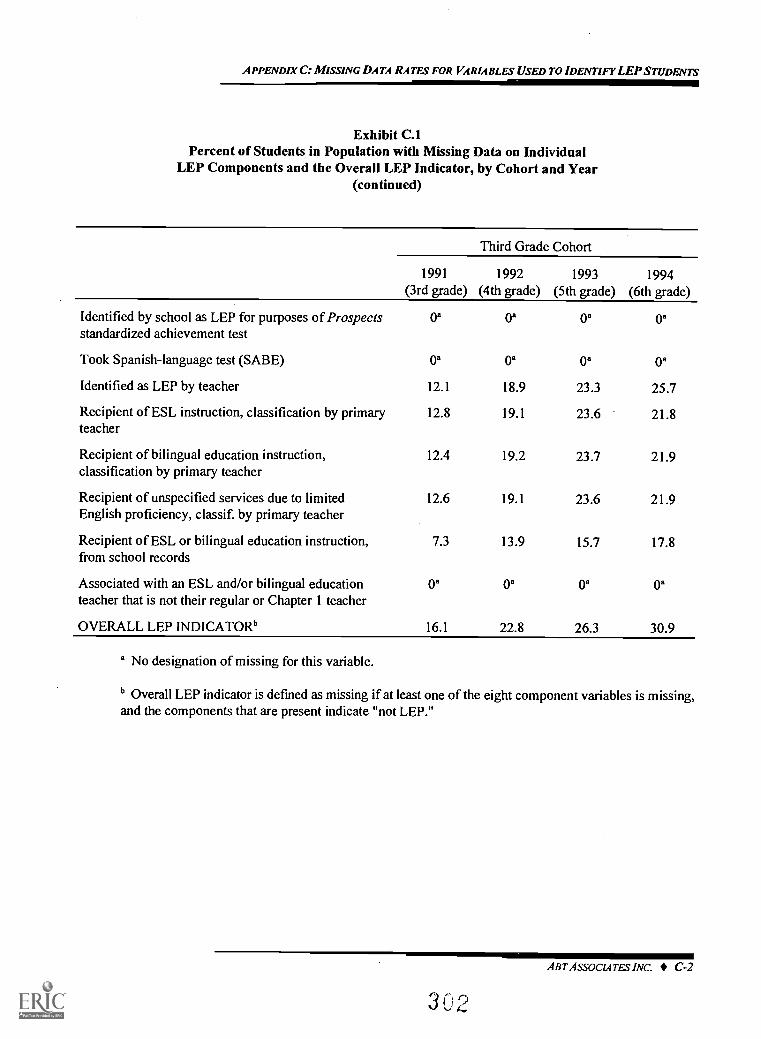
APPENDIX C: MISSING DATA RATES' FOR VARIABLES USED TO IDENTIFY LEP STUDENTS
Exhibit C.1Percent of Students in Population with Missing Data on Individual
LEP Components and the Overall LEP Indicator, by Cohort and Year(continued)
Third Grade Cohort
1991 1992(3rd grade) (4th grade)
1993(5th grade)
1994(6th grade)
Identified by school as LEP for purposes of Prospectsstandardized achievement test
Oa Oa Oa Oa
Took Spanish-language test (SABE) Oa Oa Oa Oa
Identified as LEP by teacher 12.1 18.9 23.3 25.7
Recipient of ESL instruction, classification by primaryteacher
12.8 19.1 23.6 21.8
Recipient of bilingual education instruction,classification by primary teacher
12.4 19.2 23.7 21.9
Recipient of unspecified services due to limited 12.6 19.1 23.6 21.9English proficiency, classif. by primary teacher
Recipient of ESL or bilingual education instruction,from school records
7.3 13.9 15.7 17.8
Associated with an ESL and/or bilingual educationteacher that is not their regular or Chapter 1 teacher
On On Oa Oa
OVERALL LEP INDICATORb 16.1 22.8 26.3 30.9
a No designation of missing for this variable.
b Overall LEP indicator is defined as missing if at least one of the eight component variables is missing,and the components that are present indicate "not LEP."
ABT ASSOCIATES INC. C-2
3
APPENDIX D
TREATMENT OF MISSING DATA
303
APPENDIX D: TREATMENT OF MISSING DATA
TREATMENT OF MISSING DATA
The previously described stmcture of the Prospects survey (see Appendix B) involved thecollection of data from a variety of sources, including students, parents, teachers and school officials,over a period of time of up to four years. However, not all data were available for every student forall years, and for instruments that were completed, some items of information might be missing.This situation is the norm in most large, national, longitudinal studies. Because there was such agreat potential for analysis variables to be unavailable, and because data could not be assumed to bemissing completely at random, an analysis of only those individuals with complete data would havebeen inappropriate. Consequently, missing data imputation procedures were undertaken to obtainthe best possible estimates of missing values, whenever possible.
Several properties of the Prospects data make it particularly well suited for such animputation of missing data. First, many variables are defined in each of the four survey years; someof these, such as test scores, would be expected to increase year by year, while others, such asdemographic characteristics, would be more likely to remain constant. Second, some variables arereported by more than one source, or are closely related to variables reported by another source.Third, some variables are closely related to others within the same instrument, for example, a groupof questions designed to be combined into a scale of student self concept. The high correlationsresulting from the multi-year, multi-source nature of the data base support the estimation of missingvalues.
Imputation was done on all available variables to obtain maximum likelihood estimates,iterating to within a convergence criterion of 0.001 for school variables, and 0.0001 for all othervariables. Sample sizes were large enough that the possibility of overfitting was not a constraint.Data for each cohort was processed separately, sample weights were not used in the estimationprocess, and imputations were done separately for four groups of variables: outcomes,demographic/background variables, school variables, and teacher/classroom variables.
Limits were set on the amount of missing data allowed before a variable could be includedin the imputation procedure. Variables were included only if they had data for at least 50 percentof eligible cases. The actual incidence of missing data was generally much less than this cutoff levelwould suggested. Eligibility was defined as having had an opportunity to provide data. Forexample, in 1991, 312 schools were attended by at least one student in our sample. As a result, atleast 156 (50%) of the 312 schools would have to have non-missing data on a particular 1991 school-level variable in order for estimates to be computed for the remaining first year schools. For a veryfew critical variables, the 50 percent standard was waived when the incidence of missing data fell
ABT ASSOCIATES INC. D-I
304
APPENDIX D: TREATMENT OF MISSING DATA
only slightly below the cutoff, and if the particular variables were highly correlated with othervariables in the group.
For the school- and teacher-level variables, limits were set for amounts of missing datawithin each observation as well as for each variable. School and teacher records had to have at least25 percent of the variables measured to be included in the imputation process. While this may seemquite low, the strong intercorrelations among variables within each group drove the selection of thiscutoff, and in fact, most observations were at least 80 percent complete for each group of variables.
The Prospects data underwent additional processing steps both before and after the actualimputation procedures. Prior to imputation, all variables were examined for reasonableness of meansand ranges. The diversity of the sample and the data sources suggested a substantial potential forerrors in data collection due to misunderstanding questions and problems in responding. Sincecorrelations can be severely affected by extreme values, range limits were set for each variable.Caution was also taken to avoid discarding data that might be correct, but some values were soimplausible that they were extremely unlikely to represent the intended answer to the question thatwas asked. Categorical variables (such as race/ethnicity and urbanicity) were redefined as a set of(0,1) variables for estimation purposes.
Post-processing steps were also necessary for preparing the imputed data for use in lateranalyses because some estimated values fell outside the valued ranges. Values below the minimumwere raised, and values above the maximum were, therefore, lowered as necessary. The valid rangeswere defmed in several ways: either by a theoretically fixed range if available (such as 0-100 for avariable representing a percentage of students with some characteristic), or by defining the limits tobe the range occurring in the observed data, or by extending the observed range if a higher numbercould plausibly be correct. Most dichotomous variables were rounded off to integers, except forsome with extreme splits and those that would probably be combined with others to compute a scale.Categorical variables that had been redefined as a set of (0,1) variables for imputation were returnedto their categorical form by selecting the highest value (analogous to the estimated probability)occurring in the observed data.
The remainder of this appendix describes special circumstances and treatments for each ofthe separate categories of variables for which missing data was filled in; outcome variables,demographic/background variables, school variables, and teacher/classroom variables. This reportused many of the analysis variables that were imputed for another Prospects report (see Puma et al.,1996) and details on the imputation of missing data for these variables are described below.Following these descriptions is a description of the imputation of missing data for additionalvariables that were used only in this report. These variables primarily concern language proficiencyof LEP students and their parents and educational services specific to the needs of LEP students.
ABT ASSOCIATES INC. D-2
APPENDIX D: TREATMENT OF MISSING DATA
Outcome VariablesThe outcome variables for each cohort contained four subtest scores (Reading Vocabulary,
Reading Comprehension, Math Computation, and Math Concepts and Applications) in each of thefour years of the study. A single overall report card grade (in year 1) and three separate grades forEnglish, reading/language arts, and math (in years 2-4) were obtained from school records.Responses to questions on the Student Profile instrument filled out by each student's teacher wereused to construct scales for Cooperation/Compliance, Participation in Class, and Attention/Motivation in each of the years; teachers in each year also rated each student's achievement relativeto grade level for English, reading/language arts and math.
Imputations were therefore computed for 42 outcome variables for the 1st grade cohort and50 for the 3rd grade cohort. Most variables had missing data for 10-25 percent of the sample. IV'sfor most variables were between 0.60 and 0.80. The Participation in Class scales were less wellpredicted in all years for all cohorts, with R2's of about .30. English and math grades had IV's thatwere close to 0.60 for the 1st and 3rd grade cohorts. However, the report card grades, which werecollected from school records, had among the lowest missing data rates of the variables in this group.
Although the rates of missing data were fairly low, an additional post-processing step wasundertaken for the outcome variables to preserve the variances of the observed scores. Completedata cases were used to regress each outcome variable on all of the others, and predicted scores andresiduals were obtained. Then each imputed value was modified by adding to it a residual randomlychosen from the pool for that individual's gender by ethnicity group (e.g., black males). The resultingestimates were not subjected to range limits.
DemographiclBackground VariablesThe demographic/background datasets contained student, parent, family and community
variables for each year of the study. Composites or averages across years were used for somevariables that might be expected to remain fairly constant in order to minimize the amount ofmissing data that would need to be imputed. Student variables consisted of age, gender, ethnicity,grade, LEP status, preschool history, disabilities, and health problems. Parents' education andoccupation, their contacts with and rating of the child's school, and their expectations for the child'sacademic future were also included. Family variables included family composition, size, mobilityand SES measures.
Urbanicity and region of the country had no missing data; they were included in theimputation process as correlates of other variables. There were 48 demographic variables for the 1stgrade cohort and 59 for the 3rd grade cohort (the only cohort with data collected in all 4 years). Ineach case, five of these variables were region and urbanicity indicators; the rest had missing data thatwere imputed. Missing data rates were typically well under ten percent for variables for whichobservations were combined across years (e.g., ethnicity and items in the home), but tended to be
306
ABT ASSOCIATES INC. D-3
APPENDIX D: TREATMENT OF MISSING DATA
around 20 percent for most other variables. Data for mother's education, income, and occupationwere sufficiently complete to be included in the imputations; however, for fathers, only educationwas available for enough of the sample. R2's for the demographic variables were generally betweenabout 0.30 and 0.65. The measures of student health problems and family mobility were not highlycorrelated with the other variables in this group.
Post-processing steps consisted of shrinking extreme imputed values to valid ranges, androunding dichotomous variables. The small amounts of missing data for ethnicity (ranging from 1-4%) were imputed by selecting the imputed (0,1) variable with the highest estimated value(probability).
School VariablesSchool variables for which missing data were imputed included urbanicity, school size and
grade span, participation in Chapter 1 and Schoolwide programs, principal's education and years ofexperience, and use of tracking. Measures of school climate included decision makingprocesses,consensus on goals, and frequency of disciplinary actions. Some school variables were aggregatesof student characteristics, including the proportion of students in the school who are black, white,or Hispanic, LEP, have reading scores below the 25th percentile, and whose families are below thepoverty line. Attendance rates, teacher and student mobility rates, and student/teacher andstudent/staff ratios completed this set of 70 school measures.
Of the 2,421 schools that had at least one student participating in at least one wave of datacollection, 661 provided little or no school data. Imputations were performed for missing data forthe remaining 1,760 schools as a group, without separating them by cohort. Because the highestcorrelations were across different variables at the same school and because we included indicatorsof the grade levels taught in the school, the combining of cohorts did not present a problem.
Missing data rates were much higher than for the other sets of variables because few schoolshad been in the sample in all four years. As sampled students spread out to other schoolsover time,their new schools were added to the data collection. In order to avoid the necessity of droppingvariables that had high rates of missing data, many of the school variables used in the imputationprocedures were constructed as composites across years, for measures that could be expected to bereasonably stable over time. The requirement for at least 50 percent observed data was then appliedto schools that should have had data, either for an individual year in which the school was presentin the sample, or for a composite. Correlations among school variables tended to be high, with 1V'sgreater than 0.45 for most variables. About half of all variables had IV's of 0.85 or higher. As aboveimputed values were trimmed to conform with valid ranges, and dichotomous variables wererounded.
ABT ASSOCIATES INC. D-4
APPENDIX D: TREATMENT OF MISSING DATA
Teacher and Classroom VariablesInformation on teacher characteristics and classroom procedures were collected from each
student's math teacher and reading/language arts/English teacher. Teacher variables includedethnicity, highest academic degree, years of teaching experience, certification, time in-service,number of teachers in the classroom, and use of classroom aides. Classroom characteristics includedability grouping, the proportion of time used for whole group instruction, use of computers,availability of sufficient materials, minutes per week of instruction in the subject area, and hours perweek of homework. Teachers also reported aggregated student characteristics such as the percentof Chapter 1 and LEP students in the classroom, the percent below grade level in the subject, thenumber of Chapter 1 students served within and outside of the classroom, and class size. They alsorated community climate, their relationships with staff and the school/district administration, andtheir ability to influence school policy. Several factor scores were constructed from the teachers'responses. For math teachers, these included composite measures of their dependence on remedialinstructional, and use of higher order thinking skills and advanced math. In the reading/languagearts/English classrooms, factor scores for their dependence on remedial instruction, any use ofcomprehensive, writing and reading/writing integration were obtained. Not all variables weredefined for each cohort or for each subject area. Imputations of missing data were estimatedseparately for math and reading/language arts/English teachers within each of the cohorts. The unitof analysis was the student, with the teacher/classroom variables attached to each student reportedon by that math or reading/language arts/English teacher. The 1st grade cohort had 79 math teachervariables and 83 variables for reading/language arts/English teachers; and the 3rd grade cohort had110 variables for each subject area. In each of the two cohorts, between three and four percent ofstudents had too little teacher data available for imputations to be estimated for missing values.Almost all variables had missing data rates between 10 and 30 percent. IV's varied widely, with themajority falling between 0.30 and 0.50. Higher IV's were obtained for variables related to classroomcomposition, such as the presence of LEP and Chapter 1 students, and the number served within andoutside of the classroom. Factor scores also tended to be highly correlated with other variables,especially for the 3rd grade cohort. Variables including minutes per week of classroom time on thesubject, and hours per week of homework, were less well predicted for the 1st grade cohort. Thenumber of teachers in the classroom was not highly correlated with other variables, probably becauseit was equal to one for the great majority of observed cases.
Additional Variables for the LEP ReportAfter imputed values had been estimated for missing data for all of the groups of variables
described above for the main study, additional sets of variables were selected for analysis of LimitedEnglish Proficient (LEP) data in the 1st and 3rd grade cohorts. Groups of language variables,demographics, school and teacher measures were linked with the previously imputed variables, andmissing data procedures were undertaken.
ABT ASSOCIATES INC. D-5
308
APPENDIX D: TREATMENT OF MISSING DATA
The additional LEP outcome variables were imputed only for those sample members whohad been identified as LEP at some time during the data collection: 1,642 students in the 1st gradecohort and 1,739 in the 3rd grade cohort. These variables consisted of measures of studentproficiency in speaking, understanding, reading, and writing English for each year of data collection,as reported both by the teacher and by the student's self assessment. The same measures ofproficiency in use of the student's non-English language were reported by the teacher only. Adichotomous variable indicating whether English was the parents' native language, as well asmeasures of frequency of use of English in the home and average parents' English proficiencycompleted this set of variables. The 43 language variables for the 3rd grade cohort (23 for the 1stgrade cohort, which had no 1991 data collection) were merged with selected previously imputedvariables from the main study to provide correlates for prediction. These included ethnicity,urbanicity, and several SES measures. Missing data rates for language variables in both cohortswere generally close to 20 percent, with much greater amounts of missing data for teacher reportsof native language proficiency. Ies for the 1st grade cohort were greater than 0.70 for more thantwo-thirds of the variables, and at least 0.33 for the rest. In the 3rd grade cohort, les exceeded 0.45for all language variables, and 0.70 for over half. The only post-imputation processing procedureemployed was shrinking imputed values to valid ranges; variables were not rounded because mostof them might later be combined to construct scales.
The additional demographic\background variables to be used in the LEP report hadmissing data imputed for all sample members, not only LEP students. These variables were familyincome, male and female parent's or guardian's employment in each year, average parentaloccupational status, participation in the free lunch program, time spent alone at home, and parents'interactions with the student with respect to school expectations, future goals, language use, andrules. Six self concept questions were obtained from the student questionnaire. This set of variableswas merged with the previously-imputed main report demographic\background variables, whichwere held constant to provide predictors for imputation of the new variables. With employmentvariables (full time, part time, homemaker, unemployed, other) for eachyear separated into five (0,1)variables for each parent, there were a total of 44 demographic variables added for the LEP analysisfor the 1st grade cohort, and 59 for the 3rd grade cohort.
Missing data rates for these variables were generally under 30 percent, except for highernonresponse rates for the male parent/guardian's employment and parent occupation variables,especially in the first year of data collection. Student-reported self concept variables, time alone,and discipline were not highly correlated with the other variables in this group, with R2's mostly wellbelow 0.20. les for parent employment variables generally ranged between about 0.20 and 0.50.The other variables in this group were somewhat better predicted, with les mostly greater than 0.50.Imputed values were rounded to the nearest integer only for the 10-step income variables; exactestimates were preserved for all other variables. The categorical variables for parent employment
ABT ASSOCIATES INC. D-6
APPENDIx D: TREATMENT OF MISSING DATA
were reconstructed from the imputed (0,1) variables by selecting as most probable the category withthe highest imputed value in each group.
For the LEP analysis, 44 school variables were also added to those for which missing datahad already been imputed. Missing data estimation procedures were applied to the new set ofvariables for the same 1,760 schools as for the main report, and the original set of 70 variables wasmerged with the new data to provide correlates for imputation. The LEP school variables measurethe presence of LEP and Chapter 1 students in the school, the principal's qualifications in English-as-a-Second Language/bilingual education instructional issues, integration and coordination ofprograms and instruction for LEP and Chapter 1 students, services to LEP students' parents, parents'perceptions of students school experiences, number of days in the school year, and teachers'perception of safety. As for the main study, the requirement that each variable have observed datafor at least 50 percent of cases was defined to refer to 50 percent of the schools that had been in thesample in the year that the variable was collected. Intercorrelations among this group of variableswere high, resulting in R2's of 0.50 or greater for about three quarters of the variables. The onlyvariable that was not well predicted from the other data was number of days in the school year (R2= 0.17), which varied very little among schools.
The teacher and classroom variables to be used in the LEP report also had missing dataimputed for all sample members, not only LEP students. As with the main report teacher andclassroom variables, separate imputations were done by cohort for math andreading/English/language arts variables. The original set of main-report variables were merged withthe new data to provided correlates for imputation.
The additional teacher variables included certification in ESL and/or BE instruction and non-English language proficiency. Classroom variables included whether students receive ESL/BEinstructional services, percent of classroom instruction in non-English language, availability ofcomputer hardware and software, and the type of instructional materials used for LEP students. The1st grade cohort had 44 reading/English/language arts teacher variables and 35 math teachervariables added for the LEP analysis; while the 3rd grade cohort had 52 reading/English/languagearts teacher variables and 40 math teacher variables added for the LEP analysis. Almost all variableshad missing data rates between 1 0 and 30 percent prior to processing.
ABT ASSOCIATES INC. D-7
310
APPENDDC E
PROCEDURES FOR CALCULATING COMPOSITE SCORES
FOR INSTRUCTIONAL EMPHASIS
311
APPENDIX E: PROCEDURES FOR CALCULATING COMPOSITE SCORES FOR INSTRUCTIONAL EMPHASIS
PROCEDURES FOR CALCULATING COMPOSITE SCORES FOR INSTRUCTIONAL EMPHASIS
In each year during the Prospects study period, classroom reading/English/language arts andmath teachers were asked how much emphasis they placed on approximately 25 subject-specificskills in the class attended by each student in the Prospects sample.' For each specific skill, teacherswere given the option of responding that they placed: major emphasis on this skill (coded as 3);moderate emphasis on this skill (coded as 2); little emphasis on this skill (coded as 1); no emphasison this skill (coded as 0); or the skill was not applicable to their class (recoded as 0).
To help group the multitude of specific skills that reading/English/language arts and mathteachers might emphasize into a more manageable, and meaningful, grouping of primary skillsemphasized in instruction, factor analyses were undertaken. After analyzing the results of the factoranalyses, the bundles of specific skills that were associated with an underlying, primary skill wereidentified. The composite score for the underlying skill is simply the average level of emphasisplaced on each specific skill that is associated with the underlying skill.
Factor analyses were performed separately for reading/English/language arts and mathclasses, and for each year and cohort to reflect differences in developmentally appropriate skills.The factor analyses were done at the classroom level using maximum-likelihood estimation andoblique rotations using the promax method. Below is a general description of the underlying skills,by subject. The results of the factor analyses follow these descriptions, in Exhibits E.1 to E.5. Inthese exhibits, the column headings list the factors, with the factor means and factor alphas directlybelow them. The row headings list the specific skills (items) for which teachers were asked to reportthe degree of emphasis they place on them in class. The cells in the exhibit show the factor loadingsfor each item on the factors listed in the colunm heading. Inter-factor correlations are reported inthe bottom panel of these exhibits.
Underlying Skills a Reading/English/Language Arts Teacher Might Emphasize in Class
Our examination of the factor analyses results indicated that there are seven underlying skillsa reading/English/language arts teacher might emphasize in their classes containing students in theProspects sample. A brief description of each of these skills is provided below.
I See question L22 on the 1992 Reading/English/Language Arts Teacher Questionnaire and question F 11 forreading/English/language Arts teachers and F12 for math teachers on the joint-subject Classroom Teachers'Questionnaire in 1994. These are the questions on instructional emphasis used in this report.
ABT ASSOCIATES INC. E-I
312
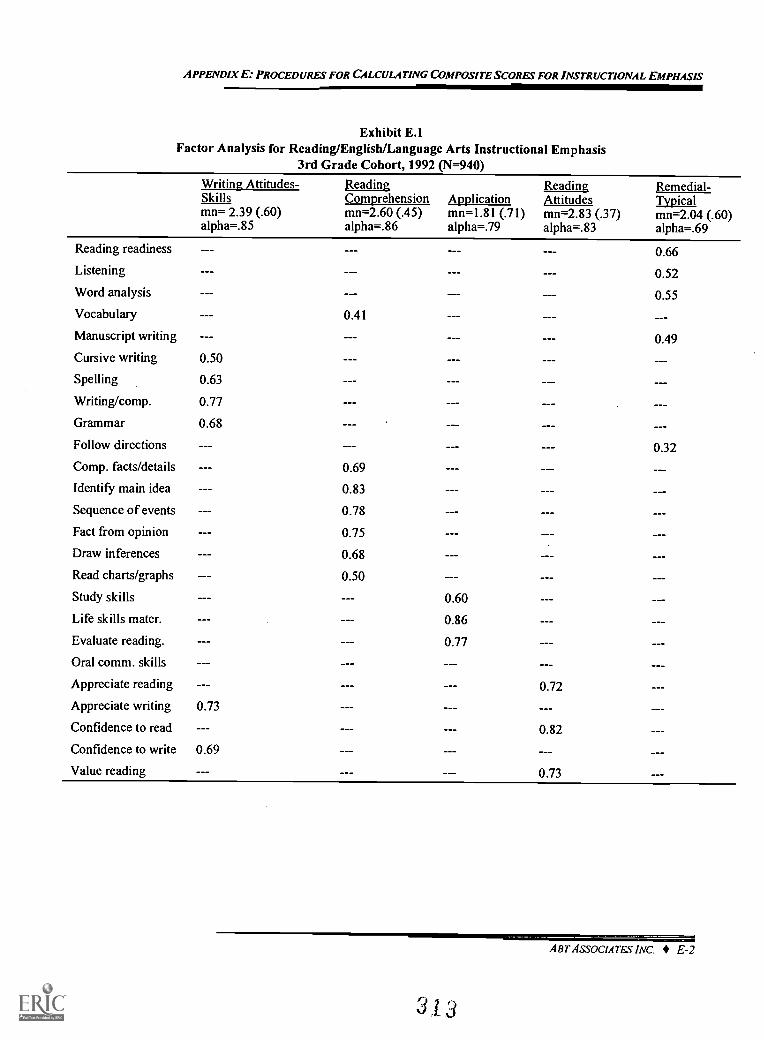
APPENDIX E: PROCEDURES FOR CALCULATING COMPOSITE SCORES FOR INSTRUCTIONAL EMPHASIS
Exhibit E.1Factor Analysis for Reading/English/Language Arts Instructional Emphasis
3rd Grade Cohort, 1992 (N=940)Writing Attitudes- Reading
Comprehension ApplicationReading Remedial-
Skills Attitudes Typicalmn= 2.39 (.60)alpha=.85
mn=2.60 (.45)alpha=.86
mn=1.81 (.71)alpha=.79
mn=2.83 (.37)alpha=.83
mn=2.04 (.60)alpha=.69
Reading readiness
Listening
Word analysis
0.66
0.52
0.55
Vocabulary 0.41
Manuscript writing 0.49
Cursive writing 0.50
Spelling 0.63
Writing/comp. 0.77
Grammar 0.68
Follow directions 0.32
Comp. facts/details 0.69
Identify main idea 0.83
Sequence of events 0.78
Fact from opinion 0.75
Draw inferences 0.68
Read charts/graphs 0.50
Study skills 0.60
Life skills mater. 0.86
Evaluate reading. 0.77
Oral comm. skills
Appreciate reading 0.72
Appreciate writing 0.73
Confidence to read 0.82
Confidence to write 0.69
Value reading 0.73
ABT ASSOCIATES INC. E-2
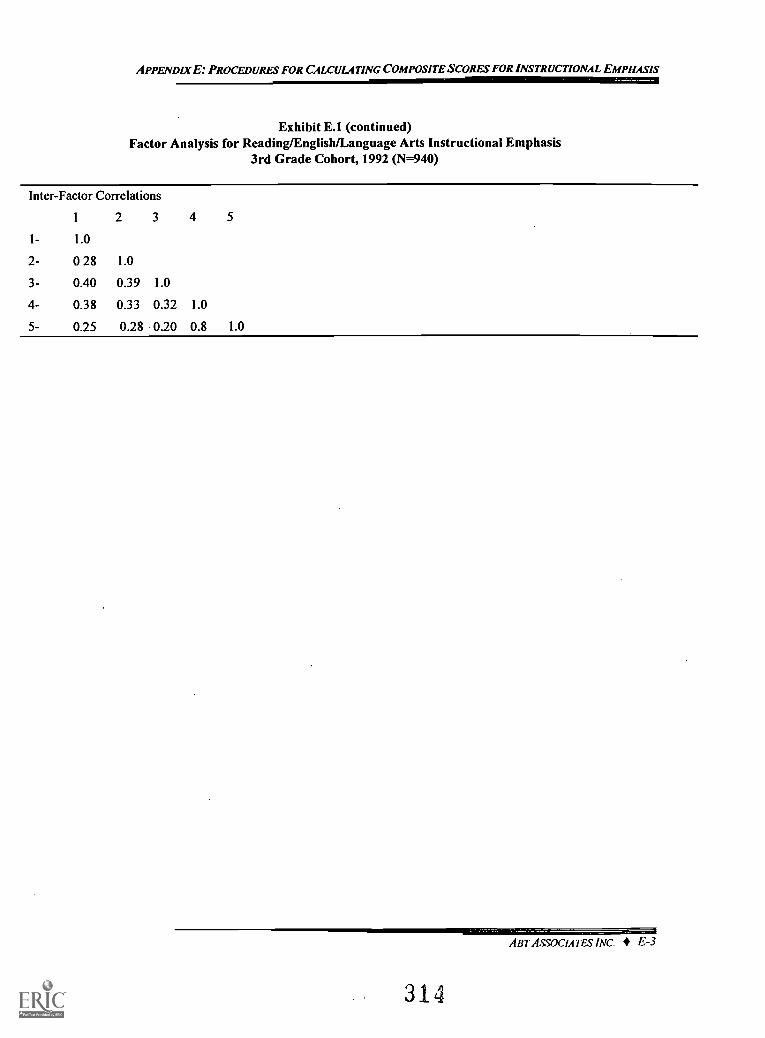
APPENDIX E: PROCEDURES FOR CALCULATING COMPOSITE SCORES FOR INSTRUCTIONAL EMPHASIS
Exhibit E.1 (continued)Factor Analysis for Reading/English/Language Arts Instructional Emphasis
3rd Grade Cohort, 1992 (N=940)
Inter-Factor Correlations
1 2 3 4 5
1- 1.0
2- 0 28 1.0
3- 0.40 0.39 1.0
4- 0.38 0.33 0.32 1.0
5- 0.25 0.28 0.20 0.8 1.0
ABT ASSOCIATES INC. E-3
314
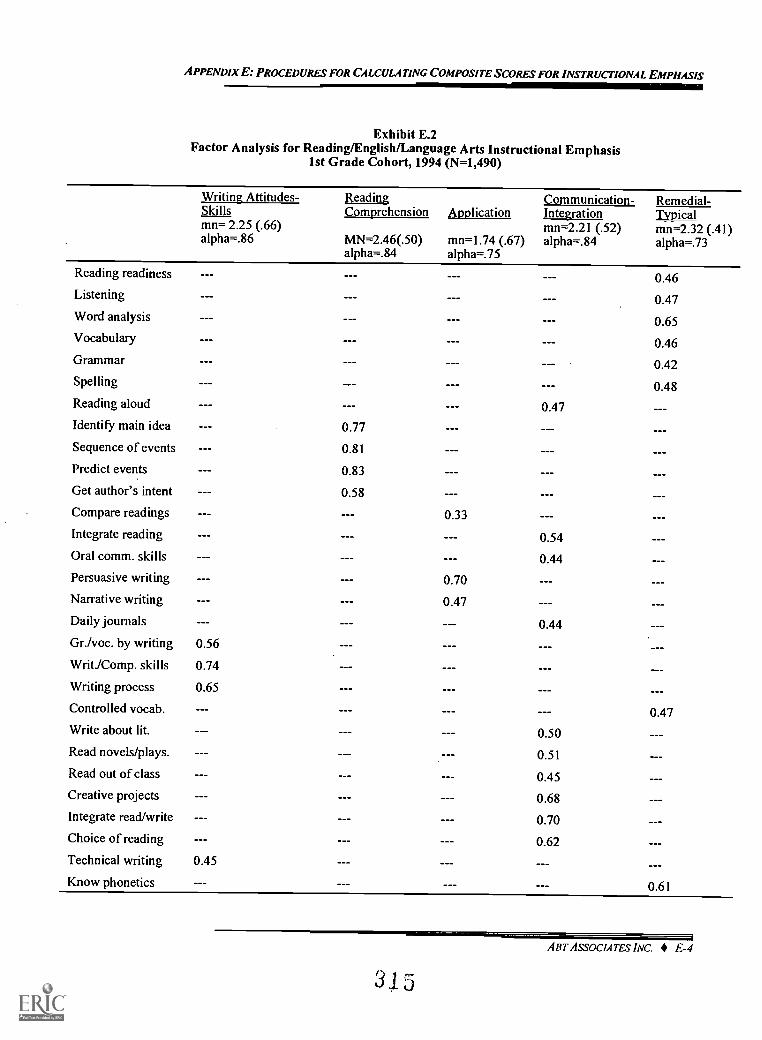
APPENDIX E: PROCEDURES FOR CALCULATING COMPOSITE SCORES FOR INSTRUCTIONAL EMPHASIS
Exhibit E.2Factor Analysis for Reading/English/Language Arts Instructional Emphasis
1st Grade Cohort, 1994 (N=1,490)
Writing Attitudes- ReadingComprehension application
Communication- Remedial-Skills integration Typicalmn= 2.25 (.66)alpha=.86 MN=2.46(.50)
alpha=.84mn=1.74 (.67)alpha=.75
mn=2.2 I (.52)alpha=.84
mn=2.32 (.41)alpha=.73
Reading readiness
Listening
Word analysis
Vocabulary
Grammar
Spelling
0.46
0.47
0.65
0.46
0.42
0.48Reading aloud 0.47Identify main idea 0.77
Sequence of events 0.81
Predict events 0.83
Get author's intent 0.58
Compare readings 0.33
Integrate reading 0.54Oral comm. skills 0.44
Persuasive writing 0.70
Narrative writing 0.47
Daily journals 0.44Gr./voc. by writing 0.56
Writ./Comp. skills 0.74
Writing process 0.65
Controlled vocab. 0.47Write about lit. 0.50Read novels/plays. 0.51
Read out of class 0.45
Creative projects 0.68Integrate read/write 0.70
Choice of reading 0.62
Technical writing 0.45
Know phonetics 0.61
ABT ASSOCIATES INC. E-4
315
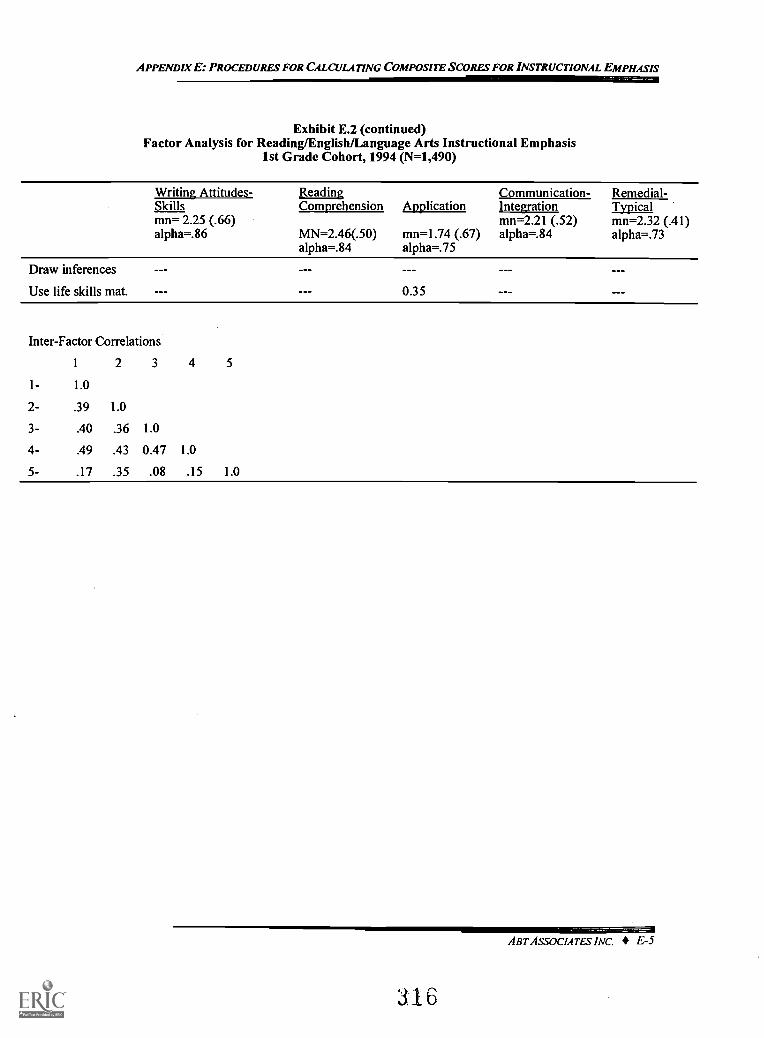
APPENDIX E: PROCEDURES FOR CALCULATING COMPOSITE SCORES FOR INSTRUCTIONAL EMPHASIS
Exhibit E.2 (continued)Factor Analysis for Reading/English/Language Arts Instructional Emphasis
1st Grade Cohort, 1994 (N=1,490)
Writing Attitudes- Reading Communication- Remedial-Skills Comprehension Application Integration Typicalmn= 2.25 (.66) mn=2.21 (.52) mn=2.32 (.41)alpha=.86 MN=2.46(.50)
alpha=.84mn=1.74 (.67)alpha=.75
alpha=.84 alpha=.73
Draw inferences
Use life skills mat. 0.35
Inter-Factor Correlations
1-
2-
3-
4-
5-
1
1.0
.39
.40
.49
.17
2
1.0
.36
.43
.35
3
1.0
0.47
.08
4
1.0
.15
5
1.0
ABT ASSOCIATES INC. E-5
316
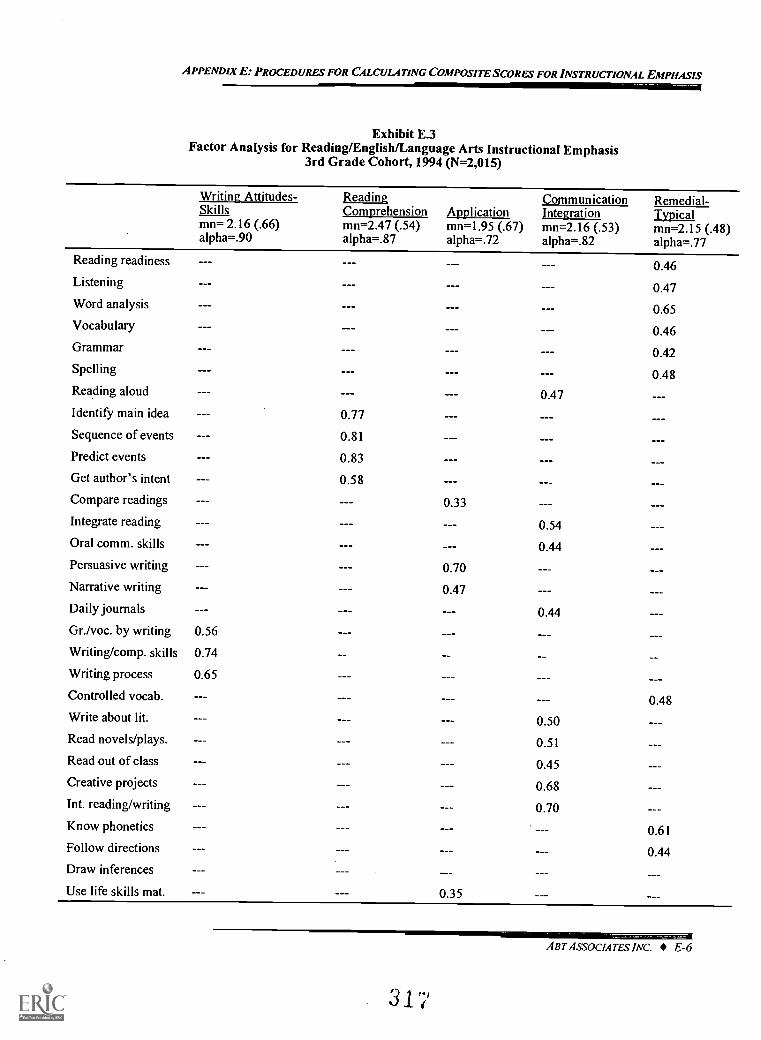
APPENDIX E: PROCEDURES FOR CALCULATING COMPOSITE SCORES FOR INSTRUCTIONAL EMPHASIS
Exhibit E.3Factor Analysis for Reading/English/Language Arts Instructional Emphasis
3rd Grade Cohort, 1994 (N=2,015)
Writing Attitudes- geadingComprehension Application
Communication Remedial-Skills Jntegration Typicalmn= 2.16 (.66)alpha=.90
mn=2.47 (.54)alpha=.87
mn=1.95 (.67)alpha=.72
mn=2.16 (.53)alpha=.82
mn=2.15 (.48)alpha=.77
Reading readiness
Listening
Word analysis
Vocabulary
Grammar
Spelling
0.46
0.47
0.65
0.46
0.42
0.48Reading aloud 0.47
Identify main idea 0.77
Sequence of events 0.81
Predict events 0.83
Get author's intent 0.58
Compare readings 0.33
Integrate reading 0.54
Oral comm. skills 0.44
Persuasive writing 0.70
Narrative writing 0.47
Daily journals 0.44
Gr./voc. by writing 0.56
Writing/comp. skills 0.74
Writing process 0.65
Controlled vocab. 0.48Write about lit. 0.50Read novels/plays. 0.51
Read out of class 0.45
Creative projects 0.68Int. reading/writing 0.70Know phonetics 0.61Follow directions 0.44Draw inferences
Use life skills mat. 0.35
ABT ASSOCIATES INC. E-6
31 7
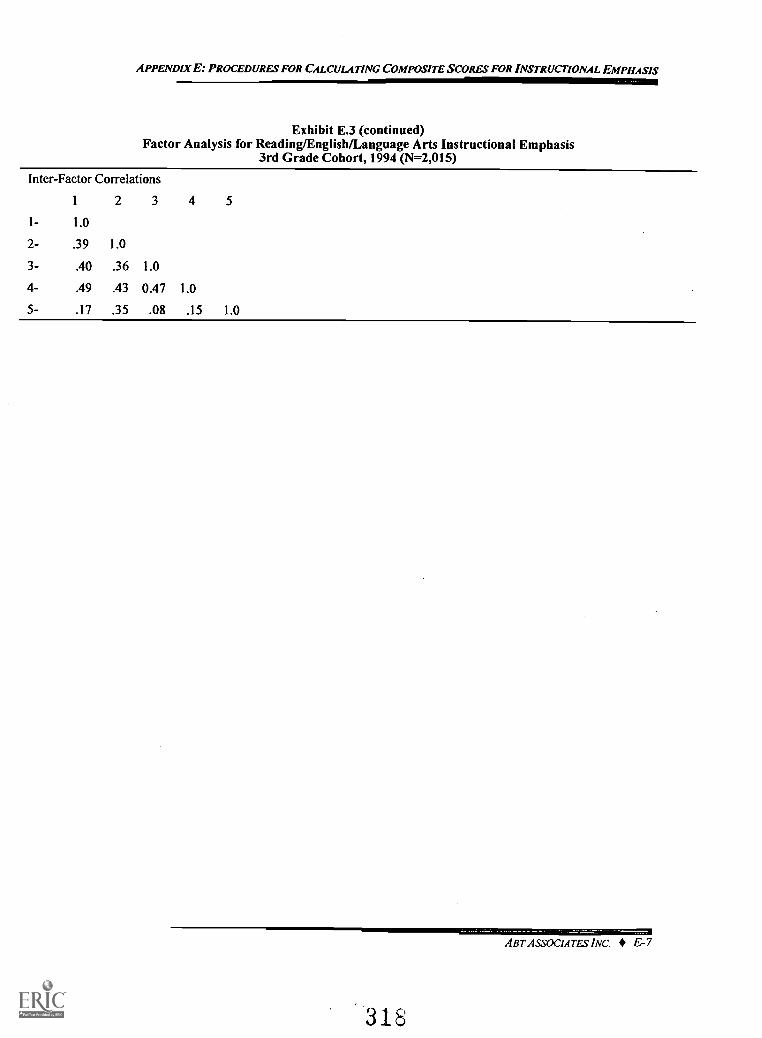
APPENDIX E: PROCEDURES FOR CALCULATING COMPOSITE SCORES FOR INSTRUCTIONAL EMPHASIS
Exhibit E.3 (continued)Factor Analysis for Reading/English/Language Arts Instructional Emphasis
3rd Grade Cohort, 1994 (W2,015)
Inter-Factor Correlations
1-
2-
3-
4-
5-
1
1.0
.39
.40
.49
.17
2
1.0
.36
.43
.35
3
1.0
0.47
.08
4
1.0
.15
5
1.0
ABT ASSOCIATES INC. E-7
318
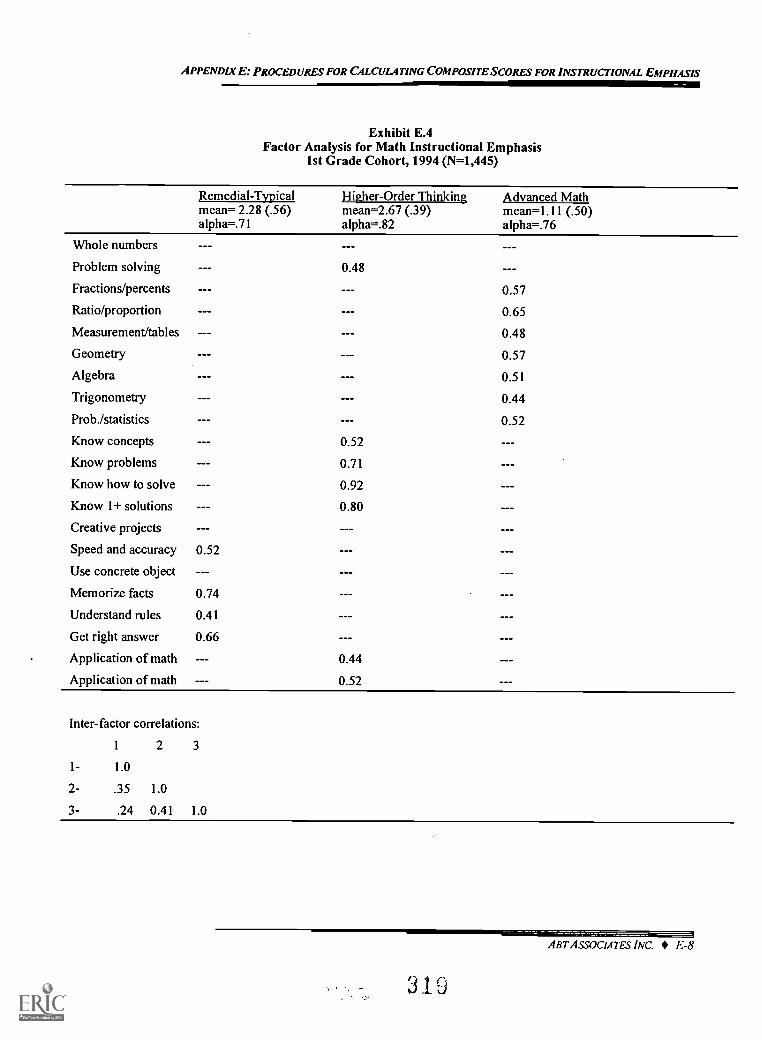
APPENDIX E: PROCEDURES FOR CALCULATING COMPOSITE SCORES FOR INSTRUCTIONAL EMPHASIS
Exhibit E.4Factor Analysis for Math Instructional Emphasis
1st Grade Cohort, 1994 (N=1,445)
Remedial-Typical Higher-Order Thinking Advanced Mathmean= 2.28 (.56)alpha=.71
mean=2.67 (.39)alpha=.82
mean=1.11 (.50)alpha=.76
Whole numbers
Problem solving 0.48
Fractions/percents 0.57
Ratio/proportion 0.65
Measurement/tables 0.48
Geometry 0.57
Algebra 0.51
Trigonometry 0.44
Prob./statistics 0.52
Know concepts 0.52
Know problems 0.71
Know how to solve 0.92
Know 1+ solutions 0.80
Creative projects
Speed and accuracy 0.52
Use concrete object ---
Memorize facts 0.74
Understand rules 0.41
Get right answer 0.66
Application of math --- 0.44
Application of math 0.52
Inter-factor correlations:
1-
2-
3-
1
1.0
.35
.24
2
1.0
0.41
3
1.0
ABT ASSOCIATES INC E-8
319
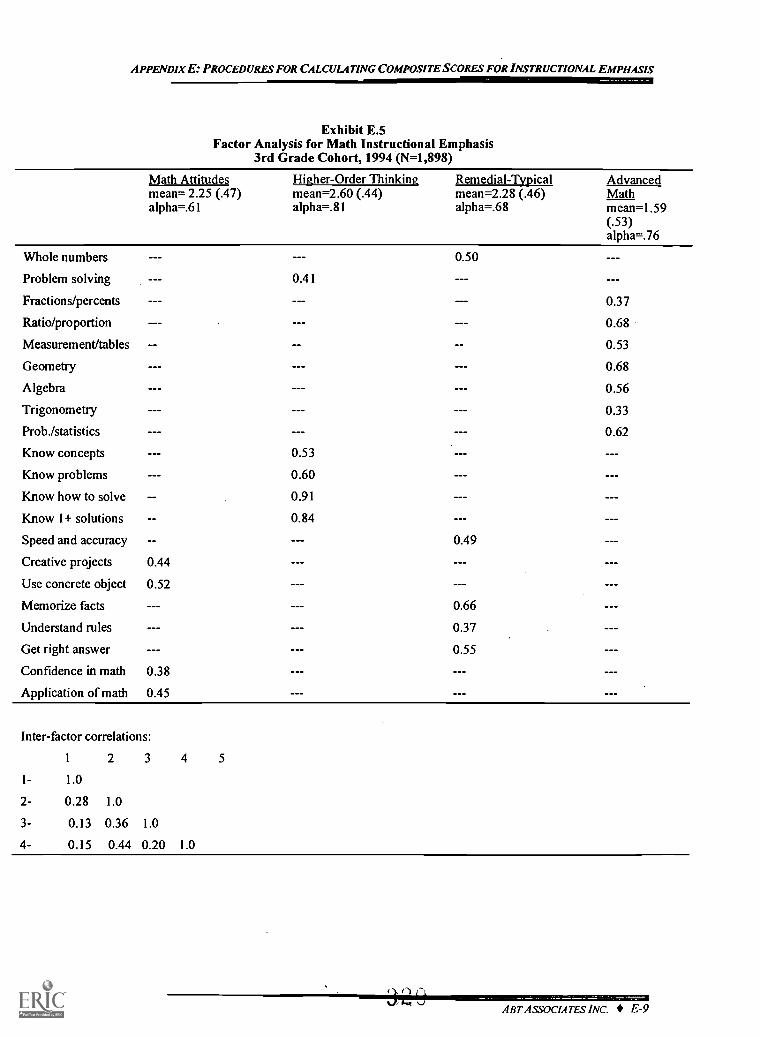
APPENDIX E: PROCEDURES FOR CALCULATING COMPOSITE SCORES FOR INSTRUCTIONAL EMPHASIS
Exhibit E.5Factor Analysis for Math Instructional Emphasis
3rd Grade Cohort, 1994 (N=1,898)
Math Attitudes Higher-Order Thinking Remedial-Tvpical Advancedmean= 2.25 (.47)alpha=.61
mean=2.60 (.44)alpha=.81
mean=2.28 (.46)alpha=.68
Mathmean=1.59(.53)alpha=.76
Whole numbers 0.50
Problem solving 0.41
Fractions/percents 0.37
Ratio/proportion 0.68
Measurement/tables 0.53
Geometry 0.68
Algebra 0.56
Trigonometry 0.33
Prob./statistics 0.62
Know concepts 0.53
Know problems 0.60
Know how to solve 0.91
Know 1+ solutions 0.84
Speed and accuracy 0.49
Creative projects 0.44
Use concrete object 0.52
Memorize facts 0.66
Understand rules 0.37
Get right answer 0.55
Confidence in math 0.38
Application of math 0.45
Inter-factor correlations:
1 2 3 4 5
1- 1.0
2- 0.28 1.0
3- 0.13 0.36 1.0
4- 0.15 0.44 0.20 1.0
I
ABT ASSOCIATES INC. E-9

APPENDIX E: PROCEDURES FOR CALCULATING COMPOSITE SCORES FOR INSTRUCTIONAL EMPHASIS
Writing Attitudes/Skills is composed of six items that a teacher might emphasize, including grammar,spelling, and developing students' confidence and appreciation for writing. Reading Attitudes includesthree items that measure the emphasis a teacher places on the student's confidence and appreciation ofreading. Reading Comprehension is composed of seven items that indicate the degree to which theteacher emphasizes students' comprehension of facts and details from their reading as well as their abilityto draw inferences and separate fact from opinion. The Application composite is an indicator of the levelof emphasis on functional applications, such as learning note-taking skills, study skills, or life skills. TheCommunication-Integration score indicates the emphasis on communication skills such as oralcommunication, reading aloud, and creative projects such as plays or skits. This factor also indicates anemphasis on integrating reading and writing projects, such as having students write about literature andintegrating reading into other areas of the curriculum. The Remedial-Typical composite score measuresthe emphasis on basic reading skills, such as reading readiness, word analysis, and vocabulary, as well aslistening skills and following directions.
Underlying Skills a Math Teacher Might Emphasize in Class
Our examination of the factor analyses results indicated that there are four underlying skills a mathteacher might emphasize in their classes containing students in the Prospects sample. A brief descriptionof each of these skills is provided below.
The Math Attitudes score indicates a teacher's emphasis on students developing an appreciationand confidence in their abilities to do math and to make math enjoyable and applicable to life. TheRemedial-Typical score is an indicator of the focus on basic math skills, such as an emphasis on learningbasic facts and concepts, whole numbers, fractions, and measurement. The Advanced Math scoremeasures the exposure provided to more advanced math instruction such as geometry, algebra,trigonometry, or statistics. Higher-Order Thinking includes an emphasis on reasoning, analytic skills andproblem solving.
ABT ASSOCIATES INC E- I 0
3'1
APPENDM F
SAMPLE SIZES FOR OUTCOMES ANALYSES
322
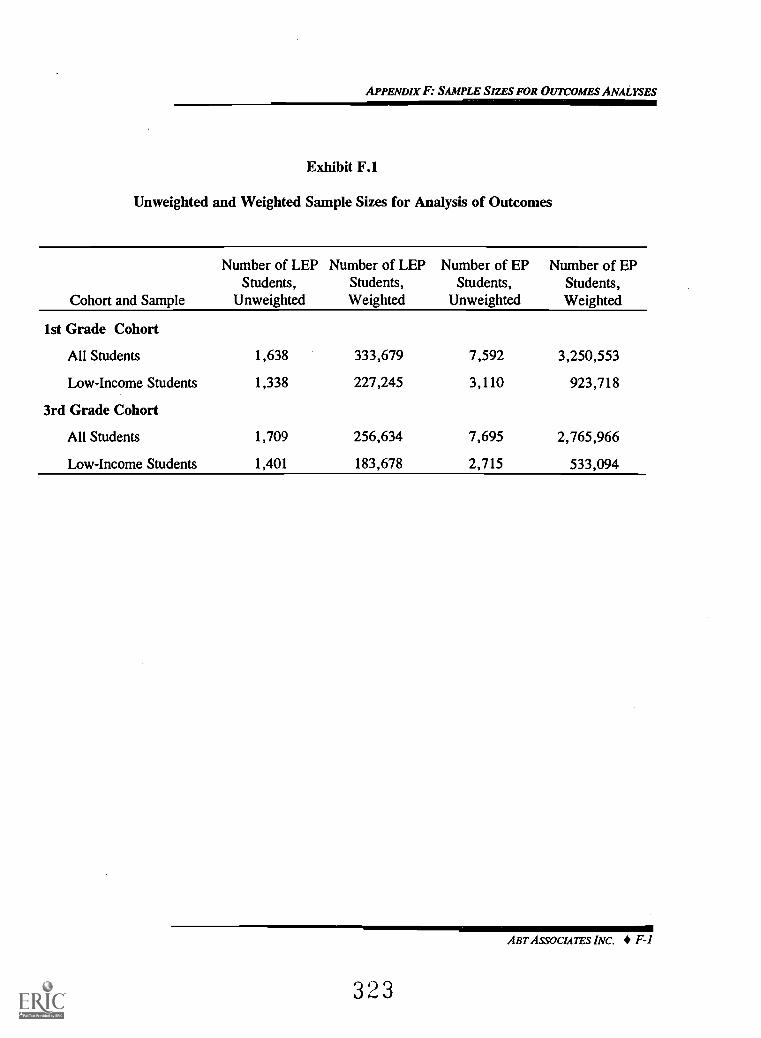
APPENDIX F: SAMPLE SIZES FOR OUTCOMES ANALYSES
Exhibit F.1
Unweighted and Weighted Sample Sizes for Analysis of Outcomes
Cohort and Sample
Number of LEPStudents,
Unweighted
Number of LEPStudents,Weighted
Number of EPStudents,
Unweighted
Number of EPStudents,Weighted
1st Grade Cohort
All Students 1,638 333,679 7,592 3,250,553
Low-Income Students 1,338 227,245 3,110 923,718
3rd Grade Cohort
All Students 1,709 256,634 7,695 2,765,966
Low-Income Students 1,401 183,678 2,715 533,094
ABT ASSOCIATES INC. F-1
323
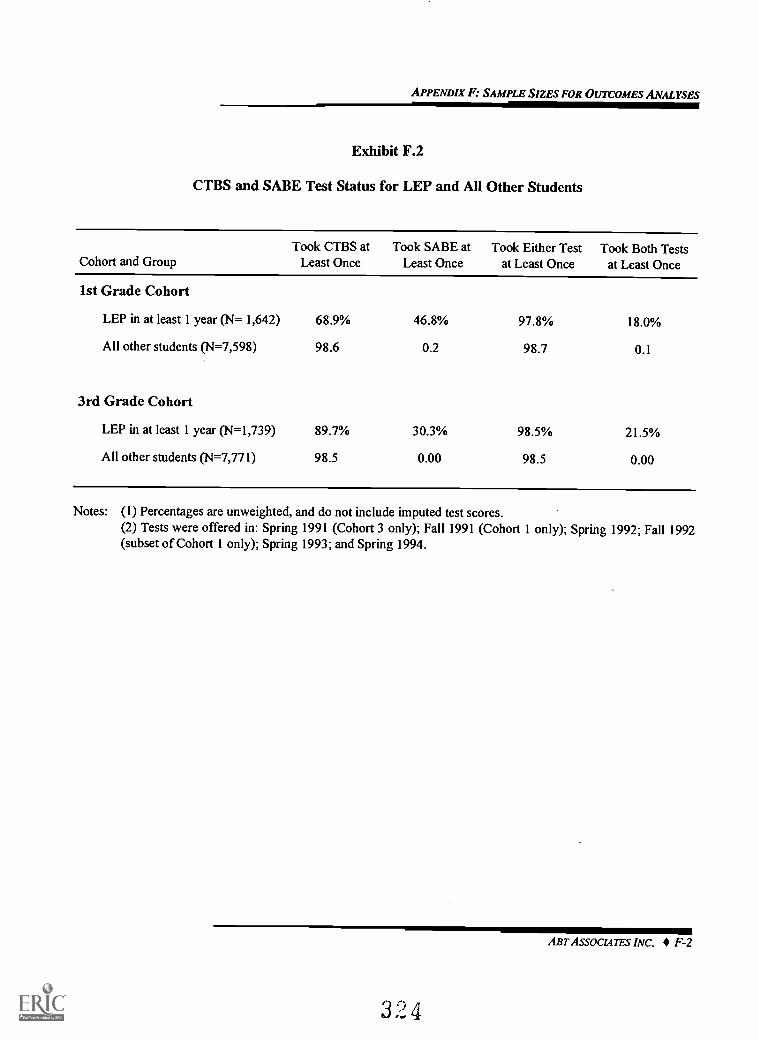
APPENDIX F: SAMPLE SIZES FOR OUTCOMES ANALYSES
Exhibit F.2
CTBS and SABE Test Status for LEP and All Other Students
Cohort and GroupTook CTBS at
Least OnceTook SABE at
Least OnceTook Either Test
at Least OnceTook Both Tests
at Least Once
1st Grade Cohort
LEP in at least 1 year (N= 1,642) 68.9% 46.8% 97.8% 18.0%
All other students (N=7,598) 98.6 0.2 98.7 0.1
3rd Grade Cohort
LEP in at least 1 year (N=1,739) 89.7% 30.3% 98.5% 21.5%
All other students (N=7,771) 98.5 0.00 98.5 0.00
Notes: (1) Percentages are unweighted, and do not include imputed test scores.(2) Tests were offered in: Spring 1991 (Cohort 3 only); Fall 1991 (Cohort 1 only); Spring 1992; Fall 1992(subset of Cohort 1 only); Spring 1993; and Spring 1994.
ABT ASSOCL9TES INC. F-2
32 4
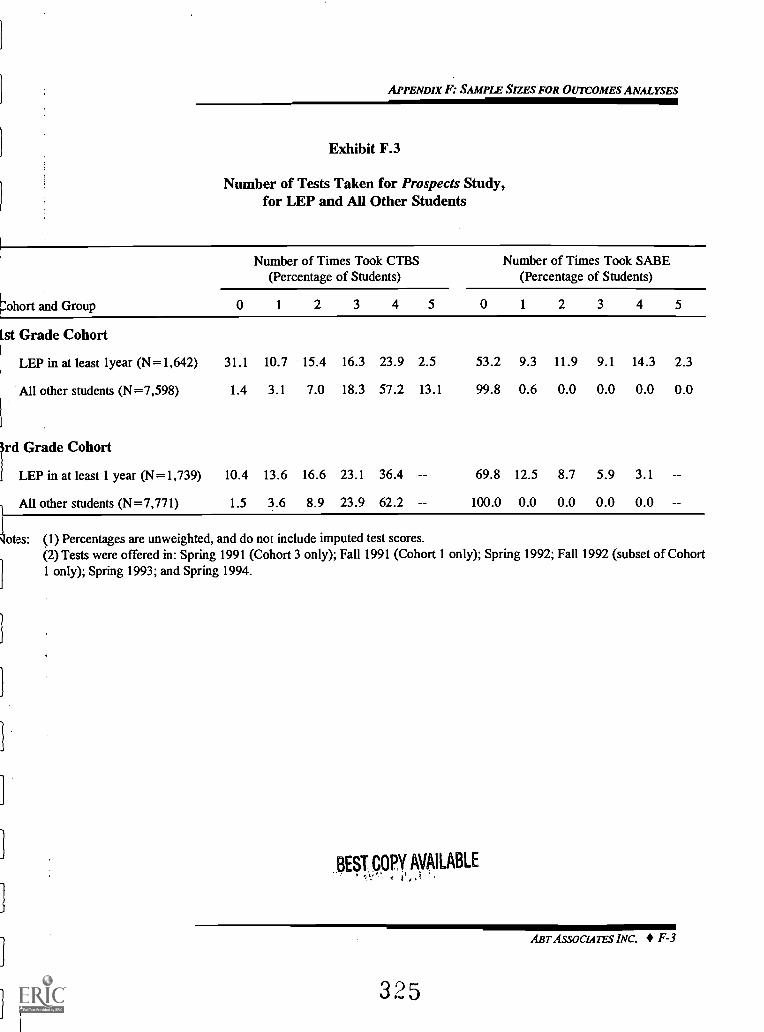
APPENDIX F: SAMPLE SIZES FOR OUTCOMES ANALYSES
Exhibit F.3
Number of Tests Taken for Prospects Study,for LEP and All Other Students
ohort and Group
Number of Times Took CTBS Number of Times Took SABE(Percentage of Students) (Percentage of Students)
0 1 2 3 4 5
lst Grade Cohort
LEP in at least lyear (N=1,642) 31.1 10.7 15.4 16.3 23.9 2.5
All other students (N=7,598) 1.4 3.1 7.0 18.3 57.2 13.1
1rdGrade Cohort
1 LEP in at least 1 year (N=1,739) 10.4 13.6 16.6 23.1 36.4
JUL other students (N=7,771) 1.5 3.6 8.9 23.9 62.2
Ltes: (1) Percentages are unweighted, and do not include imputed test scores.(2) Tests were offered in: Spring 1991 (Cohort 3 only); Fall 1991 (Cohort 1 only); Spring 1992; Fall 1992 (subset of Cohort1 only); Spring 1993; and Spring 1994.
0 1 2 3 4 5
53.2 9.3 11.9 9.1 14.3 2.3
99.8 0.6 0.0 0.0 0.0 0.0
69.8 12.5 8.7 5.9 3.1
100.0 0.0 0.0 0.0 0.0
BEST,COPY, AVAILABLE
ABT ASSOCIATES INC. F-3
3 25
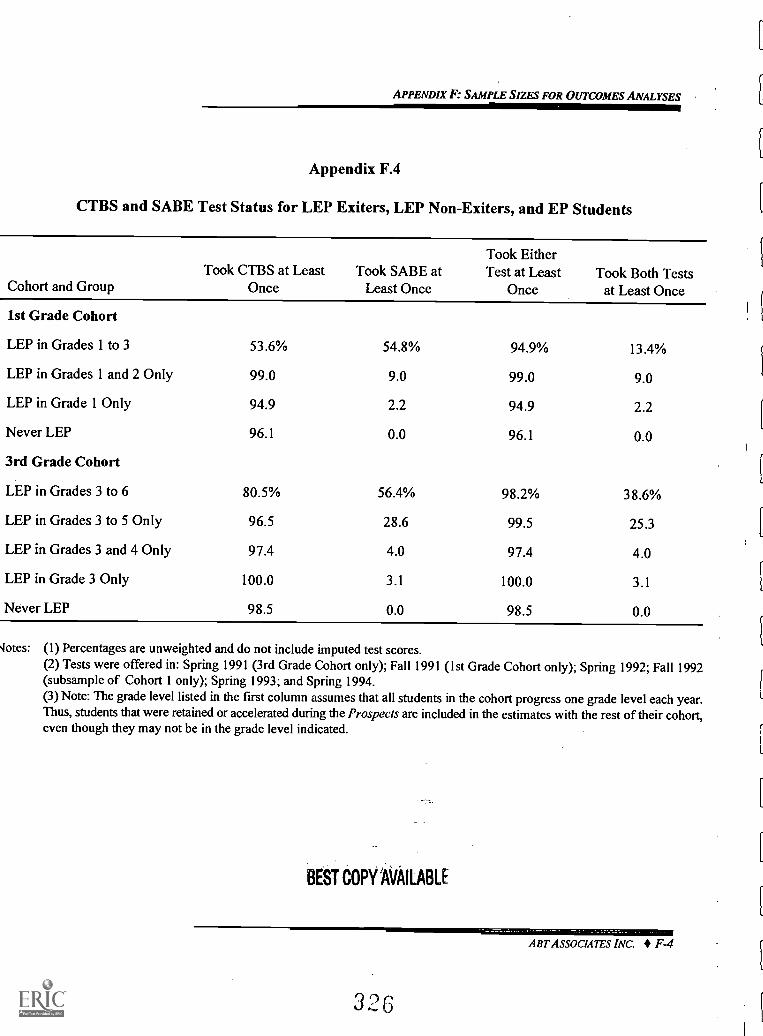
APPENDIX F: SAMPLE SIZES FOR OUTCOMES ANALYSES
Appendix F.4
CTBS and SABE Test Status for LEP Exiters, LEP Non-Exiters, and EP Students
Cohort and GroupTook CTBS at Least
OnceTook SABE at
Least Once
Took EitherTest at Least
OnceTook Both Tests
at Least Once
1st Grade Cohort
LEP in Grades 1 to 3 53.6% 54.8% 94.9% 13.4%
LEP in Grades 1 and 2 Only 99.0 9.0 99.0 9.0
LEP in Grade 1 Only 94.9 2.2 94.9 2.2
Never LEP 96.1 0.0 96.1 0.0
3rd Grade Cohort
LEP in Grades 3 to 6 80.5% 56.4% 98.2% 38.6%
LEP in Grades 3 to 5 Only 96.5 28.6 99.5 25.3
LEP in Grades 3 and 4 Only 97.4 4.0 97.4 4.0
LEP in Grade 3 Only 100.0 3.1 100.0 3.1
Never LEP 98.5 0.0 98.5 0.0
4otes: (1) Percentages are unweighted and do not include imputed test scores.(2) Tests were offered in: Spring 1991 (3rd Grade Cohort only); Fall 1991 (1st Grade Cohort only); Spring 1992; Fall 1992(subsample of Cohort 1 only); Spring 1993; and Spring 1994.(3) Note: The grade level listed in the first column assumes that all students in the cohort progress one grade level each year.Thus, students that were retained or accelerated during the Prospects are included in the estimates with the rest of their cohort,even though they may not be in the grade level indicated.
BEST COPY 'AVAILABLE
ABT ASSOCIA7ES INC. F-4
326
APPENDIX G
STRUCTURE OF HLM ANALYSIS FOR ACHIEVEMENT TEST SCORES
327
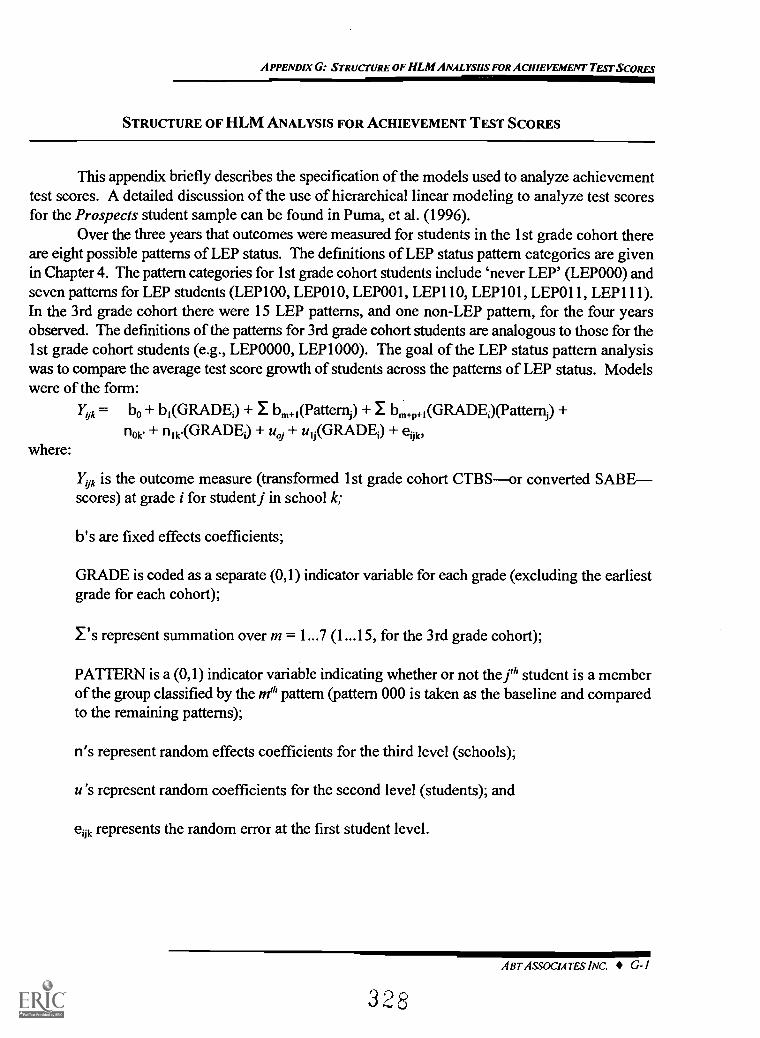
APPENDIX G: STRUCTURE OF HLM ANALYSHS FOR ACHIEVEMENT TEST SCORES
STRUCTURE OF HLM ANALYSIS FOR ACHIEVEMENT TEST SCORES
This appendix briefly describes the specification of the models used to analyze achievementtest scores. A detailed discussion of the use of hierarchical linear modeling to analyze test scoresfor the Prospects student sample can be found in Puma, et al. (1996).
Over the three years that outcomes were measured for students in the 1st grade cohort thereare eight possible patterns of LEP status. The definitions of LEP status pattern categories are givenin Chapter 4. The pattern categories for 1st grade cohort students include 'never LEP' (LEP000) andseven patterns for LEP students (LEP100, LEP010, LEP001, LEP110, LEP101, LEP011, LEP111).In the 3rd grade cohort there were 15 LEP patterns, and one non-LEP pattern, for the four yearsobserved. The defmitions of the patterns for 3rd grade cohort students are analogous to those for the1st grade cohort students (e.g., LEP0000, LEP1000). The goal of the LEP status pattern analysiswas to compare the average test score growth of students across the patterns of LEP status. Modelswere of the form:
Yijk = 130 +131(GRADE1) + I bm+1(Patterni) + I b.v."(GRADEXPatterni) +
nOk' n lie(GRADE;) + uoi + u1j(GRADE1) + e,where:
Yijk is the outcome measure (transformed 1st grade cohort CTBSor converted SABEscores) at grade i for student j in school k;
b's are fixed effects coefficients;
GRADE is coded as a separate (0,1) indicator variable for each grade (excluding the earliestgrade for each cohort);
l's represent summation over m = 1...7 (1...15, for the 3rd grade cohort);
PATTERN is a (0,1) indicator variable indicating whether or not the jth student is a memberof the group classified by the /nth pattern (pattern 000 is taken as the baseline and comparedto the remaining patterns);
n's represent random effects coefficients for the third level (schools);
u 's represent random coefficients for the second level (students); and
eijk represents the random error at the first student level.
328
ABT ASSOCIATES INC. G-1
APPENDIX H
PARAMETER ESTIMATES FOR HLM ANALYSIS OF MATH TEST SCORES
329
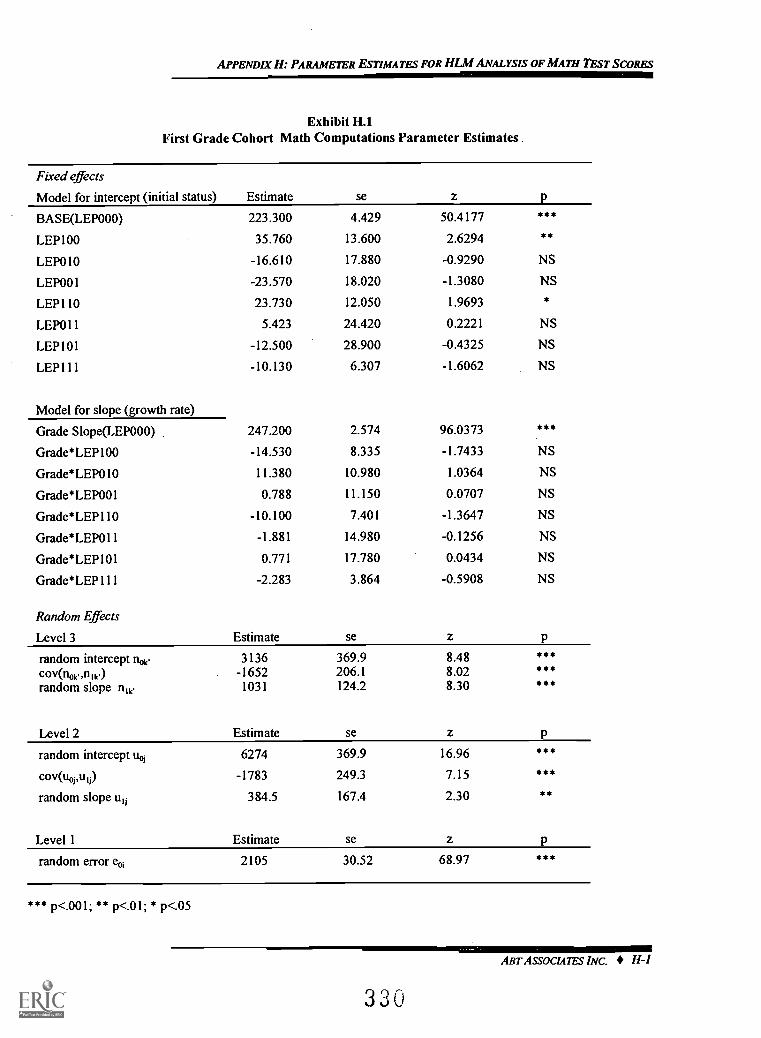
APPENDIX H: PARAMETER ESTIMATES FOR HLM ANALYSIS OF MATH TEST SCORES
Exhibit H.1First Grade Cohort Math Computations Parameter Estimates
Fired effects
Model for intercept (initial status) Estimate se z
BASE(LEP000) 223.300 4.429 50.4177 *4,4,
LEP100 35.760 13.600 2.6294 *4,
LEP010 -16.610 17.880 -0.9290 NS
LEP001 -23.570 18.020 -1.3080 NS
LEP110 23.730 12.050 1.9693
LEPO 1 1 5.423 24.420 0.2221 NS
LEP101 -12.500 28.900 -0.4325 NS
LEP111 -10.130 6.307 -1.6062 NS
Model for slope (growth rate)
Grade Slope(LEP000) 247.200 2.574 96.0373 ***
Grade*LEP100 -14.530 8.335 -1.7433 NS
Grade*LEP010 11.380 10.980 1.0364 NS
Grade*LEP001 0.788 11.150 0.0707 NS
Grade*LEP110 -10.100 7.401 -1.3647 NS
Grade*LEPO 11 -1.881 14.980 -0.1256 NS
Grade*LEP101 0.771 17.780 0.0434 NS
Grade*LEP 1 1 1 -2.283 3.864 -0.5908 NS
Random Effects
Level 3 Estimate se
random intercept nok. 3136 369.9 8.48 ***
cov(no,e,n,k.) -1652 206.1 8.02 ***
random slope nIk. 1031 124.2 8.30 ***
Level 2 Estimate se
random intercept uoj 6274 369.9 16.96 ***
cov(uopulj) -1783 249.3 7.15 ***
random slope u1j 384.5 167.4 2.30 **
Level 1 Estimate se
random error eoi 2105 30.52 68.97 ***
*** p<.001; ** p<.01; * p.05
330
ABT ASSOCIA7FS INC. H-I
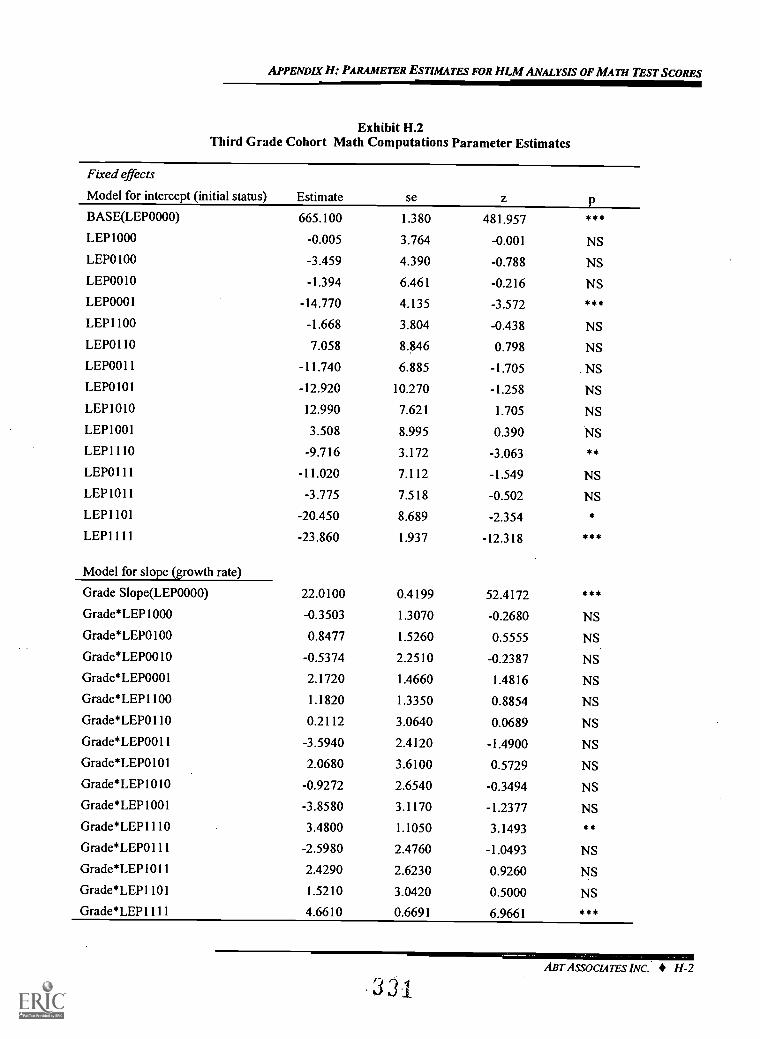
APPENDIX H: PARAMETER ESTIMATES FOR HLM ANALYSIS OF MATH TEST SCORES
Exhibit 11.2Third Grade Cohort Math Computations Parameter Estimates
Fixed effects
Model for intercept (initial status) Estimate se z PBASE(LEP0000) 665.100 1.380 481.957 ***
LEP1000 -0.005 3.764 -0.001 NSLEP0100 -3.459 4.390 -0.788 NS
LEP0010 -1.394 6.461 -0.216 NSLEP0001 -14.770 4.135 -3.572 ***
LEP1100 -1.668 3.804 -0.438 NS
LEP0110 7.058 8.846 0.798 NSLEP0011 -11.740 6.885 -1.705 NSLEP0101 -12.920 10.270 -1.258 NS
LEP1010 12.990 7.621 1.705 NS
LEP1001 3.508 8.995 0.390 NS
LEP1110 -9.716 3.172 -3.063 **
LEP0111 -11.020 7.112 -1.549 NSLEP1011 -3.775 7.518 -0.502 NSLEP1101 -20.450 8.689 -2.354 *
LEP1111 -23.860 1.937 -12.318 ***
Model for slope (growth rate)
Grade Slope(LEP0000) 22.0100 0.4199 52.4172 ***
Grade*LEP1000 -0.3503 1.3070 -0.2680 NS
Grade*LEP0100 0.8477 1.5260 0.5555 NS
Grade*LEP0010 -0.5374 2.2510 -0.2387 NS
Grade*LEP0001 2.1720 1.4660 1.4816 NS
Grade*LEP1100 1.1820 1.3350 0.8854 NS
Grade*LEP0110 0.2112 3.0640 0.0689 NS
Grade*LEP0011 -3.5940 2.4120 -1.4900 NS
Grade*LEP0101 2.0680 3.6100 0.5729 NSGrade*LEP1010 -0.9272 2.6540 -0.3494 NS
Grade*LEP1001 -3.8580 3.1170 -1.2377 NS
Grade*LEP1110 3.4800 1.1050 3.1493 **
Grade*LEP0111 -2.5980 2.4760 -1.0493 NS
Grade*LEP10 l I 2.4290 2.6230 0.9260 NSGrade*LEP1101 1.5210 3.0420 0.5000 NS
Grade*LEP1111 4.6610 0.6691 6.9661 ***
ABT ASSOCUTES INC.
331H-2
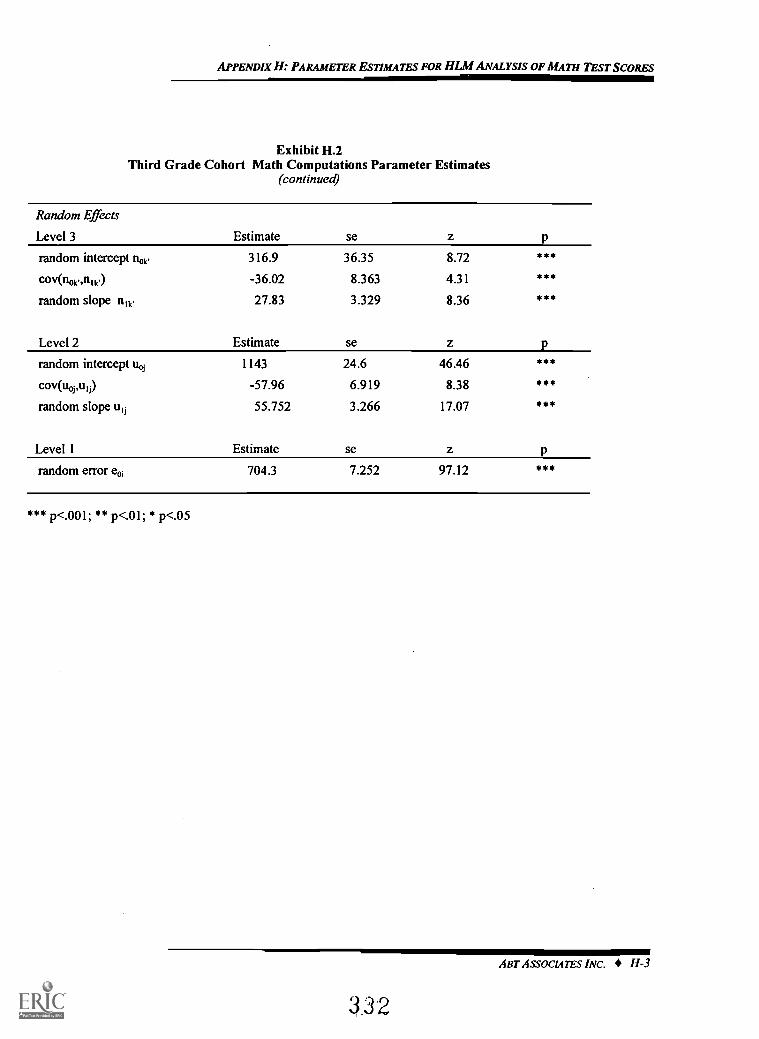
APPENDIX H: PARAMETER ESTIMATES FOR HLM ANALYSIS OF MATII TEST SCORES
Exhibit 11.2Third Grade Cohort Math Computations Parameter Estimates
(continued)
Random Effects
Level 3
random intercept nok,
cov(nok,,nlie)
random slope nik'
Level 2
random intercept uoi
cov(uoi,u,i)
random slope IN
Level 1
random error ee,
Estimate se
316.9 36.35 8.72 ***
-36.02 8.363 4.31 ***
27.83 3.329 8.36 ***
Estimate se
1143 24.6 46.46 ***
-57.96 6.919 8.38 ***
55.752 3.266 17.07 ***
Estimate se
704.3 7.252 97.12 ***
*** p<.001 ** p<.01; * p.05
ABT ASSOCIATES INC. H-3
332
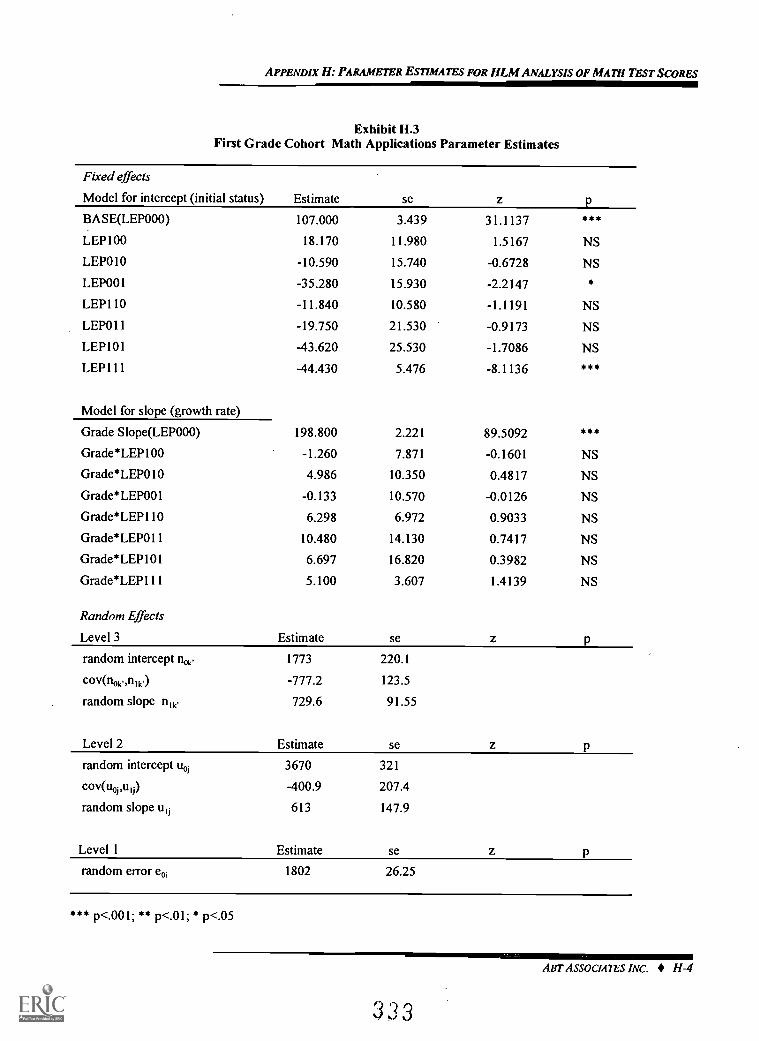
APPENDIX H: PARAMETER ESTIMATES FOR HLM ANALYSIS OF MATH TEST SCORES
Exhibit H.3First Grade Cohort Math Applications Parameter Estimates
Fixed effects
Model for intercept (initial status) Estimate se
BASE(LEP000) 107.000 3.439 31.1137 ***
LEP100 18.170 11.980 1.5167 NS
LEP010 -10.590 15.740 -0.6728 NS
LEP001 -35.280 15.930 -2.2147
LEP110 -11.840 10.580 -1.1191 NS
LEP011 -19.750 21.530 -0.9173 NS
LEP101 -43.620 25.530 -1.7086 NS
LEP111 -44.430 5.476 -8.1136 ***
Model for slope (growth rate)
Grade Slope(LEP000) 198.800 2.221 89.5092 ***
Grade*LEP100 -1.260 7.871 -0.1601 NS
Grade*LEP010 4.986 10.350 0.4817 NS
Grade*LEP001 -0.133 10.570 -0.0126 NS
Grade*LEP110 6.298 6.972 0.9033 NS
Grade*LEP011 10.480 14.130 0.7417 NS
Grade*LEP101 6.697 16.820 0.3982 NS
Grade*LEP111 5.100 3.607 1.4139 NS
Random Effects
Level 3 Estimate se
random intercept note 1773 220.1
cov(noe,nik.) -777.2 123.5
random slope nIk. 729.6 91.55
Level 2 Estimate se
random intercept uo, 3670 321
cov(u,1,u1i) -400.9 207.4
random slope u1j 613 147.9
Level 1 Estimate se
random error eth 1802 26.25
*** p<.001 ** p<.0l; *
333
ABT ASSOCIATES INC. H-4
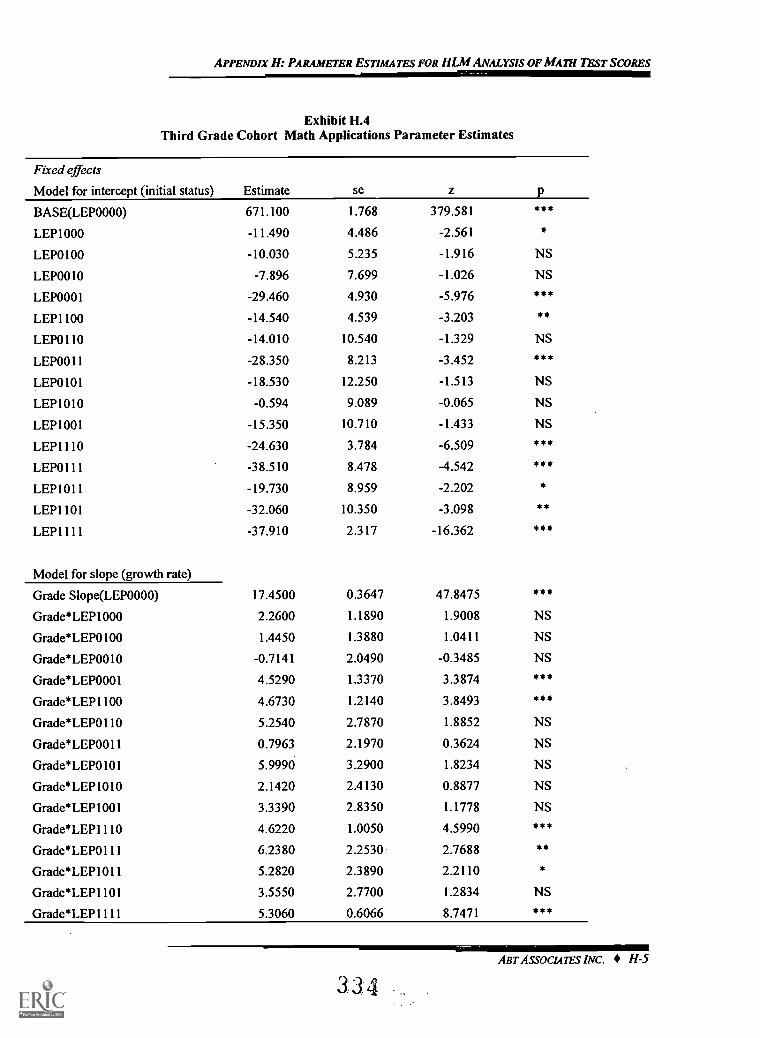
APPENDIX H: PARAMETER ESTIMATES FOR FILM ANALYSIS OF MATH TEST SCORES
Exhibit H.4Third Grade Cohort Math Applications Parameter Estimates
Fixed effects
Model for intercept (initial status) Estimate se z P
BASE(LEP0000) 671.100 1.768 379.581 ***
LEP1000 -11.490 4.486 -2.561 *
LEP0100 -10.030 5.235 -1.916 NS
LEP0010 -7.896 7.699 -1.026 NS
LEP0001 -29.460 4.930 -5.976 ***
LEP1100 -14.540 4.539 -3.203 **
LEP0110 -14.010 10.540 -1.329 NS
LEP0011 -28.350 8.213 -3.452 ***
LEP0101 -18.530 12.250 -1.513 NS
LEP1010 -0.594 9.089 -0.065 NS
LEP1001 -15.350 10.710 -1.433 NS
LEP1110 -24.630 3.784 -6.509 ***
LEP0111 -38.510 8.478 -4.542 ***
LEP1011 -19.730 8.959 -2.202 *
LEP1101 -32.060 10.350 -3.098 **
LEP1111 -37.910 2.317 -16.362 ***
Model for slope (growth rate)
Grade Slope(LEP0000) 17.4500 0.3647 47.8475 ***
Grade*LEP1000 2.2600 1.1890 1.9008 NS
Grade*LEP0100 1.4450 1.3880 1.0411 NS
Grade*LEP0010 -0.7141 2.0490 -0.3485 NS
Grade*LEP0001 4.5290 1.3370 3.3874 ***
Grade*LEP1100 4.6730 1.2140 3.8493 ***
Grade*LEP0110 5.2540 2.7870 1.8852 NS
Grade*LEP0011 0.7963 2.1970 0.3624 NS
Grade*LEP0101 5.9990 3.2900 1.8234 NS
Grade*LEP1010 2.1420 2.4130 0.8877 NS
Grade*LEP1001 3.3390 2.8350 1.1778 NS
Grade*LEP1110 4.6220 1.0050 4.5990 ***
Grade*LEP0111 6.2380 2.2530 2.7688 **
Grade*LEP1011 5.2820 2.3890 2.2110 *
Grade*LEP1101 3.5550 2.7700 1.2834 NS
Grade*LEP1111 5.3060 0.6066 8.7471 ***
ABT ASSOCIATES INC. H-5
3 3 4
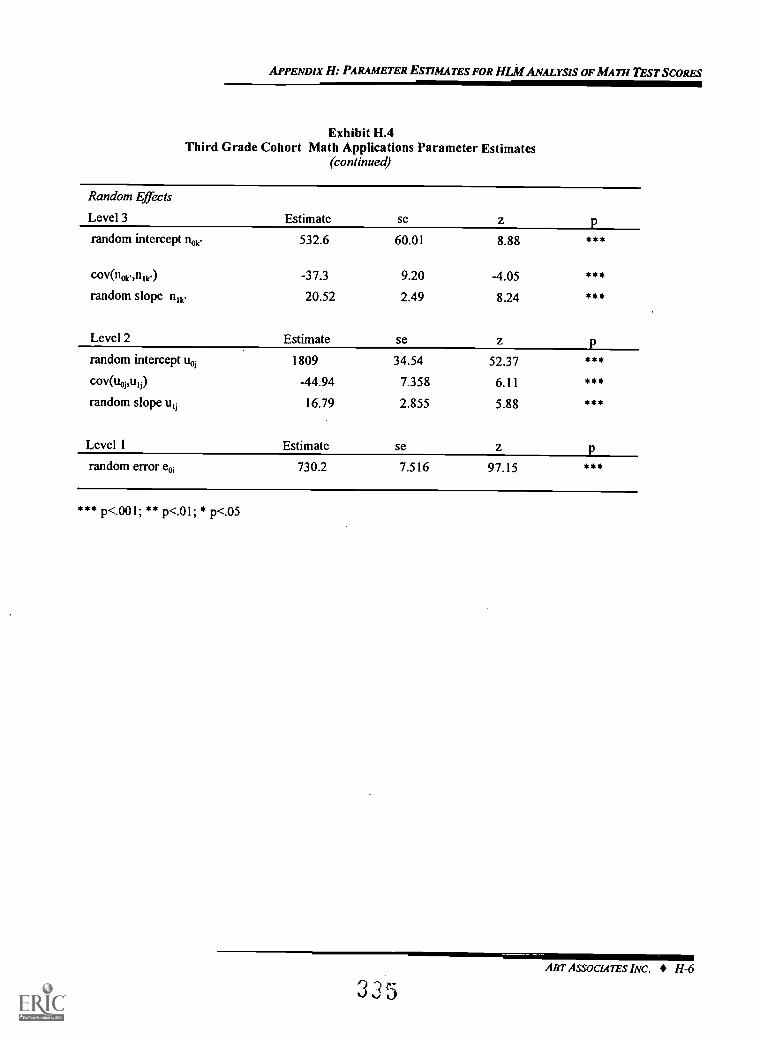
APPENDIX H: PARAMETER ESTIMATES FOR HLM ANALYSIS OF MATH TEST SCORES
Exhibit H.4Third Grade Cohort Math Applications Parameter Estimates
(continued)
Random Effects
Level 3
random intercept nok,
cov(nok.,n,k)
random slope nlie
Level 2
random intercept IN
cov(uoi,u1i)
random slope uu
Level 1
random error eth
Estimate se
532.6 60.01 8.88 ***
-37.3 9.20 -4.05 ***
20.52 2.49 8.24 ***
Estimate se
1809 34.54 52.37 ***
-44.94 7.358 6.11 ***
16.79 2.855 5.88 ***
Estimate se
730.2 7.516 97.15 ***
*** p<.001 ** p<.01 * p<.05
335ART ASSOCIATES INC. 11-6
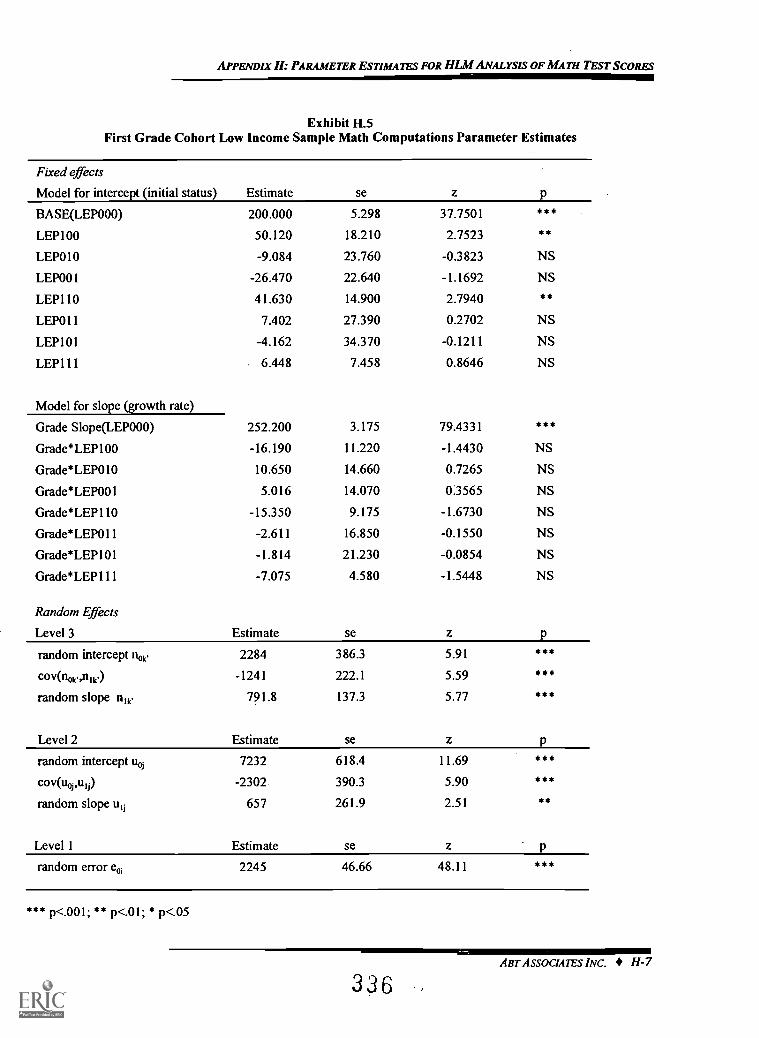
APPENDIX H: PARAMETER ESTIMATES FOR HLM ANALYSIS OF MATH TEST SCORES
Exhibit 11.5First Grade Cohort Low Income Sample Math Computations Parameter Estimates
Fixed effects
Model for intercept (initial status) Estimate se z
BASE(LEP000) 200.000 5.298 37.7501 ***
LEP100 50.120 18.210 2.7523 **
LEP010 -9.084 23.760 -0.3823 NS
LEP001 -26.470 22.640 -1.1692 NS
LEP110 41.630 14.900 2.7940 **
LEPO1 1 7.402 27.390 0.2702 NS
LEP101 -4.162 34.370 -0.1211 NS
LEP111 6.448 7.458 0.8646 NS
Model for slope (growth rate)
Grade Slope(LEP000) 252.200 3.175 79.4331 ***
Grade*LEP100 -16.190 11.220 -1.4430 NS
Grade*LEP010 10.650 14.660 0.7265 NS
Grade*LEP001 5.016 14.070 0.3565 NS
Grade*LEP110 -15.350 9.175 -1.6730 NS
Grade*LEP01 1 -2.611 16.850 -0.1550 NS
Grade*LEP101 -1.814 21.230 -0.0854 NS
Grade*LEP111 -7.075 4.580 -1.5448 NS
Random Effects
Level 3 Estimate se
random intercept now 2284 386.3 5.91 ***
cov(nok.,nlie) -1241 222.1 5.59 ***
random slope n, le 791.8 137.3 5.77 ***
Level 2 Estimate se
random intercept uoj 7232 618.4 11.69 ***
cov(uopuli) -2302 390.3 5.90 ***
random slope ii,j 657 261.9 2.51 **
Level 1 Estimate se
random error eoi 2245 46.66 48.11 ***
*** p<.001; ** p<.01; * p<.05
336ABT ASSOCIATE INC. H-7
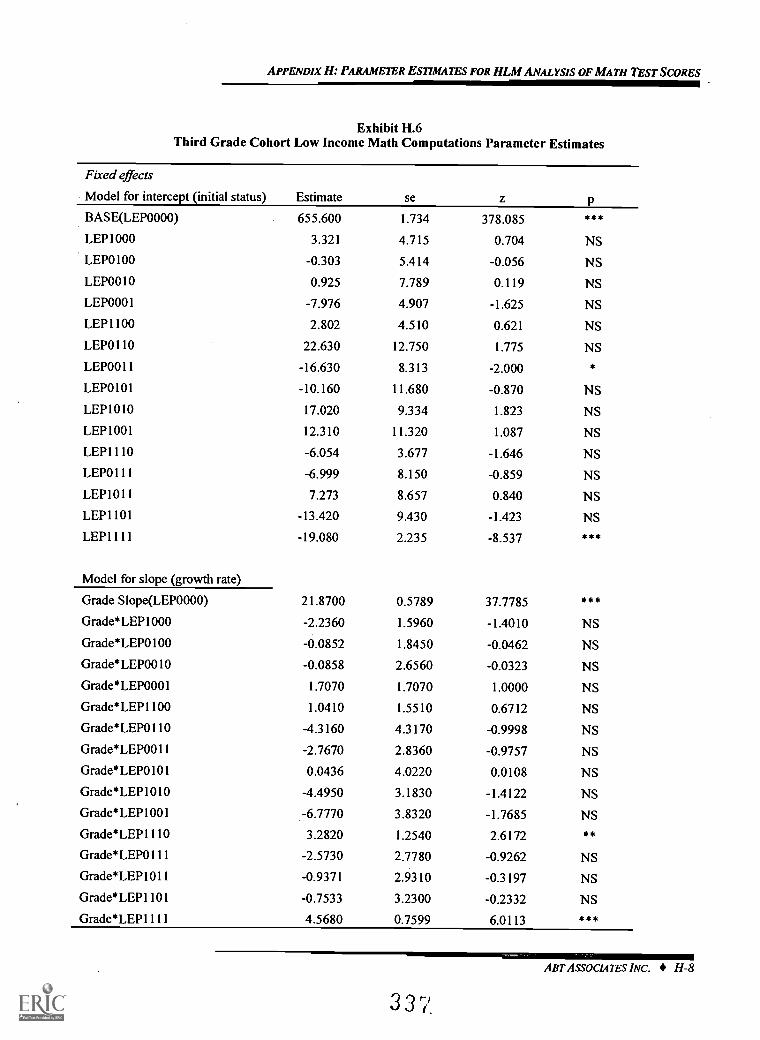
APPENDIX H: PARAMETER ESTIMATES FOR HLM ANALYSIS OF MATH TEST SCORES
Exhibit H.6Third Grade Cohort Low Income Math Computations Parameter Estimates
Fixed effects
Model for intercept (initial status) Estimate se z p
BASE(LEP0000) 655.600 1.734 378.085 ***
LEP1000 3.321 4.715 0.704 NSLEP0100 -0.303 5.414 -0.056 NSLEP0010 0.925 7.789 0.119 NS
LEP0001 -7.976 4.907 -1.625 NS
LEP1100 2.802 4.510 0.621 NS
LEP0110 22.630 12.750 1.775 NS
LEP0011 -16.630 8.313 -2.000 *
LEP0101 -10.160 11.680 -0.870 NS
LEP1010 17.020 9.334 1.823 NS
LEP1001 12.310 11.320 1.087 NS
LEP1110 -6.054 3.677 -1.646 NS
LEP0111 -6.999 8.150 -0.859 NS
LEP1011 7.273 8.657 0.840 NS
LEP1101 -13.420 9.430 -1.423 NSLEP1111 -19.080 2.235 -8.537 ***
Model for slope (growth rate)
Grade Slope(LEP0000) 21.8700 0.5789 37.7785 ***
Grade*LEP1000 -2.2360 1.5960 -1.4010 NS
Grade*LEP0100 -0.0852 1.8450 -0.0462 NS
Grade* LEP0010 -0.0858 2.6560 -0.0323 NS
Grade*LEP0001 1.7070 1.7070 1.0000 NS
Grade*LEP1100 1.0410 1.5510 0.6712 NS
Grade*LEP0110 -4.3160 4.3170 -0.9998 NS
Grade*LEP0011 -2.7670 2.8360 -0.9757 NS
Grade* LEP0101 0.0436 4.0220 0.0108 NS
Grade*LEP1010 -4.4950 3.1830 -1.4122 NS
Grade*LEP1001 -6.7770 3.8320 -1.7685 NS
Grade*LEP1110 3.2820 1.2540 2.6172 **
Grade*LEPO I 11 -2.5730 2.7780 -0.9262 NS
Grade*LEP1011 -0.9371 2.9310 -0.3197 NS
Grade*LEP1101 -0.7533 3.2300 -0.2332 NS
Grade*LEP1111 4.5680 0.7599 6.0113 ***
ABT ASSOCIATES INC. H-8
337
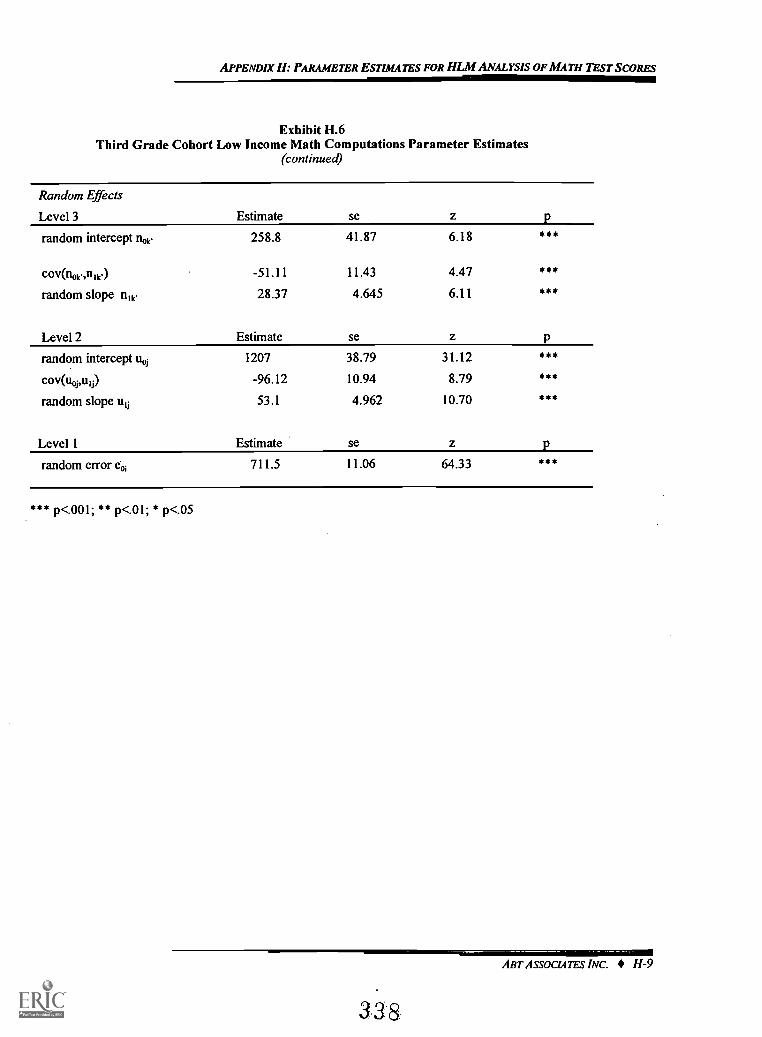
APPENDIX H: PARAMETER ESTIMATES FOR HLM ANALYSIS OF MATH TEST SCORES
Exhibit H.6Third Grade Cohort Low Income Math Computations Parameter Estimates
(continued)
Random Effects
Level 3
random intercept Axe
cov(nok.,n,k)
random slope nue
Level 2
random intercept IN
cov(14,u,)
random slope uki
Level 1
random error eoi
Estimate se
258.8 41.87 6.18 ***
-51.11 11.43 4.47 ***
28.37 4.645 6.11 ***
Estimate se
1207 38.79 31.12 ***
-96.12 10.94 8.79 ***
53.1 4.962 10.70 ***
Estimate se
711.5 11.06 64.33 ***
*** p<.001; ** p<.01; * p<.05
ABT ASSOCIATES INC. H-9
328
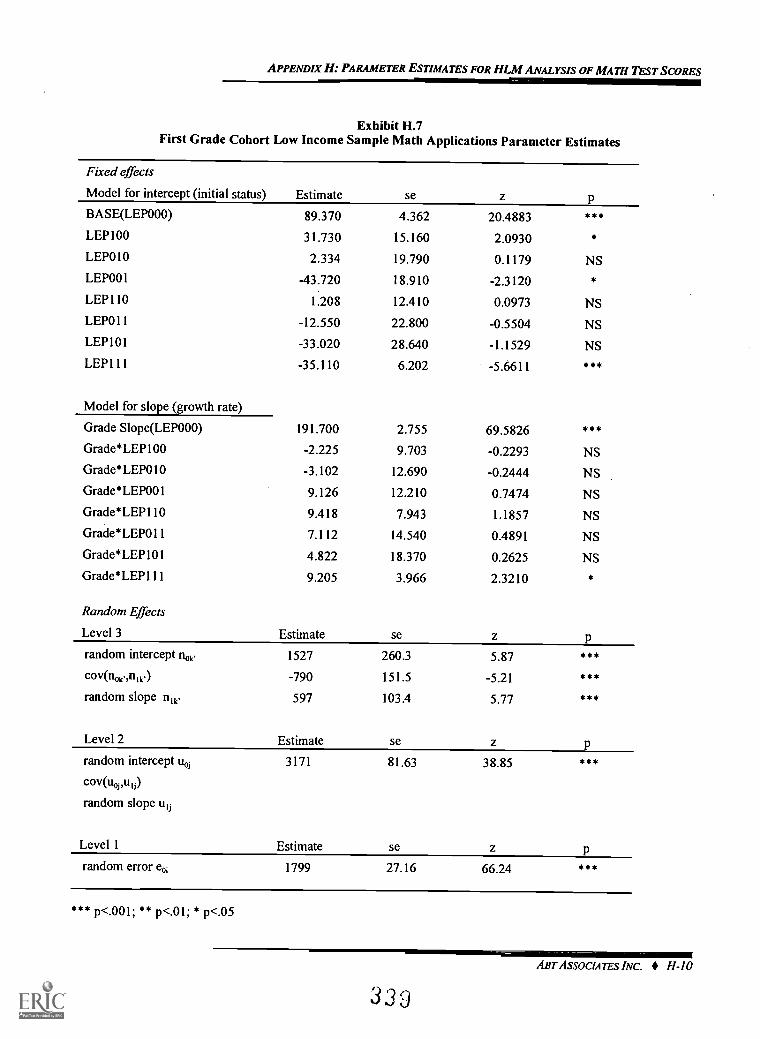
APPENDIX H: PARAMETER ESTIMATES FOR HLM ANALYSIS OF MATH TEST SCORES
Exhibit H.7First Grade Cohort Low Income Sample Math Applications Parameter Estimates
Fixed effects
Model for intercept (initial status)
BASE(LEP000)
LEP100
LEP010
LEP001
LEP110
LEP011
LEP101
LEP111
Model for slope (growth rate)
Grade Slope(LEP000)
Grade*LEP100
Grade*LEP010
Grade*LEP001
Grade*LEP110
Grade*LEPO1 1
Grade*LEP101
Grade*LEP111
Random Effects
Level 3
random intercept nok.
Cov(Ilok.,nik.)
random slope n,k,
Level 2
random intercept uo,
cov(uoi,u,j)
random slope uo
Level 1
random error eoi
Estimate se
89.370 4.362 20.4883 ***
31.730 15.160 2.0930
2.334 19.790 0.1179 NS
-43.720 18.910 -2.3120
1.208 12.410 0.0973 NS
-12.550 22.800 -0.5504 NS
-33.020 28.640 -1.1529 NS
-35.110 6.202 -5.6611 ***
191.700 2.755 69.5826 ***
-2.225 9.703 -0.2293 NS
-3.102 12.690 -0.2444 NS
9.126 12.210 0.7474 NS
9.418 7.943 1.1857 NS
7.112 14.540 0.4891 NS
4.822 18.370 0.2625 NS
9.205 3.966 2.3210 *
Estimate se
1527 260.3 5.87 ***
-790 151.5 -5.21 ***
597 103.4 5.77 ***
Estimate se
3171 81.63 38.85 ***
Estimate se
1799 27.16 66.24 ***
*** p<.001; ** p<.01; * p.05
ABT ASSOCIATES INC. H-10
3 3
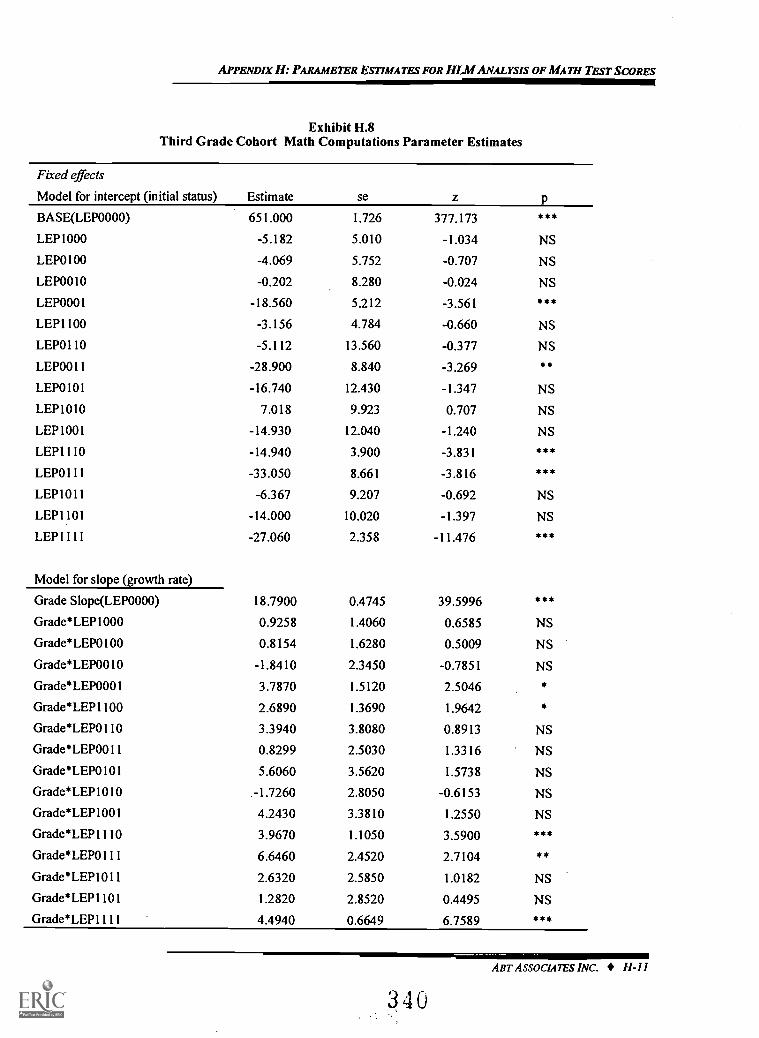
APPENDIX H: PARAMETER ESTIMATES FOR HLM ANALYSIS OF MATH TEST SCORES
Exhibit H.8Third Grade Cohort Math Computations Parameter Estimates
Fixed effects
Model for intercept (initial status) Estimate se z P
BASE(LEP0000) 651.000 1.726 377.173 ***
LEP1000 -5.182 5.010 -1.034 NS
LEP0100 -4.069 5.752 -0.707 NS
LEP0010 -0.202 8.280 -0.024 NS
LEP0001 -18.560 5.212 -3.561 ***
LEP1100 -3.156 4.784 -0.660 NS
LEP0110 -5.112 13.560 -0.377 NS
LEP0011 -28.900 8.840 -3.269 **
LEP0101 -16.740 12.430 -1.347 NS
LEP1010 7.018 9.923 0.707 NS
LEP1001 -14.930 12.040 -1.240 NS
LEP1110 -14.940 3.900 -3.831 *5*
LEP0111 -33.050 8.661 -3.816 ***
LEP1011 -6.367 9.207 -0.692 NS
LEP1101 -14.000 10.020 -1.397 NS
LEP1111 -27.060 2.358 -11.476 ***
Model for slope (growth rate)
Grade Slope(LEP0000) 18.7900 0.4745 39.5996 5**
Grade*LEP1000 0.9258 1.4060 0.6585 NS
Grade*LEP0100 0.8154 1.6280 0.5009 NS
Grade*LEP0010 -1.8410 2.3450 -0.7851 NS
Grade*LEP0001 3.7870 1.5120 2.5046
Grade*LEP1100 2.6890 1.3690 1.9642
Grade*LEP0110 3.3940 3.8080 0.8913 NS
Grade*LEP0011 0.8299 2.5030 1.3316 NS
Grade*LEP0101 5.6060 3.5620 1.5738 NS
Grade*LEP1010 -1.7260 2.8050 -0.6153 NS
Grade*LEP1001 4.2430 3.3810 1.2550 NS
Grade*LEP1110 3.9670 1.1050 3.5900 ***
Grade*LEP0111 6.6460 2.4520 2.7104 *
Grade*LEP1011 2.6320 2.5850 1.0182 NS
Grade*LEP1101 1.2820 2.8520 0.4495 NS
Grades LEP1111 4.4940 0.6649 6.7589 * 5*
ABT ASSOCIATES INC. H-11
340
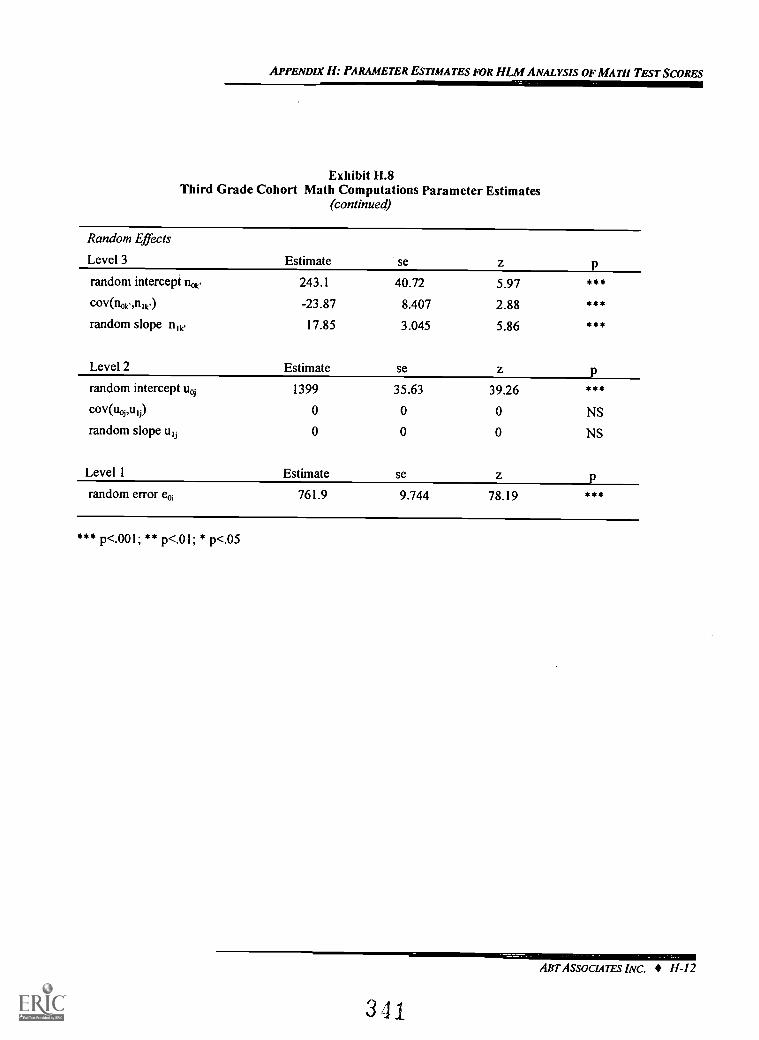
APPENDIX II: PARAMETER ESTIMATES FOR HIM ANALYSIS OF MATH TEST SCORES
Exhibit H.8Third Grade Cohort Math Computations Parameter Estimates
(continued)
Random Effects
Level 3
random intercepi
cov(nok,,tilk.)
random slope nlk .
Level 2
random intercept uo,
cov(uoru,,)
random slope
Level 1
random error eo
Estimate se
243.1 40.72 5.97 ***
-23.87 8.407 2.88 ***
17.85 3.045 5.86 ***
Estimate se
1399 35.63 39.26 ***
NS
NS
Estimate se
761.9 9.744 78.19 ***
*** p<.001; ** p<.01; *
ABT ASSOCIATES INC. H-12
341
APPENDIX I
TEACHER JUDGEMENTS AS MEASURES OF STUDENTS' ENGLISH PROFICIENCY
342
APPENDIX!: TEACHERJUDGEMENTS AS MEASURES OF STUDENTS' ENGLISH PROFICIENCY
TEACHER JUDGEMENTS AS MEASURES OF STUDENTS' ENGLISH PROFICIENCY
This appendix examines in detail the reliability and validity of teachers' judgements ofstudents' English proficiency. These proficiency measures are used in Chapter 2 to characterize theEnglish language skills of LEP students, in Chapter 3 to show which students receive language-related services, and in Chapter 4 to show which students exit LEP status during the study period.The proficiency measures are an integral part of this study, and for this and two other reasonsdeserve close scrutiny. First, teacher judgements are subjective, and therefore potentially moredifficult to interpret than a more objective measure, such as a score from a standardized test ofEnglish proficiency. Research on survey instrument design shows that responses to judgmentalquestions are sensitive to question wording and to the broader questionnaire.' Second, missingproficiency measures were subject to a two-step imputation process, and it is important to understandhow the imputations affected the distributions of the proficiency variables.
This appendix addresses the following specific questions:
How were the English proficiency variables constructed, what imputations were done, andhow did the imputations affect the values of the variables?
How reliable are teacher judgements, in the following sense: how well do assessments ina given year predict assessments in subsequent years?
How valid are teacher judgements, in the following sense: to what extent are the proficiencyvariables related to other variables that we expect to be correlated with students' Englishproficiency? Examples of such variables are: standardized reading test scores; receipt oflanguage-related services; parents' self-reported English proficiency; parents' reports of howoften English is used in the home; and exits from LEP status.
Each of these questions is addressed below. Based on these analyses, we believe the proficiencyvariables are sufficiently reliable and valid for the purposes of this study.
In addition, it is possible that measurement error in teacher judgements of language proficiency may be relatedto the level of proficiency. For example, it may be more difficult to assess language proficiency when students are inthe middle of the proficiency spectrum.
ABT ASSOCIATES INC. I-I
343
APPENDIX I: TEACHERJUDGEMENTS AS MEASURES OF STUDENTS' ENGLISH PROFICIENCY
How Were the English Proficiency Measures Constructed?
Data on each LEP student's English proficiency were collected through the "student profile"instrument, which was to be answered by the teacher who knew the student best. The instrumentused a two-step process. First, respondents were asked whether the studentwas language-minority(LM) or limited English proficient, according to definitions provided in the instrument. If theteacher answered that the student was LM or LEP, then he or she was asked:
How would you characterize this student's proficiency in English? Circle oneresponse for each language skill for each language minority or limited-English-proficient student.
a. SpeakingExcellentGoodFairPoorNo proficiency
b. Understanding(Same response categories)
c. Reading(Same response categories)
d. Writing(Same response categories)
This question was asked in each year of the study, so a student who was considered LM or LEP inevery year could have three or four years of English proficiency rating data (generally from differentteachers), depending on whether the student was in the 1st or 3rd grade cohort? The question wouldbe legitimately skipped in any year in which a teacher considered a student not to be LM or LEP.
Missing values for the English proficiency variables were then imputed. The relevant samplefor the imputations (and for all analyses of English proficiency in this report) is the subset ofstudents who we identify as LEP in at least one year of the study. (The remaining sample memberswere considered English proficient in every year of the study, and no analyses of English proficiencywere performed for these students.) First, we did a logical imputation: if an English proficiencyvariable was missing in any year because it was legitimately skipped (i.e., because the teacher did
2 The instrument did not provide detailed instructions on how to rate proficiency in each domain (speaking,understanding, reading, and writing).
ABT ASSOCIATES INC.
344
1-2
APPENDIX!: TEACHERJUDGEMENTS AS MEASURES OF STUDENTS' ENGLISH PROFICIENCY
not consider the student to be LM or LEP in that year), the value of the variable was recoded to"excellent" English proficiency. Second, for values of the English proficiency variables that weremissing for other reasons, multivariate maximum-likelihood imputations were performed, asdescribed in Appendix D.
Across all years, 14 percent of the English proficiency values in the 1st grade cohort, and 21percent of the English proficiency values in the 3rd grade cohort, were legitimate skips and thereforelogically imputed. Apart from the legitimate skips, the average missing rate for the Englishproficiency variables was 19 percent for the 1st grade cohort, and 23 percent for the 3rd grade cohort.This is the percentage of observations imputed using the maximum-likelihood method described inAppendix D.
The effect of the first imputation step, to recode legitimate skips as "excellent" Englishproficiency, is to greatly increase the percentage of LEP students with excellent English proficiency.Exhibit 1.1 shows how the percentage of students judged to have excellent proficiency in the firstyear observed increases with the two imputation steps. It is possible that the logical imputation stepoverstates the percentage of LEP students judged to have excellent English proficiency. Forexample, if a respondent did not read the definition of "limited English proficiency" carefully andincorrectly said a student was not LEP, that would create an inappropriate legitimate skip and apotentially inaccurate logical imputation of excellent English proficiency. There is no clear way todetermine how often respondents incorrectly coded LEP students as not LEP. On the other hand,the percentage of LEP students with excellent English proficiency in the first column of Exhibit 1.1is clearly too low, because some large portion of legitimate skips are very likely to be correct.
One way to explore this issue further is to compare the characteristics of LEP students whowere logically imputed to have excellent English proficiency to the characteristics of LEP studentswhose English proficiency was not imputed. We examined a number of LEP students'characteristics that are correlated in the Prospects data with English proficiency: CTBS test scores;whether English is the parents' native language; how frequently English is spoken in the home(according to parents); and whether students are low-income. Briefly, the LEP students who werelogically imputed to have excellent English proficiency looked more like the non-imputed LEPstudents with excellent English proficiency than like the non-imputed LEP students with lower levelsof English proficiency.' For this reason, we believe the logical imputations of English proficiencywere appropriate both in principle and in practice.
3 For example, compared to LEP students with non-imputed excellent proficiency, LEP students whose Englishproficiency was imputed to be excellent were more likely: to have a parent whose native language was English; to speakEnglish at home; and not to be low-income. The data on CTBS test scores is more difficult to summarize but, in broadterms, students whose proficiency was imputed to be excellent had test scores that on average fell between students withnon-imputed excellent proficiency and students with non-imputed good proficiency.
ABT ASSOCIATES INC.
315
1-3
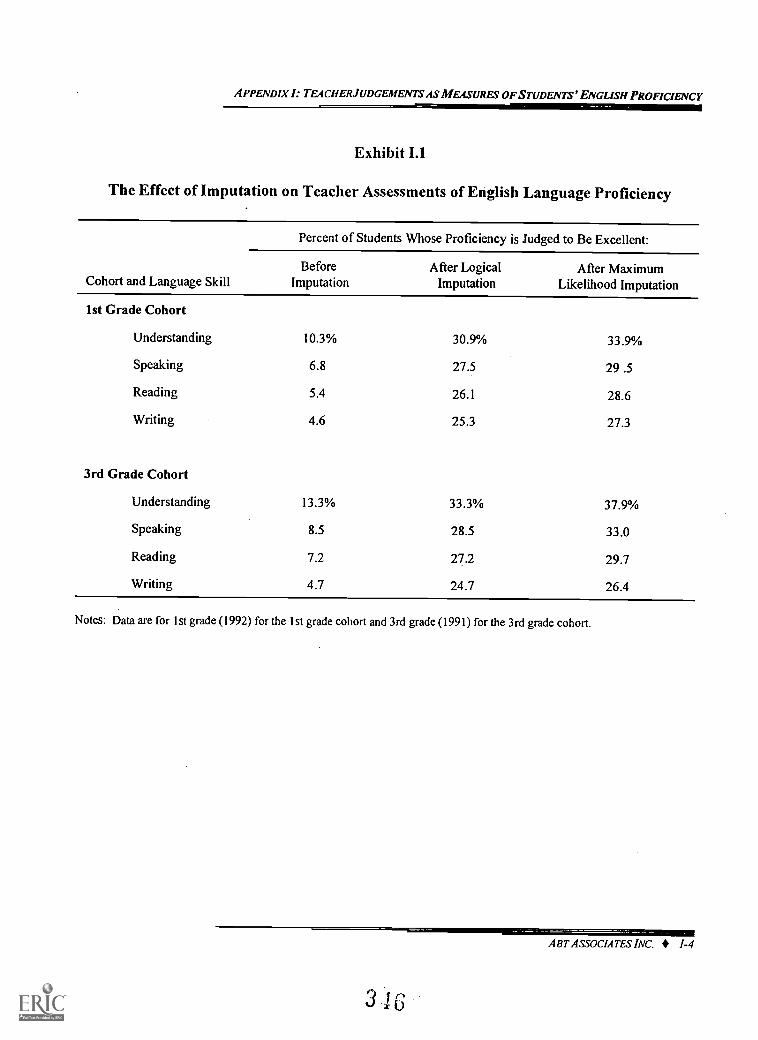
APPENDIX!: TEACHERJUDGEMENTS AS MEASURES OF STUDENTS' ENGLISH PROFICIENCY
Exhibit Ll
The Effect of Imputation on Teacher Assessments of English Language Proficiency
Percent of Students Whose Proficiency is Judged to Be Excellent:
Cohort and Language SkillBefore
ImputationAfter Logical
ImputationAfter Maximum
Likelihood Imputation
1st Grade Cohort
Understanding 10.3% 30.9% 33.9%
Speaking 6.8 27.5 29 .5
Reading 5.4 26.1 28.6
Writing 4.6 25.3 27.3
3rd Grade Cohort
Understanding 13.3% 33.3% 37.9%
Speaking 8.5 28.5 33.0
Reading 7.2 27.2 29.7
Writing 4.7 24.7 26.4
Notes: Data are for 1st grade (1992) for the 1st grade cohort and 3rd grade (1991) for the 3rd grade cohort.
ABT ASSOCIATES INC. 1-4
APPENDIX!: TEACHERJUDGEMENTS AS MEASURES OF STUDENTS' ENGLISH PROFICIENCY
How Reliable Are Teacher Judgements of Students' English Proficiency?
One measure of the reliability of teacher judgements of English proficiency is the extent towhich an assessment in a year can be predicted from an assessment in a prior year. (Anothermeasure is cross-rater reliability, but we cannot examine this because in any given year only oneteacher assesses each student's English proficiency.) This measure is important because generallywe expect English proficiency to be strongly correlated across years within students, and to growover time. If the data did not show these patterns, the reliability of teacher judgements would becalled into question. Because students usually change primary teachers each year, the moresubjective and idiosyncratic are teacher judgements, the lower should be the correlation across yearswithin students and the weaker the growth in proficiency over time.
Although we expect to see strong correlations in the proficiency measures over time, we donot expect that a prior year's proficiency would perfectly predict subsequent proficiency, even ifthere were no measurement error. This is because students' proficiencies grow at different rates.Student A may jump two levels in a year, while student B may jump only one level, and student Cmay stay at the same proficiency level. Therefore the predictive power in the data will be a functionof both true variation in growth rates and measurement error; the greater either of these factors, thelower the predictive power of a prior year's proficiency level.
Exhibit 1.2 shows the results of univariate regressions of English proficiency on prior years'proficiency, for the domains of speaking and reading English. Two numbers are reported for eachregression: beta, which is the regression coefficient showing the change in the expected value ofproficiency in a given year for a one-unit change in proficiency in a prior year (i.e., a measure of theaverage growth in proficiency across years); and R2, which measures the proportion of the variancein proficiency explained by prior years' proficiency.' As an example of how to read the table, thetop row of the table and the third and fourth columns show the results of regressing English speakingproficiency as measured in 1993 on English speaking proficiency as measured in 1992, for the 1stgrade cohort. The beta of 0.50 indicates a fairly strong predictive power of the prior year'sproficiency, and the R2 of 0.33 means that the prior year's proficiency explains one-third of thevariation across LEP students in the subsequent year's proficiency.
In general, the exhibit suggests a fair degree of reliability for teacher judgements of Englishproficiency. The slopes in adjacent years are around 0.5, indicating a positive growth rate and areasonably strong relationship across years. As expected, the slopes are always greater in adjacentyears than for periods two or three years apart, which suggests a stable relationship over time. The
4 In a univariate regression, Et2 is also the square of the simple correlation between the dependent and independentvariables. For example, an R2 of 0.33 implies a simple correlation of 0.57.
ABT ASSOCIATES INC. 1-5
347
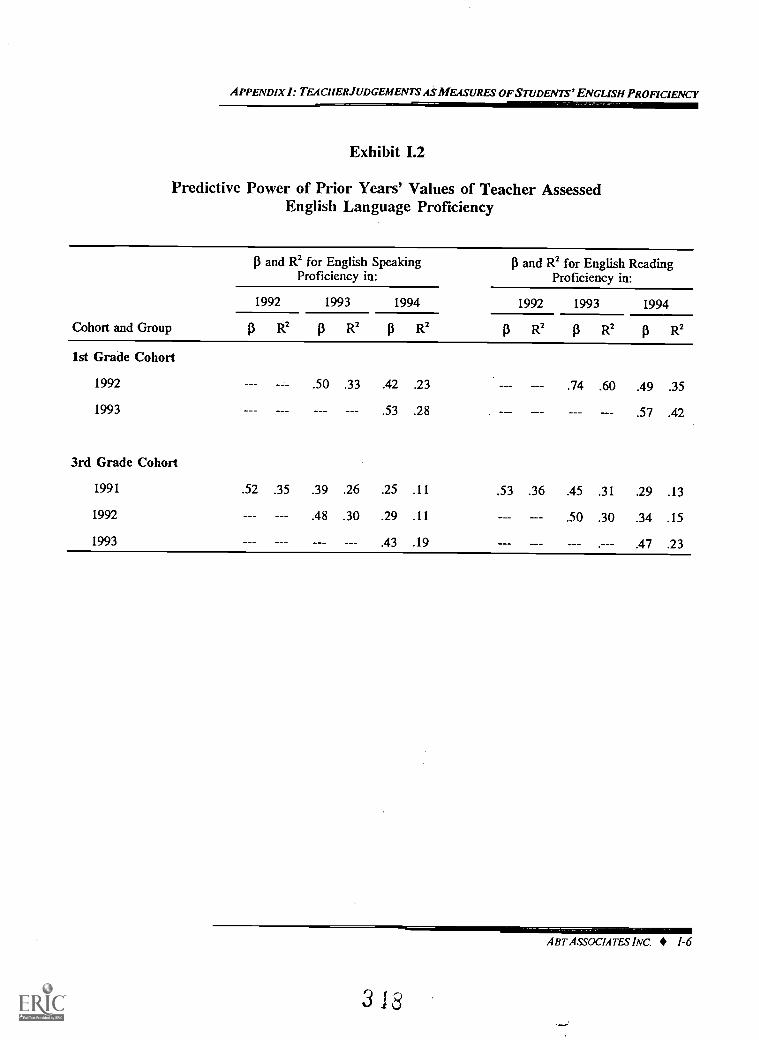
APPENDIX!: TEACHERJUDGEMENTS AS MEASURES' OF STUDENTS' ENGLISH PROFICIENCY
Exhibit 1.2
Predictive Power of Prior Years' Values of Teacher AssessedEnglish Language Proficiency
13 and R2 for English Speaking 13 and R2 for English ReadingProficiency in: Proficiency in:
Cohort and Group
1992 1993 1994 1992 1993 1994
13 R2 [I R2 13 R2 p R2 p R2 p R2
1st Grade Cohort
1992
1993
3rd Grade Cohort
1991
1992
1993
.52 .35
.50
.39
.48
.33
.26
.30
.42
.53
.25
.29
.43
.23
.28
.11
.11
.19
.53 .36
.74
.45
.50
.60
.31
.30
.49
.57
.29
.34
.47
.35
.42
.13
.15
.23
ABT ASSOCIATES INC. 1-6
3 1 3
APPENDIX I: TEACHERJUDGEMENT S AS MEASURE.S OF STUDENTS' ENGLISH PROFICIENCY
'Vs in adjacent years average about .33, implying that a fair portion of the variance across studentsin English proficiency is explained by proficiency in the prior year. Overall, the positive slopes, thereasonable relationship across adjacent years, and the consistency of the patterns suggests thatteacher judgements of English proficiency have a fair degree of reliability.
How Valid Are Teacher Judgements of English Proficiency?
If teacher judgements are good measures of students' English proficiency, then we expect themto be correlated with other variables that themselves may be related to English proficiency. To thatend, we examined the relationship between the teacher judgements and: standardized reading testscores; receipt of language-related services; parents' self-reported English proficiency; parents'reports of how often English is used in the home; and exits from LEP status.
English proficiency and reading test scores. In general we expect a positive relationship betweenEnglish proficiency and CTBS reading test scores: LEP students with higher levels of Englishproficiency should score higher on the CTBS reading test. This is a broad generalization, however,with an important caveat. The CTBS reading test is not designed to measure English proficiencyfor non-native English speakers; it is designed to measure cognitive reading skills. Given this, it isnot clear that we should expect more than a weak relationship between English proficiency and testscores.
Exhibit 1.3 presents "box and whiskers" graphs of CTBS Reading Vocabulary testscores for eachlevel of assessed English proficiency, for the 1st grade cohort. Exhibit 1.4 presents the analogousgraphs for the 3rd grade cohort. The top two graphs in each exhibit use data for year 2, with the topleft graph showing English speaking proficiency and the top right graph showing English readingproficiency. The two bottom graphs in each exhibit are analogous, and pertain to year 4. The linein the middle of each box represents the median test score, and the box itself extends from the 25thto 75th percentile. The data in these graphs include imputed proficiency and test score data.
Both exhibits show evidence of a weak positive relationship between assessed Englishproficiency and test scores. In each graph the median test score tends to increase with proficiency,although not by much. The pattern is very similar across cohorts, across years, and acrossproficiency domains.
Receipt of language-related services. In general we expect that students with more limitedEnglish proficiency are more likely to receive language-related services. This relationship isexplored in Chapter 3; see Exhibits 3.12 and 3.16 and the accompanying discussion. Exhibit 3.12shows a strong relationship between the percent of LEP students receiving ESL or bilingualinstruction and teachers' ratings of students English proficiency in the previous year. Exhibit 3.16
ABT ASSOCIATES INC. 1-7
3 9
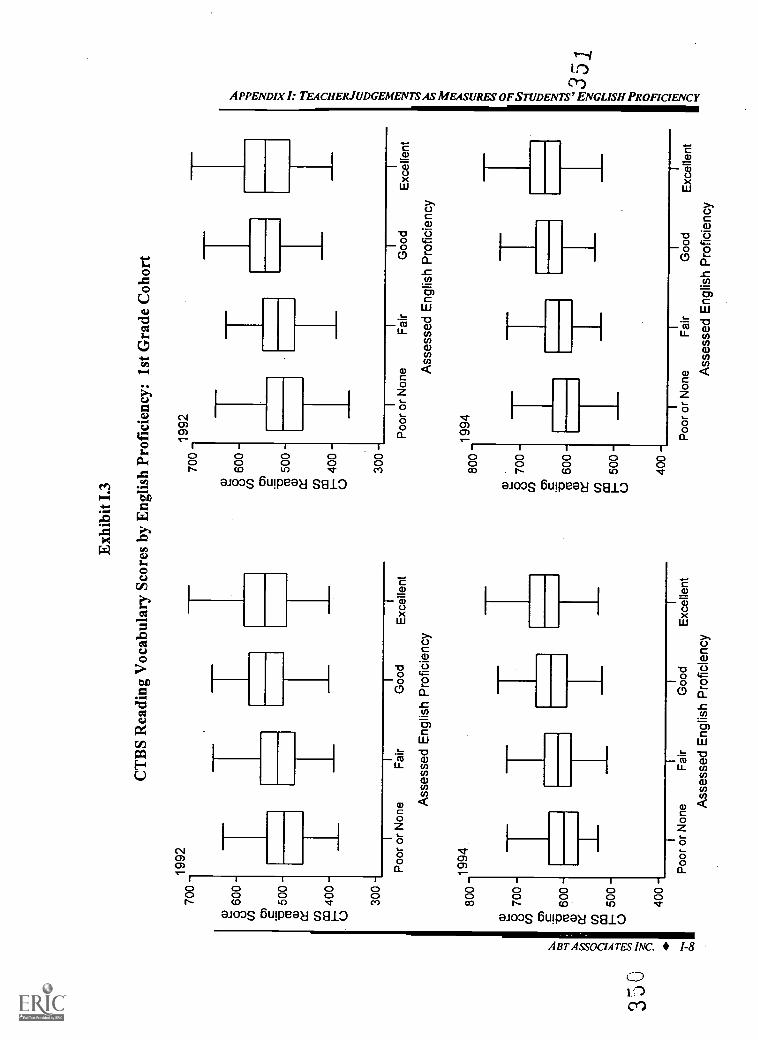
Exh
ibit
1.3
CT
BS
Rea
ding
Voc
abul
ary
Scor
es b
y E
nglis
hPr
ofic
ienc
y: 1
st G
rade
Coh
ort
700
o 60
0 -
c.)
"a 5
00 -
ca a) ca 4
00 -
300
-
800
-199
4
870
0 -
u) cu 6
00
co 1--
500
-
400
-
1992
700
-199
2
8 u) cr)
Co
500
-a) co I 4
00 -
(.)
300
-
Poo
ror
Non
e Ass
esse
d
Fai
r
Eng
lish
Goo
d
Pro
ficie
ncy
Exc
elle
nt
800
-199
4
700
-u) er
)
ca 6
00
cc ca 1 50
0 -
0
400
-
Poo
ror
Non
e Ass
esse
d
Fai
r Eng
lish
Goo
d
Pro
ficie
ncy
Exc
elle
nt
Poo
r or
Non
eF
air
Goo
dE
xcel
lent
Poo
r or
Non
eF
air
Goo
dE
xcel
lent
Ass
esse
d E
nglis
h P
rofic
ienc
yA
sses
sed
Eng
lish
Pro
ficie
ncy
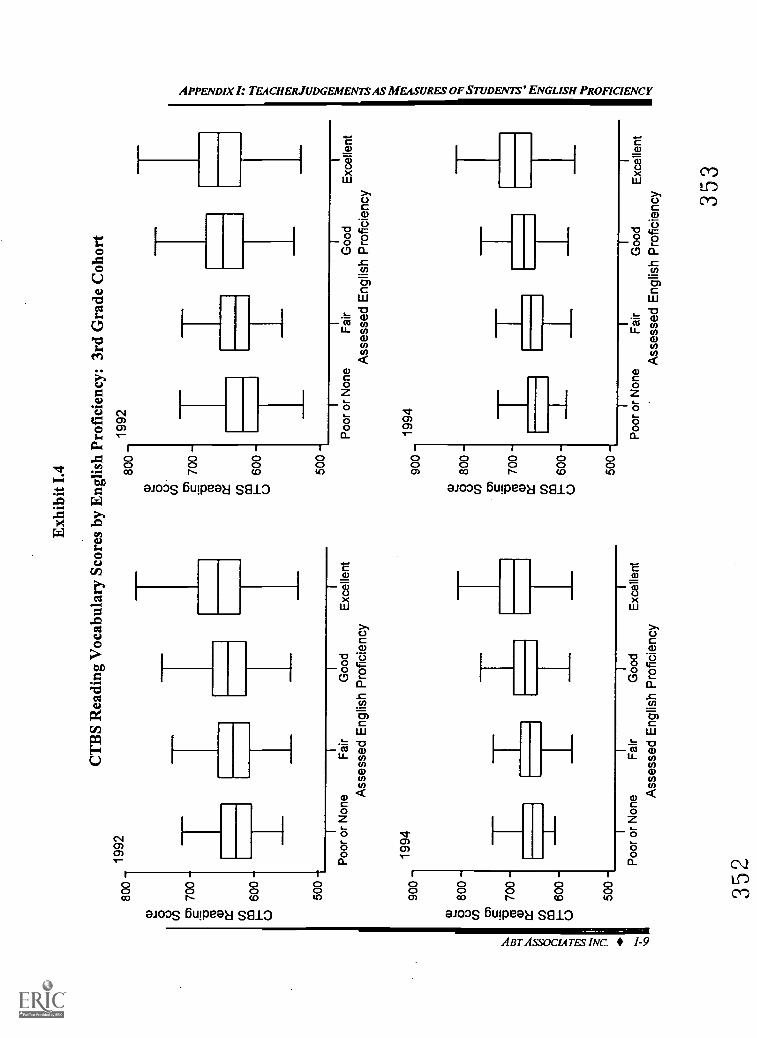
800
-
c.)
co En
700
-'E
s'
cc C/) a3
600
-
Exh
ibit
1.4
CT
BS
Rea
ding
Voc
abul
ary
Scor
es b
y E
nglis
h Pr
ofic
ienc
y: 3
rd G
rade
Coh
ort
1992
1992
800
-
c 70
0
a) cf)
co60
0 -
500
-50
0 -
Poo
r or
Non
eF
air
Goo
dE
xcel
lent
Poo
r or
Non
eF
air
Goo
dE
xcel
lent
Ass
esse
d E
nglis
h P
rofic
ienc
yA
sses
sed
Eng
lish
Pro
ficie
ncy
1994
900
-
o 80
0 -
0,4"
'cpc
u
-Ia) ce co I.-
600
--1 n
500
-*
II
II
Poo
r or
Non
eF
air
Goo
dE
xcel
lent
Ass
esse
d E
nglis
h P
rofic
ienc
y
352
190
0 -
994
o 80
0 -
co cy)
as 7
00 -
a) cc co I- 6
00 -
500
-
I
TI
Poo
r or
Non
eF
air
Goo
dE
xcel
lent
Ass
esse
d E
nglis
h P
rofic
ienc
y 353
APPENDIX 1: TEACHERJUDGEMENTS AS MEASURES OF STUDENTS' ENGLISH PROFICIENCY
shows a similarly strong relationship between prior year proficiency ratings and the percentage ofinstruction in a language other than English.
Parents' English proficiency and use of English in the home. In general we expect that parents'and students' English proficiency to be positively related: the higher a parent's proficiency, thehigher their children's proficiency, on average.5 (Parents' English proficiency is self-reported.)Exhibit 2.14 in Chapter 2 documents a strong relationship between parents' and students'proficiencies, as expected. There is a similarly strong relationship between teacher assessments ofstudents' English proficiency and parents' reports of how often English is spoken in the home; theseresults are not shown.
Exit from LEP status. Last but quite important, we expect that students who exit LEP statusin any given year will have higher levels of English proficiency than students who do not exit LEPstatus. As with the other variables discussed in this section, the expected relationship is borne outin the data; Exhibit 4.1 in Chapter 4 shows that LEP exiters have higher teacher ratings of Englishproficiency than non-exiters in every year.
In sum, all the measures we examined showed the expected relationship with teacher ratingsof English proficiency. The correlation with reading test scores is weak, but the association withother variables is strong. Based in part on this evidence, we believe teacher ratings to be more thanadequate for addressing questions in this report such as, "Are students with lower levels of Englishproficiency more likely to receive language-related services?" and "Do students who exit LEP statushave higher levels of English proficiency than students who remain LEP?" However, because of thepossibility of bias due to measurement error, we are less confident that teacher judgements provideaccurate estimates of the percentage of LEP students at different levels of English proficiency.
5 Parents' and childrens' language proficiency might be correlated because of similar environmental influences(e.g., same length of time in the U.S.), or more directly (i.e., parents' proficiency might positively or negativelyinfluence childrens' proficiency).
354
ABT ASSOCIATE S INC. 1-10
Li
U.S. Department of EducationOffice of Educational Research and Improvement (0ERI)
National Library of Education (NLE)Educational Resources Information Center (ERIC)
NOTICE
REPRODUCTION ASIS
®
ERIC
This document is covered by a signed "Reproduction Release(Blanket) form (on file within the ERIC system), encompassing allor classes of documents from its source organization and, therefore,does not require a "Specific Document" Release form.
This document is Federally-funded, or carries its own permission toreproduce, or is otherwise in the public domain and, therefore, maybe reproduced by ERIC without a signed Reproduction Release form(either "Specific Document" or "Blanket").
EFF-089 (9/97)