Embed Size (px)
Citation preview

VTT SY
MPO
SIUM
24037
th R3N
ORD
IC. Contamination Control Sym
posium
Tätä julkaisua myy Denna publikation säljs av This publication is available from
VTT VTT VTTPL 1000 PB 1000 P.O. Box 1000
02044 VTT 02044 VTT FI02044 VTT, FinlandPuh. 020 722 4404 Tel. 020 722 4404 Phone internat. +358 20 722 4404Faksi 020 722 4374 Fax 020 722 4374 Fax +358 20 722 4374
ISBN 951– 38– 6303– 4 (soft back ed.) ISBN 951– 38– 6304– 2 (URL: http://www.vtt.fi/inf/pdf/)ISSN 0357– 9387 (soft back ed.) ISSN 1455– 0873 (URL: http://www.vtt.fi/inf/pdf/)
ESPOO 2006 VTT SYMPOSIUM 240
37th R3NORDICContamination Control Symposium
R3Nordic, the Nordic Society of Cleanroom Technology, is a nonprofit,independent society with a well established network for research, education,product development and production in cleanroom technology andcontamination control in the Nordic countries. The venue of the 37th annualsymposium is Scandic Hotel Rosendahl in Tampere. The aim of thissymposium is to provide knowledge of contamination control and cleanroom technology dealing with topics in the pharmaceutical, food, andelectronics industries as well as hospitals. The topics at the 37th
R3Nordic Contamination Control Symposium are clean room technologyand management, clean room clothing, contamination control andcleaning, strategies for process analytical technology, environmentalmonitoring and risk management in production, process design and R3
technology. We wish that this event will be fruitful in giving backgroundinformation and new ideas to all participants in the symposium andexhibition as well as readers of the proceedings.


VTT SYMPOSIUM 240 Keywords: contamination control, cleanroom, clean room, air handling, process hygiene, cleaning, disinfection, decontamination, biocontamination, isolators, cleanroom clothing, process design, hygienic integration, monitoring, Process analytical technology, PAT, electrostatic discharge, ESD, R3 technology, food industry, pharmaceutical industry, electronics, hospital, operating theatre, risk assessment, eLearning
37TH R3-NORDIC CONTAMINATION CONTROL SYMPOSIUM
Tampere, Finland, May 2931, 2006
Edited by Gun Wirtanen & Satu Salo
VTT
Programme Committee: Maarit Kaihlanen, Tytti Graeffe, Anne Lintukorpi,
Antti Mikkola, Salme Nurmi, Jaakko Paasi, Satu Salo & Gun Wirtanen
Organized by R3-Nordic
The Nordic Society of Cleanroom Technology
2
ISBN 9513863034 (soft back ed.) ISSN 03579387 (soft back ed.)
ISBN 9513863042 (URL: http://www.vtt.fi/publications/index.jsp) ISSN 14550873 (URL: http://www.vtt.fi/publications/index.jsp)
Copyright © VTT Technical Research Centre of Finland 2006
JULKAISIJA UTGIVARE PUBLISHER
VTT, Vuorimiehentie 3, PL 1000, 02044 VTT puh. vaihde 020 722 111, faksi 020 722 4374
VTT, Bergsmansvägen 3, PB 1000, 02044 VTT tel. växel 020 722 111, fax 020 722 4374
VTT Technical Research Centre of Finland Vuorimiehentie 3, P.O.Box 1000, FI-02044 VTT, Finland phone internat. +358 20 722 111, fax + 358 20 722 4374
VTT, Tietotie 2, PL 1000, 02044 VTT puh. vaihde 020 722 111, faksi 020 722 7071
VTT, Datavägen 2, PB 1000, 02044 VTT tel. växel 020 722 111, fax 020 722 7071
VTT Technical Research Centre of Finland, Tietotie 2, P.O. Box 1000, FI-02044 VTT, Finland phone internat. +358 20 722 111, fax +358 20 722 7071
Cover picture Jarkko Laesvirta Otamedia Oy, Espoo 2006
3
PREFACE R3-Nordic, the Nordic Society of Cleanroom Technology, is a non-profit, independent association for the promotion of new technologies in cleanroom technology and contamination control in the Nordic countries. The venue of the annual symposium is Scandic Hotel Rosendahl in Tampere. The aim of the annual R3-Nordic Symposium is to provide knowledge within the pharmaceutical, food and electronic industries as well as hospitals. The topics at the 37th R3-Nordic Contamination Control Symposium are: contamination control, clean room technology and management, regulations and standards in clean rooms, clean room clothing, isolation applications, R3 technology and air handling, environmental monitoring in production, process design, process hygiene, cleaning and disinfection, risk assessment, process analytical technology and air quality and hygiene in operating theatres.
The persons involved in the Programme Committee are Maarit Kaihlanen, Tytti Graeffe, Anne Lintukorpi, Antti Mikkola, Salme Nurmi, Jaakko Paasi, Satu Salo and Gun Wirtanen. Raimo Pärssinen and Jouko Riihonen have been assisting the programme committee. The editors of the proceedings would like to express their gratitude to the speakers for preparing the abstracts published in the January and April (35 [2006] 1:2233 & 35 [2006] 2:1214) issues of the journal Renhetsteknik as well as the full papers or extended abstracts published in these proceedings. We wish that this event will be fruitful in giving new ideas to all participants and exhibitors.
Programme Committee
Välkommen ! Tervetuloa ! Welcome !

4

5
CONTENTS AND SPEAKERS
Preface 3
PLENARY SESSION 11
Chapter 1: The Technology City of Tampere and BioneXt Keynote 1, Tero Välimaa
13
Chapter 2: Food Safety Research Programming in Europe SAFEFOODERA Keynote 2, Oddur Gunnarsson
15
Chapter 3: Quality Risk Assessment in the Pharmaceutical Industry Keynote 3, Camilla Bollner & Petter Gallon
17
PHARMA SESSION 19
Chapter 4: GMP Inspections of the Sterile Manufacturers Inspection Observations, Hanna-Maija Koponen-Piironen
21
Chapter 5: Raising the Testing Standards through the Cleanroom Testing Certification Board, Neil Stephenson
23
Chapter 6: Implementation and Control of the EU GMP in Russian Pharmaceutical Industry, Alexander Fedotov
31
Chapter 7: Parametric Release of Sterile Products Requirements, Implementation and Benefits, Didier Meyer
43
Chapter 8: Planning Considerations of a HVAC System for Sterile Pharmaceutical Production, Jouko Miesvirta
49
Chapter 9: Qualification Process of a New Pharmaceutical Facility, Gordon Farquharson
51

6
Chapter 10: Microbiological Qualification of Pharmaceutical Cleanroom Facilities, Gerry Prout
59
Chapter 11: Cleaning and Disinfection Agents of Pharmaceutical Cleanrooms Modes of Action, Usage and Requirements, Karen Rossinton
61
Chapter 12: DryFogging as a New Technology to Disinfect Cleanrooms, Dominique Leclercq
65
Chapter 13: Cleaning and Disinfecting of Cleanrooms A Validation Perspective, Elaine Pears
67
Chapter 14: Optimum Wiper Characteristics for the Cleaning and Disinfection of Pharmaceutical Cleanrooms, Howard Siegerman
69
Chapter 15: Newest Developments in Rapid Microbiology Practical Aspects and Validation, Frank Panofen
83
Chapter 16: FDAs Process Analytical Technology (PAT) Strategy and its Implications on Sterile Product Manufacture, Kurt Brorson
87
Chapter 17: Isolator and Containment Solutions, Hans Gath 89
Chapter 18: Practical Issues and Process Solutions to Post SIP and Pre-use Integrity Testing of Sterilizing Grade Filters, Alain Rachon
93
Chapter 19: How Does Rapid Microbiology Meet the Needs of Process Analytical Technology? Peter Ball
97
FOOD SESSION 109
Chapter 20: Risk Management According to Food Safety Standards, Laura Raaska
111

7
Chapter 21: eLearning as a Tool in Educating Hygiene Aspects in Biotechnology and Food Engineering, Tuija Pirttijärvi
113
Chapter 22: Zoning in Food Processing Requirements and Examples, Janne Lundén
125
Chapter 23: Cleanroom Technology Application in a Bakery, Petri Uotila
129
Chapter 24: Risk Assessment of and Protective Measures against Microbial Threats, Laura Raaska
133
Chapter 25: Hygienic Integration in Plant Sanitation, Bo B.B. Jensen 137
Chapter 26: Increasing the Level of Hygiene in EU The EHEDG Training Facilitator and Tool-Box, Bo B. B. Jensen
143
Chapter 27: Computational Fluid Dynamics as a Tool in Planning Cleaning Procedures for the Food Industry, Satu Salo
151
Chapter 28: New Surface Materials for Food Process Applications, Anne-Christine Ritschkoff
153
Chapter 29: Food Hygiene Networking in Europe, Gun Wirtanen 163
Chapter 30: Food Hygiene in Estonia, Raivo Vokk 165
Chapter 31: Lubricants Are They A Source For Microbial Contamination in the Food Industry? Kaarina Aarnisalo
169
Chapter 32: Food Safety in the European Technology Platform Food for Life, Harmen Hofstra
177

8
Chapter 33: Comparison of Different Test Methods for Testing Fabrics for Use in High Hygiene Area, Lorenz Michael & Tuija Luoma
179
CLEANROOM CLOTHING SESSION 187
Chapter 34: Cleanroom Clothing Systems Test Results, Berit Reinmüller
189
Chapter 35: Cleanroom Clothing Systems Some Calculations, Bengt Ljungqvist
197
Chapter 36: Human as a Particle Source in Cleanroom, Tuija Luoma 207
Chapter 37: Managing Static Electricity and Particles in Cleanrooms and Clean Areas, Johanna Anttila
219
Chapter 38: Care Programme for Cleanroom Clothing, Anna-Leena Hyytiäinen
229
HOSPITAL SESSION 233
Chapter 39: Transmission Modes of Hospital Acquired Infections, Jukka Lumio
235
Chapter 40: Solutions in Preventing Hospital Infection Epidemics View of Clinician, Janne Laine
237
Chapter 41: Clinical Needs and Current Standards for Operating Room Air, Teija-Kaisa Liljeblad
243
Chapter 42: Airborne Particle Emissions of Textiles during Preparation for Surgical Operation, Salme Nurmi
255
Chapter 43: Particle Emission and Electrostatic Charge in Cardiac Surgery, Anne Lintukorpi
265

9
Chapter 44: Overview of Standardisation Projects of Hospital Textiles in CEN, Auli Pylsy
267
Chapter 45: Bacterial Adherence, Penetration and Survival on Different Surfaces and Materials, Kirsi Laitinen
273
Chapter 46: Disinfection in Hospitals in the New Millennium, Reijo Saunamäki
275
Chapter 47: Ventilation Systems in the Future Operating Theatres, Kjell Rösjö
285
ELECTRONICS SESSION 311
Chapter 48: Particle Contaminants in Electronics Manufacturing, Pasi Tamminen
313
Chapter 49: Enabling Techniques for Clean Manufacturing of Electronics, Matti Lehtimäki
331
Chapter 50: New Electrostatic Dissipative Plastic Materials for Cleanroom Applications, Antti Helminen
339
Chapter 51: ESD Protective Requirements for Cleanroom Clothing, Lars Fast
343
Chapter 52: Example Case of Clean Manufacturing of Microelectronics VTI, Marianne Pulkkinen
357
MONITORING SESSION 361
Chapter 53: Basics of Cleanroom Functions with Emphasis on Monitoring, Hans Cederqvist
363
Chapter 54: Applying Video Exposure Monitoring in Clean Production, Arto Säämänen
375

10
Chapter 55: How Safety is a Safety Cabinet? Arno Wouters 387
Chapter 56: Air Cleanliness Controls in the Food Industry, Kjell Rösjö 389
Chapter 57: The New EU Directive for Tissue Establishments Challenges in Processing Human Tissues and Cells in Cleanroom Environment, Annika Vienonen
413
SESSION ON R3 TECHNOLOGY 415
Chapter 58: Dispersion of Airborne Contaminants Basics In R3 Technology, Bengt Ljungqvist
417
Chapter 59: Airborne Biocontamination in Cleanrooms Some Aspects on Air Samplers, Berit Reinmüller
421
Chapter 60: Determination of Human Primary Proteins in Cleanroom Facilities using Fluorescence-Based Methods, Tommi Vehviläinen
429
Chapter 61: Theoretical Aspects on Environmental Monitoring in Pharmaceutical Cleanrooms, Francesco Romano
441
Chapter 62: Particle Entrainment of Ambient Room Air into the Operating Zone Protected by UDF-Ceilings, Johan Nordenadler
443
Chapter 63: Air Movements and Particle Dispersion in Unidirectional Airflow with Application to Operating Rooms, Davy Sipilä
449
SYMPOSIUM PROGRAMME

PLENARY SESSION


13
CHAPTER 1: THE TECHNOLOGY CITY OF TAMPERE AND BIONEXT KEYNOTE 1
Tero Välimaa BioneXt, Tampere, Finland
Biotechnology offers market potential and unresearched areas long into the future. The results of sustained effort are now starting to show in treatment results as well as in the development of products and the company base. More than 200 biotechnology based drugs have been developed and it is estimated that sales of the nine drugs approved last year will rise to 2.5 billion euros already this year and to 6.5 billion euros in two years time. In addition to drugs development, biotechnology is utilized e.g. in the development of novel genome research based diagnostics, vaccines, implants, tissue engineering, regenerative medicine, biosensors, which all have notable prospects in the prevention and treatment of diseases and traumas.
BioneXt Tampere investment and development programme strengthens biotechnology expertise in the Tampere area. The programmes focal areas are implants and tissue engineering, immunology and bio ICT. Tampere has for a long time been in the global front line in the research of bioabsorbable materials and commercialization of bioabsorbable surgical implants. Emerging in this field are also companies which have set their aims on next-generation products that actively affect the bodys healing process. One of the missions in Tampere is to combine expertise in biomaterials, tissue engineering and medicine to develop bioabsorbable implants containing stem cells. This would enable the repair of tissues that do not otherwise heal or where the healing process is extremely slow.
Tampere hosts active research and business related to molecular biology, immunology, cancer genetics and vaccines. The institutes in these areas have received several international and national recognitions. Active research has also produced several spin-off companies. Vibrant business and research activities have also given rise to demand for services and companies manufacturing

14
medical research equipment. Resources are therefore also being directed into computer-aided processing of biological information (bio ICT) and services related to the tissue engineering. New industry has already emerged in this field and new companies are emerging all the time. For Finland, it is worth continuing to invest in the development of high technology and biotechnology. Development of recent years in US has shown that there are significant prospects in the field both in terms of economy and science. In consequence of the wideness of the field there is room and profit for those who have the will and the persistence to take things further.

15
CHAPTER 2: FOOD SAFETY RESEARCH PROGRAMMING IN EUROPE SAFEFOODERA
KEYNOTE 2
Gun Wirtanen*, Ola Eide & Oddur Gunnarsson NICe, Oslo, Norway & * VTT, Espoo, Finland
The SAFEFOODERA project, with 21 participants from 18 countries, was started on August 1, 2004 with The Nordic InnovationCentre (NICe) as the project coordinator. The first consortium meeting was held in Kranskja Gora, Slovenia on September 23, 2004 to initiate the European Steering Committee (ESC), the Project Management Group (PMG) and to start the process of creating trust and mutual understanding in the consortium.
The SAFEFOODERA web site (www.safefoodera.net) was launched in November 2004, and is used as the main communication tool between the project meetings. Following the meeting in Kranskja Gora defined guidelines for the continuous interaction between ESC and a future European Expert Advisory Group were developed and concluded among the partners by using the web site. The final document was published in the news segment of the open part of the web site. Three questionnaires, to be used for basic exchange of information and for comparison of activities and management of governmental funded national/regional food safety research, were initiated during workshops in Kranskja Gora and further developed by PMG before distribution to the participants through the web site.
All participants have responded to the questionnaires as requested, and the results were presented at the second ESC meeting in Bergen, Norway on September 1, 2005. Food safety activities in the participating countries, ongoing or ended in 2004, in the topics Emerging risks, Risk analysis, Contaminants, Traceability and Pathogens were reported both in pie-charts for 5 regions (All SAFEFOODERA countries, Nordic countries, Central Europe,

16
Mediterranean countries & Portugal and New EU countries) based on information clustered and on the European map with colours to indicate individual activity frequencies from low through medium to high for each country. During the ESC meeting in Bergen the maps were used in workshops aiming to select joint strategic research topics for a planned pilot call for proposals.
The responses to the management questionnaire were used in workshops aiming to select evaluation criteria for project funding and to discuss the management of the pilot call both before and after project funding. The prioritised evaluation criteria were: relevance according to the call, chances for achieving the objectives, scientific quality, value for money and enhancing international collaborative work.
In the period between the ESC meeting in Bergen on September 1, 2005 and the subsequent ESC meeting in Limassol, Cyprus on February 9, 2006, the topics were further analysed using a representative working group of ESC members. A total of 70 potential topics were in a two step process reduced to 12 topics, which were further described in short documents under the following common headings: 1) Identification of problems, 2) Formulation of the knowledge question, 3) Strategic interest as a Pan-European project and 4) Approach proposed to the problems. These documents were used as stimulus in a two step workshop process at the ESC meeting in Cyprus to define the 3 preferred SAFEFOODERA topics for a pilot call. The three topics selected were: Zoonosis, Emerging risks and Pathogen free production chains. The first topic was selected to test the principle of a Distributed pot, while the two others were selected to test the principle of a Common pot.

17
CHAPTER 3: QUALITY RISK ASSESSMENT IN THE PHARMACEUTICAL INDUSTRY KEYNOTE 3
Camilla Bollner & Petter Gallon AstraZeneca, Södertälje, Sweden
Risk assessment is an activity within the larger process of risk management, as described in the new International Conference on Harmonisation (ICH) Q9 Guideline Quality Risk Management. Risk management is a process for decision-making. In our industry we have always been managing risks, but we might not always have recorded the reasons behind our decisions, or the facts and processes that lead us to the result. Other industries have been doing formal risk assessments for a long time, e.g. nuclear, food and space industry, and we can learn from them.
With the new ICH Q9 guideline, and the American Food and Drug Agencys (FDA) declaration of risk/science based approach to product quality, we as an industry are encouraged to decide on how to best use risk management as part of our quality systems. The ICH Q9 guideline is a process description, which will guide us through how to perform risk management work. Risk assessment means to identify, analyse and evaluate the risk in a certain process or object. This is a way of documenting what we know and what we do not know about that process or object. It is science based, in that we record the grounds for our decisions. For instance, when looking at microbiological risks in a production process, we can document temperature, water activity, solvent content etc and from this we can estimate if growth can occur. If uncertain, we can perform relevant tests in the laboratory, before starting the process in the production environment. The better we understand our process, the better the assessment this often requires technical and product expertise.
The assessment provides a better understanding of the risks to product quality, thus providing us with a better ground for taking control. Risk assessments must be followed by risk control, where we accept or reduce the risk, and the risk
18
assessment needs to be communicated to relevant stakeholders for decisions on actions. To make our risk assessments reflect the current situation, thus showing us being in control, there is a need to find a process for periodic or event based review.
Examples of areas where risk assessment can be a valuable tool is when working with validation, deviation investigations, change control, revalidation, investment, project planning, sample plans, inspections, process controls, etc. Risk assessment is a way of working that can make our work easier. If risks are recorded, this can facilitate communication to management and means that the organisation can take informed decisions. That way continuous improvements and quality by design will be encouraged.

PHARMA SESSION

21
CHAPTER 4: GMP INSPECTIONS OF THE STERILE MANUFACTURERS INSPECTION OBSERVATIONS
Hanna-Maija Koponen-Piironen NAM, Helsinki, Finland
When inspecting sterile manufacturers the quality system and the procedure how the company is evaluating the risks and handling complaints and deviations in the production and in the QC are particularly assessed. The main focus is to ensure that the company is capable continuously manufacture sterile products and avoid contamination.
Most of the pharmaceutical companies are aware of the requirements and are in GMP compliance. Still findings like dead legs in the WFI- system, poor handling of the sterilised primary packaging material, no clear checking if the sterilisation processes has been completed properly, no annual re-verification of the sterilisation processes, no adequate qualification of the clean area personnel, poor planning and performing of the media fills can be seen. More observations may be seen when facilities, equipment and processes are old and if they are not well maintained.
Critical findings are usually seen in small new companies planning to start manufacturing of the sterile medicines for clinical trials. The reason for this is often the lack of knowledgeable personnel of the GMP requirements.

22

23
CHAPTER 5: RAISING THE TESTING STANDARDS THROUGH THE CLEANROOM TESTING
CERTIFICATION BOARD
Neil Stephenson DOP Solutions Ltd, Letchworth, Hertfordshire, U.K.
The Scottish Society of Contamination and Control (S2C2) created the Cleanroom Testing and Certification Board (CTCB) in response to industries need. The CTCB run a training program for Cleanroom Test engineers. The course manual and examination program was constructed by Dr. Bill Whyte assisted by prominent members of the Cleanroom industry. This paper provides background to the CTCB and looks at what has been achieved in the five years it has been in operation. It is now franchised to two other Cleanroom Societies and looks set to change the way we work.
5.1 HISTORY
S2C2 is the leading cleanroom Society in the United Kingdom. It is a non profit society, established for 20 years, with currently over 1000 members drawn from users and suppliers to the cleanroom and allied industries. S2C2 is a member of the International Confederation of Contamination Control Societies (ICCCS). The Society has a strong emphasis on education, having introduced many hundreds of Cleanroom practitioners to the operation and testing of cleanrooms. The CTCB was formed in 2001 as an education and training initiative to help fulfil the objectives of the Society. It provides teaching and certification for people working in the field of cleanroom technology, and provides information to assist those educating people in cleanroom technology. The principle objective of the Board is to further the science of Cleanroom Technology and create a measure so that a standard of performance can be created and maintained for the benefit of cleanroom users, manufacturers and those responsible for validation of all cleanrooms.

24
5.2 THE CTCB COURSES
The CTCB offers two courses that are examinable. The candidate is awarded a certificate on successful completion and passing the examination of the course. These are: a general course in Cleanroom Technology and a practical and theoretical course in Cleanroom Testing. The CTCB courses are distance learning courses followed by lectures immediately prior to the examinations.
5.2.1 Cleanroom Technology
'Cleanroom Technology' course is based on a S2C2 course that has been run for over 15 years, and on the book 'Cleanroom Technology Fundamentals of Design, Testing and Operation' (0). The course covers all aspects of cleanroom technology in a way that is applicable to all types of cleanrooms and industries. An overview of the certification available is as follows.
The Course Syllabus
The candidate will use the book 'Cleanroom Technology Fundamentals of Design, Testing and Operation' as the syllabus of the course, which is as follows:
− Cleanrooms, their need, types and history − Standards and information sources − The design of cleanrooms and clean air devices − Construction materials and surface finishes − High efficiency air filtration − Cleanroom testing and monitoring − Measurement of air quantities and pressure differences − Air movement control − Filter installation leak testing − Airborne particle and microbial counting − Cleanroom disciplines − Materials, equipment and machinery − Cleanroom clothing, masks and gloves − Cleaning a cleanroom.

25
As well as receiving the course book (if required), the candidate will receive a sample set of questions and answers, so that they can anticipate the type of questions to be asked in the exam, and assess their knowledge.
Cleanroom Testing
Cleanroom Testing course was developed directly as a result of requests from Society members. Members have struggled to gain satisfaction from the testing being carried out on their facilities. The course has been so successful that it is currently franchised to R3Nordic and the Irish Cleanroom Society. The course with examination is now run a minimum of three times per year once in Glasgow, Dublin and Stockholm. The Cleanroom Testing Course is aimed at ALL cleanroom professionals including the following:
− Company validation / QA professionals − Test engineers − HVAC and cleanroom design engineers − Consultants − Equipment supplier including design engineers − Hospital Estates Management Groups − HEPA Filter manufacturers − Cleanroom and equipment sales engineers.
The Cleanroom Testing course is, as with the Cleanroom Technology course, initially distance learning. A comprehensive course manual is issued to registered students who study this for their written examination. The study period is ended when the student attends the final lectures and sits the examinations for the chosen course. One day lecture on Cleanroom Testing precedes the written examination by a day. Additionally an optional days course on HEPA filter testing is available which includes a practical. The HEPA filter course was introduced to bring candidates up to date with filter test techniques and to improve the pass rate for the course. The subject matter covered in the course is comprehensive and in order to meet the needs of different groups of candidates there are two different levels.
Associate level This course ends in a one day or two day course plus a theoretical examination. It is intended for persons associated with cleanrooms

26
but not actively engaged in regular validation of the cleanroom. The second day in the program is an optional course on HEPA filter testing and air flow / velocity measurement. Both courses include a practical. The Associate course has been found very useful by QA groups, design engineers and people who have no need to test themselves but who may be required to witness the tests and to qualify the paperwork. On successful completion of the theoretical examination the student is issued with a Associate Certificate.
Professional level The students who apply for this course should be active in cleanroom testing where it is their primary occupation. They must also have been testing for a minimum of two years. This two or three day course ends with the same theoretical examination as for the Associate course but has additionally a practical examination on HEPA filter testing and air flow / velocity measurement. The third day in the program is an optional course on HEPA filter testing and air flow / velocity measurement. Both courses include a practical covering all aspects of what is expected from the candidate during the practical examination. On successful completion of the theoretical and practical examinations the student is issued with a Professional Certificate. If the student passes the theoretical examination but fails the practical examination they will be issued with an Associate Certificate. Candidates, who have passed the Associate course, may, if they meet the necessary requirements for Professional level, return within a year and just undertake the practical examinations with the additional training course on HEPA filters and air flow / velocity measurement.
5.2.2 What is the Need?
In the five years the CTCB has been running the Cleanroom Testing course there has been clear evidence that there is a desperate need for further education. The Professional practical examinations have revealed a clear lack of basic knowledge in many candidates. Measurement principals and the understanding of measurement units together with the magnitude of the anticipated numbers has been a common source of failure. Examination of the students qualification and background often explain the lack of this fundamental knowledge.
The Professional practical examination has by far proved the greatest level of difficulty. The student is expected to enter the examination with no reference papers. The practical and subsequent report for each practical (filter test and air flow/velocity)

27
is completed with papers handed to the candidate. Half an hour is permitted for each measurement and half an hour for each of the two reports. The student must construct their own report from the measurements taken in the practical.
The issues observed in the Professional course are also seen in the field. Bad practice is more common than many would believe and is evidenced by problems encountered either in scheduled re-test (by another party) or when an additional test is carried out to validate the initial work. Often microbiological counts are used to determine the on-going performance of a cleanroom or device. Increased microbiological counts are directly attributable to cleanroom performance and can be reduced by improving regular cleanroom testing.
5.2.3 Horror Stories
Cleanroom testing is only as good as the individual making the tests. S2C2 have over the years collected real horror stories of what does happen in practice. We can classify them as Did you hear about .
Did you hear about the fellow who had his generator serviced and three weeks after the service complained that it had stopped working it was not producing any aerosol. He returned it to the service centre where it was checked out. Yes he had been testing with it during the three week period and it had suddenly stopped working. He was advised he should put oil in the generator. As part of the service the oil is drained from the generator. Thus for three weeks he had carried out tests without any challenge aerosol!
Did you hear about the woman who contracted TB from working with the bacteria in a Microbiological Safety Cabinet (MBSC). The MBSC had been tested every six months and passed. Inspection of the cabinet by a third party revealed that there was a hole in the filter. On removal of the filter a clear hand print was evident on the filter media. This cabinet had been tested five times since its installation by the same individual and passed without question. The filter was original.
Did you hear about the room terminal filter which had been passed on a new commissioning exercise? When the installation was checked by a third party it was found that the upstream sample tube was trapped under the filter gasket.

28
There was a 10% DOP leak from the gasket. How was the upstream challenge measured? See Figure 5.1 below.
Figure 5.1. Picture showing tube trapped under the filter gasket.
5.2.4 QA What We Do Not Consider
The horror stories are all factual and a small example of many. They highlight the need for training. Where tests are carried out for regulatory purposes it is imperative that all the equipment used for the tests are with in their calibration period. Often the validity of the calibration certificates will be checked by the QA department before the engineer is allowed on site to undertake the tests.
Why is it then that no certification is asked of the engineer who will carry out the tests? It seems quite crazy that we spend a great deal of time ensuring that the equipment used to undertake the test is in calibration when not addressing the much more difficult question Is the engineer calibrated? One reason why this has not occurred in the past may well be that there has been nowhere that the engineer may be trained or their competency examined. Now there is. The CTCB can provide this training and examination. When the engineer successfully passes all the required examinations they are issued with a certificate which is valid for five years.
After five years they are expected to return to a refresher course which will bring them up to date with new standards and will re-examine their practical skills. They will then on successful completion be issued with a further Professional Certificate (Figure 5.2).

29
Figure 5.2. Example of the Cleanroom Technology Certificate.
5.3 CONCLUSION
The CTCB is providing a much needed service to the cleanroom industry. For it to continue to offer this service they need the support of the industry. It makes logical sense to have the engineer qualified as well as the instrumentation calibrated. We urge those who employ test engineers to encourage them to take the course and obtain certification. This will improve the overall quality of the work in the industry and provide greater peace of mind knowing that you are receiving quality service. The CTCB continues to develop and improve the program of services on offer to its members. Visit www.s2c2.co.uk to learn more about the training courses on offer.
5.4 REFERENCE
Whyte, W. 2001. Cleanroom technology, Fundamentals of design, testing and operation. Chichester: John Wiley & Sons, Ltd. 292 p.

30

31
CHAPTER 6: IMPLEMENTATION AND CONTROL OF THE EU GMP IN RUSSIAN PHARMACEUTICAL
INDUSTRY
Alexander Fedotov ASENMCO (Association of Engineers for Microcontamination Control,
All-Russia public organization), Moscow, Russia
In 2004 EU GMP Guideline was approved as Russian national standard GOST R 52249-2004 Manufacturing and quality control of medicinal products. This is the direct translation of EU GMP with all 18 Annexes without any changes. Different GMP-like guidelines existed in Russia earlier. They reflected need to improve quality of medicinal products but did not consider some key elements of GMP approach and sometimes set unnecessary rigid requirements. ASENMCO started proving necessity to implement in Russia EU GMP in early 90-th. It was obvious that Russia should have the same normative basis as Europe. Russia will join WTO in nearest future so harmonization of standards became a mandatory requirement. Now we have to solve several tasks to provide implementation and control of GMP rules: 1) to create family of standards to support manufacturers in their GMP efforts; 2) to develop system of training; and 3) to develop inspection, audit and certification institutions.
GMP Guideline is written mainly with general words. We need standards to explain key elements of GMP with more details. For this we prepared at first stage following standards: 1) Manufacturing of medicinal products. System of quality assurance. General requirements; 2) Manufacturing of medicinal products. Documentation; and 3) Cleanrooms. Garments. General requirements. The first standard is the key document. It systematically summarizes requirements for quality assurance and introduces chapters on control of execution, proper arrangement of design and validation etc. This paper discusses experience of work according to ISO 9000 standard and describes some myths around this system.

32
6.1 HISTORY OF GMP IN RUSSIA
History of GMP in Russia is similar to development of standardization in general. Until 1991 Russian economics was different from western world in principle. All property belonged to the state. All plants received plans and orders for manufacturing of products from the state. Supplying by all materials was centralized and controlled by the state. Management of plants did not care about marketing and had the only duty to fulfill state plans. Furthermore nobody had legal right to produce anything by direct negotiation with customers without a plan. The state covered 100% of manufacturing capacities. And the state created standards that were mandatory. Under these circumstances the plants were interested only on what the state said and not on market. Better to say that the market was absent at all. So the state had several roles:
− it was the only customer, − it was the only supplier, − it was owner of plants, − it was authority that created standards and controlled compliance to them.
All this was controlled by huge bureaucratic system with many institutions that were not much interested on world level of production and quality standards. This system created many people who set standards only on basis of their own understanding. The system of so named national specific standards was established. This system actually did not reflect real national specific features but served for interests of bureaucracy.
In early 90th situation was dramatically changed. Three first roles of the state were eliminated. Only control of laws and normative documents remained for the state. Manufacturers were dropped onto market and it was their responsibility to select proper standards to reach success on the market. Not everybody understood it quickly. The system was changed but many of old institutions and old people remained. They make resistance for implementation of new ideology of standards. Implementing of GMP EC Rules in Russia should solve several tasks:
− elimination of trade barriers, − setting in Russia the same standards as in Europe and giving normative
basis for export of products, − upgrading national pharmaceutical industry,

33
− setting barrier to import of poor quality drugs from some countries.
Movement towards implementation of GMP Rules in Russia started in early 90-th. Very soon two opposite approaches appeared:
− The first of was to create something national specific. It belonged to bureaucracy and institutions;
− The second was to implement GMP EC guide in Russia directly without any changes. This approach belonged to ASENMCO.
ASENMCO was founded in 1991 as a non-profit independent society of professionals who were free of influence of bureaucracy. The core of ASENMCO included internationally oriented people who looked forward and set goal of upgrading national industry.
During 90th ASENMCO efforts had no success. In 1991 and 1998 two industry nationally oriented standards were approved in Russia. In fact they were compilations of GMP EC text with some withdrawals, mixings, changes and adding new unnecessary requirements that were even more rigid then in GMP EC Guide. For ten years ASENMCO was proving that this way has no future and is harmful for industry and society. This was a frustrating period.
Little by little situation was changing. Manufactures started to understand that they need internationally recognized norms. Some new people came to authorities. In 2004 special Technical Committee for standardization TC 458 Manufacturing and quality control of medicinal products was approved by National body for standardization (Gosstandart of Russia). ASENMCO was appointed to held secretariat of TC 458. President of ASENMCO Dr. A. Fedotov was appointed to be a convenor of TC 458.
The first result was achieved already in 2004. GMP EC Guide was approved as Russian national standard GOST R 52249 Good Manufacturing Practice for Medicinal Products. This standard is identical to GMP EC including all 18 Annexes. It was really a breakthrough. Furthermore GOST R 52249 is the first Russian standard that sets main rules for the whole industry that are identical to European norms. Many ISO and CEN standards were approved in Russia earlier but GMP was the first key standard for the whole industry.

34
6.2 NEW PROBLEMS
National standards are not mandatory documents according to Russian Law On Technical Regulating that is in force since 01.07.2003. Therefore GMP GOST R 52249 is only recommendation. Technical Regulation is a mandatory document (normally a Law). Standard can be a basis to prove compliance to Technical Regulation. This system is similar to European Practice (Table 6.1). The Technical Regulation is analogue to European Directive. Therefore we need special Technical Regulation on GMP to form the complete basis for GMP norms in Russia. Russia has the Law Safety of medicinal products. This is a general law and has only note about manufacturing of medicinal products.
ASENMCO offered a simple solution. This is to approve Russian version of European Commission Directive 2003/94 EC of 8 October 2003 laying down the principles and guidelines of good manufacturing practice in respect of medicinal products for human use and investigational medicinal products for human use. ASENMCO prepared the draft of relevant Technical Regulation and submitted it to formal discussion. We understand that approval of such key document is a slow process and we need to overcome resistance of some groups of people, for example, counterfeit makers. Of course it is necessary to develop procedure how to upgrade national manufacturing sites to GMP Rules in full scale.

35
Table 6.1. System of GMP documents in different countries.
Documents USA EC Russian Federation
Mandatory
21 CFR Part 211 Current Good Manufacturing Practice for Finished Pharmaceuticals (GMP)
EC Directive 2003/94 of 8 October 2003 laying down GMP principles
⇔
Law Safety of medicinal products. Technical regulation Manufacturing and Quality Control of Medicinal products. General requirements (draft) ⇓
Recommended, approved by state authorities
FDA guidelines, national and ISO standards
GMP EC GuideISO, CEN and other standards PIC documents
⇔
GOST R 52249 Good Manufacturing Practice for Medicinal Products Other ISO, CEN and national standards, ⇓
Recommended Practices of professional societies etc.
ISPE, PDA, IEST and other Baselines and practices
ISPE, PDA, IEST and other Baselines and practices др.
⇔
ISPE, PDA and other Baselines and practices
6.3 NEED FOR A SYSTEM OF GMP RELATED STANDARDS
GMP is a big and complicated field. To design plant, select equipment and to arrange manufacturing we must know how to do it. Normally standards should give necessary instructions. But GMP is a general guide and has many instructions like make it appropriate way or equipment should suit its intended purpose. These phrases have no technical sense. It is impossible to design anything according to them and to prove compliance. Real sense appears when general words are supported with detailed standards that have clear requirements for technical parameters. Such standards for pharmaceutical industry are almost absent. But without them we find ourselves in difficult and not clear area that is based on opinions, traditions etc. Opinion is not a real argument for design, proving budgeting expenses and conducting audits and inspections.
Here we see difference between pharmaceutical world and military, space, railway and other similar industries. These industries have numerous good detailed standards. These standards describe every requirement for equipment, processes etc with details. They really leave nothing to chance and to opinions. They are really much closer to GMP sense then pharmaceutical industry. The

36
reason is that the state invested a lot in development of standards for military and similar technologies. Pharmaceutical industry is in a worse position. Such picture is typical for most countries.
6.4 SYSTEM OF GMP STANDARDS
The next step is to develop a family of standards that will describe requirements for critical equipment, process, methods of validation etc. The scheme of such family of standards is shown on Figure 6.1.
Some of them already exist, for example standards ISO 14644 for cleanrooms and ISO 13408-1 Aseptic processing of healthcare products. Part 1. General requirements. Some of them exist but are overloaded with theory and cannot be used directly. ISO 11134 Sterilization of healthcare products. Requirements for validation and routine control. Industrial moist heat sterilization is the example. Such standards are to be replaced or supported by standards with practical methods for validation or performing other actions.
Technical Regulation National Standard GOST R 52249 (GMP)
Processes Cleanrooms Validation QA/QC, Personal and Equipment Documentation Sterilization Classification Equipment Quality assurance Garments Filtration Design Aseptic and Documentation Training Freeze-drying Test methods other processes Risk analysis Behavior and Solid forms Operation Cleaning Quality control hygiene Non-sterile liquids Biocontamination Analytical methods Ointments Isolators GAMP Water treatment HVAC Others Others Others
Figure 6.1. Proposed system of Russian GMP standards.
Some important items are not covered by existing standards. Equipment for solid forms manufacturing, freeze-drying etc are examples. ISPE Baselines give good

37
information but it is not enough. We decided to create a family of standards for equipment and processes. The first standard is Manufacturing of Medicinal products. Processing equipment for manufacturing of solid forms. General requirements. The draft is to be ready in autumn 2006. Drafts of three new standards which have been submitted for approval:
− Manufacturing of medicinal products. System of quality assurance. General requirements;
− Manufacturing of medicinal products. Documentation; − Cleanrooms. Garments. General requirements.
Of course, creating of whole family of GMP standards is a huge work. International co-operation can give good result.
6.5 QUALITY ASSURANCE STANDARD
ISO 9000 family of standards came to Russia earlier then GMP. GMP describes Quality assurance problem rather shortly and with general words. So some manufactures of medicinal products started implementation of ISO 9000 and even received certificate on compliance to ISO 9000. Soon it became evident that some holders of ISO 9000 certificate are leaders on product recalls from the market, i. e. they have poor quality of products. We studied the problem from different sides and understood that it has common roots for any industry. We receive a lot of products with ISO certificates from different countries. And these products sometimes have poor quality. Devices may have faults because of cold welding of chips, materials may not match the orders etc.
ISO 9000 describes only Quality management system. Quality management system according to ISO 9000 includes documentation, responsibilities, analysis, management of resources (human, infrastructure, process media for process some 10 general words), life cycle processes etc. All this is described very general way and in some artificial language that has no real sense and should be translated into normal language. Excellent analysis was done by Kit Sadgrove [1]. He made translation of ISO 9000 from artificial language into normal English language. The result was a very simple text that consisted of well-known recommendations like how to cross the road. But the worst is that ISO 9000 does

38
not focus attention on such key elements of Quality assurance as Good materials, Good equipment and processes and Good executive discipline. Documentation, responsibility, analysis etc are only words without this.
Many people trust ISO 9000 label. Many of us have seen label ISO 9000 certified on different products but almost nobody have paid attention to the note with small letters: Quality management system. Sometimes such note is absent. People think that words Compliance to ISO 9000 and Good product are equivalent. But it is not so! There are several myths around ISO 9000.
− Myth 1: If product has ISO certificate this is a good product. Comment: Compliance to ISO 9000 means that manufacturer has documented Quality management system that assures processing of products according to pre-determined requirements. But what if these requirements are old or simply bad? What if the manufacture has a perfect documented system but poor equipment and poor executive discipline? ISO 9000 certification body will not see these substantial disadvantages and manufacture will obtain certificate.
− Myth 2: Quality assurance system is complicated. Manufacturer cannot create it himself. It is necessary to invite experienced consultants who will write necessary documents. Comment: It is not true. Only manufacturer can create really working and useful Quality system for himself, asking, if necessary consultants for advice. The reason of this myth is lack of good guideline for creating Quality management system.
− Myth 3. Quality management system requires great mounts of paper, including big quality manual. Comment: It is not true. Nobody reads great mounts of paper. Quality management system has several levels. Upper level is Quality manual (or Information about the plant). This document should not exceed 20 pages. All other levels are to be user oriented and include only necessary information with references.
− Myth 4. ISO 9000 system is an achievement of progress. It is necessary to study it for a long time. Comment: Actually ISO 9000 is a set of well known and simple rules, but they were written unclear way.

39
Industry needs special standard that should cover all key elements of Quality assurance. This standard should be detailed enough to understand the matter, to provide quality and to give criteria for estimation of quality system. It should be written in simple and clear way by people who really know manufacturing process and have personal experience of work in industry. For this we prepared Russian standard Manufacturing of medicinal products. System of quality assurance. General requirements. It covers main topics of the problem and offers practical recommendation how to arrange and check Quality assurance system. The Standard has 13 chapters and 9 Annexes:
1. Scope 2. Normative references 3. Terms and definitions 4. Quality assurance system: 4.1 Purpose; 4.2 Principles of Quality
assurance; 4.3 Structure of Quality assurance system; 4.4 Information about the plant; 4.5 Organizational chart; 4.6 Management of the plant; 4.7 Quality assurance and quality control; and 4.8 Quality policy
5. Materials 6. Production 7. Quality control and release of finished product 8. Quality assurance at the creation stage of facility: 8.1 General; 8.2
Design qualification; 8.3 Installation qualification; 8.4 Operational qualification; 8.5 Performance qualification; and 8.6 Premises, equipment and processes that are subject for qualification
9. Personal: 9.1 General; 9.2 Requirements for personal; 9.3 Training of personal; 9.4 Qualification of personal; 9.5 Responsibilities of personal; and 9.6 Requirements for health
10. Execution Control 11. Risk analysis at critical control points 12. Stages of creating Quality assurance system 13. Auditing and inspections Annexes: A Information about the plant; B Quality policy (example);
C Materials; D Preparing and execution of orders (contracts); E Management of production process; F Management of execution control; G Stages of creating Quality assurance system (example); H Recommendations for Auditing and Inspection to meet GMP requirements; and I Checklist for Auditing and Inspections.

40
6.6 DOCUMENTATION
The next standard is Manufacturing of medicinal products. Documentation.
It describes organizational and technological documents and offers examples of documents:
− specifications for materials, − specifications for intermediate and finished products, − in-process labels, − instructions or procedures (SOPs), − batch records.
Standard gives also recommended list of instructions (SOPs).
6.7 GARMENTS
The Standard Cleanrooms. Garments. General requirements describes the issues:
− Classification of garments depending on area of use, − Requirements for different items of garments, − Requirements for marking, packaging and storage, − Handling of garments, − Laundries, − Repair of garments, − Testing.
6.8 TERMS AND DEFINITIONS
GMP standards use several terms with one and the same meaning, for example such terms as validation, verification, qualification, testing. All these terms really mean confirmation of compliance to specified requirements. One can hardly find technically clear differences in these terms. Such non-clear differences (or absence of differences) create difficulties when translating terms into other languages. Sometimes people try to find hidden sense that is actually

41
absent in these terms. Probably it is time to suggest one term and to add additives to it depending on circumstances.
Discussion on terms is out of scope of this presentation. But it is worth to discuss term quality. This is really a key term. Important point of departure is that term quality has different senses for market and for manufacture. For market and customers quality means somewhat like degree of excellence or product must fit for intended use. The sense of these definitions is more lyrical and philosophical then technical. For purpose of manufacturing fitting for intended use must be described by technical parameters with numbers or words that can be implemented into technology and tested. Requirements are to be specified clearly and in full and must be included in specification. It is possible to arrange proper production process and prove that product has expected quality only in this case. So for purpose of manufacturing term quality means compliance to specification. Considering this point Quality assurance system can be constructed in clear and comprehensive way.
6.9 REFERENCE
ISO 9000 BS5750. Made easy. A practical guide to quality. Kit Sadgrove, England, 1994.

42

43
CHAPTER 7: PARAMETRIC RELEASE OF STERILE PRODUCTS REQUIREMENTS,
IMPLEMENTATION AND BENEFITS
Didier Meyer GETINGE La Calhene, Vendôme, France
7.1 GENERAL CONSIDERATIONS
The last control of an aseptic processed medication is the sterility testing which requires 14 days of incubation which means 14 days of quarantine after the production. Some of the aseptic processed medications have to be immediately or shortly after production administrated to the patient. In this case Sterility Testing is not possible and has to be replaced by another mean of quality system such as a Continuous Quality System. This is the case for the centralized preparation of injectable anti-cancer drugs which is characterized by:
− Manual aseptic repetitive protocols with potent drugs − No possibility of Sterility Testing.
This leads to:
− Work in a limited space: a bio-decontaminated leaktight isolator located in a class ISO 8 room
− The system includes three linked parts: o A lock chamber to introduce and bio-decontaminate individual
preparations in nominative baskets o A double sided working section o A dynamic throughput for off-loading the reconstitutions and the
baskets

44
which is not a totally safe solution:
o « Barrier isolators cannot prevent contamination caused by GMP deficiencies such as poor aseptic procedures and inadequate training of operators » (The Gold Sheet, Vol. 32, No. 10, Oct.1998)
It requires a constant knowledge of the process. The 21st century FDA cGMP gives the opportunity to improve both productivity and quality:
− Accepts and recognizes the need for new manufacturing science − Recognizes the importance of quality enhancement programmes:
o HACCP Risk Analysis o Parametric Release o Process Analytical Technology (PAT)
− Describes aseptic processing advancements: o Blow Fill & Seal (BFS) o Isolators.
The first step of the risk assessment is to identify the critical control points from the diagrams of work flows:
− Pin-point areas of greatest risk − Examine potential sources of contamination − Rank occurrence and severity − Establish alert and action levels.
The second step is to organize a follow-up of these values and then to correlate them with the theoretical ones which have been demonstrated during the qualification/validation periods. One way to do it is to use the Process Analytical Technology (PAT) as a tool.
7.2 WHAT IS PAT?
It is a system for analysis and control of manufacturing processes based on timely measurements during processing, of critical quality parameters and performance attributes of raw materials, in-process materials and processes to assure acceptable end-product quality at the completion of the process. PAT

45
provides an opportunity to move from Testing to Document Quality paradigm to Continuous Quality Assurance paradigm that can improve our ability to ensure the quality and implement the spirit of cGMPs Risk Assessment.
In our case: As for aseptic processing no reliable rapid microbiological testing is yet available and as microbiological monitoring according to USP<1116> gives delayed results, we have to rely on correlated physical measurements. What are the risks and where are they from to produce a potent compounding in an isolator system?
− Airborne viable and non viable particles: o Isolator leaktightness o HEPA filters o Continuous Egress o Improper biodecontamination
− Surface viable and non viable particles: o Improper biodecontamination o Leaks on gloves o Improper transfer systems o Transfer of non sterile components
− Improper handling o Waste of product producing aerosols o Mishandling in DPTE® transfers o Bio-contamination of the continuous egress.
Why is applicable the use of PAT principles to this type of installation?
− Isolator is a defined leaktight space − Its atmosphere is bio-decontaminated:
o Physical data of the process are available o The process has been validated by a Spore Log Reduction of 106
− Its air classification can be checked: o Quality of the HEPA filters o Flow rate o Particulate counting
− Its glove system can be controlled at work (GLT system)
46
− Its RTPs, DPTE®s systems can be checked before and after use − Its continuous Egress system can be validated − Program Logic Controller automatizes the steps of process/control − The whole process is validated by a Media Fill Test (aseptic filling
simulation test) during which physical data are correlated with the proper use of the system and microbiological monitoring
− NOTA: Media Fill Test and Validation of bio-decontamination are done once/year.
PAT is used as much as possible during the process but some values can only be taken before and after it to show that the equipment still fits in the acceptable criteria after the production.
7.3 BEFORE AND AFTER THE PROCESS
Before and after the process the must important feature of an isolator is its leaktightness according to ISO 10648-2:
− Classification of enclosures according to their leaktightness − Intended for « sensitive products requiring a special atmosphere and/or a
sterile medium » i.e. applicable for the isolators (0.1 to 0.5% of the volume/h of leak for Class 2 & 3).
Thanks to a PLC measurement, the value of 0.5% is checked before and after each bio-decontamination of the lock chamber and once a month before and after the bio-decontamination of the working station. The segregation of the inside of the isolator from its surroundings is done through HEPA filters. An Emery test is done twice a year to check the efficiency of 99.997% at 0.3 µm. The bio-decontamination of the lock-chamber and the working station isolator are validated with a spore log reduction at 106. The values of its stepwise process are:
− Control of the initial rH & T°C
− Control of concentration of H2O2 in all the phases: o Dehumidification o Injection/conditioning o Sterilisation o Purging

47
− Control of the final consumption of the 35% liquid H2O2 and its concentration as a vapour.
The alpha part and the beta part of the Rapid Transfer Port DPTE® transfer system are tested with a leak rate measurement, the value of which is 1000 times less than the one of the isolator. For the DPTEBetabag® the value before the use is given with each bag from the manufacturer. In this very installation the inlet of HEPA filtered air has a double reversed Y function: one part of the air allows to keep the air positive pressure with a defined speed in the working station and another part is pushed outside of the dynamic airlock to avoid any return of contaminated air in the working station. The dynamics of these flows are validated within a filmed smoke test.
7.4 DURING THE PROCESS
The main value to introduce in a PAT system during the process is the positive pressure of the isolator which shows that no ingress of return airborne contamination occurred. Particulate counting is done on a continuous basis giving a constant classification of the workstation and showing that the inlet HEPA filter is working properly. Air flow and air speed are constantly measured enhancing the classification of the working area. Gloves installed on a wrist glove ring are tested at work on a timely regular basis with a detection of a 40 µm diameter hole with the GLT oxygen concentration system. The frequency of control depends upon the risk assessment of the work place. In this case it is done twice a day. In conclusion we can say that the consolidation of the figures before, during and after the process gives a good picture of how the system is working to provide to the patient a sterile product even when no sterility testing is possible:
− Risk assessment & PAT improve the knowledge and the follow up of a process
− In-process physical measurements give instantaneous status of the expected quality
− The use of PATs principle for isolators lowers the burden of QC workload − PATs « parametric release » is realistic as isolator is a leaktight volume
with defined unmanned manipulation systems and reliable transfer systems

48
− Constant monitoring of concentration of H2O2 vapour inside and outside of the isolator with appropriate probe brings safety to the operators.

49
CHAPTER 8: PLANNING CONSIDERATIONS OF A HVAC SYSTEM FOR STERILE PHARMACEUTICAL
PRODUCTION
Jouko Miesvirta Elpis Oy Ltd, Turku, Finland
The origin of airborne particles in the cleanroom will be explained and how to avoid the existence of airborne particles in the cleanroom. Also, an overall example of particle generation caused by human activity in the cleanroom will be presented. The importance of process knowledge in the cleanroom design and the basic phases of the processes will also be discussed. The most important standards in sterile cleanroom design will be explained. Cleanliness instruction classes for different types of cleanrooms will also be presented. The primary design criteria for the HVAC construction to maintain proper air quality and for lowering the air conditioning operating costs in the cleanroom will be shown. Explanation for the unidirectional air flow and the mixed air flow distribution and the difference, disadvantages and benefits between them will be explained. Also, the difference between the circulated and fresh air system will be explained and the environmental conditions under which the Fresh air system must be used. The HVAC requirements for the materials of the cleanroom for good air-flow patterns, proper maintenance and quality level will be presented. All the main materials and constructions will be examined from the point of view of sterile cleanroom design. Description of Static electricity and how it will influence airborne particles will be explained. Methods to minimise the forces of the static electricity in a cleanroom environment will also be shown. The basic requirements for the pharmaceutical cleanroom control and monitoring system will be explained. The cleanroom design criteria for the validation of the cleanroom, control system and devices located inside the cleanroom area will be presented. Methods of air-flow system balancing and sanitising will be explained. The explanation for the maintenance operations of the environment of the sterile cleanroom will also be explained.

50

51
CHAPTER 9: QUALIFICATION PROCESS OF A NEW PHARMACEUTICAL FACILITY
Gordon Farquharson Bovis Lend Lease Ltd, Elstead, Surrey, U.K.
9.1 INTRODUCTION
This study using real life examples is presented to illustrate all the key steps involved in the qualification of a cleanroom facility for the manufacture of medicinal sterile products. It will deal with some general philosophies and look in some detail at some specific tasks. In the available time it isnt possible to deal with the whole process in detail. Qualification stages are the specific activities involved in a validation programme for a facility. The purpose of the validation as a whole and the qualification stages is to demonstrate and confirm successful operation. If we use qualification to discover problems and failure, then we have failed in our engineering responsibility. Qualification can only be built on effective Good Engineering Practice (GEP). No amount of validation effort can correct poor design! GMP and GEP are GBP (Good Business practice). The established standard validation steps are:
− The validation plan (a living tool) − Design qualification OR Enhanced design review − Installation qualification − Operational qualification − Performance qualification.
We will not spend too much time on these standard steps. Detailed regulatory requirements can be found in Annex 15 of the EU GMP. We have seen over the last 5 years huge pressure to reduce the time & cost of the qualification effort. This has given rise to several Right First Time initiatives including, in particular, integrated commissioning & qualification (I-C&Q). This approach essentially aims to carry out certain inspections & tests once, then send the data to the relevant commissioning & validation files. We can also be even cleverer and

52
integrate some safety system qualification into the same time & cost saving process. Good examples of integrated safety and quality qualification can be achieved with unit operations such as sterilisers. The vendor will usually have an important role to play. However, we still have to remember that from a regulatory perspective, sterile products represent the highest risk and will thus be subject to the greatest scrutiny. The case study will focus on an antibiotic parenteral powder filling facility. The product is aseptically filled into vials from kegs of bulk sterile API. During the case study we will look at the following key activities:
− The Enhanced Design Review or Design Qualification. − Integrated Commissioning, IQ & OQ. − OQ testing of the cleanroom areas and clean zones.
9.2 A LOGICAL SEQUENCE OF WORK
The sequence of reviews, inspections & tests must be logical to ensure maximum value of each activity, and to avoid abortive work. The following sets out a tried and tested approach that can be used to advantage. The final range of tests used in any particular application must be related to the specific installation and the regulatory environment prevailing.
1. Design Qualification DQ 1 & DQ 2 DQ 1 should be executed on a well defined design concept and DQ 2 on detailed design or vendors proposals. The DQ process should be controlled by a structured protocol and should address all the systems and elements deemed to be direct impact. It is best conducted as a peer review process undertaken in a workshop format. It is not intended as an engineering QC check. Such checks would be part of the GEP design QC. At the completion of DQ 2, there should be a set of frozen design drawings and specifications defined, This a good time to start change control.
2. Contamination controlled construction process
3. Quality controlled construction process
4. Ducting leakage testing The application of an in-situ leakage rate test to ensure that the system does not leak excessively. This test cannot easily be used on air handling units and filter housings. These must be tested at the manufacturers works.

53
5. Enclosure integrity by inspection or leakage testing Generally it is only possible to carry out a pressure hold or leakage rate test on very small clean rooms, enclosed clean air devices, or isolators. There are no specified or commonly accepted standards to use for setting acceptance criteria. However from experience one should anticipate a leakage in the order of 1 to 2 air changes per hour equivalent for a typically constructed clean room. Where processes such as fumigation are deployed or containment of hazards is a requirement, then much lower leakage levels may be required.
6. Instrument and control device functional testing and calibration Before loading software and setting controls into operation, it is valuable to test the integrity of wiring and function of each sensor and actuator to prevent wasted effort due to trying to set up incomplete installations.
7. Controls software installation and parameter setting GMPs accept the principle that BMS controls systems can be designed and installed to GEP provided that critical parameters are monitored with a validated facility monitoring system.
8. Air balancing to set correct system air volumes Undertaking a careful proportional air balance using a pitot tube in duct or balometer at the air terminal will ensure that each terminal passes the correct relative air volume. This should then be followed by adjustment of the system or sub-system total volume.
54
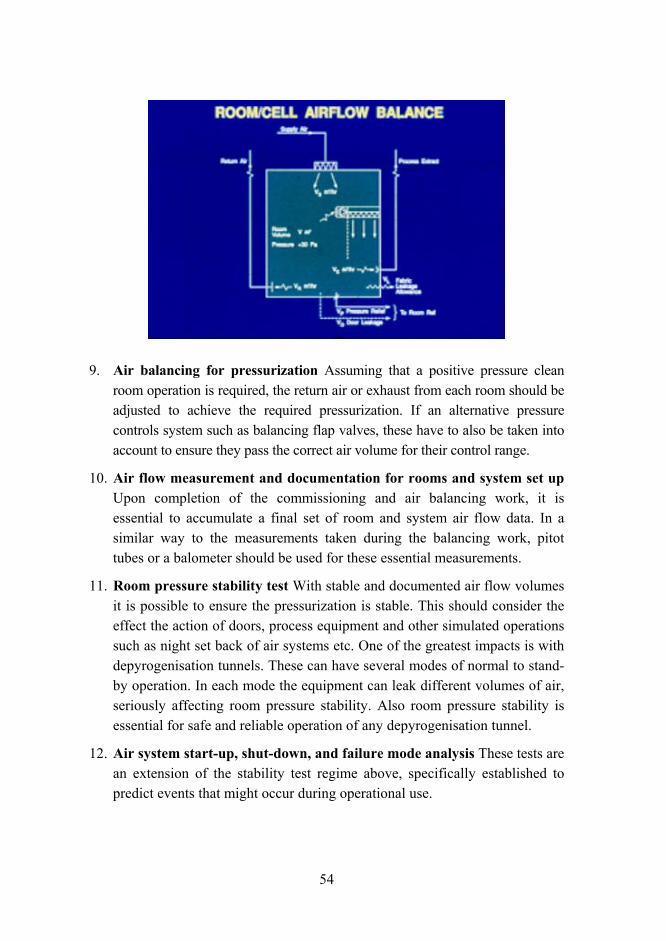
9. Air balancing for pressurization Assuming that a positive pressure clean room operation is required, the return air or exhaust from each room should be adjusted to achieve the required pressurization. If an alternative pressure controls system such as balancing flap valves, these have to also be taken into account to ensure they pass the correct air volume for their control range.
10. Air flow measurement and documentation for rooms and system set up Upon completion of the commissioning and air balancing work, it is essential to accumulate a final set of room and system air flow data. In a similar way to the measurements taken during the balancing work, pitot tubes or a balometer should be used for these essential measurements.
11. Room pressure stability test With stable and documented air flow volumes it is possible to ensure the pressurization is stable. This should consider the effect the action of doors, process equipment and other simulated operations such as night set back of air systems etc. One of the greatest impacts is with depyrogenisation tunnels. These can have several modes of normal to stand-by operation. In each mode the equipment can leak different volumes of air, seriously affecting room pressure stability. Also room pressure stability is essential for safe and reliable operation of any depyrogenisation tunnel.
12. Air system start-up, shut-down, and failure mode analysis These tests are an extension of the stability test regime above, specifically established to predict events that might occur during operational use.
55
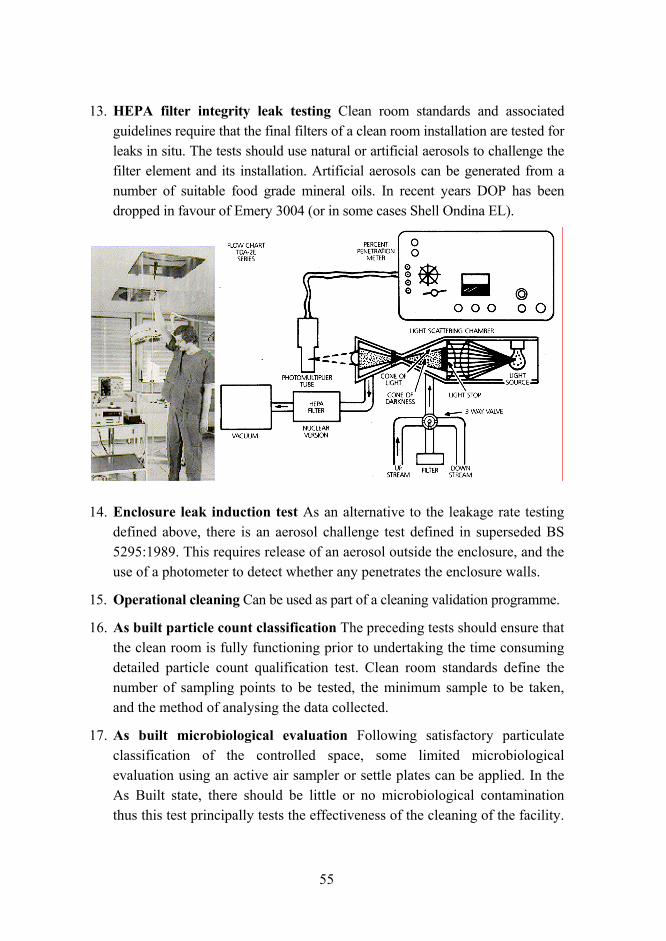
13. HEPA filter integrity leak testing Clean room standards and associated guidelines require that the final filters of a clean room installation are tested for leaks in situ. The tests should use natural or artificial aerosols to challenge the filter element and its installation. Artificial aerosols can be generated from a number of suitable food grade mineral oils. In recent years DOP has been dropped in favour of Emery 3004 (or in some cases Shell Ondina EL).
14. Enclosure leak induction test As an alternative to the leakage rate testing defined above, there is an aerosol challenge test defined in superseded BS 5295:1989. This requires release of an aerosol outside the enclosure, and the use of a photometer to detect whether any penetrates the enclosure walls.
15. Operational cleaning Can be used as part of a cleaning validation programme.
16. As built particle count classification The preceding tests should ensure that the clean room is fully functioning prior to undertaking the time consuming detailed particle count qualification test. Clean room standards define the number of sampling points to be tested, the minimum sample to be taken, and the method of analysing the data collected.
17. As built microbiological evaluation Following satisfactory particulate classification of the controlled space, some limited microbiological evaluation using an active air sampler or settle plates can be applied. In the As Built state, there should be little or no microbiological contamination thus this test principally tests the effectiveness of the cleaning of the facility.

56
Challenging the As Built state can be justified primarily to release a clean room supplier or contractor from a contract obligation prior to the user installing the equipment or process systems.
18. Installation of equipment
19. Operational cleaning Can be used as part of a cleaning validation programme.
20. Air flow visualisation For critical zones such as those associated with Grade A unidirectional flow, or other directionally critical flows, the use of smoke or aerosol visualisation tests can prove very effective. When used in conjunction with video recording techniques, a valuable record of the performance of a system can be made.
21. At rest particle count classification Repeat of the As Built test with equipment installed. This state introduces the physical obstructions of the equipment without the operational contamination generation effects.
22. At rest microbiological evaluation This test should follow the As Built methodology focused on the areas which the particle count analysis suggests is the most difficult clean.
23. In operation particle count classification With the advent of the proposed changes to the EC GMP vol. IV Annex 1, in particular the focus on In Operation particle counts, a detailed analysis of the particulate classification is required.
24. In operation microbiological evaluation The EU GMP demands for definition of the In Operation state also apply to microbiological contamination evaluation.
25. Particle decay rate test or recovery test This test provides a mechanism for demonstrating the capability of the air movement system to dilute and remove contamination in the clean room. For a well designed turbulent flow clean room, a recovery time of 10 to 15 minutes should be expected for the particle concentration to fall from the In operation to the at rest level. The decay rate test provides a finger print of the clean room capability.
26. Evaluation of results and setting of operational NORMAL ALERT ALARM levels.
27. Determination of ongoing routine testing/evaluation approach A new installation should be subjected to critical review after the first year of operation to take stock of the success and problem aspects of its functioning.

57
It is important to remember that the complete facility system is effectively a prototype. The knowledge gained from successful operation will enable service intervals, alert and action levels to be refined.
9.3 REFERENCES
1. ISO 14644-1: 1999 Cleanrooms and associated controlled environments. Part 1: Classification of air cleanliness.
2. ISO 14644-2: 2000 Cleanrooms and associated controlled environments. Part 2: Specifications for testing and monitoring to prove continued compliance with ISO 14644-1.
3. EUDRALEX Volume 4 Medicinal Products for Human and Veterinary Use: Good Manufacturing Practice. Annex 1 (May 2003 revision) Manufacture of sterile medicinal products.
4. FDA Guidance for Industry. Sterile Drug Products Produced by Aseptic Processing Current Good Manufacturing Practice.
5. EMeA European Medicines Agency. http://www.emea.eu.int.
6. Eudralex The EC Website http://pharmacos.eudra.org/F2/home.html.
7. PIC-S Pharmaceutical Inspection Cooperation Scheme. http://www.picscheme.org.
8. ISO 14644-4: 2000 Cleanrooms and associated controlled environments. Part 4: Design, construction and start-up.
9. ISO 14644-3 Cleanrooms and associated controlled environments. Part 3: Metrology and test methods.

58

59
CHAPTER 10: MICROBIOLOGICAL QUALIFICATION OF PHARMACEUTICAL CLEANROOM FACILITIES
Gerry Prout Kennet Bioservices, Stratton St Margaret, Wiltshire, U.K.
The presentation describes the activities that are necessary to qualify pharmaceutical cleanrooms for the manufacture of sterile medicinal products. The word qualification has been used in place of validation, as the author believes that validation should be retained for processes only. In a pharmaceutical cleanroom there are many functional attributes that contribute to qualification. These include the HVAC system, the manufacturing equipment, surfaces and finishes, personnel and product components and the product.
In the EU Guide to GMP (volume 4 Eudralex), the stated principle for Sterile Medicinal Product manufacture is The manufacture of sterile products is subject to special requirements in order to minimise risks of microbiological contamination, and of particulate and pyrogen contamination. Much depends on the skill; training and attitudes of the personnel involved Quality Assurance is particularly important, and this type of manufacture must strictly follow carefully established and validated methods of preparation and procedure. Sole reliance for sterility or other quality aspects must not be placed on any terminal process or finished product test.
Qualification is a stepped process comprising of a User Requirement Specification (URS), Design Qualification (DQ), Installation Qualification (IQ) and Operational Qualification (OQ). The major activities from the microbiological standpoint arise during OQ. The considerations prior to the preparation of the URS will include, inter alia, a risk assessment of microbiological implications. The paper in three sections -deals with: 1) Microbiological Risk Assessment in the URS, 2) Microbiological Activities during QC and 3) On-going surveillance Qualification during routine sterile product manufacture.

60
THE SECTION ON MICROBIOLOGICAL RISK ASSESSMENT INCLUDES:
1.1 Environmental classification 1.2 Suitability of HVAC system: Air flow patterns, Pressure differentials,
Operational at rest conditions & Operational activities
1.3 Suitability of equipment: Product contact surfaces, Walls, floors, ceilings, Gowning and auxiliary areas & Non product contact materials
1.4 Assessment of cleaning/disinfection: Cleaning/disinfecting agents, Cleaning equipment & Wet/dry cleaning.
THE SECTION ON MICROBIOLOGICAL ACTIVITIES DURING QC INCLUDES:
2.1 Definition of and compliance with Environmental Specification: EU Annex 1, FDA Sterile drug products produced by aseptic processing & ISO 14644
2.2 Cleaning and disinfection: Bactericide, sporicide, virucide and fungicide, Solutions, Gaseous formaldehyde and hydrogen peroxide & Equipment
2.3 Frequency of testing: In operation, At rest, Every shift & Every operator
2.4 Documentation: Protocols, Results, Reports & Associated documentation
2.5 Process simulation testing (media fills): Three consecutive successful tests, Risk to product process, Endotoxin testing & Sterilisation process validation (Autoclave / Oven / Tunnel).
THE SECTION ON ON-GOING SURVEILLANCE QUALIFICATION INCLUDES:
3.1 As described in Annex 1
3.2 Activities in OQ
3.3 Test at least every day (every shift): Active air samples, Settle plates, Swabs or contact plates & Glove prints.
OTHER SYSTEMS
3.4 Water 3.5 Filtration.
61
CHAPTER 11: CLEANING AND DISINFECTION AGENTS OF PHARMACEUTICAL CLEANROOMS MODES OF ACTION, USAGE AND REQUIREMENTS
Karen Rossinton Shield Medicare Ltd., Farnham, U.K.
The manufacture of sterile pharmaceutical products is governed in the European Union by the requirements of EU Good Manufacturing Practice for Medicinal Products. The CGMP guide gives very specific details on the environmental and microbial requirements for aseptic processing. However, little or no guidance is given on how to create and maintain the correct level of microbial contamination in the aseptic suite.
The relevant information regarding disinfection in EU GMP and FDA Guidance on Aseptic Processing will be detailed. But the majority of the presentation will look at the different types of disinfectant available, their modes of action and their advantages and disadvantages.
Traditional disinfectants, such as alcohols, quaternary ammonium compounds, phenols and amphoteric surfactants are effective against bacteria in their vegetative state but useless against spores. Biocides that have sporicidal activity, including aldehydes, hypochlorites and hydrogen peroxide/peracetic acid blends are often toxic, irritant, corrosive, leave residues or need a long contact time (Table 11.1).
Whilst efficacy is important it is also crucial to consider the specification of the disinfectant. A disinfectant may be required in a range of presentations to be ideal for use in a cleanroom environment. Large areas may require concentrates for use with a mop and bucket system or a format suitable for fogging. Critical areas will need ready to use sprays or presaturated impregnated wipes. Presaturated wipes are especially useful in very critical areas, such as isolators and laminar flow cabinets, which may have areas where liquid can collect and is difficult to remove. Large, impregnated mop wipes also make short work of disinfecting cleanroom ceilings,

62
walls and floors. The presentation will discuss how the use of different application techniques can affect the overall efficacy of the disinfectants used.
Table 11.1. Comparison of the chemistry and efficacy of disinfectant agents.
Disinfectant Mode of Action Bactericidal Fungicidal Virucidal Sporicidal
Chlorine Dioxide
/Quat Blend
Cell membrane disruption. Oxidisation
causes enzyme and structural protein
damage.
Excellent Very Good Very Good Excellent
Quaternary Ammonium Compound
Disrupts cells membrane. Releases
nitrogen and phosphorus from cells
Excellent Good Good Very Poor
Phenolic Compounds
Disrupts cell walls. Precipitates cell
proteins. Very Good Poor Very
Good Very poor
Hydrogen Peroxide/ Peracetic
Blend
Disrupts cell walls Excellent Very Good Very Good
Very Good
Amphoteric Cell membrane disruption Very Good Good Poor Very Poor
Aldehydes Coagulates cellular proteins Very Good Good Good Very
Good
The decontamination process involves cleaning, disinfection and validation. This presentation will not cover validation as this will be discussed elsewhere but the actual process of liquid decontamination will be covered. The process is the same for both cleaning and disinfection. Disinfection does not replace cleaning, as a heavily soiled surface may interfere with the effectiveness of a disinfectant. Cleaning should therefore usually be undertaken prior to disinfection, or combined with it. A separate cleaning stage is more likely to be needed if there has been a spillage of a product or sample. If a detergent is used, a rinsing cycle must be included to remove any residue. Any detergent residue remaining will have an adverse effect on any disinfectant used. Rinsing can be carried out with Water for Injection (WFI), sterile purified or deionised water or sterile alcohol.
63
Due to the effect of biofilms, surface wiping is needed to assist in the removal of surface contamination. Wiping or moping should never be carried out in a circular motion as this causes the wipe/mop in its dirtiest state to be passed over an area which has just been cleaned. This point needs to be reinforced with operators, as a circular wiping pattern is the most comfortable and convenient according to Siegerman.
The correct technique is to wipe/mop, towards you, in straight horizontal lines, each time overlapping the previous one by 1025%. A contaminated wipe/mop should not be passed over an area that has just been wiped, unless in the case of a wipe it is folded and refolded to provide a clean surface. Usually quarterly folds are recommended but must be validated with each operator concerned, as a quarterly fold can lead to confusion as to which surfaces of the wipe have been used. In this case wipes folded in half should be used. Surface wiping or mopping should be carried out from top to bottom, from back to front and from cleanest to dirtiest. The wipe or mop itself should be constructed from a low particulate material. The presentation will conclude with some suggested rotational regimes for life science cleanrooms.

64

65
CHAPTER 12: DRY FOGGING AS A NEW TECHNOLOGY TO DISINFECT CLEANROOMS
Dominique Leclercq Minntech BV, Heerlen, The Netherlands
Europe is preparing a new Biocide Directive and the use of carcinogenic or mutagenic chemicals such as formaldehyde and phenols is going to be limited very soon. The Pharmaceutical Industry is now investigating ways to find sporicidal substitutes to those particular chemicals that often validated for clean room disinfections. Hydrogen peroxide/per acetic acid (HP/PAA) based chemicals show very attractive properties. What are the pharmaceutical manufacturers requirements? What is available on the market? What is the efficiency compared to current products? What are the possible applications? How to use the HP/PAA technology for clean room airborne disinfection? All these questions will be answered in the presentation.
Reference to the following article: Leclercq D. & Gray J. Alternative Disinfection. Cleanroom Technology Magazine, March 2004.

66

67
CHAPTER 13: CLEANING AND DISINFECTING OF CLEANROOMS A VALIDATION
Elaine Pears Ecolab, Sutton, Surrey, U.K.
As with any process carried out in a cleanroom operating to cGMP, cleaning and disinfection procedures must be clearly documented and validated. Parameters which must be defined in the protocol include:
T time of cleaning, contact time A action (mechanical) C concentration of cleaning chemical C cleaning chemistry T temperature used.
Microbial and physical validation of cleaning can begin with laboratory-based studies using coupons of appropriate substrates as the test surface. Worse case soils can be simulated for evaluation of physical cleaning efficacy, with visual or analytical evaluation of the end point. Microbial validation of disinfection efficacy can begin with simple test norms, e.g. EN 1276, EN 1650 or EN 13697.
In-situ validation must follow, to ensure that the parameters defined can be met in the practical situation. Scaling up of the validation includes establishing procedures for cleaning flow, cleaning equipment and cleaning frequency.

68

69
CHAPTER 14: OPTIMUM WIPER CHARACTERISTICS FOR THE CLEANING AND DISINFECTION OF
PHARMACEUTICAL CLEANROOMS
Howard Siegerman ITW Texwipe, Mahwah, NJ, USA
14.1 INTRODUCTION
The title of this presentation, while perhaps not generating breathless excitement, does deal with an important topic. The cleaning and disinfection of pharmaceutical and biotechnology cleanrooms especially aseptic fill areas are critical, no compromise activities. These important tasks are scheduled to occur between sequential manufacturing lots; in fact subsequent lots cannot be manufactured until the manufacturing equipment and the environment have been cleaned and disinfected and the cleaning activity has been validated. Wipers and by extension, mops are used for these cleaning and validation tasks and since they come into contact with critical manufacturing surfaces, it is important to understand which materials are optima for these activities. We want these procedures to be done efficiently, without undue labor, in a reasonable amount of time and with the assurance that the treated surfaces have been effectively cleaned and disinfected. If we examine the cleaning and disinfection activities needed for pharmaceutical cleanrooms, we can readily identify a number of key characteristics for wipers and mops:
− Optimum wiper characteristics − Form factors − Sterility − Cleaning − Disinfection − Optimum wiping techniques − Sterile pre-wetted wipers.

70
14.2 OPTIMUM WIPER CHARACTERISTICS
Wipers and mops used for cleaning and disinfection must withstand the necessary sterilization procedures to allow them to be used in sterile environments. These fabrics must also exhibit low levels of releasable particles and fibers, low levels of pyrogens, high levels of absorbency and durability, and compatibility with the aggressive chemicals used in cleaning and disinfection. The need to meet such a wide range of requirements often calls for the use of engineered, high-performance fabrics. In these cases, kitchen cleaning cloths will just not do.
Wipers and mops can be made of natural materials such as cotton, rayon, and cellulosics (paper), or synthetic materials such as polyester, nylon or polypropylene. Naturals and synthetics can be knitted, woven, or produced in a variety of non-woven forms. It is also possible to combine naturals and synthetics to produce new textiles. As an example, a fabric such as a hydroentangled polyester-cellulose blend combines the attributes of both natural materials (absorbency) and synthetics (cleanliness) in a low-cost substrate that can be tolerated Grade C and D pharmaceutical environments.
However, only polyester knit fabrics are found to be acceptable for the cleaning and disinfection of Grade A and B critical environments because these fabrics offer the lowest level of releasable particles and fibers as well as the ability to meet all of the other requirements listed above (1). Since particles are potential transport vehicles for bacteria, it is important to use fabrics that have the lowest levels of releasable particles in critical environments.
Other fabrics that might be considered are found to be deficient in one or more critical parameters. As examples, nylon and polypropylene are both man-made substances, but the former suffers from higher bioburden and cost when compared to polyester knits and the latter is difficult to wet with aqueous solutions. To better understand the advantages of polyester knits, we present a comparison of the fabric construction and particle levels of two wipers a high-quality, sealed-border, laundered, polyester knit wiper (used for Grade A and B environments) and a lower-quality hydroentangled polyester-cellulose blend wiper (used for Grade C and D environments).

71
Figure 14.1. Scanning electron photomicrograph of a polyester knit wiper.
Figure 14.2. Scanning electron micrograph of a blended polyester-cellulose wiper.
The details of fabric construction of the two wipers are shown in Figures 14.1 and 14.2. Figure 14.1, we observe that the polyester knit fabric is made of very clean, unbroken fiber bundles held together with interlocking loops. The open structure of the polyester knit provides the fabric with good absorbency characteristics. In Figure 14.2, we observe that the hydroentangled polyester-cellulose fabric is really a random array of entangled fibers and that some of these fibers appear to be dotted with particles. The suspicion that this fabric is dirtier than the polyester knit counterpart is borne out in Figure 14.3, in which the releasable large particles (5100 µm in size) of the two materials are counted using scanning electron

72
microscopic techniques (25). The hydroentangled product is some 15 times higher in releasable large particles (i.e. dirtier) than the polyester knit product.
Releasable Large Particles 5 - 100 µm
0.142
2.1
0.000
0.500
1.000
1.500
2.000
2.500
Polyester Knit Polyester-Cellulose
Sealed Border Hydroentangled Blend
Parti
cles
x 1
06 /m²
Figure 14.3. Comparison of sealed-border polyester knit wipers versus hydroentangled polyester-cellulose wipers for large particle release.
Polyester knit wipers are also dramatically cleaner than hydroentangled polyester-cellulose blends (6) if releasable small particle levels (0.55 µm) and releasable fibers (> 100 µm) are considered. Based on particle and fibers counts, polyester knit wipers are superior to hydroentangled polyester-cellulose blends by factors of 23 and 1290 for small particles and fibers, respectively.
How can polyester knit wipers be so much cleaner than the hydroentangled polyester-cellulose blend? The fabric structures in Figures 14.1 and 14.2 give some clues; the balance lies in how these two fabrics are processed. Polyester knit wipers are made exclusively from man-made materials that are extruded to provide unbroken filaments, kilometers long, that are clean, continuous, very strong, with little tendency to shed loose material. On the other hand, polyester-cellulose blends are blended from short staple fibers that are only held together in a hydroentangling process and that can shed loose material. As can be seen, these fabrics also carry a substantial load of particles. When wipers of any fabric are cut to size, loose fibers are generated that can reside on the wiper and subsequently contaminate wiped surfaces. Cutting a polyester fabric necessarily severs the interlocking loops at the edge of the wiper. To avoid the release of loose fibers from this operation, the edges or borders of the wiper are often sealed during the cutting operation. Such a sealing process is not possible with hydroentangled polyester-cellulose blends.

73
Polyester knit wipers get an added edge in cleanliness because they can be laundered. This process removes knitting oils, soils and drastically lowers particle and fiber levels. It is not feasible to launder blended hydroentangled polyester-cellulose wipers. Thus we see that for wiping (or mopping) procedures in critical environments, polyester knit wipers (preferably sealed border) are the best choice.
14.3 FORM FACTORS
Wipers are used to clean surfaces within arms reach. This would include equipment, bench tops, workstations, furniture, minienvironments, etc. Ideally, the wiper, when quarter folded, will fit into the operators gloved hand, with little overlap. This is based on the assumption that only the fabric that is held and pressed against the surface will be truly effective in cleaning and disinfection. Wipers that are overly large are wasteful of fabric, are not cost-effective and are awkward to handle.
Mops are used for cleaning large surface areas and surfaces beyond arms reach, such as walls and floors. Mop heads can be made from the same fabrics as used for wipers. As might be expected, for the most critical cleaning applications, mop heads made of polyester knit material should be employed. Also, flat surface mops are recommended over string mops because flat surface mops can be used for both walls and floors.
14.4 STERILITY
Any consumable that is introduced into a sterile environment must itself be sterile. Therefore, wipers and mops used to clean and disinfect aseptic areas must be subjected to some sort of sterilization process to kill the bacteria present on the fabric, such that after sterilization, there is a probability of non-sterility of only 1 part per million. Expressed another way, this means that after sterilization, only 1 wiper in 1 million may be non-sterile. This is also described as a Sterility Assurance Level (SAL) of 106. Typically, wiper manufacturers use gamma irradiation to sterilize wipers because it is quick, efficient, reasonably inexpensive and leaves no residue. Compared to electron beam irradiation, gamma irradiation reduces substrate endotoxin levels to a greater
74
extent and has better substrate penetration. Suppliers validate their sterile wipers using procedures developed by the Association for the Advancement of Medical Instrumentation. This includes determining the bioburden of the wipers prior to sterilization, determination of the appropriate radiation dose level, exposure of 100 wipers to subdose levels and verification that fewer than 2 of those 100 wipers are not sterile. Wipers are then sterilized at the full dose and are shipped with Certificates of Irradiation, describing dose levels, date, lot numbers, etc.
Pharmaceutical or biotechnology facilities that choose to sterilize wipers on their own generally do so by autoclaving, since an autoclave is generally available as are the resources to repackage wipers into autoclavable breather bags and validate the sterilization activity to the desired Sterility Assurance Level. Alternately, dry heat, liquid chemical treatment (e.g., bleach), gaseous chemical treatment (e.g. ethylene oxide) techniques can be used to sterilize wipers.
14.5 CLEANING
Surfaces should be cleaned prior to disinfection so that the disinfectant can be applied to bare surfaces and not have to penetrate through surface soils and drug residues. The cleaning process, therefore, removes soil loads and residues that would otherwise consume disinfectant and mitigate its application (7). Typically, detergents are most commonly employed for these cleaning applications. Detergent selection is based on the type of soil to be removed and cleaning mechanism factors such as wetting, dissolution, oxidation, hydrolysis, enzyme action, emulsification, deflocculation, sequestration, saponification and rinseability can all be important in determining which detergent to use (8, 9). Detergents also have the benefit of reducing the bioburden level on the surface; in a sense this lessens the task somewhat for the disinfection step which follows.
Wipers and mop heads used in cleaning should be highly absorbent to ease application of the large volumes of cleaning agent to the surface. In these instances, the fabric is being used simultaneous as an applicator to apply the cleaning solution and a wiper to remove the surface soil. Polyester knit fabrics can be made with very high absorbencies per unit weight, easing the task of applying the cleaning agents. The wiping of environmental surfaces and production equipment is not a gentle procedure and the durability of the

75
polyester knit structure ensures that the wiper will not disintegrate during the cleaning operation and that minimal fibers will be shed during the wiping process. Polyester knit fabrics have excellent resistance to cleaning agents, making them a natural choice for this task.
After cleaning, it is important that the surfaces be rinsed or wiped down with deionized water (DIW) or Water for Injection (WFI), or wiped down with wipers wetted with 70% isopropyl alcohol (IPA) solution to ensure that dried cleaning residues are removed and that the disinfectant be able to contact bare surfaces (10). Cleaning strategies and cleaning methods have been discussed by Cooper (11, 12). The bioburden, particle, extractable, abrasion resistance and absorbency characteristics of wipers used in pharmaceutical applications have been documented (13). Knit polyester wipers exhibit the best overall performance.
14.6 DISINFECTION
After the surfaces have been cleaned and rinsed, polyester knit wipers and mops are used to apply aqueous disinfectant or sterilant solutions such as sodium hypochlorite (bleach), quaternary ammonium compounds (quats), per acetic acid, hydrogen peroxide and phenols. Aqueous mixtures of IPA will provide some measure of disinfection, but they are ineffective against spores. As in cleaning, wipers used for aseptic areas are often heavily wetted, even saturated with the disinfecting agent. Applying an excess of the disinfectant solution allows for greater contact time, thereby maximizing the killing of any viable organisms resident on environmental or equipment surfaces. Cooper (14) provides guidance on using wipers to apply a uniform layer of disinfectant. As in the cleaning activities, the durability and chemical resistance of the polyester knit wipers are valuable in the application of disinfectant solutions. After the disinfectant has had time to kill any resident organisms, it is necessary to remove the dried disinfectant residue from the surfaces. This is especially important for floors, since foot traffic will generate airborne particles of disinfectant residue if it is not rinsed off or wiped off. The use of sterile polyester knit wipers with 70% IPA is recommended for removing disinfectant residues, since it will both act as a cleaner, provide some degree of further surface sanitization and will leave no residue.

76
14.7 OPTIMUM WIPING TECHNIQUES
Wipers and mops used for cleaning, disinfection and residue removal are used in a somewhat counter-intuitive fashion for best results and cleanest surfaces (7). Normally, one would consider wiping a work surface in much the same way as a kitchen counter is wiped in the home in circular strokes. Ergonomically, this is very comfortable and the motion can be continued for long periods of times without strain, but it is the worst technique from a contamination control perspective.
For best results, the quarter-folded wiper must be moved across the surface in linear strokes, with each succeeding stroke overlapping the previous stroke by about 1025% (Figure 14.4). The wiper must be re-folded after each stroke to expose a clean wiping surface. If the contamination is visible to the naked eye, or if one area is believed to be more contaminated than another, move the wiper from the cleaner (drier) area to the dirtier (wetter) area. As an example, wipe walls from ceiling to floor since floors are generally dirtier than ceilings, and wipe clean hoods from back to front since the back of the hood is cleaner because of the air flow.
Figure 14.4. Use linear, overlapping strokes to remove contamination.
At the beginning of the wiper stroke, the wiper is in its cleanest state. As it is moved over the surface it begins to accumulate contamination, and presumably at the end of the stroke, the wiper is in its dirtiest state. For this reason, the wiper must not be used to go over an area it has just wiped, unless it is refolded so as to make available a fresh wiper surface. Wiping in a circular pattern causes the
77
wiper in its dirtiest state to be brought back over an area that has just been cleaned. Users must be cautioned that the circular wiping pattern that is most comfortable and convenient is also the most contaminating.
Mops have their own unique set of requirements (15). Flat surface mops are deemed preferable to string mops in order to avoid the need to dispose of buckets containing dirty cleaning solutions or dirty rinse water. Changing mop heads frequently will prevent contamination of already cleaned surfaces. Use of linear overlapping strokes on floors will be tedious; compromising to an S shaped mopping pattern would make sense. The linear, overlapping stroke pattern should still be used on walls, however.
14.8 STERILE PRE-WETTED WIPERS
As the name suggests, these are cleanroom wipers that have been pre-wetted with the optimum amount of 0.2 um filtered solvent (typically 70% IPA solutions) to accomplish the cleaning task at hand. Further, these pre-wetted wipers are sterilized by gamma irradiation to a probability of non-sterility (Sterility Assurance Level) of 106.
Generally, sterile pre-wetted wipers are packaged in sufficient quantities to last just one shift, on the premise that any consumable opened during the shift will not be used in a subsequent shift. Enough wipers are packaged to fulfill the wiping or cleaning requirements of that shift, with few, if any, left over. This generally translates into 2050 pre-wetted wipers per package. The package is made from materials that will withstand gamma irradiation at the necessary dosage levels, and that can be opened conveniently to withdraw the pre-wetted wipers and closed (or resealed) to prevent evaporation of the wetting solution.
14.9 ADVANTAGES OF STERILE PRE-WETTED WIPERS
14.9.1 Contamination Control
These wipers, as delivered, are ready for immediate use to wipe down critical surfaces before, during, and after production shifts, inside and outside the sterile suite. Sterile

78
pre-wetted wipers provide a means of cleaning key surfaces and simultaneously removing particulate matter that can act as transport vehicles for bacteria. They are particularly useful for wiping down any articles brought into the sterile suite, to clean those articles and to physically remove endotoxins from surfaces.
Sterile pre-wetted wipers have been used for wiping down gloves to maintain glove sterility during sterile suite activity. This has the advantage of simultaneously cleaning the glove and as well, physically removing dead bacteria from the glove surface, thereby reducing or eliminating a potential source of endotoxins. Spraying gloves with 70% IPA solution may kill bacteria on the glove, but will not remove the dead bacteria. Sterile pre-wetted wipers have been found to reduce the incidence of false particle alarms caused by IPA spraying.
These wipers are also used to wipe down surfaces that have been contacted with environmental sampling devices such as Rodac plates, to remove residual agar. If this is not done, the agar on the sampled surface acts as a culturing medium for opportunistic bacteria.
14.9.2 Elimination of Squirt Bottles
When alcohol is dispensed onto a dry wiper from a squirt bottle, often excessive amounts of alcohol are used, since the operators gloves prevent tactile feedback to indicate the optimum amount of dampness.
Since sterile pre-wetted wipers incorporate the optimum amount of 70% IPA for contamination control activities, there is less alcohol used in the facility and there may be an opportunity to eliminate squirt bottles and the transfer of bulk solvent. This can represent cost savings in solvent expenses and in charges for volatile organic compound (VOC) emissions. Also, sterile pre-wetted wipers eliminate fugitive emissions from squirt bottle dispense nozzles and from alcohol transfer operations.
14.9.3 Convenience
It would be difficult, but not impossible, to prepare sterile pre-wetted wipers within the sterile suite. Users could follow these steps:
79
− Bring sterile dry wipers, packaging materials, graduated cylinders and sterile-filtered 70% IPA into the sterile environment,
− Transfer the required number of wipers into the solvent-resistant packaging, − Transfer the required volume of sterile-filtered 70% IPA from the
delivery container onto the wipers, − Then close the packaging to allow the IPA to thoroughly dampen the
wipers and prevent the IPA from evaporating.
Of course, all of the process steps would need to be documented and validated to satisfy regulatory audits. Also, this seems like a lot of manual effort, if only 20 to 50 sterile pre-wetted wipers are needed for the shift. Likewise, it would be difficult, but not impossible, to prepare sterile pre-wetted wipers outside of the sterile suite. One could follow the steps outlined above except that non-sterile wipers would be used. Once the package of pre-wetted wipers had been formed, the product would then be gamma irradiated and transferred into the sterile suite (Obviously, one would not autoclave pre-wetted wipers to try to render them sterile. The high temperatures within the autoclave would volatilize the 70% IPA solution through the packaging material and would create internal pressures within the package that could likely burst the package.). Now, bioburden measurements, sterility validation and package integrity testing would also be needed in addition to the usual documentation requirements.
It would appear that if one is going to employ sterile pre-wetted wipers, they are best purchased rather than made in-house. The vendor of these products takes full responsibility for the necessary bioburden measurements, sterility validation program, package integrity testing, certificates of compliance and irradiation and the process audit trail. Also, the vendor enjoys the economies of scale to provide a lower-cost product than could be made by the customer.
14.10 CONCLUSIONS
Who knew that there was so much technology associated with such a small piece of cloth?

80
14.11 REFERENCES
1. D. W. Cooper, Cleaning Aseptic Fill Areas, Pharmaceutical Technology, Feb. 1996.
2. H. Siegerman, Know Whats in Your Cleanroom Wipers, Parts 1 and 2, Cleanrooms, Nov. and Dec. 2004.
3. Evaluating Wiping Materials Used in Cleanroom and Other Controlled Environments, IEST-RP-CC004.3, Institute for Environmental Sciences and Technology, Rolling Meadows, IL, 2004.
4. Standard Test Method for Size-Differentiated Counting of Particles and Fibers Released from Clean Room Wipers Using Optical and Scanning Electron Microscopy, E2090-00, ASTM International, West Conshohocken, PA.
5. Size-Differentiated Counting of Particles and Fibers Released from Cleanroom Wipers Using Optical and Scanning Electron Microscopy, Test Method 15, ITW Texwipe, Upper Saddle River, NJ (1998).
6. H. Siegerman, Smart Consumables Usage in Cost-Conscious Environments (Wirtschaftlicher Einsatz von Verbrauchsmaterialien in einer unter Kostendruckstehenden Industrie), Reinraum Technik, Jan. 2005; Controlled Environments, Feb. 2006.
7. H. Siegerman, Wiping Surfaces Clean, Vicon Publishing, Amherst, NH, 2004.
8. D. LeBlanc et al, Cleaning Technology for Pharmaceutical Manufacturing, Pharmaceutical Technology, Oct. 1993.
9. M. McLaughlin, Selecting and Validating Aqueous Detergents, Controlled Environments (formerly A2C2), May 1999.
10. A. Vellutato, Jr., Contending with Residue in Aseptic Manufacturing, Controlled Environments (formerly A2C2), Mar. 2000.
11. D. Cooper, Cleaning Aseptic Fill Areas, Pharmaceutical Technology, Feb. 1996.
12. D. Cooper, Sterile Disposables for Maintaining Aseptic Areas, Pharmaceutical Processing, Volume 14, Number 8 (1997).
13. K. Miscioscio and D. Cooper, Characteristics of Wipers and Swabs for Pharmaceutical Applications, Journal of the IEST, Winter 2000, p. 31.

81
14. D. Cooper, Applying a Uniform Layer of Disinfectant by Wiping, PDA Journal of Pharmaceutical Science and Technology, Vol. 54 (1), p. 45, Jan. Feb. 2000.
15. H. Siegerman, Surface Cleaning Training Session: Overlooked Protocol, Cleanrooms, Apr. 2003.
16. H. Siegerman, Advantages of Sterile Pre-Wetted Wipers (Vorteile von Feuchtwischtuchern in sterilen Arbeitsbereichen), SterilTechnik, Feb. 2005.

82

83
CHAPTER 15: NEWEST DEVELOPMENTS IN RAPID MICROBIOLOGY PRACTICAL ASPECTS AND
VALIDATION
Frank Panofen MILLIPORE GmbH, Schwalbach, Germany
15.1 GENERAL CONSIDERATIONS ABOUT RAPID MICROBIOLOGY
Microbiological results are critical data for the process control and the release of pharmaceutical products. Very often the time to results of microbiological test methods is the limiting step. In the pharmaceutical industry it is known since years that Rapid technologies in microbiological detection are predicted to become an integral part of the routine analysis. QA and QC departments all over the world would like to implement analysis techniques that provide significantly reduced time-to-result. But in times where all companies are driven by the return of investment, the automation of tests with less manipulation times is a mayor objective of implementing rapid technologies. Rapid technologies usually deliver different output compared with the slow conventional methods. The available Rapid test methods for microbiology can be in general subdivided into three types:
− qualitative tests that reveal the presence or absence of microorganisms, − quantitative test delivering the exact count of target organisms in the sample, − identification methods.
Identification as part of investigations is one of the speed limiting factors in the release of pharmaceutical products. Phenotypic ID-methods are well known and in place whereas the methods based on molecular biology are actually heavily discussed and many technicians of the representative pharmaceutical companies are in the process of validating one of these methods.

84
15.2 UNDERSTAND THE REGULATIONS
The potential benefits of alternative methods have been clear to everyone for around 2 decades. Yet we are only talking about a few dozen systems in use by the pharmaceutical industry today, all suppliers combined. We could have expected hundreds or thousands. The paradox is that the beverage industry, less obsessed with sterility, has accepted and adopted rapid methods much faster and broadly than the pharmaceutical industry.
The explanation for this situation, resides in the validation hurdles, not necessarily because they are significant, but rather because they cannot be predicted. Part of the unpredictability was no doubt the FDA, quite secret about its position on alternative methods and with some level of confusion among its own members how audits your plants.
This attitude has changed in the recent months with the publication from the FDA about the GMP for the 21st century, Risk management and PAT (Process Analytical Technology). The introduction of PAT has created a lot of noise in the pharmaceutical industry. It delivers a framework of how to design and control a manufacturing process in the way that it delivers products of consistent quality by design. This concept would lead in an ideal world to Potential gains in Quality, Safety, and Efficiency in pharmaceutical development, manufacturing and quality assurance by using state-of-the-art technologies and by reducing manufacturing time and resources. The ultimate objective is a real time release of products with consistent quality by an optimal usage of all resources. Other recently finalized regulations like the ICH/Q8 and Q9 are consistently supporting this approach.
PAT is also part of the European regulations since EMEA has established a PAT team to avoid disharmony with other regulatory agencies from outside the EU. Elements of the PAT concept can also be found in the pharmacopeia, e.g. the general chapter of the EP: The manufacturer may obtain assurance that a product is of Pharmacopeia quality from data derived, for example, from validation studies of the manufacturing process and from in-process controls. These concepts can be supported when looking at the new chapter 5.1.6 which is now an official part of the EP 5.5, becoming official from the 1st July 2006.

85
15.3 UNDERSTAND YOUR NEEDS DEVELOP A U.R.S
One of the crucial steps of implementing a rapid microbial system for a pharmaceutical manufacturer is to understand their own needs. The best way to investigate these needs is to develop a User Requirement Specification. This URS can be a predecessor for the qualification of a new system, the selection of a system and a vendor. It should contain all aspects of the test methods starting with the actual way of testing and continuing with the main functionality requirements of the system, operational requirements like sample handling and performance, as well as training, support and maintenance.
15.4 EXAMPLES: TOTAL VIABLE COUNT AND IDENTIFICATION
The Milliflex® Rapid Microbiology Detection system is an automated solution for the rapid detection, response, and resolution of microbial contamination in filterable samples throughout the manufacturing process. The system improves process control, product yield and the timely release of products. Based on adenosine triphosphate (ATP) Bioluminescence technology, the Milliflex® Rapid system delivers faster test results than traditional microbial contamination detection methods, such as membrane filtration (MF) and pours plates. The Milliflex® Sample Prep method also ensures consistent, reliable results. The Milliflex® Rapid system can clearly distinguish between mixed microbial growth of slow growing and fast growing microorganisms, variances in their size and ATP content in water samples. All alternative methods for rapid detection of total viable microorganisms available on the market are not able to provide additional information about the identity of the detected microorganisms. In order to fill this gap between the quantitative information and the specific identification, Millipore developed a detection kit that combines specific nucleic acid probes hybridization on the membrane with the detection by image analysis of the Milliflex® Rapid system. This enables the specific detection of Pseudomonas aeruginosa from a sample in about 8 hours.

86
Figure 15.1. Specific detection of Pseudomonas aeruginosa by hybridization techniques using the Milliflex® Rapid detection system.
Furthermore, this technology can be combined to a total count analysis using ATP bioluminescence done on the same membrane prior to specific detection of a target microorganism. The Milliflex® Rapid system is therefore the first available system in the market that can deliver two crucial sets of data on the same sample: Total count and specific count.
15.5 CONCLUSION
Rapid methods for pharmaceutical microbiology save time and money. Despite former regulatory hurdles the actual initiatives from FDA and EMEA now favor the use of fast analytical methods to support the concept of designing quality into the product. The first chapter about Rapid Microbiology has been published recently in the EP 5.1.6.
Implementing a Rapid technology is still a tough workload and should be started by defining a URS. To support the implementation of Rapid technologies at pharmaceutical companies Millipore has developed the Milliflex® Rapid System for a broad range of applications (including ID).

87
CHAPTER 16: FDAS PROCESS ANALYTICAL TECHNOLOGY (PAT) STRATEGY AND ITS
IMPLICATIONS ON STERILE PRODUCT MANUFACTURE
Kurt Brorson CDER/FDA HFD-123, Bethesda, MD, USA

88

89
CHAPTER 17: ISOLATOR AND CONTAINMENT SOLUTIONS
Hans Gath M+W Zander Products GmbH, Stuttgart, Germany
Within the life sciences industry individual product types require different types and specialized forms of production and environmental controls. With the need to rationalize investment and operation cost for sterile and aseptic production facilities, the operating companies of laboratories and production facilities are looking for more flexible plants. Very often, only small cleanrooms or containments are required, but these can ensure total separation from product and personnel, achieving a level of security not attainable with conventional cleanroom technology. Barrier systems for the separation of products and personnel are becoming increasingly important to the biopharmaceutical industry. This paper describes solutions for the integration of isolators and containments into cleanroom facilities and process equipment.
17.1 INTRODUCTION
High potency compounds in the form of APIs and HAPIs are a growing source of concern in biopharmaceutical production and laboratory facilities. Special containment measures were required for only around 5% of the materials passing through drug development in the 1990s. Today, at least 35% of compounds meet these criteria. In many biopharmaceutical research facilities the use of potent compounds or materials with undocumented toxicity is increasing dramatically. New compounds have exposure limits in the low ng-range, and a one gram sample is a large quantity of material. Manufacturing processes as well as the transfer of sample quantities, preparation of testing materials, and even the actual testing operations represent a significant exposure potential. Guaranteeing safe workplaces for scientists and technicians poses new problems and challenges for health and safety professionals, and for facility managers.

90
17.2 ISOLATOR DESIGN
Key factors for successful isolator design include an understanding of the process, containment technologies, risk assessment and ergonomics. The process or activity that is taking place in a containment system is the key element. Performing processes in an isolator limits the access and manipulations, which means that each interaction must be defined in terms of how personnel interact with the equipment and hazardous materials. Containment technologies offer several solutions on how to separate the product, people and environment. Each of these technologies has certain degrees of protection based upon the individual application.
Risk assessment should be used to determine the risk, and the extent of containment technology required to reduce the risk to a minimum. Containment systems should be designed to be failsafe. Ergonomics determine the success or failure of most containment systems. If ergonomics are not taken into consideration on how the operator interacts with the process and equipment, personnel will develop alternative methods of accomplishing the work.
17.3 DESIGN CRITERIA FOR ISOLATORS
From an engineering point of view, containments are designed to achieve a validated level of control of highly potent or toxic substances by providing protection for people and the environment. Containments are operated with a negative pressure to prevent the uncontrolled spreading of highly potent or toxic materials from a controlled area. Isolators are designed to protect the product from contamination from the environment through particulates, chemicals and microorganisms. Isolators are operated with overpressure to prevent the contamination or degradation of clean or aseptic materials inside a controlled area. Containment and isolator technologies consist of several means of how to separate the product from people and the environment. Selecting the right technology is important to achieve the protection goals:
− Operation with overpressure or negative pressure − Leak tightness requirements − Explosion proof classification (ATEX) − GMP design quality of interior and exterior surfaces
91
− Quality and finish of welding seams − Window and door seals − PLC controls and monitoring − Integration of process equipment − Penetrations for cables and piping.
17.4 MOCK-UP STUDY
Lack of process integration is the major reason for failure of isolator and containment projects. As there are several technologies and components available to achieve the protection goals, it is recommended to perform a mock-up study to better understand the interactions between the process, the operator and the production environment. In order to achieve the protection goals each solution should be evaluated to determine which would best fit the process constraints.
− Ergonomics Positioning of gloves and equipment − Simulation of loading/unloading and material handling − Positioning of process equipment inside the Isolator − Positioning of RTPs for material transfer − Positioning of utilities (power, gases, water, chemicals) − Positioning of precision scales and scale displays − Positioning of disposal systems (RTPs, floor drain valves) − Transport trolleys for container and vessels − Positioning of spray pistols, spray balls.
17.5 SUMMARY
Isolators are one of the most interesting and innovative technology, which is increasingly used in the biopharmaceutical and API (Active Pharmaceutical Ingredients) industry, rather than human scale cleanrooms. The ability to segregate certain critical processes by the use of isolators offers many advantages, such as keeping processes sterile, preventing cross contamination, protecting personnel and environment. These are important attributes for both sterile and aseptic production as well as for conducting sensitive analytical tests in quality control laboratories. In addition isolators greatly simplify the

92
assignment of cleanroom zoning within a containment process environment, where highly active pharmaceutical ingredients are being increasingly used. These compounds represent a high risk for operative personnel, their surroundings, and a potential cross contamination of other products. The efficient use of isolator technology can largely eliminate these risks to products, people and environment.

93
CHAPTER 18: PRACTICAL ISSUES AND PROCESS SOLUTIONS TO POST SIP AND PRE-USE INTEGRITY
TESTING OF STERILIZING GRADE FILTERS
Alain Rachon Millipore SA, Molsheim, France
18.1 GENERAL CONSIDERATIONS
Post-sterilization, pre-use integrity testing of sterilizing-grade production filters is regarded as a cGMP requirement. The challenge in integrity testing of a sterlized sterilizing grade filter before use is to perform the test without breaching the sterility on the downstream side of the filter. The filter should be flushed and wetted prior to integrity testing which leads to the need to evacuate the flushing solution. Also, the air/nitrogen used during the integrity testing needs to have an evacuation port downstream of the filter. The current practice to perform these steps safely is to use a separate tank with a vent filter attached to it. This method requires aseptic procedures to handle an extra tank which needs often to be sterilized separately. The vent filter on the tank is integrity tested as well to ensure that the sterile downstream side has been protected from external contamination. The filter flushing volume is limited to the tank volume in this set up. If new wetting should be required the tank must be removed and emptied after which the whole system needs to be re-sterilized.
18.2 UNIQUE SOLUTION FOR POST-STERILISATION PRE-USE INTEGRITY TESTING
Millipore has designed a new technology, the MilliBarrier Filter, to meet these cGMP challenges. MilliBarrier filter is a unique combination of hydrophilic and hydrophobic sterilizing grade membrane material in one filter unit. This combination will allow wetting, integrity testing and drying of the production

94
filters without breaching the sterility of the system. The dual nature of the filter unit will enable both wetting fluid and air/nitrogen used in integrity testing to be evacuated through the same filter unit. Figure 18.1 shows the MilliBarrier used before the filling line in the final filling application where the sterility of the system must be carefully assured.
Figure 18.1. Use of MilliBarrier filter in the aseptic filling operation.
MilliBarrier technology can also be used in combination with disposable filter assemblies (Figure 18.2). The assemblies consist of a sterilizing grade filter connected with single-use BioProcess Container bags (BPC) and sterile connectors and/or valves. The assemblies are delivered pre-sterilized with gamma irradiation. MilliBarrier filter will enable flushing/wetting of the filter before the integrity testing and the evacuation of air/nitrogen during the integrity testing itself. After this the MilliBarier filter is isolated by clamping it off. Then the sterile filtration of the product can be conducted through the filter into the BPC where the product can be either stored or connected to a filling line for example.
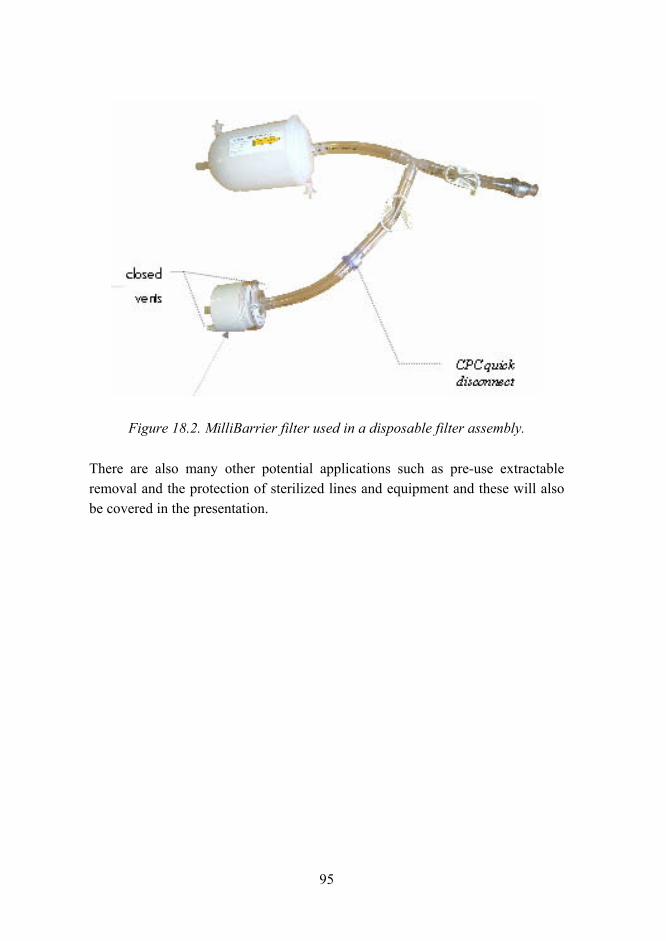
95
Figure 18.2. MilliBarrier filter used in a disposable filter assembly.
There are also many other potential applications such as pre-use extractable removal and the protection of sterilized lines and equipment and these will also be covered in the presentation.

96

97
CHAPTER 19: HOW DOES RAPID MICROBIOLOGY MEET THE NEEDS OF PROCESS ANALYTICAL
TECHNOLOGY?
Peter Ball Pall Life Sciences, East Hills, NY, USA
Process Analytical Technology (PAT) is seen as a key tool for better characterisation of the manufacturing process. Central to successful implementation of PAT is the timely acquisition of data by monitoring all critical parameters relevant to process quality and performance. Whilst this is relatively easy to achieve for physical and chemical parameters, it is much less easy to achieve for some biological parameters, particularly microbiological data. Rapid Microbiology is a tool that can provide near real-time data and thus address the apparent disconnect between the goals of PAT and current compendial microbiological methods. This article reviews key aspects of how Rapid Microbiology can address the requirements of PAT, with a particular focus on validation aspects.
19.1 INTRODUCTION
Today, one of the key initiatives in the Pharmaceutical industry is implementation of PAT as a quality management tool. As covered in more detail later, PAT is based on timely acquisition of data obtained by monitoring critical parameters relevant to process quality and performance. PAT is intended to enable the intelligent design, control and analysis of manufacturing processes. For some in the industry, a potential goal of PAT is also to enable parametric release of finished product. However, whilst parametric release may be viewed as attractive because of accelerated product release, there are significant technical challenges to implementing this strategy with products manufactured using aseptic processing.

98
Before considering what challenges exist in implementing PAT (and how it might facilitate parametric release) it is useful to consider the transition from the historical manufacturing processes based primarily on terminal sterilisation to the modern Pharmaceutical manufacturing environment, dominated by aseptic processing.
From the risk avoidance viewpoint, there are many advantages to terminal sterilisation. Thermal sterilisation is a well-characterised process. Process parameters and sterility assurance are clearly linked and readily validated. Probably, the vast majority of sterile Pharmaceutical manufacturing processes operating under parametric release today utilise thermal sterilisation.
A significant economic advantages of parametric release is that finished product can be released quickly based on the validated measurements that define the process as being within control. Of course, it is for this reason that some Pharmaceutical companies ultimate objective is to achieve parametric release for all key products, where this approach is both technically achievable and commercially desirable. However, most Pharmaceutical manufacturing processes have moved away from terminal sterilisation and towards aseptic processing for a variety of practical reasons.
19.2 ASEPTIC PROCESSING, MICROBIOLOGICAL MONITORING, PROCESS ANALYTICAL TECHNOLOGY AND PARAMETRIC RELEASE
Aseptic processing requires control of all critical aspects of the manufacturing process that could potentially contribute microbiological contamination to the finished product. The regulatory view is that aseptic processing it is a high-risk process (with regard to potential non-sterility) dependent on stringent control of the risks. How well do current microbiology methods measure these risks?
Microbiological test methods have changed little since the 1890s. They can only detect a restricted range of replicating organisms that are recovered on the limited range of culture media and incubation temperatures routinely used. The current compendial methods are operator-dependent and hence to a degree are subjective and they are far from real time methods, needing between 5 and 14 days (or more) to produce a result acceptable to the regulators. This reality is

99
being increasingly exposed as the amount of manufacturing and regulatory focus on PAT has grown.
As a reminder, PAT was introduced by FDA with two main aims, firstly to encourage real-time process monitoring and secondly to facilitate the introduction of new technology. PAT is well advanced for chemistry but adoption has been very slow for microbiology. PAT is a system for designing, controlling and analysing manufacturing processes based on monitoring critical parameters relevant to process quality and performance. PAT is based on obtaining in-process measurements in a timely manner. PAT should cover all critical analytical measurements made in the process, which, de facto, includes microbiological measurements. PAT is considered to be fully achieved when:
− All critical sources of process variability have been identified, characterised and explained.
− Monitoring data demonstrate process fully controlled to minimise variability.
− Finished product quality is predicted accurately and reproducibly by in-process data.
How does this approach fits alongside finished product testing, which is currently the most common approach used by the Pharmaceutical industry to assess finished product quality?
United States Pharmacopeia 28 (January 2005) General Notices and Requirements Page 7, Procedures, states: Data derived from manufacturing process validation studies and from in-process controls may provide greater assurance that a batch meets a particular monograph requirement than analytical data derived from an examination of finished units drawn from that batch. On the basis of such assurances, the analytical procedures in the monograph may be omitted by the manufacturer in judging the compliance of the batch with the Pharmacopeial standards. Thus, USP recognises that a PAT approach is equivalent or potentially superior to a finished product testing approach.
100
19.3 CURRENT MICROBIOLOGICAL METHODS WHAT DO THEY ACCOMPLISH?
Common microbiological methods used for monitoring and/or product release currently used routinely in Pharmaceutical manufacturing are the Microbial Limit Test (or MLT) and the Sterility Test. The MLT is focused on non-sterile raw materials, intermediates and finished products that are not claimed as sterile. The test is intended to demonstrate low levels of microbial contamination and to confirm the absence of certain specified organisms. The methods cited in the European and United States Pharmacopoeias provide results in around 5 days.
The compendial Sterility Test is, of course, designed to demonstrate absence of viable organisms and gives results in 14 days. When reviewing these tests and what they can accomplish, the objective of this article is to reflect several independent experts constructive criticisms of the relevance of these tests to modern Pharmaceutical manufacturing. It is important to preface any commentary by emphasising that modern Pharmaceutical manufacturing is an extremely secure process that has been proven over a long period of time to produce very safe products. The purpose here is thus to highlight thinking amongst several experts who argue that this is a reflection of the manufacturing processes and control procedures used rather than the methods used to test finished products.
When considering the compendial Sterility Test procedure in the context of PAT, there are a number of concerns that are attracting significant debate. Firstly, the Sterility Test concept and strategy is nearly 70 years old. Secondly, the test is limited in terms of the incubation temperature and growth media, which means that it almost certainly cannot detect all microorganisms. Thirdly and arguably most critically based on normal sample sizes analysed, the probability of detecting a non-sterile event is 0.005% or put another way in theory, for every 1000 batches manufactured, 5 could be non-sterile and remain undetected.
Alongside these points, it is also important to consider the more general limitations of the current microbiological methods, some of which were mentioned previously and include:
− The fact that the test methods presume that all microorganisms will grow, but the methods used make this unlikely.

101
− The methods require significant sample preparation, which limits the throughput of the tests.
− Environmental sampling methods, particularly those for surfaces, exhibit limited recovery.
− Current growth-based are far from real-time.
Thus, current methods are disruptive, inferential and correlate poorly with actual process performance. All of these factors represent real challenges in bringing microbiology in line with PAT.
19.4 RAPID MICROBIOLOGY, PAT AND PARAMETRIC RELEASE
The dilemmas just highlighted are where many experts believe Rapid Microbiology can help. The logic is that Rapid Microbiology can:
− Provide rapid results that permit an early response to any apparent process deviations.
− Offers the potential for simpler methods that require less highly trained operators.
− Can increase the number of samples that can be processed.
So Rapid Microbiology methods are perceived as being far more in line with the goals of PAT and parametric release than the current compendial methods.
19.5 RAPID MICROBIOLOGY THE REGULATORY PERSPECTIVE
One of the biggest obstacles to the early adoption of Rapid Microbiology has been the perception that national and global regulatory authorities may have concerns about Rapid Microbiology and may not support its introduction. This section addresses these concerns by providing evidence from the public domain that key regulatory groups in fact do support rapid microbiological methods. In Mail, the journal published by the UK-based Medicines and Healthcare Products Regulatory Authority (MHRA; part of the European MEdicines Authority, EMEA) in June 2003, on page 5, MHRA commented: Rapid microbiological methods (RMM) offer substantial advantages over conventional

102
methods for speed of the tests and should be an integral part of process analytical technology (PAT) and process understanding.
FDA, CDER commented in their document guideline Sterile Drug Products Produced by Aseptic Processing (September 2004): Other suitable microbiological test methods can be considered for environmental monitoring, in process control testing, and finished product release testing after it is demonstrated that the methods are equivalent or better than traditional methods (e.g. USP).
Dr. David Hussong, FDA CDER, in a presentation at a PDA meeting in Chicago, USA in 2005 commented: Rapid microbiology methods are encouraged by the FDA for improved process control. Rapid methods are encouraged for product release.
Arguably, the most important indicator of what how FDA CDER view Rapid Microbiology was their granting of their first global approval of this technology for use in the quality control procedures that form part of the release process for a drug product. The approval in question was granted to GSK in 2004. At a recent PDA meeting in Milan, Italy and in response to a question from Dr. Scott Sutton, Vectech, about this regulatory approval, Dr. Silvano Lonardi from GSK in Italy revealed that approval was granted in 19 days, which is believed to be a record.
In addition, other FDA and EMEA approvals for Rapid Microbiology have been publicly disclosed or are known to be in progress. Thus, it is clear that the regulatory authorities are supportive of new method introduction, as long as the appropriate validation and submittal strategy is followed and an appropriate data package is provided.
19.6 VALIDATION OF RAPID MICROBIOLOGY TECHNOLOGY
There are several key guidance documents that should be read, and their recommendations followed, as part of a programme to introduce rapid microbiological methods. The first of these documents is PDA Technical Report 33, published in June 20001. This is still the most detailed and informative document of validation of alternative microbiological methods, including rapid

103
methods. It is only possible to highlight a limited number of points from this document here. Because it forms the basis of all of the other key documents that have followed it, the reader is strongly recommended to obtain a copy and to study and implement its recommendations.
PDA Technical Report 33 includes amongst its key recommendations a recommendation that an Equipment Qualification Model approach is followed for the adoption of new methods. This is a holistic approach that is based on the use of a User Requirement Specification (URS). This type of URS is similar in concept, but different in detail, to the type of URS generated, for example, between a vendor and a user for a custom-developed electronic system designed to comply with the recommendations of the Good Automated Manufacturing Practice (GAMP) Guide for Validation of Automated Systems in Pharmaceutical Manufacture (issue 4).
Rather, the URS design recommended in PDA Technical Report 33 is designed to help the user make a rational selection of a technology appropriate to their intended application for the new method. This selection is recommended to cover the method and system together with other key requirements such as servicing and repair. The other key steps in the URS approach recommended by PDA Technical Report 33 are the performance of Installation Qualification (IQ) Operational Qualification (OQ) and Performance Qualification (PQ). Normally, the system manufacturer performs at least basic IQ and OQ on a product prior to delivery, but some degree of user-performed IQ/OQ will also be required.
PQ is seen rightly as the most important component of validating Rapid Microbiology and is an area where many of the questions related to validation arise. PDA Technical Report 33 covered this topic in some detail and the four key aspects identified were:
− accuracy, − sensitivity, − linearity (primarily relevant for methods that count bacteria) and − reproducibility.
Since PDA Technical Report 33 was published, a second important document has been developed that covers the topic of PQ for alternative microbiological

104
technologies in some detail. This is draft United States Pharmacopoeia General Information chapter 1223 Validation of Alternative Microbiological Methods (USP <1223>) 2.
There have been several changes in this latest and third revision compared with the original draft and this article will touch on aspects of both the original and the latest revision. The key points to note about this document are:
− It introduces the concept of comparability studies to validate new methods against the current methods.
− It defines two basic types of test method, qualitative and quantitative tests.Identification methods, which were included in the two previous versions of this chapter have now been removed. It is planned that these methods will be covered in a separate, new, chapter.
− The draft chapter defines validation criteria for each type of test method.
Arguably one of the most important parts of this draft chapter is the definition of a comparability protocol approach in which the current and the new method are tested alongside each other. This aspect will be discussed in more detail later.
The original draft chapter3 also defined types of qualitative and quantitative methods. As an example of an existing qualitative method, it gave presence-absence tests, for example, the sterility test and as examples of new methods it listed ATP bioluminescence, head space gas measurement and impedance. As an example of an existing quantitative method, it gave plate counts and as examples of new methods it listed automated epifluorescence microscopy.
This section listing current and alternative new methods has been deleted from the latest revision, which is unfortunate, because it was informative. However, a similar section is included in PDA Technical Report 33. Draft USP <1223> lists the following recommended validation parameters for new alternative methods. These are:
− Accuracy* − Precision* − Specificity − Detection Limit − Quantification Limit* − Linearity*

105
− Range* − Ruggedness − Repeatability − Robustness.
Those validation of parameters marked * above are only recommended for an alternative method that provides quantitative data.
The last key document covering validation of alternative microbiological methods is European Pharmacopoeia General Chapter 5.1.6 Alternative Methods for Control of Microbiological Quality4.
This chapter is very close in many ways to the original draft of USP <1223> and is now published4, so the reader is recommended to read this in detail. It is not the purpose of this document to give a detailed account of the process for validating a Rapid Microbiology system, because of space constraints. This topic will be covered during the authors presentation at the May 2006 R3 Nordic symposium. However, for those not attending this presentation, the author can be contacted for this information at the e-mail address shown at the start of this article.
19.7 COMPARABILITY PROTOCOLS AND RAPID MICROBIOLOGY
As a reminder, comparability protocols were introduced to:
− Improve communication between regulators and industry − Reduce the time cycle time for approvals −− Decrease the level of information required to support post-approval changes.
FDA has stated that: A comparability protocol can be used to reduce the reporting category for specified changes and has further commented that: A comparability protocol describes the changes that are covered under the protocol and specifies the tests and studies that will be performed, including the analytical procedures that will be used, and acceptance criteria that will be achieved to demonstrate that specified CMC changes do not adversely affect the product. 5.The route by which a comparability protocol can be used to support a change to an alternative method could be via a Prior Approval Supplement
106
(PAS, if the change is viewed as a major change) or via a Change Being Effective (CBE) or Change Becoming Effected in 30 days (CBE 30) if the change is viewed as moderate. Changing a microbiological test method from a compendial to a rapid method is most likely to be reviewed in one of the CBE categories, but the approach must be discussed between the applicant and the reviewing authority. Other approaches are also possible.
The key point to appreciate is that by following a Comparability Protocol strategy, it is not necessary to resubmit a Drug Master File and FDA has publicly stated that since the comparability protocol is an interactive exercise with them that has no regulatory impact on continuing manufacturing practice. FDA has also commented that, with adequate preparation work, once the comparability protocol is agreed, it is highly probable that the data obtained in a validation study will support the acceptance criteria defined in the protocol, therefore this is the lowest risk approach to validating a new method.
It is also important to be aware that there is currently no European equivalent to the Comparability Protocol and that rapid methods are at present reviewed as a type II approval.
19.8 CONCLUSIONS
There is now a wealth of information from regulatory and other sources which encourages, supports and guides the prospective user in evaluating, validating and implementing routine usage of Rapid Microbiology into Pharmaceutical manufacturing applications. The economic benefits of releasing product sooner are well documented and are complemented by the interest in using rapid methods to support PAT. Increased recognition of the value of Rapid Microbiology is being given by its inclusion in the European Pharmacopoeia with effect from January 20064 together with its planned inclusion in the United States Pharmacopeia3. The first regulatory approvals have been granted and more are in progress. Therefore, Rapid Microbiology can truly be said to have transitioned from an interesting future concept into a practical, widely recognized and accepted quality tool for Pharmaceutical manufacturing.

107
19.9 REFERENCES
1. PDA Technical Report 33: Evaluation and Implementation of New Microbiological Testing Methods (June 2000).
2. Pharmacopeial Forum 31 (5): 14761486 (2005).
3. Pharmacopeial Forum 28 (1): 154160 (2002).
4. Supplement 5.5 of the European Pharmacopoeia, January 2006.
5. Comparability Protocols Chemistry, Manufacturing and Controls Information (FDA CDER, CBER and CVM (February 2003).

108

FOOD SESSION


111
CHAPTER 20: RISK MANAGEMENT ACCORDING TO FOOD SAFETY STANDARDS
Laura Raaska VTT, Espoo, Finland
Complete elimination of risk from food manufacture and consumption is an impossible goal, but risk reduction is an essential part of every food producers responsibility to protect both its customers and its business. In recent years food safety has become a major issue in EU countries and much effort both in research and at plant level have been dedicated to ensure the production of safe food. Concomitantly there are several safety standards available for manufacturers in the food chain helping food industry to build up and maintain efficient documented food quality and safety management system. The choice of standard can be difficult and is probably influenced by many factors. The scope and specific characteristics of safety standards, e.g. the ISO 22000 Food safety management systems Requirements for any organization in the food chain and the BRC Global Standards for Food and Packaging, are important aspects as well as the international recognition and acceptance of the standard when choosing the most suitable and effective safety standard.
Furthermore, food industry needs practical easy-to-use tools both for assessing the risks and building up a cost-effective risk management system. HYGRAM® and Paperi HYGRAM® are especially developed for food and packaging industry for establishing and maintaining GHP/GMP and HACCP principles. In addition to well-designed risk assessment and documentation tools in efficient risk management along the food chain sufficiently sensitive, specific and fast detection and identification methods applicable at plant level are needed as well as knowledge on interactions and relationships between micro-organisms and their environment. To help food industry to fulfil the demand of safe food European technology Platform on Food for Life has been initiated in which one of the main research topics is food safety.

112

113
CHAPTER 21: ELEARNING AS A TOOL IN EDUCATING HYGIENE ASPECTS IN
BIOTECHNOLOGY AND FOOD ENGINEERING
Tuija Pirttijärvi, Henna Aho* & Jaana Kullaslahti* HAMK University of Applied Sciences, Biotechnology and Food Engineering
* HAMK University of Applied Sciences, eLearning Centre
Food industry needs motivated personnel understanding different hygienic aspects dealing with food safety. Hygiene education and training is needed for everyone working or aiming at to work in the food industry, either in processing, sanitation or maintenance. Hygiene aspects are important also for those producing food packaging materials or equipment for food industry. Traditional face-to-face teaching is not always optimal or even possible. Sometimes training independent on time and place is needed. This is the case also in degree-awarding education. Meaningful and flexible digital study materials and eLearning solutions have shown to be valuable tools in hygiene training and education. It has been possible to individualise the learning processes on the basis of personal needs, also in large groups. Production of interactive, pedagogically meaningful digital study material is time consuming. A practical way of producing eLearning material is to prepare learning objects that are reusable in different learning contexts.
21.1 ELEARNING AND WEB-BASED LEARNING
Although there are many different and rapidly changing definitions in the field of eLearning, the term eLearning is usually used to describe learning based on the utilization of digital information and communication technologies. When the use of Internet is involved, the terms Internet based learning, web based learning and online learning are also frequently used. eLearning is usually not limited to the use of Internet but also CD-ROM, DVD etc. can be used to provide learning materials.

114
Figure 21.1. Web based learning in different modes of learning.
Modes of learning can be divided on three categories depending on the contact time between the teacher or trainer and those participating the training: traditional face-to-face learning, distance learning and so-called flexible learning consisting of both face-to-face and web-based learning sessions (Figure 21.1). Digital learning materials and web-based training can be used in all these three modes of learning. Therefore, there are no strict boundaries between them.
Web-based training may sometimes rely solely on self-studying materials. However, virtual learning environment (eLearning environment) can also offer a sense of communication and contact with the tutor or the participants of the training. Virtual learning environment consists of materials, learning assignments, exercises or projects, tutoring and evaluation as well as several web-tools enabling communication (Figure 21.2). Learning should be learner-centered and the learning environments are expected to meet the needs of diverse learners (Ruohotie & Nokelainen 2002).
Figure 21.2. Content of eLearning environment.

115
21.2 HYGIENE EDUCATION AND TRAINING IN FOOD INDUSTRY
21.2.1. Aim: Skilled and Motivated Professionals
Everyone working in food industry must have sufficient hygiene skills. These skills consist of theoretical knowledge of risk factors connected to food production, the ability to apply this knowledge in order to ensure safe food production and especially the motivation to do so. In those cases when hygiene had failed because of mistakes made by workers, the reason has mostly not been the lack of knowledge about the hygienic working practices. Instead, more common is that the worker simply has not followed the hygiene programme of the food production plant because the lack of time or lack of motivation. In order to carry out the often time-consuming steps required in hygiene programme, the workers must be committed to good manufacturing practices. This is possible only if all workers understand the advantages of these practises. Therefore, very important aspect in hygiene education is to increase motivation and positive attitude towards the work.
21.2.2 Needs for Hygiene Training and Education in Food Industry
In the recent years companies in food sector have carried out a large hygiene proficiency training programme for their staff. Today they prefer employing professionals who already have hygiene proficiency certificate or a certificate of vocational qualification. Basic hygiene education is still needed, for example for temporary labour. Training is always needed when a new employee needs to be familiarized with the work and working environment. A successful familiarisation improves occupational safety, the quality and the productivity of the work. It also helps a person to commit to the organisation and to his own tasks. The amount of information in the beginning of a new employment is often huge. Walking trough the plant, learning the manufacturing process and location of different operations, meeting new colleagues, learning hygienic rules etc. often fills the first day(s). After that it is already needed that the worker takes responsibility for his/her own tasks. The importance of familiarisation is recognised at least in most of the food companies, but the limiting factor is time, for both the new employee and the person responsible for the familiarisation process. Effective tailor made learning materials can help in this process. Development of production technologies, structural changes in food production

116
plant, introduction of new raw materials as well as changes in microbiological and chemical risks call constantly for special needs for hygiene training.
21.2.3 eLearning Solutions
eLearning is one educational tool among others, but its use should never be the aim itself. Sometimes training or parts of it can be effectively carried out by utilising different types of digital media elements; sometimes other methods are more powerful. For example hygiene proficiency training can be quite effective during face-to-face learning session if several new workers start simultaneously. On the other hand, if the need for training is constant but for only one new employee at the time, self-study materials save time. During the familiarisation process interactive simulations of process lines help new worker to see the effects of their actions. With simulations it is possible to practise and also make mistakes without causing damage for the production. Web based tutoring for the use of instruments, equipment etc. enables user to use exactly as much time as needed for learning. Sometimes it could be an advantage if testing can be done virtually prior purchasing the equipment.
Apparent advantage for eLearning is that it overcomes timing, attendance and travel difficulties. This is important in companies having several units throughout the country or in different countries. Web based training with effective tutoring enables training to be organised at optimal time and in convenient place for each participant. In addition, the advantages of online meetings and conferences have been realised. Unlike in the past, online meetings and conferences do not require expensive equipment but they can be organised simply using Internet, microphones and headphones. Examples of eLearning solutions used in Finnish expert companies can be seen for example on Finnish Digital Learning Business Cluster (Anon. 2006) web-pages. Alamäki and Luukkonen (2002) have clearly described how eLearning can be successfully launched in a company.

117
21.3 CONSTRUCTION OF PEDAGOGICALLY MEANINGFUL ELEARNING
21.3.1 Planning, Production and Testing
When eLearning is used, it has to be done in a pedagogically meaningful way. Digital material and its use must provide with improvements into the present situation. First, the aim of the eLearning material must be clearly formulated. After that, it can be considered what are the pedagogical methods and technical solutions that can help to reach the aim. The resources available must be taken into consideration, also. The steps needed in the production of eLearning material are shown in Figure 21.3. Material can be a small, single learning object or a large web-based course. Careful planning and preparation of manuscripts is especially important when several people with different expertise are involved in the production.
Figure 21.3. Production of eLearning material.

118
21.3.2 Learning Objects
The production of interactive, pedagogically meaningful digital study material is time consuming. A practical way of producing material is to prepare learning objects that are reusable in different learning contexts. Learning object is a small piece of learning material (e.g. visualization, video clip, animation, interactive simulation, interactive exercise) that is a reusable, compact and unitary entity (Cavas et al. 2003, Pitkänen & Silander 2004). Learning object brings added value especially to such phenomena in the learning process which are otherwise difficult to make understandable to the learner (Koli and Silander 2003). Learning objects can be built by using different media elements as shown in Table 21.1. Learning objects may have different pedagogical functions (Koli & Silander 2003, Pitkänen & Silander 2004):
1. Learning seeds which activate the learner
2. Content modules; knowledge source (these are closest to the traditional learning materials like books)
3. Learning tools (mind tools), which guide the learner in the learning process (these can be for example interactive simulations)
4. Tools, utilities which help learner in thinking and solving problems.
21.3.3 eLearning Platforms
There is already a lot of digital information on hygiene aspects available for everyone: food hygiene legislation, information from different authorities involved in food and feed control, methodology etc. Effective utilisation of this information and use of different learning objects requires good organisation of training. There are different eLearning platforms (e.g. Moodle, Optima and WebCT) in which the path for the learner can be built. If the eLearning platform is used in pedagogically meaningful way, the participant can reach the aim of the training in small steps using versatile and motivating methods. Different web tools (discussion forums, learning assignments, wikis, weblogs, chats, exams, (feedback) forms etc.) can be used in eLearning platforms. It has to be noted that the excellence of eLearning is not in the versatility of web tools but in the wise selection of tools which promote the learning process. Some tools require more

119
computer skills than others. Usually a simple e-learning platform with only those tools that are needed is preferred.
Table 21.1. Media elements and their didactic use.
Media element Didactic use Text (e.g. HTML and PDF)
− material basis − reading text on a screen is harder than from a book → text
has to be more structured, concise and understandable − theme at first, then complementary and more specified
information behind a link − easy to browse, interesting titles
Picture (e.g. PhotoEditor and PhotoShop)
− helps to demonstrate and understand − clarifies structures − makes it easier to remember − works fine together with text and sound
Animation (e.g. PowerPoint and Flash)
− illustrates processes, stages and phenomena − tutors to different kinds of specific functions − can be interactive or authentic simulations − enables experiments, problem solving and practising
Sound (e.g. Audacity)
− easy to use, smaller file size than in videos − essential in studying languages and music − can be repeated several times − is used in realization, understanding and internalizing
information − is used also as an effect
Video (e.g. MovieMaker)
− illustrate different stages − suits well for teaching working techniques − helps to understand and internalize information − enables individual progress and review − enables to analyse work performances − can be used in orientation and problem solving − expert interviews
Screen capture video (e.g. CamtasiaStudio and Microsoft Producer)
− visualizes how to do certain actions or to use software − includes everything that is seen on screen (e.g. mouse
movements, pop-up windows, reporting, text, sounds and other effects)
− enables studying in smaller parts and repeating is easy Web lecture (e.g. MicrosoftProducer)
− teaching situations in web based learning − includes sounds, images (animation or picture) and text − enables studying in smaller parts and repeating is easy − can be either real-time or not, usually interaction is created
separately

120
21.4 EXPERIENCES OF USING ELEARNING IN MICROBIOLOGY AND HYGIENE EDUCATION
Different eLearning solutions have been made in HAMK University of Applied Sciences in order to promote the degree-awarding education e.g. in biotechnology and food engineering. Web based learning methods have also been used in tailored continuing education. In the production of materials, focus has been on the development of reusable learning objects. Recently Moodle, an open source eLearning platform, has been used to create web based courses. It has also been utilised in flexible learning consisting of face-to-face and web-based learning sessions.
21.4.1 Selection of Pedagogic Methods Based on a Target Group
The selection of pedagogic methods and eLearning tools has been done depending on the target group: age, background and motivation of the participants, group size and homogeneity and time available for learning sessions. For example, the students majoring in meat and convenience food technology can study the first two years in different universities of applied sciences in Finland and carry out only the advanced studies in Hämeenlinna. Hygiene and microbiology courses must still be taken in the beginning of studies. For these students web-based tutoring is important. The time for contact learning in the degree-awarding education of adults is very limited. A clear learning path on eLearning platform helps the students to carry out learning assignments and to organise their work during distance learning periods.
21.4.2 Individualised Learning Process
The main challenge among the young student groups has been how to individualise the learning processes on the basis of personal needs in large groups. Practical work periods in laboratory are important parts of the microbiology and hygiene course, but the time for those is limited. Nowadays students, already before they come into the laboratory, use digital study material showing safe microbiological working practises and aseptic techniques. The material includes several video clips for example on how to cultivate, determine and microscope microbial cultures. Using interactive animation the students can practice how to enumerate microbes in a sample by traditional plate counting
121
techniques. This exercise has shown to be very useful: amount of time practising needed to understand the principles of diluting and plating varies considerable between different students. Using interactive web based materials, students can use exactly the time they need for learning.
21.4.3 Tailor-made Web-Based Hygiene Proficiency Training
Basic hygiene proficiency training is organised in numerous organisations, also web based courses are available. The minimum hygiene proficiency requirements are the same to all employees whose work entails special risks related to food hygiene or who handle unpacked, perishable foodstuffs. However, in different fields of practice the risks and the measures for effective risk management are different. We have built tailor made web based learning materials, e.g. in the form of short web lectures. Part of the lectures can be used for many different groups, part of them are targeted only to the particular group. The web lectures and other learning objects have been organised, together with learning assignments, on eLearning platform. Hygiene proficiency training can be much more than a way to reach the minimum required skills.
21.4.4 Web Exams as Tools for Learning
Exams are usually used for evaluation, but web exams available in eLearning platforms can also be powerful tools for learning. Questions can be made to ensure that everyone learns the most essential matters. For example, we have seen that students behave differently when they are advised to study certain materials first and then answer the questions (multiple choice, true/false, numerical, short answer etc.). Students who have studied the material in advance as recommended were able to answer the questions in a few minutes. Some others were not so well prepared and they did not pass the exam at the first trial. However, they studied the materials before the next, successful attempt. The third group checked the questions first, kept the form open and studied the material simultaneously. All these three types of learners needed probably the same time for learning, but they did it different way. In traditional exams those who were not well prepared at the moment the test was started would not have learned as much.
122
21.4.5 Authentic Learning Environments
In recent research on learning, there has been an emphasis on authentic learning environments. Using web based learning materials (e.g. videos, interviews, short web lectures) it is relatively easy to bring young students into food production plant and to hear the opinions of those people who they might meet during the practical training period or who even might employ them in the future. Using the same techniques, those who have been working in the same plant for many years could be brought to virtual visit to, for example, another production plant of the same company. This might promote the exchange of best practices. In the future, interactive, motivating, time-saving and reusable learning objects could be produced more as joint projects of industry and educational institutions. Good subjects to start with can be found by assessing what kind of knowledge and understanding most workers need, and what do they not adopt sufficiently well by the presently used pedagogic methods.
21.5 REFERENCE
1. Alamäki, A. & Luukkonen, J. 2002. eLearning. Osaamisen kehittämisen digitaaliset keinot: strategia, sisällöntuotanto, teknologia ja käyttöönotto. Helsinki: Edita Prima Oy. ISBN 951-37-3559-1.
2. Anon. 2006. http://www.learningbusiness.fi/portal/news/all_profiles_and_ articles 27.3.2006.
3. Cavas, B., La Russa, G., Pitkänen, S.H., Silander, P., Silvasti, P. & Suhonen, J. 2003. What are needed to be considered beside of learning objects in computer science education? In: Kurhila, J. (ed.) Proceedings of the Third Finnish/Baltic Sea Conference on Computer Science Education, Oct. 35, 2003. in Koli, Finland. Report B-2003-3. University of Helsinki, Department of Computer Science, Helsinki, Finland. Pp. 714.
4. Nokelainen, P. & Ruohotie, P. 2002. Modelling students motivational profile for learning in vocational higher education. In: Niemi, H & Ruohotie, P. (eds.) Theoretical understanding for learning in the virtual university. Saarijärvi: Research Centre for Vocational Education and training. Pp. 177205. ISBN 951-44-5363-8.

123
5. Pitkänen, S.H. & Silander, P. 2004. Criteria for pedagogical reusability of learning objects enabling adaptation and individualised learning processes. Fourth IEEE International Conference on Advanced Learning Technologies (ICALT'04). Pp. 246250.
6. Silander, P. & Koli, H. 2003. Verkko-opetuksen työkalupakki oppimisaihioista oppimisprosessiin. Helsinki: Finn Lectura. ISBN 951-792-152-7.

124

125
CHAPTER 22: ZONING IN FOOD PROCESSING REQUIREMENTS AND EXAMPLES
Janne Lundén & Hannu Korkeala Faculty of Veterinary Medicine, Helsinki University, Helsinki, Finland
22.1 ZONING REQUIREMENTS
Zoning in food processing, means that different processing steps are separated by space. Zoning enables the separation of processing steps with different requirements on the hygiene level into own spaces. Zoning has been observed to have an influence on the hygiene and safety on the processing environment and final products in meat processing plants (Lundén et al. 2003).
With zoning it is possible to separate a processing step that requires higher hygiene with a physical barrier from a preceding or following processing step of lower hygiene. When proceeding from one hygiene level to the next the processes should be separated in order to prevent cross-contamination (Holah, 2003). Especially the separation of the raw processing areas from the post heat treatment areas is extremely important. The pathogens present in the raw materials should not go further in the processing chain. Adequately performed zoning provides good possibilities to prevent pathogenic organism from entering the next step in the processing chain.
22.2 EXAMPLES OF VARIOUS ZONING LEVELS
Following examples highlights the differences between the levels of zoning. Figure 22.1a shows a processing line without zoning. The oven opens to the area where raw products are present. This causes a risk for cross-contamination of the heated product. The spaces are not separated by any means, which makes the control of personnel traffic or other traffic very difficult. Figure 22.1b shows a processing line,
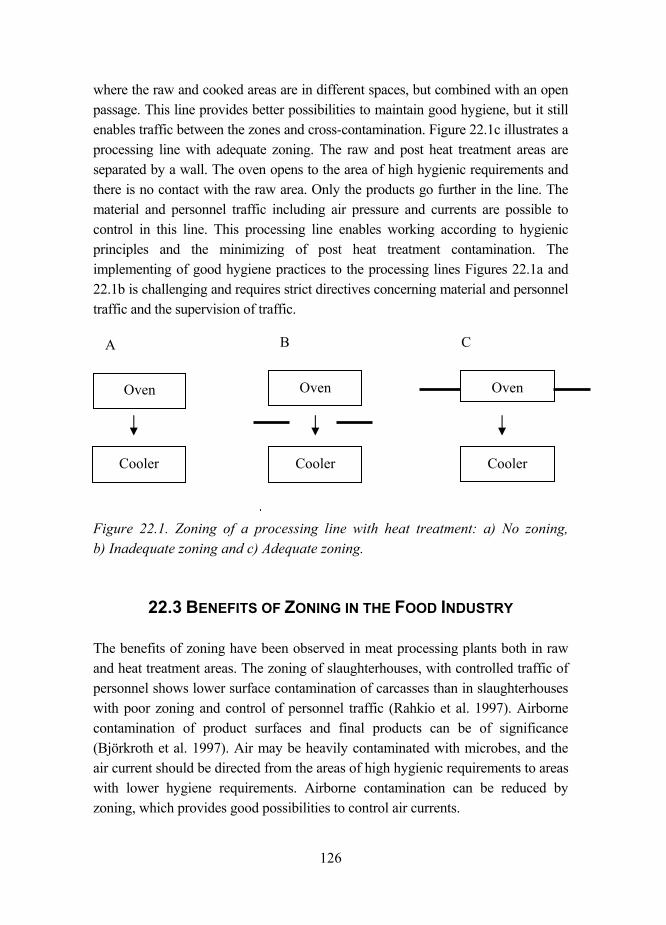
126
where the raw and cooked areas are in different spaces, but combined with an open passage. This line provides better possibilities to maintain good hygiene, but it still enables traffic between the zones and cross-contamination. Figure 22.1c illustrates a processing line with adequate zoning. The raw and post heat treatment areas are separated by a wall. The oven opens to the area of high hygienic requirements and there is no contact with the raw area. Only the products go further in the line. The material and personnel traffic including air pressure and currents are possible to control in this line. This processing line enables working according to hygienic principles and the minimizing of post heat treatment contamination. The implementing of good hygiene practices to the processing lines Figures 22.1a and 22.1b is challenging and requires strict directives concerning material and personnel traffic and the supervision of traffic.
Figure 22.1. Zoning of a processing line with heat treatment: a) No zoning, b) Inadequate zoning and c) Adequate zoning.
22.3 BENEFITS OF ZONING IN THE FOOD INDUSTRY
The benefits of zoning have been observed in meat processing plants both in raw and heat treatment areas. The zoning of slaughterhouses, with controlled traffic of personnel shows lower surface contamination of carcasses than in slaughterhouses with poor zoning and control of personnel traffic (Rahkio et al. 1997). Airborne contamination of product surfaces and final products can be of significance (Björkroth et al. 1997). Air may be heavily contaminated with microbes, and the air current should be directed from the areas of high hygienic requirements to areas with lower hygiene requirements. Airborne contamination can be reduced by zoning, which provides good possibilities to control air currents.
Oven
Cooler
Oven
Cooler Cooler
Oven
A B C

127
Zoning has significant importance of controlling Listeria monocytogenes in food processing plants (Lundén et al. 2003, Lundén et al. 2005). Food processing plants with inadequate zoning experience often problems with persistent L. monocytogenes contamination. These processing plants have limited possibilities to prevent the L. monocytogenes contamination of spreading with raw material traffic and other traffic moving from the raw areas to the post heat treatment areas. Food processing plants with processing lines described in Figure 22.1a may encounter prolonged difficulties with L. monocytogenes contamination. Inadequate zoning has been associated to contamination in the post heat treatment areas including processing machines and final products. On the other hand, food processing plants with processing lines described in Figure 22.1c have good prerequisites for controlling L. monocytogenes.
22.4 REFERENCES
1. Björkroth, J. & Korkeala, H. 1997. Use of rRNA gene restriction patterns to evaluate lactic acid bacterium contamination of vacuum-packed sliced cooked whole-meat product in a meat processing plant. Appl. Environ. Microbiol. 63, pp. 448453.
2. Holah, J. T. Hygienic plant design. 2003. In: Lelieveld, H. L. M. et al. (eds.) Hygiene in food processing. Woodhead Publishing Limited, Cambridge. Pp. 76105.
3. Lundén, J., Autio, T., Sjöberg, A.-M. & Korkeala, H. 2003. Persistent and nonpersistent Listeria monocytogenes contamination in meat and poultry processing plants. J. Food Prot. 66, pp. 20622069.
4. Lundén, J., Björkroth, J. & Korkeala, H. 2005. Contamination routes and analysis in food processing environments. In: Lelieveld, H.L.M., Mostert, M.A., Holah, J. (eds.). Handbook of hygiene control in the food industry. Woodhead Publishing Limited, Cambridge, England. Pp. 539555.
5. Rahkio, M. & Korkeala, H. 1997. Airborne bacteria and carcass contamination in slaughterhouses. J. Food Prot. 60, pp. 3842.

128

129
CHAPTER 23: CLEANROOM TECHNOLOGY APPLICATION IN A BAKERY
Petri Uotila Uotilan Leipomo Oy, Pälkäne, Finland
23.1 UOTILA´S BAKERY
Over the years we have specialised in traditional healthy, pure baking, and in further developing this concept. The idea of healthy, pure baking is based on a desire to keep our basic food products safe choices. We keep tightly to this principle in all our products. The result is a tasty product that equals the first choice of todays consumer: healthy, pure, safe bread just the way you like it. Figures about the Uotilas bakery is given in Table 23.1.
Table 23.1. Uotilas bakery in brief.
Established Traditional baking since 1941 Business idea Healthy Pure Owners Harri and Petri Uotila (50%/50%) Turnover 2,5 milj. (2005) Personnel 14 Marketing 4 private sales representatives and one car in southern Finland.
Fazer in northern and eastern Finland, Inex and Tradeka stores. Products Uotilas traditional breads taste and remember
Traditional Häme bread: Real Pälkäne potato loaf Traditional country bread: Country rye loaf

130
23.2 HYGIENE IN FOOD INDUSTRY
Different industries use clenroom technology for different kind of purposes. Electronic industry considers every particle as an enemy and the pharmacy industry is after microbes. When it comes to food industry; meat industry is mainly afraid of bacteria and bakeries are only for mould and yeast. In food industry there isnt hardly any cleanroom applications, most common is to build clean facilities according GMP or standards (BRC etc.) and not according the cleanroom specifications.
23.3 BAKERY HYGIENE SOLUTION
Our first cleanroom was planned to fulfil ISO Class 4 specifications and it was built in 1995. Since 1995 we have been producing without any conservatives or any other additives. In bakeries contamination happens after baking, so cooling, slicing and packaging takes place in the cleanroom. Process is fully automated and worker(s) is isolated from the process by glasses or with plastic curtain strips. Slicing process provides quite lot of waste, like food processes normally do. Walls, floors and machinery are washed daily with low pressure water.
23.4 SOLVING THE HYGIENE PROBLEMS
In 2002 we started to build new slicing and packaging area according the experience we have had so far. Now we had the knowledge about the problems and that was the key to solve them. Total hygiene is outcome from different hygiene sectors involved with the process. First you have to recognize them all and prioritize them, after all this you solve them one by one and eventually you are controlling them. In food industry it wouldnt be prize wise to create such methods that would totally block microbes entering the facilities. Something more was needed. The answer for this question was online disinfection which was created together with Biocid Ltd.

131
23.5 ON- AND OFFLINE METHODS
Microbe safety is outcome of how you are able to reduce your contamination pressure and on the other hand how you are able to provide online disinfection. In cleanroom technology we determinate for facilities rest- and operational status. We do same way in our bakery off- and online disinfection methods. When there is no production going on we are able to use more disinfection methods than during the production. Main idea in this Biocid system is to have continuous (24/7) controlled dry disinfection in our cleanroom. We have two different dry disinfection methods in use, uvc and activated oxygen.
23.6 EXPERIENCES
So far we have achieved to create total hygiene solution, where 92% of our microbiological samples indicates zero! Our bread is aseptic packed and produced without any conservatives or any other additives, with the result that our microbiological self life is endless. We have achieved several advantages in our struggle to guarantee our microbiological result. This automatic system guarantees even results and saves water, chemicals and work time.

132

133
CHAPTER 24: RISK ASSESSMENT OF AND PROTECTIVE MEASURES AGAINST MICROBIAL
THREATS
Laura Raaska & Veikko Rouhiainen VTT, Espoo & Tampere, Finland
Risk assessment and management of micro-organisms is well established commission in process industry. Security is distinguished from safety by characterizing intended contamination of e.g. air, soil, water or food. In case of microbial contamination it is called bioterrorism. Requirements for increasing security have arisen in Europe. Accordingly also the process industry should be aware of the potential possibility of bioterrorism or threat of intended contamination and evaluate the efficiency of protective measures implemented for primarily ensuring the safety of the end product also for intended attacks. Infectious agents have been used in warfare since ancient times but their use in attacking civilians is more recent and probably consequence of the ease in cultivating micro-organisms. The need for on-line detection of several micro-organisms in respect of safety and security and the restricted requirements for detection emphasize crucial synergistic cooperation between safety and security research.
24.1 INTRODUCTION
Risk assessment and management of micro-organisms is well established commission in process industry. The protective measures implemented and followed focus mainly on minimizing the risk of unintended contamination of the process and the end product caused by process failure or accident. Requirements for increasing security have arisen in Europe after several highly visible and tragic events including also use of micro-organisms as bio agents. Security is distinguished from safety by characterizing intended contamination of e.g. air, soil, water or food. In case of microbial contamination it is called bioterrorism. Bioterrorism is the employment of biological agents which are living micro-organisms that cause infectious diseases to produce casualties in humans and animals and damage to plants or material. According to the requirement process industry should be aware of the potential

134
possibility of bioterrorism or threat of intended contamination and evaluate the efficiency of protective measures implemented for primarily ensuring the safety of the end product also for intended attacks.
24.2 CHARACTERISTICS OF BIOLOGICAL AGENTS
Infectious agents have been used in warfare since ancient times but their use in attacking civilians is more recent and probably consequence of the ease in cultivating micro-organisms. The biological agent should consistently produce the desired effect of death or disease, have short and predictable incubation time and be effective in low concentrations. The disease should be difficult to identify and not to be suspected as act of bioterrorism. Furthermore the biological agent should be suitable for mass production, storage and weaponization, remain stable during dissemination and terrorists should have means to protect themselves against the agent. Biological agents are attractive to terrorists because many of them have several of these characteristics. In addition aerosols of biological agents are invisible, silent, odourless and tasteless. The delivery systems for aerosols are commonly available and the agent is relatively easily dispersed as well produced by using e.g. the common technology available for production of same antibiotics, vaccines and foods. The incubation period for most of the potential agents is 37 days which allows escape of terrorists before symptoms of disease appear and terrorist attack is suspected. Also endemic infectious agents can be used which may cause confusion in differentiation between natural epidemic and biological warfare attack. For some agents the potential of secondary and tertiary transmission by person-to-person or natural vectors exist which further enhances the effect of attack.
The potential microbial agents in biological terrorism include bacterial, fungal and viral pathogens and toxins produced by micro-organisms. Examples of infectious agents include e.g. those causing anthrax (Bacillus anthracis), plague (Yersinia pestis), tularaemia (Francisella tularensis), hemorrhagic fevers (e.g. arenaviruses), and smallpox (variola virus). Examples of potential toxins produced b y micro-organisms include botulinum toxin from Clostridium botulinum, trichothecene mycotoxins from e.g. Fusarium, Mycotenium, Trichoderma, Stachybotris spp. and enterotoxins from Staphylococcus aureus. However use of any pathogen as bio agent is possible.
135
24.3 DETECTION TECHNOLOGIES
Detection of micro-organisms by traditional plating is far too slow for ensuring the safety of every product batch emphasizing the need for rapid, sensitive and easy-to-use detection methods. Molecular technologies and immunotechnologies that are more sensitive and rapid that culturing have already been developed for detection and characterization of several micro-organisms but however these technologies have not jet been fully adopted in industry.
The detection and measurement of biological agents is also challenging due to the great number of potential agents to be distinguished, the complexicity of the agent itself, the myriad of similar micro-organisms that are constantly present in the environment and the minute quantities of agent necessary to cause illness or death. However the real-time detection is crucial for the in time warning, protection and minimization of the number of causalities as well in time identification of the agent to initiate medical treatment, In addition imperative demands for real-time detection are specificity (no false positives), sensitivity (low concentration of agent detected), broad-ranged agent detectability, operation ability in variety of extreme field conditions with minimal supporting infrastructure, long shelf-life, high-volume automated output with minimum need for specialized training, dispensable or decontaminantion-cabable elements and of reasonable price. The specificity and sensitivity of the detection system are key issues to discriminate small differences in analyte concentrations. The need for on-line detection of several micro-organisms in respect of safety and security and the restricted requirements for detection emphasize crucial synergistic cooperation between safety and security research.
24.4 EXAMPLES OF ACTIVITIES
The countermeasures available today are not sufficient and improvements are necessary to ensure a more effective response to bio attack. While responsibility for security rests largely with national activities the EU has also started planning a research area "space and security" as a part of the 7th framework programme. As a justification for this research area it has been stated that "Technology alone can not assure security, but security can not be assured without the support of technology". More information on 7th Framework can be found in Cordis web pages (http://www.cordis.lu/security/).

136
The 7th Framework programme has been preceded by ongoing PASR Preparatory Action in the field of Security Research program. IMPACT is one of the projects funded by PASR-program. The aim is to outline the scenarios that provide insight in the possible risks of e.g. biological event, evaluate the efficiency and applicability of present detection technology and to identify the existing technology gaps. It is impossible to develop measures of protection which cover all potential scenarios. An alternative approach which was adopted in IMPACT is to construct a smaller number of relevant terrorist scenarios and to use these scenarios for evaluation of countermeasures. This kind of methodology could also be used at plant level for efficiency evaluation of the risk management system.
For identifying and defining in more detail the VTT expertise and research goals, the Security Research Roadmap has been developed. The road map identified three particularly significant areas related to security: assurance of critical infrastructure e.g. energy networks, drinking water systems, transport and protection of citizens, assurance of entrepreneurship activities e.g. security of production and services, protection of sites and assets and information security. Main goals in security of production and services were identified as use of several available risk assessment and scenario building methods to security aspects, development of risk indicators and security measures and development of network and information security.
24.5 REFERENCES
http://europa.eu.int/comm/enterprise/security, April 13, 2006.
http://www.cordis.lu/security, April 13, 2006.
www.vtt.fi/julkaisut/VTT julkaisusarjat/VTT verkkojulkaisut, April 13, 2006.
http://en.wikipedia.org/wiki/Biological weapons, April 13, 2006.
Khardori, N. & Kanchanapoom, T. 2005. Overview of biological terrorism: potential agents and preparedness. Clinical Microbiology Newsletter 27, pp. 18.
Naumanen, M. & Rouhiainen, V. (eds.). Security-tutkimuksen roadmap. Espoo: VTT Tiedotteita 2327. 2006. 69. p.

137
CHAPTER 25: HYGIENIC INTEGRATION IN PLANT SANITATION
Lotte Dock Steenstrup, Roland Cocker# & Alan Friis BioCentrum-DTU, Kgs. Lyngby, Denmark
# Cocker Consulting, Almere, the Netherlands
New approaches to application of zoning and integration procedures in assurance of plant hygiene and sanitation will be presented. The goal is to assure that an installation which is hygienic at the design state will remain hygienic through maintenance, re-design and of cause the intended use. The presentation will pertain to application of known principles such as zoning, construction of plant master plans and the relatively new topic of hygienic integration. Applying proper integration, focus will remain on the most important issues allowing process engineers to plan and re-design plants in a safe manner. Also product developers can include issues of hygienic requirements early in their development processes. The proposed principles will allow for easy and effective communication inside companies as well as externally to public bodies and costumers. The work build partly on the proposed integration guideline from European Hygienic Engineering & Design Group (EHEDG) partly on discussions and inspiration form a large amount presentations made by people in the hygienic design and cleaning community.
25.1 HYGIENIC ENGINEERING
Poor decisions are often made during the sequence of designing, fabricating, installing, contracting and making design changes, or when maintaining a production assembly, a line, or a facility, because the sequential approach to problem-solving is adopted. This way, hazards may be unintentionally created in the process line, such as leaving a valve on a branch closed, thus creating a dead end, or simply placing equipment inexpediently, making cleaning very difficult.

138
Another important issue for obtaining a line that runs optimally is to make sure it is operated systematically. One way to ensure high performance is to implement HACCP and GMP, which primarily deal with hygiene, cleaning and critical control point monitoring. Furthermore, high performance is ensured by employing changes in management, by establishing and maintaining documentation with regard to installation, automation, operation, maintenance, and cleaning as well as by testing the operation and performance of the equipment before routine use. The ideas presented here are part of the imminent EHEDG guideline on Hygienic Systems Integration (HSI). The EHEDG guideline has the task of linking and supporting current guidelines on hygienic design regarding specific equipment and hygienic tests, and which can be viewed as vertical guidelines. The HSI guideline, on the other hand, is classed as a horizontal guideline, which is a completely new approach. Neither the EN1672-2 nor the HACCP standards are replaced by the HSI guideline.
25.2 HYGIENIC INTEGRATION
The integrated approach to hygienic design is a systematic way of combining hygienic entities into a hygienic facility. This may be a new design or reassignment of existing entities. An entity is a component, which is part of a hygienic system, and can be a part, an assembly, a module, a line, or a factory. Part of the scope of the HSI guideline is:
! to describe the integration of entities, including the manufacture and supply of goods, in order to produce safe food or related products cost effectively, and
! to describe integration topics that can affect hygienic design, including installation, operation, automation, cleaning and maintenance, especially those that are common or a frequent cause of failure.
The guideline defines hygienic integration as a process of combining or arranging two or more entities to work together while eliminating or minimizing hygiene risks. While the focus is on the hygienic standard of the equipment, there are many surrounding issues that must be controlled in order to complete hygienic integration. For example, a facility must conform with all specified requirements, which may originate from legislation, users, product quality or safety. The integrated approach also involves determining specifications for

139
product flow, control strategy, automation, maintenance, change management and training of personnel. Furthermore, implementation of HACCP and GMP is a necessity. A failure mode and effect analysis (FMEA), which is a structured, equipment-based safety tool based on risk assessment of the consequences of failure of any parts of a process may also be carried out.
The integration process comprises a set of actions, which are given in Figure 25.1. Each step is carried out by following a flow diagram, which takes the user through the necessary steps in order to complete each particular action properly. Examples of such flow diagrams are given in Figures 25.2 and 25.3.
Each integration-action must have at least a prospective validation identifying probable failure modes. Hygienic integration should be carried out on a modular basis with entities that have already passed the functional requirement for integration. Instructions must cover: installation, operation, cleaning, sterilisation (if applicable) and maintenance. Concurrency with design and validation activities other than those concerned with hygiene is naturally a prerequisite. For an unassigned module or assembly, the provisionally intended process or processes and product(s) must be defined in a prospective list.
STARTSTARTSTART Stakeholder requirements
Stakeholder requirements
Analyze and specify design
Analyze and specify design
Design new entity
Design new entity
Validate design
Validate designInstall entityInstall entity
Add to library of qualified
entities
Add to library of qualified
entities
Validate hygienic
performance
Validate hygienic
performance
Validate physical function
Validate physical function
STARTSTARTSTART Stakeholder requirements
Stakeholder requirements
Stakeholder requirements
Stakeholder requirements
Analyze and specify design
Analyze and specify design
Analyze and specify design
Analyze and specify design
Design new entity
Design new entity
Design new entity
Design new entity
Validate design
Validate design
Validate design
Validate designInstall entityInstall entityInstall entityInstall entity
Add to library of qualified
entities
Add to library of qualified
entities
Add to library of qualified
entities
Add to library of qualified
entities
Validate hygienic
performance
Validate hygienic
performance
Validate hygienic
performance
Validate hygienic
performance
Validate physical function
Validate physical function
Validate physical function
Validate physical function
Figure 25.1. The figure shows a single integration displaying the required integration actions.
The first action is to determine the stakeholders requirements, which can originate from customer, food safety, environmental legislation, or some other type of constraint. After listing the stakeholders requirements the user goes through the first flowchart: Analyse and specify the design, given in Figure 25.2. Going

140
through the stakeholders list of requirements should produce a conceptual design for the entity or entities under examination. Every time such a stage is completed, the flow diagram takes the user through a confirmation step, making sure there is compliance between the information obtained and the outcome of the analysis. For example, if the user forgot to take some legislation issues into consideration in the conceptual design, the user should be able to notice this before going on to specify the design in more detail. The flow chart also asks to record data produced during the decision process and to record the decision itself (Figure 25.2). The user then continues through the integration snake (Figure 25.1), and goes on to design the new entity, validate physical function, install the entity, validate the design, and the hygienic performance. There is a separate flowchart for each of these actions taking the user through the necessary steps to complete a particular action.
Stakeholder needs*, product
specs., and constraints
Stakeholder needs*, product
specs., and constraints
StartStartStart
Analyze the Stakeholder needs
Compliance with stakeholder needs ?
OK? Decision recordedDecision recorded
Records producedRecords produced
Conceptual design*Conceptual design*
Note: *relationships layout etc.
Yes
No
Note: *costumer, food safety and environmental legislation, etc.
Compliance with specifications and constraints?
Specify the Design
Conceptual design, library of
published solutions,
constraints, relevant standards
and EHEDG guidelines
Conceptual design, library of
published solutions,
constraints, relevant standards
and EHEDG guidelines
OK?Decision recordedDecision recorded
Design specificationHygienic classifications (equipment and zones)
Design specificationHygienic classifications (equipment and zones)
Note: building, utilities, storage, mechanical strength, etc. Failure to integrate all other aspects can jeopardize the hygienic design.
Records producedRecords
produced
Yes
No
Stakeholder needs*, product
specs., and constraints
Stakeholder needs*, product
specs., and constraints
StartStartStart
Analyze the Stakeholder needs
Compliance with stakeholder needs ?
OK? Decision recordedDecision recordedDecision recordedDecision recorded
Records producedRecords producedRecords producedRecords produced
Conceptual design*Conceptual design*
Note: *relationships layout etc.
Yes
No
Note: *costumer, food safety and environmental legislation, etc.
Compliance with specifications and constraints?
Specify the Design
Conceptual design, library of
published solutions,
constraints, relevant standards
and EHEDG guidelines
Conceptual design, library of
published solutions,
constraints, relevant standards
and EHEDG guidelines
OK?Decision recordedDecision recorded
Design specificationHygienic classifications (equipment and zones)
Design specificationHygienic classifications (equipment and zones)
Note: building, utilities, storage, mechanical strength, etc. Failure to integrate all other aspects can jeopardize the hygienic design.
Records producedRecords
produced
Yes
No
Figure 25.2. Flow Diagram for the integration action: Analyse and specify the design.

141
Yes
Complies with design
rules?
No OK?
Record the results Record the results
Record the decision
Record the decision
Examine description or drawings of the
entity
StartStartStart
ISO 14159 EN 1672-2
EHEDG Guideline Nos. 8, 10,13, etc.
ISO 14159 EN 1672-2
EHEDG Guideline Nos. 8, 10,13, etc.
Carry out risk assessment
What is the risk?Can the design
be simplified
OK?
Record the results Record the results
Record the decision(s) Record the decision(s)
Yes
No
FMEAHACCP Codex
Alimentarius
Prospective or assigned product
and process
FMEAHACCP Codex
Alimentarius
Prospective or assigned product
and process
Hazard Analysis and Risk Assessment
Hazard Analysis and Risk Assessment
Pass or Fail?
OK?
Other challenge test protocols
EHEDG guidelines 2, 4, 5, 7, 15, 19,
21
Definition of acceptable Mean
Time Between Failure (MTBF)
Other challenge test protocols
EHEDG guidelines 2, 4, 5, 7, 15, 19,
21
Definition of acceptable Mean
Time Between Failure (MTBF)
Simplify, then define and perform stress test, then challenge
tests etc.
Record the decision(s)Record the decision(s)
Record conditions, duration, results
Record conditions, duration, results
Yes
No
Yes
Complies with design
rules?
No OK?
Record the results Record the results
Record the decision
Record the decision
Examine description or drawings of the
entity
StartStartStart
ISO 14159 EN 1672-2
EHEDG Guideline Nos. 8, 10,13, etc.
ISO 14159 EN 1672-2
EHEDG Guideline Nos. 8, 10,13, etc.
Carry out risk assessment
What is the risk?Can the design
be simplified
OK?
Record the results Record the results
Record the decision(s) Record the decision(s)
Yes
No
FMEAHACCP Codex
Alimentarius
Prospective or assigned product
and process
FMEAHACCP Codex
Alimentarius
Prospective or assigned product
and process
Hazard Analysis and Risk Assessment
Hazard Analysis and Risk Assessment
Pass or Fail?
OK?
Other challenge test protocols
EHEDG guidelines 2, 4, 5, 7, 15, 19,
21
Definition of acceptable Mean
Time Between Failure (MTBF)
Other challenge test protocols
EHEDG tests 2, 4, 5, 7, 15, 19,
21
Definition of acceptable Mean
Time Between Failure (MTBF)
Simplify, then define and perform stress test, then challenge
tests etc.
Record the decision(s)Record the decision(s)
Record conditions, duration, results
Record conditions, duration, results
Yes
No
Figure 25.3. Flow diagram for the integration action Validate hygienic performance.

142
An example is given here for the Validate hygienic performance flowchart (Figure 25.3). The incoming information for the first step is provided by examining the description or drawing of the entity with respect to the guidelines on the safety of machinery, i.e. NSF 14159 or EN 1672-2, as well as the EHEDG guideline on Hygienic equipment design criteria. Depending on the entities to be integrated, EHEDG has published guidelines on:
⇒ Hygienic design of closed equipment for the processing of liquid food,
⇒ Hygienic design of equipment for open processing,
⇒ General hygienic design criteria for the safe processing of dry particulate materials
⇒ Hygienic engineering of plants for the processing of dry particulate materials or similar.
The second step is to perform a risk assessment, which in practice means performing a FMEA and HACCP analysis, while the third step is to test the entity. Depending on intended use, one or more of the EHEDG tests for sterilisability, in-place cleanability, or bacteria tightness may be applicable. The acceptable mean time between failures may also be determined at this time.
After completing the validation of the hygienic performance, the entity has been integrated successfully, and can be implemented for the specific process to which it was assigned. If the entity has not been assigned to a particular product or process, it can simply be added to the library of unassigned entities.

143
CHAPTER 26: INCREASING THE LEVEL OF HYGIENE IN EU THE EHEDG TRAINING
FACILITATOR AND TOOL-BOX
Bo B. B. Jensen, Hilde Cnossen*, Jacques Kastelein* & Roland Cocker#
BioCentrum-DTU, Kgs. Lyngby, Denmark *TNO Quality of Life, Zeist, the Netherlands #Cocker Consulting, Almere, the Netherlands
Research continues in the area of hygienic engineering and design, particularly in innovative techniques using safe construction materials to develop functional as well as easily cleanable equipment for handling, processing and packing foodstuffs. This is the motivation behind the work of the European Hygienic Engineering & Design Group (EHEDG), which regularly publishes detailed guidelines and guidance on engineering aspects of food production. To convey this information from research reports and guideline documents to the designers at their drawing boards and production personnel, EHEDG has moved into the area of training and education. Within the HYFOMA project, the EHEDG Training and Education subgroup created for this purpose a Training Facilitator and a tool-box, which gives recommendations on training and education in hygienic engineering and design within the EU.
26.1 INTRODUCTION
High quality and safety are necessary to sustain the good reputation of European manufactured foodstuffs. The livelihood of many people depends on the success of food manufacturing. Key prerequisites for high quality and safe products are good hygienic design and regular maintenance of the production facilities. The European Hygienic Engineering & Design Group (EHEDG) has published more than 30 guidelines on proper hygienic design of different aspects of food manufacturing (www.ehedg.org). Based on these guidelines and within the scope of the European Network for Hygienic Manufacturing of Food (HYFOMA, QLK1-CT-2000-01359), the Training Facilitator was recently produced.

144
In preparing the Training Facilitator, the subgroup made the following observations: The few training courses currently available in this area are diverse in content and objectives. Few consultancy companies and research institutes offer very high quality training and consultancy in hygienic design. Larger food manufacturers may have in-house training capabilities and in general, course content and quality are assessed internally.
26.2 SCOPE OF TRAINING FACILITATOR
To provide a basis for a common European approach on teaching hygienic design, the Training Facilitator outlines requirements for trainers and specifies training objectives (learning goals) for defined categories of trainees. Training modules, equivalent to a syllabus, are structured by theme, with specific training objectives per target group classification and suggestions for appropriate training levels (target groups). The themes are based on themes and issues developed in published guidelines. They range from generic hygienic design criteria to their application in pieces of equipment such as valves, pipe couplings, pumps, seals etc, to manufacturing processes and test methods (Table 26.1). A module was also developed on the normative reference EN 1672-2. The index featured in Table 26.1 is only the first edition; the intention is to expand the themes as new guidelines are developed. The accompanying Trainers Toolbox, which consists of DVDs and a CD-ROM, illustrate actual examples and footage of industrial applications, also beyond those listed on the index.
26.3 TRAINING MODULES
To structure all the information contained in the EHEDG guidelines in a manner applicable for teaching, each theme was broken down into training objectives (Figure 26.1). For each target group (defined below) appropriate training objectives for a theme were selected from a complete list of training objectives for that theme, generating a training module. The four (4) general classifications of trainees identified for the purposes of the modules are Designers, Management, Maintainers and Auditors. Each category of personnel has different learning objectives, which need to be addressed adequately in a training course. Each training module is therefore a well-thought out syllabus directed at
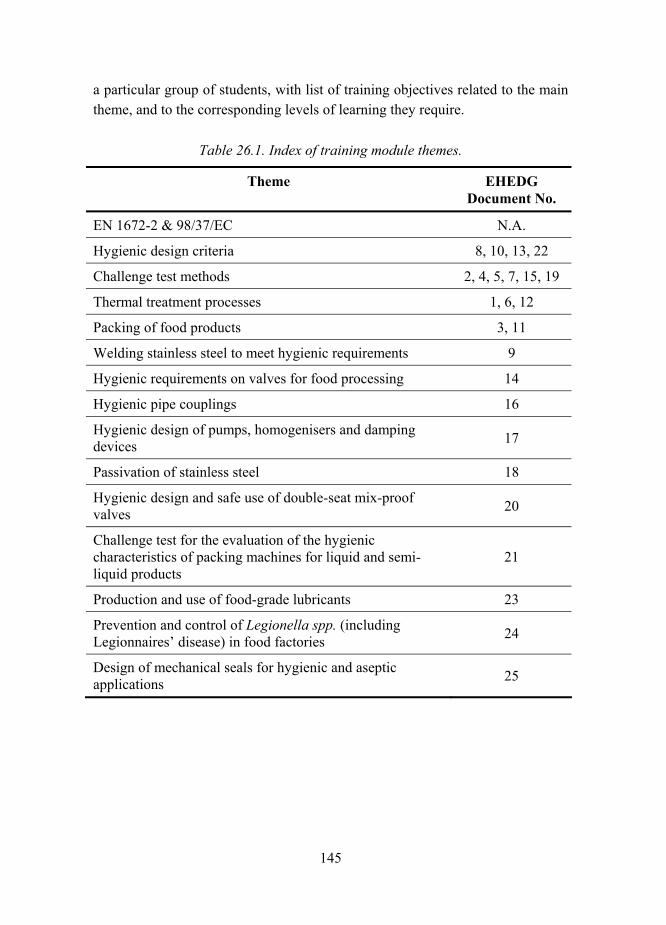
145
a particular group of students, with list of training objectives related to the main theme, and to the corresponding levels of learning they require.
Table 26.1. Index of training module themes.
Theme EHEDG Document No.
EN 1672-2 & 98/37/EC N.A.
Hygienic design criteria 8, 10, 13, 22
Challenge test methods 2, 4, 5, 7, 15, 19
Thermal treatment processes 1, 6, 12
Packing of food products 3, 11
Welding stainless steel to meet hygienic requirements 9
Hygienic requirements on valves for food processing 14
Hygienic pipe couplings 16
Hygienic design of pumps, homogenisers and damping devices 17
Passivation of stainless steel 18
Hygienic design and safe use of double-seat mix-proof valves 20
Challenge test for the evaluation of the hygienic characteristics of packing machines for liquid and semi-liquid products
21
Production and use of food-grade lubricants 23
Prevention and control of Legionella spp. (including Legionnaires disease) in food factories 24
Design of mechanical seals for hygienic and aseptic applications 25
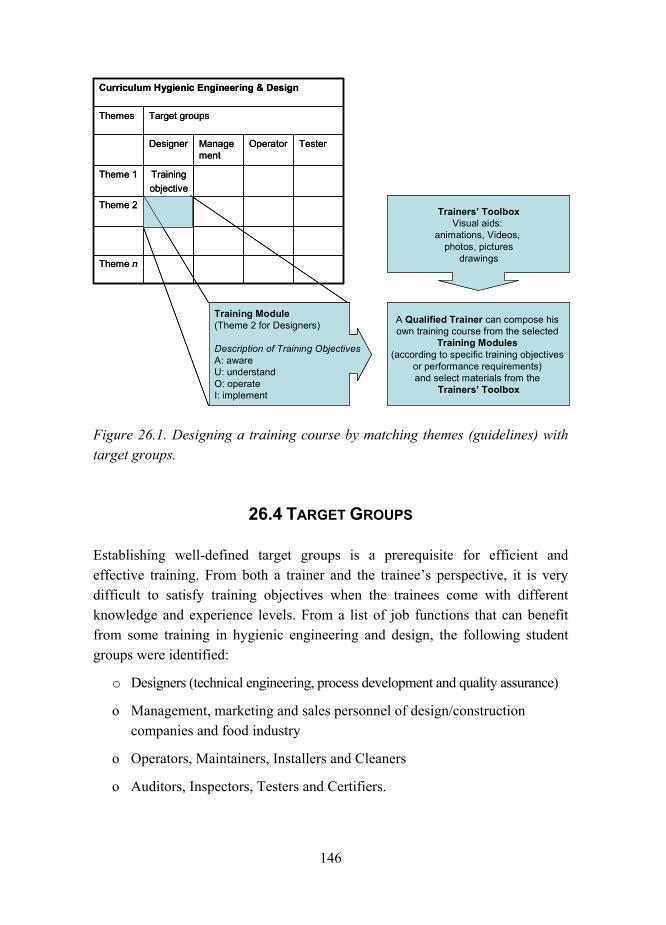
146
Curriculum Hygienic Engineering & Design
Theme n
Theme 2
Trainingobjective
Theme 1
TesterOperatorManagement
Designer
Target groupsThemes
Curriculum Hygienic Engineering & Design
Theme n
Theme 2
Trainingobjective
Theme 1
TesterOperatorManagement
Designer
Target groupsThemes
Training Module(Theme 2 for Designers)
Description of Training Objectives A: awareU: understandO: operateI: implement
A Qualified Trainer can compose his own training course from the selected
Training Modules(according to specific training objectives
or performance requirements) and select materials from the
Trainers Toolbox
Trainers ToolboxVisual aids:
animations, Videos, photos, pictures
drawings
Training Module(Theme 2 for Designers)
Description of Training Objectives A: awareU: understandO: operateI: implement
Training Module(Theme 2 for Designers)
Description of Training Objectives A: awareU: understandO: operateI: implement
A Qualified Trainer can compose his own training course from the selected
Training Modules(according to specific training objectives
or performance requirements) and select materials from the
Trainers Toolbox
Trainers ToolboxVisual aids:
animations, Videos, photos, pictures
drawings
Figure 26.1. Designing a training course by matching themes (guidelines) with target groups.
26.4 TARGET GROUPS
Establishing well-defined target groups is a prerequisite for efficient and effective training. From both a trainer and the trainees perspective, it is very difficult to satisfy training objectives when the trainees come with different knowledge and experience levels. From a list of job functions that can benefit from some training in hygienic engineering and design, the following student groups were identified:
o Designers (technical engineering, process development and quality assurance)
o Management, marketing and sales personnel of design/construction companies and food industry
o Operators, Maintainers, Installers and Cleaners
o Auditors, Inspectors, Testers and Certifiers.

147
To find the correct training module the trainer needs to select the theme as well as define his/her target group. Training methods need to be adapted to the background, function and experiences of each group. Hands-on learning will be more efficient to some, while others may learn adequately by traditional classroom methods. Suitable audio-visual aids and supplementary training materials always provide an extra dimension.
26.5 TRAINING OBJECTIVES
Training objectives are essential in the planning and conduct of a course. They are the basis for the preparation and production of course materials, examples and case studies. Guided by the Training Facilitator, the trainers task of ensuring that training objectives relevant to each guideline (theme) are taught is simplified. The Training Facilitator uses the following guide phrases to describe what trainees are expected to achieve:
o Must be aware of
o Must understand and able to describe
o Must be able to operate hygienically
o Must by able to implement in design activities for equipment and processes that produce safe foods.
It is assumed that a person must first be aware in order to understand and must first understand in order to operate or implement.
26.6 TRAINERS TOOLBOX
The Trainers Toolbox contains a series of pictures, drawings, movies, and animations that illustrate and visualise technical information and practical applications. The contents are a mixture of brand new high quality videos (see Figure 26.2), images and drawings extracted from the EHEDG guidelines as well as materials and footage collected from several food producers, equipment manufacturers and consultants throughout Europe. Subjects covered include welding, rheology, cleaning methods and practices, routing in a food factory, to

148
cite a few. The Toolbox will be continuously developed, updated and expanded as new guidelines are produced. Assessments and feedback received by trainers using existing materials will also ensure continuous improvement.
26.7 CONCLUSION AND PERSPECTIVES
In the hands of a qualified trainer, the Training Facilitator and Toolbox are ready-to-use instruments to help design comprehensive, streamlined and target-oriented hygienic engineering courses. EHEDG will organise a number of such courses around Europe for future trainers and end-users. Two levels are envisaged. The Basic level will focus on definitions, principles, generic criteria and basic applications in the industry. The Advanced level courses will be for selected people with some understanding of hygienic engineering and design concepts, plus a practical background in food safety, engineering, microbiology, etc. and will be taught by world-class teachers in hygienic-design Courses will be announced on the website www.ehedg.org.
Figure 26.2. Screen capture from the Trainers Toolbox. The picture shows guidance on orbital welding from the Welding DVD.

149
26.8 ACKNOWLEDGEMENTS
The HYFOMA project was funded by the European Commission under the Fifth Framework Programme Quality of Life and Management of Living Resources (QoL), Key Action 1 (KA1) on Food, Nutrition and Health (QLK1-CT-2000-01359). We would also like to thank A.W. Barendsz (TNO), J. Fernandes (Kraft Foods R&D Inc.), M.I. Llorca (AINIA), M.A. Mostert (Unilever R&D), P.Z. Pinto (AESBUC) and M. Reij (Wageningen University) for their contribution to the Training and Education document.

150

151
CHAPTER 27: COMPUTATIONAL FLUID DYNAMICS AS A TOOL IN PLANNING CLEANING PROCEDURES
FOR THE FOOD INDUSTRY
Satu Salo, Alan Friis* & Gun Wirtanen VTT, Espoo, Finland
* BioCentrum-DTU, Kgs. Lyngby, Denmark
The hygienic state of process surfaces in food production plants crucially affects the quality of products. Therefore hygienic requirements must be included in the design of the processes, hygienic integration of process equipment into process lines and in performing the cleaning procedure. Fluid flow plays an important role in production and cleaning. Specific hydrodynamic parameters have been proved to control cleaning in closed process systems. The work pertains extension of flow modelling to be applicable for improvement of the hygienic state of process tanks. The case study is limited to tanks for dairy and brewery applications. Computational fluid dynamics (CFD) is used in many applications to model bulk parameters of fluid flows. Model developments have made it possible to resolve what happens in specific positions on and near walls, which is of interest when studying cleaning processes. CFD models of tanks exist for purposes of optimizing the operation of processes like mixing and heating but not on cleaning. The extension pertains to combining the models for prediction of hygienic design of valves and pipes with conventional tank flow models and establishment of more information on the connections between surface characteristics and the cleaning effect of fluid flow. This gives a tool suitable for evaluation of efficiency of cleaning procedures in tanks and also for evaluation of processing. These CFD simulations give information on wall shear stresses in the tank and the flow rates in different parts of the system. On more realistic process applications the CFD model is extended to cover different tanks and spray balls. This was validated using microbial culturing methods modified for this application. The results from the pilot scale experiments studying a simple cleaning case supported well the simple case flow study performed. This has supported us in the hypothesis that a combination of knowledge in fluid dynamics and microbiology is an excellent base for hygienic design, hygienic integration of tanks into a system and evaluation of CIP cleaning systems.

152

153
CHAPTER 28: NEW SURFACE MATERIALS FOR FOOD PROCESS APPLICATIONS
Anne-Christine Ritschkoff , Riitta Mahlberg , Saila Jämsä, Mia Löija, Marke Kallio, Juha Mannila & Anne Pahkala
VTT, Espoo, Finland
Such materials as stainless steel, wood-based composites and glazed tiles, widely used in the constructions designed for food processing and kitchen environments are susceptible to contamination by different micro-organisms and dirt. The repellence and decontamination properties of material surfaces can be improved by using coating systems based on sol-gel hybrid concepts. By tailoring and optimising the composition of the sol-gel, the properties of the thin coatings can be directed to the desired direction. Currently, sol-gel technique has been commercially applied in products with anti-soiling properties. However, little of the durability properties and service life is known of these products. In this study, the anti-fouling and decontamination efficacy as well as durability of different, newly developed sol-gel hybrid coatings were evaluated by the means of contact angle measurement, Fourier Transform Infra Red Spectroscopy (FTIR) method developed for this particular application. The results revealed that all the selected coatings improved the anti-fouling and cleanability of the material surfaces.
28.1 INTRODUCTION
Soiling of surfaces is a major problem in everyday life as well as in many industrial processes. The soil adhesion and cleanability are affected by many different factors of which surface chemistry and topography are the most important. The prevention of the adhesion of soil to the material surface structures can be improved with smooth surface topography and low surface energy properties. Also the electroconductibility properties of the material surface affect the soil adhesion and cleanability [1]. Material surfaces can remain clean and free from impurities by passively repelling moisture and dirt which are, thereby, not adhered to the material. Similarly, surfaces functioning according to the "lotus effect" do not adhere impurities and are easily to be cleaned. The "lotus effect" is a principle of nature to give the lotus plant a stay-clean & easy-to-

154
clean mechanism and this concept can be adapted to the development work of new surfaces for every day life [2]. Modern coating techniques based on nanotechnology enable development, tailoring and characterisation of new coating systems which simulate this innovation of nature [2].
The anti-soiling and easy-to-cleaning properties of material surfaces can be improved by sol-gel hybrid coatings. Sol-gel hybrid coatings are promising new materials consisting of organic-inorganic composites with an amorphous nanoscale structure. The sol-gel coatings with thickness of about only several microns consist of different parent substances that will build a nanoscale network through hydrolysis and condensation reactions. By using different precursors the coatings have various combinations of properties depending of the structure and chemical nature of the coating [3]. The composition of the sol-gel coatings has a significant effect on the properties. Ceramic components give hardness and polymer components the flexibility and repelling properties for the tough and durable coatings [4, 5]. By tailoring and optimizing the composition of the sol-gel, the properties of thin coating can be directed to certain direction. The hybrid thin coatings can be tailored to have a good adhesion to many substrate materials [6]. One of the major advantages in using these coatings is their transparency to visible light and thereby, they do not remarkably change the appearance of the substrate [7].
Wood and wood-polymer composites, stainless steel and glazed ceramics are commonly used materials in the everyday household appliances and food processing environments. In many applications the material surfaces should maintain the clean and neat and shiny appearance. However, due to the softness and other material properties, such as porosity, the surfaces of such materials are susceptible to the penetration of greasy soiling agents, e.g. edible oils and other food based residues and greasy finger-prints, which leads to poorly cleanable contaminated areas. In this study, thin coatings with oleophobic and easy-to-clean properties were developed and coated on the material surfaces commonly used in the food processing environment. The anti-soiling and cleanability properties of the coated materials were characterized. Particular attention was focused on the abrasion resistance and durability of the thin coatings.

155
28.2 MATERIALS AND METHODS
The white melamine-coated chipboard and stainless steel substrates were selected to represent the materials with contamination problems with greasy soiling agents. The model substrates were coated with two silane-based, newly developed sol-gel coatings (PRO A and PRO B and one semi-commercial sol-gel coating. The coatings were applied by spill-coating and spray-coating methods. The chemical composition of the coatings varied in relation to the organic substance as well as to the concentration and composition of ceramic components. Ethanol was used as a solvent in the sol and water was added for the hydrolysis reaction. After the coating, the samples were heat-treated at temperatures of 100oC to form thin solid coatings through condensation reactions. Prior to the further property characterisations, the adhesion of the coatings was detected visually according to ASTM D 3359-02. The surface chemistry has significant influence on the adhesion and anti-soiling properties of the substrate surfaces. The data for the evaluation of wetting properties, estimation of surface free energy, hydrophobicity and oleophobicity of the non-coated and coated model substrates were assessed by using contact angle measurements (CAM 200 Optical Contact Angle Meter, KSV Instruments Ltd, CAM 200 software). The surface free energy measurements were carried out by using a solvent sequence containing distilled water and analytical grades of formamide, ethylene glycol and di-iodomethane. The contact angles of the probe liquids were used for calculations of the surface free energies of the different surfaces in the way described by Mahlberg et al. [8]. The assessments of hydrophobicity and oleophobicity of the non-coated and coated melamine-chipboard surfaces were carried out by measuring the contact angle of distilled water and oleic acid (analytical grade of C18H34O2).
The anti-soiling properties and cleanability of the non-coated and model substrates were assessed with soil-drop test developed at VTT. Each sample surfaces were contaminated with a spot of 0.5 µm of oleic acid as soiling agent. The follow-up of the shape and spreading tendency of the oleic acid spot on the non-coated and coated test material surfaces was performed visually. Prior to the cleaning test, the oleic acid spot was dispersed on the sample surface with rubber teat with the load of 62 kPa. The contaminated sample surface was wiped with dry micro-fibre cloth with the load of 0.7 kPa approximately. The extent of oleic acid on the sample surfaces before and after cleaning was qualitatively assessed by means of a microscope (40 x) (BioRad FTS 6000).

156
Material surfaces are exposed to different kinds of abrasion and rubbing during the service life (e.g. cleaning). The wet abrasion resistance simulating the normal cleaning process of thin coated model substrates was measured with a wet abrasion test (modified standard DIN 53 778) by using the Erichsen washing apparatus designed for paint films. Each test sample was exposed to 700 back and forth abrasion cycles. The abrasion was carried out with wetted (200%) micro-fibre cloth. The load applied on the sample surface was 0.7 kPa. The extent of the abrasion of the coated surfaces was assessed with contact angle measurements with water and oleic acid.
28.3 RESULTS
The sol-gel thin coatings selected to this study had an adequate adhesion to the melamine-chipboard and stainless steel substrates. Indication of significant brittleness or flaking off from the surface was not observed. The surface properties of the non-coated and sol-gel-coated melamine-chipboard and stainless steel samples were studied by determining the surface energy values (Table 28.1). The effect of coatings on the hydrophobic and oleophobic properties of model surfaces was assessed by contact angle measurements of water and oleic acid on the surfaces as a function of time (Figure 28.1).
Table 28.1. The surface energy values of uncoated and sol-gel coated melamine-chipboard substrate before and after back and forth wet abrasion cycles.
Surface energy values (mJm-2)
Before wet abrasion After 700r abrasion cycles
Material Sol-gel coatings
γp γd γs γp γd γs
white melamine-chipboard 6.6 30.8 37.4 nd nd nd PRO A 8.5 27.3 35.8 15.2 25.3 40.5 PRO B 4.8 13.4 18.2 10.2 16.9 27.1 Semi-commercial 1.3 15.1 16.4 6.3 17.9 24.2
stainless steel 3.9 30,9 34.8 PRO A 13.0 28.6 41.6 18.1 23.1 41.6 PRO B 2.9 15.4 18.3 9.8 13.1 22.9 Semi-commercial 3.3 8.5 11.8 2.8 20.3 22.3
nd = not detected

157
The surface energy results indicate that all the substrates (the non-coated as well as the coated surfaces) are rather non-polar in nature. The PRO A coating resulted in surface energy values comparable with the values of the non-coated surface. However, the PRO B and the semi-commercial coatings significantly decreased the total surface energy of the model surfaces. After the wet abrasion test, increase in the surface energy values of the coated surfaces was observed which indicates that some wearing of the coatings had taken place. The considerably clear increase in the polar component of the coatings could be due to decreased proportion of the non-polar polymeric component within the coatings. Spreading of water on the non-coated melamine-chipboard and stainless steel surfaces is quite limited already from the start. However, the resistance of the model surfaces against oil and greasy contaminants is rather weak. The surface energies show that the hydrophobic and oleophobic properties can be improved with thin coatings and the chemical composition of the coatings results in different surface properties. In general, coating materials containing high polymer concentrations possess good hydrophobic properties. The two newly developed thin coatings, PRO A and PRO B, vary in relation to the amount of ceramic proportion in the sol-gel matrix. The tailored sol-gel coating, PRO B, showed high hydrophobicity and oleophobicity. The ceramic nanocomposite coating PRO A did not show any improvement in the hydrophobicity and oleophobicity of the melamine chipboard substrate. The semi-commercial sol-gel coating selected to this study is referred as reference to the newly developed nanocomposite coatings (Figure 28.1). Hydrophobicity and oleophobicity of the chipboard could be clearly increased by the reference coating.
0
10
20
30
40
50
60
70
80
90
100
0 5 10 15 20 25 30Time (s)
Con
tact
ang
le o
f ole
ic a
cid
(deg
ees)
UntreatedPRO A without abr.PRO A with abr.PRO B without abr.PRO B with abr.
Figure 28.1. The contact angles of oleic acid on uncoated and thin coated stainless steel substrate prior and after 700 back and forth abrasion cycles.
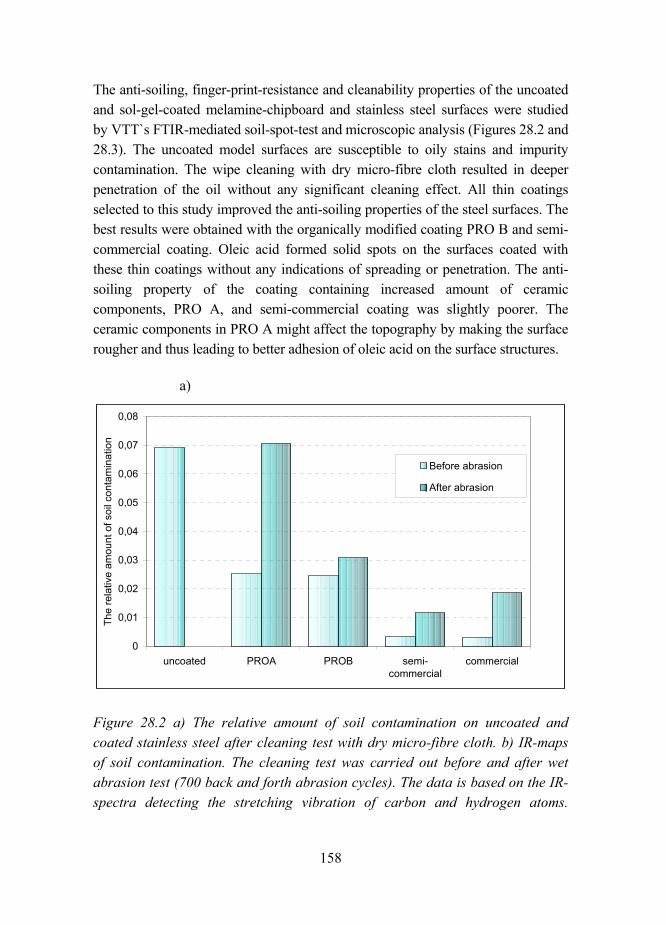
158
The anti-soiling, finger-print-resistance and cleanability properties of the uncoated and sol-gel-coated melamine-chipboard and stainless steel surfaces were studied by VTT`s FTIR-mediated soil-spot-test and microscopic analysis (Figures 28.2 and 28.3). The uncoated model surfaces are susceptible to oily stains and impurity contamination. The wipe cleaning with dry micro-fibre cloth resulted in deeper penetration of the oil without any significant cleaning effect. All thin coatings selected to this study improved the anti-soiling properties of the steel surfaces. The best results were obtained with the organically modified coating PRO B and semi-commercial coating. Oleic acid formed solid spots on the surfaces coated with these thin coatings without any indications of spreading or penetration. The anti-soiling property of the coating containing increased amount of ceramic components, PRO A, and semi-commercial coating was slightly poorer. The ceramic components in PRO A might affect the topography by making the surface rougher and thus leading to better adhesion of oleic acid on the surface structures.
a)
0
0,01
0,02
0,03
0,04
0,05
0,06
0,07
0,08
uncoated PROA PROB semi-commercial
commercial
The
rela
tive
amou
nt o
f soi
l con
tam
inat
ion
Before abrasion
After abrasion
Figure 28.2 a) The relative amount of soil contamination on uncoated and coated stainless steel after cleaning test with dry micro-fibre cloth. b) IR-maps of soil contamination. The cleaning test was carried out before and after wet abrasion test (700 back and forth abrasion cycles). The data is based on the IR-spectra detecting the stretching vibration of carbon and hydrogen atoms.

159
b)
0 500 1000 1500 2000VAR1
0
500
1000
1500
2000
VA
R2
0.000.030.060.090.120.15
VAR3
Uncoated
0 500 1000 1500 2000VAR1
0
500
1000
1500
2000
VA
R2
0.000.030.060.090.120.15
VAR3
0 500 1000 1500 2000VAR1
0
500
1000
1500
2000
VAR
2
0.000.030.060.090.120.15
VAR3
PRO A, before wet abrasion PRO A, after wet abrasion
0 500 1000 1500 2000VAR1
0
500
1000
1500
2000
VAR
2
0.000.030.060.090.120.15
VAR3
0 500 1000 1500 2000VAR1
0
500
1000
1500
2000
VAR
2
0.000.030.060.090.120.15
VAR3
PRO B, before wet abrasion PRO B, after wet abrasion
0 500 1000 1500 2000VAR1
0
500
1000
1500
2000
VAR
2
0.000.030.060.090.120.15
VAR3
0 500 1000 1500 2000VAR1
0
500
1000
1500
2000
VAR
2
0.000.030.060.090.120.15
VAR3
Semi-commercial, before wet abrasion Semi-commercial, after wet abrasion

160
Uncoated, before cleaning Uncoated, after cleaning
PRO A, before cleaning PRO A, after cleaning
PRO B, before cleaning PRO B, after cleaning
Semi-commercial, before cleaning Semi-commercial, after cleaning Figure 28.3. The behaviour of oleic acid droplet on the uncoated and coated melamine-chipboard substrates before and after cleaning.

161
28.4 DISCUSSION
The anti-soiling properties of melamine-chipboard and stainless steel substrates can be improved by applying hybrid nanocomposite thin coatings. In this study, best anti-soiling results were obtained with organically modified, hydrophobic coatings. The durability and abrasion resistance properties of thin coatings is, however highly dependent on the chemical composition and compatibility of components in the sol-gel coating. The polymeric component of the thin coating system is suggested to have a tendency to wear and scratch which can be seen as pronounced alteration in surface properties of the polymeric-rich coatings.
28.5 REFERENCES
1. A.W. Adamson. Physical chemistry of surfaces, (Wiley, London, 1990).
2. W. Barthlott and C. Neinhuis. Planta 202 (1997), pp. 18.
3. C.J. Brinker and G.W. Scherer. Sol-Gel Science: The Physics and Chemistry of Sol-Gel Processing (USA, 1990).
4. A.J. Atanacio, B. A. Latella, C.J. Barbé and M.V. Swain. Surface and Coatings Technology, in press.
5. J. Martínes Urreaga, M.C. Matías, V. Lorenzo and M.U. de la Orden. Mat. Lett. 45 (2000), pp. 293297.
6. K.H. Haas, S. Amberg-Schwab, K. Rose and G. Schottner. Surface and Coating Technology 111 (1999), pp. 7279.
7. C. Li, K. Jordens and G.L. Wilkes. Wear 242 (2000), pp. 152159.
8. Mahlberg, R., Niemi, H. E.-M., Denes, F. & Rowell, R.M. International Journal of Adhesion and Adhesives, 18 (1998), pp. 283297.

162

163
CHAPTER 29: FOOD HYGIENE NETWORKING IN EUROPE
Gun Wirtanen VTT, Espoo, Finland
Hygiene networking has been an important issue in the Nordic countries and pioneering networks have been built-up starting with the NORDFOOD-programmes in the early 90s. From an industrial point of view it is important to maintain and extend the interactive contacts between persons dealing with safety and environmental questions. The requirements for improved hygiene are being raised due to the development of the food industry, including prolonged shelf life, centralised production and long-distance transportation, automated cleaning systems, reduced cleaning time and demands for environmentally friendly cleaning agents. Three subsequent Nordic 3-year projects in dairy hygiene, Sanitation in dairies Sanitering i mejeri; Evaluation of cleaning agents and disinfectants for use in dairies: methods and mechanisms (DairyNI); and DairyNET Hygiene control in dairies, have been carried out from 1994 to 2004.
Networking between food industry, research institutes, equipment manufacturers and maintenance representatives is challenging since the knowledge gaps can be huge. Societies and organizations at national (e.g. Finnish Society of Food Sciences), Nordic (e.g. the Society Nordic Cleanroom Technology) and European (e.g. European Hygienic Design and Engineering Group (EHEDG) and the SAFE Consortium) food related societies have an important role in building up networks with experts from interdisciplinary fields involved in food hygiene.
In the 6th Framework programme EU has focused on networking by clustering projects into bigger entities than the projects themselves e.g. the PROEUHEALTH cluster focusing on food, GI-tract functionality and human health with 64 partners in 8 projects. The outcome from this cluster was spread

164
to the new EU member states (MS) and Associated Candidate Countries (ACC) through a Specific Support Action (SSA). The hygiene networking in the EU MS and ACCs will be launched in a SSA starting up in the near future. This SSA-action aims at knowledge sharing to prevent risks related to microbial hazards in food processing and to find areas for future research activities in food processing and packaging safety in the new EU. A crucial part in this type of actions is knowledge sharing on build-up and establishment of new RTD activities with industrial and research partners especially from the new EU Member States and ACCs.
Through the signing of a contract between the European Science Foundation (ESF) and the European Commission in September 2003 ESF provides the administrative, technical and scientific secretariat and management of European Cooperation in the field of Scientific and Technical Research (COST). This was the basis for a new partnership between the two networking organisations COST and ESF. The main reason to join forces was that this partnership would serve the scientific community and make better use of the existing instruments. ESF Standing Committee for Life, Earth and Environmental Sciences (LESC) and COST is providing important contributions to the discussion of Food Safety and the implementation of tools and standards for Food Security through COST actions, ESF programmes, EUROCORES, etc.
Furthermore, the SAFEFOODERA coordination action in EU will advance the integration of European food safety research activities and programmes carried out and co-ordinated on either national or regional level.

165
CHAPTER 30: FOOD HYGIENE IN ESTONIA
Raivo Vokk & Tiina Veskus Tallinn University of Technology, Tallinn, Estonia
To join the European Union, Estonias food control system had to be harmonized with the EU food regulations and directives. Although food law in the Member States had common objectives, the approach and structure of each Member State was rooted historically in the various culinary and cultural traditions. The Food Law adopted in 1999 has regulated the food safety requirements both in food control and inspection in Estonia. Besides the HACCP approach the Assured Safe Catering (ASC) has been implemented for caterers to produce guidance on applying the principles of HACCP to catering operations in order to avoid food safety problems and to guarantee safe food for consumers.
There are two authorities in Estonia responsible for food inspection Health Protection Inspectorate with its laboratory departments is responsible for food inspection in catering and food marketing while Food and Veterinary Board is responsible for all food enterprises. Estonian Veterinary and Food Laboratory (VAFL) are involved in the laboratory testing of food. VAFL operates as a reference laboratory. The organisational structure of VAFL includes four laboratories as follows: Central Veterinary and Food Laboratory in Tartu, Tallinn VAFL in Tallinn, Rakvere VAFL in Rakvere, Saaremaa VAFL in Kuressaare. Estonian Veterinary and Food Laboratory are accredited in the area of food and drinking water testing in accordance with EVS-EN ISO/IEC 17025 on General requirements for the competence of testing and calibration laboratories by the internationally certified Estonian Accreditation Centre.
The food inspectors of the VFB are responsible for official supervision and inspection of approved food establishments. It is clear that the officers should seek to identify risk arising from the activities of the business and the effectiveness of that business´s own assessment of hazards and control of risks. This approach should move the emphasis from final product testing and inspection of structure and layout of premises to raw material and process

166
control. Nowadays they take samples of products, process hygiene and water according to the official surveillance plans. Food business operators take samples of production according the testing frequencies based on their self-checking plans. Figure 30.1 presents the number of chemical and microbiological analyses under surveillance and self-checking performed in VAFL from 2001 to 2005.
0
20
40
60
80
Year
Ana
lyse
d sa
mpl
es, %
surveillance self-checking
surveillance 43 36 37 32 33
self-checking 57 64 63 68 67
2001 2002 2003 2004 2005
Figure 30.1. The number of chemical and microbiological analyses under surveillance and self-checking performed in VAFL during 20012005.
The Estonian Government has undertaken various programs including the cooperation program together with FAO Strengthening of the food control system in Estonia, and the PHARE project Assistance to upgrading the efficacy of the Estonian food processing industry together with a consulting company DLG (Germany). As a result of this project some special training programs and courses have been prepared in four main food sectors in Estonia: dairy, bakery, meat and fish sector. Lately, VTT (Finland) has performed a practical evaluation the pathogens-related risks in different dairies in Estonia. Nowadays food inspection is monitoring microbiological risks on the basis of the self-control systems of food entrepreneurs as described before.
Department of Food Processing, Tallinn University of Technology is one of the local leaders having good expertise and sharing knowledge about food hygiene, food safety, food legislation and other food safety related issues. Some special

167
training programs have been elaborated in collaboration with the University of Humberside and Lincolnshire (U.K.). Due to food legislation the importance of food hygiene and food safety has experienced an increasing attention by food industry and catering in Estonia. According to Council Directive 93/43/EEC on Food Hygiene, the food handlers have to assure food hygiene in the whole chain of food handling. Estonian Food Law, adopted in 1999 demands food hygiene training for every food handler. Since 1994 the food hygiene has been the subject of training. The three-level study programs have been designed according to the requirements of the EU Food Hygiene Directive and renewed according to the requirements of the EC No 852/2004 of the European Parliament and of the Council of 29 April 2004 on the hygiene of foodstuffs. The study program on food hygiene includes the basic study (6 h), the intermediate study (24 h), and the advanced study course (36 h). Since 1999 above 6000 of food and catering specialists have been taught at the basic level, and above 2000 specialised food handlers have been granted by the certificate of the intermediate level program.
Concerning the nutrition issues the Estonian Government has adopted National Health Program for Children and Teenagers in 1996. In the framework of the program a detailed training scheme has been elaborated and teaching materials have been designed and printed. In addition, a special hygiene training program for the food handlers in schools and nurseries has been worked out to meet new requirements on food safety in Estonia. 635 kindergartens and 634 schools have been inspected by the Health Protection Inspectorate in 2004, and the common results are presented in Table 30.1.
In recent decade, the Estonian food market has undergone major changes leading to increased concentration of retail trade and amazing variety of food items available to consumers. In fact, these changes have placed increased demands on consumers to be able to evaluate and teachers have to be taught in various aspects of information and claims for products including environmental and ethical aspects. It means that already in the schools introduction of new methodical approaches is necessary to cover the needs in knowledge concerning consumer issues.
Recent studies on the educational issues concerning food safety and microbiological risks in food showed very clearly that the major components of

168
the related to food hygiene topics have been included into syllabus of general education.
The continuous technological and economical development of companies in the food industry will be guaranteed if it is based on the total management of the whole production chain: starting from raw materials, and ending to consumer satisfaction. The quality assurance of the raw materials, sanitation and hygienic techniques for handling foods after processing are of particular importance.
Table 30.1. Health inspection of educational institutions and establishments of social welfare in 2004 in Estonia
County Number of premises
Number of inspected premises
% of inspected premises
Number of
analyses
Number of rejected checks
% of premises with rejected
checks Harjumaa 466 399 86 451 303 76
Järvamaa 66 56 85 95 28 50
Raplamaa 86 79 92 105 37 47
Jõgevamaa 64 61 95 81 56 92
Põlvamaa 57 56 98 77 50 89
Tartumaa 160 141 88 142 123 87
Valgamaa 67 67 100 75 20 30
Viljandimaa 101 92 91 98 68 74
Võrumaa 65 64 98 71 19 30
Hiiumaa 33 27 82 37 8 30
Läänemaa 79 79 100 86 15 19
Pärnumaa 105 105 100 141 64 61
Saaremaa 63 63 100 71 31 49
Ida-Virumaa 177 177 100 227 137 77
Lääne-Virumaa 125 123 98 142 14 11
Total 1714 1589 93 1899 973 61
169
CHAPTER 31: LUBRICANTS ARE THEY A SOURCE FOR MICROBIAL CONTAMINATION IN THE FOOD
INDUSTRY?
Kaarina Aarnisalo, Laura Raaska & Gun Wirtanen VTT, Espoo, Finland
Lubricants in food processing equipment decrease friction and wear, transfer energy and protect surfaces against corrosion. Food-grade lubricants must fulfil the requirements of legacy and be physiologically safe and neutral in taste and odour. Often new lubricant is added to lubrication points without prior cleaning of the residues from the surfaces. Survival and growth of pathogens Pseudomonas aeruginosa and Listeria monocytogenes and in commercially available lubricants, both food grade and non-food grade used in the food industry, were investigated. The bacteria were inoculated into lubricants and reduction or increase in amounts of bacteria was followed during two weeks test period. The potential transfer of these bacteria from stainless steel discs inoculated with bacteria into lubricants during 24 h test period was also investigated. The lubricants reduced the number of bacteria in most cases during the test period, but because of the survival of the bacteria, they may act as contamination. Clear transfer from surfaces to lubricants could be observed. A conveyer belt lubricant diluted in water was shown to best support growth and survival of bacteria. Clear differences in bactericidal properties between different lubricants were observed as well as differences in survival of P. aeruginosa and L. monocytogenes.
31.1 LUBRICANTS IN THE FOOD INDUSTRY
31.1.1 Requirements of Food-grade Lubricants
Lubricants in food processing equipment decrease friction and wear, transfer energy and protect surfaces against corrosion. During the production of foodstuffs including packaging in direct contact with the product it is essential to avoid contamination with lubricants from machine elements such as gears, bearings, hydraulics, pneumatics, compressors, slideways and chains (ISO, 2006). Food-grade lubricants must fulfil the requirements of legacy and be physiologically safe
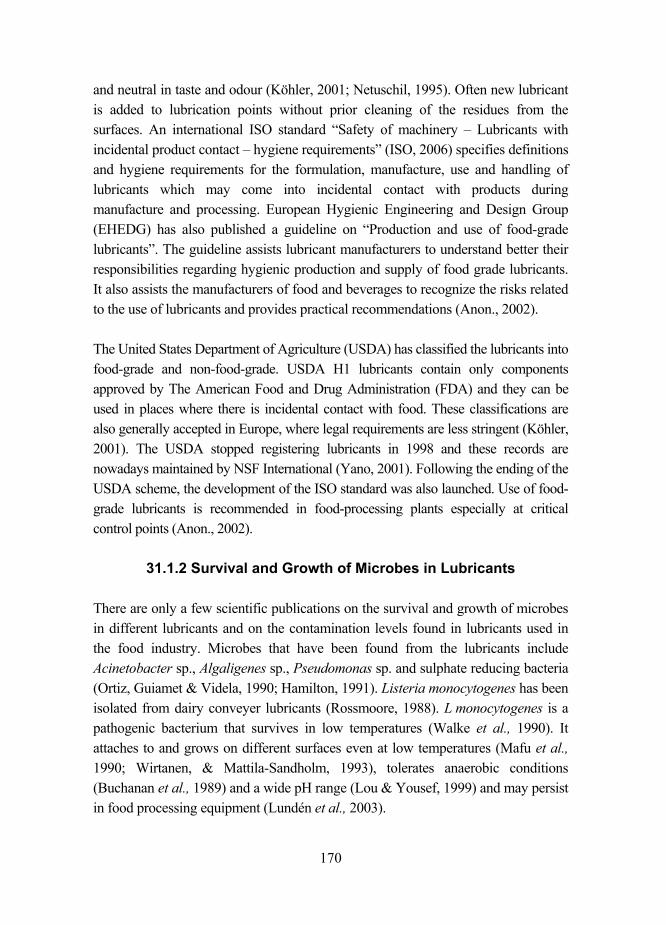
170
and neutral in taste and odour (Köhler, 2001; Netuschil, 1995). Often new lubricant is added to lubrication points without prior cleaning of the residues from the surfaces. An international ISO standard Safety of machinery Lubricants with incidental product contact hygiene requirements (ISO, 2006) specifies definitions and hygiene requirements for the formulation, manufacture, use and handling of lubricants which may come into incidental contact with products during manufacture and processing. European Hygienic Engineering and Design Group (EHEDG) has also published a guideline on Production and use of food-grade lubricants. The guideline assists lubricant manufacturers to understand better their responsibilities regarding hygienic production and supply of food grade lubricants. It also assists the manufacturers of food and beverages to recognize the risks related to the use of lubricants and provides practical recommendations (Anon., 2002).
The United States Department of Agriculture (USDA) has classified the lubricants into food-grade and non-food-grade. USDA H1 lubricants contain only components approved by The American Food and Drug Administration (FDA) and they can be used in places where there is incidental contact with food. These classifications are also generally accepted in Europe, where legal requirements are less stringent (Köhler, 2001). The USDA stopped registering lubricants in 1998 and these records are nowadays maintained by NSF International (Yano, 2001). Following the ending of the USDA scheme, the development of the ISO standard was also launched. Use of food-grade lubricants is recommended in food-processing plants especially at critical control points (Anon., 2002).
31.1.2 Survival and Growth of Microbes in Lubricants
There are only a few scientific publications on the survival and growth of microbes in different lubricants and on the contamination levels found in lubricants used in the food industry. Microbes that have been found from the lubricants include Acinetobacter sp., Algaligenes sp., Pseudomonas sp. and sulphate reducing bacteria (Ortiz, Guiamet & Videla, 1990; Hamilton, 1991). Listeria monocytogenes has been isolated from dairy conveyer lubricants (Rossmoore, 1988). L monocytogenes is a pathogenic bacterium that survives in low temperatures (Walke et al., 1990). It attaches to and grows on different surfaces even at low temperatures (Mafu et al., 1990; Wirtanen, & Mattila-Sandholm, 1993), tolerates anaerobic conditions (Buchanan et al., 1989) and a wide pH range (Lou & Yousef, 1999) and may persist in food processing equipment (Lundén et al., 2003).

171
Pseudomonas aeruginosa is an opportunistic pathogen which has been associated with water-borne illnesses. It has ability to live in biofilms in water distribution systems, where it can act as a continuous source of contamination (Sharma et al., 2003). The possible role of lubricants taking part in the survival of P. aeruginosa and L. monocytogenes should be further investigated.
In the study of Aarnisalo and co-worker (2006) a mail survey on equipment hygiene was sent to 184 Finnish food companies. The employee, who was the equipment hygiene expert in the company, was asked to answer the survey. Almost all (95.2%) (n = 44) respondents reported use of lubricants in their companies. 21.4% (n = 42) of respondents had noticed hygiene problems in use of lubricants. According to the respondents who answered to multiple choice question (n = 11) lubricants collect a lot of soil (72.7%), lubricant residues are left on production surfaces after maintenance work (63.6%), lubricants cannot be cleaned off from the surfaces sufficiently (54.5%) and a lot microbes are detected from samples taken from sites containing lubricants (36.4%).
31.2 TESTS FOR SURVIVAL AND GROWTH OF L. MONOCYTO-GENES AND P. AERUGINOSA IN COMMERCIAL LUBRICANTS
Survival and growth of pathogens P. aeruginosa and L. monocytogenes in commercially available pure lubricants, both food grade and non-food grade used in the food industry, were investigated and compared. Transfer of bacteria from the surface of stainless steel disc to lubricant was also studied.
31.2.1 Materials and Methods
The bacteria were inoculated into lubricants and reduction or increase in amounts of bacteria was followed during two weeks test period in the temperatures of 5°C, 20°C and 40°C. The results of one strain of P. aeruginosa (I) and three strains of L. monocytogenes (III, VTT E-981012 and VTT E-991205) were compared. Samples were taken after 0.5 h (control sample), 4 h, 24 h, 3 d and 14 d. The samples (0.5 g) were taken in triplicate each time and pipetted in 4.5 ml of inactivation solution (Aarnisalo et al., 2000) and the solution was allowed to stand for 5 min before culturing.

172
The lubricants tested included food industry lubricant (grease, USDA H1) based on synthetic hydrocarbon (7080%) (A); silicone based conveyer belt lubricant (0.3% water solution in use); chain lubricant based on synthetic vaseline (C); rapeseed oil (100%) (D) and dry(not diluted with water) conveyer belt lubricant (F) containing polyhydric alcohols and a small amount of silicone emulsion. The potential transfer of these bacteria from stainless steel discs inoculated with bacteria into lubricants at 5°C during 24 h test period was also investigated. Growth broth (0.1 ml) containing 108
CFU/ml bacteria was pipetted on the surface of sterile stainless steel discs (AISI 304, 2B, 10.5 mm in diameter, Happoteräs Oy, Helsinki, Finland). The discs were dried and transferred to 10 g of soiled lubricant. After 1, 4 and 24 h, three discs were removed from three test tubes and the tubes were incubated at refrigerated (5°C) temperature. After taking the samples, dilution series was prepared in pre-warmed (35°C) 0.85% Tween-saline solution. P. aeruginosa was cultivated on Nutrient agar (30°C, 2 days) and L. monocytogenes on Oxford agar (30°C, 3 days).
31.2.2 Results and Discussion
The results of survival and growth of P. aeruginosa are presented in Figures 31.1ac and results of transfer studies of P. aeruginosa and L. monocytogenes from the surface of stainless steel disc to lubricants in Table 31.1. The synthetic conveyer-belt lubricant containing silicone and diluted in water (B) supported the survival of P. aeruginosa, as also the survival of L. monocytogenes at all temperatures. Another conveyer belt lubricant (F, dry, not diluted with water) reduced the number of P. aeruginosa and L. monocytogenes the better the higher the temperature was.
A decrease of 2.72.9 logs could be seen in numbers of L. monocytogenes in USDA H1 approved grease (A) after 14d in all temperatures. It destroyed P. aeruginosa completely after 24h at 5°C and 40°C, but the number of bacteria even increased slightly at 20°C. Chain lubricant based on synthetic vaseline (C) destroyed P. aeruginosa completely after 24h at all temperatures. In case of L. monocytogenes, the bacteria survived best at 40°C but were nevertheless destroyed completely after 14d. The rapeseed oil (D) supported the survival of L. monocytogenes but numbers of P. aeruginosa (results not shown in the Figs.) were reduced 3.54.5 log units during 14d test period. Neither of the bacteria were transferred from the surface of stainless steel disc to 10 g of lubricant at 5°C during a 24-h incubation period in case of USDA approved grease lubricant A and rape seed oil D (Table 31.1). Vice versa, bacteria were clearly transferred from surfaces
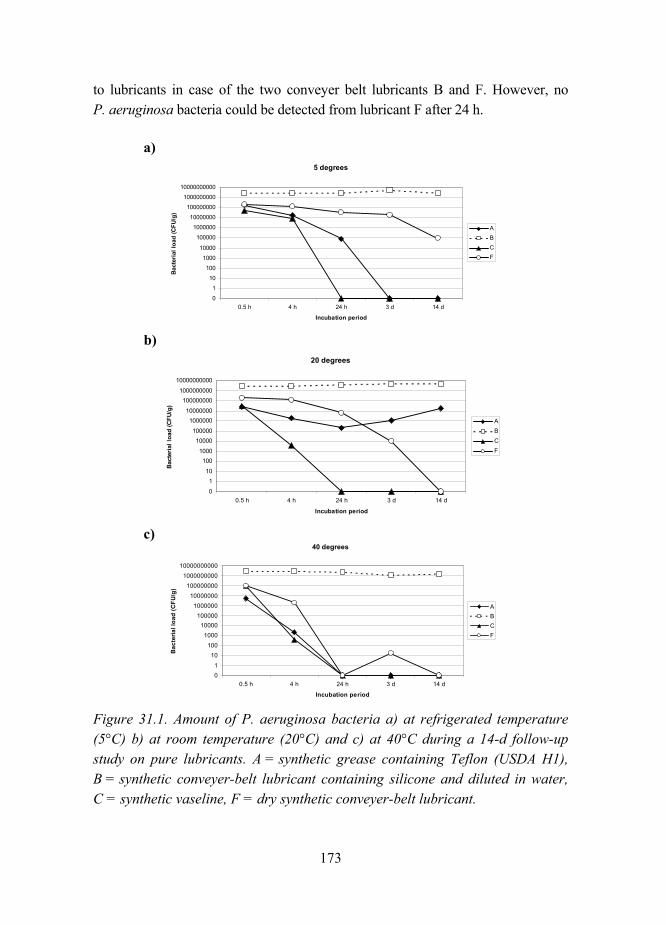
173
to lubricants in case of the two conveyer belt lubricants B and F. However, no P. aeruginosa bacteria could be detected from lubricant F after 24 h.
a) 5 degrees
0
1
10
100
1000
10000
100000
1000000
10000000
100000000
1000000000
10000000000
0.5 h 4 h 24 h 3 d 14 d
Incubation period
Bact
eria
l loa
d (C
FU/g
)
ABCF
b)
20 degrees
0
110
1001000
10000100000
100000010000000
1000000001000000000
10000000000
0.5 h 4 h 24 h 3 d 14 d
Incubation period
Bac
teri
al lo
ad (C
FU/g
)
ABCF
c)
40 degrees
01
10100
100010000
1000001000000
10000000100000000
100000000010000000000
0.5 h 4 h 24 h 3 d 14 d
Incubation period
Bac
teria
l loa
d (C
FU/g
)
ABCF
Figure 31.1. Amount of P. aeruginosa bacteria a) at refrigerated temperature (5°C) b) at room temperature (20°C) and c) at 40°C during a 14-d follow-up study on pure lubricants. A = synthetic grease containing Teflon (USDA H1), B = synthetic conveyer-belt lubricant containing silicone and diluted in water, C = synthetic vaseline, F = dry synthetic conveyer-belt lubricant.

174
Table 31.1. Transfer of P. aeruginosa (strain I) and L. monocytogenes (average of strains III and VTT E-991205) from the surface of stainless steel disc to 10 g of lubricant at 5°C during a 24-h incubation period.
a Inoculum, log CFU /disc
31.3 CONCLUSIONS
The pure lubricants reduced the number of bacteria in most cases during the test period, but because of the survival of the bacteria, lubricants may act as contamination sources. In general, the numbers of P. aeruginosa were reduced more easily than L. monocytogenes. A conveyer belt lubricant diluted in water was shown to best support growth and survival of P. aeruginosa and L. monocytogenes and in case of both bacteria, the dry conveyer belt lubricant (not diluted in water) was more hygienic choice. Clear differences in bactericidal properties between the tested lubricants were observed. Clear transfer of both
Result (log CFU/g) Lubricant Time/h
P. aeruginosa L. monocytogenes [st.dev.]
A 0 8.17 a 7.59 [0.12]a 1 0 0 4 0 0 24 0 0
B 0 7.95a 7.40 [0.21]a 1 6.84 4.78 [0.30] 4 6.94 5.76 [0.08] 24 6.47 5.61 [0.96]
D 0 7.95a 7.45 [0.09]a 1 0 0 4 0 0 24 0 0
F 0 8.17 a 7.40 [0.21]a 1 4.86 4.78 [1.70] 4 3.42 4.90 [1.63] 24 0 4.85 [1.44]

175
bacteria from stainless steel surfaces to lubricants could be observed in case of two conveyer belt lubricants indicating that lubricants may assist the transfer of bacteria to other surfaces. Residues of old lubricants should be removed from surfaces before adding new lubricants and the number of bacteria in lubrication points should be followed regularly.
31.4 ACKNOWLEDGEMENTS
The technical assistance of Taina Holm, Erja Järvinen and Mari Arpiainen is gratefully acknowledged.
31.5 REFERENCES
1. Aarnisalo, K., Salo, S., Miettinen, H., Suihko, M.-L., Wirtanen, G., Autio, T., Lunden, J., Korkeala, H. & Sjöberg, A.-M. (2000). Bactericidal efficiencies of commercial disinfectants against Listeria monocytogenes on surfaces. J. Food Safety, 20, pp. 237250.
2. Aarnisalo, K., Tallavaara, K., Wirtanen, G., Maijala, R. & Raaska, L. 2006. Hygienic working practices of maintenance personnel and equipment hygiene and in the Finnish food industry. Food control, in press.
3. Anon., 2002. EHEDG Guidelines. Doc. 23 Production and use of food-grade lubricants, UK: European Hygienic Equipment Design Group.
4. Buchanan, R.L., Stahl, H.G. & Whiring, R.C. 1989. Effects and interactions of temperature, pH, atmosphere, sodium chloride and sodium nitrite on growth of Listeria monocytogenes. J. Food Prot., 52, pp. 844851.
5. Hamilton, W.A. 1991. Sulphate-reducing bacteria and their role in biocorrosion. In: Flemming, H.-C. & Geesey, G.G. (Eds) Biofouling and biocorrosion in industrial water systems, Berlin, Germany: Springer-Verlag. Pp. 187193.
6. ISO 21469. 2006. Safety of machinery Lubricants with incidental product contact hygiene requirements, Switzerland: International Organization for Standardization.

176
7. Köhler, C.R. 2001. Food-grade lubricants for the food processing industry. New Food, 4, pp. 4954.
8. Lou, Y. & Yousef, A.E. 1999. Characteristics of Listeria monocytogenes important to food processors. In: Ryser, E.T. & Marth, E.H. (Eds) Listeria, listeriosis and food safety, New York, U.S.A: Marcel Dekker. 2nd ed. Pp. 131224.
9. Lundén, J., Autio, T., Markkula, A., Hellström, S. & Korkeala, H. 2003. Adaptive and cross-adaptive responses of persistent and non-persistent Listeria monocytogenes strains to disinfectants. Int. J. Food Microbiol., 82, pp. 265272.
10. Mafu, A.A., Roy, D., Goulet, J. & Magny, P. 1990. Attachment of Listeria monocytogenes to stainless steel, glass, polyprophylene, and rubber surfaces after short contact times. J. Food Prot., 53, pp. 742746.
11. Netuschil, K. 1995. Hygienic lubrication in the food processing and pharmaceutical industry. Food Tech. Europe., 2, 82, pp. 8486, 8890.
12. Ortiz, C., Guiamet, P.S. & Videla, H.A. 1990. Relationship between biofilms and corrosion of steel by microbial contaminants of cutting-oil emulsions. Int. Biodeterior., 26, pp. 315326.
13. Rossmoore, K. 1988. The microbial activity of glutaraldehyde in chain conveyer lubricant formulations. In: Houghton, D.R., Smith, R.N. & Eggins, H.O.W. (eds.) Biodeterioration. London, UK: Elsevier Publishers Ltd., 7, pp. 242247.
14. Sharma, S., Sachdeva, P. & Virdi, J.S. 2003. Emerging waterborne pathogens. Appl. Microbiol. Biotechnol., 61, pp. 424428.
15. Walker, S.J., Ascher, P. & Banks, J.G. 1990. Growth of Listeria monocytogenes at refrigeration temperatures. J. Appl. Bacteriol., 68, pp. 157162.

177
CHAPTER 32: FOOD SAFETY IN THE EUROPEAN TECHNOLOGY PLATFORM FOOD FOR LIFE
Harmen Hofstra SAFE Consortium, Brussels, Belgium

178

179
CHAPTER 33: COMPARISON OF DIFFERENT TEST METHODS FOR TESTING FABRICS FOR USE IN
HIGH HYGIENE AREA
Lorenz Michael & Tuija Luoma* L. Michael Oy, Äetsä, Finland
* VTT, Tampere, Finland
Regulations and instructions in food industry dont give a simple way to evaluate a sufficient level of personal protection in high hygiene areas. There are many methods for testing antibacterial activity and transferred particles. In high hygiene areas it is essential to wear clothing which protects against contamination and particles. A person is a significant particle and microbe source in high hygiene production. It's therefore necessary to minimize contamination and released particles which are generated and transferred by personnels activities. Special clothing helps to control the particle and microbiological dispersion from people and hence the contamination within high hygiene production. There are many factors which influence the clothings and fabrics suitability to the high hygiene area. This presentation discusses e.g. these standpoints.
33.1 INTRODUCTION
The regulation on food hygiene states that food-handlers must be supervised and instructed in food hygiene matters commensurate with their work activity. Every person working in a food-handling area have to maintain a high degree of personal cleanliness and have to wear suitable, clean and, where necessary, protective clothing (EC Regulation No 852/2004). Regulations and other instructions dont although give a simple way to evaluate the functionality of personal protection. The regulations and instructions consider mostly the manufacturing equipment and processes. The personal protection and protective clothing are discussed less.

180
There are many standards and methods to evaluate an antibacterial activity of materials. Suitable clothing for clean production is essential in high hygiene area. This kind of clothing protects the person and the product against impurities (e.g. particles and microbes from the person). It is very critical to have a sufficient protection against contamination and released particles which are generated and transferred by personnels activities. The ability to protect against contamination and particles depends on the properties of the cleanroom garment system and the textile material of the cleanroom garment. There are different kinds of cleanroom clothing for different kinds of clean productions.
There are many factors that influence cleanroom garments protectiveness, e.g. the material, design and seams of the cleanroom garment. In common a cleanroom fabric is made from synthetic fibres (e.g. polyester and polyamide) which release fewer particles than natural fibres (e.g. cotton) and can be dense weaved. The fabric has also many different properties which have an effect e.g. on the fabrics cleanliness and comfortableness.
33.2 TEXTILE MATERIALS AND FABRIC CONSTRUCTIONS
Fabric properties depend on the fibre and yarn properties, such as fibre fineness, fibre structure, fibre length, fibre type, yarn count, yarn structure and yarn type. They also depend on the fabric construction, density, thickness and any finishing treatments used in manufacturing process.
33.2.1. Raw Materials
Textile fibres originate from vegetables, animals or oil. They can be divided into natural fibers (e.g. cotton, coir, flax, jute, wool, silk and asbestos) and man-made fibers (e.g. viscose, modal, acetate, polyamide, acrylic, polyester and polypropylene). The raw material of the fabric has a major impact on the cleanliness of the fabric.
Natural fibers generally absorb moisture very well but wrinkle easily. These fibers have limited strength (except linen which has good strength properties). Washing and dyeing may be difficult, e.g. wool and silk.
181
The properties of man-made fibers can be modified during the manufacturing process. Man-made fibers can be divided into three groups regenerated, synthetic and inorganic fibers. Synthetic fibers in generally do not absorb moisture and they are considered easier to wash and dye than natural fibers. For example polyester has a high dry and wet strength and good resistance to the chemicals and microbes.
33.2.2 Fabric Structure
A fabric may release particles to the high hygiene area from the surface of the fabric (e.g. fibers from the fabric) or through the fabric (holes in the fabric structure).
Fabrics can be divided into three main types woven, knitted and nonwoven fabrics. They are made either of yarns, fibers or their combinations. Textile fibers are either filament fibers or staple fibers. Most natural fibers are in a staple form. Synthetic fibers can be made to a filament form.
Woven fabrics are formed by warpyarns and weftyarns which cross each other. The way the warps and wefts cross each other is called a weave. There are different types of weaves. The type of the weave has a major effect on the fabrics cleanliness. Most common weave types are plain weave, twill and satin. The plain weave is very dense and quite inflexible. The twill weave is quite flexible and the satin weave is lustrous and very flexible. A plain weaved fabric releases fewer particles through the fabric than satin weaved fabric because the plain weave is dense and the satin weave is quite loose structure. However the plain weaved fabric may feel inflexible and stiff as a material of a garment.
Knitted fabrics are formed by loops of a single yarn and they are very elastic. Because of their loose structure, knitted fabrics arent suited for high hygiene areas.
Nonwoven fabrics are composed of fibers (fibrous webs) that are mechanically, thermally or chemically bonded to each other. Nonwoven fabrics are paperlike and used for example as waddings and disposable single-use products. The linting properties (released particles from a material) depend on the used fibers and bonding method.

182
33.3 PERSON AS SOURCE OF CONTAMINATION
Personnel are usually a significant particle and airborne microbe source in high hygiene production areas. It is essential that workers in high hygiene areas are trained to proper cleanroom behaviour and they fully understand contamination risks.
A worker shed millions of particles into air of high hygiene production area. Visible particles include bacteria, moulds and yeast and nonviable may include hair, dead skin cells and dandruff. Loose fabric particles from clothing can also contribute to contamination. The higher the demand for cleanliness, the greater is the need for contamination control which leads to a full-body cleanroom clothing system. The difference in released particles when person is moving and dressed in normal cotton clothing or in cleanroom clothing is illustrated in Figure 33.1.
Clothing for clean production is typically made from synthetic fibers, such as polyester. When a fabric is woven from threads made from continuous synthetic monofilaments, it ensures very few released particles from the fabric.
BODYBOX, emitted particles (0.5 - 10 µm)
0
1000
2000
3000
4000
5000
6000
7000
8000
9000
10000
Normal clothing Reusable cleanroom clothing
Emitt
ed p
artic
les,
ave
rage
dur
ing
mov
emen
t [pa
rtic
les/
s]
Figure 33.1. Released particles of normal clothing and cleanroom clothing in a bodybox test.

183
33.4 ASPECTS OF SELECTING MATERIALS AND GARMENTS FOR HIGH HYGIENE AREA
It is not an easy task to select the proper materials and garments for use in high hygiene areas. There are some material properties that have an influence on the choice. No property is the most important. It depends on the end use of a garment and compromises have to be made. The target should be to find the most comfortable combination that can be chosen.
33.4.1 General Fabric Properties
Breathability
This generally used term has a very misleading name. The correct name should be Water Vapour Transmission. It counts the amount of water that can be transported through a material from the human body as water vapour. In a normal room temperature a typical value is 56 000 g/m2d for most typical fabrics used. If this value is 0 a garment is very uncomfortable to use. Many finishes used for barrier materials do not affect this value. Roughly you can say that 50% of this property still can be comfortable.
Air Permeability
Air permeability measures how open or dense the material is. It also measures the pore size of the material. It correlates with the property of a material to protect against particle penetration. This also can improve the breathability (WVT) as more air passing through takes more water vapour through the material. Comfortable materials with some barrier properties have values about 50 l/dm2s. For more suitable barrier materials the value is less than 10. For total block materials the value of air permeability is 0.
Resistance to Liquid Penetration
Resistance to liquid penetration is a property which is always achieved by chemical treatment of the fabric. How good the treatment is and against what liquid it protects is very depending on chosen method of application and also the structure of the fabric. A typical case is to take a dense woven material with air

184
permeability less than 10 and treat it with a FC (Fluor Carbon) finishing. You get a resistance to water of 200600 mmH2O (water column). If the liquid includes solvents (alcohol) the value goes down. Such a treatment is durable for between 5 and 15 washes after which it has to be reactivated. So what does this mean?
Commonly a material is considered to be rainproof if the water column is 1350 mm. If you are sitting on a wet bench or driving a motorbike in the rain this value is considered to have to be over 4000 mm. Normal rainwear on the market usually promise 2000 mm, high tech products 510 000 mm. Demands for surgical gowns, standard performance, is 200 mm. High performance is 600 mm. Up to 2000 mm is achieved by coating techniques, higher values only by laminating a liquid proof film to the material.
Hydrofilicity
This is the property of a fabric to absorb and transport water. The material coming close to the body favourably should be hydrophilic. This means that it actually transports water away from the body where it can evaporate, thus keeping the body dry. This kind of quality can be added to a material chemically, at the same time improving soil release properties (easy to get dirt away when washing).
33.4.2 Some Specific Properties for Cleanroom Applications
Linting
Linting properties of a material tell about the amount of loose particles and the size of those particles coming off the fabric during movement. Released particles can originate from the fabric itself or they are foreign particles attached to the fabric. In praxis only polyester filament fabrics are lint free. Also laminated fabrics are OK, but coated fabrics may cause lint after washing.
Resistance to Microbial Penetration Dry
Resistance to dry microbial penetration measures the active microbial particles in dry form passing through the fabric. Dense materials easily pass this test.

185
Resistance to Microbial Penetration Wet
Resistance to wet microbial penetration measures the active microbial items in liquid form passing through the fabric. The material has to be chemically treated with a liquid resisting treatment. To be sure that the material is working also after washings a total liquid block (film) should be used. It can also have a water vapour transmission property making garments comfortable to wear.
Electro Static Discharge
Depending on the working environment the electrostatic properties of materials should be also considered. In some working environments electrostatic discharges may cause danger to people or damage sensitive components. In that case specific requirements for textiles are necessary and specifications are given by the user.
Synthetic textile materials are used everywhere as working garments and favourable they should contain a wash proof antistatic property. The most common way to do this is to attach carbon yarns into the material. There are sure to be many more important properties to consider. It is anyway not possible to build in all the good properties you need into one material. Many times the best solution is to combine different materials in many layers.
33.5 CONCLUSIONS
The regulation on food hygiene states that every person working in a food-handling area have to maintain a high degree of personal cleanliness and have to wear suitable, clean and, where necessary, protective clothing. Regulations and other instructions do not although give simple and clear information for choosing the right protection level for personal protection. Personnel are usually a significant particle and airborne microbe source in high hygiene areas. It is essential that every person working in food-handling are trained to proper behaviour in the clean and high hygiene manufacturing area and they fully understand contamination risks.
It is not easy to select proper materials and garments for high hygiene areas. For example there are many garment and fabric properties that have an influence on the choice. The level of production cleanliness and gives the foundation for

186
selecting the right materials for clean and high hygiene production. For example the body-box method gives information on the garmenthuman systems level as a particle source. From a single fabric many properties e.g. breathability, air permeability, resistance to liquid penetration, hydrofilicity, linting, resistance to microbial penetration and electrostatic properties should be considered when selecting the most suitable material for the high hygiene area. It is essential to find the most suitable combination.
33.6 ACKNOWLEDGEMENTS
We would like to thank Satu Salo and Salme Nurmi at VTT and Maarit Kaihlanen for their input to the work.
33.7 REFERENCES
1. Corrigendum to Regulation (EC) No 852/2004 of the European Parliament and of the Council of 29 April 2004 on the hygiene of foodstuffs. 30.4.2004. Official Journal of European Union L 139. 18 pp.
2. Regulation (EC) No 178/2002 of the European Parliament and of the Council of 28 January 2002 laying down the general principles and requirements for food law establishing the European Food Safety Authority and laying down procedures in matters of food safety. 1.2.2002. Official Journal of European Union L 31. 23 pp.
3. Regulation (EC) No 1935/2004 of the European Parliament and of the Council of 27 October 2004 on materials and articles intended to come into contact with food and repealing Directives 80/590/EEC and 89/109/EEC. 13.11.2004. Official Journal of European Union L338. Pp. 417.
4. Wirtanen, G & Raaska, L. 2005. Food safety regulations, standards and guidelines in Europe. 36th R3-Nordic Contamination Control Symposium. Linköping. Sweden. 2325 May 2005. Pp. 151160.

CLEANROOM CLOTHING SESSION

189
CHAPTER 34: CLEANROOM CLOTHING SYSTEMS TEST RESULTS
Bengt Ljungqvist and Berit Reinmüller KTH (Building Services Engineering), Stockholm, Sweden
34.1 REVIEW
People disperse fragments from the skin and the airborne dispersion will vary from person to person and from time to time. The prime function of cleanroom clothing is as a filter protecting the products and processes from airborne contamination. Clothing systems should be designed to envelope a person and not allow significant amounts of contaminants to be dispersed into the cleanroom. Properties of the fabric used for cleanroom clothing can be evaluated by measurements of air permeability, particle retention and pore size. The fabric itself should disperse the minimum of particles and be resistant to breakdown and tearing. However, the effectiveness of cleanroom clothing will deteriorate due to factors such as aging, wear, washing, drying and sterilization.
Today clothing and clothing systems for cleanrooms are mainly tested with regard to material properties, such as particle generation, particle filtration and resistance to wear. The dispersal chamber or body-box has been used for studying the protective efficacy of clothing systems in use. At KTH in Stockholm, a modified dispersal chamber has been installed, see Figure 34.1. Over the last seven years, tests and comparative studies have been performed in the dispersal chamber on selected clothing systems.
Results have been reported in the book Cleanroom Clothing Systems, People as a contamination source (1) from tests carried out with clothing systems which have passed through 1, 25 and 50 washing and sterilization cycles, respectively. Results from a comparison of underwear used in combination with the cleanroom coverall show lower levels of released airborne contaminants when long-sleeved cleanroom undershirts were used together with long-legged cleanroom underpants.

190
Changingarea
Body-box
HEPAfilter
Exhaustfan
Figure 34.1. Principal arrangement of the dispersal chamber (body-box) used for evaluation of clothing systems.
The results are given in total number of airborne particles (≥0.5 µm and ≥5 µm) per cubic meter and airborne aerobic colony forming units (CFU) per cubic meter. Statistical evaluation of the results has been performed. From the averaged results, the source strengths of the contamination source people wearing modern cleanroom clothing systems have been estimated, see Figure 34.2.
Sampling ports for CFUs and particles
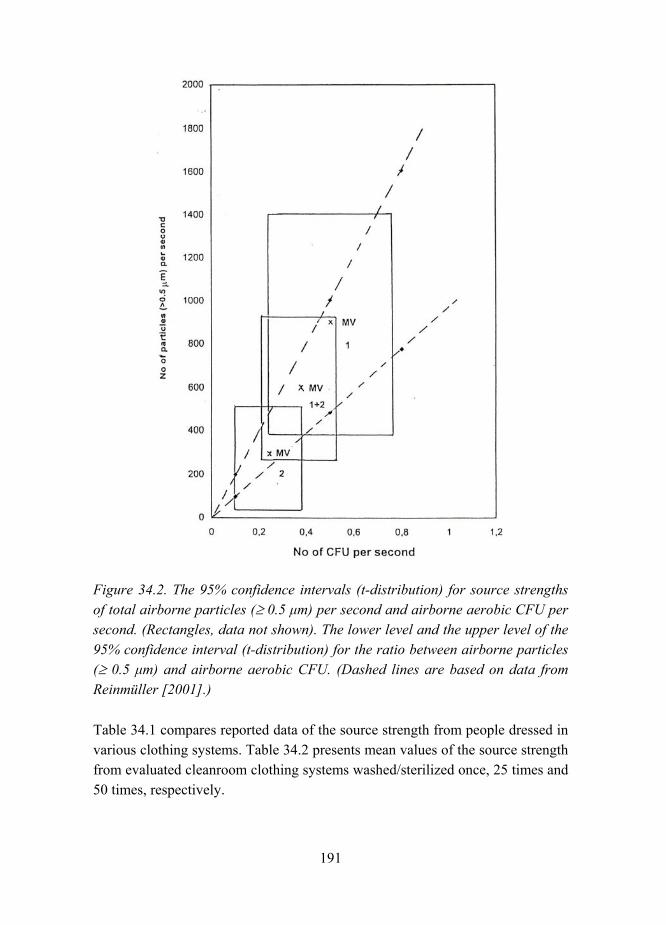
191
Figure 34.2. The 95% confidence intervals (t-distribution) for source strengths of total airborne particles (≥ 0.5 µm) per second and airborne aerobic CFU per second. (Rectangles, data not shown). The lower level and the upper level of the 95% confidence interval (t-distribution) for the ratio between airborne particles (≥ 0.5 µm) and airborne aerobic CFU. (Dashed lines are based on data from Reinmüller [2001].)
Table 34.1 compares reported data of the source strength from people dressed in various clothing systems. Table 34.2 presents mean values of the source strength from evaluated cleanroom clothing systems washed/sterilized once, 25 times and 50 times, respectively.

192
Table 34.1. Comparison of data of the source strength (particles per second and CFU per second) people dressed in various clothing systems.
Particles per second and CFU per second
Clothing system
Contaminant Gustavsson [1999]
Whyte [1999]
Tammelin et al.
[2000]
Reinmüller [2001]
Part ≥ 0.5 µm 10 000 40 000 33 300 - 26 700
Part ≥ 5.0 µm - 5 000 - 1 780
Lab coat Disp. coat
Conv scrub CFU - 2.7 1.88* 4.6
Part ≥ 0.5 µm - - - 4 060 Part ≥ 5.0 µm - - - 270
Tightly woven scrub
Surgical system
CFU - - 0.77* 1.7
Part ≥ 0.5 µm 1 000 10 000 16 600* - 585
Part ≥ 5.0 µm - 600* - 9
High quality
cleanroom clothing system CFU - 0.22* 0.38
* Theoretical calculated data
Whyte [1999], estimated from penetration tests.
Tammelin et al. [2000], estimated by using given values of air flows and assuming dilution principle.

193
Table 34.2. Comparison of data (mean values) of the source strength (particles per second and CFU per second) people dressed in various clothing systems washed/sterilized once, 25 times, and 50 times, respectively.
Particles per second and CFU per second Clothing system
Contaminant
1 wash 25 washes 50 washes Particles ≥ 0.5 µm
4 060 13 875 12 207
Particles ≥ 5 µm
270 535 698
Surgical clothing system
CFU 1.7 4.2 9.0 Particles ≥ 0.5 µm
585 3 950 2 860
Particles ≥ 5 µm
9 70 36
High quality cleanroom clothing system
CFU 0.38 0.49 1.14
A continuation of the evaluation of cleanroom clothing systems have been performed in 2005 and http://webmail.saunalahti.fi/wm/ma?d=1147427120649& k=1svewcq&reply=2219&f=INBOX 2006. An additional polyester material (XR) with conductive threads has been tested. The number of washing/sterilizing cycles will be increased to 60. Figures 34.3 and 34.4 show the results of the added material compared with earlier tested in the HelmkeDrumTest and the BubblePointTest. Figure 34.5 shows the results of the microbiological evaluation.
At KTH, more than 65 hours of evaluation activity have been simultaneous measured with regard to airborne particles and CFUs. During six different studies a total of 23 clothing systems have been tested by 5 persons in duplicate per study; total 30 test subjects have performed the standardized cycles of movements.

194
0
1000
2000
3000
4000
5000
1 w ash 25w ashes+sterilizations
50w ashes+sterilizations
No
of p
artic
les
>0.5
um
US
US
US
Japan
Japan
Japan
XR 50
XR 50
XR 50
XR 50
XR 50
Helm keDrum Test
Figure 34.3. Results from HelmkeDrumTest of three compared cleanroom clothing materials.
0
20
40
60
80
100
New 25w ashes+sterilizations
50w ashes+sterilizations
Eqv
pore
siz
e
US
US
US
Japan
Japan
Japan
XR 50
XR 50
BubblePoint Test
Figure 34.4. Results from BubblePointTest of three compared cleanroom clothing materials.

195
50 washes CFU
0
10
20
30
40
50
J + underwear
J + shirt + autocl
J + unde rwear + autocl
US + underwear + autocl
XR 50 + underwear + autoclClothing Systems
Num
ber o
f CFU
s pe
r m3
16
Figure 34.5. Results from microbiological evaluation of three compared cleanroom clothing materials (J, US and XR).
Evaluation of the prime function of cleanroom clothing to act as a filter protecting the products and processes from airborne contamination is of importance to biotech and pharmaceutical manufacture. By measuring airborne particles and CFUs the efficiency of cleanroom clothing systems during factual situations data of source strengths can be calculated and used e.g., when predicting the maximum number of operators in a cleanroom. The influence of aging and washing/sterilization cycles can also be measured.
34.2 REFERENCE
Ljungqvist, B. & Reinmüller, B. 2004. Cleanroom Clothing Systems; People as a Contamination Source, PDA/DHI Publishing, LLC, River Grove, IL. ISBN 1-930114-58-3.

196

197
CHAPTER 35: CLEANROOM CLOTHING SYSTEMS SOME CALCULATIONS
Bengt Ljungqvist and Berit Reinmüller KTH (Building Services Engineering), Stockholm, Sweden
With the result from the book Cleanroom Clothing Systems, People as a contamination source (1), some calculations are given, describing predicted contamination levels in cleanrooms with turbulent mixing air and cleanrooms with vertical unidirectional air flow when people are dressed in modern cleanroom clothing systems which have been used and washed several times.
35.1 INTRODUCTION
The authors have performed tests on selected clothing systems in a dispersal chamber installed at KTH (2, 3 and 4). A comparison of source strength for people dressed in various clothing systems are shown in Table 35.1. It can be noted that the particle levels reach higher values at 25 washing/sterilizing cycles than after 50 washing/sterilizing cycles. This might be explained by the fact that after a certain number of washing/sterilizing cycles the fabric releases particles. With time, the released particles seem to be washed away from the fabrics. In the following some calculations are given describing predicted contamination levels when people are dressed in clothing systems washed several times in cleanrooms with turbulent mixing ventilation and in cleanrooms with vertical unidirectional air flow.

198
Table 35.1. Comparison of data (mean values) of the source strength (particles per second and CFU per second) people dressed in various clothing systems washed/sterilized once, 25 times and 50 times, respectively. (Ljungqvist & Reinmüller (1)).
Particles per second and CFU per second Clothing system Contaminant
1 wash 25 washes 50 washes Particles ≥ 0.5 µm 4 060 13 875 12 207
Particles ≥ 5 µm 270 535 698
Surgical clothing system
CFU 1.7 4.2 9.0 Particles ≥ 0.5 µm 585 3,950 2 860
Particles ≥ 5 µm 9 70 36
High quality cleanroom clothing system
CFU 0.38 0.49 1.14
35.2 TURBULENT MIXING AIR
It is possible to make a mathematical model of the level of airborne contaminants in a clean room with completely turbulent mixing air, if the contamination sources and the design of the ventilation system are known. Such descriptions of ventilation systems can be found in various text books. With the assumption of no leakage into the room and the final filters having efficiency close to 100% (HEPA-filters), the simplest possible expression describing the concentration in the room becomes
Qqc s= (1)
where qs = source strength, outward particle flow (numbers/s), bacteria-carrying particles (CFU/s)
Q = total air flow (m3/s).
With Equation (1) some estimations are given in the following examples.

199
EXAMPLE 1
In an aseptic filling room of 90 cubic meter and 20 air changes per hour the only contamination sources are the clean room dressed operators. How many operators are allowed in the filling room if FDA 2004 (5) requirements for US Customary Class 10.000 (ISO class 7) shall be fulfilled?
Limit values of FDA 2004 (5), US Customary Class 10.000, ISO class 7 in dynamic state Number of particles ≥ 0.5 µm 352.000/m3
Number of airborne CFU 10/m3
With the data given in the example the total air flow becomes 0.5 m3/s.
The calculation procedure is:
1. Calculate the concentration in the cleanroom with one person by using Equation (1). Source strength for one person, data from Table 35.1, divided by the total air volume flow.
2. The maximum allowed number of people in the cleanroom will be the limit value/recommended value, divided with the above calculated concentration for one person.
According to Table 35.1, the maximum particle source strength for high quality clean room clothing system occurs around 25 washing/sterilizing cycles. For particles equal to and larger than 0.5 µm the value is 3950 particles per second. The concentration becomes:
Particles ≥ 0.5 µm 7 900 particles/m3.
The maximum allowed number of people in the filling room depending on particle size will be the limit value of the FDA Class 10.000 divided by the calculated concentration.
Particles ≥ 0.5 µm gives 44 operators
With regard to particles equal to and larger than 0.5 µm the maximum allowed number of operators within the filling room is 44.

200
Table 35.1 shows that the source strength for CFU increases with the number of washing/sterilizing cycles. Since the calculations follow the same steps which are described above for particles, initial data from Table 35.1 for CFU and high quality clean room clothing systems, and calculated results are summarized in Table 35.2.
Table 35.2. Source strengths (CFU/s) for high quality cleanroom clothing systems and estimated number of operators allowed.
Number of washing/sterilizing
cycles (number)
Source strength (CFU/s)
Concentration (Eq (1))
(CFU/m3)
Max number of operators
(number)
1 0.38 0.76 13
25 0.49 0.98 10
50 1.14 2.28 4
Table 35.2 shows with FDA US Customary Class 10.000 requirements that after 50 washing/sterilizing cycles the allowed maximum number of operators is 4. Should the FDA 2004 (5) with Clean Area Classification US Customary Class 1000 be used instead the microbiological limit is set to 7 CFU/m3 the maximum number of operators allowed would be only 3.
The results of this example show, when the operators are the only contamination source, that the value for CFU presents a stricter requirement than that of particles. On the other hand, it should be noted that in many production lines the machinery generate particles, which could be a reason for the larger ranges for particles equal to and larger than 0.5 µm.
If unidirectional flow units with HEPA-filtered air are used the situation will be improved. The airflow through the units should be added to the room air flow. If, in the filling room in this example discusses here, a unidirectional flow unit with HEPA-filtered air is installed with the same air flow as the room air flow, the total air flow becomes 1.0 m3/s. This gives the maximum number of allowed people in the filling room to be about twice those values, which are estimated in the above example.

201
EXAMPLE 2
How many people dressed in surgical clothing systems can stay in an operating room with turbulent mixing air when the total air flow is 2.000 m3/h during
a) conventional operation; b) orthopedic operation (e.g., hip joint replacement).
when recommended values of airborne CFU/m3 are:
conventional operation < 100 CFU/m3
orthopedic operation approx. 5 CFU/m3.
The airflow is given to 2000 m3/h ≈ 0.56 m3/s.
Table 35.1 shows the source strength for CFU and surgical clothing system washed once, 25 times and 50 times, respectively. The calculation procedure is the same as described in Example 1. Initial data and the calculated results for conventional operation and for orthopedic operation are directly given in Table 35.3 and Table 35.4.
Table 35.3. Source strengths (CFU/s) for surgical clothing systems and estimated number of people allowed during conventional operation (recommended value < 100 CFU/m3).
Number of washing cycles
(number)
Source strength (CFU/s)
Concentration (Eq (1))
(CFU/m3)
Max number of operators
(number) 1 1.7 3.04 32
25 4.2 7.5 13
50 9.0 16.1 6

202
Table 35.4. Source strengths (CFU per second) for surgical clothing systems and estimated number of people allowed during an orthopedic operation e.g., hip joint replacement (recommended value 5 CFU/m3).
Number of washing cycles
(number)
Source strength (CFU/s)
Concentration (Eq (1))
(CFU/m3)
Max number of operators
(number) 1 1.7 3.04 1
25 4.2 7.5 < 1 50 9.0 16.1 < 1
The results indicate that surgical clothing systems for conventional operations should not be used more than 50 washing cycles. For orthopedic operations the surgical clothing system discussed here should not be used at all. It should be mentioned that hip joint replacement operations are often performed in an HEPA-filtered unidirectional air flow system with the surgical team dressed in high quality clothing systems. The relations for a surgeon or an operator in a downward (vertical) unidirectional air flow will be discussed in the following part.
35.3 DOWNWARD (VERTICAL) UNIDIRECTIONAL AIR FLOW
A mathematical model describing the dispersion of airborne contaminants when a cleanroom dressed person (operator) is standing in a vertical unidirectional air flow has been reported by Ljungqvist et al. (6).
Measurements have been performed by Jonsson (7) on an operator inside the dispersal chamber at an air velocity of 0.45 m/s. The operator has a height of 1.86 m and an estimated radius of 0.15 m. The measurements have been performed with the operators arms moving in a calm manner in standard cycles (one hand from hip shoulder and back, then the same movement with the other hand), see Jonsson (7). The source strength has been measured and calculated to 500 particles (≥0.5 µm) per second per meter. This value might be somewhat small so an additional value of the source strength chosen to 20,000 particles (≥ 0.5 µm) per second and meter has been used in the theoretical calculation. Data from Reinmüller (2) show that this value of the source strength is comparable with lab coat disp coat. Figure 35.1 shows both the theoretical and measured

203
contamination region edges for an operator. The contamination region edge is here set to 35 particles (≥0.5 µm) per cubic meter (1 particle per ft3).
Figure 35.1 shows that the measured results with an operator active (arm movements) deviate from results based on the mathematical model. The distances from the centre of the cylinder to the contamination region edge are about 50% larger for values measured with a moving operator than those theoretically calculated.
It should be noted that in spite of the large difference in source strengths between the two theoretically calculated curves (predicting operator standing still) in Figure 35.1, the contamination regions differ less than 0.1 m.
If theoretical calculations are performed for surgical clothing systems with data from Table 35.1, the contamination region edges will be in positions between the two theoretical calculated edges shown in Figure 35.1. When estimating the situation during operation in a vertical unidirectional air flow, the relevant part to use in Figure 35.1 is the distance from the surgeons head to the operating table or the operators head to the plane of the exposed product.
0
0,2
0,4
0,6
0,8
1
1,2
1,4
1,6
1,8
20 0,05 0,1 0,15 0,2 0,25 0,3 0,35 0,4 0,45 0,5 0,55 0,6
Distance from operator's centreline ρ (m)
Dis
tanc
e fr
om h
ead
x (m
)
Measured
1 model ql 500
2 model ql 20000
operators edge
1 2
Figure 35.1. Contamination region edge (c( ρ, x) = 35 particles (≥ 0.5 µm) per m3) at the air velocity 0.45 m/s. Thicker line represent edge for measured values. Thinner lines show the position of the calculated edges according to the theoretical model and the source strengths 500 and 20,000 particles (≥ 0.5 µm) per meter and second, respectively (from Jonsson (7)).

204
Values presented by Reinmüller (2) and Ljungqvist, Reinmüller (4) indicate that a relationship exists between the number of particles equal to and larger than 0.5 µm per volume unit of air and the number of aerobic airborne CFU per volume of unit air. In a typical cleanroom environment, with people dressed in new modern cleanroom clothing systems (washed/sterilized once) as the main contamination source, it seems to be possible to establish a relationship at a ratio of approximately 1 500 to 1. When the cleanroom clothing systems are washed/sterilized several times this relationship will increase, where the values of the ratio are estimated to be less than 10 000 to 1 (compare Table 35.1). This means that the contamination region edges described here will have theoretical CFU values much below one CFU/m3.
Nowadays in Europe, filter ceiling systems with HEPA-filtered air and with flows about 10.000 m3/h (ca 2.8 m3/s) are commonly used in operation rooms. The air velocity just below the filter ceiling is below 0.3 m/s. According to Nordenadler (8), who has performed smoke visualization tests, the air movements are rather sensitive to disturbances. People, the radiation of heat and objects (lamps, filter fixtures) have a decisive impact on the flow pattern and even the transport of contaminants. The latter has also been shown with particle challenge tests and a particle counter.
In the region around the operation table the air movements are not unidirectional but irregular. This gives that the calculation procedure described for turbulent mixing air should be used to estimate how many persons are allowed to be in this room.
Due to the higher air flows (5 times) for the filter ceiling system than that of the conventional operation room, the numbers of allowed people in the room with filter ceiling system are about five times those values, which are given in Tables 35.3 and 35.4. In conclusion, a unidirectional air flow system with low velocities (< 0.3 m/s) will never fulfill the demands of a class 100 (ISO class 5) environment during operational conditions.
205
35.4 DISCUSSION
Performed calculations show that it is possible to make a first estimation of the number of people allowed in a classified cleanroom during activity when people are the main source of airborne contaminants. These estimations are based on data from source strengths when people are dressed in various clothing systems.
When people are the main source of airborne contaminants, the microbiological requirements (5) constitute stricter demands than that of particles. A reason for the higher ranges of limits for airborne particles could most probably be that the machinery of production lines generates particles.
The predominant sources of contaminants within a cleanroom are people and machinery. Potential risk situations are created by the interaction among people, air patterns, and the dispersion of airborne contaminants, and are difficult to predict.
During the design and construction phase, the data on source strength can be used for a first estimation of expected air cleanliness during activity. However, during the dynamic state in, for example, in an aseptic filling room, the environmental monitoring must always be performed in a conventional way.
Operating rooms are seldom classified as cleanrooms and regulatory recommendations do not exist in the same way as for pharmaceutical cleanrooms. It should, however be noted, that the tested surgical clothing systems for conventional operations have a limited life and should not be used for more than 50 washing cycles. For orthopedic operation rooms where higher cleanliness is desirable this kind of clothing system should preferably be exchanged for high quality cleanroom clothing systems.
35.5 REFERENCES
1. Ljungqvist, B. & Reinmüller, B. 2004. Cleanroom Clothing Systems; People as a Contamination Source, PDA/DHI Publishing, LLC, River Grove, IL. ISBN 1-930114-58-3.
206
2. Reinmüller, B. 2001. Dispersion and Risk Assessment of Airborne Contaminants in Pharmaceutical Clean Rooms. PhD-Thesis, Bulletin No 56, Building Services Engineering, KTH, Stockholm.
3. Reinmüller, B. & Ljungqvist, B. 2003. Modern Cleanroom Clothing Systems: People as a Contamination Source. PDA Journal of Pharmaceutical Science and Technology, Vol. 57, pp. 114125.
4. Ljungqvist, B. & Reinmüller, B. 2003. People as a Contamination Source: Cleanroom Clothing after 1, 25 and 50 washing/sterilizing cycles. European Journal of Parenteral & Pharmaceutical Sciences, Vol. 8, pp. 7580.
5. US Food and Drug Administration. 2004. Guidance for Industry, Sterile Drug Products Produced by Aseptic Processing Current Good Manufacturing Practice, FDA, Rockville, MD.
6. Ljungqvist, B., Reinmüller, B. & Söderström, O. 2003. Cleanroom-dressed operator in unidirectional airflow: a mathematical model of contamination risks. European Journal of Parenteral & Pharmaceutical Sciences, Vol. 8 pp. 1114.
7. Jonsson, R. 2002. Particle Dispersal from a Cylindrical Source in a Clean Zone with Unidirectional Air Flow. MSc-thesis, report No 85, Building Services Engineering, KTH, Stockholm (in Swedish).
8. Nordenadler, J. 2006. Licentiate Thesis in Progress, Building Services Engineering, KTH, Stockholm.

207
CHAPTER 36: HUMAN AS A PARTICLE SOURCE IN CLEANROOM
Tuija Luoma VTT, Tampere, Finland
Managing production cleanliness based on life cycle approach has a growing importance in cleanrooms. Production cleanliness includes requirements for facilities, humans, material flows and production. In cleanrooms it is essential to pay attention to reliable documentations and appropriate materials and garments. Present standards don't give a simple way to analyze e.g. the garment's cleanroom properties and suitability to cleanroom. A human is a significant particle source in cleanrooms. A cleanroom garment is one of the best available techniques to manage emitted particles from a human. Cleanroom garments can e.g. protect the worker from particles released from production or product from particles released from the worker. It is essential to find a proper way to manage released particles. There are many ways to evaluate risks and suitability of materials and garments for cleanrooms. It should be paid attention to what kind of materials are used in the garment, how functional barrier is the whole garment-human system and what kind of effect has cleanroom materials and garments on the production cleanliness. This presentation discusses e.g. these standpoints.
36.1 INTRODUCTION
The number of industries that are operating in critical and controlled environments continues to increase. In a normal production environment cumulate different kinds of impurities to unprotected products, raw materials, production processes and equipment. In cleanroom this kind of occurrence of impurities and possibility to end up in products and production is limited to a certain level. In that case demands for product cleanliness, quality and production acquisition will be fulfilled. The meaning of cleanroom is to protect the product and in some cases also the worker against impurities from a working environment and production.
208
Cleanroom personnel are an important source of cleanroom contamination. Almost all micro-organisms found in a cleanroom come from personnel. They are also a major source of particles and fibers. It's therefore necessary to minimize contamination and released particles which are generated and transferred by personnels activities. Special clothing is therefore worn in all cleanrooms to control the particle and microbiological dispersion from people and hence the contamination within cleanrooms.
Considering the risks of the cleanroom performance it is important to pay attention to the whole entity, life cycle and all factors influencing the entity. For example material flows, processing the products, the functionality of personal protection, working methods and the cleaning in production may cause contamination risks.
36.2 CONTAMINANTS
The term contaminants has a very broad meaning. As a general definition it can be stated that a contaminant is something, either material (in solid, liquid or gaseous form) or a physical state, that is considered to be n the wrong place (and/or) at the wrong time. Different contaminants can be divided e.g. into groups consisting of solid materials, chemicals and physical conditions.
36.2.1 Air as a Carrier of Particles
Many times is the ability of air to contain and transport liquids, solids and living substances, e.g. microbes, overlooked or forgotten. Typically, in the air it can be found biological agents such as plant cells, pollen, bacteria, yeasts and viruses originating from natural habitats.
There are number of ways in which biological and microbiological material is possible to become airborne e.g. through wind and rain splash. Almost every human activity can create bioaerosols. Sneezing and coughing are examples for human activities causing bioaerosols. Human also shed skin and bacteria to air. Even wearing clothes does little to stop the process.

209
36.2.2 Particle Contaminants
Usually within contamination control one tends to talk about contaminants that are of particulate matter. Particulate contaminants can be divided into "dead particles" and "live particles". Particles can be more or less harmful, depending on the nature of what is being produced or handled. Dead or inert particles are not able to reproduce by themselves or form identical copies. For example fibres from textiles are inert particles. "Live particles" covers a vast number of micro-organisms. These particles have an extraordinary ability to reproduce or multiply depending on the environmental conditions.
36.2.3 Chemical Contaminants
Chemical contaminants are all the other contaminants that aren't comprised of solid materials, i.e. particles. These are either liquid or gaseous. Chemical contaminants may have an effect on production in different ways. They can be either toxic, inert, reactive or possibly explosive. All chemical contaminants can be harmful or hazardous to the product, the production process and personnel present during the production. They must be defined for each individual system.
36.2.4 Physical Conditions
Physical risk factors sum up all the other factors, excluding solid, liquid or gaseous material, which can be hazardous to product, process or personnel. These factors include temperature, humidity, pressure, different types of radiation as well as static electricity and vibrations.
36.3 ELECTROSTATIC ATTRACTION
Charged surfaces attract particles and air particles are seldom electrically completely neutral. The electrostatic attraction (ESA) is illustrated in Figure 36.1. The contamination of a charged surface due to ESA and the bonding of particulate to critical surfaces depend on various factors, such as the amount of charge (or electric field strength) on the surface and the concentration, charging (amount, polarity and distribution), mass and speed of the particles. In highly charged surfaces the contamination can be very strong (note television screens at home).

210
In cleanrooms where any contamination should be minimized it means that existing electrostatic charges should be minimized. For example in lenses and products, which will be painted, are not allowed "dust particles". In products directed to the pharmaceutical industry may ESA cause contamination during production or use because microbes can also cling to product surfaces due to the ESA phenomenon.
+ + + + + +
Critical surface
Bonding
Particles
Particulate -emission
Staticcharge
Figure 36.1. Contamination of a surface due to electrostatic attraction.
36.4 LIFE-CYCLE THINKING A WAY TO MANAGE RISKS IN CLEANROOMS
It's critical to think cleanroom operations as an entity which consists of many different factors. When all these factors function properly are cleanroom operations controlled. The operations of cleanroom and cleanroom production should be examined also in the long run for avoiding many risks. Different contaminants have different impacts on production processes and products. It is important to recognize all the aspects of the production and of how to control them. There are many ways that different contaminants can be come into contact with a product or product equipment. The following list contains examples of sources of contamination that pose a risk to the production process:
− dirty areas closely related to the cleanroom, − unfiltered air supply, − room air, − functionality of cleanroom's structure, − personnel (e.g. work methods, know-how), − functionality of personal protection (e.g. cleanroom garments, masks),

211
− machines, − products (e.g. materials and processing), − cleanliness of materials used in production (e.g. raw materials, packages), − office equipment and office material, − cleaning (e.g. equipment, chemicals, work methods, personnel), − maintenance personnel, particularly external personnel, − visitors and − documentation.
From standpoint of the cleanroom and risk management it is very important to document well different operations in cleanrooms. Operations should be traceable. For example the regularity of cleaning should be controlled by means of documentation. In cleanroom operations systematics has a major importance because out of line activities increase contamination risks.
36.5 HUMAN AS A PARTICLE SOURCE
Man is considered to be the greatest generator of contaminants in cleanroom. A major reason for that is the fact that skin scales are continuously being shed from the outer layer of skin on the human body and are dispersed into the surrounding environment. The nature of the activities being undertaken has an effect on the rate of the released skin particles. Another source of contamination is everyday clothing. Fibres and other particles may be dispersed into the room air. Today the cleanroom environment is protected from contaminants generated by personnel with the use of special clothing. The special clothing is known as personnel filters or the garment system.
The rate of released particles from human varies from person to person. The greater their activity is the more particles they disperse. The routes and sources of particle released from person are illustrated in Figure 36.2. Personnel in cleanrooms may release particles from:
− skin, − clothing they wear under cleanroom garments, − cleanroom clothing and − mouth and nose.
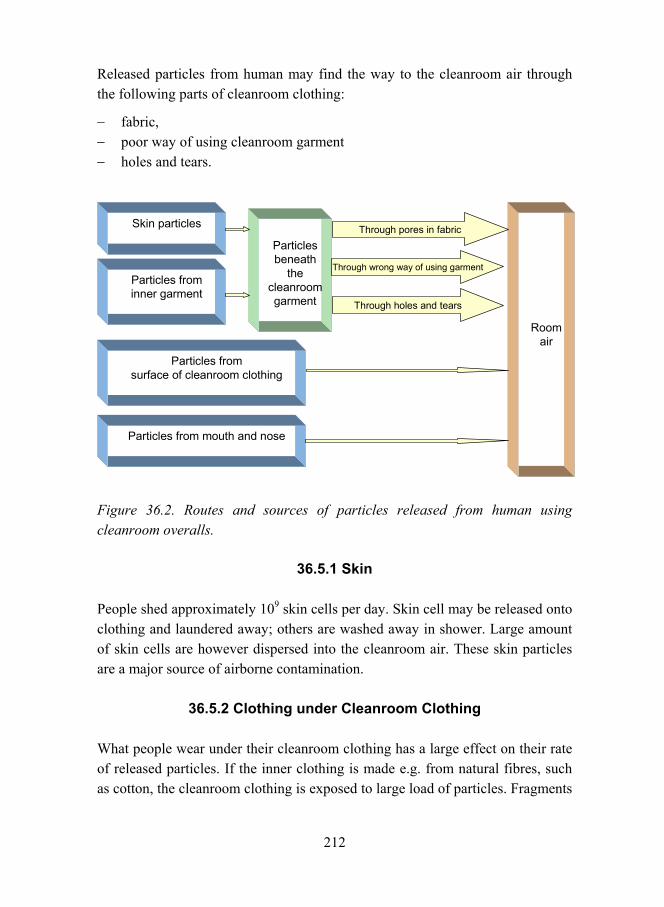
212
Released particles from human may find the way to the cleanroom air through the following parts of cleanroom clothing:
− fabric, − poor way of using cleanroom garment − holes and tears.
Skin particles
Particles from inner garment
Particles beneath
the cleanroom garment
Room air
Particles from surface of cleanroom clothing
Particles from mouth and nose
Through pores in fabric
Through wrong way of using garment
Through holes and tears
Figure 36.2. Routes and sources of particles released from human using cleanroom overalls.
36.5.1 Skin
People shed approximately 109 skin cells per day. Skin cell may be released onto clothing and laundered away; others are washed away in shower. Large amount of skin cells are however dispersed into the cleanroom air. These skin particles are a major source of airborne contamination.
36.5.2 Clothing under Cleanroom Clothing
What people wear under their cleanroom clothing has a large effect on their rate of released particles. If the inner clothing is made e.g. from natural fibres, such as cotton, the cleanroom clothing is exposed to large load of particles. Fragments

213
from inner clothing combined with dispersed skin particles increase the particle load for cleanroom garment. Therefore it's more likely that more particles pass through the outer cleanroom garment. If the inner clothing is made from synthetic fabric, the particle load from inner garment can be reduced distinctively. If the inner garment has a good filtration efficiency against skin particles it can be reduced even more.
36.5.3 Cleanroom Clothing
In cleanrooms it's important to put emphasis on minimizing the particles released from cleanroom clothing. For example cleanliness of the clothing and non-linting properties of fabric are critical. Cleanroom clothing is typically made from synthetic fibres, such as polyester. When a fabric is woven from threads made from continuous synthetic monofilaments, it ensures very few released particles from the fabric.
36.5.4 Mouth and Nose
People disperse particles from their mouth or nose. They emit particles e.g. when they snort through their nose, sneeze, cough or talk,. These saliva droplets contain salt and bacteria. It is necessary to prevent them causing contamination in the cleanroom. Wearing a mask over the face normally does this.
36.6 MANAGING RISKS ORIGINATING FROM HUMAN ACTIVITIES IN CLEANROOMS
Contamination control and cleanroom technology demands protection for both personnel and products and processes. Depending on the nature of the product and the conditions during manufacturing, both product and production area should be protected from personnel. In certain cases personnel should be protected at the same time from hazardous components in the process, e.g. when working with vaccines or cytostatic agent.
A cleanroom worker shed millions of particles into the cleanroom air. Visible particles include bacteria, moulds and yeast and nonviable may include hair, dead skin cells and dandruff. Elements such as sodium, potassium and

214
magnesium can also be released from the human body. Loose fabric particles from clothing can also contribute to contamination. The higher the class of cleanroom, the greater is the need for contamination control which leads to a full-body cleanroom clothing system.
One of the most important ways to reduce contamination from humans is to shield with proper cleanroom garment system suitable for cleanrooms including also masks and gloves. It should be paid attention to the functionality of cleanroom garment system. For example wrong kind of seam structures and design solutions may cause contamination in the cleanroom. Highly charged cleanroom garment materials attract particles causing e.g. transitions of harmful particles to the manufactured products. Because of this the electrostatic properties of cleanroom garments should be examined.
In addition with a proper cleanroom garment system it is highly important to know how to use the garment in a right way. The contamination control becomes more difficult when the cleanroom garment system is wrongly dressed, for example a mask or a zip straggling. Shortages in using cleanroom garments may cause a particle and microbiological dispersion from people.
It is essential to train cleanroom workers to proper cleanroom behaviour. Cleanroom workers must also understand the reasons why they should act in a certain way. In cleanrooms the worker must move quiet avoiding sudden movements or turns.
The released particles from human and the influence of different kind of movements and cleanroom garment systems can be tested with a body box method (Figure 36.3). It is essential to know the suitability of different cleanroom garment systems to the cleanroom. The amount of released particles varies depending on the cleanroom garment system and movements (Figure 36.4).

215
Figure 36.3. Testing different outfits in a body-box test.
0
1000
2000
3000
4000
5000
6000
0.3-0.5 µm 0.5-1 µm 1-3 µm 3-5 µm 5-10 µm >10 µm
Particle size (µm)
Bod
ybox
, Num
ber o
f par
ticle
s
Normal clothing Reusable clothing
Disposable clothing - prewashed Disposable clothing - ster. and prewashed
Figure 36.4. Comparison of different garment systems in a body-box test.
The body-box method considers particles released from the whole human garment system. When it is important to evaluate different materials, linting property is critical. The term lint generally means fibre fragments released from material during handling. The textile material itself is a possible source of particle emissions. Most materials loose compounds by friction. The linting property of materials is becoming increasingly important as more and more companies are handling sensitive devices for both contamination and electrostatic discharge.

216
36.7 CONCLUSIONS
Personnel are usually the most significant particle and airborne microbe source in cleanroom production areas. It is essential that cleanroom workers are trained to proper cleanroom behaviour and they fully understand contamination risks. The main function of cleanroom garments is to protect products against fibres and particles released by humans from skin and garments. The second function is in some cleanroom production areas to protect also the worker from harmful particles, e.g. in production of vaccines. Various types of cleanroom garment systems are available such as reusable or disposable garments. It is important that cleanroom garment systems are both good barriers and also comfortable to wear. In the future the meaning of the personal protection in cleanrooms becomes more and more important. Cleanroom fabrics and garments should release even less particles than before, especially after many washes.
36.8 ACKNOWLEDGEMENTS
I would like to thank to my colleagues at VTT for their input to the work.
36.9 REFERENCES
1. IES-RP-CC003.2. 1993. Garment system considerations for cleanrooms and other controlled environments. 31 p.
2. Mc Ilvaine, R. 2006. Reusable Cleanroom Garments, Part 1. CleanRooms. Volume: 20, Issue: 2. February 2006. 6 p.
3. Nurmi, S. et al. 2003. Fabrics of cleanroom garments. VTT Symposium 229. 34th R3-Nordic Contamination Control Symposium. Turku, Finland, 24 June 2003. Wirtanen, G. & Salo, S. (Eds). VTT Biotechnology. Pp. 205212. ISBN 951-38-6285-2.
4. Paasi, J. 2003. Management of static electricity and ESD in cleanroom production of electronics. VTT Symposium 229. 34th R3-Nordic Contamination Control Symposium. Turku, Finland, 24 June 2003. Wirtanen, G. & Salo, S. (Eds). VTT Biotechnology. Pp. 349374. ISBN 951-38-6285-2.

217
5. Ramstorp, M. 2000. Introduction to Contamination Control and Cleanroom Technology. WILEY-WCH, Winheim. Germany. 168 p. ISBN 3-527-30142-9.
6. SFS-EN ISO 14644-1. 2000. Cleanrooms and associated controlled environments. Part 1: Classification of air cleanliness. CEN European Committee for Standardization. 37 p.
7. SS 2680. 1995: Renhetsteknik Renhetskontrollerad verkstadsmiljö. SIS Standardiseringen I Sverige. 25 p.
8. Whyte, W. 2001. Cleanroom Technology. Fundamentals of Design, Testing and Operations. John Wiley & Sons, LTD, England. 309 p. ISBN 0-471-86842-6.
9. Wirtanen, G. et al. 2002. Clean air solutions in food processing. VTT Publications 482. Espoo: Otamedia Oy. 95 p. ISBN 951-38-6015-9.

218

219
CHAPTER 37: MANAGING STATIC ELECTRICITY AND PARTICLES IN CLEANROOMS AND CLEAN AREAS
Johanna Anttila Laitosjalkine Oy LajaPro, Hirsilä, Finland
37.1 STATIC ELECTRICITY AND CONTROLLED DISCHARGE
37.1.1 Electrostatic Discharge
Electrostatic discharge (ESD) is defined as the transfer of charge between bodies at different electrical potentials. Electrostatic charge is most commonly created by the contact and separation of two similar or dissimilar materials. For example, a person walking across the floor generates static electricity as shoe soles contact and then separate from the floor surface.
37.1.2 Why is Static Electricity Harmful?
Quality problems
− component damages in products − machines and control equipment damages or malfunction − product damages and contamination risk (the charged particles are
attracted to opposite charged surfaces)
Occupational safety
− danger for gas and dust explosions − personnel gets unpleasant shocks
Patient safety in hospitals
− ESD- shock can transfer from personnel to patient, the charged particles are attracted to opposite charged surfaces (MRSA).

220
37.1.3 Creation of Static Electricity
Charge caused by friction: different materials are rubbed against each other and they become charged. Charge through induction: a charged object creates an electrostatic field around itself, the electrostatic field can transfer to a close object without touching.
37.1.4 Triboelectric Serie
The more far away the materials are of each other in the triboelectric serie the stronger they are charged when they come to contact.
The strongest positive charge air human skin fur of a rabbit glas hair polyamide silk aluminium paper cotton steel hard rubber gold, platinum polyesther polystyrene polyurethane polyethene PVC silicons Teflon
The strongest negative charge
37.1.5 Creation of a Charge Depending on Relative Humidity of the Air
RELATIVE HUMIDITY OBJECT OR ACTIVITY RH 20% RH 80% Walking on a carpet of artificial fibres 35 000 V 1 500 V
Walking on a carpet of vinyl 12 000 V 250 V Lifting of box of polyethene 20 000 V 600 V
Working by the work terminal 6 000 V 100 V Sitting on a chair 18 000 V 1 500 V
A plastic coffee cup 5 000 V - Notebooks and books with plastic covers 8 000 V -
Plastic pockets 20 000 V -
The drier air the more charges!

221
37.1.6 Discharges of Static Generated in the Body
Feeling 3500 V Hearing 4500 V Seeing 5000 V
The voltage damaging components is so low that it is impossible to feel it.
37.1.7 How Eliminate the Uncontrolled Discharges of Static Electricity?
EPA = ESD PROTECTED AREA
In the area
− the creation of electric charges/discharges have been minimized
− the charges will be discharged in a controlled way.
37.1.8 Where to Begin?
An effective ESD control program is only as strong as its weakest link. Focusing on these fundamental ESD control principles is a good place to start:
− Clear identification of ESD susceptible components and products. − Grounding of all conductors, including personnel, in an ESD protected area. − Removal of nonessential insulators from ESD protected areas and
neutralization of charges on essential insulators via ionization. − Enclosure of ESD-susceptible items in static-shielding packaging while
being transported or stored outside an ESD protected area.
37.1.9 Personnel Grounding through Shoes
The main task of ESD footwear is to discharge static electricity stored in a person through the floor in a reliable and safe manner under all conditions. In order to function in the right way the grounding through footwear always needs a dissipative floor. When entering an EPA zone, shoes are often tested using a grounded metal plate placed on the floor. This measuring method provides the resistance of the shoe but not that of the floor. In other words, it does not

222
indicate the effect that the floor resistance has on electrostatic discharging, which is why users should ensure the properties of the floors they use their shoes on and test the system resistance in individual workplaces. Resistance indicators should also be set to comply with the system resistance requirements of the users EPA zone.
37.1.10 System Resistance of the Floor and Shoes Must Be 750 KΩ 35 MΩ.
In order to discharge the static electricity, ESD footwear must meet the requirements of standards EN 61340-5-1 and IEC 61340-4-3. According to these standards the charge of a person working in an EPA area must be under 100 V at all times. The resistance of ESD footwear should be as low as possible, near 750 kΩ to ensure that the system resistance of the floor and shoe remains under 35 MΩ. Proper ESD footwear works reliably also in low humidity with all floor materials. A low system resistance results from small shoe resistance, as well as from the contact between the shoe and the floor.
37.1.11 ESD Footwear Form a Part of Productivity and the Quality System
A good ESD system improves productivity, quality and safety. An ESD system is only as strong as its weakest link. Correct shoe choices help to ensure that employees are not the cause of components breaking or getting damaged at different phases of production. The system resistance and operations of shoes and various floor materials should be regularly checked.
37.2 STATIC ELECTRICITY IN CLEANROOMS
Static electricity leads to an increasing number of problems also in medical and pharmaceutical industry. In cleanrooms and in clean production areas should always control as well as the amount of particles as the movement and contamination. All materials are chargeable, also the small particles in the air. The charged particles are attracted to opposite charged surfaces. This leads to contamination of surface. It is called ESA- phenomenon (electrostatic attraction).

223
The charges should be eliminated to get the risk of contamination lower. Careful control of static electricity is the key issue of contamination control in cleanrooms. Contamination control is only as strong as its weakest link. The higher classification of the cleanroom the more important should be ESD control. Cleanroom area = EPA area.
37.2.1 Personal Protection in Cleanrooms
In cleanrooms are typically used gloves, handstrips (if necessary), overalls, caps and breathe protectors. The floors are usually semiconductive and all machines are grounded. Still there might be problems with electro static discharges.
37.2.2 Laja Clinigo Program
LajaPro introduces a new way of integrated personal protection for cleanrooms. The objective of the R&D project has been the development of personal protection to combine excellent electrostatic and particle properties while ensuring maximum wearing comfort of clothing and footwear. In this program have VTT (Technical Research Centre of Finland) and a group of Finnish cleanroom users from the electronics, pharmaceutical, chemical and plastics industries been members of Laja Clinigo R&D workgroup.
For three years, thousands of different tests have been carried out on different raw materials, fabric structures as well as prototype clothing and footwear items. Garments and boots are carefully tested with several test methods:
− Release of particles from material, ISO/DIS 9073-10 (particle linting) − Resistance to particle penetration, IFP method 70-99,A − Triboelectric charging, prEN 1149-3 − Point-to-point resistance − Charge decay time (from 1000 V to 100 V), EN 61340-5-1 − Surface resistivity, EN 61340-5-1, EN 100015-1 and EN 1149-1 − Vertical resistance, EN 1149-2 − Equivalent pore size, BS 3321:1986 − Permeability to air, EN-ISO 9237:1995 − Resistance of footwear to earth accordance with standard EN 61340-4-3.

224
37.2.3 Release of Particles from Material ISO/DIS 9073-10
The materials have been tested for release of particles (particle linting) and their size distribution using Gelbo Flex test equipment in conformity with standard draft ISO/DIS 9073-10.
The sample was subjected to a combined twisting and compressing action in a test chamber. During the flexing, air was withdrawn from the chamber and particulates in the air stream were counted and classified in a laser particle counter.
Standard requirements: linting of particles 325 micrometer < 100 000 pcs.
Test results: Clean 71 fabric
=> unwashed < 400 pcs => 50 times washed < 400 pcs.
37.2.4 Charge Decay Time SFS EN 61340-5-1
The charge decay time was tested using finished garments and different materials in accordance with standard SFS-EN 61340-5-1. Attention was also paid to the seams of the garments to verify that any charges built up in the clothing are also discharged over seams. Standard requirements: decay time < 2 s. Test results: decay time stays in all conditions < 0.2 s.
0,0
1,0
2,0
3,0
Clean 71: unwashed Clean 71: 10 times washed Clean 71: 25 times washed Clean 71: 40 times washed Clean 71: 50 times washed
Char
ge d
ecay
tim
e (fr
om 1
000V
to 1
00V
) m
horizontal pos. horizontal neg. vertical pos. vertical neg.
Charge decay time SFS-EN 61340-5-1
Release of particles from materialISO/DIS 9073-10
Standard requirements:linting of particles 3-25mikrometer < 100 000 pcs
0
200
400
600
800
1000
0,3 0,5 1 2 3 5 10 25
Particle size (µm)Lint
ing:
qua
ntity
of p
artic
les
rele
ased
from
Cle
an 7
1 -fa
bric
unwashed 50 times washed

225
37.2.5 Triboelectric Charging prEN 1149-3
The charge build up of through triboelectric friction was investigated in accordance with standard draft prEN 1149-3. The fabric was rubbed using both aluminium and HDPE bars. The tests indicated that the materials used in Laja Clinigo clothing build up very little electrical charge.
Standard requirements: < 3000 V (CO or PES > 3000 V, ESD-fabric with metal yarn apprx. 700 V)
Test results: with aluminium bars stays under 100 V, with HDPE bars stays under 140 V.
37.2.6 Point-to-point Resistance SFS EN 61340-5-1
Standard requirement < 1012Ω (= 1 Teraohm)
Test results after 50 times washed < 1012Ω
37.2.7 Resistance of Laja Clinigo Footwear EN 61340-4-3
The resistance of Laja Clinigo footwear to earth was measured inter alia, in accordance with standard EN 61340-4-3. For the measurement, the shoe is placed on a metal plate and a 12.5 kg filled with metal balls is put inside it. Aluminium foil is used as the conductor. The sole resistance is measured between the aluminium foil and the metal plate. Test result: passed.
-500,0
-400,0
-300,0
-200,0
-100,0
0,0
100,0
200,0
300,0
400,0
500,0
Clean 71: unwashed Clean 71: 10 timeswashed
Clean 71: 25 timeswashed
Clean 71: 40 timeswashed
Clean 71: 50 timeswashed
Trib
oele
ctric
cha
rgin
g [V
]
Aluminium bars horizontal V0
Aluminium bars horizontal V2Aluminium bars horizontal V30Aluminium bars vertical V0
Aluminium bars vertical V2Aluminium bars vertical V30
HDPE bars horizontal V0HDPE bars horizontal V2
HDPE bars horizontal V30HDPE bars vertical V0
HDPE bars vertical V2HDPE bars vertical V30
1E+00
1E+01
1E+02
1E+03
1E+04
1E+05
1E+06
1E+07
1E+08
1E+09
1E+10
1E+11
1E+12
1E+13
Clean 71: unwashed Clean 71: 10 times washed Clean 71: 25 times washed Clean 71: 40 times washed Clean 71: 50 times washed
Poin
t-to-
poin
t res
ista
nce
(max
) [O
hms]
horizontal vertical
Source: VTT

226
37.2.8 Barrier Ability against Airborne Particles of Cleanroom Fabrics VDI/DIN 3926
A particle disperser is located at the top of the duct and a suction pump, which suctions the main stream of crude gas through the duct, is found at the bottom. A second suction pump pulls a portion of the main stream of crude gas through the test sample. The air which is pulled through the sample is the test air. The test air stream passes through the sample perpendicular to the sample plane and is referred to as clean gas when it has left the apparatus. With the help of the particle disperser a defined particle concentration is achieved in the duct. The particle concentrations on both sides of the sample are measured simultaneous at certain time intervals with a particle counter; from these measurements a value for the Transmitting Factor (degree of particle pass-through) as function of particle size is calculated. The Transmitting Factor is defined as follows for every measured particle size:
Particle concentration of clean gas x 100 Particle concentration of crude gas
The lower the Transmitting Factor, the better the particle barrier ability. A filter test apparatus.
− The test air stream passes through the sample from back side to face. − After 1, 50 and 100 washes − Test duration of 15 and 60 minutes.

227
Test results: The barrier ability against airborne particles of the material clean 71 is better than that of material air 71. Both material show the typical behaviour of clean room fabrics, which act as surface filters: the transmitting factor decreases with increasing particle size and with a longer test duration, which means the barrier ability increases. This behaviour is more significant for the material air 71. The material clean 71 shows already a better barrier ability after a short test duration (5 minutes), but after a test duration of 60 minutes the barrier ability of both materials is on the same level. There is no significant reduction of the barrier ability after 50 and 100 washing cycles!
37.3 INTEGRATED PERSONAL PROTECTION FOR CLEANROOMS
The Laja Clinigo family provides products made to the requirements of different cleanroom classes, allowing to design a personal protection concept that is just right for the cleanroom. LajaPro introduces a new way of integrated personal protection for cleanrooms. The objective of the R&D project has been the development of personal protection to combine excellent electrostatic and particle properties while ensuring maximum wearing comfort of clothing and footwear. LajaPro has a long experience of control of static electricity in different applications of industry. LajaPro is specialised especially for ESD- footwear, production since 1985. LajaPro is supplying footwear over 20 countries. LajaPro footwear is known as high quality ESD- footwear. LajaPro has taken an active role in STAHA -program in Finland. Laja is a member of the board of STAHA -association and has also been chairman of personal protection workgroup. More information: www.laja.com.

228
229
CHAPTER 38: CARE PROGRAMME FOR CLEANROOM CLOTHING
Anna-Leena Hyytiäinen Lindström Oy, Helsinki, Finland
38.1 REQUIREMENTS FOR CLEANROOM CLOTHING
Cleanroom clothing is used in environments where special cleanliness is required. Personnel is one of the major sources of contamination. Following definitions describe the requirements for cleanroom clothing and for laundering of cleanroom clothing.
Final treatment and packaging operations for cleanroom clothing should be carried out in cleanroom conditions that are compatible with standards of the cleanroom in which they will be used. / ISO 14644-5: Annex B (informative) Cleanroom clothing B.6.
The clothing and its quality should be appropriate for the process and the grade of working area.
Clean area clothing should be cleaned and handled in such a way that it does not gather additional contaminants, which can later be shed. These operations should follow written procedures. Separate laundry facilities for such clothing are desirable. Inappropriate treatment of clothing will damage fibres and may increase the risk of shedding of particles./ EU GMP Annex 1; Personnel, 19, 21.
230
38.2 CARE PROGRAMME FOR CLEANROOM CLOTHING IN CLEANROOM LAUNDRY
38.2.1 Lindström Oy, Hämeenlinna Cleanroom Laundry
Hämeenlinna Cleanroom laundry meets the requirements of ISO 14644-1 and EU-GMP. The cleanroom laundry is equipped with instrumentation for continuous monitoring of the airborne particle concentration, air pressure difference, temperature and humidity. Airflow in the cleanroom is non unidirectional but vertical from ceiling to the floor where the air is sucked to the filters. The garments are processed after washing and packed in cleanroom ISO Class 4 (at rest) (EU GMP C, folding table EU GMP B). Water used in washing process is softened and filtered (1 цm). Last rinsing water is RO water. HEPA filtered air is used in drying process. Quality control consists of particle control and microbiological control. The personnel is trained and follow the instructions (SOP). The cleanroom laundry is validated according to EU GMP Annex 15. The laundry is equipped with GMP Steam Sterilizer.
38.2.2 Laundry Process
Before washing, garments are inspected on sorting table with light. Sorted undamaged garments are washed in barrier washer. The washing machine is emptied in cleanroom ISO 4 (at rest). Garments are dried in tumbler dryer and only HEPA filtered air is used. The washing result is checked and dry garments are folded according to instructions and packed in sterilization bags if garments will be sterilized. Washing cycles are followed by microchip attached on the garment.
38.2.3 Quality Control
The quality management system fulfils the requirements of ISO 9001:2000 and EU GMP. Lindström work wear processes have the ISO 9001 certificate since 1997.
Monitoring and continued compliance with particle concentration limits is made according to ISO 14644-2.

231
Microbiological tests are made according to the test plan based on risk assessment and validation results. Samples are taken from cleanroom air, process water, floor, doors, handles, folding table and personnel.
Revalidation processes for critical processes are carried out whenever major changes in the process take place.
38.2.4 Garment Control
New garments have been tested before use with VTT body-box test method. The results are analyzed and decisions have been made together with the supplier, customer and VTT.
During care process garments are inspected visually before soil sorting and after washing. Garments, which cannot be repaired, are eliminated. Microbiological tests are made randomly of packed and sterilized garments.
The washing cycles of garments are registered and ageing of garments is followed up by testing garments in test laboratory after certain washing cycles. Filtration efficiency and fabric cleanliness (materials property to release particles) can be measured with several test methods. E.g. test methods for fabric cleanliness are VTT Linting test and Helmke Drum test. Body Box- test gives information also of filtration efficiency.
38.3 REFERENCES
1. EN ISO 14644-1 Cleanrooms and associated controlled environments: Classification of air cleanliness.
2. EN ISO 14644-2 Cleanrooms and associated controlled environments: Specifications for testing and monitoring to prove continued compliance with ISO 14644-1
3. EN ISO 14644-4 Cleanrooms and associated controlled environments: Design construction and start up.
4. EN ISO 14644-5 Cleanrooms and associated controlled environments: Operations.

232
5. Annex 1 EU Guide to Good Manufacturing Practice (EU-GMP).
6. Annex 15 EU GMP: Qualification and validation.
7. IEST-RP-CC00 3.2 Garment system considerations for cleanrooms and other controlled environments.

HOSPITAL SESSION


235
CHAPTER 39: TRANSMISSION MODES OF HOSPITAL ACQUIRED INFECTIONS
Jukka Lumio Tampere University Hospital, Tampere, Finland
Hospital acquired infections (HAIs) is an increasing problem in wealthy countries. Five percent of all patients admitted to hospital acquire an infection during hospital stay. As hospital infections double the average length of stay, the prevalence of patients with HAI is about 10%. More than 95% of all HAIs are endemic (sporadic) and only less than 5% occurring as outbreaks. The increasing threat of HAIs is predicted leading to decrease average life expectancy in rich countries already during the next decades.
Postoperative infections are the most important HAIS estimated in health and resources. More than half of them are caused by bacteria resident on patients' own resident flora. The modes of transmission of HAIs are: 1) aerosol transmission (e.g. influenza, varicella), 2) droplet spread (> 5 µm particles from respiratory tract), 3) via blood (HIV, hepatitis), and 4) contact spread. Contact spread is estimated to cause over 90% of all HAIs. The hands of care keepers carrying bacteria from other patients, plays the major role in hospital wards. The environment and inanimate objects have, in rare occasions, caused small outbreaks. Thus, hospital cleaning and environmental disinfection plays a minor role in prevention. Airborne transmission plays a major role in very few, mainly viral, infections. Special ventilation systems are only needed to combat these infections. High turnover laminar or semi laminar ventilation is also used to decrease the risk of infections in operation theatres when foreign material (heart valve, arterial, or hip- or knee prostheses) is implanted.

236
237
CHAPTER 40: SOLUTIONS IN PREVENTING HOSPITAL INFECTION EPIDEMICS VIEW OF CLINICIAN
Janne Laine Tampere University Hospital, Tampere, Finland
40.1 INTRODUCTION
Nosocomial infections are considered to be one of the leading causes for morbidity and mortality attributed to infectious diseases in the industrialized world. In Finland, the estimated number of avoidable deaths is roughly the same as total number of road accident casualties. All the possibilities to minimize the burden of disease are therefore necessary.
Hospital infection outbreaks represent only a minority (2-4%) of all nosocomial infections. Majority on nosocomial infections are considered to be "endemic", which means that their incidence is quite stable over time. For example, it is a well known fact that about 1% of prosthetic joint operations results in deep infection. This small number of infections is considered more or less inevitable price of providing such care.
Nosocomial infections do not have to be caused by so called "super bugs" or "hospital bugs". Most of nosocomial infections are caused by microbes that reside normally on patient's skin or mucous membranes. Hospital-acquired, often resistant, bacterial strains cause only a small proportion of nosocomial infections, but their relevance is bigger when it comes to outbreaks.
Hospital infection epidemic or outbreak is a situation, when certain microbe or type of nosocomial infection is found more often than usually. Despite their small proportion of all nosocomial infections, nosocomial outbreaks´ importance is bigger than their size. They tend to concentrate on most vulnerable patients, for

238
example patients receiving intensive care, immunosuppressive medication or patients going through surgical treatment. This means that outbreaks have a potential to increase morbidity, costs and even mortality of nosocomial infections. Therefore, prevention is primary, but if an outbreak arises, prompt investigation and ending of an outbreak must be the goal.
For most parts, preventing hospital outbreaks utilizes same tools as preventing other nosocomial infections. There are several aspects to be taken into consideration. Prevention must involve multiple prospects, from basic bioscience to behavioural and technical aspects. The field of prevention is extremely large; only main principles are discussed here.
40.2 SURVEILLANCE
One has to know, at least roughly, the basic incidence of nosocomial infections in order to detect outbreaks. Some kind of surveillance systems is therefore necessary. The importance of surveillance was verified already in the cornerstone SENIC study during the 80´s (Haley RW et al. Am. J. Epidemiol. 1985; 121:182205).
There are many ways to perform surveillance. Passive incidence surveillance is a traditional way of doing surveillance. It is based on notifications made by ward personnel. Good side of incidence surveillance is that at its best it provides real-time data. It also employs ward personnel directly to infection control practise, thus possibly improving compliance. The dark side of incidence surveillance is its poor sensitivity. In most studies, only about half of the burden of disease is notified.
Active prevalence surveillance has been used trying to overcome these pitfalls. In this way of surveillance data is gathered by trained experts. This greatly improves sensitivity, but is very labour-intensive. Prevalence studies are therefore usually performed as a cross-sectional study for example twice a year. This makes prevalence surveillance vulnerable to biases. Despite of that, a series of cross-sectional prevalence studies are considered to be the most important mode of prevalence nowadays.

239
A considerable proportion of nosocomial infections can be diagnosed only after discharge from hospital. Post-discharge questionnaires are used to better notify these infections. Questionnaires can be directed to patient or his/her GP.
If only microbiological culture results are surveyed, about half of the infections are found. Most important microbiological surveillance is in detecting outbreaks that are caused by a specific pathogen. It is also important method to gain information about causative microbes and their drug sensitivity in hospital.
40.3 STANDARD PRECAUTIONS
Standard precautions include ordinary hygienic procedures that are supposed to be followed in all care. The cornerstone of standard precautions is hand hygiene, which is also the best evidence-based method of infection control. Water and soap are not always needed; modern hand hygiene is primarily hand disinfection with alcohol-based hand rubs. Hand disinfection must be performed before and after (and often also during) every physical patient contact. The greatest challenge with hand hygiene is how to improve personnels compliance to perform it. Standard precautions also include correct use of masks, gowns and gloves, prompt cleaning of infectious spillages and avoiding needle stick injuries.
40.4 CONTACT ISOLATION
Contact isolation precautions are used in the care of patients known to carry certain microbes known to have potential for cross-transmission. In our hospital, the most common reason for contact isolation is methicillin resistant Staphylococcus aureus. Contact isolation includes the principles of standard precautions plus extended use of barrier protection. Usually contact isolation is carried out in a single room. There is no solid proof of the advantage of using single rooms in this instance, yet most guidelines recommend it to be used when contact isolation is warranted.

240
40.5 ISOLATION IN ROOMS WITH NEGATIVE AIR PRESSURE
A minority of infectious diseases can spread airborne. The best known examples of this are tuberculosis, varicella and measles. Also human cases of avian influenza are recommended to be treated in such rooms, although there is no data of its capability to spread airborne.
When negative pressure isolation is used, air is flowing from other parts of the ward towards isolation room and not vice versa. This prevents possible floating small infectious particles to reach other patients or stuff. When staying in isolation room, personnel follows usual contact precaution procedures and uses FFP 3 -class masks, that can filter small aerosol particles from air. The exhausting air is led outside via separate pipelines and usually filtered before entering outside.
There is no inarguable benefit of negative pressure isolation. Because most of these diseases are rare and their spread in hospitals is therefore uncommon, it would be very difficult to proof the benefit firmly. Nevertheless, it is widely recommended to be used when treating these patients.
40.6 STERILIZATION
Reliable sterilization of instruments is crucial to prevent procedure-related outbreaks. Regular quality control of sterilization is necessary. The quality of sterilization has been high; outbreaks because of inaccurate sterilization have been extremely rare.
40.7 OTHER ASPECTS
Patient preparation for surgical procedures is important. Patient should not stay in the hospital unnecessary before operation in order to prevent colonization with hospital strains. Skin preparation must be done correctly. Antibiotic prophylaxis is given just before most operations.
Invasive catheters and draining tubes as well as endotracheal intubation raises significantly the risk of infection by allowing microbes to pass important barrier

241
defence mechanisms. These devices are mostly used in intensive care units, where they can play significant role in outbreak situation. The benefit of these devises must be evaluated daily, and devices must be removed immediately when no longer necessary.
Operating theatre ventilation must be adequate to be able to minimize the amount of microbes in air. Laminar air flow is recommended in theatres, where uncontaminated surgery, such as prosthetic or heart surgery, is performed.
Other humans are usually the source of cross-transmission. Hospital environment is a source in a lesser degree. Despite of that, house-cleaning in hospitals is important. Especially in certain outbreak situations environment can play a bigger role and enhanced cleaning can some times be the solution to end an outbreak.
40.8 CONCLUSION
Transmission of pathogens from a patient to another is the usual element when an epidemic arises. Usually pathogen is transmitted by caregivers hands. This underlines the critical role of hand hygiene. Wards awareness of the possibility of an epidemic is important, as well as the knowledge of acceptable rate of nosocomial infections in that type of ward. When these aspects are recognised, ward itself has a good capacity to detect outbreaks when they occur. In these circumstances, infection control teams are often alarmed by the ward even before the surveillance systems detect the outbreak.

242

243
CHAPTER 41: CLINICAL NEEDS AND CURRENT STANDARDS FOR OPERATING ROOM AIR
Teija-Kaisa Liljeblad Laurea University of Applied Science, Vantaa, Finland
The purpose of this presentation is to introduce some of the current Finnish and international standards for operating room air and critically discuss their implications to aseptic practices aiming to minimize particle dispersion during operation. The criteria for aseptic practice recommendations were created by method of critical incidences by analyzing 18 h of videotaped material including whole time particle count by laser-sampler (VTT, Tampere) in laminar flow paediatric operating rooms. The inductive analysis of the data was divided into three sections 1) the preparations for the operation, 2) the creation of the sterile field, 3) the maintenance of the sterile field. The research findings brought one section more: 4) the discharge of the sterile field. Less incidences causing particle dispersion were found during creation of sterile field than other sections. During the maintenance of the sterile field, the causes of dispersion were 1) handling the items in the sterile field, 2) invasive and 3) non-invasive interventions during the operation and 4) the action of non-scrubbed persons around the sterile field. The amount of particles varied in operations during the discharge of operation. The incidences were tested also by rotated explorative factor analysis (FA) with Maximum Likehood Method aiming to decrease the number to critical ones. FA strengthened the result of inductive analysis, decreasing 21 incidents to 9 critical ones. The detailed recommendations were reasoned by international evidence. This piece of research will be used in different clinical contexts to test a conceptual model of clinical aseptic practices to be used in perioperative education, research and clinical quality development.
41.1 INTRODUCTION
Operating room (OR) environment has been in the focus of infection control (IC) since mid 1800s when surgeons Lister in Scotland (Cohen 1999) and
244
Brewer (1915) first in New York and later in Boston, started perhaps the very first evidence based evaluative programmes in OR environment. The concepts like asepsis and aseptic technique, and practical norms concerning them, were created to decrease the high numbers of Nosocomial gangrene or wound fever threatening the effectiveness of the surgery and even the life of surgical patient. In European ORs the environmental aspects were pointing out to the importance of clean air and sterility of items used in operations. Heavy methods of infection control, carbolic vapours and dressings used by surgeons were not available in nursing when Florence Nightingale in Crimean War and Rofaida AL-Islamiahs in Islamic Wars organized groups of women to deliver nursing care for wounded by means of environmental changes and hygiene. According to Meleis (1991) during this stage the mission of nursing was defined as providing care and comfort to enhance healing and a sense of well-being and to create a healthy environment that helps in decreasing suffering and deterioration. At those times nurses defined the patient and the environment to include their domain. In actual perioperative practice nurses are focusing to evidence based practice which in OR means learning, evaluation and development of aseptic practice based on critical use of multidisciplinary knowledge.
In Europe Sweden has long been in the front line of multidisciplinary co-operation and research concerning aseptic practices focusing to the safety of OR air. Since the end of 20th century OR nurse, educator and researcher Barbro Friberg (1998) has developed working standards for OR according to and in co-operation with medical researchers respected as researchers creating basic knowledge concerning air born contamination using experimental design arrangements. Findings of these Swedish and other international research has long been published, but not always been used in a very efficient way when reasoning professionally separated aseptic practices in European ORs. Nominal group decision making model with lacking sources of multidisciplinary IC studies has long been used in reasoning of recommended aseptic practices for OR nurses (AORN 1999). The challenge of evidence based and multidisciplinary aseptic practices in OR is to replace the ritualistic and unreasoned practices with research findings where the evidence strong enough is available (Liljeblad & Sihvonen 2005).

245
41.2 CURRENT STANDARDS FOR OPERATING ROOM AIR
In Finland findings of Reijula (2005) concerning hospital in door air showed, that hospital personnel suffers from dry (46%) and stuffy air (40%), noise (30%), draught (27%) and odours (26%) in their working environments. In total 15% of the hospital facilities were estimated to need immediate repair. According to Reijula there are no official regulations for OR air in Finland or in Europe, so the lack of instructions was one of the most common problems with ventilation. The level of local planning and construction of systems like level of air filtration varied a lot between ORs in the research hospitals. Insufficient ventilation was a common problem indoors causes for complaints were draught problems, lack of local exhaust ventilation systems or undeveloped systems, heavy loads of heat or impurities to the indoor air. The immediate need of planning instructions for hospital air was found.
According to Finish national infection control guidelines for OR air (Tarvainen & Rantala 2005), the critical amount of particles in air is defined at level of 100 CFU/m3, the temperature 22±3°C, humidity of the air 3545% ±10% and the pressure model should be directed from clean to less clean (from aseptic zone to periphery). The filtration of air should be performed by HEPA- (high efficiency particulate air)-filtration during basic ventilation model of 20 air changes per hour (ACH), and conventional turbulent ventilation model of 2025 ACH, from which at least 20% should be fresh air. The vertical laminar flow is preferred as more efficient than horizontal laminar flow. The laminar-roof-model is considered most efficient ventilation model with 60 ACH. The increase in amount of personnel in OR and opening of OR doors decreases the efficiency. Local exhaust models were mentioned as an occupational means of prevention with laser surgery. In www-pages of local office for occupational safety, the exposure to biomaterials but not to surgical smoke was mentioned (http://www.tyosuojelu.fi/fi/biologisetvaarat / 19.1.2006). In Finland the follow up of empty OR is recommended to be performed by sampling particles over 23 µm. This does not follow the recommendations stated by U.S. Department of Labor, Occupational Safety & Health Administration (OSHA).
OSHA Technical Manual recommends as the walk around inspections for health hazards in OR 1) handling of waste anaesthetic gases, 2) air conditioning, 3) humidity of 50% and 4) static electricity control. Controls and

246
preventions concerning OR air include a demand of adequate ventilation to remove contaminants with adequate filtering when the air is recirculated. Local ventilation, like portable ventilation, should be used during laser surgery to remove contaminants and mixing of methyl metacrylate should be done in a closed system. In the morgue, but not in the OR the local vacuum systems should be in place for power saws and shields should be used when significant splash hazards are anticipated. OSHAs recommendations for good working practices in OR include immediate and proper disposal of bio hazardous waste and care taken of not to create aerosols. The air sampling should be taken place during normal exposure time not in empty OR like in Finnish recommendations.
CDC (2003) recommends maintaining higher pressure of the air in OR than in surrounding environment. From the recommended 15 ACH, more than 3 should be fresh air. All recirculated and fresh air should be filtered with filters of at least 90% of dust-spot-tested air. In environments with no laminar ventilation available, the intake of conventional ventilation should be from sealing and, the exhaust from floor level. Ultraviolet germicidal irradiation (UVGI) is not recommended to use in OR. The doors of OR should be kept closed and unnecessary traffic should be minimized. In environments where laser is used, the personal protective devices (PPE) like N95 or N100 respirators and smoke wall-suction evacuators should be used. Mechanical smoke evacuator with high-efficiency-filter should be used with excessive smoke when handling tissues of patients contaminated with human papilloma-virus (HPV) or extra pulmonary Tuberculosis.
41.3 MEASURING THE CRITICAL INCIDENCES CAUSING PARTICLE DISPERSION IN STERILE FIELD
To find out the clinical needs to control air born particles of OR air the criteria for aseptic practice recommendations were created by method of critical incidences by analyzing 18 hours of videotaped material including whole time particle count of particles size over 0.3 µm by Metone-laser-sampler collected by research group of VTT in Tampere in laminar flow ventilated paediatric operating rooms during four open heart operations. To minimize the threats of reliability in data collection and analysis, the time of particle figure dictation from the screen was limited to maximum 30 min and the periods of reanalysis was done. The requirements of accuracy and objectivity in the later judgements
247
were aimed to reach by using the Friedmans test, principle component analysis, factor analysis and rotated factor analysis to study the hierarchical structure of the critical incidents during these operations.
In operations 1 and 4 the barrier drapes used in sterile field were disposable and extra drapes cotton. In operations 2 and 3 all sterile drapes were made of polyester microfibre. In operation 1 where used several non-sterile cotton bedclothes. During all operations the cotton sponges were used.
After classification of the collected data to reach the demand of normal distribution, the principal component analysis of 21 critical incidences in connection with high particle counts was performed. The analysis aimed to explore the possible grouping variables describing aseptic practice during the operations. The correlations between 21 critical incidents were low. The loadings of critical incidents varied from 0.282 to 0.730. The power of principle component analysis to explain the total variance of critical incidents with nine principal components was 57.2%.
The variance of these nine principal components varied from 8.4% to 4.88%. The principal components formulated were 1) simultaneous activity with tissue handling in the sterile field (8.4%), 2) the activity of scrubbed an un-scrubbed personnel near the sterile field (7.4%), 3) handling of sterile items in the sterile field (7.2%), 4) the activity of un-scrubber personnel near the sterile field (6.4%), 5) the handling of the skin of the patient (6.1%). In component number 6) all the criteria (6.0%) were secondary and the principal component number 7) handling of cotton sponges (5.4%) was negative. Next were the 8) incision- component (5.2%) and component describing 9) handling of tissues (4.9%). Critical incident of diathermia use got strong negative loadings in third component like did the suturing of tissues and sawing of the sternum in eight components. The results indicate the critical incidents to be good variables to be used as them selves and the trend of principal component analysis to create larger matrix than factor analysis (Hazard Munro 1997).
The inductive analysis of the data was divided into three sections 1) the preparations for the operation, 2) the creation of the sterile field, 3) the maintenance of the sterile field. The primary analysis of the data brought one section more: 4) the discharge of the sterile field. Unlike earlier Finnish findings

248
of Verkkala et al. (1990) less incidences causing particle dispersion were found during creation of sterile field than other sections. During the maintenance of the sterile field, the causes of dispersion were 1) handling the items in the sterile field, 2) invasive and 3) non-invasive interventions during the operation and 4) the action of non-scrubbed persons around the sterile field. The amount of particles varied in operations during the discharge of operation. The incidences were tested also by rotated explorative factor analysis (FA) with Maximum Likehood Method aiming to decrease the number to critical ones. FA strengthened the result of inductive analysis, decreasing 21 incidents to 9 critical ones (Table 41.1). The detailed recommendations were reasoned by international evidence.
The invasive interventions during the operation caused highest dispersions during the whole observed period. Dispersion during incision were less than 10000000000 p/m³ in all operations. The use of diathermia caused highest maximal dispersion in operation 4 (730650000000 p/m³) with significant operation related variation (Khi2 = 127853, p = 0.000, N = 204). The sawing of sternum caused highest dispersions of range 1610000000264395000000, mean 55798370000 p/m³) in operation 2. The variation between operations were significant (Khi2 = 11.80, p = 0.008). Suturing the tissues and making knots increased the particle amount highest in operation 3 (range 0124460000000, mean 100622000 p/m³) with very significant statistical variations between operations (Khi2 = 89.696, p = 0.000). During the suturation of the skin the difference between operations was significant (Khi2 = 38.069, p = 0.000), the highest was 10180000000 p/m³. When performing simultaneous activities with tissue handling in the sterile field the variation was between 0 and 36875000000, mean 777970000 p/m³ in operations 1 and 4, and between 0 and 8255000000, mean 733430000 p/m³ in operation 2 and 3. Differences were almost significant (Khi2 = 8.753, p = 0.033).

249
Table 41.1. Critical aseptic incidences as results of rotated factor analysis.
Loadings and explanatory power of critical aseptic incidences
1. Cleaning the skin of the patient after operation (0.984 / 5.307%)
2. Moving the sterile drapes by scrubbed person (0.989 / 5.217%)
3. Sawing the sternum of the patient (0.991 / 5.207%)
4. Moving the sterile drapes by unscrubbed person (0.988 / 5.180%)
5. Actions exposuring the sterile field to contamination (5.106%) removing of the surgical glove in the presence of sterile field (0.880) moving the OR lamp (402)
6. Actions exposuring the sterile field to contamination (4.771%) moving the OR table (0.692) removing of the surgical glove in the presence of sterile field (0.318) coughing in the sterile field (0.546)
7. Handling cotton sponges in sterile field (0.690 / 4.142%)
8. Opening sterile packages (0.521 / 2.68%)
9. Several simultaneous actions in the sterile field handling the tissues of the patient (0.387 / 1.592%))
The use of powered instruments caused electrical coronas with increased amount of particles in the sterile field (Table 41.2). The other activities were in connection with handling the skin of the patient, causing turbulent air currents or electrical currents in the sterile field by handling drapes and sterile items or by moving in the presence of the sterile field. The factor of several simultaneous actions was describing the explanative power of other factors.

250
Table 41.2. Particle dispersions and electrical coronas during use of powered instruments.
Critical incident in sterile field during electrical coronas
Amount of particles* during electrical coronas during four operations (n=number of observations) min max mean SD
Use of electrocautery device Sawing the sternum of the patient Use of suction during operation Ensuring the function of pacing electrode
1 (n = 26) 161 6 803 000 10 56 298.8 1 949 937.9 2 (n = 12) 2 000 2 619 000 253 541.67 746 084.28 3 (n = 12) 1 000 1 645 000 477 791.67 620 806.42 4 (n = 187) 0 24 963 000 1 937 067.4 3 714 299.20 2 (n = 4) 224 000 1 306 000 588 125.0 486 656.00 4 (n = 4) 227 500 565 500 393 000.0 153 964.82 1 (n = 20) 0 14 000 2 575.0 3 184.15 2 (n = 8) 1 000 4 000 2 062.5 1 083.56 3 (n = 20) 0 89 8000 72 000.0 197 375.14 4 (n = 42) 1 000 26 000 3 809.52 4 462.52 2 (n = 4) 2 500 3 000 2 625.0 250.00
* 1 observed particle is 10 000 particles/m3
41.4 CLINICAL NEEDS TO CONTROL THE AMOUNT OF PARTICLES IN OR AIR
These findings of analysis done in an inductive way are supported by traditional understanding of particle dispersion in the sterile field and also by Friberg (1998) when she describes broadly the classical findings of studies concerning air born contamination in OR. She summarises that the physical mechanisms of movements and sedimentation of particles in OR air has been proved by Whyte concerning the gravitation mechanism and the speed of sedimentation of the particles as mean value of 0.3 m/min and points out that fine particles of size less than 0.5 µm are able to spread out by random diffusion which decreases the speed of sedimentation. The current Finnish recommendation to measure particles of over 23 µm in empty OR does not respect the existence of particles this size.

251
According to earlier strong evidence, several issues should be taken care when optimizing the clean air in sterile field of surgical operation site by decreasing the amount of particle dispersion originated from foreign materials, perioperative patient and personnel. Friberg (1998) summarised that by 1) minimizing the number of personnel in OR, 2) avoiding rapid movements in the sterile field and 3) ensuring intact and healthy skin of OR personnel important factors effecting on the amount of particles in the air of sterile field in OR are controlled. The sources of contamination could be controlled by using personal protective devices, sterile instruments and scrub suits in the sterile field, ensuring the positions and cleanliness of OR lamps, minimizing the dispersion of particles originating from electrocautery devices, materials used in operation site like glove powder and linting textiles and minimizing handling of the instrument. To protect the sterility of the surgical site, the size of the sterile field is recommended to be 2.8 m2 covering all the instruments and the whole sterile operation site (Chow & Yang 2005).
These current research findings are supported also by the demands of American operating room nurses in their national conferences (Ulmer 1998) concerning surgical smoke to protect the patient and the personnel in OR not to exposure to the irritating and toxic effects of surgical smoke plume from electrical surgical devices and use surgical laser. The origin of current American recommendations for evacuation of surgical smoke is in Health Hazard Alert of National Institute for Occupational Safety and Health in September 1996, where is described that the surgical smoke consists of toxic cases, vapours and particles and vapours causing bio hazardous exposure. Despite of demands of Association of periOperative Nurses (AORN) and American Nurses Association (ANA) the Centres for Disease and Control (CDC) has not (yet) published national standards concerning surgical smoke even many pieces of research with strong experimental design arrangements has been published recently. According to Johnsson (2000) the publishing will take place soon but they have not been published during year 2003 (Roark, 2003) or spring 2006.
Earlier CDC (2003) has been shortly guided the health care personnel to protect against air born risks in its Guidelines for Environmental Infection Control in Health-Care Facilities. There are advices to use portable, industrial-grade HEPA filter units capable of filtration rates in the range of 300800 ft3/min to augment removal of respirable particles when needed. Portable HEPA filters able to

252
re-circulate all or nearly all of the room air, and provide the equivalent of > 12 ACH should be selected. In many American hospitals removal of surgical smoke has been taken care by the hospital risk management (Tydell 2002). The recommendations of OSHA, like the location of the nozzle of smoke evacuator line not longer than 2 in from the source of surgical smoke, operation or use related change of filters and lines, and handling of smoke evacuator filters as infected material has been accepted locally.
These results support the need to develop both the occupational infection control and the aseptic practices to decrease air born contamination of the surgical site in OR. In future creating process of European Council Directives for OR air, the exposure of OR personnel to bio-hazardous materials caused by the use of powered instruments should be taken care by proper room and local ventilation and personal protective devices. The exposuring time of OR nurses is discussed to be longer than the time of surgeons and anaesthetists, so the occupational risk of at least nurses to pulmonary and infectious diseased should be studied in addition to the risk of air born contaminants like toxic vapours and mutagenic particles.
41.5 REFERENCES
1. American Nurses Association (ANA) 1998. Occupational Health Hazard: Surgical Smoke. www.ana.org/gova/smokefct.htm 13.10.1998.
2. AORN. 1999. Standards, Recommended Practices and Guidelines Denver: AORN Inc.
3. Brewer, GE. 1915. Studies in Aseptic technic with report of some recent observations at the Roosevelt hospital. Deniston: JAMA Vol. LXIV, No 17, pp. 36972.
4. Centers for Disease Control and Prevention, department of health and human services, 2003. Guidelines for environmental infection control in health-care facilities.
5. Recommendations of CDC and the Healthcare Infection Control Practices Advisory Committee (HICPAC). Recommendations and Reports June 6, 2003 / Vol. 52 / No. RR-10. http://www.cdc.gov/mmwr/PDF/rr/rr5210.pdf/ 28.03.2006

253
6. Chosky, S.A., Modha, D. & Taylor, G.J.S. 1996. Optimisation of Ultraclean Air, Br. J. Bone Joint Surgery, 78-B, pp. 835837.
7. Chow, T.T. & Yang, X.Y. 2005. Ventilation performance in the operating theatre against infection: numerical study on a ultra-clean system. J. Hospit. Infect. 59, pp. 138147.
8. Cohen, J. 1999. Hospital Gangrene: The Sourge of Surgeons in the Past. Infect. Cont. Hospit. Epidemiol., 20, pp. 638640.
9. Flanagan, J.C. 1954. The Critical Incident Technique. Psychol. Bull. 51, pp. 327358.
10. Friberg, B. 1998. Aerobiology in the operating room and its implications for work and standards. Umeå: University medical Dissertations. New series No 556.
11. Guidelines for Environmental Infection Control in Health-Care Facilities Recommendations of CDC and the Healthcare Infection Control Practices Advisory Committee (HICPAC), Prepared by Sehulster L., Raymond Y.V., Chinn MD, http://www.cdc.gov/mmwr/preview/mmwrhtml/rr5210a1.htm / 29.12.2005.
12. Hazard Munro, B. 1997. Statistical methods for health care research. 3rd ed. Lippincott: Philadelphia. Pp. 320.
13. http://www.tyosuojelu.fi/fi/biologisetvaarat. /19.1.2006.
14. Johnson, A.C. 2000. Technological Advances in Lighting and Booms for the OR: Impact on Infection Control and OR Efficiency. Infect. Cont. Today 07.
15. http://www.infectioncontroltoday.com/articles/071feat4.html / 28.03.2006.
16. Liljeblad, T.-K.., Hannunkivi, J., Lintukorpi, A. & Rauhala, P. 2003. Critical aseptic incidences during open heart operations, 3rd European Congress for Operating Room Nurses, 1013 April in Hersonissos, Island of Crete.
17. Liljeblad, T.-K. & Sihvonen M. 2005. Acceptance of aseptic recommendations. World Conference on Surgical Patient Care, September 2005 in Barcelona, Spain.

254
18. Meleis A.I. 1991. Theoretical Nursing: Development & Progress. 2nd ed. Philadelphia: J.P. Lippinggott Company.
19. OSHA Technical Manual, 2005. www.osha.gov, Appendix VI:1-1. Biological Agents Blood and Body Fluids/. 26.12.2005.
20. Reijula K. 2005. Sairaaloiden kunto ja ilmanvaihto. Sosiaali- ja terveysministeriön työryhmämuistioita 2005:3. Selvityshenkilön raportti. Helsinki: Sosiaali- ja terveysministeriö
21. Roark J. 2003. Dangers of surgical smoke still persist despite of awareness campaign. Infect. Cont. Today 07/2003. http://www.infectioncontroltoday.com/ articles/371refer.html /28.03.2006.
22. Tarvainen, K. & Rantala, A. 2005. Leikkaussalin ilmastointi. In: Infektioiden torjunta sairaalassa. Helsinki: Kuntaliitto 2005. Pp. 261264.
23. Tydell, P. 2002. Keeping Employees Healthy: The far-reaching effects of occupational health. Infect. Contr. Today 10. http://www.infectioncontroltoday.com/articles/2a1bpract.html.
24. Ulmer, B. 1998. Occupational safety and health administration acts on guidelines for electrosurgical smoke. AORN J 67(6), pp. 12441245.
25. U.S. Department of Labor, Occupational Safety & Health Administration STD 01-05-001-PUB 8-1.7 Guidelines for laser safety and hazard assessment.
26. Verkkala, K., Mäkelä, P., Ojajärvi, J., Tiittanen, L. & Hoborn, J. 1990. Air contamination in open heart surgery with disposable coveralls, gowns, and drapes. Annals Thorag. Surg. 50, pp. 757761.

255
CHAPTER 42: AIRBORNE PARTICLE EMISSIONS OF TEXTILES DURING PREPARATION FOR SURGICAL
OPERATION
Salme Nurmi, Anne Lintukorpi,*, Arto Säämänen, Tuija Luoma & V-P Suikkanen
VTT, Tampere, Finland * Uudenmaan Sairaalapesula Oy, Kerava, Finland
Managing human particle cleanliness is an important issue in the cleanrooms and in the operating theatres. Man is considered to be the greatest generator of contaminants in a cleanroom. Human persons and textile materials are the sources of particle emissions in an operating theatre. Airborne micro-organisms are not the only particles in the modern surgical environment. The wide use of woven reusable and disposable non-woven surgical protective clothing, drapes and clean air suits in the operating rooms, has resulted in the release of large amounts of nonviable particles called lint, which may adhere to walls, floors, instruments, nursing staff, patient in recovery and other critical surfaces. Controlling electrostatic charge reduces surface contamination and electrostatic discharge (ESD). The ordinary textile fibrous or laminated materials are insulators, exhibit rather low electrical conductivity and charge dissipates with difficulty. ESD protective fabrics incorporating electrically conductive fibres can safely dissipate electrostatic charge when they are effective grounded. In this paper generally used surgical protective clothing as a source of total nonviable particle emission and electrostatic charge accumulation into body are studied by simulated patient preparation process in a cleanroom laboratory conditions. Airborne microbial populations were not determined.
42.1 INTRODUCTION
The human being is considered to be the greatest generator of contaminants in a cleanroom. Today the cleanroom environment is protected from contaminants generated by personnel with the use of special clothing known as personnel

256
filters or the garment system. The personnel filter is used as a barrier between the personnel and the atmosphere surrounding them. The garment system for use in cleanrooms can actually be defined as both working clothes and protective clothing. Contamination control and cleanroom technology demands protection for both the personnel and the products and processes. Contamination control in operating theatres is concentrated on patient, nurses, doctors, devices and surrounding room.
Controlling electrostatic charge reduces surface contamination and electrostatic discharge. The materials used for protective garments and surgical drapes are often comprised of insulating materials. Electrostatic charges are generated both inside and outside the garment, as well as induced on personnel wearing the garment. Electrostatic fields resulting from the surface charges on the garment material can affect nearby other materials and equipment. Electrostatic discharge protective fabrics incorporating electrically conductive fibres can safely dissipate electrostatic charges when they are effectively grounded.
42.2 HUMAN AS A GENERATOR OF CONTAMINANTS
People continuously release small particles from the outer layer of the skin into the surrounding environment. This process occurs because cells from surface layers of skin are continually replaced by new cells from the layers below. The number of particles released from the outer layer of the body will increase as a result of the abrasive action of clothes and jewellery for instance. The more active and effectively personnel is working and moving the more numerous particles will be released (Table 42.1).
Table 42.1. Contaminants generated from a body.
Activity Number of particles generated (≥ 0.5 µm / min)
Sitting or standing still 100 000 Sitting, small movement of arms or head 500 000
Sitting, moving arms, legs or head 1 000 000 Standing up 2 500 000
Walking slowly 5 000 000 Walking normally 7 500 000
Walking with speed (2.5 m/s) 100 0000 Performing work-out 15 000 00030 000 000

257
42.3 ELECTROSTATIC CHARGE IN OPERATION THEATRES
The nature of operations in the cleanrooms and operation theatres encourages the generation of static charge. The movement of personnel is often a major cause of electrostatic discharge. Cleanrooms and operation theatres require many kinds of insulating materials, such as glass, fibrous textile materials, Teflon and other polymer and cellulose products. Personnel are enclosed in protective garments, shoes, gloves and other protective devices. Insulating surfaces generate high charges, furthermore in motion larger amounts. Human body, conductive shoes and conductive floors, dissipative or conductive constructions and furniture materials can prevent or dissipate static charge if the path to ground is existed.
It is recommended to use in cleanrooms conductive or static dissipative materials as much as possible but catering for contamination control. A conductive path should be provided between static dissipative garments and the ground to complete system. The most important is that cleanroom materials have to pass all the facility requirements for contamination control. When insulators cannot be eliminated or isolated from static sensitive products, the most common methods of static control are high humidity chemical coatings and air ionisation.
42.4 BARRIER SURGICAL PROTECTIVE PERFORMANCE
Protective barriers are very important when trying to shield from the contamination by blood-borne pathogens and micro-organisms. With the rapid increase in blood borne diseases, such as hepatitis C and HIV, the need for medical workers to wear garments that provide a barrier to fluids such as water, blood and alcohol have become critical. The major requirements for barrier fabrics are that they resist the penetration of liquids, particular blood and at the same time be sterile, breathable, flexible and inexpensive.
Barrier requirements can be partial resistant or total proof, ranging from particulates and bacteria to fluids and viruses. In some cases special coating and breathable polymer films are being added to fibres and fabrics. In other cases ingredients are added directly into polymers being used to make fibres. In non-woven structures, melt blown low denier fibres are being layered in the middle of spunbonds or used to make three dimensional moulded shapes. Bicomponent

258
fibres are also used in the production of spunbonds, carded and thermal bonded non-woven materials. Today totally barrier materials which means viral and liquid barrier are fabrics reinforced with impermeable polymer films. In operation theatres there are used reinforced drape materials which means three layer structures consisting one layer polymer film.
42.5 STATIC DISSIPATIVE PROTECTIVE GARMENT AND CLEANROOM GARMENT
Cleanroom garments are used to completely enclose personnel to prevent personnel generate particles from entering the cleanroom work area. The materials used in these cleanroom outer garments, including shoes, boots, gloves and other protective devices, are often insulating materials capable of generating high levels of static charge when they contact other garment materials worn by personnel. Charge is generated on both the inside and outside of the garments as well as on personnel wearing the garments.
Static dissipative materials are generally created by adding conductive materials or chemicals to insulative polymers and elastomers. These may be carbon or metallic fibres, powders, chemicals that form on the surface a conductive path or hygroscopic chemicals that attract water to the surface of a material. In all of these cases the method of creating the static dissipative property may be a potential cleanroom contaminant. Continuous cleaning of cleanroom materials, particularly the washing of garments, may cause them to lose their static control properties over time. All cleanroom materials need to be monitored periodically for effectiveness and replaced as needed.
42.6 TEST ARRANGEMENTS
Measurements were made in a controlled cleanroom of 22 m2 where the cleanliness was class 5 pursuant to EN ISO 14644-1 standard. Measurements were done in an ambient relative humidity of 38% and a temperature of 22°C. The room with a conductive floor was HEPA-filtered. Total airborne particulates and contact body voltage were measured. Contact body voltage was measured directly from movable nurse by wristband. Simulation of operation theatre
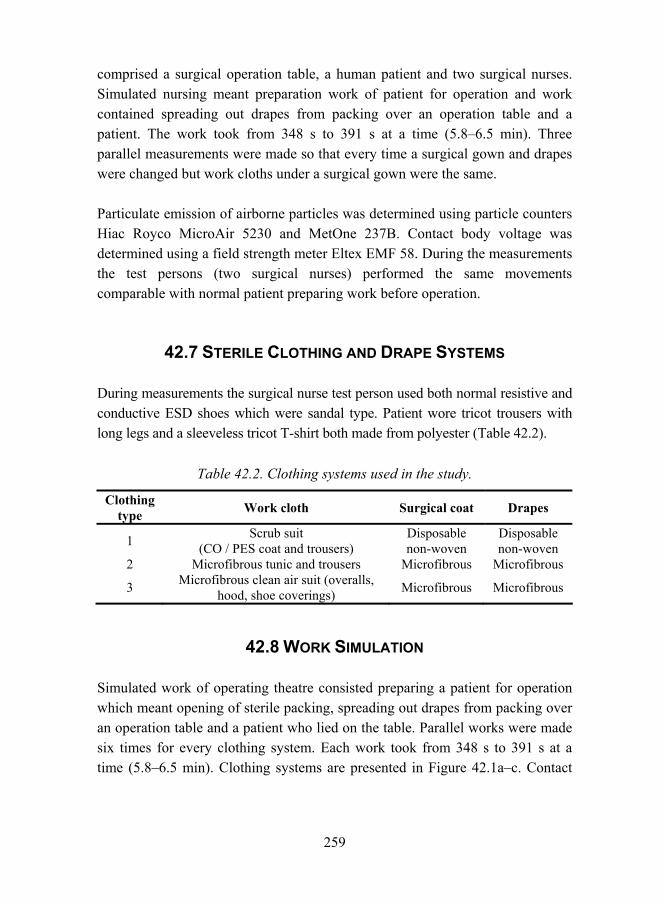
259
comprised a surgical operation table, a human patient and two surgical nurses. Simulated nursing meant preparation work of patient for operation and work contained spreading out drapes from packing over an operation table and a patient. The work took from 348 s to 391 s at a time (5.86.5 min). Three parallel measurements were made so that every time a surgical gown and drapes were changed but work cloths under a surgical gown were the same.
Particulate emission of airborne particles was determined using particle counters Hiac Royco MicroAir 5230 and MetOne 237B. Contact body voltage was determined using a field strength meter Eltex EMF 58. During the measurements the test persons (two surgical nurses) performed the same movements comparable with normal patient preparing work before operation.
42.7 STERILE CLOTHING AND DRAPE SYSTEMS
During measurements the surgical nurse test person used both normal resistive and conductive ESD shoes which were sandal type. Patient wore tricot trousers with long legs and a sleeveless tricot T-shirt both made from polyester (Table 42.2).
Table 42.2. Clothing systems used in the study.
Clothing type Work cloth Surgical coat Drapes
1 Scrub suit (CO / PES coat and trousers)
Disposable non-woven
Disposable non-woven
2 Microfibrous tunic and trousers Microfibrous Microfibrous
3 Microfibrous clean air suit (overalls, hood, shoe coverings) Microfibrous Microfibrous
42.8 WORK SIMULATION
Simulated work of operating theatre consisted preparing a patient for operation which meant opening of sterile packing, spreading out drapes from packing over an operation table and a patient who lied on the table. Parallel works were made six times for every clothing system. Each work took from 348 s to 391 s at a time (5.86.5 min). Clothing systems are presented in Figure 42.1ac. Contact

260
body voltage was measured by wristband directly from the movable nurse who spread out the drapes over the patient.
Figure 42.1. a) Clothing system 1, b) Clothing system 2, c) Clothing system 3.
42.9 RESULTS AND DISCUSSION
42.9.1 Airborne Particles
Measured total particle amounts are presented in Table 42.3 and Figures 42.2 and 42.3. Test persons (two surgical nurses) dressed in scrub suits, disposable non-woven surgical coat and working with disposable non-woven drapes released more airborne particles into laboratory cleanroom than nurses in microfibrous cloths working with microfibrous drapes.
Table 42.3. Number of airborne total particles during work measured from three different clothing system types during simulated work
Clothing type Test duration [S] ≥ 0.3 Μm ≥ 0.5 Μm ≥ 3 Μm ≥ 5 Μm
1 348 3 560 000 2 090 000 271 000 124 000 2 356 2 709 000 1 245 000 148 000 660 00 3 391 758 000 381 000 55 000 25 000
According to the results clothing system number 1, which consisted of polyester/cotton woven clothes and disposable non-woven drapes, released most airborne particles into surrounding room, altogether 3 560 000 particles (≥ 0.3 µm). When microfibrous woven cloths and drapes were used less particles released into air. Released airborne particle amount from clothing system 2 was 23% less and

261
from clothing system 3 as much as 78% less than from clothing system 1. Both systems 2 and 3 were polyester microfibrous materials. System 2 included two-piece work cloth (tunic and trousers) and system 3 one-piece clean air suit with a hood. Drapes were polyester microfibrous.
Total particle amounts
0500000
1000000150000020000002500000300000035000004000000
0.3 0.5 3.0 5.0
Particle size [micro m]
Part
icle
am
ount
1
2
3
Figure 42.2. During simulation released total particles (≥ 0.3 µm).
Number of released particles during simulation
0
5000
00
1000
000
1500
000
2000
000
2500
000
3000
000
3500
000
4000
000
1
2
3
Clo
thin
g sy
stem
Number of particles
Figure 42.3. Cumulative particle amounts of different clothing systems.
From the results it can be supposed that big part from particles came from movable test nurses signifying skin scales, hair, textile fibres and micro-organisms. Cotton/polyester based work cloth, disposal non-woven surgical coat and disposal non-woven drapes linted into air more particles from fabric surfaces than microfibre polyester fabrics because they contained cotton, cellulose and polyester stable fibres which were loosed and cut more easily than filament type fibres. One-piece clean air polyester microfibrous suit linted less particles and protected best particles from test nurses coming to surrounding room. The

262
results showed that it is possible to achieve less airborne particles containing work air by developing multifunctional and clean microfibre fabrics, by designing and manufacturing as covering clean air suits as it is possible without forgetting comfortableness items.
42.9.2 Body Charge
Measured body charge levels are presented in Table 42.4 and Figure 42.4.
Table 42.4. Body charge level [V] measured directly from movable nurse.
Clothing type Nurse with normal shoes Nurse with ESD shoes 1 767 15 2 1707 140 3 17*
* Shoe coverings were conductive
Body charge level during simulation
0200400600800
10001200140016001800
1 2 3
Clothing system
Pote
ntia
l [V]
Normal shoesESD shoes
Figure 42.4. Contact body voltage measured directly from movable nurse
The results showed body charged into different potential levels by means of different clothing systems worn. Least of all charge was accumulated when nurses wore clothing system 3 charge dissipative clean air suits and conductive shoe coverings. Conductive clothing gave a path for a charge to ground via body, conductive shoes and conductive floor. Body charged to the lowest potential level of 17 V. Normal resistive shoes did not form a continuous grounding route but body was charged in clothing systems 1 and 2 into potential levels of 700 V and 1700 V. Similar systems with conductive ESD shoes gave potential levels as low as 15 V and 140 V.

263
42.10 CONCLUSIONS
Contamination control is becoming more and more important in industrial areas where there are increasing requirements for both cleanliness and hygiene in production. Contamination control and cleanroom technology demands protection for both the personnel and the products and processes. The results showed that the environment in operation theatre can be managed, controlled and protected from contaminants generated from personnel and other textile materials. To ensure the proper and reliable functionality of cleanroom clothing, the real cleanliness measurement should be determined under real-use conditions and environment.
42.11 REFERENCES
1. SFS-EN ISO 14644-1. 2000. Cleanrooms and associated controlled environments. Part 1: Classification of air cleanliness. CEN European Committee for Standardisation. 37 p.
2. SS 2680. 1995. Renhetsteknik Renhetskontrollerad verkstadsmiljö. SIS Standardiseringen I Sverige. 25 s.
3. Lickfield, D. 2001. Nonwovens in medical textiles. Int. Fiber J., 16, pp. 4248.
4. McDonnell, G. 2002. Clean and sterile. Cleanroom Technol., 8, pp. 1315.
5. IES-RP-CC003.2. 1993. Garment system considerations for cleanrooms and other controlled environments. 31 p.
6. ESD TR 11-01. Electrostatic guidelines and considerations for cleanrooms and clean manufacturing. ESD Association Technical Report. 22 p.
7. Medicinal products for human and veterinary use: Good manufacturing practices. 1997. EC Eudralex. Annex 1.
8. FED-STD-209E. 1992. Airborne particulate cleanliness classes in cleanrooms and clean zones. USA Federal standard. 48 p.
9. Ramstorp, M. 2002. Personal hygiene. Cleanroom Technol., 8, pp. 2324.

264

265
CHAPTER 43: PARTICLE EMISSION AND ELECTROSTATIC CHARGE IN CARDIAC SURGERY
Anne Lintukorpi & Salme Nurmi* Uudenmaan Sairaalapesula Oy, Kerava, Finland
* VTT, Tampere, Finland
Managing of personal particle cleanliness is important in the medical operating theatres. Cleanroom materials and garments are generally used in rooms in which concentration of airborne particles is controlled. In operating theatres, however, particle control is not common practice at the moment. In this study we documented four open-heart operations in Helsinki University Childrens Hospital. We wanted to observe the relationship between critical incidents, materials, actions and equipment.
Critical incidents in operations are, for example, using electric coagulation with bleeding veins, swapping with cotton fabrics during the operation and different sterile drape materials put on patients. How the nurse and the surgeon behave in the instrumentation situation has a great influence the amount of particles released. We asked a few operating theatres to participate in our study. The Helsinki University Childrens Hospital accepted the suggestion on the condition that we hire an assistant nurse from their operating theatre to participate in the study and take care of the research workers.
In Helsinki University Childrens Hospital there are laminar flow ceilings in two operating rooms. Ceilings are equipped with HEPA filters. They are big enough to cover the operating table and all the instrument tables needed in the cardiac surgery operation. We made a hypothesis that the air condition and laminar flow keeps the amount of particles very low during the surgical operation.
Discharge ability of different materials is becoming increasingly important as more companies build hardware for operating theatres. Equipment can be sensitive to damage or degradation from contamination and electrostatic

266
discharge. Therefore, it is critical to control the materials that come in contact with patients in operating theatres. You also need to wear semi-conductive shoes to achieve electrical discharge. In Finland the National Building Law requires the use of conductive floor materials in the operating theatre. The law originates from the time Ether was used in anaesthesia.
Only limited public data is available on particle cleanliness of the different materials. More data and research are needed to identify the best materials for operating theatres. The best material used in the operating theatres is the one that releases the least amount of lint and other particles during handling. All particles are foreign matters inside the human body and they cause reactions in tissues.
Most materials lose compounds by friction. In our research we have studied the linting properties of several types of disposable and reusable textile materials used in products in operating theatres. These materials were chosen in order to have a representative selection of textile materials used in operating theatres for personnel and patient protection.
We tried to figure out how much particles exist in the air during the operation. We used the FinnPimex system to collect the data in four open-heart-operations, resulting in altogether 16 h of film. In the experiment a sterile measuring tube was placed 2 cm from the wound. Particle counting was carried out with a laser particle counter with eight measurement channels. According to the results there are big differences in amounts and size ranges of releasing particles concerning cleanroom textile materials, medical textile materials and different material faces.
The purpose of this paper is to objectively report the results and trends of the study. This data should not be construed as recommendations for or against individual products. Rather, the results can be used as a guide for matching categories of materials with suitable applications. This work was part of the Finnish STAHA technology programme supported by the National Technology Agency, Tekes.

267
CHAPTER 44: OVERVIEW OF STANDARDISATION PROJECTS OF HOSPITAL TEXTILES IN CEN
Auli Pylsy TEVASTA ry., Tampere, Finland
The textiles and clothing products needed in hospitals have requirements which depend on the use. In EU the products used in surgery belong to the legislation under the Medical Directive. Standards are the technical means of implementing the legislation into practice. Also for other textile products in hospitals trading is almost impossible without recognising and fulfilling the requirements given in various standards, European EN, international ISO, or in addition to them, also specific national standards. The challenges met by the standardisation work for hospital textiles in CEN have been large. Firstly it was necessary to determine which properties are essential to be addressed in the requirements. Secondly, before the requirement levels could be determined, the test methods had to be agreed upon. There is a variety of possible textile materials and each have different behaviour, but test methods do not in all cases correlate the behaviour in the same way for each structure or fibre type. The standards determine which methods are to be used for evaluating the conformance to requirements. Thirdly for each property the minimum performance level needed in practical use was to be defined. In practise the values required are not always the state of the art of the potential materials as a whole, one material outperforms in certain property and another in other properties. The European EN-standards address only the performance properties and the suitable materials fulfilling them for a product is the decision of manufacturers and buyers. Voluntary national standards exist for example in Finland covering also design requirements, but in European level design of products is not standardised.
44.1 INTRODUCTION
CEN is the official organisation for standardisation in Europe. All EN-standards must be impelemented nationally in CEN-member countries of which there are now 29. In the final acceptance procedure of draft standards the votes are weighted. The standards are prepared in working groups under specific technical

268
committees, roughly 350 in CEN. In priciple standards are voluntary. But the ones which interpret legislation into practise can be considered largely binding. Textiles used in operations in hospitals in Europe are regulated by the Medical Device Directive 93/42/EU. This Directive is in place to ensure that medical devices sold in Europe will not be harmful or pose any health risk. Protective clothing against risks at work, in hospitals for example against medical x-radiation, fall under the Personal Protective Directive 89/686/EU, but are outside this presentation.
Both are new approach directives requiring the products to meet essential safety requirements and as conformity to this be CE-marked. The essential safety requirements and their test methods are specified in standards. Member States shall presume compliance with the essential requirements in respect of devices which are in conformity with the harmonized standards the references of which have been published in the Official Journal of EU.
44.2 STANDARDS FOR OPERATION ROOM TEXTILES
For surgical clothing and drapes the essential requirements means to prevent the transmission of infective agents between patients and clinical staff during invasive procedures Standard EN 13795 parts 1 to 3 have the general title: Surgical drapes, gowns and clean air suits, used as medical devices, for patients, clinical staff and equipment. It is intended to assist the communication between users, manufacturers and other parties with regard to material or product characteristics and ensure the same level of safety for both single use and reusable surgical textiles throughout their useful life. Part 1 covers General requirements for manufacturers, processors and products, published 2002. Part 2 specifies Test methods, published 2004, and part 3 specifies Performance requirements. Part 3 was accepted in the formal vote in March 2006 and is expected to be published in early 2007.
The experts from different countries and organisations in the working group were to define the essential characteristics of surgical textiles to be taken in the standards. Test methods to test the characteristics were to be chosen from existing international or European standards, or new ones to be developed to reflect the practical use as far as possible for all textiles within the scope. Characteristics of test methods according to EN 13795-1:2002 and EN 13795-2:2004, units according to prEN 13795-3:2005 are shown in Table 44.1.

269
Table 44.1. A summary of test method charasteristics.
Characteristic Test method Unit
Resistance to microbial penetration Dry EN ISO 22612 Log10 (CFU)1)
Resistance to microbial penetration Wet prEN ISO 22610 Bi2) (barrier index)
Cleanliness Microbial EN 1174-1, -2 and -3 Log10 (CFU/dm²)
Cleanliness Particulate matter ISO 9073-10 IPM3)
Linting ISO 9073-10 Log10 (lint count)
Resistance to liquid penetration EN 20811 amended cm H2O
Bursting strength Dry and wet EN ISO 13938-1 kPa
Tensile strength Dry and wet EN 29073-3 N 1) CFU = colony forming unit 2) Bi = barrier index 3) IPM = index for particulate matter
Test methods for microbial penetration were specially developed. Standard EN ISO 22612:2004 is for resistance to dry microbial penetration and prEN ISO 22610 for resistance to wet bacterial penetration, the latter under final acceptace in April 2006. Requirements are divided into standard and high performance levels and critical and less critical product areas according to prEN 13795-3:2005. Some examples are shown in Table 44.2.
Table 44.2. Requirements for microbial performance level in production areas.
Product performance level 1) Standard performance High performance
Product area 2) Critical area
Less critical area
Critical area
Less critical area
Resistance to microbial penetration Wet ≥2.8 Not required 6.0 3) Not
required
Resistance to liquid penetration ≥20 ≥10 ≥100 ≥10
Bursting strength Dry ≥40 ≥40 ≥40 ≥40
Tensile strength Dry ≥20 ≥20 ≥20 ≥20
1) Elevated level to be considered when extensive exposure to liquid, mechanical stress or a long operation is to be expected 2) Probability of to be involved in the transfer of infective agents to or from the wound 3) 6,0 is maximum achievable and means no penetration

270
The performance requirements give minimum values for each required characteristic for a particular use situation. Because the standard includes both single-use and reusable products of various potential materials, their individual behaviour and state of art can be in some cases far above some of the minimum requirements. One material outperforms in one characteristic and another in a different characteristic. In practise any one of the requirements can be agreed higher between the supplier and buyer. The minimum values ensure conformance with the essential requirements of the directive.
The European standards leave the choosing of the appropriate materials which fulfil the requirements of the standards, to the buyers and suppliers. When EN-standards are implemented the national standards of same subject must be withdrawn. This means that who now uses national standards, which specify the actual fabric, the colour and design of the products, face now a new way of approach which can be at the same time an opportunity and a challenge. If needed nationally, new standards for only design aspects may need to be done.
44.3 OTHER STANDARDS
Surgical masks of 4 types according to the standard EN 14683:2005 are given in Table 44.3. A standard for surgical head coverings is under development. Medical gloves are covered in standard series EN 455. Requirements for textiles suitable for laser surgery are covered in a standard for optics EN ISO 11810.
Table 44.3. A summary of characteristics for surgical masks according to EN 114683:2005.
Characteristics surgical mask Type I Type IR Type II Type IIR
Bacterial filtration efficiency % ≥ 95 ≥ 95 ≥ 98 ≥ 98
Breathability (Differential pressure) Pa < 29.4 < 49.0 < 29.4 < 49.0
Splash resistance mm Hg not required ≥ 120 not
required ≥ 120

271
44.4 OTHER TEXTILES IN HOSPITALS
Textiles used in hospital environment, but not related to legislation, are covered in the European prestandard ENV 14237:2002. The document is next year under review to be changed to a standard. It gives the basis for agreements between supplier and customer and as for operation textiles it also deals only with performance requirements without design aspects. Minimum requirements and additional requirements for reusable, new textiles in health care, are given for the following product groups:
− Bed textiles − Pillows and quilts − Mattress protectors against liquids − Blankets − Towels − Curtains − Patients and baby clothing − Staff clothing.
Examples for bed textiles (sheets, pillow covers, draw sheets, bed spreads), test methods not included in the example (Tables 44.4 and 44.5). Examples about additional properties are taken from staff clothing, air permeability and water vapour resistance, values to be indicated by the manufacturer.
Table 44.4. Characteristics for bed textiles.
Colour fastness
Light (grade 18) ≥ 4
Washing (grade 15) change ≥ 4 stain ≥ 34
Bleach ≥4
Rubbing dry ≥ 34 wet ≥ 3
Perspiration change ≥ 4 stain ≥ 34
Dry heat (printed PES) ≥ 4

272
Table 44.5. Characteristics for bed textiles.
Dimensional change Warp/ Length Weft/ Width
Woven untreated ± 10% ± 6% Woven pre shrunk ± 5% ± 5%
After washing + processing
Knitted fabrics + 2 to – 5% + 5 to – 8%
Basic requirements ≥ 400 N ≥ 400 N Tensile strength (woven fabrics) Advanced requier. ≥ 800 N ≥ 600 N
Bursting strength (knitted fabrics) ≥ 600 kPa
Pilling ≥ 4 woven fabrics ≥ 3 knitted fabrics
44.5 CONCLUSION
The standardisation projects of hospital textiles in CEN have progressed to cover the most important tasks given, but they continue. Every 5 years each standard is evaluated for it’s possible need of revision and new needs may arise.
Influencing at as early stages as possible is best especially for small countries. Partcipation in the work of drafting of standards and co-operation within the Nordic countries are opportunities to ensure that our knowhow, good practices and needs of textiles in hospital environment are brought into European, and increasingly also to International standards. Ladies and gentlemen, experts in hospital area, your feedback when using the standards is most welcome. As responsible of textiles and clothing area standardisation in Finland, I would like to thank the experts of our hospital and operation textiles mirror group for their active contribution to the standards referred to.

273
CHAPTER 45: BACTERIAL ADHERENCE, PENETRATION AND SURVIVAL ON DIFFERENT
SURFACES AND MATERIALS
Kirsi Laitinen Department of Public Health, University of Helsinki, Helsinki, Finland
For most of the history of microbiology, microorganisms have primarily been characterized as planktonic, freely suspended cells and described on the basis of their growth characteristics in nutritionally rich culture agar. Later on it was discovered that bacteria will stick to almost any surface available and almost always produce a slimy polysaccharide matrix i.e. biofilm. Bacterial adherence depends on many features, environmental and properties of the bacterial cell. Adherence allows bacteria to colonize and survive surfaces in question. Cell surface hydrophobicity is one of the most important features in adherence process. Bacterial nonflagellar appendages, fimbriae or pili, play an important role in cell surface hydrophobicity and attachment, probably by overcoming the initial electrostatic repulsion barrier that exists between cells and substratum. Biofilm formation is ubiquitous and costly for industry and medicine. The practical difficulty posed by biofilm resistance to chemical challenge. When microorganisms attach to surface and grow as biofilm, they become less susceptible to biocides and disinfectants than are same microbes on conventional culture. Therefore, strategies for manufacturing surfaces that would resist bacterial adhesion are very important. A smooth and uniform surface alone is not the answer, since bacteria are able to find microscopical roughness and survive on the surface. Surface-treatment technologies might provide an answer by creating anti-infectious surfaces that would decrease bacterial adhesion. Such treatments are for example modifying surfaces to become more hydrophilic or incorporation of non-toxic anti-bacterial agents in surface material i.e. pharmaceutical agents, silver, surfactants.

274

275
CHAPTER 46: DISINFECTION IN HOSPITALS IN THE NEW MILLENNIUM
Reijo Saunamäki Soft Protector Ltd, Espoo, Finland
46.1 INTRODUCTION
Hospital acquired infections are a major concern in healthcare settings. Even when the most common source of infection is the patient him- or herself there are still different kinds of transmission routes that could be eliminated by using disinfectants in the right places. IDS whose affecting agent is PHMG, polyhexamethylene guanidine, is a new disinfectant for hospital use. It is a cationic water-based antiseptic and its efficacy is based on its positive electric charge. When getting in contact with the cell membrane PHMG reacts with its positive electric charge against the cells negative electric charge and destroys the cell membrane. It does not invade the cell and that is why it is very difficult for microbes to develop a resistance to PHMG (1).
IDS is a broad-spectrum biocide (Table 46.1) permitted by EU regulations which is on one hand highly effective against micro-organisms and on the other hand completely harmless for humans and animals. The tests made by the State Institution R.R. Vreden Russian Research Institute of Traumatology and Orthopedics Accredited Testing Laboratory Centre demonstrates the wide spectrum of IDS efficiency against bacteria, spores, viruses, yeasts and moulds. Working solution already up from 0.05% is working well and the time needed for 100% disinfection varies from seconds to 30 min depending on circumstances. Also the various tests done by Helsinki University, Department of Public Health are showing the good performance and usability of IDS in healthcare circumstances, such as high level hand disinfection and disinfection for equipments, surfaces and human spills.
Its biguanide-mode (PHMB) has been used as contact lens solution, swimming pool disinfectant, skin preparation before cataract surgery, and treatment of

276
vaginosis, genital herpes and eye amebiasis and aspergillus infections (210). PHMG is minimally irritating and its dermal LD50 value is 20 000. It has undergone several tests on safety. The tests show clearly the high safety for the end users and patients:
− Acute toxicity: Not toxic if swallowed: LD50 (oral, rat) > 2000 mg/kg − (according to OECD 423, acute toxic class method) − Eye irritation: Not irritating to eyes (according to OECD 405) − Dermal irritation: Not irritating, not corrosive (According to OECD 404) − Skin sensitisation: Not skin sensitising (according to OECD406, GPMT) − Mutagenicity: Ames Test negative (according to OECD 471).
A further advantage is the ecological acceptability of IDS. As a cationic polymer the active substance becomes ineffective in anionic soil and sludge due to the overlapping of the cationic core and therefore can be decomposed by alga and bacteria. At the end of the decomposition, Urea-connections emerge, which, thanks to its fertilizing properties, can enrich the soil with nutrients.
It has a long-term efficacy due to its capability of forming a thin, long lasting layer. For example, when using it on textiles they become impermeable to microbes and that effect lasts for several washing circles. IDS is not corrosive and it can be used on all waterproof materials.
Contact transmission is the most common transmission route. It could occur when the healthcare worker transmits the pathogens via contaminated hands from one patient to the other either directly or indirectly. Using hand disinfection reduces the opportunity of transmission.
Alcohol-based hand disinfectants are now widely used in Europe. In year 2002 the Guideline for Hand Hygiene in Health-Care Settings was published by the Infection Control Practices Advisory Committee and the Hand Hygiene Task Force of HICPAC/SHEA/APIC/IDSA. The guideline is to use disinfectants always between each patient. Hands should be washed with water and soap only when visibly soiled. Using gloves does not obviate the need for hand disinfection.
The first concern when choosing the disinfectant is its efficacy. The efficacy is tested using different methodologies. IDS has been tested by using EN-standards by

277
Helsinki University. The activity of hand disinfectant must include at least bacteria, fungi (yeasts) and viruses (coated). Also uncoated viruses and bacterial spores could be important for example in case of epidemics caused by uncoated viruses like the noro-virus or spore forming bacteria like Clostridium difficile (Table 46.1).
Table 46.1. IDS express biocidic activity against among others the following microorganisms.
Bacteria Viruses Fungi Escherichia coli Peseudomonas aeruginosa Proteus mirabilis Proteus vulgaris Klebsiella pneumoniae Serratia marcescens Staphylococcus aureus Streptococcus faecalis Salmonella typhimurium Salmonella infantis Yersinia entrocolitica Campylobacter jejuni Clavibacter michiganensis Mycobacterium tuberculosis
Polioviruses Adenoviruses Rotaviruses Hepatitis viruses Influenza viruses HIV
Aspergillus niger Candida albicans Penicillium glaucum Mycrosporum ferrugineum Achorion shenleinae Mycrosporum lanosum Trichophyton crateriform Trichoderma virige Epidermaphiton rubrum Mould, yeast
In hand hygiene the opinions of the users are essential. The irritating or drying effects of the hand disinfectant should be minimized. Also the availability of the solutions, placing the disinfectants near the patients is important to compliance. IDS is not irritating due to having a dermal LD50-value of 20 000. It can be used by touch-less sensor dispenser which is a quick and hygienic alternative for traditionally used dispensers. The aim of our study was to test IDS efficacy in real patient care situations and compare it to traditionally used alcohol-based disinfectants. We also wanted to study the opinions of the healthcare workers when using the new type of disinfectant.
46.2 METHODS
We made an in vivo study in hand disinfection in the central hospital of Kanta-Häme in 2006. For the study a surgical ward was chosen, where patients were mainly recuperating after gastro- or urology surgery. Total patient amount was

278
40 (30 gastro surgery patients and 10 urology surgery patients). Personal was approx. 30 nurses of which 14 in gastro surgery and 14 in gastro and urology and 3 in maintenance. The study was begun by demonstrating the use of IDS to the participating nurses and by taking finger samples before and after alcoholic (n = 5) or non-alcoholic disinfection (n = 19). It was agreed that half of the department responsible for gastro patients uses IDS and the other half with urology patients continues to use the alcohol disinfectant as usual.
Experiment started 12.12.2005, and the IDS disinfectants were introduced to the patients rooms and bedside holders. After two weeks of using either IDS or alcohol, two nurses specialized in hospital hygiene took finger samples from the participating nurses at different time-points during the day and at different patient care situations. Samples were taken from 5 IDS users (22 samples) and five alcohol users (21 samples). Samples were taken from both hands. A second set of samples was taken 29.12.2005. Skin condition was also monitored. Five nurses gave IDS samples (24) and seven nurses alcohol samples (28). Samples were analyzed at the microbiology laboratory. In year 2005 the use of hand disinfectants in the study ward was 22.75 l / 1000 patient day. That makes approximately 12 l of IDS/study period and 50 ml / healthcare worker / day.
46.3 RESULTS
The results (Tables 46.246.5) clearly demonstrate that the IDS disinfection solution also works outside laboratory conditions just as alcohol-based disinfectants. In the 0-samples taken at the initial demonstration session all the samples had > 100 colony/dish before disinfection. Of the participants using an alcohol-based solution 7 out of 12 (58%) were completely clean after disinfection, and of the participants using IDS solution 19 out of 36 (53%) were completely clean. The participants whose samples stayed positive for infection, the colony amount was reduced except for participants with long fingernails (Table 46.2).
In the actual test situation where the participants were screened at the beginning of the working day, the results for the group using alcohol-based solutions was the following: clean after disinfection 1 out of 3 and for the IDS group clean after disinfection 2 out of 2 (Table 46.3).

279
Table 46.2. 0-samples from study-group in 14.11.2005 and 17.11.2005(N = 24, of which 16 IDS-group, 6 alcohol-group).
No wash, no disinfection
Disinfection with alcohol
Disinfection with IDS
Number of CFU (RH = right hand, LH = left hand) Study
member Skin condition
RH LH RH LH RH LH 1 No problems > 100 > 100 0 0 2 Dry skin > 100 > 100 0 0
62 Long fingernails > 100 > 100 > 100 > 100 55 Dry skin > 100 > 100 2 2 56 Excema, dry skin, wounds > 100 > 100 3 3 57 Dry skin > 100 > 100 0 0 54 Dry skin > 100 > 100 1 0 63 Dry skin, wounds > 100 > 100 0 0 53 Long fingernails, dry skin > 100 > 100 0 0 61 Long fingernails > 100 > 100 > 100 > 100 59 Excema, dry skin, wounds > 100 > 100 0 0 60 Dry skin > 100 > 100 0 0 58 Dry skin > 100 > 100 0 0 9 Long fingernails, wounds > 100 > 100 0 0
10 Long fingernails, dry skin > 100 > 100 > 50 > 50 6 Long fingernails, dry skin > 100 > 100 > 100 > 100 7 Long fingernails > 100 > 100 31 24 5 Long fingernails, dry skin > 100 > 100 0 0 8 No problems > 100 > 100 10 10 4 No problems > 100 > 100 0 0
34 No problems > 100 > 100 1 1 35 Long fingernails, dry skin > 100 > 100 0 0 37 Dry skin > 100 > 100 > 50 > 50 36 Long fingernails, dry skin > 100 > 100 1 0
In situations where samples were taken from participants after having treated patients with gloves on, after disinfection the results for both groups were negative. In this instance the difference between using alcohol-based solution and IDS solution was that after the removal of gloves but before disinfection all participants using the alcohol-based solution showed some increase in infection (4-> 100 colonies, median 13) while the participants using the IDS solution 2 participants showed an increase in infection and with 4 persons the samples were negative also before disinfection massage (Table 46.4).

280
Table 46.3. Samples taken before patient contact.
No wash, no disinfection Wash
Disinfec- tion with alcohol
Disinfec-tion with
IDS Number of CFU (RH = right hand, LH = left hand)
Study member
Weeks after study start
Skin condition
RH LH RH LH RH LH RH LH
64 2 Dry skin, wounds > 50 > 50
66 2 Dry skin > 100 > 100
69 4 No problems 12 33 0 0
71 4 Dry skin 3 0 1 0
72 4 Dry skin, wounds 18 11 1 0
89 2 Long fingernails > 100 > 100 > 100 > 100 0 0
93 4 Dry skin, wounds 0 0 0 0
All the samples were also negative after disinfection massage in situations where participants had been involved in patient care without gloves. When samples were taken before disinfection massage, 6 out of 14 (42%) of the participants using the alcohol-based solution had completely clean samples and of the participants using the IDS solution 11 out of 14 (78%) had completely clean samples (Table 46,5).
The result was that IDS was at least as effective as alcohol-based disinfectant (Tables 46.2–46.5). It also showed long-term efficacy but the study group was too small to make it possible to calculate any statistical significance.
46.4 DISCUSSION
IDS is a totally new disinfectant for hospital use. It is as efficient as traditionally used disinfectants in hand hygiene. It also has long term efficacy which makes it a very good disinfectant in long surgical operations both in hand disinfection and in preoperative skin preparation. IDS has also some significant advantages over traditionally used disinfectants. It has for example the efficiency against viruses like adenovirus and spore forming bacteria. This makes IDS a possible better choice when a hospital is experiencing for example noro-virus or

281
Clostridium-difficile epidemics. It is also safe in places where patients are likely to misuse alcohol-based disinfectants. IDS is safe for healthcare workers. It can be used in instrument disinfection instead of toxic disinfectants like glutaraldehydes or phenols because it is also effective against mycobacteria. IDS is not corrosive and it is safe for surfaces that could be sensitive to chlorine-based disinfectants.
Table 46.4. After patient care (after removing gloves).
No wash, no disinfection Wash
Disinfec-tion with alcohol
Disinfec- tion with
IDS Number of CFU (RH = right hand, LH = left hand)
Study member
Weeks after study start
Skin condition
RH LH RH LH RH LH RH LH 66 2 Dry skin 10 11 0 0
68 2
Long fingernails,
dry skin, wounds
15 54 0 0 0 0
67 2 Dry skin 11 10 1 0 0 0
65 4 No problems 48 75 14 11 0 0
69 4 No problems 24 20 0 0 0 0
70 4 Dry skin, wounds 10 10 0 0 0 0
72 4 Dry skin, wounds > 100 > 100 > 100 > 100 0 0
73 4 Long
fingernails, wounds
> 100 > 100 > 100 > 100 0 0
85 2 Dry skin, wounds 4 5 0 0
86 2
Long fingernails,
dry skin, wounds
12 22 10 21 0 0
88 2 Dry skin 0 0 13 18 0 0 90 4 Dry skin 0 0 0 0 0 0
93 4 Dry skin, wounds 0 0 0 0 0 0
94 4 Dry skin, wounds 0 0 0 0 0 0

282
Table 46.5. After patient care (no gloves used).
No wash, no disinfection Wash
Disinfec- tion with alcohol
Disinfec- tion with
IDS Number of CFU (RH = right hand, LH = left hand)
Study member
Weeks after study start
Skin condition
RH LH RH LH RH LH RH LH 64 2 Dry skin,
wounds > 100 > 100 45 31 0 0
66 2 Dry skin > 100 > 100 61 67 0 0 68 2 Dry skin,
wounds, long
fingernails
32 47 0 0
67 2 Dry skin, wounds 0 0 0 0 0 0
70 4 Dry skin, wounds 0 0 0 0
71 4 Dry skin 0 0 0 0 0 0 73 4 wounds ,
long fingernails
> 100 > 100 0 0
84 2 No problems 12 0 0 0 0 0
85 2 Dry skin, wounds 0 0 0 0
86 2 Long fingernails 0 0 0 0
87 2 Dry skin, wounds,
long fingernails
> 100 > 100 0 0
90 4 Dry skin 0 0 0 0 91 4 Dry skin,
long fingernails
0 0 0 0
92 4 Wounds 0 0 0 0 0 0 94 4 Dry skin,
wounds 0 0 0 0

283
46.5 REFERENCES
1. Gilbert, P., Moore, L.E. 2005. Cationic antiseptics: diversity of action under a common epithet. J Appl Microbiol., 99, pp. 703715.
2. Krebs, F.C., Miller, S.R., Ferguson, M.L., Labib M., Rando, R.F. & Wigdahl, B. 2005. Polybiguanides, particularly polyethylene hexamethylene biguanide, have activity against human immunodeficiency virus type 1. Biomed. Pharmacother. 59, pp. 438445.
3. Welk, A., Splieth, C.H., Schmidt-Martens, G., Schwahn, C., Kocher, T., Kramer A. et al. 2005. The effect of a polyhexamethylene biguanide mouthrinse compared with a triclosan rinse and a chlorhexidine rinse on bacterial counts and 4-day plaque re-growth. J. Clin. Periodontol., 32, pp. 499505.
4. Hansmann, F., Kramer, A., Ohgke, H., Strobel, H., Muller, M. & Geerling, G. 2004. [Polyhexamethylbiguanid (PHMB) as preoperative antiseptic for cataract surgery]. Ophthalmologe. 101, pp. 377383.
5. Rosenthal, R.A., Henry, C.L., Stone, R.P. & Schlech, B.A. 2003. Anatomy of a regimen: consideration of multipurpose solutions during non-compliant use. Cont Lens Anterior Eye., 26, pp. 1726.
6. Panda, A., Ahuja, R., Biswas, N.R., Satpathy, G. & Khokhar, S. 2003. Role of 0.02% polyhexamethylene biguanide and 1% povidone iodine in experimental Aspergillus keratitis. Cornea. 22, pp. 138141.
7. Gerli, S., Rossetti, D. & Di Renzo, G.C. 2003. A new approach for the treatment of bacterial vaginosis: use of polyhexamethylene biguanide. A prospective, randomized study. Eur Rev Med Pharmacol Sci., 7, pp. 127130.
8. Codling, C.E., Maillard, J.Y. & Russell, A.D. 2003. Performance of contact lens disinfecting solutions against Pseudomonas aeruginosa in the presence of organic load. Eye Contact Lens., 29, pp. 100102.
9. Rosin, M., Welk, A., Kocher, T., Majic-Todt, A., Kramer, A. & Pitten, F.A. 2002. The effect of a polyhexamethylene biguanide mouthrinse compared to an essential oil rinse and a chlorhexidine rinse on bacterial counts and 4-day plaque regrowth. J Clin Periodontol., 29, pp. 392399.

284
10. Rosenthal, R.A., McDonald, M.M., Schlitzer, R.L., Abshire, R. & Stone, R. 1997. Loss of bactericidal activity from contact lens storage solutions. CLAO J. 23, pp. 5762.
285
CHAPTER 47: VENTILATION SYSTEMS IN THE FUTURE OPERATING THEATRES
Kjell Rösjö AET ARBEIDSMILJÖ OG ENERGITEKNIKK A/S, Strömmen, Norway
Ultra clean air ceilings were developed in the 1960's with the objective of reducing wound infections from airborne colony forming units, especially for orthopaedic surgery. Current designs confine themselves to this single objective, which has been achieved to a certain degree. Infections have been reduced to low levels compared with the risks at start of orthopaedic replacement surgery. However for many procedures the risk still are not at acceptable levels. One of the important reasons for this is the fact that the Ultra clean air ceilings until now to a certain degree helps, but not without serious compromises made by the manufacturers. The author has of this reason invented and patented a further and significant development of the ultra clean air ceiling. As with earlier designs, the airflow system creates a clean zone over the patient to prevent contamination. Where this theatre differs is that it comprises a number of zones where the air temperature, humidity, velocity, volume, direction and cleanliness including Bioclimatization can be individually delivered and regulated manually or even automatically. Most important is also that adjustments and presetting are made possible and easy in a totally new way. The reason why the new patented technique is beneficial is that the configuration of technical installations and staff are different from one room to another and will change during surgery and that the patient, the surgeon and the anaesthetist all have conflicting requirements. The surgeon likes cool dry air for comfort. He is the one who generally dictates the theatre conditions. The anaesthetist, who is sedentary during operations finds these conditions too cold and might complain. The patient, who is the most important party present, requires to be warm in order for his body to function most effectively. Finally the patient's wound site will have temperature and humidity requirements of its own to minimise the chance of infection and to avoid evaporative cooling. The invention provides for all of these conflicting requirements. Nine ceilings of this type are now in operation in Scandinavia, and some early experiences will be reported.

286
47.1 INTRODUCTION
Ultra Clean Ventilation-ceilings (UCVs) for surgical operating rooms were developed in the 1960s with the objective of reducing wound infections from airborne colony forming units, especially for orthopaedic surgery. The orthopaedic surgeon, John Charnley and the engineer Hugh Howorth OBE carried out the pioneering research and development work. In 1966, at Wrightington Hospital, they installed the prototype, or first generation of permanent Clean Air Enclosure. In this unit, Charnley performed more than 5000 operations and proved that the airborne route of cfus was the dominating reason for infections after orthopaedic surgery. Howorth continued the development and units were installed in about 30 countries. These units (originally called green houses after the shape of the prototype) had a dramatically influence on the wound sepsis reduction particularly in the orthopaedic field, from the start of the early seventies. It quickly became apparent that the high levels of airborne contamination of between 200600 cfu/m3 in a typical operating theatre reduced down to < 10 cfu/m3 at the instrument and operating table. This again resulted in a dramatic reduction in infections from above 10% down to very low levels. All this is very well documented in studies from a number of countries around the world. Many of the reports concerning the value of ultra clean ventilation are based on the third generation of Howorths invention, the almost legendary Exflow. Current designs confine themselves to this single objective, which has been achieved, namely the reduction of infections. The Howorth Exflow has been the " Rolls Royce " in the market since 1977, but in1992 Howorth made the last of his inventions, the Omniflow UCV, which did away with partial walls completely. In 1992 the very first of these fourth generation UCVs was installed in theatre 3 at Hässleholm Hospital in Sweden for orthopaedic surgeon Dr. E. Ornstein. This was the start of the co-operation with Hugh Howorth that was of the greatest importance for the development of the new ideas. Howorth had made the break through of understanding the basic and fundamental agrological principles for the efficiency of airflows in the peripheral areas. This helped me to understand the importance and nature of these problems too.
It was at Hässleholm Hospital we first understood the need to continue the development of UCVs a further step forward. Discussions with Hugh Howorth and Dr. Ornstein helped me to understand the real nature of the complex
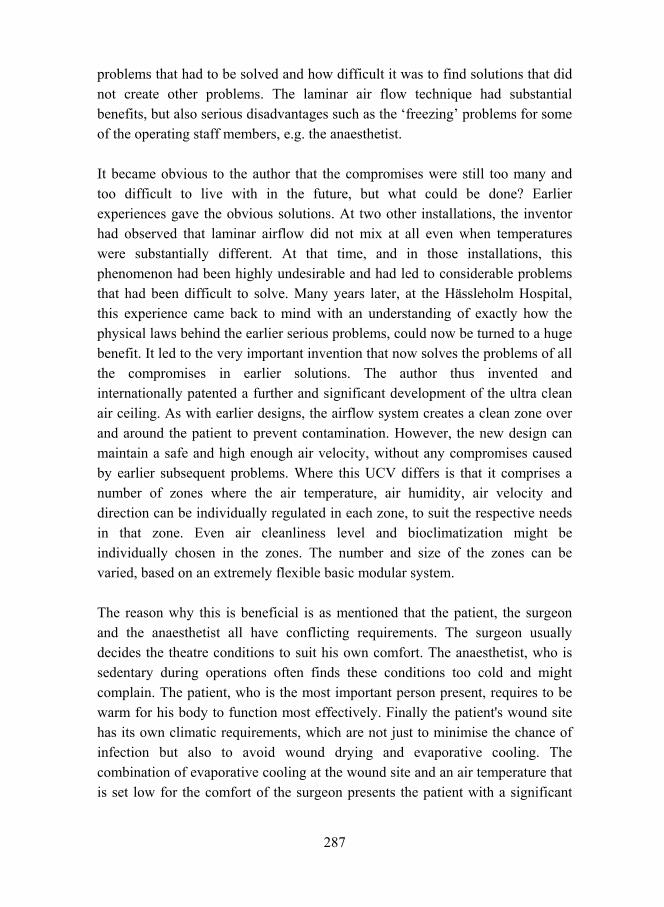
287
problems that had to be solved and how difficult it was to find solutions that did not create other problems. The laminar air flow technique had substantial benefits, but also serious disadvantages such as the freezing problems for some of the operating staff members, e.g. the anaesthetist.
It became obvious to the author that the compromises were still too many and too difficult to live with in the future, but what could be done? Earlier experiences gave the obvious solutions. At two other installations, the inventor had observed that laminar airflow did not mix at all even when temperatures were substantially different. At that time, and in those installations, this phenomenon had been highly undesirable and had led to considerable problems that had been difficult to solve. Many years later, at the Hässleholm Hospital, this experience came back to mind with an understanding of exactly how the physical laws behind the earlier serious problems, could now be turned to a huge benefit. It led to the very important invention that now solves the problems of all the compromises in earlier solutions. The author thus invented and internationally patented a further and significant development of the ultra clean air ceiling. As with earlier designs, the airflow system creates a clean zone over and around the patient to prevent contamination. However, the new design can maintain a safe and high enough air velocity, without any compromises caused by earlier subsequent problems. Where this UCV differs is that it comprises a number of zones where the air temperature, air humidity, air velocity and direction can be individually regulated in each zone, to suit the respective needs in that zone. Even air cleanliness level and bioclimatization might be individually chosen in the zones. The number and size of the zones can be varied, based on an extremely flexible basic modular system.
The reason why this is beneficial is as mentioned that the patient, the surgeon and the anaesthetist all have conflicting requirements. The surgeon usually decides the theatre conditions to suit his own comfort. The anaesthetist, who is sedentary during operations often finds these conditions too cold and might complain. The patient, who is the most important person present, requires to be warm for his body to function most effectively. Finally the patient's wound site has its own climatic requirements, which are not just to minimise the chance of infection but also to avoid wound drying and evaporative cooling. The combination of evaporative cooling at the wound site and an air temperature that is set low for the comfort of the surgeon presents the patient with a significant

288
risk of hypothermia. At best hypothermia results in difficulty in waking from the anaesthetised state, which means protracted (and expensive) nursing in the recovery room. In the most serious cases it can result in death. The invention provides for all of these conflicting requirements. The invention does not go in the dangerous direction that some systems do to reduce problems for staff and to save money by using low or reduced velocities. The invention allows optimum conditions for all involved and overcomes earlier conflicting requirements. The invention of the internationally patented fifth generation of UCV utilises the long-established knowledge of the necessary levels of air velocity, and thus volumes for safe LAF systems and patient protection. The velocity is no longer limited by the earlier unsolved problems and cross contamination problems can now be minimized. The wish that the minimum safety level acceptable must be the maximum obtainable safety can now be given by optimum of cross contamination barrier settings.
It is projected that, more surgery will be done in the future because the median age of the world population will increase dramatically in the coming 1050 years. Even as less invasive procedures such as vascular surgery, cardiac catheterisation or endoscopies become more popular, the need to change quickly to the standard more invasive procedures will still be there. Operating theatres must be prepared for that. It may be a question of life or death if less invasive procedures go wrong. And anyway at the time of writing in 2006 approx. 80% of surgery is still the estimated future range of the invasive type. Thus operating theatres must be built to meet the demanding need for more equipment and thus more space and capacity to meet the needs for hygiene. For some procedures, especially in the Orthopaedic field, the demand for space is essentially. The new invention will also give a substantially increased clean area for the laying out of sterile instruments on the instrument tables. There is a further point, which is that aseptic surgery will in future become more and more necessary to prevent the very threatening situation concerning the development of resistant pathogens.
47.2 EVOLVEMENT
All this makes the flexibility of the UCV system an important part of the construction of operating theatres. This flexibility must include all the hygienic, safety, comfort and economical parameters of the UCV. The flexibility to meet

289
future needs cannot be overstated. Design of UCVs has evolved through 4 generations, with each generation striving for the most flexible solution for dealing with the high demands for hygienic control during surgery. When the first of Howarths patents expired after 20 years, a few manufacturers copied his ideas with relative success. Others, who copied his ideas less successfully, lacked an understanding of the necessity for the highest possible cross contamination protection factor, P, which should exceed 105 as for other types of microbiological containment protection. Instead many new systems were built much smaller than the minimum standard size and with lower velocities than required in international standards. These often gave good test results where the operating lamps, surgeons and other staff members were placed to allow the under cooled air to fall down without disturbance. (Figure 47.1a) Test results with these in more realistic positions are not mentioned. The dramatic situation when the air inlet temperature increases during surgery is also not mentioned. (Figure 47.1b).
a)
Velocity and temperature measurements
20,4520,5
20,5520,6
20,65
1 3 5 7 9 1113 15 17 1921 23 2527 29 31
Measurement number
Deg
rees
C
elci
us
0,4050,4100,4150,4200,425
Vel
ocity
[m
/s]
°C
m/s
b)
Velocity and temperature measurements
05
1015202530
1 7 13 1925 31 3743 49 5561 6773 7985
Measurement number
Deg
rees
C
elci
us
00,20,40,60,811,2
Vel
ocity
[m/s
]
°C
m/s
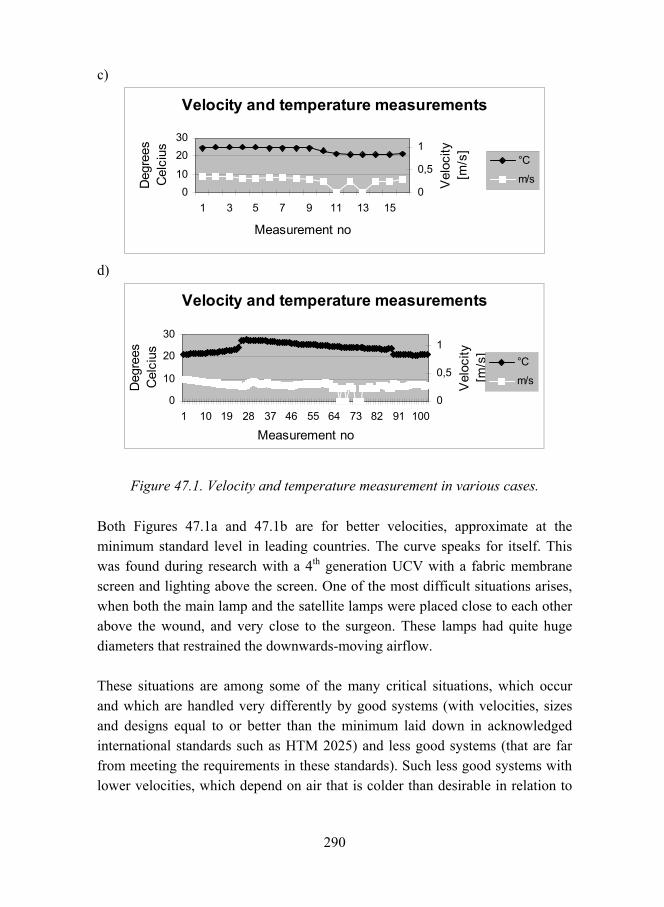
290
c)
Velocity and temperature measurements
010
2030
1 3 5 7 9 11 13 15
Measurement no
Deg
rees
C
elci
us
0
0,5
1
Vel
ocity
[m
/s]
°C
m/s
d)
Velocity and temperature measurements
0
10
20
30
1 10 19 28 37 46 55 64 73 82 91 100
Measurement no
Deg
rees
C
elci
us
0
0,5
1
Vel
ocity
[m
/s]
°C
m/s
Figure 47.1. Velocity and temperature measurement in various cases.
Both Figures 47.1a and 47.1b are for better velocities, approximate at the minimum standard level in leading countries. The curve speaks for itself. This was found during research with a 4th generation UCV with a fabric membrane screen and lighting above the screen. One of the most difficult situations arises, when both the main lamp and the satellite lamps were placed close to each other above the wound, and very close to the surgeon. These lamps had quite huge diameters that restrained the downwards-moving airflow.
These situations are among some of the many critical situations, which occur and which are handled very differently by good systems (with velocities, sizes and designs equal to or better than the minimum laid down in acknowledged international standards such as HTM 2025) and less good systems (that are far from meeting the requirements in these standards). Such less good systems with lower velocities, which depend on air that is colder than desirable in relation to

291
room temperature, flushing down over the patients who already may be too cold and staff members who not are so active, will sooner or later fall short in practice or when tested according international standards as HTM 2025. The compromises can immediately be seen. The smaller, low airflow non-compliant systems might be capable of delivering clean air to the operating table if the air is made sufficiently cool in relation to the surrounding room air. However they may not meet the climatic requirements of the patient neither the wound site, nor will they necessarily achieve the necessary level of prevention of cross contamination, or cover the needed space for the instrument tables.
Another factor is that indoor climate, air distribution, occupational environment, sound level and many other parameters, influence concentration during surgery. The upgrading of the environment to allow the highest possible level of concentration is therefore a substantial contribution to both patient safety and staff health and comfort. Other factors are the recovery time if the level of cleanliness is broken and the general level of cleanliness of all the equipment that should be kept clean by the airflow.
47.3 RECONSIDERATIONS
Before looking further into the invention of the fifth generation of UCV, it can be useful to reconsider what clean air-systems for operating theatres are, and also to look at other related questions. Air distribution in operating theatres can be arranged, in many ways. The following factors are central for all of the first four-generation systems.
47.3.1 Air Conditioning
This must deal with climate (temperature and humidity), thermal loads, particulate loads, microorganisms (colony forming units or CFUs), cross contamination within the sterile area and between the secondary area and the primary area in the operating theatre and anaesthetic gases. There are different requirements for the different areas of the theatre: The primary operating zone and the sterile instruments on the instrument tables, the median zone and the outer zones of the theatre. There will also be many possible choices of air distribution.

292
47.3.2 Air Distribution
This must deal with disruption of airflow caused by: the surgeon, operating lamps, pendants, C-bows and other obstacles, unsymmetrical positioning of these restrictions to the downflow, thermal loads, unsterile air streams from cooling fans in nearby equipment, personnel (who may or may not be trained for work in ultra clean laminar airflow zones), opening of doors, failure in the pressurization of the operating room, failure in the temperature regulating system for the LAF (Figure 47.1b), failure in the humidification system, failures with the air-conditioning system. Those challenges have to be met by a system that gives the patient and the staff the increased safety and the comfort that they should have through all the years the system will be in use. So what are the options for air distribution in operating theatres? This has been provided in a variety of ways and the main systems have been.
47.3.3 Turbulent Systems also Called Dilution Systems
These systems result in a dilution of pollutants, but not necessarily in the way that might be expected. In many cases the turbulent systems can create local eddies where the concentration of particulates including micro organisms can rise to 3400 times and even more, compared with the lowest level in the room. And even more, those areas can fluctuate during surgery so that the location of high germ concentration areas is unpredictable. Thus they might present the worst imaginable situation anywhere in the operating room. They can easily penetrate into the core of low velocity displacement systems (described below) from the turbulent surroundings. Turbulent systems are difficult to do well and are often burdened with claims caused by drafts and even to high sound levels from the inlet devices.. These systems has hundreds of different air diffusers and grill in many shapes; round, rectangular, linear with different means as vanes and other items to try to mix the inlet air as even as possible into the zones of occupancy and without draft.
These are sometimes also called displacement flow systems and often also wrongly called LAF systems and also displacement flow systems. Such systems, which to some measure removes contaminated air from the incision zone and replaces it with filtered fresh air, is based on thermal air force principles. Thus they work, with the relatively small forces due to the limited temperature

293
differences that can be used. A temperature difference that normally applies is 0.520C and rarely more. This gives difficulties with the control of airflow, and unpredictable protection.
This is not easily shown in the simple CFU tests done in some tests during a short period compared with all the hours, with their very different activities and happenings, year after year while the rooms are in use. The tests are usually done under the centre area of the screen, often with no operating lamps above the tested area or other objects such as pendants disturbing the down flow of air. Other limitations are that the CFU tests usually are done in one single small spot with an area of approximate 1/1000 to 8/1000 m2 compared with the screen- and clean are size of many m2 Research done by us in this matter clearly shows that the cross- contamination resistance factor is proportional to the velocity of the protecting airstreams. No successful (lucky) test spot can change that fact.
This is caused by unequal distribution of particles and thus concentrations in and within all the turbulences in the room. The very bad thing with the turbulences is that they favour in their collection of particles the worst particle fractions, the bacteria carrying sizes. The low velocity systems are easily disrupted (contributes to turbulences) and are completely dependant on that real temperature being lower during all stage of surgery. This cooler air may build up under the diffuser and move sideways and there falling somewhere outside the designated area for surgery and instrument tables. The systems are often built much smaller than the smallest sizes allowed in international standards.
The reason for this is often of purely economic, considering only the installation costs. The huge real costs of infections in society are rarely calculated because of very often different budgets. The risk of invalidity and death is still unacceptably high for many surgical procedures, compared with risks in other areas society try to eliminate. The system may provide a lower germ concentration in a smaller area central to incision. However this does little to prevent previous mentioned problems with local whirls where concentrated particles including micro organisms can rise to 3400 times the average level in the secondary area of the room. This is particular the case where screens are smaller than standard.

294
The test should cover the larger area for the sterile laying of the instrument tables. The level outside the limited cleaner area under the smaller screens will thus be dangerous sources for contamination entraining the easily disrupted low velocity airstreams. These systems can be found marketed as an almost laminar airflow, with an extremely low germ concentration at the operating table however with little mentioned about the problems discussed so far.
The areas where sterile instruments are unpacked and laid out ready for use, are not protected by the airflow. The minimum provisions laid down in the international standards as HTM 2025 are not mentioned in the marketing of low velocity systems affecting to be LAF-ceilings. The need for under-temperated air shows that this is not a real LAF-system. LAF-systems shall be possible to run safely without relying on unpredictable thermal conditions and forces in the theatre. Even when the systems now and then are capable of a speed up to approx. 0.25 m/s, the system will not be able to supply the operating zone without under-tempered air. This is especially the case where the partial walls are removed as in the 4th generation systems.
The problems that follow the low velocity systems are many, also stated by other representatives for such systems: With warm supply air jets the flow becomes unstable and does not reach the operating zone in an unmixed condition. Although in the marginal zone of the supply air jet admixture with indoor air is unavoidable, this jet constricts this in the mixed zone. The greater the temperature differences between indoor air and supply air the greater this constriction. The minimum outlet width of 1.4 m however, ensures that operating zone of 0.5 m wide operating table is flushed with filtered and sterile supply air. However the result is, once installed, at best only a small or narrow clean area, which can be easily infringed by the main lamp, satellite and pendants positioned close to the wound and the surgeon. When the peripheral surroundings are infringed, the rest of the area is often contaminated.
Although these systems have some benefits, when they are compared correctly with real LAFs, they are inadequate for many reasons. Some even claim to be able to deliver safe systems using lover fresh air volume than the normally stated minimum volume of 2400 m3/h. However there is a risk of build up of, higher concentrations of particular and gaseous pollutions in locally spots in the room. That is shown in tests for maximum Nitrous oxide (N2O) levels in operating
295
theatres. Concerning about the low velocity- and low fresh air systems evidence must be provided to prove the systems effectiveness at removing pollutants. This is particularly important for gaseous and harmful vapours. Neither at the commissioning nor during the daily use would it be possible to reach acceptable nor controlled safety levels in all parts of the operating theatre. This is due to the fact that the previously mentioned whirls of air, can occur in unpredictable places, (Ref.: the multiple times increasing of pollutions and worsening of the recovery time factors in those zones mentioned above).
The extremely difficult task to plan, construct and build a low velocity system that works under all circumstances, has been fully stated in reports after testing the effect of thermal forces, obstacles and the position of those, airflow characteristics, amount and position of the members of the operating team, door openings etc. The change in position of obstacles at any given time, during surgery, has effect on the results of cleanliness under low velocity systems. Essentially the arrangements and layouts in the operating theatres influence on the air patterns, whirls, and turbulences in the rooms. The conditioning of the air (Figure 47.1c), velocities, exhaust layout has the same effect. Symmetric asymmetrical positioning has been proven to make or not make the low velocity systems to work. The positioning affects the risk of germ introduction into the clean zone, and thus the incision area.
It is known that temperature deviations from supply air to room conditions and surfaces can be disregarded, when the inlet velocities well exceeds that of the low velocity range of installations. However when this is not the case, temperature deviation cannot be neglected. The understandings of how sensitive the low velocity systems are vital when deciding which type of systems to choose and designing for. Tests have shown that there are different levels of air velocities in larger air streams that make considerable different results when moving obstacles and changing of surface temperatures occurs. The low velocity systems are in the narrow range between approximate 0.15 and 0.25 m/s. The main differences occur in a narrow range between turbulent and laminar air flow conditions, just where the low velocity systems are designed to work. The systems can as mentioned only be operated with a certain degree of acceptability when air stream temperatures are below the exhaust air (room) temperature. However this may result in unpredictable situations for systems not design for these situations, and when there is a failure with or improper constructed or

296
handled control system and settings. Cleanliness level increases with the sizes of the air diffusers dimensions, and with the velocities. This does make the above-mentioned temperature setting problem even more difficult when forgotten in the design period. (Figure 47.1d)
47.3.4 Laminar Air Flow Systems
The LAF-systems are known under many different names. They are some times more correctly called Parallel Stream Air Systems. The reason for this is that the air does not follow a 100% straight line; due to minor fluctuations along the line the air follows. In practice LAF-systems have an enormous advantage compared to turbulent systems, because of better contamination control. LAFs have become the preferred method of supplying air in operating theatres since Charnley/Howarth's days. They protect large areas against air pollutants from surrounding areas in the room. Moreover they quickly displace particulate and gaseous molecules that may have been generated in the clean zone. Thus the operating zone and the instrument table area may be kept at controlled level of cleanliness during the total period of surgery. However problems may still occur. Some of those are dealt with in various ways by different makes of LAFs within the four generations. Some designs also cope with the problems by combining solutions from the other generations of LAFs. In general the 4 generations can be described by some special construction details of importance.
1st Generation units, "Charnley Boxes" and even "Green Houses", had glass walls almost to the floor. As repeatedly pointed out by Hugh Howorth, this gave the unit excellent protections against the peripheral entrainments. However the main objection to these units was and still is the limitation of freedom caused by the glass walls for all parts of the surgical and anaesthetic procedures.
2nd Generation units kept the name Charnley Boxes, though walls are extended down from the ceiling to various heights. To day some international standards specify the height of these partial walls e.g. HTM 2025 down to 2 m above floor. These walls are in use in 2nd and 3rd generation units. The screen sizes are from 2.4 x 2.4 m.
3rd Generation units are mainly known under the, now almost legendary name, the Exflows. These Exflows invented and patented by H. Howorth, have been

297
installed in Hospitals all over the world. They have kept the use of the partial walls, which quite often extend down towards floor level. The advantage with the Exflow units was the increased resistance towards peripheral entrainments. Articles and lectures from H. Howorth are of great importance for all those who want to understand the complexity of air movements in an operating theatre during surgery. These systems will still be among the available for hospital leaders for many years to come. Screen sizes 2.9 x 2.9 m. The design is now copied by some manufacturers.
4th Generation A few factories in Europe produce these units. H.Howarth's own 4th Generation; Omniflow unit (also patented) is among the constructions that totally leave out the partial walls. The reason for this is the increasing need for more space which still needs to be kept clean, and the need for free heights for 3 m and more without any hindrances. The freedom of the positioning and the use of operating theatres lamps and satellites, pendants and c-bows differ from unit to unit. Screen sizes from 2.9 x 2.9 and up to 4.2 x 4.2 m, are designed and installed by AET in Scandinavia.
Some have extended the use of outward directed airflows. Some combine the use of that and hypothermic air. Others that are run in a low velocity mode rely mainly on hypothermic air. Isothermic air or even worse hyperthermic air, will not work safely in most of these units. To avoid problems with the lowering of room temperature by the steadily introduction of air at 0.5 to 6.0°C (fig.4) beneath room temperature, a compromise has been made by reducing the total air volume and thus the area that can be kept clean under the sterile laminar airflow. Consequently there are still more problems that need to be solved after the introduction of the 4th generation units.
Even though these units provide greater freedom for the use of the main lights and satellites, the positioning of the pendants etc, the problems mentioned above still represent a major challenge. These systems also involve the risk of build up of cold air with unpredictable downfalls as mentioned previously when run in the lower velocity modes. The lower the velocity the bigger the risk will be with the installation. In the lower velocity range there is a considerably reduced resistance to cross contamination through out the clean zone in spite of the larger units. When emissions of contaminants occur within the clean zone, the recovery time for the 4th generation systems in the lower velocity range will be
298
approximately 300% greater than that of traditional UCVs or LAFs. Reduced clean areas mean reduced ability to preserve the integrity of sterile equipment. In the Nordic countries some of these systems have had great problems in achieving acceptable maximum CFU levels.
With some system designs serious sound problems have been experienced. Some of the systems have been designed in such a way that only a lower level of protection is achievable. In addition some of these systems have proved to be difficult to maintain in an efficient and hygienic manner. The above-mentioned factors concerning all 4th generations of LAFs, strongly emphasises the need to have in mind internationally recognized guidelines, when designing units and the complete ventilation system for the operating room. The 5th generation of LAF ceilings for operating theatres internationally patented multiple flexible zoned systems.
The unpredictable and often very serious negative influence of hindrances, door openings, movements of staff, thermal disturbances etc., is as mentioned among the important challenges to the UCVs for operating theatres. The airflow from LAFs remains laminar as long as there are no failures with temperature control of inlet air, thermal disturbances (Figure 47.1b) or obstacles etc. There are further questions of interest that understates the need for the new generation of LAFs.
The airflow in low velocity systems is set as a compromise. It is designed with the priority to reduce draught problems in work zones, by minimizing the air velocity to the lowest limit of what possible could work. It gives some cleaner air towards incision area, but at very easy vulnerable state. One of the arguments, taken out of the total picture, has also been economically savings. Of course these questions are important. However even when only the economical side of the total picture is discussed, the cost of only one more wound infection at orthopaedic operations e.g. will at best be compensated after approximate 50 years. In practise there will be more infections acquired during surgery pr op-room through 10 years and more, and thus the economical potential saving by less secure systems as the low velocity systems is really not a serious argument. These systems are not designed with priority to reduce influence of obstacles etc. They have proven to be more unstable, due to easily caused air circulations and whirls from the thermal disturbances, obstacles and also the secondary zone. It has been demonstrated by tests that whirls released e.g. from lamps induce more

299
turbulence than that caused by thermal buoyancy. Those are important factors to consider when constructing real laminar airflow systems.
This emphasises the need for using operating theatre lamps consisting of a multiple of smaller lamp heads than one larger. The result is always less clean air with increased particle counts in the primary zone when obstacles are introduced in the upper part of the air flow. Even when there are very good aerodynamically shaped operating theatre lamps on the market, for example the lamps from Brandon Ltd, UK, which have been found to be very good concerning avoidance of air disruptions, there is still a long way to go in bringing the importance of even the lamp shape to the hospital managers attention. We have found that models with only one big lamp may be disastrous for the level of air cleanliness under the lamp and over the operating table or instrument tables. Most often there are satellites involved, which can seriously increase this effect. Our research in the matter clearly points out there is a number of risk positions concerning theses lamps. Among the most important factors is the preventions of pathogens when choosing of lamps in ultra-clean air stream.
While all mentioned obstacles and other problems which there will be to comprehensive to include in this discussion, creates possible routes for airborne infections, there are even more reasons to day than earlier to refine, improve and develop the LAF concept to a adjustable and modular system. Compromises concerning construction and layout are bad, and should be avoided. One of those more and more importunate reasons is the rapidly increasing in resistant microbes against antibiotics. Thus the need for aseptic surgery will increase as well, in not only the same rate, but even more. This is caused by the growing of the elderly part of the patients and their special needs and a lot of other circumstances.
Compromises have been made with the first four generations of UCVs in other to prevent or reduce discomfort. On the other hand J.Charnley and H.Howorth who were also at an early stage familiar with these problems were never prepared to compromise the safety of the patient. They only made those compromises that were strictly necessary from a medical point of view and no more than that. They were obliged to accept the drawbacks with the earlier designs. Different choices have been made. Is it possible to continue in the same direction as J.Charnley and H.Howorth?
300
The patented 5th generation UCV's can be adjusted to safe levels of velocities. These systems allow adjustments of lamp heads, and other obstacles to positions, which low velocity systems cannot safely deal with. Thus the freedom for lamp movements without disrupting the clean airflow is much bigger. With the 5th generation UCV's, the air can be directed either manually or automatically, to meet the challenges in each individual zone. The benefits of adjusting the air parameters to each specific zone rather than for the whole area are many; greater individual comfort, less increase of sound, less increase of energy consumption, better protection factors, and above all no compromises.
The 5th generation is therefore a vast improvement compared to the compromises made in the first four generations. The internationally patented 5th generation of UCV's: AET-V4-UCA is the optimal answer for today's and tomorrows needs, and a totally new way of planning and designing UCV's for the safety and comfort for the operating theatre staff and the patient. This system has been designed to meet the challenges of all the above-mentioned problems. The new modular and very flexible system makes it possible to deal with the problems that will occur, not only for those that are obvious, but also those that are forgotten and often hidden. These problems are often very difficult to deal with for the 14 generation systems. And if they can be dealt with they will often be disastrous for the finalizing of the project concerning costs and schedule. New hospitals have been delayed for months and years by such factors. The 5th generation of Ultra Clean Ventilation systems was invented with these serious problems in mind. The positive options for this innovative design are now available. So far they have been successfully installed in operating theatres in Scandinavia, amongst others at the new University Hospital in Oslo, in the department built for the research of new surgical procedures. The experience with the 5th generations of UCV's also involves inclusion of pendants, multiple operating lamps, operating lamps with satellites and camera arms, camera boxes, gas and electrical fixed outlet points.
Hypothermia prevention, medical hypo- and hyperthermia possibilities, prevention of wound drying, very low sound levels, extremely low CFU-levels at the wound area and over the total clean area, good diversified Indoor Zoned Climate, high cross contamination protection factor microbiological safety system, infection ventilation safety system, freedom for lamp and pendant movements, freedom for lamp and pendant placing (for the remote fan systems),

301
freedom for moving of high apertures (C-bows, that might be close to 3 m height), system for reduction of risk for microbiological growth and smells through HEPA filters. All the features are parts of the international patent. The earlier problems are now solved with the new technique. As mentioned above it is now possible to give the correct air conditioning, comfort levels, cleanliness, wound environmental priorities at the same time without the usual compromises. Increased levels of airspeed well above the limit between turbulent and LAF also can now safely be used in a wider area. The conditions for the operating wound were decisive for the velocity settings in the Howorth Units. A measure of the velocity at level of incision and instrument tables was an integral part of commissioning the unit. Consequently this measurement has become a part of the HTM 2025. This level can however be tuned in the 5th generation units to better suit the patients needs. Is the patent of any use, or is it only a theoretical idea? As mentioned it has been installed and four different types of the invention are currently in use. Initial experience with the equipment has been very positive.
The AET-V4-UCA, is built up as a modular system with separated zones connected to purposely designed chambers depending on how the staff and patient are situated in the working zone (Figure 47.2). The shape and amount of
Figure 47.2. Function description for a laminar flow ceiling.

302
zones can vary according to needs specified by the Hospital. There are an almost endless number of configurations and needs can be catered for, thanks to the unique modular and zoned system. All climate and air parameters are manually or automatically adjusted and controlled individually within the chosen zones; the air volume, temperature, humidity, velocities, directions, cleanliness and laminar flow (all internationally patented). Additionally the AET-V4-UCA has a special peripheral zone for stabilising of air stream and patterns towards the secondary zone, where the above-mentioned parameters to be varied individually (Figure 47.3). Additionally there is an option for a reduction system for smells and prevention of the growing of micro organisms in the filters and all around in the part of the micro cosmos in the operating theatre (joints, cracks, partly enclosed hollow spaces; impossible to clean). The system reduces static electrical problems (and thus the main reason for a total humidification system for the supply air), harmful gaseous and vapours (all covered by the patent). The systems can be delivered with all sorts of good screen systems according to wishes. Ultra Cleanliness to Extreme Cleanliness, air pattern choices including the highest grade of laminar flow are options that are essential for the staff and the patient's comfort and safety. The air volume and direction controls, for the compensation of all the variables that may contribute to peripheral entrainment and even cross contamination of microorganisms, give the ultimate protection possibilities with such systems. The dynamics and directions of the air streams as well as the volumes needed for this can be automatically controlled. The zoned controls, which include the possibilities for the temperature corrections (Figure 47.4) during the use, will eliminate the risk of hypothermia and draught problems, without compromises. This means also increased concentration ability and endurance for the staff, and thereby ultimately increasing patient safety.

303
Figure 47.3. AET-V4-UCA.
Figure 47.4. Zoned controls with temperature correction possibilities.
Moreover it is of great importance; that the climate for the patient as well as the incision area is as optimal as possible. This is covered by the patented solution, which provides the correct conditions to substantially improve the healing of the wound while at the same time increasing protection against infections. This makes the internationally patented AET-V4-UCA to the optimal answer for today's and tomorrows needs for the performance of surgery under the safest possible condition!

304
Summing up of the properties, benefits and the utility of the 5th generation of UCVs for operating rooms are given below. Benefits:
− Cleanliness class C, D or E (ISO 3-5) according to choices into an extended area because the directed air patterns (downward and outward) refer US. FED. STD: 209 F and BS 5295.
− Amount of micro organisms will be ≤ 5 cfu/m3 without the use of body exhaust.
− An infection rate well below 0.1% is possible for all types of clean operations. Even other types of surgery will benefit in a substantial way because of the increased control of wound conditions.
− A comfortable individual adjustable climate for the operation team and patient.
− Options for adjustments during the day for changes in temperature and arrangements of pendants, lamps, apparatus, instrument tables, amount of staff members, all influencing on the air patterns in a complex operating theatre by sensors that will keep control of the systems efficiency all the time, and adjust the dynamic needs of the air in the different zones.
− Can be adjusted to any desired type of velocity and temperature settings, equal to any other makes in the market.
Properties for the patented UCV's:
− Especially designed zones for the need of the surgical procedures in the respective operating theatres.
− Integrated or remote fans, heating and cooling coils, humidification system, filters.
− Prevention apparatus against electrostatic discharge, gaseous and vapours, smells and microbiological growth in the micro filters (bioclimatization).
− V4-UCA has substantial constructions with sound attenuators, which include hygiene insulation of highest quality. This gives optimal sound reduction.
− Automatic controls and readings for temperatures, humidity, velocities and directions of the air patterns.
− Automatic controls for bioclimatization.
− The total outlet area of the micro filters is the same size as the diffuser area.

305
− Enormous total filter area for longest possible service intervals. Micro filter lifetime > 15 years. (Safe because of bioclimatization an important part of innovation and the patent)
− Micro filters as last part of the systems represents a safe last barrier for the clean zone and even makes aseptic service and maintenance possible. The protecting grilles under the micro filter may be delivered in parts for autoclaving.
− Specially designed air vanes between zones and in the peripheral area.
− Individual control of all 4 sides of the peripheral area gives maximum protection towards entrainments
− Adjustable relative humidity in separate zones
− Adjustable extreme humidification in the incision area
− A flexible modular based size makes the adaptation to the operation room easier (no take it or leave it size.)
− A modular basic system makes it possible for future additions with different options
− Manual or automatically control.
The utilities of AET-V4-UCA. Even though the some of the earlier models have shown good results it is still highly desirable and now possible to reduce the infection rate. The reason for this is the improved control and adjustment possibilities of all the parameters of importance for the environment in the clean zone and for the wound. This will be the case for orthopaedic, neurological, heart, eye, implant, burns and also other types of surgical procedures. For Hospitals that already have quite low rates of infections, further improvement e.g. from 0.3% to 0,03% is achievable for clean operations with this new generation of LAFs / UCVs. Even a reduction from 0.3 to only 0.15 is in fact 50% improvement, thereby making substantial saving for hospitals, society and not least the patient concerned. It goes without saying that Hospitals with substantial infection rates the savings can be enormous. All operations outside the group of clean operations are done at a greater risk of infection.
Even though contact infections are the main reasons for infections in those operations, (for some Hospitals and procedures this may be over 30%), the airborne routes for infection still play a role. However this route is often heavily camouflaged

306
by the high rate of contact infections, and therefore difficult to estimate when compared to the clean operations done in ultra clean environments. It is therefore reasonable to assume that the airborne route in ordinary operating theatres with the dirtier air causes a higher rate of infections.
The fact that the risk from the airborne route of contaminations is much higher here should be paid attention to, Bearing in mind these obvious savings the UCV's would soon have a short pay back time. The consequence of those estimates has led hospitals today to increase the amount of UCV's in full scale according to international standards. Among our latest installation is a central hospital with 6 full size units and 3 minor half-size units with special double textile screens and the light above the textile screen. This is in very clear contrast to the earlier period where hospitals at most only installed 1 or 2 units. The flexibility of the modular system will improve the future use of the theatres in many ways. Those will as mentioned reduce the camouflaged part of the infection rates in the less clean operations. This will ultimately mean even more patients; compared to those in the clean operation situation will be able to leave the hospital with no post operative infections due to the extra protection given by the UCVs and especially the 5th. Generation UCVs. Hygiene in general is also proven to be improved when ultra clean ventilation (UCV) systems are taken into use. The UCVs will make substantial savings in many different circumstances. At only one hospital in the Nordic countries, they could document the following savings pr. year.
Pr. theatre after purchasing 5 units: The basis for the calculations is 700 orthopaedic operations pr year and theatre, and a reduction from 1% to 0.5% in new infection rate, in average (counted through 3 years) and where infection costs were 60 000 GBP in average. This gives extra savings pr year and theatre of 700 x 0.005 x 60.000,- = 210.000,- GBP
The cost of one standard UCV is approx 30.000 to 60.000 GBP depending on options, type and make. The costs for the basic models of the 5th generation types are aprox equal to the second to fourth generation models. There are therefore more savings to society if units are installed into existing theatres and the new ones to be built. Even when you add the cost of the outside air systems, which must be installed anyhow, this is still a very profitable investment for the future.
307
This is in fact for many Hospitals a conservative estimate, bearing in mind that they have much higher infection rates and also frequencies of operations. Emergency theatres for instance may reach 78 operations pr 24 h, 7 days a week. Other theatres may have rates of 1000 operations or more pr. year. The cost of long term payments to persons off work due to the ill effects of an operation, is obviously not included in this estimate, but is still considerable for society at large.
47.4 CONCLUSIONS
The total costs for patient treatment also includes those who return to hospital due to hospital acquired diseases, which only become apparent after leaving hospital. Deep wound infections and infections making joints loosening may be diagnosed months after the operation. Calculations show that the payback time for any investment that successfully prevents infections will be among the very best. There can be few investments for, the society that can compete with these in cost effectiveness. This is particularly the case where deep wound infections are involved. The potential for savings in this area are still considerable. This cost is approximately equivalent to an installation of only one high quality UCV in a theatre where thousands of operations are performed.
For the above-mentioned reasons and others not covered by this article, the planning, design and construction of operating theatres must meet the needs of tomorrow. Flexibility of design is an absolute essential requirement. Every part of the total construction including the LAF ceilings must be considered. Design must be considered for multiple purposes. Designs that only cater for specialized surgery that relatively seldom occurs will involve far too high costs. Therefore large multipurpose rooms equipped to meet the needs of general and specialized surgery will be the dominating feature of future hospitals. This will create the need for UCVs in almost every operating theatre in the future. The development and improvement of less invasive procedures has been impressive, however today, 80% or more involves ordinary invasive surgery and this will probably be the case for the foreseeable future. All this calls for infection barriers of the utmost flexibility and highest quality. The internationally patented 5th generation of UCVs will be integral part of that barrier. Finally although some surgeons may be reticent to work under different conditions, they must bear in mind that these units can be adjusted to any desired type of velocity and temperature settings,

308
equalling any other generation designs and capable of providing the ordinary climate he is used to when he is in charge.
When the zoned theatre system is taken into consideration it is believed that a zoned theatre system would meet the needs for flexibility and throughput at any Hospital and would keep the doctors at the very forefront of ultra clean air theatre technology. It would therefore be very advantageous when doctors are interested in exploring the benefits of the zoned theatre technology, not only the technical persons involved in projects, since the doctors usually are the best to evaluate if the most important aspects; the medical and the individual need for; climate settings for patient, incision area, surgeons, anaesthetists etc. When doctors are informed about a patented invention that represents a development of the open systems often used to day (24 generation of systems), they at least should told that:
− AET-V4 UCA is proprietary technology, products, systems and know how with a large potential. Response at specialized exhibitions and conferences, as well as close cooperation with hospitals and surgeons confirms the features of this concept. Alone, AET does not have the required capacity to supply the modular systems to the worldwide market and explore the opportunities it represents, as possible and wished, so this can only be achieved through a wide cooperation between companies already working with clean air technology.
− Basically the invention allows for zones of different temperature and humidity. The surgeon can work in a zone that is cool and dry for comfort, the patient can be kept warmer with the wound site more humid to reduce evaporation and possibly hypothermia, and the anaesthetist can adjust the conditions to suit himself. A beautiful consequence of this arrangement is that the cool air surrounding the patient zone constrains the warmer air in that zone so that it is more likely to reach table level.
− There are a number of theatres of this type in operation already in Scandinavia, but none so elsewhere in the world. The ideal installation site of course would be where the user has the vision to see the potential benefits, and the desire to document the results in terms of patient well-being and productivity etc. The international needs for the AET-V4-UCA proprietary, patented technology and know how is very large and

309
may represent an opportunity for the total clean air branch to present improved solutions to a number of various types of industries, institutions and organisations world wide. This represents enormous challenges. The most important world wide need currently being met are hospitals and food industries
− Industrial partners and others are invited to explore the full international need for the V4-UCA system. AETs V4-UCA represents a strong technology and is positioned to develop a successful change to the individual cover of environmental needs in operating theatres and other clean areas with needs for multiple climate zones in the same area.
− Specialized companies are invited to take their part to cover the international needs for better solutions for the staff and patient; with individual zoned ultra clean operating rooms. Ideal actors will have an already sound technology platform. With common effort and ambition, the clean air technology branch will soon pas the first 4 generations of elderly techniques inclusive all the compromise solutions and supply the system of to morrow already to day. Will you be among the pioneers?
47.5 REFERENCES
1. Hall, G. 2005. Air flow disruption must be minimized. Health Estate J.
2. Hartung, C. & Kugler J. 1998. Perturbations affecting the performance of laminar flow in operating theatres. 15th IFHE Congress Hannover, Germany.
3. Howorth, H. 1993. The evolution and development of clean air systems for surgery, Health Estate J.

310

311
ELECTRONICS SESSION


313
CHAPTER 48: PARTICLE CONTAMINANTS IN ELECTRONICS MANUFACTURING
Pasi Tamminen & Jari-Pekka Leskinen* NOKIA Corporation, Tampere, Finland * NOKIA Corporation., Salo, Finland
We have studied particle contaminants in high volume electronics manufacturing having component placement and final assembly operations. Special interest of the study is with particles having size more than 10 µm which may cause visual or functional defects. This study covers risk assessment, quantity, distribution and source of contamination analyses. Results of the analyses will be used to establish contaminant prevention and removal principles fulfilling the current and future requirements of assembly operations.
48.1 INTRODUCTION
Particle control in consumer electronics manufacturing, having mainly Surface Mount Technology (SMT) and mechanical assembly operations, has not been traditionally one of the major concerns. Component placement and joint technologies have had such large dimensions that even more than 100 µm particles have not decreased quality of the products. Modern consumer electronics manufacturing is now moving step by step to dense joint technologies as new component and Printed Wiring Board (PWB) technologies merge [1]. These may not necessarily use solder paste anymore and space between joint pads and thickness of the joint can be less than 300 µm and 50 µm, respectively. Some of these joint technologies, like Anisotropic Conductive Film (ACF), may have 35 µm distances between the device and substrate [2]. Joints with these dimensions have to be made in environment having particle control. However, not all manufacturing areas may fulfil these requirements.

314
Consumer electronics manufacturing has several major differences when compared to small scale industrial or medical high end product manufacturing and the same clean manufacturing methods can not always be used especially when the production volumes are high. Cost efficiency has a very important role and forces to use simple and adaptive technologies e.g. with contamination control. Efficiency depends on production phase time and this is typically much faster than in high end manufacturing. At the same time, new complicate products having several subassemblies require more and more assembly and logistics phases and throughput time may be actually fairly long. All these phases will increase products exposure to particle deposition. In addition, volume of product parts, sub-assemblies and packaging materials flowing through the consumer electronics manufacturing is much bigger than in high end manufacturing. Number of different product versions and amount of suppliers for product parts is also high and these all together challenges particle control in manufacturing.
Visual degradation of the product quality due to particles has been better understood with consumer electronics and has been controlled with inspections, cleaning, electrostatics and environmental control methods. A deviation with visual quality is not a crucial failure with consumer product, but has an effect on customer satisfaction. Some of the consumer products are examined very carefully by the end users and have therefore high requirements for visual quality. Visible dust particles can be typically removed during the assembly if those are on the surface of the product. However, particles being inside of the product can not be taken easily away and are not acceptable if there are lenses or other optical instruments in the product. Particles may also drift inside of the product during manufacturing phase or particles may peel off from the surface of subassemblies. This will bring new type of challenges when production volumes are high and particle contamination should be controlled.
The aim of this research is to study particle contaminants in high volume consumer electronics manufacturing in order to understand risks related to particle depositions on manufactures. Visible particles have about the same dimension as contaminants giving challenges for modern electronics joint technologies. Therefore, this study focuses on particles having size 10 µm or more. At first, process phases and product subassemblies with potential challenges with particle control in typical consumer electronics manufacturing

315
are presented. Secondly, type of particles reducing product quality or deteriorating manufacturing processes will be studied. The third part of this work will present results of the analysed sources and types of particle contaminants in typical electronics manufacturing area. The last part discuss about contamination prevention methods and technologies.
48.2 PARTICLES AND CONSUMER ELECTRONICS ASSEMBLY
Technical features of manufactured products shall affect to risks contamination may cause in manufacturing. Some of the products may not be at all sensitive to contaminants and particle control may not have been taken into account in the design of product or assembly processes. Nevertheless, these products may be assembled in the same area as the products being sensitive to contaminants. There can be also only one or a few process phases requiring clean environment and rest of the phases can be done in uncontrolled environment. Of course, contamination sensitive processes or products can be manufactured in a separate area having better classification for cleanness, but this would constrain flexibility of the manufacturing. This makes it difficult to find an effective way to design clean assembly processes for high volume manufacturing. On the other hand, products being insensitive to particles can be designed so that manufacturing of them will not cause problems to more sensitive products. However, there should not be any major extra costs due to design changes and sources of contamination should be also well known by the designers. These targets may not be so easy to achieve.
Processes or subassemblies having challenges with particle contaminants have to be specified in order to plan an effective particle control for high volume manufacturing. Typical product parts and electrical joint technologies used with assembly processes are shortly presented in chapters 48.2.1 and 48.2.2.
48.2.1 Subassembly Parts
Product parts are typically coming to the assembly from suppliers which are producing e.g. circuit boards, SMT components, cameras, LCDs, plastics or other mechanical or electro mechanical parts. Each part may have a specific

316
requirement for particle control and these requirements are also continuously changing due to technology progress.
Optical Components
One common technology with hand held consumer electronics is Liquid Crystal Display (LSD) which is used for user interface purposes. Size of a display vary between a few to even over 100 square centimetres and may have high screen resolution with a pixel size e.g. 120 µm x 120 µm. These high resolution displays must not have visible particles on the surface. If the particle is on the surface of the product simple cleaning can be done, but product has to be disassembled in case of contamination under e.g. protective lens. This slows down manufacturing and cause extra costs. The same challenges may exist e.g. with camera assembly having the camera module and objective under a protective lens [3].
Printed Circuit Boards
Particle contaminants on circuit boards may cause defects with joints. PWBs will arrive in moisture and dust barrier packages and those are removed not until just before printing. Therefore, PWBs do not typically have large particles on the surface when those are fed into the paste printing process. However, test pads and joints with paste are visible and subject to particle deposition during component placement and handling processes until reflow phase where joints are made. PWBs may have also electrostatic potentials during handling due to dielectric solder resists and this will increase possibility to get particles on the surface due to electrostatic attraction.
Electrical and Mechanical Components
Electronic components do not have major amount of particles when coming from the suppliers as those are manufactured and packed in clean room environment. More challenges may exist with mechanic and electro mechanic parts which may have particles on the surface due to previous manufacturing and handling processes. Mechanical parts itself may not suffer of these contaminants, but those will carry particles into the process and cause problems with sensitive manufacturing phases. Mechanical parts have both dielectric and
317
conductive structures and e.g. electrostatic forces may trap and hold particles on the surface long periods. In addition, machined inner edges of the mechanics may have particles with loose connection.
Those parts which will form enclosures of the product have high requirements for surface quality. These parts are mainly provided by suppliers and will arrive in varying packages in to the assembly area. Even the part would be clean when it arrives, it may get contaminants on the surface during handling and assembly phases. Especially, surface treatment such as painting is sensitive to particles and is always made in controlled environment. Product covers may also include transparent lenses e.g. for camera and LCD assemblies and are often made of plastic and may get triboelectric charges during handling. For this reason, optical parts have typically temporary protective plastic film on the surface during manufacturing operations.
48.2.2 Joint Technologies
Paste printing has not been extremely sensitive to particles with a current typical joint diameter 400 µm or more. However, lint or other larger pieces of dirt may cause solder defects like bridging and poor wetting during reflow process even with larger joint size [4]. Paste printing uses stencils having thickness between 50 µm and 180 µm to deposit paste onto the PWB. Stencil openings are now typically more than 200 µm, but are also getting smaller due to tighter component connection spacing and can be e.g. 70 µm within the next years. Joints with these dimensions requires controlled environment inside of the paste printing process However, also process materials such as PWBs and stencils have to be clean when fed into the process.
Paste printing is not the only principle to create electrical joints. For example, ACF and flux dipping in Package on Package (PoP) process are also commonly used. Flip Chips and other component types can be dipped in flux prior to placement with a special fluxing tool. Flux station can be attached in normal placement equipment which will be used to pick up a component, dip it on the flux and place it onto the PWB. Reflow process is used to join these components the same way as the components on solder paste. Several versions of flux dipping tools are available, e.g. in Figure 48.1 is one tool with a rotating flux bath which will make a flux wave having height about 50 µm. Cleanness of air

318
inside placement equipment is not typically well controlled as there are several openings with the covers. In addition, flux bath is typically uncovered and particles may deposit into the flux and cause deviations with joint quality.
Figure 48.1. Dip-Flux Feeder by MIMOT LLC for Flip Chip fluxing.
ACF technology is widely used to electrically connect die, PWB and flexible circuits with devices such as LCDs and PWBs. ACF adhesives use e.g. gold-plated polymer spheres or conductive fibres having size of 515 µm which are squeezed together under high pressure. Contamination on joint area may block the connection or decrease quality of the joint. In addition, large conductive particles may cause bridging with small joint spacing.
Electrical and functional testing of products is sensitive to particle contaminants. Electrical testers use typically thin pins to contacts test pads of the product and any contamination on the contact area may attach on to the test pins. This may cause test errors due to contact problems. Optical testers may have also challenges with particles and especially testing of high resolution LCDs is very sensitive to particle contaminants. In this test, each pixel has to pass functional test and particle contaminants shadowing even partially any of the pixels will cause fail decision.
48.3 CRITICAL SIZE AND VOLUME OF PARTICLES IN ELECTRONICS ASSEMBLY
The bigger the particle is the easier it will cause defects during electronics manufacturing. Therefore, minimum critical size and amount of particles which

319
may cause problems in manufacturing operations is the main concern [5]. Process may tolerate tens of thousands of few micron size particles but not even hundreds with 25 µm size. On the other had, human is able to see particles having size at least about 3040 µm, but this depends strongly on particle shape, shininess and ambient light [6]. Visual particles will create also problems with optical testing equipment in manufacturing.
48.3.1 Number of Particles on Critical Surfaces
Electrical joints are one of the critical surfaces in an assembly process. Probability to have harmful particle contaminants on electrical joint area depends mainly on number of particles in environment, deposition speed of particles, area of joints and product exposure time. However, it is not easy to give a simple or exact equation for defect probability. For example, size of the connection may be such a large that particles will not cause defects even those stays on the joint area. In addition, particles are not moving equally as other forces, such as electrostatic attraction and air flow, affects to deposition. Air is neither the only source of particles in process as contaminants may come with the process materials or from the process itself. Therefore, only rough estimations can be done of the probability to have certain amount of defective joints due to air contaminants. [4]
Maximum number of particles in a cubic meter can be calculated and used as guidance, despite of its inaccuracy, for required air cleanness in an assembly area. For example, there may be 1200 joints on a PWB and if the average size of pad is 0.4 x 0.4 mm, it makes a total joint area of 1.92 * 10-4 m2. In Figure 48.2 is a chart presenting calculated number of particles after 10 minutes deposition on the joint area of one PWB with different volume and speed of particles. Ten minutes represent the time joints would be visible during surface mount process. The total area of joints is small when compared to the area of whole PWB and there may be only a few joints on a PWB being very sensitive to particles, and typically, less than 5 µm particle size dominates the distribution of contaminants in air, as shown in a Figure 48.3. Therefore, in principle, it is fairly low probability to have a solder defect due to particles on joint area. ACF joints have smaller dimensions and are therefore more critical to particle depositions, but on the other hand, the number and total area of ACF joints is typically much smaller than the area of solder connections on one PWB. Thus, the probability to have a defective joint due to particle contamination is low also with ACF technology.

320
0
2
4
6
8
10
12
14
16
18
20
125 250 500 1000 2000 4000 8000 16000Number of particles in air / m3
Num
ber o
f par
ticle
on
pads
/PW
B
(10
min
utes
& 1
.92*
10E-
4 m
2 ar
ea) 0.01
0.020.040.080.16
Figure 48.2. Number of particles on 1.9 * 10-4 m2 joint area during 10 min period.
The same calculations can be made also for surfaces having high visual quality requirements. This will apply more for final assembly operations in electronics assembly. In Figure 48.4 has been presented calculated number of particles after 10 minutes deposition on 7 x 4 cm size LCD surface. Particle deposition rate is now about two decades higher due to larger target area when compared to probability to have particles on solder joints. In this case, particle rate would be significant already with low air particle concentration and particle speed.
1
10
100
1000
10000
100000
1000000
10000000
0.3 0.5 1 2 3 5 10 25Particle size [um]
Part
icle
s / m
3
Figure 48.3. Distribution of particles in air beside of component assembly equipment.
Particle speed m/s

321
0
50
100
150
200
250
300
350
400
450
500
125 250 500 1000 2000 4000 8000 16000Number of particles in air / m3
Num
ber o
f par
ticle
on
pads
/PW
B
(10
min
utes
&28
E-4
m2
area
)
0.010.020.040.080.16
Figure 48.4. Number of particles on 28 * 10-4 m2 LCD area after 10 minutes.
48.3.2 Selection of Critical Particle Size and Volume
Consumer electronics manufacturing seldom uses the latest technology with mass products due to cost and reliability matters. Therefore, it can be estimated that solder connections will have around 200300 µm dimensions within the next years. AFC technology has already about 3050 µm dimensions and LCD test may fail if the particle size is more than about 40 µm. For this reason, particles having size about 30 µm or more are the most critical from joint technology point of view with electronics assembly operations. 30 µm would be the limit for those particles which may cause direct failures with the most sensitive assembly processes. However, even smaller particles may cause defects if concentration of the particle contaminants is high. For this reason, particles with a size 10 µm or more should be controlled.
Human detects visual defects the better the size of particle increases and observable particles are typically much larger than 30 µm, and preferably, at least several hundreds of micrometers. However, a 30 µm requirement can be selected for particle control in consumer electronics manufacturing when visual defects have to be prevented.
It is not easy to give one exact value for the maximum number of particles in air for SMT and final assembly processes. This depends on e.g. type of the
Particle speed m/s

322
contamination, sources of the particles, exposure time, assembly processes and product technologies. For example, by having a critical surface size 28 cm2 and controlled particle size 10 µm, about 10002000 particles/m3 could be a reasonable target to require.
48.4 PARTICLE SOURCES
Sources of particle contaminants in electronics manufacturing have been presented in several publications [4, 7]. High volume consumer electronics assembly has mainly the same general potential sources of particles such as facility, ventilation, personnel, product processing, etc. However, there are a few processes or process functions which will emphasise when larger than 10 µm particles are the main concern. Therefore, processes and functions producing mainly more than 10 µm particles are analysed more in detail in this study.
Target of the analyses were to locate major sources of particle contaminants and estimate volume of particles with the size of 10 µm or more. Contaminants in electronics manufacturing area were analysed with HIAC/ROYCO 5230, MetOne 237 B and 3113 particle counters. These analysers are not reliable when measuring particles having size more than 10 µm, and therefore tape samples and optical microscopy analyses were used to classify larger particles. This method will also help to locate local sources of large particles which may not be found with air particle counters.
Manufacturing area had the following automated PWB manufacturing phases: paste printing, surface mount assembly, electrical and functional testing of the PWB, and the only manual phase which was final assembly. There were also material storage, recycling and logistic operations at the same area. Product and packaging material volumes were extremely high both in PWB and final assembly.
48.4.1 Contamination Sources with Component Assembly, PWB Separation and Testing
Surface mount process has a few local sources of particles. Paste printing process deposits flux and solder particles with a ball size e.g. 10 µm onto the pad areas and these will form joints during reflow phase. Some of the solder particles

323
may fall side of the pad before or during the reflow and stay as a free conductive blob, consisting of one or more solder particles. Size of a solder ball may vary between 10 µm and several hundreds of micrometers. These solder balls may cause e.g. short-circuits or visual quality challenges. However, free solder balls are not common when printing process is in control and therefore, these were not found to be a major concern from the cleanness point of view.
One other source of particles is component packages. Electrical components and PWBs are packed in plastic or paper based materials when brought into the surface mount process. Components are on plastic trays or in reels which are made of cardboard or plastic. Components in a reel are in the pockets of carrier tape and these pockets are covered with a plastic cover tape. During the assembly, these tapes are cut in small pieces or guided as a solid tape into a waste box, depending on the type of assembly equipment. Cutting of the paper tape and handling of the paper reel will create fibre particles. Especially, the tape cutting process may be a significant local source of particles since there may be over 50 paper tapes in one assembly equipment and each tape is punched into few millimetre long pieces. These particles mix with all other paper based fibres found in manufacturing and were not identified separately with air particle or tape analyses in this study.
Component assembly or testing has not many major sources for over 10 µm particles as the process do not contain heavy material processing, except component tape cutting and PWB separation. In addition, assembled parts in this area are mainly particle free and most of the operations are more or less automated pick and place functions. Small number of air particles was also observed with sample measurements beside of a component placement process. In addition, this process area is typically controlled only by two or three operators and human based contaminants have not a major role. In Figure 48.3 has been presented a chart of particle distribution in air. There was only small amount of particles in air having size more than 10 µm in surface mount component assembly area.
PWB separation (routing) process is used with large panels which include several small PWBs. Routing process cuts off individual PWBs from a larger panel with a bit having high speed of rotation. This process phase creates lots of small dielectric and conductive particles and these are removed from the process

324
with a suction nozzle. Ionisation is used to neutralise particles and to help with dust removal. However, some of these particles will solidify onto the surface of PWB or equipment due to high speed, temperature and electrostatic attraction. Routers are well encapsulated, but some of the particles may also escape outside of the cabin due to maintenance and PWB loading/unloading operations. In Figure 48.5 is microscope images taken from two tape samples placed on a router inner surface. In image 48.5a are small lacquer, fibreglass and solder particles and also longer millimetre range fibres which were originating from final product cardboard packages. Image 48.5b has typical fibreglass and copper chips originating from the PWB material. Particle sizes vary from a few micrometers up to 500 µm. PWB cleaning may be needed if these particles will cause problems with product testing or particles create visual quality challenges in final assembly phase.
(a) (b)
Figure 48.5. Particles found from the routing process. Two tape samples.
48.4.2 Contamination Sources with Final Assembly Processes
Final assembly operations have more variation than surface mount processes. Final assembly phases merge together all subassemblies and number and type of those depends on end product. Therefore, final assembly areas making different products or having different process layout will have novel challenges with particle contaminants. In this study, sources of particles being typical for high volume final assembly area with several assembly phases per product were analysed. This area had separate manual and semi-automatic work stations, hundreds of workers making assembly and material logistics operations.
500um
1000um

325
The dominating source of particles within the area was found to be the packaging materials. All other typical sources of particles, such as personnel, subassembly or facility, were found to be in minority. There were more particles close to the packaging area, but packaging material based fibres were identified also with tape sample analyses taken close to the testing, final assembly and PWB assembly area. Air particle analyses revealed also large numbers of smaller particles in air. In Figure 48.6 has been presented an average measured particle distribution in final assembly area. Measured particle volumes between 0.3 µm and 5 µm falls between ISO 14644-1 classes 7 and 8. Final assembly processes having high visual quality requirements should not be located close to final product packaging phase.
1
10
100
1000
10000
100000
1000000
10000000
0.3 0.5 1 2 3 5 10 25
Particle size [um]
Part
icle
s / m
3
Figure 48.6. Distribution of particles in air in final assembly area.
The main reason for generic packaging based fibres was found to be the cardboard boxes. These boxes were used to hold or enclose final products and some other similar boxes were also used with subassembly transportations. Typical fibres found in the area are shown in Figure 48.7. Some of the cardboard boxes were also foldable and had to be opened prior to use with an automated machine. This equipment generated significant amount of cardboard particles which were blown to the environment with a cooling fan. In addition, these cardboard boxes were manually slid on work surfaces between assembly phases which also generated small amount of particles per movement. Most of the particles broke away from the shear area of the packages.

326
Figure 48.7. Typical particles found in final assembly area.
The cumulative number of particles in high volume manufacturing is substantial even the number of particles peeling off per movement or work phase is small. Therefore, all process phases having repetitive operations with filaceous materials should be considered as a source of contaminants. If these processes are made locally, it should be also possible to prevent spreading of the contaminants. However, when the contamination sources are spread out evenly over assembly area major changes with work practices or with materials are required.
One other source of particles was found to be the plastic trays used to hold non-electrical subassemblies. These trays were made of dielectric plastics and generated easily over 10 000 V/m electrostatic fields when charged. Identified particles were not necessarily originating from the tray itself as the electrostatic field captures charged particles from environment. Trays were recycled due to cost and environmental reasons and are originally coming from material suppliers, and therefore, particle control should be extended to whole logistic network.
48.5 PREVENTION OF PARTICLE CONTAMINANTS
Most of the particle prevention activities in the facility under this study should be targeted to packaging material handling operations in the final assembly area. Packaging based particles were found both in PWB and in final assembly area, but more challenges can be expected with final assembly operations where
1000um

327
packages are mainly handled. Probability to have defects due to particle deposition is much lower with component assembly operations. Those final assembly phases producing particles should be separated from the processes having high requirements with cleanness, but this would often require major changes in process layout. Therefore, solutions that are more flexible are needed in high volume assembly environment.
Major part of over 10 µm particles could be prevented by reducing particles peeling off from cardboard boxes. Packages should have durable edges and solid surface to reduce particle peeling. In addition, package format should be modified so that shearing edges of the cardboard will not be subjected to rubbing during handling. Plastic based materials could be also used with those areas where particle prevention has more importance.
Some of the particle contaminants can be prevented by having better material cleanness control. Dielectric trays should be changed to dissipative and all trays should be cleaned between usages. This would prevent most of the particles in the process due to electrostatic attraction. Subassembly parts should be also packed and transported into the assembly area with materials not releasing particles.
Some of the final assembly operations had phases which increased probability of particle deposition onto the critical surfaces. One of these functions was LCD ionisation where compressed air with ions was used to clean the screen area. However, strong air flow blow also particles from the work surface into the air, thus increasing contamination of the product parts waiting for assembly. Therefore, also assembly operation modifications have to be used as a part of particle prevention. In this case, ionisation phase should be modified so that it will not disturb normal air flow in the area.
Control of air flow is one of the basic principles used with particle prevention. Some of the process equipment, such as component placement and enclosed PWB conveyors, could be modified to have overpressure inside and incoming air should be filtered. These modifications could be used with the most critical assembly phases. However, process layout may have particle sources and particle critical phases by turns, thus, preventing e.g. laminar flow principles. Product parts and packages will also move through these phases and release new particles within each phase. In addition, it is typically not possible to change

328
assembly order of the product, and therefore, laminar air flow or constant overpressure would require major changes with the line layout.
48.6 SUMMARY
Particle contaminants causing functional or visual defects with consumer electronics assembly operations were studied. Typical critical manufacturing processes to particle contaminants were found to be paste printing, Anisotropic Conductive Film (ACF) and Package on Package (PoP) assemblies. In addition, electrical and optical tests can be sensitive to contaminants depending on the size of the test pads and resolution of the screens, cameras or other optical parts. Particles having size more than 30 µm may cause direct failures with some of these processes, but even smaller particles may cause defects or decrease visual quality when the concentration of the particles is high. Critical concentration of particles depends on the products and processes, and therefore, case-specific decisions have to be made for each process.
Particle contaminants in high volume assembly processes were analysed with particle counters and tape sample measurements. Packaging materials and package handling processes were found to be the major source of particles due to cumulative amount of particles releasing from cardboard boxes. All other sources of particles, such as operators and facility, were in minority. Packaging originated contaminants are challenging to control due to major changes required with packages or handling practices. Air flow control is also challenging in high volume manufacturing as the process layout is designed from efficiency point of view. Particles could be prevented for example with more solid packaging materials or package designs. In addition, cleaning methods could be used, but the main target should be to prevent particle generation.
48.7 ACKNOWLEDGEMENTS
We would like to thank Dr. Jaakko Paasi, Dr. Matti Lehtimäki, Dr. Seppo Embom and Mr. Tapio Kalliohaka from VTT Industrial Systems and Mr. Erkki Rajala from NOKIA Corporation for their input to the work.

329
48.8 REFERENCES
1. Paasi, J. 2003. Management of Static Electricity and ESD in cleanroom production of electronics. 34th R3-Nordic Contamination Control Symposium, Turku: VTT Publication 229. Pp. 349362.
2. Chunyan, Y. & Hua, L., 2004. Effects of Solder Reflow on the Reliability of Flip-Chip on Flex Interconnections Using Anisotropic Conductive Adhesives. IEEE Transactions on Electronics Packaging Manufacturing, Vol. 27, NO 4, October 2004, pp. 254259.
3. Chowdhury, A. 2006. Camera Module Assembly and Test Challenges. http://www.reed-electronics.com/semiconductor/. February 1, 2006.
4. Pecht, M. 2002. Contamination of Electronic Assemblies. Series: Electronic Packaging Volume 7. University of Maryland, USA. 232 p.
5. Wilkie, R. 1994. Montague C. Counting on Cleanliness Measurement Technology. http://www.particle.com/whitepapers_met/iaq.pdf. Reprinted from Precision Cleaning magazine © 1994 Witter Publishing Co., Inc,
6. Annis, P. 1991. Fine Particle Pollution, Residential Air Quality. North Central Regional Publication 393: Kansas State University. P. 3.
7. Welker, R. & Nagarajan, R. 2006. Contamination and ESD Control in High Technology Manufacturing. Wiley-IEEE Press. 508 p. ISBN: 0-471-41452-2.

330
331
CHAPTER 49: ENABLING TECHNIQUES FOR CLEAN MANUFACTURING OF ELECTRONICS
Matti Lehtimäki VTT, Tampere, Finland
The rapid development of the manufacturing techniques in electronics industry has increased the need for the control against particulate contamination. Many of the new electronic devices contain sensitive parts which may become deteriorated by large particles. Therefore, several control measures successfully used in advanced industrial ventilation and clean room technology must be also be utilized in electronics industry. Essential efforts are the elimination of major contamination sources, the proper application of ventilation techniques, the control of static electricity, and the adoption of proper work practices.
49.1 INTRODUCTION
The manufacturing of electronic devices is normally not considered to be an activity which requires strict limits for the particulate contamination. This is due to fact that the dimensions of the critical parts are large and sensitive electronic components are encapsulated and are therefore not affected by contaminants. However, the rapid development of electronics manufacturing techniques has significantly changed the situation. The size of the electronic parts has decreased and more components are being integrated into very compact structures. In addition, the use of optoelectronics is rapidly increasing, e.g. modern mobile phones are equipped with cameras. Also, the electronic devices may include large high-resolution displays. Thus, the importance of contamination sensitive parts in electronic devices has increased.
Maybe the most acute contamination problem in the manufacturing of electronic devices is the deposition of very large particles or objects on critical surfaces of the electronic device, e.g. on the display of a mobile phone. Thus, the visible
332
particles cause appearance defects and lead to extra cleaning work and manufacturing costs. It is also reasonable to assume that in the future particulate contamination will cause even functional defaults when new joint techniques are adopted to the manufacturing processes.
The manufacturing of electronic devices is normally made in premises which have been designed to fulfil the conventional requirements for producing high quality electronic devices, e.g. possible problems due to ESD have been eliminated. However, all efforts to eliminate particulate contamination problems have not been made. On the other hand, the procedures of the modern clean room technology may be too heavy for the large-scale manufacturing of electronic devices. A typical feature of the contamination problems in electronics industry is the particle size. In the microelectronics industry, the main focus is in particles well below 1 µm while the problems in the manufacturing of electronic devices are caused predominantly by particles larger than 10 µm.
The elimination of contamination problems in clean production of electronics requires several efforts including feasible measurement techniques and proper application control measures such as elimination of particle sources, utilization of proper ventilation techniques, elimination of electrostatic charges etc. These techniques will be discussed in the following paragraphs.
49.2 MEASUREMENT
An important part of contamination control is the proper measurement technique. This is due to the fact that the major sources of large particles must be located and their contribution for the contamination problem must be known before the proper control measures can be applied.
The progress of modern clean room technology and microelectronics manufacturing has strongly contributed to the development of sensitive and handy instruments for the measurement of particle number concentrations and size distributions. Lot of efforts have made to produce optical particle counters to detect particles as small as 0.1 µm (and even less). Many of the instruments have been designed to measure particles in the range of 0.35 or 0.310 µm.

333
These instruments suit well for fine particles but their feasibility for particles above 10 µm is questionable. There are only few instruments which are provided with the size classification up to 20 or 25 µm. A crucial problem when measuring the concentration of large particles in the air is the controlled sampling of particles, i.e. how to collect and transport a representative particle sample to the sensor of the particle measuring device. Another practical problem is caused by the low number concentration of large particles. Thus, the sample air flows of the particle counters are too low to provide statistically reliable results within a reasonable sampling time.
Sample air flow
Major air flow
Minor air flow =OPC sample flow
Optical particlecounter OPC
Figure 49.1. Principle of the particle concentrator: combining virtual impactor with an optical particle counter.
To solve the sensitivity problem, a special approach for large particle measurement has been studied (Figure 49.1). In this system the effective sample air flow of an optical particle counter is increased with the aid of virtual impactor. Virtual impactor is used to concentrate large particles from the incoming major air flow into the minor air flow which is transported to the particle sensor. In this way, the effective sample air flow for large particles can be significantly increased and the reliability of the measurement result can be improved. The real-time measurement of large particle concentration is vitally

334
important for applying video exposure monitoring (VEM), i.e. technique which combines real-time particle measurement with video recording (Figure 49.2). This visualization technique is an effective tool for revealing potential causes of particulate contamination.
Figure 49.2. Principle of Visual Exposure Monitoring (VEM).
The particle number concentration is necessarily not the only relevant quantity which should be considered. The contamination is due to depositing particles, i.e. the contamination rate of a critical surface is a function of particle concentration and size. The most straightforward technique for producing relevant information about the particulate contamination is the measurement of particle flux on the critical surface. Unfortunately, handy monitors for real-time measurement of particle deposition are not yet available. Therefore, the use of witness plate technique is normally used for the measurement of contamination rate.

335
Besides witness plates, surface sampling techniques can also be used. A handy method for estimating the surface contamination is the tape sample analyzed with an optical microscope. The particle sample is extracted from the surface by pressing the adhesive side of the tape on the surface and removing the tape carefully for the microscope analysis. The advantage of this technique is the possibility to see the size, shape and colour of the particles, i.e. estimates about the particle source can be made. In addition, tape sample can be used for more detailed analysis, e.g. with electronic microscope.
49.3 PRIMARY TECHNIQUES SOURCE CONTROL
When struggling against contamination problems, the most important approach is the elimination of the contamination sources. Needless to say the effect of outdoor conditions should be eliminated with a ventilation system which provides proper air filtration and pressure control. The filtering of large particles is one of the easiest tasks but elimination of uncontrolled air flows e.g. through door openings requires more efforts.
All processes and work practices which may generate particles should be revealed and proper control techniques should be applied. In general, the most effective approach for reducing the effects particle sources is the local exhaust ventilation. A good example of utilization of local exhaust ventilation is routing, i.e. separation of printed wire boards. This is a process which generates huge amounts of large particles which are removed with an effective local exhaust system. Concerning many other particle sources, however, local exhaust ventilation is an option which is not always favoured because general ventilation is assumed to take care of all contaminants.
As known from the clean room technology, people may contribute significantly to the large particle emission. This fact must be taken into account especially in the assembly of electronic devices. The amount of manual work in the assembly may be significant, i.e. lot of workers are in close proximity with the sensitive electronic parts and therefore contamination from people may play a significant role. Besides particle emission from people, also the work practices and tools may strongly influence the contamination of critical surfaces. An important step to reduce the dust emission from people is the use of proper protective clothing.

336
A general feature of the manufacturing of electronic devices is the use of large amounts of components and parts from various suppliers. Thus, large amounts of materials are being transported into the manufacturing premises which enhance the probability of generating particles. The elimination of dust emission from material handling processes may be quite difficult. However, local exhaust ventilation should be utilized when ever possible. Also, the handling area of dust producing materials (e.g. cardboard) should be separated from the areas of most critical production.
49.4 SECONDARY TECHNIQUES
As mentioned above, the primary tool for contamination control is the elimination of particle sources. This can be accomplished by means of modifications in the manufacturing processes and practices, and by using effective local exhaust ventilation systems. The important secondary techniques which can be used to further reduce the contamination are proper ventilation techniques (Figure 49.3), working practices and elimination of static electricity.
Figure 49.3. Basic principles to minimize contamination.
The contamination problem in electronics industry is due to large particles which limits the feasibility of the general ventilation as a control tool. The behaviour of the large particles is governed by gravitational settling and therefore the life-time of these particles is quite short compared with the air residence time in the manufacturing premises. Thus, the contamination caused by large particles cannot be effectively controlled by general ventilation. On the other hand, local ventilation

337
techniques can be used to create controlled air flow patterns so that critical working areas can be protected from the particles originating from adjacent sources. Thus, the clean zone techniques which are widely used in clean room technology can also be utilized in the electronics industry.
The well-known fact is that the contamination rate is proportional to particle concentration and deposition velocity. Controlled air flows can be used to create clean air zones which reduce the concentration of particles in the critical working areas. Another approach for reducing contamination is to minimize the particle deposition velocity. Unfortunately, one of the major factors affecting particle deposition is gravitational settling which is practically impossible to affect. The only tool against gravitational settling is the positioning of the critical surfaces, i.e. vertical surface is not contaminated by particle settling. Particle deposition can also be caused by inertial force, i.e. large particle cannot follow the deflection of air streamlines near the critical object and impacts on the surface. Particle deposition due to inertial force is quite complicated in real manufacturing condition. This is due to the fact that deposition depends on the air velocity and turbulence, dimensions of the object, particle size and density, surface properties etc. Various deposition mechanisms are shown in Figure 49.4.
Diffusional deposition plays no role in the case of large particles but the deposition due to ESA (electrostatic attraction) may be highly important. The deposition due to ESA requires, however, that the critical surfaces carry strong electric charge. Then, the induced electric field can transport charged particles towards critical surface. It is worth noticing that an inhomogeneous electric field polarizes particles and makes them drift towards stronger electric field even though particles are uncharged. Avoiding contamination due to ESA requires efforts to minimize the charging of all critical surfaces. This can be accomplished by proper materials and/or ionizing devices.
+
ESASettling Inertia Diffuusion
DEPOSITION.VSD, 05.04.2006
- - - - - -
Figure 49.4. Deposition mechanisms.

338
In addition to the techniques discussed above, contamination control can be reduced with aid of cleaning techniques. This means that critical surfaces are visually inspected, and if necessary, cleaned e.g. with pressurized air. The cleaning is normally made with air guns which provide a jet of ionized air for particle removal. This technique removes effectively dry large objects from the surfaces. The cleaning work should, however, be made carefully to avoid mixing particles from the surrounding air into the air jet and dispersing particles from the dirty surfaces, clothing, etc.
49.5 SUMMARY
Clean production of electronics faces with similar problems as all other critical manufacturing processes. Thus, the earlier experiences from the development of clean room technology can be utilized also in electronics industry. Naturally, the well-known control techniques must be designed and dimensioned in such a way that they comply with the special requirements of electronics manufacturing.
49.6 REFERENCES
1. Tamminen, P. & Leskinen, J.-P. 2006. Particle contamination in electronics manufacturing. 37th R3-Nordic Contamination Control Symposium. Tampere, May 2931, 2006. VTT Symposium 240. Pp. 313329.
2. Säämänen, A., Heinonen, K. & Kalliohaka, T. 2006. Applying video exposure monitoring in clean production. 37th R3-Nordic Contamination Control Symposium, Tampere, May 2931, 2006. VTT Symposium 240. Pp. 375385.

339
CHAPTER 50: NEW ELECTROSTATIC DISSIPATIVE PLASTIC MATERIALS FOR CLEANROOM
APPLICATIONS
Antti Helminen & Peter Ristikangas Premix Oy, Rajamäki, Finland
A cleanroom is a hyper-clean environment achieved through the control of ventilation, filtration, temperature, humidity, and air pressure. Materials used in the room as well as ionization also contribute to the clean room conditions. Electrostatic charge generation (electrostatic discharge, ESD) control is essential in cleanrooms as ESD can reduce yield and disrupt automatic equipment. In addition, airborne particles are attracted to charged surfaces by electrostatic attraction (ESA) and this also needs to be overcome by proper ESD control. By choosing the right plastics materials this control can be easily achieved without causing additional contamination.
Plastics are often preferred materials because of their good processability, light weight and low price. Plastics as such exhibit typically very good insulative properties and behave as insulators. There are several ways of lowering the resistivity of the plastics, which include compounding with electrically conductive fillers or utilizing inherently conductive or dissipative polymers. Materials can be categorized according to their resistivity as shown in Figure 50.1.
Conductive compounds are prepared by melt processing conductive fillers such as carbon black, carbon fibres or metallic particles or fibres with thermoplastics. When the loading of the conductive filler in the compound reaches the percolation threshold, a conductive path throughout the plastic material is created. The volume resistivity of such compound is typically in the range of 1 to 106 Ω·cm. Conductive compounds can also be produced by using inherently conductive polymers (ICP) such as polyaniline. ICPs inherently exhibit high conductivity and are used as such in conductive inks and coatings. ICP blended with insulative polymer gives an electrically conductive or dissipative

340
compound in the resistivity range of 104109 Ω·cm. However, both ICP and conductive fillers have a disadvantage of creating either chemical or particulate emissions that can not be accepted in clean room environments.
Figure 50.1. Premix conductive and dissipative compounds cover a wide resistivity range.
Inherently dissipative polymers (IDP) are used in the manufacturing of static dissipative compounds. IDPs are typically block copolymers in which ions are responsible for charge transfer. IDPs serve as permanent antistats in polymer compound and inhibit the formation of electrical charges on the plastic material. The surface resistance of such compound is typically 1081011 Ω. For most applications it is more important to ensure the sufficiently low charge decay time (e.g. below 2 s) than to worry about the actual surface resistance level.
IDPs can be considered for clean room applications. The new electrostatic dissipative plastic materials have to have low non-volatile residue, low ionic contamination and low outgassing. In addition, no silicones or phthalates are allowed. Also the plastic parts should not generate dust under friction when handled. The plastic materials have to stand isopropyl alcohol (IPA) rinsing without losing favourable ESD properties. From the requirements mentioned above low ionic contamination is the most challenging as ions are added into the IDP in order to lower the resistance. Typically ionic content is analyzed with ion chromatography. Depending on the amount of ions added and the requirements set by the clean room environment, a suitable electrostatic dissipative plastic compound can be found.
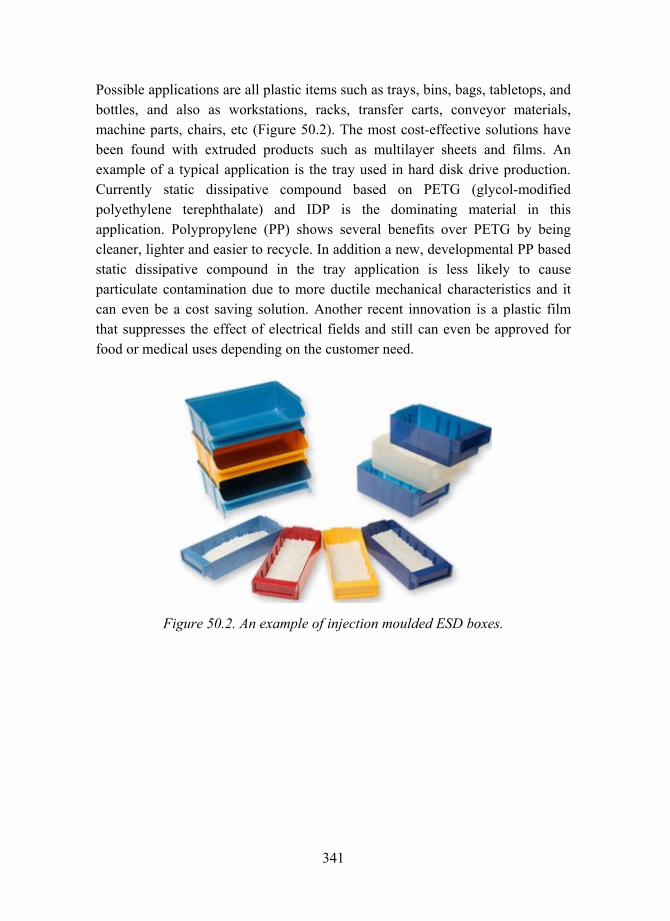
341
Possible applications are all plastic items such as trays, bins, bags, tabletops, and bottles, and also as workstations, racks, transfer carts, conveyor materials, machine parts, chairs, etc (Figure 50.2). The most cost-effective solutions have been found with extruded products such as multilayer sheets and films. An example of a typical application is the tray used in hard disk drive production. Currently static dissipative compound based on PETG (glycol-modified polyethylene terephthalate) and IDP is the dominating material in this application. Polypropylene (PP) shows several benefits over PETG by being cleaner, lighter and easier to recycle. In addition a new, developmental PP based static dissipative compound in the tray application is less likely to cause particulate contamination due to more ductile mechanical characteristics and it can even be a cost saving solution. Another recent innovation is a plastic film that suppresses the effect of electrical fields and still can even be approved for food or medical uses depending on the customer need.
Figure 50.2. An example of injection moulded ESD boxes.

342

343
CHAPTER 51: ESD PROTECTIVE REQUIREMENTS FOR CLEANROOM CLOTHING
Lars Fast & Jaakko Paasi* SP Electronics, Borås, Sweden
* VTT, Tampere, Finland
The European Commission, in connection with the Technical Committee No 101 Electrostatics of the International Electrotechnical Commission (IEC), issued in late 2000 a call for a research about new test methods and electrostatic requirements for electrostatic discharge (ESD) protective clothing (called ESD garments) used in the manufacturing of electronics. As a response to the call, a 3-years European research project Protective clothing for use in the manufacturing of electrostatic sensitive devices (ESTAT-Garments) was launched in early 2002, with the project partners: VTT (FI), SP (S), University of Genova (I), Centexbel (B), STFI (D), Nokia (FI), and Celestica (I).
In this paper we summarise the main results of the ESTAT-Garments project, confining us to ESD protective garments used in cleanrooms and clean manufacturing environments. We show why the cleanroom garments should have ESD protective properties, what methods that we recommend for the testing the ESD protective performance of cleanroom garments and finally, what the recommended test limits for these protective garments are. Furthermore, we discuss in which cases the conductive threads in the garment material should be surface conductive as well as in which cases core conductive threads, that is when the conductive fibres are embedded inside the thread, can safely be used.
51.1 INTRODUCTION
Electric charges on the clothing of operators are typically accumulated when the operator is moving around, i.e., by triboelectric effects (rubbing or separation of two materials). In electronics manufacturing environment specially designed protective

344
clothing is often used to minimise accumulation and retention of the charge. This clothing, called an ESD garment, is worn over the ordinary clothing of the operator. Thus it should also provide shielding against any surface voltages or voltage transients arising from underlying garments. In some cases the ESD garments are not used just to prevent ESD damage to electronics but also to prevent the electronics from being damaged by the contamination of dust particles (cleanroom clothing).
Present standards for the evaluation of the ESD garments protective performance [1, 2] are mainly based on the results of researches performed in the 70's80s with garments having electrostatically homogeneous surfaces. The protective clothing was typically either a pure cotton or cotton-mixture garment which could have been topically treated by hygroscopic agents; see Figure 51.1 (a) top row. Since then, the electronics industry has been demanding increasing performance from the ESD protective clothing. At the same time there has been much progress in the textile industry. As a result the ESD-garments in use today are made of composite fabrics where a grid or stripes of conductive threads are present inside a matrix of cotton, polyester or mixtures of these materials; see Figure 51.1 (a) bottom row. Furthermore, the conductive threads are more and more frequently made by composites, i.e. by a mixture of conductive and insulating fibres (core conductive fibres, sandwich type fibres (also called hybrid conducting fibres) etc.), see Figure 51.1 (b). All the latter elements lead to very heterogeneous fabrics for garments.
While the presently available standard test methods for garments used in electronics industry [1, 2] have been developed for homogeneous materials, they do not allow a proper characterisation of the modern garments performances [3, 4]. Furthermore, it is not certain that they indicate how much the garments will protect the electronics from ESD. Therefore, the European Commission, in connection with the Technical Committee No 101 Electrostatics of the International Electrotechnical Commission (IEC), issued a call for a research about new test methods for ESD garments which led to the ESTAT-Garments project (20022005).
In this paper we summarize the main results of the ESTAT-Garments project, confining us to ESD protective garments used in cleanrooms and clean manufacturing environments. The main results of the project have been published in full in three research reports [57] where we refer for more details.

345
In Chapter 51.2 we give arguments why cleanroom garments should have ESD protective properties. A good ESD garment is defined in Chapter 51.3. The ESTAT-Garments recommendations for the testing the ESD protective performance of cleanroom garments is given in Chapter 51.4. Recommended test limits for these garments are given in Chapter 51.5. Finally, our concluding remarks are presented in Chapter 51.6. Note, the requirements and recommendations of this paper may not be relevant for those cleanroom garments used outside the EPA (ESD protected area).
Figure 51.1. (a) Structures of electrostatically homogeneous and heterogeneous textiles; (b) Structures of some commonly used conductive fibres.
51.2 WHY CLEANROOM GARMENTS SHOULD HAVE ESD PROTECTIVE PROPERTIES?
From the electrostatic standpoint, clothing used in cleanrooms should have two protective functions:
− to minimise risks of ESD failures on sensitive devices. − to minimise contamination by electrostatic attraction (ESA) of particles.

346
Either of the functions can be of primary importance, depending on case. An ESD failure caused by charged clothing can, in practice, happen in two different ways:
− by discharge from a charged device, − by a direct discharge to a device.
The main source of ESD risk with reference to clothing may occur where an electrostatic discharge sensitive device (ESDS) can reach a high induced voltage, due to external fields from charged clothing, and subsequently experience a field induced, charged device model (CDM) [1], type discharge. The risk threshold is reached when the charge induced on the device, approaches the device CDM withstand voltage level. Also an entire Printed Wiring Board (PWB) may become charged due to charged clothing giving rise to a risk of Charged Board Model (CBM) ESD. A PWB conductor can have much higher capacitance than a single device and can therefore store much more charge than a device. Depending on the board circuits, this could mean an increased ESD risk for sensitive devices.
ESD risks due to induction charging of ESDS or PWB assemblies, in the vicinity of operators, and subsequent CDM ESD, are strongly influenced by electrostatic fields external to the garments. This external field depends on:
− chargeability of the outer clothing,
− ability of charge dissipation of the clothing,
− ability of the outer clothing to shield static electric fields from normal clothing under the outer garment,
− suppression of field external to the garment by coupling to grounded body or conductive threads of garment.
All the four factors are strongly dependent on the fabric material of garment, garment design, humidity, grounding of the person as well as the garment, etc. The triboelectric chargeability of the clothing depends strongly on the material of the clothing as well as the humidity of the environment. Normal clothing with synthetic fibres, such as polyester, can easily be charged to several kV (even to over 20 kV) by triboelectric effects. In Figure 51.2 we show an example of how normal clothing with synthetic fibres can charge an electronic device by induction, to a level of 1500 V. This is a dangerous potential for many state-of-the-art devices

347
(in the experiment a 2-pF dummy device was scanned near the surface of an inhabited garment over a grounded operator, see [8] for more details).
Figure 51.2. Induced potential on a 2 pF dummy device that is moved over an inhabited non-ESD garment along with four different tracks after tribo-charging of the garment.
The second category of ESD risks with reference to clothing is related to direct discharges from charged clothing into a victim device. Direct discharges from charged clothing into an ESDS are related to insulating surfaces of large area (well over 20 mm x 20 mm) or improperly or completely unearthed conductive garment elements, such as (surface) conductive threads or large press studs. Garment characteristics should be chosen so that neither of these possibilities can give significant ESD damage risk. The highest peak discharge current we have measured from an inhabited normal clothing surface, charged to only about 700 V, was 0.8 A, that may expose ESDS with standard Human Body Model (HBM) [1] withstand voltage of less than 2 kV to a great risk of damage.
From the contamination prevention standpoint, the garment (cleanroom clothing) must have electrostatic field preventative properties in order to minimise contamination by electrostatic attraction (ESA) of particles. For cleanroom clothing, chargeability of the garment fabric (surface potential) is the main electrostatic parameter to control. Other electrostatic properties important for ESD garments may be of negligible importance. That should have influence to the requirements set for ESD protective clothing used for contamination control.

348
51.3 WHAT IS A GOOD ESD GARMENT?
An ESD protective garment should ideally have the following functions:
• The protective garment should effectively shield the electric field originating from the insulating parts of the operators normal clothing.
• The protective garment should prevent direct discharges from the normal clothing of the operator.
• The protective garment should not itself cause similar problems, i.e., it should not cause an electrostatic field external to the garment and it should not constitute a potential source of direct electrostatic discharges.
In practice these targets may not always be met.
Requirements for the ESD protective clothing in electronics industry are very diverse. Some manufacturers, handling very ESD sensitive devices, require high ESD protective performance for the outer garments of their production personnel, while other manufacturers would be satisfied with a much lower ESD protective performance. In cleanroom manufacturing, the ESD garments also play other important roles such as protection of electronics from contamination (dust) particles originating from the operator (cleanroom clothing). Then the major electrostatic function of the garment could be to reduce electrostatic attraction (ESA) instead of minimising ESD failures. The diverse requirements for ESD garments have lead to diverse structures of the ESD garments. This makes it challenging to practically define a good ESD garment.
The diverse needs for the protective performance of ESD garments have led us to propose classification of ESD garments according to the ESD protective performance they provide. Two classes of ESD garments are proposed, Table 51.1. Electrostatic requirements (limits of acceptance) for the Class A and Class B garments would be connected to test methods. These methods and limits will be discussed and given in the next chapters.
Cleanroom garments made of fabrics with surface conductive fibres are of Class A and must be effectively grounded in use. Garments with core conductive fibres cannot be adequately grounded due to the buried conductive elements and can never be considered as electrically continuous at dry conditions. We cannot, however,

349
conclude anything from this itself about their potential value in ESD protective garments. Cleanroom garments with core conductive fibres are of Class B.
Table 51.1. ESTAT-Garment proposal for the classification of ESD garments.
Class A ♦ Class A garments must be grounded in use. ♦ Class A garments are electrically continuous, low-charging1 and either static
dissipative or conductive. ♦ Class A garments are recommended for the handling of very ESD sensitive devices. Class B ♦ Class B garments are recommended, but not required to be grounded in use. ♦ Class B garments are low-charging1, and need not have measurable electrical
continuity. 1 Low charging material is a material with low tendency for charge separation by contact or by rubbing against other materials
Comments to Table 51.1:
− The person who wears the clothing must be grounded both with Class A and Class B garments.
− Class B garments are suitable for cases where the primary function of ESD garments is in the contamination control (cleanroom usage) and ESD protection is of secondary importance.
− A cleanroom garment should be of Class A when high ESD protective performance is of primary priority, otherwise it can be of Class B.
− The requirements and recommendations of this paper may not be relevant for those cleanroom garments used outside the EPA (ESD protected area), if ESA is not an important issue.
51.4 RECOMMENDATIONS FOR THE TEST OF ESD GARMENTS
The diverse requirements for the ESD garments as well as the diverse structure of the garments give a great challenge for the test methods characterising the protective performance of the clothing and for the recommendations for the performance of these garments. In practice, there is a need for different types and levels of tests [4]:

350
1. Evaluation test(s) for new products to enter the market, which should be done in laboratories under controlled conditions.
2. Approval test(s) for first article or incoming material to determine if the measured values or other requirement specified by the inspection order are within limits.
3. Periodic field/audit test(s) done for garments already in use, which test(s) would be done in production sites or in laundries after washing.
Furthermore, while the end-users of garments are interested in garment tests, manufacturers of protective garments as well as garment fabrics do need also fabric level tests in order to be able to produce garments fulfilling the end-user needs.
To fulfil the needs with a minimum number of test methods to cover all really important aspects of ESD protection at each level of testing, the ESTAT-Garments project concluded with the test methods given in Table 51.2 for the evaluation testing of new product to enter the markets, in Table 51.3 for the approval testing for the first article or incoming material, and in Table 51.4 for the periodic testing.
Evaluation test of new products to enter markets should cover all important aspects of ESD protective performance. It should be done in controlled environment, preferably at 12% RH, 23°C for washed garments and fabrics. The tests should include methods focusing both on garment properties, including workmanship (connections between sleeve-torso-sleeve), and fabric properties of which the chargeability and electrostatic screening are the most important. EN 1149-3 methods [9] cover the fabric property testing. Garment level study could be done either by the point-to-point resistance [1, 2] or by the ESTAT-Garments garment level charge decay test method (NT Method Elec 037 [10], which is actually an improved version of the old SP-Method 2175). Both test methods provide specific standpoints but, because of the strong overlap of properties they focus to, we do not feel it necessary to carry out both tests. Due to the diverse needs of electronics industry, we are recommending the methods as alternatives. Finally, if the ESD risks of direct discharges due to improperly functioning or used garment (garment where all panels are not grounded) would like to be assessed, the ESTAT-Garments direct ESD test would be a method for that (NT Method Elec 036 [11]).

351
Table 51.2. ESTAT-Garments recommendations for the evaluation test of new products to enter markets.
Evaluation tests Valid for both Class A and Class B garments:
Required tests ♦ IEC 61340-5-1 / ESD STM 2.1 point-to-point resistance test method or alternatively,
NT Method Elec 037 "Measurement of the charge decay time of ESD-protective garment"
♦ EN 1149-3 Method 1 (tribocharging) for fabric level chargeability test ♦ EN 1149-3 Method 2 (induction charging) for the electrostatic shielding test
Optional test ♦ NT Method Elec 036 "Measurement of a direct discharge from an ESD protective
material, such as an ESD garment/fabric"
Approval test will be done for garment types which have already passed the evaluation tests when entering the markets. Therefore, approval test does not have to cover all parameters of interest influencing the ESD protective performance of garment. Instead, the approval test should focus to workmanship. For Class A garments it is particularly important to verify whether all panels of garment are sufficiently well connected to ground. This can be done by the point-to-point resistance test method or, alternatively, by the ESTAT-Garments garment level charge decay test method. Class B garments do not have to be grounded in use. Therefore the point-to-point resistance test is not relevant for them. In order to have a link between the evaluation and approval tests, we are proposing to the electrostatic shielding test of EN 1149-3 (Method 2) for Class B garments at approval testing. It is focusing to an important parameter to control, and it is easy to perform. The electrostatic shielding test of EN 1149-3 is useful also for Class A garments in the approval testing. There is no special need to carry out the approval test at controlled dry humidity conditions. The test can be done in the true climate of EPA in question, taking into account the lowest possible humidity in the EPA.

352
Table 51.3. ESTAT-Garments recommendations for the approval test for the first article or incoming material.
Approval test
Required test for Class A garments ♦ IEC 61340-5-1 / ESD STM 2.1 point-to-point resistance test method or alternatively,
NT Method Elec 037 "Measurement of the charge decay time of ESD-protective garment"
Required test for Class B garments ♦ EN 1149-3 Method 2 (induction charging)
Optional test for Class A garments ♦ EN 1149-3 Method 2 (induction charging)
Table 51.4. ESTAT-Garments recommendations for periodic test
Periodic test
Required only for Class A garments ♦ IEC 61340-5-1 / ESD STM 2.1 point-to-point resistance test method or alternatively,
NT Method Elec 037 "Measurement of the charge decay time of ESD-protective garment"
Periodic test is to verify that the ESD garment still has a desired ESD protection. Periodic testing would be necessary only for Class A garments, because they are sensitive both to washing and to wear and tear. Washing has a tendency to rip seams. Also wear and tear, giving rise to broken conductive fibres, predominantly affects to the grounding performance of the garment, which is important only for Class A garments. The ESD protective performance of core conductive Class B garments should only improve in use because broken fibres increase garment's ability for the self-dissipation of charge through the corona mechanism [12]. The point-to-point resistance test or, alternatively, the ESTAT-Garments garment level charge decay tests are the recommended methods for periodic testing of Class A garments. While the point-to-point test may be more suitable for laundries, the charge decay test does have a potential for a quick garment test when entering EPA if suitable equipment (simple automatic testers) will become available.

353
51.5 RECOMMENDATIONS FOR THE LIMITS
The ESTAT-Garments recommendations for the required limits for the acceptance of Class A and Class B garments are given in Table 51.5. The upper resistance limit of the point-to-point test method is set to 1 x 10¹⁰ Ω in order allow sufficiently fast migration of charge to ground to protect ESDS having HBM withstand of 100 V. The 20 s limit of the garment level charge decay test corresponds to the 1 x 10¹⁰ Ω resistance-to-ground of garment. Although a lower limit of point-to-point resistance is not given, we would like to mention that setting the lower limit to 1 x 10⁵ Ω would give further redundancy for the protection against direct ESD risks. In the case where the grounding of a garment panel fails for one reason or another and the garment becomes charged, discharge current could be dissipated already within the garment to a safe level if the surface resistance of the garment is in the range for static dissipative materials (i.e. the lower limit ≥ 1 x 10⁵ Ω).
The limits for the chargeability test method come from the general EPA requirements. The IEC 61340-5-2 says that the electrostatic field at the position of ESDS should not exceed 10 kV/m [13]. ANSI/ESD S20.20 says that all process essential insulators that have surface potential that exceed 2000 V should be kept at a minimum distance of 30 cm from ESDS items [14]. These general EPA requirements can both be applied to clothing used inside EPA. The 500 V surface potential limit is based on the supposition that in typical handling of ESDS the minimum distance between an ESDS and garment is about 5 cm, supposing that the sleeves of the garment fit well. Thus the 10 kV/m electrostatic field limit would be satisfied. For Class B garments a higher surface potential could be allowed because the principal electrostatic function of Class B garments is not in the safe handling of ESDS but in the contamination prevention. Therefore, the 2000 V EPA potential limit gives a relevant limit of chargeability for Class B garments.
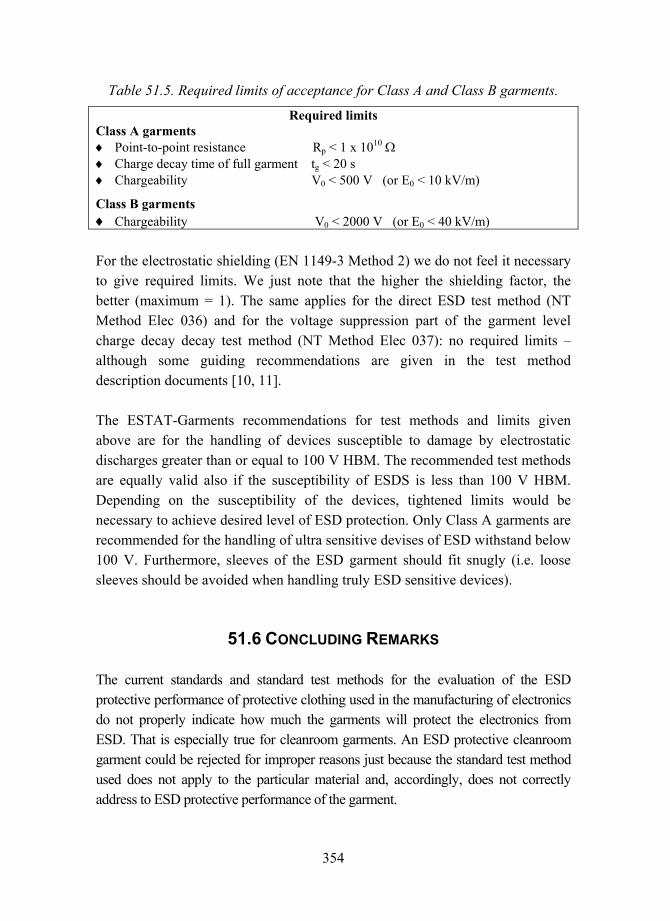
354
Table 51.5. Required limits of acceptance for Class A and Class B garments.
Required limits Class A garments ♦ Point-to-point resistance Rp < 1 x 10¹⁰ Ω ♦ Charge decay time of full garment tg < 20 s ♦ Chargeability V0 < 500 V (or E0 < 10 kV/m)
Class B garments ♦ Chargeability V0 < 2000 V (or E0 < 40 kV/m)
For the electrostatic shielding (EN 1149-3 Method 2) we do not feel it necessary to give required limits. We just note that the higher the shielding factor, the better (maximum = 1). The same applies for the direct ESD test method (NT Method Elec 036) and for the voltage suppression part of the garment level charge decay decay test method (NT Method Elec 037): no required limits although some guiding recommendations are given in the test method description documents [10, 11].
The ESTAT-Garments recommendations for test methods and limits given above are for the handling of devices susceptible to damage by electrostatic discharges greater than or equal to 100 V HBM. The recommended test methods are equally valid also if the susceptibility of ESDS is less than 100 V HBM. Depending on the susceptibility of the devices, tightened limits would be necessary to achieve desired level of ESD protection. Only Class A garments are recommended for the handling of ultra sensitive devises of ESD withstand below 100 V. Furthermore, sleeves of the ESD garment should fit snugly (i.e. loose sleeves should be avoided when handling truly ESD sensitive devices).
51.6 CONCLUDING REMARKS
The current standards and standard test methods for the evaluation of the ESD protective performance of protective clothing used in the manufacturing of electronics do not properly indicate how much the garments will protect the electronics from ESD. That is especially true for cleanroom garments. An ESD protective cleanroom garment could be rejected for improper reasons just because the standard test method used does not apply to the particular material and, accordingly, does not correctly address to ESD protective performance of the garment.

355
The ESTAT-Garments project has brought a wealth of new information and data to electronics manufacturers (end-users of the garments) as well as to experts involved in standardization of garments test methods, development and manufacturing of ESD garments, etc. In a short term, however, it is foreseen that the problems in the testing and validation of cleanroom garments according to standard test methods and requirements will remain: the next versions of neither IEC 61340-5-1 nor ANSI/ESD S20.20 system garments standards may not include the special aspects of cleanroom clothing in a satisfactory way. In a long term, the situation could be different. So far we hope that the results of the ESTAT-Garments project would help manufacturers of electronics and cleanroom garments to find good solutions for ESD protection in cleanroom manufacturing of electronics using ESD protective clothing.
51.7 ACKNOWLEDGEMENTS
The authors thank other members of the ESTAT-Garments Project Management Group Philippe Lemaire (Centexbel), Christian Vogel (STFI), Gianfranco Coletti (University of Genova), Terttu Peltoniemi (Nokia) and Giuseppe Reina (Celestica) for their contribution to the work. The work was supported in part by the European Commission (contract No G6RD-CT-2001-00615) and by the Nordic Innovation Centre (Nordtest project No 1609-02). One of the authors, Lars Fast (SP), is grateful to Fristads Sweden AB, part of the Kwintet Group, for there support and involvement during the project.
51.8 REFERENCES
1. Standard IEC 61340-5-1: Protection of electronic devices from electrostatic phenomena General requirements. 1998.
2. Standard ESD STM2.1: ESD association standard test method for the protection of electrostatic discharge susceptible items Garments. 1997.
3. M.J. Dyer. The antistatic performance of cleanroom clothing: Do tests on the fabric relate to the performance of the garment within the cleanroom. Proc. EOS/ESD Symp. Vol. EOS-19, 1997. Pp 276286.
356
4. G. Baumgartner. Consideration for developing ESD garment specifications, Report ESD TR 05-00, ESD Association, Rome (NY). 2000.
5. J. Paasi, T. Kalliohaka, T. Luoma, M. Soininen, H. Salmela, S. Nurmi, G. Coletti, F. Guastavino, L. Fast, A. Nilsson, P. Lemaire, J. Laperre, C. Vogel, J. Haase, T. Peltoniemi, T. Viheriäkoski, G. Reina, J. Smallwood & A. Börjesson. Evaluation of existing test methods for ESD garments, VTT Research report No. BTUO45-041224, Tampere, 2004. 57 p.
6. J. Paasi, L. Fast, P. Lemaire, C. Vogel, T. Viheriäkoski, G. Reina, J. Chubb, P. Holdstock & P. Heikkilä. ESTAT-Garments Interlaboratory tests, VTT Research report No. BTUO45-051337, Tampere, 2005. 40 p.
7. J. Paasi, L. Fast, P. Lemaire, C. Vogel, G. Coletti, T. Peltoniemi, G. Reina, J. Smallwood & A. Börjesson. Recommendations for the use and test of ESD protective garments in electronics industry, VTT Research report No. BTUO45-051338, Tampere, 2005. 31 p.
8. J. Paasi, T. Kalliohaka, L. Fast, J. Smallwood, A. Börjesson, J. Haase, C. Vogel, P. Lemaire, G. Coletti, F. Guastavino, T. Peltoniemi & G. Reina. Risks of Damage to Electronics with Reference to Charged Clothing. J. Electrostatics Vol. 63 (2005) pp. 603608.
9. Standard EN 1149-3: Protective clothing Electrostatic properties Part 3: Test methods for measurement of charge decay. 2004.
10. NICe: NT method Elec 037 Measurement of the charge decay time of ESD-protective garments. 2005.
11. NICe: NT method Elec 036 Measurement of a direct discharge from an ESD protective material, such as an ESD garment/fabric, 2005.
12. T. Kalliohaka, J. Paasi & P. Lemaire. Forced corona method for the evaluation of fabrics with conductive fibres, J. Electrostatics Vol. 63 (2005), pp. 583588.
13. Technical Specification IEC 61340-5-2: Protection of electronic devices from electrostatic phenomena User guide. 1999.
14. ANSI/ESD S20.20: Protection of electrical and electronic parts, assemblies and equipment (excluding electrically explosive initiated devices). 1999.
357
CHAPTER 52: EXAMPLE CASE OF CLEAN MANUFACTURING OF MICROELECTRONICS VTI
Marianne Pulkkinen VTI Technologies Oy, Vantaa, Finland
VTI wants to be the forerunner in measuring the Human Scale Motion and Pressure Acceleration, angular rate, inclination, pressure are the physical parameters The human scale for these parameters means the value range which a human being in normal conditions causes or experiences and which he feels is normal, safe and/or pleasant and appropriate.
− MEMS Design capabilities − Sensing elements − Electronics and ASICs − Packaging − Application specific sensor systems − 130 persons in R&D − Good co-operation with MEMS research
institutions − Investment in R&D close to 17% of sales

358
In the beginning of the company's history, ESD and such physical phenomena were not considered to have strong affect on our mechanical device. Devices at that time were bigger and thus more robust. Due the demand to produce smaller devices new generations of devices were designed. In the pre production phase during the validation tests several severe failures in the devices were discovered. The reason for the failures was unknown since all devices were tested to be working devices before they were selected to the tests. All production process steps and test procedures were viewed. Finally the normal manual handling of the devices was found out to be the reason for breaking the devices.
Wrong material selection and working instruments caused 15 kV charges by the manual handling station. Soon after this discovery first ESD-audit was performed. Complete risk analysis was done according to the foundations in the ESD-audit. VTI decided to start a project to beat the ESD related unwanted effects.
Project group was put up from several different professionals from different fields. Project leader was working in the QA laboratory. He was also trained to make the audits. Material assistant, micro electronics process engineer, production maintenance engineer, test engineer and production quality engineer were selected for the project resources. The whole group was trained to do the ESD measurements by being participants in the internal ESD audits.
According to the risk analysis a pilot project was designed to minimize the ESD risk in one production area. The biggest question was the production area flooring which was not properly grounded. To change the whole flooring to a grounded one would cost a considerable amount of money not to mention the risk produced for the production. Project group decided to make less expensive changes and evaluate whether the ESD risk was reduced on a appropriate level < 100 V without flooring change. Every change was evaluated and measured. All posts were grounded, all charging materials were replaced with ESD compatible materials and operators were grounded via shoes and ESD bracelet.
Material handling and flows were redesigned. A pilot group of operators were trained to give some common understanding on the phenomena. Material handling and flows were gone through at the posts in order to make everyone to understand one's possibilities to effect on the phenomena. This pilot group of operators handled part of the production the "safe way". Other part of the

359
production was handled as in the past. This was also a way to collect data of the impact of the done changes to the yield.
The effect of the ESD work on the mass product yield was not obvious. The product yield was not statistically changed. But deviation on some parameters was cut down 30%, which could also been statistically shown. With new products the impact on yield was tremendous. When the yield of product manual handling before the change was 10% it was after the change 100%.
Even though ESD safe handling and material flow was little bit more difficult than normal handling and flow no specific human resistance for the change was observed. On the contrary when the effect on the production was realized, the most common question was regarding the schedule to extend the safe handling, grounding and ESD safe materials to cover the whole production.
REFERENCES
1. ISO 14644-2. 2000. Cleanrooms and associated controlled environments Part 2: Specifications for testing and monitoring to prove continued complience with ISO 14644-1. CEN-European Commission for standardization.
2. ANSI/ESD 20:20-1999. Protection of Electrical and Electronic Parts, Assemblies and Equipment (Excluding Electrically Initiated Explosive Devices).
3. ANSI/ESD STM5.1-2001 Electrostatic Discharge Sensitivity TestingHuman Body Model (HBM) Component Level.
4. ANSI/ESD STM5.2-1999 Electrostatic Discharge Sensitivity TestingMachine Model (MM) Component Level.
5. Wallash, A. & Larry Levit, L. 2003. Electrical breakdown and ESD phenomena for devices with nanometer-to-micron gaps.

360

361
MONITORING SESSION


363
CHAPTER 53: BASICS OF CLEANROOM FUNCTIONS WITH EMPHASIS ON MONITORING
Hans Cederqvist CRT Oy, Tampere, Finland
53.1 THE CLEAN ROOM FUNCTION
This paper consist modified Clean Room Standards with some additional comments. Clean rooms are normally divided according to needs, into two main groups: a) Bacteria free rooms (sterile rooms) according t oGMP-standards and FDA-regulations where the particle size is between 0.30.5 µm and environment with positive or negative pressure, and b) Particle free rooms (clean rooms) according toFed Std and ISO-standards where the particle size is between 0.10.3 µm and with environment with positive pressure. Important issues to take into consideration are:
− standardization of equipment, − facilities, and associated controlled environments, − operational methods for cleanrooms, − includes procedural limits, − operational limits and testing procedures to achieve, − desired attributes, − to minimize micro contamination, − topics of interest are non-viable particles, − viable particles, surface cleanliness, room, − temperature and humidity profiles, − airflow patterns and velocities, − room vibration profiles, − room light levels, − room infiltration leakage, − personnel procedures, personnel cleanroom, − clothing, − equipment preparation, and any other topics, − related to optimizing cleanroom operations.

364
53.2 ISO 14644 CLEANROOM STANDARDS
When new plane to build a cleanroom is realty the best guideline available is the Clean Room ISO 14644 1-4 standards. This paper handles partly the ISO 14644-1.2 and 3. consisting the air cleanliness and testing methods and monitoring in. Published standards on cleanrooms and associated controlled environments:
− ISO 14644-1:1999 Classification of air cleanliness
− ISO 14644-2:2000 Specifications for to prove continued compliance with ISO 14644-1
− ISO 14644-3:2005 Test methods
− ISO 14644-4:2005 Design, construction and start-up
− ISO 14644-5:2005 Operations
− ISO 14644-7:2005 Separative devices (cleanair hoods, glove boxes, isolators, minienvironments)
− ISO 14698-1:2003 Biocontamination control Part 1: General
− principles and methods
− ISO 14698-2:2003 Biocontamination control Part 2: Evaluation and & Cor 1:2004 interpretation of biocontamination
53.3 PROJECT MANAGEMENT
Cleanroom Software Engineering needs to cover the design methodology, covering the planning, process and needs.
− Special requirements and how to get problem solved − Standards and regulations Fed.Std.209E Classes or Metric, or ISO-
14644-1/4 and GMP/FDA ISO/5A − Training − Function control: air handling, air flows, software, solve new problems − Trial drive − Manufacturing and product check − Function control and production.

365
The project management must be strictly guided. The room construction and layout must be taken into careful consideration. Enough space around the facility for ducts for; make up air, re-circulating air, normal exhaust air, process exhaust air, media-lines for gas and fluids. Pumps, coolers etc., raw material-, half-ready, testing store and calibration area, final checking and packing must carefully be considered. Afterwards it may be impossible or very costly for new installations when the clean room is in operation. If the room function do not satisfy the needs the planed results will be difficult to reach. Cleanroom build up groups and committees must be founded. When choosing the right air handling one must know how and what must be protected and which the environmental needs are. The tasks are:
− Who has the time to planning, planning comity? − Should the specialist be from house or be a consultants? − Construction- and building groups − Quality checks and control responsible, group? − Environment responsible for working and operational conditions? − Safety − Economical aspects.
53.4 HORIZONTAL PUSH PULL VENTILATION
When the room height is not high enough for air handling ventilation ducts the Push-Pull ventilation is the only option when HEPA-filtered. Laminar Air Flow AF is ´shown in Figure 53.1. A system on lertical air flow VAF in cleanrooms is shown in Figure 53.2.

366
Figure 53.1. Push-Pull ventilation.
Figure 53.2. The VAF princip.
When production demands a higher protection ´Cleaner Particle Free Area. Easiest way to solve this is with flexible tubes from main duct to the Filter unit FU. The position of the FUs are easily adjusted to their right place (Figure 53.3).

367
53.5 CLEAN ROOM MONITORING TESTING & CONTROL OF INSTRUMENTATION
Are used in highly controlled environments such as semiconductor clean rooms Life Science and Food industry hygiene and environments where control and toxic hazard protection is necessarily. The HVAC machinery is critical for the system. It has to have an accurate performance. In that environment the safety of the operators and the products has always to be taken in consideration. To be able to fulfill this requirement which meets the industry performance standards may be expensive and a difficult task. Precision measurement testing includes: Ventilation (airflow and right pressure checks, particle testing and counting), Air balancing and measuring (air and gas flows), Certification Control of HVAC systems, COSHH (Control of Substances Hazardous to Health) regulations, Monitoring of ventilation and control for different products, QA checks i.e. verifying accuracy of installed gauges, Experiment to be performed in real time and adjustments online, Airflows and particle counting in ductwork and Determination of leaks around doors and windows.

368
Figure 53.3. VAF flexible tubes from main duct to the Filter plenum (up), VAF permanent stainless steel ducts deliver the air to Filter plenum (middle) and VAF over pressure plenum supply the air to the Filter plenum (down).

369
53.6 INSTRUMENTATION FOR CLEAN ROOM CONTAMINATION CONTROL
A clean room can be defined as a strictly controlled environment of the purest kind. During the technology boom, the semiconductor and HDD industries were the biggest users of clean rooms. However, as the world of science rapidly progresses, the demand for cleanrooms especially in the biotech and pharmaceutical markets have become noticeably strong.
The technology and dedication have to be possible to reliably meet the specifications to accurate measurements in the semiconductor and HDD industries, biotechnology, nanotechnology, pharmaceutical, medical device assembly, hospital, surgery room, food and beverage industries and research. There are measurements to cover ranges whatever your end applications may be. Examples in which measurement are typically used:
− Clean room monitoring − Facility certification − Trend analysis (continuous and spot) − Process control analysis − SMIF and FIMS enclosures monitoring.
The following instruments are recommendable for cleanrooms: − Handheld Anemometers: Rotating Vane Anemometers − Multi-channel Anemometers: Multi-channel anemometer − Ultrasonic Anemometers: Ultrasonic meters − Handheld Laser Particle Counters: Laser counters handheld − Condensation Nucleus Counters (CNC): Condensation Counters − Laser Particle Sensors: Different types of Laser counters − Cleanroom Monitoring System (CRMS): Different types of Laser counters − DOP Photometers and generators: Different types of fraction light counters.
53.7 FILTER FACE VELOCITY MEASUREMENT IN CLEANROOM STUDIES AND IAQ INVESTIGATIONS
The measurement has to be suitable for single probe for air velocity and temperature simultaneously. It makes your data collection easy if the unit has a

370
built-in memory, which allows you to store measurement data. With a visible LCD capability of displaying air velocity and temperature simultaneously gives the real time data with RS232 and Analog outputs available are necessarily. Data should be reviewed on-screen, printed and be possible to download to a computer. The probes should be possible to change depending to various applications.
53.7.1 Hydro- and Thermometer Anemometer
The Anemometer (Figure 53.4) is a versatile instrument for measuring air velocity, temperature, and relative humidity and is a must for anyone in the clean room check, ventilation and air conditioning industry. The Anemometer should be provided with switch table velocity between (FPM) and Meters/Second (MPS). The temperature should be switch table between °F or °C. Due to the sensitivity the readings variety a lot and a it is preferable with a hold/reset button to frozen the recording readings. A average, min. / maximum readings are also preferable.
Figure 53.4. Hydro- and thermometer anemometer.
53.7.2 Multi-Function Thermal Anemometer
The anemometer should be an accurate handheld hot-wire with detachable probe compatibility. The flow-measuring possibilities with automatic Flow rate calculation functions should be included in the features. To ease the data documentation the anemometer should be able to collect data and log this

371
through RS232C plug to PC and printer. The memory stor size has to be large enough, sugestion is at least 1500 measurement data. Differential Pressure has also to be logged and measured. The accuracy should be at least +/-2%. It is to prefer if there is one main unite with several different probes to make it possible to measure the flow rate in the different channel sizes. The collected software data should be easy to reach instantly via rs232c. A multi- function thermal anemometer is shown in Figure 53.5.
Figure 53.5. Multi- function thermal anemometer.
53.7.3 Hand-Held Laser Particle Counter
Hand-held laser particle counter (Figure 53.6) is used when measuring: indoor air quality, investigation aerosol, research filters, tests, environmental monitoring, for electronics, food processing, pharmaceutical, medical / hospital in cases where 0.3, 0.5 and 5 µm sized particles are whished to be monitored. Where high concentration ranges up to 100 000 /cm3 the small handhold counter is most suitable. The counter should be able to store data and is simple to download to computer via the USB. Check that the unit is delivered with its own rechargeable power supply.

372
Figure 53.6. Hand-held laser particle counter.
53.7.4 Hand-Held Condensation Particle Counter
Hand-held condensation particle counter (Figure 53.7) is used when measuring: indoor air quality, investigation aerosol, research filters, tests, environmental monitoring, for electronics, food processing, pharmaceutical, medical / hospital. In cases where Nano sized particles are whished to be monitored Down to 0,005 µ sensitivity. Where high concentration ranges up to 100 000 /cm3 is needed Condensation counter will be used. The counter should be able to store data and be simple to download to computer via the USB. Check that the unite is delivered with its recharge-able power supply.
Figure 53.7. Hand-held condensation particle counter.
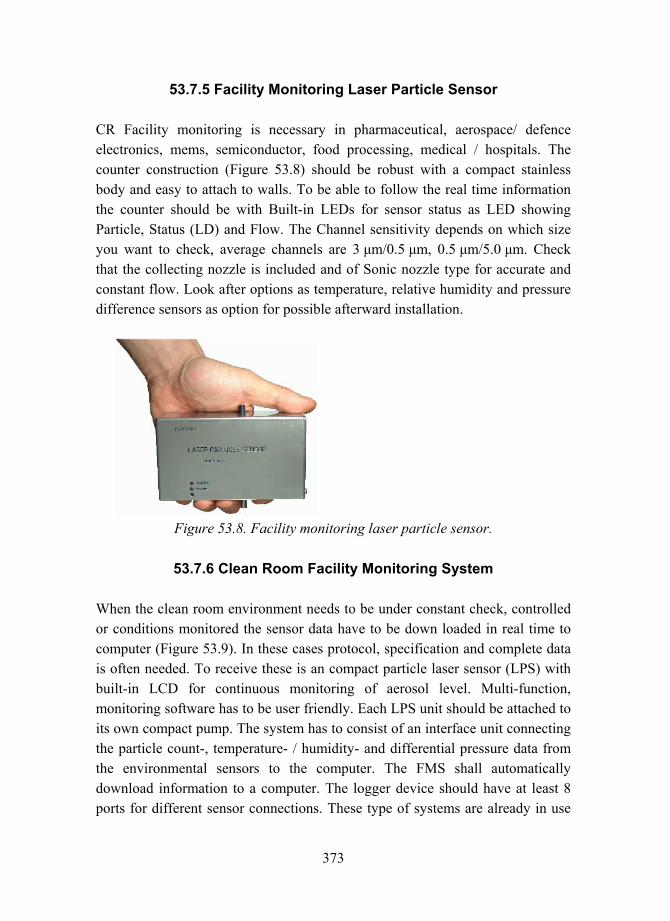
373
53.7.5 Facility Monitoring Laser Particle Sensor
CR Facility monitoring is necessary in pharmaceutical, aerospace/ defence electronics, mems, semiconductor, food processing, medical / hospitals. The counter construction (Figure 53.8) should be robust with a compact stainless body and easy to attach to walls. To be able to follow the real time information the counter should be with Built-in LEDs for sensor status as LED showing Particle, Status (LD) and Flow. The Channel sensitivity depends on which size you want to check, average channels are 3 µm/0.5 µm, 0.5 µm/5.0 µm. Check that the collecting nozzle is included and of Sonic nozzle type for accurate and constant flow. Look after options as temperature, relative humidity and pressure difference sensors as option for possible afterward installation.
Figure 53.8. Facility monitoring laser particle sensor.
53.7.6 Clean Room Facility Monitoring System
When the clean room environment needs to be under constant check, controlled or conditions monitored the sensor data have to be down loaded in real time to computer (Figure 53.9). In these cases protocol, specification and complete data is often needed. To receive these is an compact particle laser sensor (LPS) with built-in LCD for continuous monitoring of aerosol level. Multi-function, monitoring software has to be user friendly. Each LPS unit should be attached to its own compact pump. The system has to consist of an interface unit connecting the particle count-, temperature- / humidity- and differential pressure data from the environmental sensors to the computer. The FMS shall automatically download information to a computer. The logger device should have at least 8 ports for different sensor connections. These type of systems are already in use

374
in Italy, Sweden and in Finland. A continuously checking of the parameters should be easy to follow on a multicolored display screen. The screen has to show the following readouts: graphics and displays, column diagrams, scaling, setting upper and lower alarm values in each, checking point, different types of collected event, history etc.
Figure 53.9. An example of a cleanroom facility monitoring system.
53.8 SUMMARY
The above positions are only some thoughts around the issue. In additional it is recommendable to use consultants in needed area if not own personal knowledge is strong enough. The consultant has to have practical knowledge and experience in installation and final validation. It is of most importance to get satisfied information and results because this will be the foundation for further inventions, investments and development.

375
CHAPTER 54: APPLYING VIDEO EXPOSURE MONITORING IN CLEAN PRODUCTION
Arto Säämänen, Kimmo Heinonen & Tapio Kalliohaka VTT, Tampere, Finland
Airborne contaminants or substances present in the production environment can have undesirable outcomes in cleanrooms. Their presence may, for instance, affect the end product and cause problems for both production equipment and personnel. Yet, minor changes in processes or working practices can have a dramatic influence on the production environment. Enhancement in production conditions can be achieved with the aid of visualisation of airborne contaminants. This can be done using video exposure monitoring (VEM) systems. The visualisation of invisible variables in the video picture can help to discover dependence between visible events and some easily measurable, but not visible variable such as low particulate concentrations in production environments. VEM equipment combines video picture of the work and simultaneously measured data from the sensors detecting e.g. production environment. Link between problem calling conditions and work can be analysed with the aid of video picture in which graphical presentation of data is superimposed. Several types of sensors can be connected to the VEM equipment and the method can be applied to all kinds of problems in which the visualisation of the problem with measurements and video assist the analysis and problem solving.
54.1 INTRODUCTION
The utilisation of cleanrooms in different production systems and other applications has increased during last decade. This is mainly due to tighten particulate and microbial quality requirements of the products. Because of this, controlling particle concentrations in the cleanrooms is an important issue. Moreover, hazardous chemicals are also used and handled in cleanrooms. Therefore, human exposure to chemical agents has to be considered also in the cleanrooms.

376
The improvement of the production environment is a complex task. The causality between elevated particulate concentrations and possible contaminant source is not easily perceived. Therefore, unprofitable investments to production environment are common. Normally the companies only have access to methods, which prove that they comply with limit values set by e.g. standards. Such methods do normally give a very limited base for decisions on how the problems best will be solved. For that purpose, a technique that gives more information is needed.
Visualisation is effective way to find out the causalities between the process and the worker's exposure. It is also effective tool for explaining those to peoples with different backgrounds and levels of education. The visualisation also increases the reliability of the measurement results, because it is possible to see the reasons caused the measurement values. Thus the visualisation makes the basis for sharing information to company people before they will find out the improvement ideas.
54.2 VIDEO EXPOSURE MONITORING
54.2.1 Basic Idea of Video Exposure Monitoring (VEM)
The visualisation of invisible variables in the video picture can help to discover dependence between visible events and some easily measurable, but not visible variable (Rosén 2002). This is the case for example in work environment studies where the dependence of airborne contaminant concentration and work practises is studied. The VEM methods are typically based on a combination of direct-reading instruments and video filming (Rosén & Lundström 1987, Gressel et al. 1987, Rosén & Andersson 1989, Gressel et al. 1993, Walsh et al. 1998, McGlothlin 2005). The measurement instruments for environmental or other factors are connected to the equipment. Concurrently with the measurement, the work or other event under investigation is filmed. With the aid of VEM equipment, signals from the video camera and the measurement instrument are mixed to give information of the current level of the measured variable (Figure 54.1). The continuous signal from the measuring instrument are converted to a bar graph and displayed at the edge of the video screen. The height of the bar is proportional to the measured signal.

377
Figure 54.1. Basic configuration of video exposure monitoring system.
54.2.2 PIMEX-PC Equipment
One of the VEM systems, PIMEX-PC (abbreviation PIcture Mixed EXposure), is based on a standard computer and specially developed software (Rosén, 2002; Andersson et al, 2002). The PIMEX-PC software is written in Labview® (National Instruments) and has two versions of the software: one is for collection of video and data and the other version is for replay of video and data (Rosén et al. 2005). During the recording, the picture from the video camera and data are presented on computer screen in real-time and stored on hard disk. During replaying, a line graph with data from a full measurement period and the video image is displayed (Rosén et al. 2005). After commencement of the video replay, the pointer on the line graph follows the synchronised video picture. A pointer can be moved to any point (time) of interest and video image follows the movement. Both versions can present data digitally, as a bar graph or a line graph. Figure 54.2 shows a typical result window from the replay version of the program. It is possible to export data to spreadsheet programs as Excel® or similar for further analysis.

378
Figure 54.2. Display of the PIMEX-PC equipment.
The PIMEX-PC system is capable to record continuously eight signals from measurement instruments in the rate of 15 Hz (maximum), depending on the properties of the instrument. The system can be used also together with equipment using RS 232 or USB data transmission channel e.g. counter of the airborne particles. The PIMEX-PC system has been applied in several different environments and with many different measuring equipment such as particulates, static electricity, gas, solvent and noise monitors.
54.3 APPLICATION AREAS
The video exposure monitoring method has its origin in occupational hygiene. There it has become an aid for evaluation of various measures for reducing workers exposure as well as a tool for training of good work practises. The VEM system can be used also in other applications than occupational hygiene. Almost any process that could be visually surveyed may also be studied with VEM equipment. What is needed is a real time monitor capable to measure the variable of interest. The processes that are complex, such as human activities are the most suitable application areas of the system. The next chapters will give examples of applying video exposure monitoring (mainly PIMEX method) in cleanrooms and other controlled environments.

379
54.3.1 Reducing Exposure to Drug-agents at the Pharmaceutical Factories
Pharmaceutical industry has strict demands on the cleanliness of production environments. This is mainly done to ensure the high quality of the product. However, employees working in the cleanrooms will handle hazardous chemicals and dust escaping during some steps of the process may contain tens of percents the effective drug-agent. This was the case in one pharmaceutical factory. The conventional occupational hygiene measurements showed unacceptable exposures to an drug agent during three work stages. The main coal of this study was to find means to reduce the exposure to the minimum, under 1/10 of the occupational exposure limit (OEL) (Rosén et al. 1999).
Using video exposure monitoring and systematic improvement strategy it was shown that the exposure could be held under 1/10 of the OEL. About 15 preventive measures were suggested and the innovation process continued after the study. The main advantages of the procedure were that a group, which was concentrated to exposure problem, was formed. Also, detailed information of the exposure problem was shared within the group. Each person was talking from the same situation with the same knowledge. While the exposure problem was visualised, the procedure led the group to concentrate the most critical problems. This was, according to the company personnel, the most important advantage of the procedure and make it easy to start the change process.
54.3.2 Source of Contamination in a Production Line
High particle concentrations were noticed in a production line where very clean plastic products were manufactured. In order to create a local clean air zone around the production line, the line was equipped with a clean vertical laminar air flow system. The HEPA filters were located above the extruding machine and side walls were made of transparent plastic flaps. During the process cycles moving parts and heat convection create mixing in the air flow field. Therefore, it was possible that in the case of particle emissions inside the machine, they could spread to the most critical points of the extruder and hence the product.
The aerosol particle concentration (optical diameter > 0.3 µm) during the process was measured using optical particle counter (MetOne 237B) connected to

380
PIMEX system using 2 second sampling time. The air sample was taken nearby the most critical point of production line and the camera was filming the process simultaneously. During the PIMEX measurements it was observed that the particle concentration variability had a certain frequency. There was about 2 minute time difference between the higher particle concentration peaks. The PIMEX system was used to analyse which production equipments were having the same operation frequency as the particle concentration had. It was clearly seen on the PIMEX video that the high concentration peaks were in coincidence with operational cycle of the compressed air cylinder. Additional investigations pointed out that the particle emission source was found.
54.3.3 Measurement of Particle Emission from Materials
Humans are considered to be one of the greatest sources of airborne contaminants in most of the cleanrooms. Therefore personnel have to use special garment system as a filter or barrier between the personnel and the atmosphere. Also other textiles may be used in cleanrooms and similar controlled environments such as in operating theatres. The properties of garment system vary depending on the type of the garment and material they are manufactured (Nurmi et al. 2003).
The particulate emissions from garments can be studied using several test systems. The standardized body box test allows the investigation of complete cleanroom garment systems. Similarly particulate emissions can be investigated using simulated work method in a test cleanroom (Nurmi et al. 2003). In both cases the utilisation of the video exposure monitoring system assists the interpretation of the test results. For example in simulated operating theatre work it was observed that most of the particles came from the movable test person and handling of the surgical drapes (Nurmi et al. 2003).
In simulated work method the work under study is performed in the raised floor test clean room (class 5). Emitted particles are sampled under the floor using multipoint sampling system. Particle concentrations are measured with optical particle counters (Royco MicroAir 5230 or MetOne 237B). The output of the optical particle counter is connected to the PIMEX-PC system.

381
54.3.4 Training
VEM is well suited as a training tool as it is a highly visual technique. The ability to graphically show the workers themselves and other key players how exposure or contamination occurs and how it can be controlled has been one of the most important uses of VEM since its inception (Rosén 2005).
Material from video exposure measurement studies can also be used in training purposes. Production of training material makes it possible to spread the knowledge gained during the video measurements to the all person in need at the company. Material can be re-edited and training videos composed from interesting takes found from videos. The results of a successful (or unsuccessful) measure or recognised contamination sources can also be worth knowing about at other departments or workplaces with the same or similar problems.
Training material has been produced e.g. concerning proper dressing and undressing code for cleanrooms workers. Also general video training material for cleanroom working including non-acceptable behaviour and best practices has been produced. Video training material including video exposure monitoring videos has also been used when laboratory personnel has been trained to work with fume cupboards (Pasanen et al. 2000).
54.4 SYSTEMATIC IMPROVEMENT STRATEGY
Systematic approach to airborne contamination problems applies a general problem-solving model (or development cycle) consisting of the following phases: 1) Identification of the problem 2) Analysis 3) Solution development 4) Implementation and 5) Evaluation. Participation and co-operation are integral parts of the problem-solving and solution development. Visualisation methods are used to realised contamination problems and enhance the co-operation between different personnel groups (Rosen 1999, Heinonen & Säämänen 2000, Andersson, et al. 2000, Säämänen et al. 2000, Säämänen et al. 2002).
Visualisation helps to understand the exposure in details and it creates the possibilities to innovate preventive measures. Visualised situations are understood both by technical experts and employees almost independently of the

382
cultural background. So all the "know how" can be utilised, commitment increased and misunderstanding diminished. This creates a good basis to improve conditions at the workplace using participatory approach.
The main goal with the participatory process in the company is to gather 1) company knowledge 2) contaminant control knowledge and 3) the utilisation of visualisation methods e.g. PIMEX to enhance the knowledge and communication of relationship between work tasks and exposure. The process is based on the use of methods that visualise the factor of interest, e.g. particulate concentrations in the critical production zone and the participation of different personnel groups in the company. A development group, formed in the company, utilises the visualisation methods to identify reasons for high exposure but also to search for possibilities to control and evaluate the efficiency of different control measures. Used visualisation methods have mainly been the PIMEX-method but also generation of smoke for visualisation of the air flow field, the dust lamp for source identification and different methods for graphical presentation of measured data.
The collected data (videos, concentrations, etc.) are analysed in more detail. The analysis shall explain reasons for differences in measured values and point out important factors for control measures. The analysed material is presented to the development group as the base for an idea generation meeting. Several kinds of working methods, e.g. brainstorming, can be used in this phase. A clear distinction must be made between solution generation and choice of solution. The feasibility of the ideas is compared. The suitable solutions are chosen for implementation. The progress of the implementation is followed. Possible obstacles in the implementation are discussed and solved in follow-up meetings. After implementation the success of the control measures are evaluated and the continuous exposure-monitoring program is continued (Säämänen et al. 2002).
54.5 CONCLUSIONS
Visualisation is an effective way to find out causalities between the process events and the particle concentration. This is mainly performed using PIMEX-method which combines particle measurements and video recording. It is effective tool for explaining reasons for contamination and/or human exposure

383
to peoples with different backgrounds and levels of education. The visualisation shares information to company people and helps them to find out improvement ideas. When the causality between process or work tasks and the airborne particle concentrations it is well known, it is quite easy to get improvement ideas.
Generally, the most efficient improvements are not always expensive ones. Only with minor changes to the process or to the working method can have dramatic influence on the production environment. It was found about 1020 improvement ideas for one part of process when the work place improvement strategy was tested in several companies.
The used video exposure monitoring method contribute strongly to motivate the workers and to give them necessary knowledge to actively take part in searching for solutions on their problems. The staff and managers, supervisors or other persons responsible for working conditions, were able to study the relation between work, contaminant concentration and different control measures. This resulted in a better chance of succeeding in the search for changes that effectively will lead to the goal.
54.6 REFERENCES
1. Andersson, I-M., Heinonen, K., Karjalainen, J., Leisser, H., Novak, H., Pääkkönen, R., Riipinen, H., Rosén, G. & Säämänen, A. 2000. Workplace improvement strategy by PIMEX WISP. In: Manuell, R.W. 4th International Scientific Conference of the International Occupational Hygiene Association. Cairns, Australia, 1014 July, 2000. Pp. 43.
2. Andersson, I-M., Riipinen, H., Rosén, G., Säämänen, A. & Walsh, P. 2002. Visualisation of real time exposure. In: IOHA 5th International Scientific Conference. Professional Development Session. Bergen, Norway, 1014 June, 2002.
3. Gressel, M., Heitbrink, W.A., McGlothlin, J.D. & Fischbach T.J. 1987. Real-time, integrated, and ergonomic analysis of dust exposure during manual materials handling. Appl. Ind. Hyg., Vol. 2, pp. 108113.
4. Gressel, M.G., Heitbrink, W.A. & Jensen, P.A. 1993. Video exposure monitoring A means of studying sources of occupational air contaminant

384
exposure, Part 1 Video exposure monitoring techniques. Appl. Occup. Environ. Hyg., Vol. 8, pp. 334338.
5. Heinonen, K. & Säämänen, A. 2000. FINN-PIMEX a tool for contaminant control. In: Niemelä, R., Railio, J., Sundqvist, E. & Tähti, E. (eds.) Progress in Modern Ventilation. Ventilation 2000, 6th International Symposium on Ventilation for Contaminant Control. Helsinki, FI, 47 June 2000. Vol. 1. Helsinki: Finnish Institute of Occupational Health , pp. 165167.
6. McGlothlin, J.D. 2005 Occupational Exposure Visualization Comes of Age. Ann. Occup. Hyg., Vol. 49, pp. 197199.
7. Nurmi, S., Säämänen, A., Luoma, T., Soininen, M. & Suikkanen, V-P. 2003. Human, protective cloths and surgical drapes as a source of particles in an operating theatre. In: World Textile Conference 3rd AUTEX Conference. Gdansk, 2527 June, 2003. Book 1. Technical University of Lodz, Faculty of Engineering and Marketing of Textiles, pp. 394399.
8. Pasanen, T., Heinonen, K., Säämänen, A. & Kokotti, H. 2000. Visualisation of the performance of the laboratory fume cupboard. [In Finnish: Vetokaapin toiminnan havainnollistaminen laboratoriohenkilöstön työnopastuksessa.] Kuopio, Kuopion yliopiston ympäristötieteiden laitokset. 26 + app. 5 p. Kuopion yliopiston ympäristötieteiden laitosten monistesarja.
9. Rosén, G. & Andersson, I-M. 1989. Video filming and pollution measurement as a teaching aid in reducing exposure to airborne pollutants. Ann. Occup. Hyg., Vol. 33, pp. 137144.
10. Rosén, G. & Lundström, S. 1987. Concurrent Video Filming and Measuring for Visualization of Exposure. Am. Ind. Hyg. Ass. J., Vol. 48, pp. 688692.
11. Rosén, G. 2002. Seeing is believing. Ann. Occup. Hyg., Vol. 46, pp. 34.
12. Rosén, G. (ed.) 1999. Workplace Improvement Strategy by PIMEX. Final report to European Commission. SAFE Project no 97 202356 05F05.
13. Rosén, G., Andersson, I.-M., Walsh, P. T., Clark, R. D. R , Säämänen, A., Heinonen, K., Riipinen, H. & Pääkkönen, R. 2005. A Review of Video Exposure Monitoring as an Occupational Hygiene Tool, Ann. Occup. Hyg., Vol. 49, pp. 201217.

385
14. Säämänen, A., Riipinen, H., Andersson, I-M., Heinonen, K., Karjalainen, J., Leisser, H., Novak, H., Pääkkönen, R. & Rosén, G. 2000. WISP Workplace Inprovement Through Visualisation. In: Niemelä R, Railio J, Sundquist E, Tähti E. (eds.). Progress in Modern Ventilation. Ventilation 2000, 6th International Symposium on Ventilation for Contaminant Control. Helsinki, Finland, 47 June 2000. Helsinki: Finnish Institute of Occupational Health, Vol. 1. Pp. 159161.
15. Säämänen, A., Heinonen, K., Vilppola, K., Pääkkönen, R. & Riipinen, H. 2002. Development of participatory process for the improvement of occupational hygiene. In: IOHA 5th International Sceintific Conference. Bergen, Norway, 1014 June 2002.
16. Walsh, P.T., Clark, R.D.R.., Flaherty, S. & Gentry, S.J. 1998. Computer-aided video exposure monitoring. Appl. Occup. Environ. Hyg., Vol. 15, pp. 4856.

386

387
CHAPTER 55: HOW SAFETY IS A SAFETY CABINET?
Arno Wouters Kojair Tech Oy, Helvoirt, the Netherlands
A microbiological safety cabinet (MSC) is a very sensitive piece of machinery. Correctly placed, used and serviced it will provide you with optimal protection! Because of not enough knowledge at the purchase, installation and service it can easily get insecure. How should you install a MSC? How should you test and service? Most MSCs are built according an international (EN-12469) or sometimes national- (DIN 12980) acknowledge norm and in most cases tested by an independent national- or international acknowledge institute. Many manufactures choose for the GS-sign ("Geprüfte Sicherheit") which is provided by Tüv in Germany. GS-sign is not compelling. However, the 1st of January 1995 the EC-declaration and the CE-mark are prescribed since after supplement 3 of the Machinery Guidance. Because Germany is one of the leading markets in Europe and very attached to the GS-sign many manufacture still choose to have the cabinets tested by Tüv in Hamburg or Köln. It looks like that both institutes will be provided with enough work for a longer period although according the present EG-regulations the manufacture is 100% responsible for the production and sales of a MSC even though it s tested by a third party. A test by a third independent party is therefore no longer necessarily. The EN-12469 and DIN-12980 only demand the minimum requirement. From all manufactures is required to build a cabinet which provides the best person-, product-, and environmental protection. Further literature: EN-12469 (Biotechnology-Performance criteria for MSCs), Teil 10 of DIN- 12950, EN 12296 (Biotechnology-Equipment-Guidance on testing procedures for cleanability) and Laboratory biosafety manual, 3rd edition. As a manufacturer of safety cabinets we also have to follow all kinds of rules, norms and regulations to build a safe MCS! To prove we are fulfilling the norm (EN 12469) we have asked an independent well known organisation to certify our cabinets (Tüv-Rheinland in Germany). Probably because of lack of information and/or knowledge it s very easy to disturb the protection grade of a MSC. During the presentation you will be confronted with the daily lab-routine which probably has an effect on your work and safety as well.

388
389
CHAPTER 56: AIR CLEANLINESS CONTROLS IN THE FOOD INDUSTRY
Kjell Rösjö AET- ARBEIDSMILJÖ OG ENERGITEKNIKK A/S, Strömmen, Norway
Ultra clean air ceilings were in fact originally developed for the textile and the food (brewing industry). After a period of some decades, after solving the main problems with pollution within the textile industries, clean air technology was transferred to the brewing industry. The main problems at that time which made the brewing process a risk area with very variable quality, are still present today to a certain extent in the modern food industry. Thanks to developments made for the textile industry, the brewing industry was able to solve these problems and the quality of their production is now much more predictable. However, from time to time these problems still arise and there is a need for a clean environment. The situation is still not completely under control, and we see the headlines in the newspaper concerning food scandals, something causing concern and mistrust amongst the consumers. This is made worse when reading about factory closures and recalls of dangerous products.
The advances made in the 1960's with the objective of reducing cross contamination which causes pollution in the areas of scientific based research, production, medical industry and hospitals, has been introduced to the food industry. Demands for clean and safe food, has increased the need to reduce additives and still deliver high quality food with a certain shelf life. This has lead to further challenges. However there are conflicting requirements in the food industry; on the one hand the need for cleanness in production and on the other hand the requirements for people working there. How can the aerobiological sources of problems be addressed by using control techniques which are cost effective? How can the requirements for staff working in areas be met while at the same time reducing energy costs? This lecture will discuss those challenges and suggest some possible approaches to these problems. Some examples of findings and possible solutions will be shown.

390
56.1 VENTILATION IN CONNECTION WITH R3-TECNIQUE
Clean air is an extremely important factor in many industries, in particular the food industry. This paper will discuss which factors can influence the choice of solutions to more or less complex needs for ventilation within the Food Industry. In addition the attainment and maintenance of clean air at a sufficient level will be covered. We will also show several possible ways to solve some of the issues concerning the improvement of ventilation systems. Since it is not only extremely demanding to produce clean air, but also to measure and document this, we have found that it is appropriate to arrange the units according to categories and classes. These types of ventilation installations serve individual rooms, zones within rooms or even complexes of rooms, in other words areas ranging from a few m2 to several 1000 m2 for very large systems. There are particularly strict requirements for the choice of installations in large industrial halls. These classified areas are known by many different names, one of them being clean rooms. Clean rooms can be limited areas within smaller or bigger rooms. Problems are encountered when management or operators do not know the level of cleanness they need to have and what level is actually achieved. This means that it is important to spend enough time to analyse the needs as well as to carry out control analyses. Unnecessarily over clean rooms may incur large extra costs, while the choice of low substandard classes of installation can in many cases cause problems and costs and even make it impossible to achieve the desired result. The class or desired level of cleanness in the rooms is therefore an important decision that must be taken.
56.1.1 Relevant Areas for Clean Room or Clean Room Ventilation
The following industrial areas are becoming increasingly more highly technological: electronics, diagnostics, medicine, pharmaceutical, medicine handling, optical electronics and food. In many areas within these industries there may be requirements for product, person and environmental protection. An example of environmental protection could be microfilters that prevent radioactive emissions through the ventilating systems and air outlet.

391
56.1.2 Design of Ventilations Installations for Clean Rooms, and Clean Zones; Conventional and Laminar
The design of a clean room installation must cater for the necessary pressure conditions and for a sluice system. There are national and international standards that regulate the different requirements for dimensions and usage. The laws and regulations for ventilation generally regulate the bottom of the installation. Clean room standards, class requirements and branch best practice are all necessary and important in this regard. These are often complicated installations which involve risks in connection with work on microbiological, chemical and or radioactive materials etc. The classification and design of the clean room installations are more often based on maximum permitted particles which are equal or greater to stipulated particle fractions in the particular room or zone. This will influence the choice of the type of the clean air installations; a parallel stream (LAF) or turbulent type or even a combination of them. There are a many different varieties of systems which work according to these basic principles. The LAF systems may be further categorized into vertical, horizontal and special versions which can be diagonal. LAF systems may sometimes not provide the solution to the problems, but can be a source of problems in themselves. Conflicting problems for staff and production areas can be solved while at the same time reducing energy costs! Those challenges and some possible approaches to the problems can be solved by individual climate controls. How is this possible? A particular area for the laminar air flow technique recently developed has to do with installations which are also designed with the purpose to give individual climate control to each person and product in separate areas under the LAF-ceiling. An internationally patented system has been invented and will be able to provide a solution for zoned climate controlled installation within the same smaller areas.
It is possible to achieve a high level of cleanness in the relevant areas, provide good control with microbe units in a production hall and at the same time create a multi-flexible climate system by means of a zoned climate controlled laminar air stream. The Norwegian company AET-ARBEIDSMILJØ OG ENERGITEKNIKK AS has an international patent covering this technique and equipment based on this principle has already been commissioned in operating theatres. Even though the experience from ventilation and climate systems cannot always be transferred from one operation to another, the basic principles can still be

392
applicable for use within the food industry and pharmaceutical industry. It is possible by means of LAF ceilings to maintain different temperature zones in close proximity to one another, In practice this means that a person working in an area with something that must be kept cold can still enjoy a pleasant temperature, an important occupation hygiene factor safeguarding the welfare and comfort of the individual. Many working areas in the food industry are unpleasant for operators and workers, and this can result in more sick leave and greater staff turn-over. It can also be somewhat difficult to recruit people to jobs considered unpleasant. The extra costs associated with such problems may alone provide a potential saving that could cover the investment of the new and patented AET. Since the whole installation is based on air circulation the energy costs associated with it are competitive with other systems which utilize larger amounts of outside air. This way of keeping energy costs as low as possible can also be used in other contexts.
A unit placed in a production hall can contain general lighting, channels for leads and cables, channels and containers for gas, media, compressed air, steam, electrical appliances and ventilation. The fans can be situated in the ventilation room in the department or building and can even be integrated in the laminar air flow ceiling or construction. The advantage with the this feature is that the costs for large channels or ducts to and from the unit, as well as the large climate aggregates involved, can be reduced, covering only the fresh air part of the inlet air volume.
It is important to distinguish between which conditions that are needed to carry out the classification and which controls that must be performed. Normally the classification carried out in full operation is most relevant. The classification norms for built (built with all technical installations complete) or at rest (installed and ready for use) are both significant for the control and validation when building and testing.. In the case a test in full operation in inadvisable, and if the at rest test is not adequate, then a test must be done under simulated conditions. The following standards will often be a part of an agreement when planning or building clean rooms: NS-EN ISO 14644-1 to 7, NS-EN 1822-1 to 5 (HEPA-filter provisions), EU GMP with Annex , PIC/S Guide to Good Practice for preparation of medicinal products in pharmacies. Draft 2004 A WHO guide to GMP requirements.
Branch associations in different countries can provide a good reference source when orientating oneself in this area. For Norway the Norsk VVS Forenings
393
årbok pages 9597 would be a good place to start. This contains an overview of a number of standards which are relevant for clean rooms on pages 97125. Many of the listed standards are a must when building and running clean rooms and zones; 14644 and 14698 are mentioned on page 100. Moreover a catalogue from Norsk Standard and other related products from Pronorm are necessary when finding the relevant and applicable standards in Norway. Arbeidstilsynets (Norwegian Labour Inspection Authority) Publication catalogue (published by Gyldendal Akademisk), order art. Nr.1 is also among the useful overviews available. Requirements laid down by the Rescue and Emergency Planning Department regarding electrical installations, fire security and explosion protection are often necessary to be considered. Other countries and their national authorities will have similar legislation.
56.2 PRODUCT REQUIREMENTS
In addition to the protection provided by the clean room ventilation, the product requirements can be so extreme they must be catered for by standard or specially designed encapsulations within even the cleanest parts of the clean room. Standard encapsulation cabinets can have either vertical or horizontal LAF units to supply the critical area with ultra clean air. The air flow must be carefully studied throughout the entire process to avoid an unacceptable risk of high airborne contamination, something that often leads to a special design of LAF units for process and work stations.
56.3 SAFEGUARD CLASS INSTRUCTIONS FOR ROOM OR ZONES
These areas help to prevent the risk of an unacceptable high airborne contamination and subsequent failure of the system. This may entail further risk analysis during the needed analysis period. In addition to risk analysis, a study of critical control points will be essential for the commissioning of the finished system and correctly maintained and running the system (Hazard Analysis Critical Control Points; HACCP). This will also be necessary for the ventilation installations, especially the process ventilation if future problems are to be resolved quickly. It is one thing however to devise theoretical control points, but it is another to be able to measure them practically and to make sure they give a reliable answer. This means that one

394
must take into consideration how to collect the control data (measurements) as well as the usage of instruments and probes. In some cases the solution could be to construct special probes, adapters and connections to these, in order that the control can be performed in critical positions. With more advanced units the control points are permanently connected to SBC via special instruments which direct the collection data to a production monitoring computer system. Measuring sequences and the number of measuring place which are relevant at any given time can be entered into the installation program. Alarms can often be linked to the most important control points.
56.4 PERSONNEL PROTECTION LEVEL
This is expressed as risk classes, for example as stated for microbiological laboratories; level P1P4. For laboratories and industrial situations there are a number of more or less well known laws and regulations for occupational hygiene (referred to as Health Environment and Safety-HMS in Norway) which refer indirectly to international standards such as Control of Substances Hazardous to Health Regulations (COSHH).
The installations must be designed and built in accordance with this. Another example of special areas where personnel protection must be emphasised is cleanness certified rooms which include radiation protection.. Requirements concerning design and installation quality are common for clean rooms and the associated ventilation installations. These must include controllability and traceability during all phases of building. Measuring points must be planned with regard to what is required, the total number of points as well as accessibility, in order that the person carrying out the controls does not need to jeopardize his life when measuring. This is unfortunately an all too common occurrence. Lack of knowledge and consideration is often evident with inexperienced planners. We can see this for example when they overlook the difficulty of hanging on the fitted climbing frame 810 m above the floor while holding on bulky and heavy test equipment. A situation such as this should be avoided by better planning and this is important bearing in mind that necessary control or maintenance could simply be put off due to the difficulties and risks involved.
Many requirements are common and well known, such as pressure testing of duct systems. There are however particular requirements to clean room units within

395
special areas; vibration control, flexibility for rebuilding due to changing needs, material quality, risk of condensation, risk of leakage and the subsequent problems associated with process suction, air intake location and design, maximum variation of air volumes with changing weather conditions. With integrated classified high risk areas this can entail many complicated measures that must be taken. It is essential that a thorough needs analysis is performed to ensure that important things are not overlooked, and that the implementation and running standards can be controlled, during construction and afterwards during running.
Moreover cleanness techniques must be already in use during the production and fitting of the clean air installations. Aggregates, ducts, unit components must be kept completely free of visible particular contamination. A visible dust layer comprising small invisible individual dust particles, moisture and moulds are naturally not acceptable in ducts and unit components. Pressure testing of ducts is done in the usual way according to the appointed pressure class. Quality, reliability, user friendliness, ease of access to the ventilator room and other technical floors in large installations are all of vital importance when building and running ventilation units for clean rooms. Omissions can lead to corrosion, dry drains, mould in prefilters, cracks and leakages which can easily create major problems.
In the worse case there could be large scale delays due to necessary improvements or later reconstruction, something made even more difficult by the fact that the unit is in use. Details such as choice of fans and the regulation of these are also essential. A directly driven fan with frequency regulation is the best choice. Normally a large pressure drop due to the construction of the installation, as well as the relatively large quantities of air involved, will place greater demands on noise insulation. Requirements concerning space and flexibility for technical installations are extremely important questions that must be addressed early in the planning process. The same applies to moving in and positioning of large and heavy aggregate and cooling units.
The large clean room installations make demands on cooling for most, if not all, of the year round, and as such this is an important consideration in itself. Even smaller installations will have some need for cooling during the year. Temperature regulation in clean rooms will require that the best possible regulation of the cooling unit is used. and a ice water unit is most commonly used.

396
56.5 PURPOSE AND OBJECTIVE OF CLEAN AIR TECHNIQUES
It is more often necessary to make an overview of the requirements and demands which apply to the clean room and the associated ventilation installations e.g. showing relevant parts of NS-EN ISO 14644-1:1999 and other standards such as EC GMP (Good Manufacturing Practice). These can provide good pointers to what must be done to achieve satisfactory control possibilities, also in the practical control work, as well as which class may be or should be applied according to the purpose for the unit. Definitions from IS-ISO-14644-4:2001 of:
1) LAF (Laminar Air Flow) or unidirectional flow: Controlled air stream throughout the cross section of a clean zone with stable speed and near parallel streamlines. Note! This type of air stream results in a direct transport of particles away from the clean zone.
2) Non unidirectional air stream (turbulent air stream): Air distribution where the air blown in is mixed with the air in the zone by means of induction.
The purpose of classified air purity is to prevent harmful material spoiling the end result. Important factors to achieve this assume control of one of more of the following areas; particle purity, permitted gas and aerosol concentrations, temperature, moisture, ionisation, aerobiology, heat exchange mechanisms and temperature induced airstreams. If control is to be achievable, procedures for necessary controls, measuring frequency, measuring times and points must be devised, implemented, validated and revised. Traceability in this work with the relevant forms and log systems is vital. The majority of food companies are relatively well acquainted with HACCP. In the food industry where there are demands on air purity, this must also cover running, maintenance of ventilation, clean rooms, zones and sluices.
56.6 DEMANDS ON CLIMATE
The needs and requirements for indoor and process climate; temperature, moisture, air volumes, air exchange values, pressure values in zones, are the basis for suitable air conditions. Is important however to be aware that stricter requirements regarding stability and evenness can apply to industries with controlled hygiene. A certain excess should normally be built in when designing technical installations to allow for flexibility at some later point in time, should the need arise.

397
56.7 MAINTENANCE OF CALCULATED AIR QUANTITY
Before calculations of air qualities may be performed, the following principles for clean air installations must be chosen: product protection, personnel protection, contamination control. There is a choice of LAF- airstreams: Horizontal-diagonal or Vertical LAF. In addition there are turbulent installations or pure clean process ventilation installations.
When procedures for controlling different installations are set up it is important to take into consideration factors such as: nominal speeds and air quantities, pressure conditions, pressure drop, energy consumption, internal and external filtration, dilution time, purity, air exchange and design criteria (these will change in time within the industry), cooling requirements and encapsulation (leakage).
56.8 CONTROL OF INSTALLATIONS
Control of such installations cannot be carried out in a thorough manner without the integration of personnel activity into the control routines. How can the analysis of ventilation air be carried out adequately to ensure optimal steering and monitoring of the ventilation? People can often represent one of the dominating sources of contamination in clean room installations while in use. The correct choice of work clothing is an important feature when reducing the source of the contamination. Moreover the flow of personnel and materials in and out of clean rooms and zones will introduce dust and dirt via trolley wheels, shoes, dirty material and packaging surfaces coming from less clean areas. One possible strategy for reduction is to minimise and optimise traffic, while at the same time using dedicated wagons/trolleys in individual zones, ie transferring materials through suitable sluices to prevent cross contamination. Others strategies can involve the use of special hygienic clean room floor surfaces which are designed to retain 90% of particles from shoes , wheels etc, which otherwise would be brought into the cleaner zones. After a comprehensive collection and consideration of all relevant factors, procedures can be drawn up to give continuous control and to achieve purity of the different particle fractions within the given rooms and zones.

398
56.8.1 Design of Control Points
Clean room ventilation installations must be constructed with appropriate solutions for control of zones and divisions to inhibit the risk of adventitious transmission of contaminants, whether particulate or gaseous. For more complicated installations this can mean one or more systems of zones with correspondingly more control points. Although open plenary systems on the air intake side and an open plenary system underneath a specially installed floor on the return air side, gives big advantages in flexibility, they make stricter demands on the placement of appropriate measurement positions. The zones, and the pressure regulation within them, are key elements in maintaining control of different cleanliness requirements. Great care must be taken when choosing measuring methods and positions, particularly with respect to uncovering adventitious temperature fluctuations and ensuring pressure regulation (even more difficult).
Aerobiological sources for problems can be addressed by using control techniques that are cost effective! One of these techniques that has been shown to be very effective is using a particle counter combined with a combination instrument for temperature, humidity and velocity. The velocity meter should be of the propeller type, to be sure of the air direction. The use of smoke generators can also be valuable in giving accurate calculations of the important recovery time in certain areas, if this is allowed in the area controlled. If not, you may still be allowed to use a water evaporator or preferably steam generator which generates a visible mist.
It is of importance to look for, and sometimes to test out, where the critical control points should be placed. Remember that temperature deviations from zone to zone , frequencies of door openings, sizes of leaks around sliding doors etc are important factors for disturbing, not only the cleanness of production, but even your control measurements too. You may find nothing or far too much compared with the average needed to find. For example, it is not always needed to place your particle counter probe over a pinhole in a microfilter ! Examples of CCPs that contaminate are the lifts moving up and down, covering areas that are more dirty than one would imagine. Like a piston in an engine, the lifts push the air out and since there usually are no exhaust tubes, the door openings in different zones around the lift vent off the air. Controlling what happens around

399
the lift doors when the lift moves up and down will usually uncover substantial contributors to contamination (Figure 56.1). The diagram shows how easily the air cleanness is influenced by several activities, including using of a lift in a central sluice and cross transferring zone. This zone had 4 doors, including the lift door, and 2 of these doors lead directly to cleaner zones of which one opened directly to a production area. It does also show the influence of an introduced air cleaner and relationship between activities and the capacity of that particular cleaner. This is shown by the decrease of pollution particle count 1923 and 3335 Note! the logarithmical scale is used and sampling only lasted 6 seconds with a particle counter with 1 cfm capacity.
What about employees walking out of the lifts with the air coming out from the lift shaft? What will these people bring on their clothing as they proceed into the cleaner zones with the vacuum behind them? In Table 56.1 some of the particle counts are given and explained. It is those and similar areas, that are often forgotten, and which can really contaminate to undesired levels in cleaner zones. Wind forces and temperature drafts represent very effective additions to the already mentioned forces that are created internally by moving devices.
1
10
100
1000
10000
100000
1 2 3 4 5 6 7 8 9 10 11 12 13 14 15 16 17 18 19 20 21 22 23 24 25 26 27 28 29 30 31 32 33 34 35 36
0,3 µm 0,5 µm 1,0 µm 2,0 µm 5,0 µm 10,0 µm
Figure 56.1. Diagram showing activities affecting the air cleanliness.
Control points, must be placed by the control engineers with knowledge about the total ventilation system and how the building is constructed. The outer

400
environment including wind, topography, outside temperature can influence the inner rooms and areas. Figuratively speaking, those main carriers can be likened to small streams that make up a large river. What are the streams? Some items are placed in ignorance close to the very cleanest areas needed. A chair could be one such item in that it may contain millions and millions of well incubated colony forming units. A chair with a cushion could contain air pollutants coming from body emissions into the material. When the person gets up, bacterial growing in the cushion are spread around at temperatures close to 37oC (after some time sitting). This might give the colony forming units a very good start when emitted from contaminated chairs. According to the tests we have perform it only takes one chair like this to change a class 100 zone to a much higher class. The challenges are many, however there are also some possible approaches to the problems. One possible solution could be so simple as to simply just change to a proper chair for that class. 42 chairs were delivered to a vaccine factory for use in a clean room of class (100). If these chairs had been of the wrong quality it is obvious that this would have had a disastrous affect on the cleanness in the factory. Fortunately this was avoided.

401
Table 56.1. Examples of particle count measurements.

402
56.8.2 Filter Controls
Whatever design and zone control the overall cleanness will depend on the right choice of end filtration. Micro filtration is today divided into several classes (NS-ISO-EN 1822 15). Often they are referred to as HEPA-filter (High Efficiency Particulate Airfilter), although the name simply is valid for the first part of the microfilter class. The standard parts 15 have comprehensive provisions which must be followed closely in a clean room installation. The choice which is made regarding the end filter must be followed closely with respect to the condition checks. Factors which influence running costs and negative security at any given time should be gone through. This should supplemented by checking the possibility of incorrect choices. There is a tendency that the filter classes increase in relation to what was the case in previous years. In some cases this has been satisfactory, however in other cases there can be question marks against some of the decisions made, even though there were sensible reasons for upgrading the filters and thereby increasing the cost for short term and longer term. A cost benefit control analysis on the filter installations would presumably have lead to downgrading the filter again in a number of cases. The most common filter used is the microfilter in class H14, and this will normally prove itself to be a suitable choice for smaller installations. This is particularly true where time and resources, or the option of carrying out a closer examination is lacking. On the other hand in larger installations this choice of filter should be made more accurately. The fastening of finer filters, and not least microfilters, can be of vital importance since microscopic leakages can be devastating for operation where the filter will be used. All filter fastenings in such installations should be chosen with great care.
Not everything is equally easy to get approved. Many of the constructions which are simply more or less an improvement on a slightly more advanced fine filter fastenings do not conform to the demands for fastening microfilters. Cheaper solutions can quickly prove to be more expensive if they ultimately have to be replaced. Even specialized producers of LAF cabinets and equipment have many less well suited solutions in this area. The micro filters differ also with respect to quality when it comes to fastenings. Right choice of microfilters and frames can save a lot of concern during fitting and service. There are also examples that show that maintaining the grade of filter (Efficiency) adds unnecessarily to the costs of the operation. As mentioned before it should not be forgotten that in

403
many cases an unnecessarily high grade microfilter was chosen due to lack of knowledge about the real needs when the installation was being designed and about the fact that the combination with enormous filter surfaces does not represent any real risk. These surfaces may not give any measurable leakages in the clean areas and thus prevent the rejection of the installation in accordance with the applicable standards. The company must in any case follow the laws, regulations and agreements that apply despite any interruption to the installation and whatever the costs this entails.
Control of microfilters should only be done by service personnel with the necessary training and experience for many reasons. The safest way would normally be to make use of the personnel provided by the supplier of the filter units. Correctly performed control requires insight and knowledge on the part of the person. Filter unit have been incorrectly changed due to lack of knowledge about the installation and its use. It is also possible that mistakes made when installing the equipment would not be discovered until too late. A good understanding of the purpose of the installation, how it is constructed, how it should be adjusted according to real needs will help the controller and the user to maintain necessary quality, while avoiding the over consumption of filters /wrong choice of filter (too fine or coarse).
Prefiltration should be Coarse filter EU4 or better, preferably EU 6, before the aggregate components and EU 9 as the very last filter layer before the microfilter. This should be placed after all the aggregate components, if possible after the main silencer. Controls should include making sure that the installations are intact, without any damage or other faults. Leakage and control to ensure tight fitting require particular insight. Persons not having sufficient knowledge of the ventilation installation, its construction and mode of operation should not attempt to carry out these controls.
56.8.3 Control of Air in Clean Room Including Types of Sluices
There are 2 main types, conventional (turbulent) and laminar. Often we find a combination of these, also within the same room. Conventional types are characterized by micro filtered air fed in sufficient qualities with a turbulent air pattern. Laminar rooms are characterized by a unidirectional air flow across large surfaces. Since air does not flow completely parallel, the term parallel flow
404
or unidirectional is preferred by some. The supply of air can be vertical, diagonal or horizontal from ceiling or wall. The evacuation of the air into the room is of great importance. Appropriate positioning of control points can affect the result of the control with respect to the level of contamination. Different types of operation will impose varying demands on the positioning, number and duration of control points.
Ceiling to Floor or Vertical LAF
These require leakage and speed testing. DOP-testing with scanning of filter and fastening is carried out after that it has been checked that the filters still allow the air to pass through with the correct speed. If the filters must be changed due to difficulty in increasing the ventilator pressure, then it will be a waste of money to DOP-test such an installation.
This is also basically true for all microfilter installations, firstly the speed controls are performed, and then afterwards the leakage controls. In addition, the room temperature and intake air temperature are controlled over longer time intervals. The automation can give periodic temperature fluctuations for which the individual installations are not designed and built to compensate for. As mentioned previously the pressure regulation system must be controlled carefully, since this an important part of the barriers within the system. Pressure oscillations can be just as undesirable as temperature oscillations and cross contamination risks. DOP controls must include control of DOP feeding level, smoothness and stability. There are strict demands on knowledge here and experience in solving problems will be important. Over dosage with frequent filter changes (costs) is a significant risk. Even though a filter survives in the first instance, being changed through incorrectly registering a leakage as a result of over dosage, end pressure drops can still soon occur. It requires therefore areas for placing the DOP feeding arrangement, which provide an even DOP load across the total micro filter inlet area. Also when these are placed in system cassettes in the ceiling panels this is really a challenge. Likewise there must be systems for control of load level to prevent too frequent and expensive filter changes, which also represent a real challenge when seeking a representative place for the collection tube(s) connections to the pressure chamber.

405
Wall to Wall or Horizontal LAF
The biggest advantage here is that they are better suited in areas with height restrictions. However horizontal systems can still have limitations in practice use. They are controlled as for vertical systems, but note that LAF streams are prone to rise up from lower surfaces (floor or process surface). As for vertical systems, temperature plays an important role and must be controlled. Clean rooms are built in all possible configurations to accommodate the process there. It is important to take into consideration the origin and removal of particles, whether or not this is allowed, options to minimize or completely isolate these areas, whether they be large or small. The appropriate number of control points to ensure intended performance must be established.
56.9 MATERIAL CHOICE
Choice of materials can be critical. Clean areas with associated ventilation installations are by no means an exception. As opposed to ordinary ventilation installations, issues such as avoiding interruptions and stops, ease of maintenance and ease of cleaning play key roles. Other key topics with regard to choice of material are: low particle and contaminant emissions, resistance to wear, wear qualities, corrosion resistance, conductivity (ESD problems) strength, voltage succession of the materials, changeability, reflections and silencing. Appropriate controls will also include making sure that the material features and construction are sufficiently taken into consideration and maintained. Small cracks or paint bubbles can emit spores and moulds. Even relatively small cracks can send out large amounts of spores with the slightest touch along the surface. The release of spores can be intermittent and not always easy to detect when carry our air sampling. Visual controls and prompt action taken are therefore of great importance when problems arise. Risk analysis and appropriate placement of critical control points for the maintenance of the cleanness of ventilation installations is necessary to prevent adventitious and undesirable strain through the system to the clean areas.

406
56.10 COOLING
In addition to the usual major or minor challenges that must be addressed, clean rooms make special demands on the placement of machinery and the total need for space. Regular checks must also be made to ensure extremely good regulation stability. Energy consumption in clean room installations can increase dramatically if energy recovery and heat pumps are not used in conjunction with the extensive use of recycled air. The condensators in all cooling systems should always be constructed according the sound energy conservation principles. Control of energy consumption is consequently an important feature of the procedures that must be drawn up, and control points must be included.
56.11 HEAT
The heating of clean rooms is normally a smaller problem, since we normally concern ourselves with cooling in these areas. There is however a need to consider the consequences associated with heating up areas in a clean room. In some cases air flow can be used, but in others this is more difficult, if not impossible. Good solutions for heat sources, the placement of them, and not least cleaning options are necessary. Undesirable oscillations in automation must be prevented by regular controls done at appropriate measuring points and times. Suitable procedures must include simple ways to adjust, control and maintain temperature settings.
Central Building Control System (CBCS) has recently become more and more common. There is however a serious drawback with this, in that these systems in many cases have automation devised by experts not well versed in clean air techniques, and this has in some cases resulted in some most unusual programs being installed into the computer system. The laying down of control points must include keeping an eye on what points the automation experts have come up with during the building phase prior to normal working of the installation. It is vital to keep control and to ensure you receive accurate information so that you are able to make correct and well informed decisions, or when approving different solutions. Appropriate choices of critical control points and procedures for the implementation of determined programs, should uncover any conceivable and inconceivable deviation before a critical situation arises. This should include finding faults in data or monitoring systems.

407
56.12 SPECIAL REQUIREMENTS FOR VENTILATION EQUIPMENT, DUCTS AND AUTOMATION
Normal indoor climate demands can be designed in the lower clean room classes. Cooling needs are often substantial in a number of clean room classes. The temperature and moisture stability requirements can put demands on the design of the ventilation installation. Some installations allow only tenths of 1 degree of temperature deviation and lack of steering and control can cause serious problems.
Zone divisions, pressure zones, sluices, correctly chosen materials, well designed and dimensioned ventilation installations with full climatization, in stricter classes, are very complicated and the continuous surveillance of them is usually included in SBCS.
Ionisation in the strictest classes of clean room can also give a positive contribution. Special ionisation instruments are available for this purpose. In some cases the use of a particle counter can help to visualize and give good control of to effect of ionisation. The fresh air section of the ventilation installation shall prevent undesirable particles from entering. The more heavily dimensioned installations will have a significantly higher air intake and filter system compared to common comfort units. The positioning of air intake will affect the total filter economy. The construction of the ventilation installation with aggregates and ducts will influence greatly the end result. Depending on the demands, the construction of these systems will have to be adjusted to more and more details than with conventional installations to avoid bypass or induction leakages and to enable stable and stop free running. Important control points are chosen with respect to; air speeds, pressure drop, blockage in the ventilation installation, mechanical failure about to occur, leakage, corrosion, cleanness (overgrowing) temperature, moisture (energy control and effect grade for heat recovery (HR) system), fans and belts (found in rotating heat exchangers), etc.
56.13 SLUICES
Sluices play an important part and must therefore be adequate, functional and not least well ventilated. The same should apply to all changing room lockers for clean and unclean clothing. Ventilated lockers are available from specialist suppliers.
408
Pressure control and regulation is important to ensure that the contamination moves in the right direction from clean zones to more unclean zones. These sluices must be fitted with some device to prevent opening doors in and out at the same time and avoiding puncturing the pressure barrier. Electrical or mechanical interlocking systems, or minimum windows enabling one to see each other, can help to prevent the doors being opened simultaneously. There must not be under any circumstance anything which impedes free escape routes in emergencies like fire etc.
There must be regular checks to ensure there are no blockages. Ventilation must, in critical situations, prioritize personnel safety needs and contribute to free escape routes, even those through the sluices. This function should still be tested regularly even though it is never used in a critical situation, thereby helping to prevent the damper mechanism and motor from failing through lack of use. The issues mentioned in this section must be addressed when working to Food Safety standards like British Retail Consortium (BRC) which stipulates requirements for risk evaluation of air flow, personnel and material flow, as well as laying done special requirements for changing rooms and locker etc.
56.14 STATIC ELECTRICITY AND ELECTRO STATIC DISCHARGE
When there is a significant problem the clean room can be classed as a special Electro Static Discharge (ESD) cleanroom. This is a special room which only a few companies can supply and can be relevant in larger companies where much of the data control of processes etc, can be centralised in certain floors or buildings. Control of these installations will be a basis for the remaining control routines. Control and maintenance can be facilitated by specially built aggregates where control is possible and resistant through well chosen materials. U.S supplied a large installation to a food factory where the surface requirements conformed to AISI 316. The surfaces inside were flat like a mirror and were a dream to keep clean. It is possible to make an excellent system, however it is necessary to do a cost / benefit analysis!
The vast majority of clean rooms will however be equipped with means to control electrostatic forces, which in themselves could cause unacceptable levels of particulate contamination as well as the more serious damage to electronic components and intermediate products. There is also an issue of explosion risk with ESD.

409
56.15 BIOHAZARD
Biohazard places extra demands on the clean room area. It should be noted that the demands on cleanness cannot simply be solved by using overpressure. The option of using recycled air is to a large extent limited. Security encapsulation and isolation mean that work stations must be clean room ventilation installations with extraction units, intake air compensation and pressure zones. HACCP is also relevant for these extra installations.
56.16 END CONTROL AND VALIDATION OF INSTALLATION, RUNNING AND PERIODIC CONTROLS
In the main the requirements for clean rooms are specified in ISO-14644-2, which refers to testing of microfilters according to ISO-14644-3. The minimum of controls to be performed are room classification controls:
− ≤ ISO class 5 every 6 months. − > ISO class 5 every 12.months.
Air sampling with microbiological sampling equipment is utilized to a large extent in the food industry. However using the equipment is so time consuming that there are relatively few measuring points that are possible to manage and it is consequently more difficult to locate sources of air-borne contamination than with a particle counter. A combination is often the best and safest method and this has been done in some industries with interesting findings as a result.
56.17 RUNNING CLEAN ROOMS, CLEAN ZONES, AND CLEAN AIR WORK STATIONS
Running the installation will mean meeting the demands for occupation hygiene (HMS) with fire protection. explosion protection, environmentally dangerous factors, as well as biological, chemical, noise, vibration and radiation concerns that must be addressed. These important traditional risks can be present in this type of installation and must not be allowed to be overlooked as a result of the special demands a clean room imposes.

410
56.18 CROSS CONTAMINATION AND PERSONNEL SECURITY CONTROLS
These must be carried out regularly by test methods such as the KI-discus test, which can be used to simulate a real situation. The apparatus is specially designed for personnel security tests, but is also well suited to product protection tests and cross contamination tests. KI-discus is necessary to be able to control the level of protection against exposure to biological factors or the level of security with such work. Controls must show that the minimum personnel security factor (P) for work with Biohazard cabinets class I and class II, or with the associated use of Containment Technology can achieve a P ≥ 1,0 x 10⁵.
56.19 DECONTAMINATION PROCESSES
Clean room and decontamination processes can be vital for the further running of many types of clean room. Examples of this are rooms where there has been an undesirable growth of moulds in the microfilter and other installations, which have resulted in the room being considered unclean and the carrying out of sanitization activities, which in themselves constitute a risk of cross contamination. If the room or area is not sufficiently decontaminated the problem will simply return. In cases such as this, clean rooms without adequate measures to cater for unclean ventilation and quick decontamination, can risk being left unused for longer periods. The measures could involve a motor always set in the same position being tested and controlled so to prevent it jamming. After cleaning and decontamination the room must be returned to normal running and be checked at appropriate time intervals, which could be 24 hours, 48 hours or even longer periods.
56.20 CONCLUSION
According to current regulations, DOP, Particle, cfu, speed tests and other agreed controls must be performed from 614 months. The same intervals mentioned above apply to end control and validation of the installation. Speed and air quantity measurements, as well as pressure testing must be performed every 12 months. Particle control or DOP control of the micro filter and

411
fastening will, as a rule, be done in addition to the tests mentioned above. The correct measuring of DOP as well as the correct values, will be of great importance. Incorrect implementation will make more difficult the control of correct air quantities, and allow extra strain on parts of the filter system. This could result in the unnecessary rejection of perfectly acceptable filters. Misleading leakage test results can also exaggerate the fault which has been discovered. Correctly performed DOP-tests, control and after adjustments will prevent the costly and unnecessary changing of the microfilters. Where there are possibilities for leakages in the frame system between the filters, then this must also be controlled, depending on the construction. With large LAF-ceiling systems of the open plenary type, this control is just as important as that of the filters. Is should be noted that the rules for control of such installations are included in international standards and will often be a part of the contract. There are requirements for calibration routines for the instruments used. Note also that a significant stop in the use of an installation could lead to a new control sequence. Written test and control reports must be devised to contain important data, for example to contain certificates proving that the instruments have been calibrated and are valid for that measurement and interval. Controls must be performed by well trained personnel with sufficient experience from this type of work. Wrong evaluations can result in large and unnecessary costs. Those generally best trained to do this work will be representatives from the factory or supplier (importer) when these have been trained sufficiently to perform controls and tests of this type of clean air technical installation.
56.21 REFERENCES
1. European Commission: Scientific Committee on Emerging and Newly Identified Health Risks (SCENIHR) Opinion on The appropriateness of existing methologies to assess the potential risks associated with engineered and adventitious products o f nanotechnologies October 2005.
2. Envair, Integrity in Clean Air v/ John Neiger.
3. Design & Operation for Clean Rooms, revised edition v/P.R. Austin, B.A.E., M.S.A.E, P.E. B.N. Publ. Co. D.Mich. Healthcare Engineering-Latest Developments and Applications, Professional Engineering. Publishing Catalogue from Pronorm P- 560 NS-EN-ISO.

412

413
CHAPTER 57: THE NEW EU DIRECTIVE FOR TISSUE ESTABLISHMENTS CHALLENGES IN PROCESSING HUMAN TISSUES AND CELLS IN
CLEANROOM ENVIRONMENT
Annika Vienonen Regea, University of Tampere, Tampere, Finland
An increasing number of patients receive treatments based on human tissue and cells. This includes both conventional tissue bank products and advanced therapy medicinal products. The use of human cells and tissues has not been regulated by a European Union directive until recently. A directive on setting standards for the quality and safety of donation, procurement, testing, processing, preservation, storage and distribution of human tissues and cells was published by the European Parliament and of the Council in March 2004 (Directive 2004/24/EC). The directive should be implemented by the member states by 7 April 2006. More detailed technical requirements will be given in two Commission directives. First of them, covering the technical requirements for donation, procurement and testing of human tissues and cells, was recently published (2006/17/EC). The second directive regarding technical requirements for the coding, processing, preservation, storage and distribution is still in a draft phase. This directive will specify the air quality and cleanliness needed to minimise the risk of contamination during production. The recent draft states that the air quality should be equivalent to Grade A as defined in the current European Guide to Good Manufacturing Practice (GMP) with a background environment of at least GMP grade D if the tissues or cells are exposed to the environment during processing without following microbial inactivation process. However, the draft accepts less stringent cleanliness of the environment in some cases, depending on the nature of the tissues or cells, the processing method or the route of application.
The manufacture of an advanced therapy medicinal product including gene therapy, somatic cell therapy and human tissue engineering will be governed by

414
a regulation of the European Parliament and of the Council. The current proposal states that these products shall be processed according to GMP. An aseptic processing of advanced therapy medicinal product will thus be done in Grade A environment with Grade B background.
Both tissue bank products and advanced therapy medicinal products will be processed in clean room environment. Due to the sensitive biological nature that many of these products have, a final microbial inactivation is not possible and thus an aseptic processing is needed in order to fulfil the requirements of the earlier mentioned directives. The products processed by tissue establishments may be procured from either living or deceased donors. Despite the careful evaluation of the donor, the procured cells or tissues may be contaminated by viruses, prions, mycoplasma, bacteria, and yeasts. In many applications, the processing of tissues or cells has to be started before the test results screening for contaminants of the donor or tissues or cells are ready. This conflicts with the principles of aseptic processing.
The prevention of cross-contamination between cells and tissues procured from different individuals is a crucial measure of precaution. This increases the processing costs of tissue establishments since the production batches are usually small. One batch is generally specified as products derived from one donors tissue or cells. Moreover, the cells may be cultured for several weeks or months before the transplant is ready for clinical use. The new regulations by European Union will improve the safety and quality of therapies based on human tissues and cells and harmonise the current differing national approaches. According to the new regulations, the processing of tissues and cells should be done in clean room environment. Particular concerns associated with the processes are the risks related to human tissues and cells and their special biological characteristics.

SESSION ON R3 TECHNOLOGY


417
CHAPTER 58: DISPERSION OF AIRBORNE CONTAMINANTS BASICS IN R3 TECHNOLOGY
Bengt Ljungqvist and Berit Reinmüller KTH (Building Services Engineering), Stockholm, Sweden
58.1 REVIEW
The air may move in two different ways. One of these is characterized by a smooth flow, free of any disturbances, such as small and temporary vortices or eddies. This is known as laminar flow. The other type of flow is characterized by small and temporary fluctuations caused by instabilities. The flow velocity is no longer constant but more or less fluctuates around an average value. This is known as turbulent flow and the disturbances are often interpreted as being small, temporary eddies. In order to estimate the problems associated with the transport of contaminants by air, we must understand how this occurs. We must assume that, with traditional ventilation processes and the rules we apply, the air in the rooms is more or less turbulent.
The aim is to arrange ventilation in such a way that there is a certain basic flow of air. An organized basic flow implies that the flow can be characterized by means of stream lines, i.e., the paths taken by weightless particles in the room as they follow the air stream, if the turbulent fluctuations are ignored. The transport of contaminants due to streamline flow is often described as convective transport.
The simplest system for an analysis of the transport of contaminants by ventilation is, therefore, convective transport along the streamlines. The disturbances caused by turbulence (turbulent diffusion) are superimposed on this. Obviously, if there is no turbulence, turbulent diffusion is replaced by molecular diffusion or Brownian motion. It can generally be assumed, in regions with well-defined air flow fields, which the settling velocity of contaminants is negligible, which implies that gravitation plays an inferior role.

418
With the assumption of a constant value of the diffusion coefficient, the diffusion equation in a velocity field gives the simplest possible mathematical model that describes a system with regard to transport of contaminants emitted from a source at an arbitrary position.
In a vortex (rigid-body rotation) the mean value of the concentration, over the entire region inside the streamline where the point of emission is situated, is considerably higher than that of the outside. This allows us to use the concept of contamination accumulation in the context of vortices. It has also been shown by using visual illustrative methods that accumulation can occur in the wake of people or objects, provided that the contaminants are emitted in the vortex region. Special consideration must be taken with instabilities and vortices generated by the working person.
In all essentials, personal vortices are of two kinds. The first and relatively stable and stationary wakes created by the body. The second kind is the unstable and non-stationary vortices which arise as a consequence of the movements of the body. In this respect, it is obvious that the movements of the hands and arms play a significant part. With the visual illustrative methods it is easy to demonstrate that each of these two types of vortex is capable of destroying the intended beneficial effect of the ventilation system. Without further comments, some situations are shown in Figures 58.1 and 58.2.
Figure 58.1. Air flow structure downstream of a person.

419
Vortex street
Stagnationregion
Irrotationalvortices
Figure 58.2. Observed flow pattern behind an obstacle in a vertical unidirectional flow bench (long side).
58.2 REFERENCE
1. Ljungqvist, B. & Reinmüller, B. 2006. Practical Safety Ventilation in Pharmaceutical and Biotech Cleanrooms. PDA/DHI Publishing, LLC, River Grove, IL, 2006.

420
421
CHAPTER 59: AIRBORNE BIOCONTAMINATION IN CLEANROOMS SOME ASPECTS ON AIR
SAMPLERS
Bengt Ljungqvist and Berit Reinmüller KTH (Building Services Engineering), Stockholm, Sweden
In cleanrooms the main source of biocontamination is people. The concentration of airborne biocontamination depends upon the number of people present in a cleanroom, their level of activity, and the clothing systems used. There are several methods of measuring the airborne biocontamination and many published reports show that the results as number of colony forming units per cubic meter (CFU/m3) depend on the equipment used. The difference in results between microbiological air samplers often depend upon physical parameters of the samplers. These parameters, together with d50 that is the aerodynamic particle diameter where 50% of the particles are collected and 50% are not collected are discussed. In order to evaluate the collection efficiency of impaction air samplers, a simplified mathematical model will be presented and examples given.
59.1 INTRODUCTION
In cleanrooms the main source of biocontamination is people. The concentration of airborne biocontamination depends upon the number of people present in a cleanroom, their level of activity, and the clothing systems used. Usually, the processes carried out in cleanrooms are well controlled and do not contribute to the airborne biocontamination in the areas. The microbiological monitoring methods are challenged by the task to measure low concentration of airborne biocontamination.
In controlled areas the supply air may be of the same cleanliness as in the critical areas but processes and people are not controlled in the same way.

422
Microbiological methods used for monitoring air in controlled areas e.g., during operational or dynamic state should be able to measure both high and low concentrations of airborne microorganisms.
Monitoring of airborne viable particles can be considered as a specific form of aerosol measurement. The term aerosol means an assembly of liquid or solid particles in a gaseous medium (e.g., air) stabile enough to enable observation and measurement. Generally, the size of aerosol particles is in the range 0.001100 µm (1). The measuring devices collect particles from the air and give the collected viable microorganisms a possibility to multiply and be detected as CFUs.
Particle size, shape and density determine the behaviour of particles in air. A commonly used term in aerosol science and technology is the aerodynamic particle diameter, which is the diameter of a unit-density sphere (1 g/cm3) having the same value of physical properties as the irregularly shaped particle being studied. The particle diameter is in the literature also called equivalent diameter. Reference to the aerodynamic diameter of a particle is useful for describing settling and inertial behaviour. Large particles e.g., skin flakes, might have an inertial behaviour similar to that of a particle with smaller equivalent diameter. The motion of a particle is of concern for impaction sampling devices (e.g., slit-to-agar samplers, sieve-samplers, centrifugal samplers) and for settling plates.
59.2 SAMPLING EFFICIENCY
59.2.1 Physical Efficiency
The physical sampling efficiency of an aerosol sampler is influenced by inlet or extraction efficiency and by separation efficiency:
− Inlet or extraction efficiency is a function of the inlet design of the sampler and its ability to collect particles from the air in a representative way and transport the particles to the impaction nozzle or the filter.
− Separation efficiency is the ability of the sampling device to separate and collect particles of different sizes from the air stream by impaction onto the collection medium or into the filter medium.

423
The physical sampling efficiency is the same whether the particles consist of single microorganisms, carry microorganisms, or are nonviable (inanimate). The physical sampling efficiency is based on physical characteristics of the sampling device such as airflow, orifice shape, and orifice size. The d50 (cutoff size) describes the aerodynamic equivalent particle diameter removed by 50% from the air stream and impacted. The d50 -value can according to Hinds (2) and Nevalainen et al. (3) be calculated as follows:
CUStkDd h
ρη 50
509
= (1)
where η = Viscosity of air (g/(cm, s)) Dh = Hydraulic diameter of the air inlet nozzle (cm)
Stk50 = Stokes number that gives 50% collection efficiency (non-dimensional)
ρ = Particle density (g/cm3) U = Impact velocity (cm/s)
C = Cunningham correction factor used for particles smaller than 1 µm (non-dimensional).
Impactor collection data is usually given in terms of an aerodynamic d50 (ρ = 1 g/cm3) and the results of impactor measurements expressed in terms of aerodynamic diameter. The Cunningham correction factor could for particle sizes discussed here mostly be chosen to 1. For smaller particles and more accurate estimations see Hinds (2). It could be mentioned that such a correction for particles with diameters of 1 µm and 0.5 µm a reduction will occur with 8% and 14% respectively. The Stk50 number is often chosen to 0.24 to 0.25 for inlet nozzles, see e.g., Hinds (2) and Nevalainen et al. (3).
Most impaction sampling devices have sharp cutoff characteristics, meaning that almost all particles larger than that of d50 are collected. However, it is not yet common for manufacturers of microbiological samplers to present the d50 of their equipment. The Equation (1) can be simplified by using constant factors for air viscosity, particle density, and correction factor. The expression for d50 in µm will approximately become

424
U
Dd h×≈
4050 (2)
where Dh = Hydraulic diameter of the air inlet nozzle (mm) U = Impact velocity (m/s).
For a round opening the hydraulic diameter Dh is the hole diameter. For a rectangular long slit (length much larger than the width) the hydraulic diameter will approximately be twice the slit width.
EXAMPLE 1
Calculate d50 for an impaction sampler (Sieve Sampler) with a sampling air volume flow of 100 liters per minute and a lid with 200 holes of a diameter of 1 mm. The ratio between the air flow and the total area of the holes gives the impaction velocity to 10.6 m/s. With aid of Equation (2) the d50 will be estimated to 1.94 µm.
941610140
50 ..
d ≈×
≈
EXAMPLE 2
Calculate d50 for an impaction sampler (Slit Sampler) with a sampling air volume flow of 50 liters per minute and a rectangular inlet slit 1 mm wide and 25 mm long. The ratio between the air flow and the total area of the slit gives the impaction velocity to 33.3 m/s. With aid of Equation (2) the d50 will be estimated to 1.55 µm.
551333240
50 ..
d ≈×
≈
EXAMPLE 3
Calculate d50 for an impaction sampler (Sieve Sampler) with a sampling air volume flow of 100 liters per minute and a lid with 12 holes of a diameter of 10 mm. The ratio
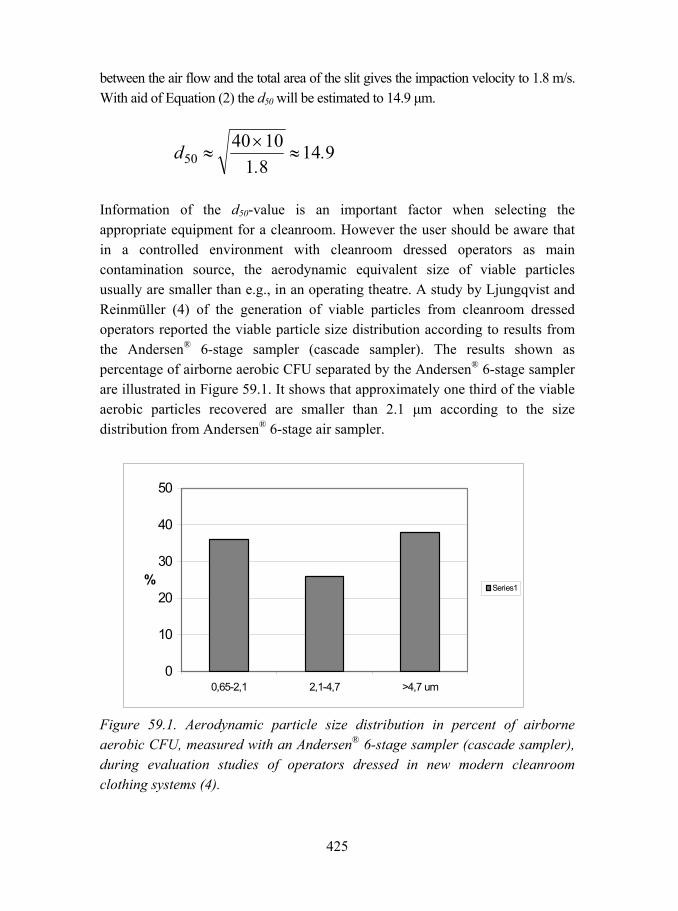
425
between the air flow and the total area of the slit gives the impaction velocity to 1.8 m/s. With aid of Equation (2) the d50 will be estimated to 14.9 µm.
914811040
50 ..
d ≈×
≈
Information of the d50-value is an important factor when selecting the appropriate equipment for a cleanroom. However the user should be aware that in a controlled environment with cleanroom dressed operators as main contamination source, the aerodynamic equivalent size of viable particles usually are smaller than e.g., in an operating theatre. A study by Ljungqvist and Reinmüller (4) of the generation of viable particles from cleanroom dressed operators reported the viable particle size distribution according to results from the Andersen® 6-stage sampler (cascade sampler). The results shown as percentage of airborne aerobic CFU separated by the Andersen® 6-stage sampler are illustrated in Figure 59.1. It shows that approximately one third of the viable aerobic particles recovered are smaller than 2.1 µm according to the size distribution from Andersen® 6-stage air sampler.
0
10
20
30
40
50
0,65-2,1 2,1-4,7 >4,7 um
%Series1
Figure 59.1. Aerodynamic particle size distribution in percent of airborne aerobic CFU, measured with an Andersen® 6-stage sampler (cascade sampler), during evaluation studies of operators dressed in new modern cleanroom clothing systems (4).

426
59.2.2 Biological Efficiency
The biological sampling efficiency, mostly below the physical sampling efficiency, is the ability to maintain the viability of the microorganisms during separation and collection in combination with the ability of the collection medium to support growth. Guidance on the evaluation of biological efficiency is presented in the ISO 14698-1 (5) in the informative Annex B. The method described is based on a method by Clark, Lach and Lidwell (6) and can not be carried out in a common microbiological laboratory. The test should preferably be performed in an independent test laboratory. The results of the tests are expected to be provided by the manufacturer of the air sampler.
The method makes use of airborne particles of different sizes containing spores of Bacillus subtilis var. niger NCTC 10073 which survives the sampling conditions. To obtain the concentration of spores in the test chamber a membrane filter is used. The concentration obtained from the test sampler is compared to the concentration from the membrane filter over five sizes between 0.8 and 15 µm. For each test at least 10 experiments should be carried out. The efficiency of the tested sampler is calculated using the following equation:
( ) ( ) 100×=samplermembranefromcounttotal
countsamplertest%samplerofEfficiency (3)
Measuring the biological efficiency with microorganism typically found in the cleanroom is suggested as a better method by Whyte (7). Whyte also points out the importance of testing the air sampler including the tube extension if tube extensions are used.
59.3 AIR SAMPLING
There are three main methods for collecting particles that are used for microbiological tests: impaction, filtration and sedimentation. Impaction and filtration methods are considered active sampling techniques and require the collection of a known air volume. Sedimentation is the passive collection of airborne viable contamination by fall out or settling into an open Petri dish.

427
The purpose of the active sampling procedure is to separate particles from the air at a representative location without affecting the viability of the microorganisms, and without altering the air flow pattern in the sampling region. The selection of the most appropriate sampling device for a particular application depends upon the following factors:
− Physical characteristics of the sampling equipment
− The type of viable particles to be sampled (single spores or cells that are carried by non-viable particles)
− The equivalent size of particles to be collected
− The sensitivity of the viable particles to the sampling procedure
− The expected concentration of CFU in the environment
− The ability to detect low levels of CFU in a reliable way
− The time and duration of the sampling
− The sampling location.
ISO 14698-1 (5) considers air samplers that collect viable particulates by direct impact of particles on nutrient media and filtration samplers that collect particles on special filters suitable for active sampling in clean zones with a low biocontamination. The impaction velocity should be high enough to separate particles down to approximately 1 µm and low enough to avoid mechanical damage of the cells. For cleanrooms applications, 1 m3 should be sampled in a reasonable time without drying the collection medium.
59.4 SUMMARY
To interpret the results from viable air sampling the user should understand the dynamics of sampling and collection of viable particles on the collection medium. Results of 0 CFU per cubic meter in manned cleanrooms could indicate that the sampling process, sampling location or the collection media, incubation time and temperature have not been optimized.
It is important to be aware of the limitations of each sampling method. Results achieved with one method must not be compared with results from another method

428
without careful investigation. To improve the evaluation of controlled environments based on achieved results, the air sampler used has to be specified. An air sampler must be selected based upon a careful evaluation of the characteristics of the sampler, the sampling conditions and sampling requirements.
59.5 REFERENCES
1. Willeke, K. & Baron, P.A. (eds.) Aerosol Measurement: Principles, Techniques and Applications. New York, Van Nostrand Reinhold, 1993.
2. Hinds W.C. Aerosol Technology, 2nd ed. New York: John Wiley & Sons, Inc, 1999.
3. Nevalainen, A., Willeke, K., Liebhaber, F., Pastuszka, J., Burge, H. & Henningson E. Bioaerosol Sampling. In: Willeke K, Baron PA, eds. Aerosol Measurement: Principles, Techniques and Applications. New York: Van Nostrand Reinhold, 1993, pp. 471492.
4. Ljungqvist, B. & Reinmüller, B. Cleanroom Clothing Systems, People as a Contamination Source. Bethesda, MD, PDA. River Grove, IL, DHI Publishing LLC, 2004.
5. ISO 14698-1 Cleanrooms and associated controlled environments Biocontamination control Part 1: General principles and methods. Geneva: International Organization for Standards, 2003.
6. Clark, S., Lach, V. & Lidwell, O.M. The performance of the Biotest RCS centrifugal air sampler. Journal of Hospital infection, 1981:2, pp. 181186.
7. Whyte, W. Collection efficiency of microbial methods used to monitor cleanrooms. European Journal of Parenteral &Pharmaceutical Sciences. 10(2), 2005, pp. 4350.

429
CHAPTER 60: DETERMINATION OF HUMAN PRIMARY PROTEINS IN CLEANROOM FACILITIES
USING FLUORESCENCE-BASED METHODS
Tommi Vehviläinen Axovaatio Ltd., Tampere, Finland
In this research, a fast, convenient, and sensitive method for monitor human contamination on surface and aerosol sedimentation samples in cleanroom environments has been developed. The different protein chemistry approaches were evaluated and optimized for the measurements of keratinous material. Two of the methods were based on fluorescence detection and one on UV absorbance measurements. The gel electrophoresis (SDS-PAGE) was used for protein characterizations. The six different gel visualization techniques were tested, of which four staining protocols were based on silver nitrate reaction, one fluorescence dye reaction and one on Coomassie Blue dye reactions. Keratin polypeptide segments were terminated with immunoblotting. Protein from the gel transferred to PVDF membrane and Western blotting was used on keratin detections. Monoclonal antibodies were tested with dot blotting. The human particle loads in sedimentation samples were determined as direct microscopy counts of FITC-labeled skin cells. The samples were collected from both cleanrooms and ordinary rooms for comparison purposes. The cleanroom samples were taken from the ISO 5 class and ISO 6 class cleanrooms. The data obtained shows that keratin is a sensitive indicator of human activity in cleanroom facilities. The described methods can be used to monitor human particle distributions and critical contamination areas in the cleanroom environment. The observed data can be utilized in development and troubleshooting tools to ensure an optimal cleanroom operations.

430
60.1 INTRODUCTION
The human particle contamination is the major quality problem in many industrial premises where production requires controlled environments. The contamination control is a key element in assuring product reliability in many high technology companies, such as biotechnology, microelectronics and semiconduction. Most particles within the cleanrooms are generated by humans due to mechanical frictions despite of good personal protection. The size of these particles varies from one to several hundred micrometers (Whyte, 2001; Lieberman, 1992). The cleanroom contamination control is based mainly on the measurements of particle distribution and microbiological monitoring in the clean zones. Most of these conventional monitoring methods are either laborious or have a low sensitivity for human particles. The protein chemistry approaches have seldom been used for the analysis of human activity in cleanroom facilities. The methodologies are versatile ranging in sensitivity, specificity, robustness and price.
Keratin represents the largest and most diverse group of intermediate filament (IF) proteins (Fuchs & Weber, 1994; Klymkowsky, 1995). Based on size, isoelectric point and structure homologies, keratins are divided into type I (4050 kDa, smaller acid) and type II (5565 kDa, larger neutral and basic) subfamilies (Eichner, Bonitz & Sun, 1984). Unlike other types of IF which are relatively simple in subunit composition, keratin composition is heterogeneous and varies depending on epithelial cell type (Lazarides, 1982). Keratin is hard to measure with traditional analytical tools since the protein is extremely poorly solubilised in ordinary buffers and the usage of strong chaotropic agents is needed. However, after it has been liberated in solution phase several possibilities exist such as gel electrophoresis in one or two dimensions (Laemmli, 1970; Hamers & Rickwood, 1981; Rabilloud, 1990; Sørensen et al., 2002; Westermeier, 2005) thereafter western blotting using suitable labelled antikeratin antibodies (Towbin et al. 1979; Knect &Dimond, 1984; Ramaekers et al., 1987; Fradelizi et al., 1999) or direct immunofluorescence keratin particle counting under microscope field. In this study, several protein chemistry methods have been used to develop tools for the analysis of keratin particles and concentration in cleanroom facilities. The study shows that the protein, and indirectly the amount of human activity, can be measured by simple and robust means in cleanroom settings.
431
60.2 MATERIALS AND METHODS
60.2.1 Comparison of the Extraction Buffers
Three different extraction methods were compared: acid/base neutralization (Chao & Nylander-French, 2004), conventional urea buffer (Sambrook & Russell, 2001) and modified Shindai method (Nakamura et al. 2002). A Human hair (of a Finnish man) was used as a protein standard. The protein extraction and the washing protocol was based on the method description provided by Nakamura et al. (2002). The human hair was washed with ethanol; external lipids were moved using a mixture of chloroform/methanol (2:1, v/v) for 24 h. The delipidized hair (10 mg) was mixed with different buffer solutions (total volume of 5 ml). In acid/base neutralization 10 mg of lipid free hair were dissolved with 1 M NaOH (2.5 ml), vortexes at various intervals over 2 h period and stored 4oC overnight or incubated at 50oC for 2 d. After incubation the hair samples were neutralised with 1 M HCl (2.5 ml).
In conventional protein extraction 10 mg of hair was mixed with a solution containing 8 M urea, 5% 2-mercaptoethanol (2-ME), 0.1% soudium atzide and 50 mM Tris-HCl, pH 9.5. The modified Shindai methods buffer contains 2.6 M thiourea, 5 M urea, 5% 2-ME, 0.1% soudium atzide and 50 mM Tris-HCl, pH 8.5. The hair samples were incubated at 50oC for 2 d. The mixtures were centrifuged at 15 000 x g for 20 min at room temperature. The obtained supernatants were uses as a hair protein fraction standard. The amounts of protein were determined by modified colometric method of Bradford (1976) using the Bio-Rad protein assay (Bio-Rad, Hercules, CA, USA). A standard curve was prepared using commercially available bovine serum albumin (BSA) (Molecular Probes, Inc.,Eugene, OR, USA) or human keratin (Sigma, St. Louis, MO, USA). The UV-absorbance measurements performed with a UV-1601 Shimadzu UV-Vis or Pharmacia Novaspec II spectrophotometer (Shimadzu Scientific Instruments, Inc., USA).
60.2.2 Sample Collection
The particles were sampled with sedimentation and surface sampling techniques. The samples were taken from both cleanrooms, where the air was filtered to remove particles, and ordinary rooms with unfiltered air. The cleanroom samples were collected from ISO 5 class and ISO 6 class cleanrooms. Sampling was

432
always performed on working days during working time. In this way environmental test conditions according to the ISO 14644-1:1999 standard under the heading in operation was fulfilled. The sedimentation samples were colleted on diameter of 60 mm sterile Petri plates (Sarstedt, Nümbrecht, Germany) for protein assay and epifluorescence samples on diameter of 90 mm Petri plates for microscopy analysis. Epifluorescence sample collectors have microscopy class plates (26 x 76 mm) on the each Petri plates. The swab samples were taken from selected surface areas (100 cm2) at each location using sterile buffer-moistened ATP-free polyester swabs (Copan Diacnostic, Inc.,CA USA), which were placed individually in labeled tubes (with 1 ml of buffer solution). Two swab samples and one sedimentation sample were analysed from each of 26 locations in ISO class cleanroom facilities. The normal sample collection period was two or four days depending on the cleaning sequences. In addition, the samples were collected in ordinary room for comparison purposes. The total background particle distribution was measured, before sampling according to ISO-14644:1999 standard with the optical particle counter (MET ONE 237 B from Pacific Scientific Instruments, Inc., CA, USA).
60.2.3 Sample Preparation
The sedimentation samples for the protein assay were dissolved into selected buffer system (3 ml) in ISO 4 class laminar flow cabinet. The dissolved samples were incubated for 24 h at 50 oC. The epifluorescence samples were fixed with the flame in laminar flow cabinet. After swabbing the surface samples were dissolved into selected buffer system (1 ml) in cleanrooms after swabbing. The swab samples were incubated for 24 h at 50 °C in the water bath.
60.2.4 Protein Quantisation
Protein content was determined using CBQCA (3-(4-carboxybenzoyl)quinoline-2-carboxaldehyde) or NanoOrange protein quantitation kits. The experimental protocol was based on the method description provided by the manufacture (Molecular Probes, Eugene, OR, USA). A protein standard curve was prepared using commercially available human keratin (Sigma, St. Louis, MO, USA) or bovine serum albumin (BSA) (Molecular Probes, Inc., Eugene, OR, USA). A dilution series was prepared resulting in final keratin concentrations of 10, 30, 60, 100, 300, 600, 1000, 3000 and 6000 ng/ml. Fluorescence emission intensities
433
were measured using Fluoroskan Ascent FL microplate reader (Thermo-Labsystems, Helsinki, Finland) with excitation at 485 nm and emission at 590 nm or 444 nm and 538 nm.
60.2.5 SDS-PAGE
Gel electrophoresis was used as a protein profiling in cleanroom samples. Tris-glysine SDS denaturing electrophoresis was performed by method of Laemmli (1970) with an 410% or 59% slab gels using a Bio-Rad Mini-PROTEAN® 3 Cell vertical electrophoresis system (Bio-Rad, Hercules, CA, USA). Running buffer was 25 mM Tris, 192 mM glycine, pH 8.3 and 0.1% SDS in normal silver staining or 0.05% SDS in SYPRO Orange staining.
60.2.6 Staining of Gels
The six different gel visualization techniques were tested. The silver nitrate reactions protocols were based on the method description provided by Merill et al. (1981), Blum et al. (1987), Heukeshoven et al. (1988) and Shevchenko et al. (1996). The Coomassie brilliant blue R-250 (CBB) staining was done by description of the Sambrook & Russell (2001). The experimental protocol of SYPRO Orange staining (Steinberg et al., 1996) was based on the method description provided by the manufacture (Molecular Probes, Eugene, OR, USA). The gels were photographed at KODAK DC290 digital camera with 49 mm SYBR® Gold -filter (KODAK Scientific Imaging System, Rochester, NY, USA). The protein bands were analysed by using KODAD 3.5 image analysis software.
60.2.7 Western Blotting (Dot Blotting)
Keratin bands were verified by western blotting using monoclonal mouse-anti human cytokeratin antibodies (Monoclonal mouse anti-pan cytokeratin Clone C-11, Sigma, MO, USA or mouse anti-human cytokeratin type I (AE1), Serotec, Oxford, UK). Antibodies were tested with dot blotting using 5 µl spots. Dot blotting can also be used in place of ELISA for semi-quantitative or quantitative determination of membrane-immobilised antigens (Pingoud et al. 2002). The detection process is the same as in western blotting. Protein were separated on 59% Tris-glycine SDS-PAGE gels and transferred onto a polyvinylidene difluoride (PVDF) membrane (Immobilon-P, Millipore or Immun-Blot, Bio-Rad)

434
using a Bio-Rad Mini Trans-Blot Cell electrophoretic transfer unit (Bio-Rad, Hercules, CA, USA). Modified Towbin et al. (1979) transferred buffer system (25 mM Tris, 195 mM glysiini, 20% metanoli, 0,05% SDS, pH 8.3) was used.
60.2.8 Epifluorescence Microscopy
The human particle loads in sedimentation samples were determined as direct microscopy counts of FITC-labeled skin cells. FITC-labelling protocol was modified using a normal cell labelling techniques which are based on different scientific publications (Waseem et al., 2004; Wöll et al., 2004; Carson 1997; Beltz & Burd, 1989; Talor, 1986). Direct immunofluorescence was performed using the monclonal human cytokeratin antibody conjugated with FITC. FITC-labeled skin cells were counted in Zeiss Axioscop 2 epifluorescence microscopy equipped with a HOB 103 illuminator (Zeiss, Oberkochen, Germany). Epifluorescence micrographs were taken using a Zeiss AxioCam MRc digital camera equipped with a MRGrab analysis software (MRGrab, Carl Zeiss Vision).
60.2.9 Statistical Analysis
The Students t-test with 95% confidence interval was used as the statistical analysis in particle measurements and NanoOrange validation. The protein standard calibration curves were fitted using the method of least squared. The MS Excel LINEST-function was used for evaluating uncertainness of the straight line fittings, including standard deviations of the slope, intercept, y-values and the regression sum of squares. The total uncertainties of protein measurement were evaluated with the minimal maximum error method using the LINES-function parameters. In addition, uncertainty in x-values was computed with using the variance-covariance matrix error analysis (Salter, 2000).
60.3 RESULTS
The Modified Shindai method buffer with combination of thiourea and urea increased the amounts of the protein extraction. The maximal protein yield was more than 70% of total mass. In the preliminary study, the Molecular Probes CBQCA (3-(4-carboxybenzoyl)quinoline-2-carboxaldehyde) protein assay gave a false positive result in conventional and Shindai method buffer systems. The

435
presence of free amines, thiols or thiolreducing reagents, like DTT and 2-ME, interferes significantly the measurements (You et al., 1997). Thus, another fluorescence-based protein assay was attempted. The total protein content was determined using NanoOrange protein quantitation kit (Molecular Probes, Eugene, OR, USA). An important advantage of the NanoOrange assay was its tolerance for presence of reducing agents (Jones et al., 2003). NanoOrange reagent binds to protein-lipid complexes by hydrophobic interactions (Molecular Probes, 2004; Jones et al., 2003; You et al., 1997). The colometric method of Bradford (1976) was used as a reference technique when the protein content was over 1 µg/ml.
The six different gel visualisation techniques were tested, of which two gave sufficient signal/background ration for human keratin. With the staining protocols of Heukeshoven et al. (1988) and Shevchenko et al. (1996) were obtained at best results and the detection limits of both methods were under nanogram levels. The detection level of the chromogenic western blotting kit remains to 3 µg/ml of human keratin.
In the ISO 5 class and ISO 6 class cleanrooms four days sedimentation sample gave sufficiently protein so that the protein concentration could be reliable defined. In the ISO 5 class cleanroom two days fluorescence signals collection with swab samples were too low in order to derive any accurate results, but in the ISO 6 class cleanroom detection levels were sufficient. The average protein concentrations in the ISO 6 class cleanroom were higher than in the ISO 5 class cleanroom. With the swab samples difference was clearer.
The sedimentation samples in ordinary rooms were approximately 50% higher than in ISO 6 class cleanrooms. The collection period was four days in both cases. With swab samples the average protein load of four days collection was about three times higher than the load of ISO 6 class cleanroom from two days collection. The direct microscopy counts of fluorescence particles gave values that were ten times higher in ordinary rooms than in ISO 6 class cleanrooms. However, due to different load of the rooms direct comparison could not be carried out.
In the terms of result given by this study all three methods, namely NanoOrange protein assay, SDS-PAGE protein profiling and Western Blotting can be used to determinate human contamination on surface and sedimentation samples in the cleanroom environment. Besides, microscopy counts on sedimentation samples

436
can be used as supporting methods for these analyses. Such supporting methods include direct microscopy counts of FITC-labeled skin cells, normal phase contrast microscopy and different electron microscopy techniques.
60.4 DISCUSSION
The personnel working in cleanrooms disperse large quantities of particles from their skin and clothing. The cleanroom contamination control is based on the measurements of particle distribution in the clean zones. The human contamination has been difficult to measure with traditional condition control methods. In addition, there is not a quantitative method for measuring human particles in cleanroom environment. Thus, how the human particles can be measured in a quantitative way was the main strategic problem of this study.
The main purpose of this research was to developed new methods for measurement of the human particle contaminations in the cleanroom facilities. Since keratins are the most abundant proteins in human outer layer of the skin, hair and nails, the human keratin proteins were used as an indicator to measure and to monitor the human contamination in the cleanroom environment. The aim of the study was to develop quantitative methods for outlining human particles, i.e. the human contamination in the cleanroom premises. The methods that were chosen for this study utilised existing protein chemistry and biochemistry assay techniques.
A major factor affecting the choice of reagents and instruments was the ease of use. When selecting the specific analytical methods, fluorescence-based assays were opted for their sensitivity and rapid applications. In the preliminary research it was observed that human particle load could be analysed with epifluorescence microscopy. Since epifluorescence microscopy is often laborious, measurements were focused in protein assays techniques. Epifluorescence microscopy was used mainly as a reference method to evaluate the results obtained with fluorometric measurements. Finally, the data obtained shows that keratin is a sensitive indicator of human activity in cleanroom facilities. The described methods can be used to monitor human particle distributions and critical contamination areas in the cleanroom environment. The observed data can be utilized in development and troubleshooting tools to ensure an optimal cleanroom operations.
437
60.5 REFERENCES
1. Beltz, B. & Burd, G. 1989. Immunocytochemical Techniques: Principles and Practice. Blackwell Scientific Publications, Inc. Massachusetts. 182 p.
2. Blum, H., Beier, H. & Gross, H. 1987. Improved Silver Staining of Plant Proteins, RNA and DNA in Polyacrylamide Gels. Electrophoresis, Vol. 8, pp. 9399.
3. Bradford, M.M. 1976. A rapid and sensitive method for the quantitation of microgram quantities of protein utilizing the principle of protein-dye binding. Anal Biochem., Vol. 72, pp. 248254.
4. Carson, F. 1997. Histotechnology: A Self-Instructional Text. 2nd Edition. ASCP Press, Chicago. 304 p.
5. Chao, Y.-C. & Nylander-French, L. 2004. Determination of Keratin Protein a Tape-stripped Skin Sample from Jet Fuel Exposed Skin. Ann. Occup. Hyg., Vol. 48, No. 1, pp. 6573.
6. Eichner, R., Bonitz, P. & Sun, T. 1984. Classification of epidermal keratins according to their immunoreactivity, isoelecric point, and mode of expression. J. Cell Biology, Vol. 98, pp. 13881396.
7. Fradelizi, J., Friederich, E., Beckerle, M.C. & Golsteyn, R.M. 1999. Quantitative measurement of proteins by Western blotting with Cy5-coupled secondary antibodies. BioTechniques, Vol. 26, pp. 484494.
8. Fuchs, E. & Weber, K. 1994. Intermediate filaments: structure, function, dynamics and disease. Annu. Rev. Biochem., Vol. 63, pp. 345382.
9. Hamers, B.D & Rickwood, D. 1981. Gel Electrophoresis of Protein: A Practical Approach. IRL Press Limited, London. 290 p.
10. Heukenshoven, J. & Denick, R. 1988. Improved Silver Staining Procedure for Fast Staining in PhastSystem Development Unit l. Staining of Sodium Dodecyl Sulfate Gels. Eletrophoresis, Vol. 9, pp. 2832.
11. ISO 14644-1. 1999. Cleanrooms and Associated Controlled environments-Part 1: Classification of Air Cleanliness. CEN-European Commission for Standardization. 37 p.

438
12. Jones, L., Haugland, R. & Singer, V. 2003. Development and Characterization of the NanoOrange Protein Quantitation Assay: A Fluorescence-Based Assay of Proteins in Solution. Biotechniques, Vol. 34, pp. 850861.
13. Klymkowsky, M. 1995. Intermediate filaments: more proteins, some answers, more questions. Curr. Opin. Cell. Biol., Vol. 7, pp. 4654.
14. Knect, D.A. & Dimond, R. 1984. Visualization of Antigenic Proteins on Western Blots. Anal. Biochem., Vol. 136, pp. 180184.
15. Lazarides, E. 1982. Intermediate filaments: a chemically heterogeneous, developmentally regulated class of proteins. Annu. Rev. Biochem., Vol. 51, pp. 219250.
16. Laemmli U.K. 1970. Cleavage of Structural Proteins during the Assembly of the Head of Bacteriophage T4. Nature., Vol. 227, pp. 680685.
17. Lieberman, A. 1992. Contamination Control and Cleanrooms: Problems, Engineering Solutions and Applications.Van Nostrand Reinhold, NY. 411 p.
18. Merril, C., Goldman, D., Sedman, S. & Ebert, M. 1981. Ultrasensitive Stain for Protein in Polyacrylamide Gels Shows Regional Variation in Cerebrospinal Fluid Proteins. Science, Vol. 211, pp. 14371438.
19. Molecular Probes. 2004. Quantitation and Purification of Proteins in Solution. In: Handbook of Fluorescent Probes and Research Products. 9th Edition. Molecular Probes, Inc.
20. Nakamura, A., Arimoto, M., Takeuchi, K & Fujii T. 2002. A Rapid Extraction Procedure of Human Hair Proteins and Identification of Phosphorylated Species. Biol.Pharm.Bull., Vol. 25, pp. 569572.
21. Pingoud, A., Urbanke, C., Hoggett, J. & Jeltsch, A. 2002. In: Biochemical Methods: A Concise Guide for Students and Researches. Wiley-VCH Verlag GmbH, Weinheim, pp. 234235.
22. Ramaekers, F., Huysmans, A., Schaart, G., Moesker, O. & Vooijs, P. 1987. Tissue distribution of keratin 7 as monitored by a monoclonal antibody. Experimental Cell Research, Vol. 170, pp. 235249.
23. Rabilloud, T. 1990. Mechanisms of Protein Silver Staining in Polyacrylamide Gels; A 10-year Synthesis. Electrophoresis, Vol. 10, pp. 785794.

439
24. Salter, C. 2000. Error analysis using the variance-covariance matrix. J. Chem. Ed., Vol. 77, pp. 1239.
25. Sambrook, J. & Russell, D. 2001. In: Molecular Cloning: A Laboratory Manual. Volume 3. 3th edition. Cold Spring Harbor Laboratory Press, NY. 765 p.
26. Shevchenko, A., Wilm, M., Vorm, O. & Mann, M. Mass Spectrometric Sequencing of Proteins from Silver-stained Polyacrylamide Gels. Anal. Chem., Vol. 68, pp. 850858.
27. Steinberg, T., Jones, L., Haugland, R. & Singer, V. 1996. SYPRO Orange and SYPRO Red Protein Gel Stains: One-Step Fluorescent Staining of Denaturing Gels for Detection of Nanogram Levels of Protein. Anal. Biochem., Vol. 239, pp. 223237.
28. Sørensen, B., Højrup, P., Østergård, E., Jørgensen, C., Enghild, J., Ryder, L. & Houen, G. 2002. Silver Staining of Protein on Electroblotting Menmbranes and Intensification of Silver Staining of Proteins Separated by Polyacrylamide Gel Electrophoresis. Anal. Biochem., Vol. 304, pp. 3341.
29. Talor, C. 1986. Immunomicroscopy: A Diagnostic Tool for the Surgical Pathologist. W.B Saunders Company, Philadelfia, PA. 452 p.
30. Towbin, H., Staehlin, T, & Gordon, J. 1979. Electrophoretic transfer of protein from polyacrylamide gels to nitrocellulose sheets: procedure and some aplications. Proc. Natl. Acad. Sci., Vol. 76, pp. 43504354.
31. Waseem, A., Karsten, U., Leigh, I., Purkis, P., Waseem, N. & Lane, B. 2004. Conformational Changes in the Rod Domain of Human Keratin 8 following Heterotypic Association with Keratin 18 and Ist Implication for Filament Stability. Biochemistry, Vol. 43, pp. 12831295.
32. Westermeier, R. 2005. Electrophoresis in Practice: A Guide to Methods and Applications of DNA and Protein Separations. 4th Edition. WILEY-VCH Verlag GmbH & Co. KGaA, Weinheim. 406 p.
33. Whyte, W. 2001. Cleanroom Technology: Fundamentals of Design, Testing and Operation. John Wiley & Sons, Ltd. Chichester; UK. 309 p.
34. Wöll, S., Windoffer, R. & Leube, R. 2004. Dissection of Keratin Dynamics: Different Contributions of the Actin and Microtubule Systems. European J. Cell Biol., Vol. 84, pp. 311328.

440
35. You, W., Haugland, R., Ryan, D. & Haugland, R. 1997. 3-(4-Carboxybenzoyl)quinoline-2-carbox-aldehyde, a Reagent with Broad Dynamic Range for the Assay of Proteins and Lipoproteins in Solution. Anal. Biochem., Vol. 244, pp. 277282.

441
CHAPTER 61: THEORETICAL ASPECTS ON ENVIRONMENTAL MONITORING IN PHARMACEUTICAL CLEANROOMS
Francesco Romano Politecnico di Milano, Milan, Italy &
KTH (Building Service Engineering), Stockholm, Sweden
Airborne particles are present throughout our environment. Particles vary greatly in their ability to affect not only visibility and climate, but also human health, quality of life and of industrial processes. Airborne particles are all examples of aerosols. Due to the large diversity of chemical, physical and microbiological properties existing among airborne particles, the way of performing measurements can not be the same for all the airborne particles present in the air environment. The measurement readings from a certain kind of airborne particle type may be different depending on the techniques and instruments used to perform the measurements. In the years, different methods and techniques were implemented and many instruments constructed in order to have the right equipment able to detect and to measure perfectly different kinds of airborne particles in their own environment without altering the real chemical, physical and microbiological characteristics. The theoretical aspects of environmental monitoring in pharmaceutical cleanrooms will be treated giving attention to the main measurement techniques used. Particle counters and microbiological air samplers are discussed taking into consideration the characteristics and the limitations they have under different working conditions. Results from experimental tests of different instruments are used for discussing the limitations of different instruments. Regulatory Requirements and Guidelines discussion help to find the specific field in which each measurement technique best fits the requirements.

442

443
CHAPTER 62: PARTICLE ENTRAINMENT OF AMBIENT ROOM AIR INTO THE OPERATING ZONE
PROTECTED BY UDF-CEILINGS
Johan Nordenadler Incoord AB, Stockholm, Sweden
62.1 INTRODUCTION
Nowadays, HEPA-filtered UDF-ceilings with supply air flows of about 10 000 m3/h and with an air velocity of less than 0.3 m/s are frequently installed in operating rooms. When installing a ventilation system in an operating room it is important to understand how contamination takes place in the operating room, how air velocities and air temperatures affect the cleanliness of the operating zone. The design of a realistic acceptance test for UDF-ceilings in operating rooms is the beginning of the research study Operating Room Ventilation; Risk Assessment and Quality Assurance, performed at Building Sciences Engineering, KTH. When using the LR-method, described by Ljungqvist and Reinmüller (1, 2 and 3) as an acceptance test similar to the test presented in Swiss Directives 99-3F (4), particle entrainment of ambient room air into the operating zone protected by UDF-ceilings has been observed.
62.2 EVALUATION METHODS
In an operating room, work is concentrated around the area of the patient where the operation takes place, and it is here that the critical emission of impurities occurs. The LR-method, with its visualization studies, challenge tests and risk factor calculations is essential to the detailed evaluation of processes involving human interventions. The LR-method is an engineering tool that allows details to be evaluated and provides valuable information concerning weak links. With visualization and particle measurements, the LR-method, can provide good information about air flow patterns and can identify potential risks during activity.

444
Particles at a concentration of not less than 300 000 particles equal and larger than 0.5 µm per cubic feet are generated in critical around and within the UDF-area. Through visualization of the smoke, sketches have been drawn, and in the measuring location on the operating table counts of airborne particles have been recorded.
62.3 RESULTS
Three different UDF-ceilings have been investigated and results from one of the rooms will be described in more details. The principal arrangement of the studied operation room is illustrate in Figure 62.1. The size of the room was 50 m2, the volume 150 m3 and the temperature in the room 20ûC. The square UDF ceiling had a size of 13 m2, supply air 10 400 m3 and 16 600 m3 per hour, variable air velocity 0.27 and 0.40 m/s respectively. The temperature of supply air was 20ûC.
Figure 62.1. Principal arrangement of the studied operation room.
At the set air velocity of 0.27 m/s, the acceptance test of the UDF-ceiling was performed without any persons or activity in the operating zone (comparable to at rest conditions). Operation lamps were placed in correct position and all lights were switched on (operation lamps and ceiling lights). Air velocities were measured at two different levels over the floor in the operating zone. Particles were generated at two levels outside the UDF ceiling. First particles were generated from floor level approx 0.2 m above the floor and followed by generation of particles from floor level up to11.5 meter in combination with one person moving outside the clean zone. Particles were also generated below the operating table. The number of

445
particles was measured within the operation zone 0.15 meter above the operation table. Regions of particle generation and measuring location are shown in Figure 62.2. The acceptance test was repeated at the set air velocity of 0.40 m/s. Results from the evaluation with the LR-Method without activity in the operating zone are summarized in Table 62.1 and Table 62.2.
Figure 62.2. Operation room with the operation zone covered by the UDF ceiling, position of operation lamps and operation table and particle generation locations (15).
Figure 62.3. Observed main air movements and particle dispersion routes below the UDF ceiling at the set air velocity 0.27 m/s.
Measuring point
4
Operating table
Operating lamp Operating
zone
1
3
2
5

446
Table 62.1. Evaluation with the LR-Method during at rest condition of operating zone. Set velocity 0.27 m/s.
Particle generation at location number Number of particles (≥ 0.5 µm/ft3)
measured above the operation table
1 Outside the UDF area 0.2 m above the floor 32
1 Outside the UDF area in combination with 1 person moving 779
2 Outside the UDF area 0.2 m above the floor 1
2 Outside the UDF area in combination with 1 person moving 0
3 Outside the UDF area 0.2 m above the floor 55 537
3 Outside the UDF area in combination with 1 person moving 1 015
4 Outside the UDF area 0.2 m above the floor 0
4 Outside the UDF area in combination with 1 person moving 17
5 Below the operation table 0.2 m above the floor 170 792
Table 62.2. Evaluation with the LR-Method during at rest condition of operating zone. Set velocities 0.40 m/s.
Particle generation at location number Number of particles (≥ 0.5 µm/ft3)
measured above the operation table
1 Outside the UDF area 0.2 m above the floor 1 383 (Leakage side wall ceiling
1 Outside the UDF area in combination with 1 person moving 213
2 Outside the UDF area 0.2 m above the floor 1
2 Outside the UDF area in combination with 1 person moving 3
3 Outside the UDF area 0.2 m above the floor 1
3 Outside the UDF area in combination with 1 person moving 1
4 Outside the UDF area 0.2 m above the floor 7
4 Outside the UDF area in combination with 1 person moving 6
5 Below the operation table 0.2 m above the floor 864
447
62.4 DISCUSSION
Results from the performed study indicate that the LR-Method, used for evaluation of UDF-systems in operating rooms, can provide valuable information about air flow patterns and dispersion routes of airborne contaminants. A combination of measuring air velocities at different levels below the UDF ceiling, visualization (by smoke studies) of air movements and particle measurements in the operating zone can reveal strong and weak aspects of UDF-ceilings.
The results also show that the ability of keeping a stabile vertical laminar airflow varies with the UDF-ceilings. The position of the operating lamps can reduce the effect of the parallel airflow. An air velocity of 0.40 m/s results in less particle entrainment from the ambient operating room into the operating zone compared to an air velocity of 0.27 m/s. At air velocities of 0.250.30 m/s the UDF-ceilings seem not to be able to maintain a clean zone with regard to particle cleanliness. The sweeping action can not be considered satisfactory. Vortices can occur downstream of obstacles, e.g., land tables. Operating clothing on legs and feet might be of importance.
To understand how contaminants are dispersed in operating rooms equipped with UDF-ceilings, future studies on different UDF-ceilings are necessary. Factors of interest to further studies are e.g., the influence of air velocities in the operating zone, human movements around the operating table, the positioning of people around the operation table, heat convection from the people and equipment, the use of side-walls around the UDF-ceilings, the influence of air temperatures in the operating room and clothing properties.
62.5 REFERENCES
1. Ljungqvist, B. & Reinmüller, B. (1995) Hazard Analyses of Airborne Contamination in Clean Rooms Application of a Method for Limitations of Risks, PDA J. Pharm. Sci. and Technol., Vol. 49, No 5, pp. 239243.

448
2. Ljungqvist, B. & Reinmüller, B. (1997) Clean Room Design; Minimizing Contamination Through Proper Design. Interpharm Press Inc., Buffalo Grove, IL.
3. Ljungqvist, B. & Reinmüller, B. (2002) Risk assessment with the LR-Method. European J. Parent. Sci., Vol. 7, No 4, pp. 105109.
4. Schweizerischer Verein von Wärme- und Klima-Ingenieuren, (2003). Richtlinie 99-3 Heizungs, Lüftungs- und Klimaanlagen in Spitalbauten (Planung, Bau, Betrieb), SWKI, Schönbühl.

449
CHAPTER 63: AIR MOVEMENTS AND PARTICLE DISPERSION IN UNIDIRECTIONAL AIRFLOW WITH
APPLICATION TO OPERATING ROOMS
Davy Sipilä KTH (Building Service Engineering), Stockholm, Sweden
In view of the discussions during the past few years about the ability of air distribution systems with unidirectional air flow to remove airborne contaminants in operating rooms, the author has performed tests in a test chamber with a parallel flow field of adjustable velocity. With aid of both smoke visualization and computer simulation, at as well laminar as turbulent parallel flow, it has been shown that the air movements behind obstacles become disordered with wakes and vortex streets. In order to observe the particle dispersion in parallel flows the particle level is increased in the air close to a person, and at the same time, the particle concentration in the critical region is measured. With this challenge test (LR-Method), it has been shown that the velocity of the parallel air flow has a decisive significance to the protection efficiency. When a person performs arm movements in a calm manner, the protection efficiency seems to be significant when the velocity exceeds 0.35 m/s.

Tim
e Pr
ogra
mm
e on
Mon
day
May
29th
, 200
6 8.
00 –
9.3
0 R
egis
trat
ion,
Exh
ibiti
on a
nd C
offe
e 9.
30 –
10.
00
Ope
ning
cer
emon
y, M
aarit
Kai
hlan
en, P
rogr
amm
e C
omm
ittee
& L
enna
rt H
ultb
erg,
Cha
irman
10.0
0 –
10.
45
Keyn
ote
1 –
The
Tec
hnol
ogy
City
of
Tam
pere
and
Bio
neXt
, Te
ro V
älim
aa, B
ioTa
mpe
re (
FI)
10.4
5 –
11.
30
Keyn
ote
2 –
SAF
EFO
OD
ERA
- Fo
od s
afet
y re
sear
ch p
rogr
amm
ing
in E
urop
e, O
ddur
Gun
nars
son,
NIC
e (N
O)
11.3
0 –
12.
15
Keyn
ote
3 –
Qua
lity
risk
asse
ssm
ent
in t
he p
harm
aceu
tical
indu
stry
, Cam
illa
Bolln
er &
Pet
ter
Gal
lon,
Ast
raZe
neca
(SE
)
12.1
5 –
13.3
0 Lu
nch
and
Exhi
bitio
n
Ph
arm
a se
ssio
n Fo
od s
essi
on
Cle
anro
om c
loth
ing
sess
ion
13.3
0 –
14.
00
GM
P in
spec
tions
of t
he s
teril
e m
anuf
actu
rers
– In
spec
tions
obs
erva
tions
, A
nne
Junt
tone
n, N
AM
(FI)
Risk
man
agem
ent
acco
rdin
g to
foo
d sa
fety
sta
ndar
ds,
Laur
a R
aask
a, V
TT (F
I) C
lean
room
clo
thin
g sy
stem
s –
test
resu
lts
Ber
it R
einm
ülle
r, K
TH (S
E)
14.0
0 –
14.
30
Rai
sing
the
test
ing
stan
dard
s th
roug
h th
e C
lean
room
Tes
ting
Cer
tific
atio
n B
oard
, N
eil S
teph
enso
n, D
OP
Sol
utio
ns L
td (U
K)
eLea
rnin
g as
a to
ol in
edu
catin
g hy
gien
e as
pect
s in
bi
otec
hnol
ogy
and
food
eng
inee
ring,
Tui
ja P
irttij
ärvi
, H
AM
K U
nive
rsity
of A
pplie
d S
cien
ces
(FI)
Cle
anro
om c
loth
ing
syst
ems
– so
me
calc
ulat
ions
B
engt
Lju
ngqv
ist,
KTH
(SE)
14.3
0 –
15.0
0 C
offe
e br
eak
and
Exhi
bitio
n
Zoni
ng in
food
pro
cess
ing
– re
quire
men
ts a
nd
exam
ples
, Jan
ne L
undé
n, U
nive
rsity
of H
elsi
nki (
FI)
Hum
an a
s a
parti
cle
sour
ce in
cle
anro
om,
Tuija
Luo
ma,
VTT
(FI)
Im
plem
enta
tion
and
cont
rol o
f the
EU
G
MP
in R
ussi
an p
harm
aceu
tical
indu
stry
, A
lexa
nder
Fed
otov
, AS
EN
MC
O (R
US
)
Cle
anro
om te
chno
logy
app
licat
ion
in a
bak
ery,
P
etri
Uot
ila, U
otila
n le
ipom
o O
y (F
I)
Man
agin
g st
atic
ele
ctric
ity a
nd p
artic
les
in
clea
nroo
ms
and
clea
n ar
eas,
Joh
anna
Ant
tila,
La
itosj
alki
ne O
y –
Laja
Pro
(FI)
15.0
0 –
15.
30
15
.30
– 1
6.00
16.0
0 –
16.
30
Par
amet
ric re
leas
e of
ste
rile
prod
ucts
–
requ
irem
ents
, im
plem
enta
tion
and
bene
fits,
Did
ier M
eyer
, Get
inge
La
Cal
hene
(FR
) R
isk
asse
ssm
ent o
f and
pro
tect
ive
mea
sure
s ag
ains
t m
icro
bial
thre
ats,
Lau
ra R
aask
a, V
TT (F
I) C
are
prog
ram
me
for c
lean
room
clo
thin
g,
Ann
a-Le
ena
Hyy
tiäin
en, L
inds
tröm
Oy
(FI)
18.0
0 –
18.3
0 B
us tr
ansp
orta
tion
from
Sca
ndic
Hot
el R
osen
dahl
to th
e C
ity R
ecep
tion
18.3
0 –
20.0
0 C
ity R
ecep
tion
20.0
0 –
23.0
0 Ev
enin
g pr
ogra
mm
e: V
isit
to V
iikin
saar
i (bu
ffet d
inne
r)

Prog
ram
me
on T
uesd
ay M
ay 3
0th, 2
006
Ph
arm
a se
ssio
n Fo
od s
essi
ons
Elec
tron
ics
sess
ion
Hos
pita
l ses
sion
8.
30
– 9.
00
Hyg
ieni
c in
tegr
atio
n in
pla
nt s
anita
tion,
B
o B
.B. J
ense
n, B
ioC
entru
m-D
TU (D
K)
Tran
smis
sion
mod
es o
f hos
pita
l acq
uire
d in
fect
ions
, Juk
ka L
umio
, TA
YK
S (F
I) P
lann
ing
cons
ider
atio
ns o
f a H
VA
C-
syst
em fo
r ste
rile
phar
mac
eutic
al
prod
uctio
n, J
ouko
Mie
svirt
a, E
lpis
Oy
(FI)
9.00
–
9.30
In
crea
sing
the
leve
l of h
ygie
ne in
EU
- th
e E
HE
DG
Tra
inin
g Fa
cilit
ator
and
tool
box,
B
o B
.B. J
ense
n, B
ioC
entru
m-D
TU (D
K)
Sol
utio
ns in
pre
vent
ing
hosp
ital i
nfec
tion
epid
emic
s –
view
of c
linic
ian,
Ja
nne
Lain
e, T
AY
KS
(FI)
9.30
- 1
0.00
Qua
lific
atio
n pr
oces
s of
a n
ew p
harm
a-ce
utic
al fa
cilit
y, G
ordo
n Fa
rquh
arso
n,
Bov
is L
end
Leas
e Lt
d (U
K)
Com
puta
tiona
l flu
id d
ynam
ics
as a
tool
in
plan
ning
cle
anin
g pr
oced
ures
for t
he fo
od
indu
stry
, Sat
u S
alo,
VTT
(FI)
STA
HA
Ann
ual m
eetin
g (fo
r mem
bers
onl
y)
Clin
ical
nee
ds a
nd c
urre
nt s
tand
ards
for
oper
atin
g ro
om a
ir, T
eija
-Kai
sa L
iljebl
ad,
Laur
ea U
nive
rsity
of A
pplie
d S
cien
ce (F
I)
10.0
0 - 1
1.00
C
offe
e br
eak
and
Exhi
bitio
n
11.0
0
– 11
.30
New
sur
face
mat
eria
ls fo
r foo
d pr
oces
s ap
plic
atio
ns, A
nne
Rits
chko
ff, V
TT (F
I)
Stu
dy o
f airb
orne
par
ticle
em
issi
ons
of
text
iles
durin
g pr
epar
atio
n fo
r sur
gica
l op
erat
ion,
Sal
me
Nur
mi,
VTT
(FI)
Mic
robi
olog
ical
Qua
lific
atio
n of
P
harm
aceu
tical
Cle
anro
om F
acili
ties,
G
erry
Pro
ut, K
enne
t Bio
serv
ices
Li
mite
d (U
K)
Par
ticle
con
tam
inan
ts in
ele
ctro
nics
m
anuf
actu
ring,
Pas
i Tam
min
en,
Nok
ia C
orpo
ratio
n (F
I) 11
.30
–
12.0
0 Fo
od h
ygie
ne n
etw
orki
ng in
Eur
ope,
G
un W
irtan
en, V
TT (F
I)
Stu
dy o
f par
ticle
em
issi
on a
nd e
lect
rost
atic
ch
arge
in c
ardi
ac s
urge
ry, A
nne
Lint
ukor
pi,
Uud
enm
aan
Sai
raal
apes
ula
Oy
(FI)
12.0
0
– 12
.30
Cle
anin
g an
d di
sinf
ectio
n ag
ents
of
phar
mac
eutic
al c
lean
room
– m
odes
of
actio
n, u
sage
and
requ
irem
ents
, Kar
en
Ros
sing
ton,
Shi
eld
Med
icar
e (U
K)
Food
hyg
iene
in E
ston
ia, R
aivo
Vok
k,
Talli
nn U
nive
rsity
of T
echn
olog
y (E
E)
Ena
blin
g te
chno
logi
es fo
r cle
an
man
ufac
turin
g of
ele
ctro
nics
, M
atti
Leht
imäk
i, V
TT (F
I) O
verv
iew
of s
tand
ardi
satio
n pr
ojec
ts o
f ho
spita
l tex
tiles
in C
EN,
Aul
i Pyl
sy, T
evas
ta ry
. (FI
) 12
.30
– 14
.00
Lunc
h an
d Ex
hibi
tion
14.0
0
– 14
.30
Dry
Fogg
ing
as a
new
tech
nolo
gy to
di
sinf
ect c
lean
room
s D
omin
ique
Le
qler
cq, M
innt
ech
BV
(NL)
Lubr
ican
ts –
are
they
a s
ourc
e fo
r mic
robi
al
cont
amin
atio
n in
the
food
indu
stry
?,
Kaa
rina
Aar
nisa
lo, V
TT (F
I)
New
ele
ctro
stat
ic d
issi
pativ
e pl
astic
m
ater
ials
for c
lean
room
app
licat
ions
,A
ntti
Hel
min
en, P
rem
ix O
y (F
I)
Bac
teria
l adh
eren
ce, p
enet
ratio
n an
d su
rviv
al
on d
iffer
ent s
urfa
ces
and
mat
eria
ls,
Kirs
i Lai
tinen
, Uni
vers
ity o
f Hel
sink
i (FI
)
14.3
0
– 15
.00
Cle
anin
g an
d di
sinf
ectin
g of
cl
eanr
oom
s - A
val
idat
ion
pers
pect
ive,
E
lain
e P
ears
, Eco
lab
(UK
)
Food
saf
ety
in th
e E
urop
ean
Tech
nolo
gy
Pla
tform
Foo
d fo
r Life
, Har
men
Hof
stra
, S
AFE
Con
sorti
um (B
E)
ES
D p
rote
ctiv
e re
quire
men
ts fo
r cl
eanr
oom
clo
thin
g,
Lars
Fas
t, S
P-E
lect
roni
cs (S
E)
Dis
infe
ctio
n in
hos
pita
ls in
the
new
m
illenn
ium
, Rei
jo S
auna
mäk
i,
Sof
t Pro
tect
or L
td (F
I) 15
.00
– 15
.30
Cof
fee
brea
k an
d Ex
hibi
tion
15.3
0
– 16
.15
Opt
imum
wip
er c
hara
cter
istic
s fo
r the
cl
eani
ng a
nd d
isin
fect
ion
of
phar
mac
eutic
al c
lean
room
s, H
owar
d S
iege
rman
, ITW
Tex
wip
e (U
SA
)
Com
paris
on o
f diff
eren
t tes
t met
hods
for
test
ing
fabr
ics
for u
se in
hig
h hy
gien
e ar
ea,
Lore
nz M
icha
el, L
. Mic
hael
Oy,
(FI)
and
Tuija
Luo
ma,
VTT
(FI)
Exa
mpl
e ca
se o
f cle
an m
anuf
actu
ring
of m
icro
elec
troni
cs, M
aria
nne
Pul
kkin
en, V
TI T
echn
olog
ies
Oy
(FI)
Ven
tilat
ion
syst
ems
in th
e fu
ture
ope
ratin
g th
eatre
s, K
jell
Rös
jö, A
ET-
Arb
eids
milj
ö og
E
nerg
itekn
ikk
AS
(NO
)
16.3
0 –
17.4
5 Th
e A
nnua
l mee
ting
of th
e So
ciet
y N
ordi
c C
lean
room
Tec
hnol
ogy
(for m
embe
rs o
nly)
19
.30
– 24
.00
Tang
o ev
enin
g (B
anqu
et) a
t Sca
ndic
Hot
el R
osen
dahl
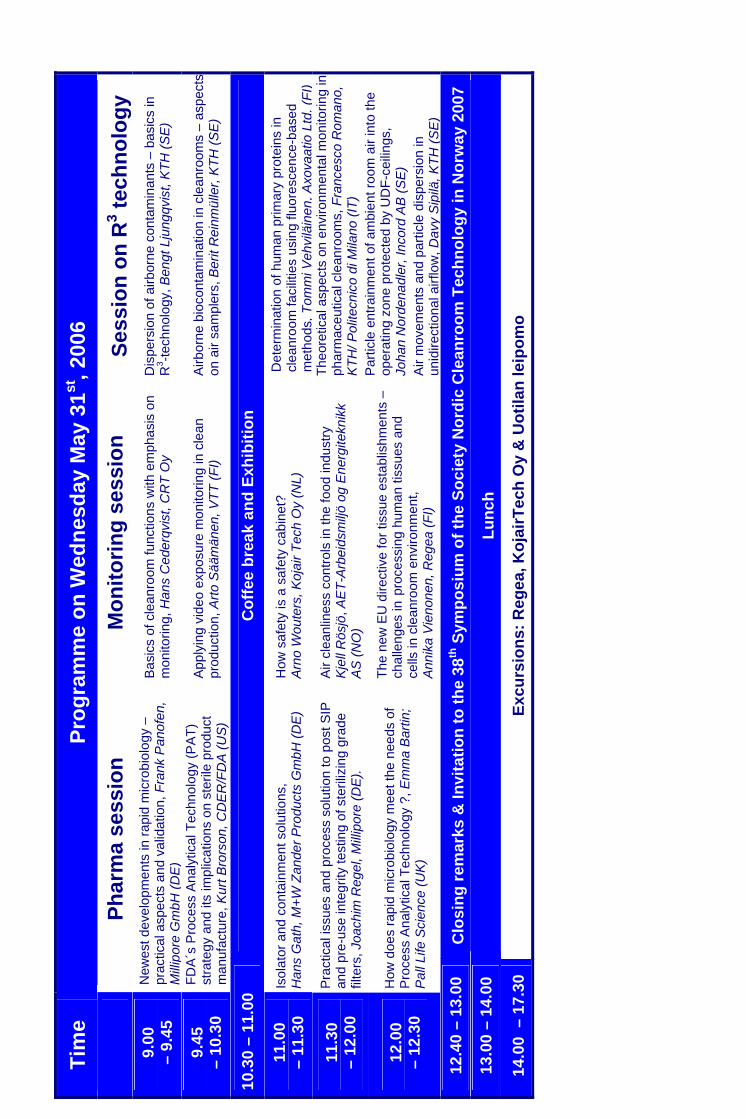
Tim
e Pr
ogra
mm
e on
Wed
nesd
ay M
ay 3
1st, 2
006
Ph
arm
a se
ssio
n M
onito
ring
sess
ion
Sess
ion
on R
3 tech
nolo
gy
9.00
–
9.45
N
ewes
t dev
elop
men
ts in
rapi
d m
icro
biol
ogy
– pr
actic
al a
spec
ts a
nd v
alid
atio
n, F
rank
Pan
ofen
, M
illi p
ore
Gm
bH (D
E)
Bas
ics
of c
lean
room
func
tions
with
em
phas
is o
n m
onito
ring,
Han
s C
eder
qvis
t, C
RT
Oy
Dis
pers
ion
of a
irbor
ne c
onta
min
ants
– b
asic
s in
R
3 -tech
nolo
gy, B
engt
Lju
ngqv
ist,
KTH
(SE
)
9.45
–
10.3
0 FD
A´s
Pro
cess
Ana
lytic
al T
echn
olog
y (P
AT)
st
rate
gy a
nd it
s im
plic
atio
ns o
n st
erile
pro
duct
m
anuf
actu
re, K
urt B
rors
on, C
DE
R/F
DA
(US
)
App
lyin
g vi
deo
expo
sure
mon
itorin
g in
cle
an
prod
uctio
n, A
rto S
ääm
änen
, VTT
(FI)
Airb
orne
bio
cont
amin
atio
n in
cle
anro
oms
– as
pect
son
air
sam
pler
s, B
erit
Rei
nmül
ler,
KTH
(SE
)
10.3
0 –
11.0
0 C
offe
e br
eak
and
Exhi
bitio
n
11.0
0
– 11
.30
Isol
ator
and
con
tain
men
t sol
utio
ns,
Han
s G
ath,
M+W
Zan
der P
rodu
cts
Gm
bH (D
E)
How
saf
ety
is a
saf
ety
cabi
net?
A
rno
Wou
ters
, Koj
air T
ech
Oy
(NL)
D
eter
min
atio
n of
hum
an p
rimar
y pr
otei
ns in
cl
eanr
oom
faci
litie
s us
ing
fluor
esce
nce-
base
d m
etho
ds, T
omm
i Veh
vilä
inen
, Axo
vaat
io L
td. (
FI)
11.3
0
– 12
.00
Pra
ctic
al is
sues
and
pro
cess
sol
utio
n to
pos
t SIP
an
d pr
e-us
e in
tegr
ity te
stin
g of
ste
riliz
ing
grad
e fil
ters
, Joa
chim
Reg
el, M
illip
ore
(DE)
.
Air
clea
nlin
ess
cont
rols
in th
e fo
od in
dust
ry
Kje
ll R
ösjö
, AE
T-A
rbei
dsm
iljö o
g E
nerg
itekn
ikk
AS
(NO
)
12.0
0
– 12
.30
How
doe
s ra
pid
mic
robi
olog
y m
eet t
he n
eeds
of
Pro
cess
Ana
lytic
al T
echn
olog
y ?,
Em
ma
Bar
tin;
Pal
l Life
Sci
ence
(UK
)
The
new
EU
dire
ctiv
e fo
r tis
sue
esta
blis
hmen
ts –
ch
alle
nges
in p
roce
ssin
g hu
man
tiss
ues
and
cells
in c
lean
room
env
ironm
ent,
A
nnik
a V
ieno
nen,
Reg
ea (F
I)
Theo
retic
al a
spec
ts o
n en
viro
nmen
tal m
onito
ring
in
phar
mac
eutic
al c
lean
room
s, F
ranc
esco
Rom
ano,
K
TH/ P
olite
cnic
o di
Mila
no (I
T)
Par
ticle
ent
rain
men
t of a
mbi
ent r
oom
air
into
the
oper
atin
g zo
ne p
rote
cted
by
UD
F-ce
ilings
, Jo
han
Nor
dena
dler
, Inc
ord
AB
(SE
) A
ir m
ovem
ents
and
par
ticle
dis
pers
ion
in
unid
irect
iona
l airf
low
, Dav
y S
ipilä
, KTH
(SE
) 12
.40
– 13
.00
Clo
sing
rem
arks
& In
vita
tion
to th
e 38
th S
ympo
sium
of t
he S
ocie
ty N
ordi
c C
lean
room
Tec
hnol
ogy
in N
orw
ay 2
007
13.0
0 –
14.0
0 Lu
nch
14.0
0 –
17.
30
Excu
rsio
ns: R
egea
, Koj
airT
ech
Oy
& U
otila
n le
ipom
o

Published by
Series title, number and report code of publication
VTT Symposium 240 VTTSYMP240
Author(s) Wirtanen, Gun & Salo, Satu Title
37TH R3-NORDIC CONTAMINATION CONTROL SYMPOSIUM Abstract R3-Nordic, the Nordic Society of Cleanroom Technology, is a non-profit, independent society with a well established network for research, education, product development and production in cleanroom technology and contamination control in the Nordic countries. The venue of the 37th annual symposium is Scandic Hotel Rosendahl in Tampere. The aim of this symposium is to provide knowledge of contamination control and clean room technology dealing with topics in the pharmaceutical, food, and electronics industries as well as hospitals. The topics at the 37th R3-Nordic Contamination Control Symposium are clean room technology and management, clean room clothing, contamination control and cleaning, strategies for process analytical technology, environmental monitoring and risk management in production, process design and R3 technology. We wish that this event will be fruitful in giving background information and new ideas to all participants in the symposium and exhibition as well as readers of the proceedings. Keywords contamination control, cleanroom, clean room, air handling, process hygiene, cleaning, disinfection, decontamination, biocontamination, isolators, cleanroom clothing, process design, hygienic integration, monitoring, Process analytical technology, PAT, electrostatic discharge, ESD, R3 technology, food industry, pharmaceutical industry, electronics, hospital, operating theatre, risk assessment, eLearning
ISBN 9513863034 (soft back ed.) 9513863042 (URL: http://www.vtt.fi/publications/index.jsp)
Series title and ISSN Project number VTT Symposium 03579387 (soft back ed.) 14550873 (URL: http://www.vtt.fi/publications/index.jsp)
Date Language Pages Price May 2006 English 449 p. + app. 3 p. J
Contact Sold by VTT Technical Research Centre of Finland Tietotie 2, P.O. Box 1000 FI-02044 VTT, Finland Phone internat. +358 20 722 111 Fax +358 20 722 7071
VTT Technical Research Centre of Finland P.O.Box 1000 FI-02044 VTT, Finland Phone internat. +358 20 722 4404 Fax +358 20 722 4374

VTT SY
MPO
SIUM
24037
th R3N
ORD
IC. Contamination Control Sym
posium
Tätä julkaisua myy Denna publikation säljs av This publication is available from
VTT VTT VTTPL 1000 PB 1000 P.O. Box 1000
02044 VTT 02044 VTT FI02044 VTT, FinlandPuh. 020 722 4404 Tel. 020 722 4404 Phone internat. +358 20 722 4404Faksi 020 722 4374 Fax 020 722 4374 Fax +358 20 722 4374
ISBN 951– 38– 6303– 4 (soft back ed.) ISBN 951– 38– 6304– 2 (URL: http://www.vtt.fi/inf/pdf/)ISSN 0357– 9387 (soft back ed.) ISSN 1455– 0873 (URL: http://www.vtt.fi/inf/pdf/)
ESPOO 2006 VTT SYMPOSIUM 240
37th R3NORDICContamination Control Symposium
R3Nordic, the Nordic Society of Cleanroom Technology, is a nonprofit,independent society with a well established network for research, education,product development and production in cleanroom technology andcontamination control in the Nordic countries. The venue of the 37th annualsymposium is Scandic Hotel Rosendahl in Tampere. The aim of thissymposium is to provide knowledge of contamination control and cleanroom technology dealing with topics in the pharmaceutical, food, andelectronics industries as well as hospitals. The topics at the 37th
R3Nordic Contamination Control Symposium are clean room technologyand management, clean room clothing, contamination control andcleaning, strategies for process analytical technology, environmentalmonitoring and risk management in production, process design and R3
technology. We wish that this event will be fruitful in giving backgroundinformation and new ideas to all participants in the symposium andexhibition as well as readers of the proceedings.