Embed Size (px)
Citation preview
What Economics Is About 1Jackie and Stephanie share an apartment about a mile from West Virginia University. Both are juniors at the univer-sity; Jackie is a history major, and Stephanie is an economics major. The following events occurred one day not toolong ago.
Settingthe Scene
7 : 1 5 A . M .
Jackie’s alarm clock buzzes. She reachesover to the small table next to her bed andturns it off. As she pulls the covers backup, Jackie thinks about her 8:30 Americanhistory class. Should she go to class todayor sleep a little longer? She worked latelast night and really hasn’t had enoughsleep. Besides, she’s fairly sure her professorwill be discussing a subject she alreadyknows well. Maybe it would be okay tomiss class today.
11 : 3 7 A . M .
Stephanie is in the campus bookstorebrowsing through two economics books.She ends up buying both books.As she
leaves the bookstore, she glances over at ablue jacket with the West Virginia Univer-sity emblem on it. She knows that herbrother, who is a junior in high school,would like to have a WVU jacket.Stephanie tells herself that she might buyhim the jacket for his birthday nextmonth.
1 : 2 7 P. M .
Jackie, who did skip her 8:30 Americanhistory class, is in her European historyprofessor’s office talking to him aboutobtaining a master’s degree in history.Getting a master’s degree is somethingthat mildly interests her, but she’s not surewhether she wants it enough or not.
9 : 0 0 P. M .
Stephanie has been studying for the pastthree hours for tomorrow’s midtermexam in her International Economicscourse. She says to herself, I don’t thinkmore studying will do very much good.So she quits studying and turns on the tel-evision to watch a rerun of one of herfavorite movies, Sleepless in Seattle.
Here are some questions to keep in mind as you read this chapter:
c h a p t e r
?• Is Jackie more likely to miss some
classes than she is to miss otherclasses? What determines whichclasses Jackie will attend and whichclasses she won’t attend?
• What does a basic economic facthave to do with Stephanie’s buyingtwo books at her campus bookstore?
• Does whether or not Jackie will goon to get a master’s degree haveanything to do with economics?
• Stephanie stopped studying at 9:00P.M. Would she have been better offif she had studied 30 more minutes?
See at the end ofthis chapter for answers to these questions.
analyzing the scene
©A
SS
OC
IAT
ED
PR
ES
S,
CH
AR
LES
TON
DA
ILY
MA
IL
38014_01_c01_001-016.qxd 11/10/06 4:50 PM Page 1
A Definition of Economics In this section, we discuss a few key economic concepts; then we incorporate knowledgeof these concepts into a definition of economics.
Goods and BadsEconomists talk about goods and bads. A good is anything that gives a person utility orsatisfaction.A good can be tangible or intangible. If a computer gives you utility or satis-faction, then it is a good. If friendship gives you utility or satisfaction, then it is a good.(A computer is a tangible good, and friendship is an intangible good.)
A bad is something that gives a person disutility or dissatisfaction. If the flu givesyou disutility or dissatisfaction, then it is a bad. If the constant nagging of an acquain-tance is something that gives you disutility or dissatisfaction, then it is a bad.
People want goods and they do not want bads. In fact, they will pay to get goods(“Here is $1,000 for the computer”), and they will pay to get rid of bads they currentlyhave (“I’d be willing to pay you, doctor, if you can prescribe something that will shortenthe time I have the flu”).
ResourcesGoods do not just appear before us when we snap our fingers. It takes resources to pro-duce goods. (Sometimes resources are referred to as inputs or factors of production.)
Generally, economists divide resources into four broad categories: land, labor, capital,and entrepreneurship. Land includes natural resources, such as minerals, forests, water, andunimproved land. For example, oil, wood, and animals fall into this category. (Sometimeseconomists refer to this category simply as natural resources.)
Labor consists of the physical and mental talents people contribute to the produc-tion process. For example, a person building a house is using his or her own labor.
Capital consists of produced goods that can be used as inputs for further produc-tion. Factories, machinery, tools, computers, and buildings are examples of capital. Onecountry might have more capital than another. This means that it has more factories,machinery, tools, and so on.
Entrepreneurship refers to the particular talent that some people have for organ-izing the resources of land, labor, and capital to produce goods, seek new business oppor-tunities, and develop new ways of doing things.
Scarcity and a Definition of Economics We are now ready to define a key concept in economics: scarcity.Scarcity is the condition in which our wants (for goods) are greaterthan the limited resources (land, labor, capital, and entrepreneurship)available to satisfy those wants. In other words, we want goods, butthere are just not enough resources available to provide us with allthe goods we want.
Look at it this way: Our wants (for goods) are infinite, but ourresources (which we need to produce the goods) are finite. Scarcityis our infinite wants hitting up against finite resources.
Many economists say that if scarcity didn’t exist, neither wouldeconomics. In other words, if our wants weren’t greater than thelimited resources available to satisfy them, there would be no field ofstudy called economics. This is similar to saying that if matter and
2 Part 1 Economics: The Science of Scarcity
The economist says that every-
one in the world—no matter
how rich—has to face scarcity. But what about Bill
Gates, the cofounder of Microsoft and a billionaire? He
may be able to satisfy more of his wants for tangible
goods (houses, cars) than most people, but this doesn’t
mean he has the resources to satisfy all his wants. His
wants might include more time with his children, more
friendship, no disease in the world, peace on earth, and
a hundred other things that he does not have the
resources to “produce.”
Thinking likeAN ECONOMIST
Good Anything from which individualsreceive utility or satisfaction.Utility The satisfaction one receives from agood.BadAnything from which individualsreceive disutility or dissatisfaction.DisutilityThe dissatisfaction one receives froma bad.LandAll natural resources, such asminerals, forests, water, andunimproved land.LaborThe physical and mental talentspeople contribute to the productionprocess.CapitalProduced goods that can be used asinputs for further production, such asfactories, machinery, tools, computers,and buildings.EntrepreneurshipThe particular talent that some peoplehave for organizing the resources ofland, labor, and capital to producegoods, seek new business opportuni-ties, and develop new ways of doingthings.ScarcityThe condition in which our wants aregreater than the limited resourcesavailable to satisfy those wants.
38014_01_c01_001-016.qxd 11/10/06 4:50 PM Page 2
motion didn’t exist, neither would physics, or that if living things didn’t exist, neitherwould biology. For this reason, we define economics in this text as the science ofscarcity. More completely, economics is the science of how individuals and societies dealwith the fact that wants are greater than the limited resources available to satisfy thosewants.
THINKING IN TERMS OF SCARCITY’S EFFECTS Scarcity has effects. Here are three: (1) theneed to make choices, (2) the need for a rationing device, and (3) competition. Wedescribe each.
Choices People have to make choices because of scarcity. Because our unlimitedwants are greater than our limited resources, some wants must go unsatisfied. We mustchoose which wants we will satisfy and which we will not. Jeremy asks: Do I go toHawaii or do I pay off my car loan earlier? Ellen asks: Do I buy the new sweater or twonew shirts?
What Economics Is About Chapter 1 3
economics 24/7
24
You are going to tell me what I want to know, it’s just a mat-ter of how much you want to hurt.
—Jack Bauer
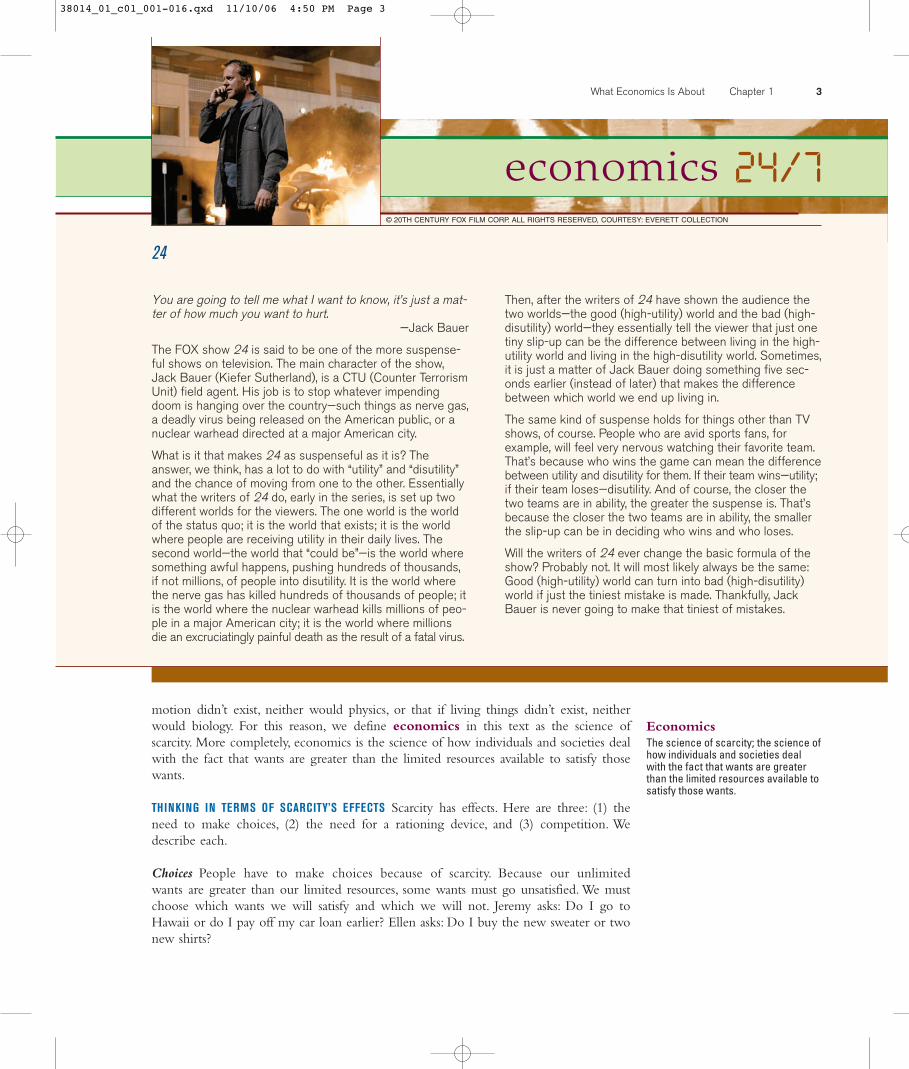
The FOX show 24 is said to be one of the more suspense-ful shows on television. The main character of the show,Jack Bauer (Kiefer Sutherland), is a CTU (Counter TerrorismUnit) field agent. His job is to stop whatever impendingdoom is hanging over the country—such things as nerve gas,a deadly virus being released on the American public, or anuclear warhead directed at a major American city.
What is it that makes 24 as suspenseful as it is? Theanswer, we think, has a lot to do with “utility” and “disutility”and the chance of moving from one to the other. Essentiallywhat the writers of 24 do, early in the series, is set up twodifferent worlds for the viewers. The one world is the worldof the status quo; it is the world that exists; it is the worldwhere people are receiving utility in their daily lives. Thesecond world—the world that “could be”—is the world wheresomething awful happens, pushing hundreds of thousands,if not millions, of people into disutility. It is the world wherethe nerve gas has killed hundreds of thousands of people; itis the world where the nuclear warhead kills millions of peo-ple in a major American city; it is the world where millionsdie an excruciatingly painful death as the result of a fatal virus.
Then, after the writers of 24 have shown the audience thetwo worlds—the good (high-utility) world and the bad (high-disutility) world—they essentially tell the viewer that just onetiny slip-up can be the difference between living in the high-utility world and living in the high-disutility world. Sometimes,it is just a matter of Jack Bauer doing something five sec-onds earlier (instead of later) that makes the differencebetween which world we end up living in.
The same kind of suspense holds for things other than TVshows, of course. People who are avid sports fans, forexample, will feel very nervous watching their favorite team.That’s because who wins the game can mean the differencebetween utility and disutility for them. If their team wins—utility;if their team loses—disutility. And of course, the closer thetwo teams are in ability, the greater the suspense is. That’sbecause the closer the two teams are in ability, the smallerthe slip-up can be in deciding who wins and who loses.
Will the writers of 24 ever change the basic formula of theshow? Probably not. It will most likely always be the same:Good (high-utility) world can turn into bad (high-disutility)world if just the tiniest mistake is made. Thankfully, JackBauer is never going to make that tiniest of mistakes.
© 20TH CENTURY FOX FILM CORP. ALL RIGHTS RESERVED, COURTESY: EVERETT COLLECTION
EconomicsThe science of scarcity; the science ofhow individuals and societies dealwith the fact that wants are greaterthan the limited resources available tosatisfy those wants.
38014_01_c01_001-016.qxd 11/10/06 4:50 PM Page 3
Need for a Rationing Device A rationing device is a means of deciding who getswhat. Scarcity implies the need for a rationing device. If people have infinite wants forgoods and there are only limited resources to produce the goods, then a rationing devicemust be used to decide who gets the available quantity of goods. Dollar price is arationing device. For example, there are 100 cars on the lot and everyone wants a newcar. How do we decide who gets what quantity of the new cars? The answer is “use therationing device dollar price.” Those people who pay the dollar price for the new carend up with a new car.
Is dollar price a fair rationing device? Doesn’t it discriminate against the poor? Afterall, the poor have fewer dollars than the rich, so the rich can get more of what theywant than can the poor.True, dollar price does discriminate against the poor. But then,as the economist knows, every rationing device discriminates against someone.
Suppose that dollar price could not be used as a rationing device tomorrow. Somerationing device would still be necessary because scarcity would still exist. How wouldwe ration gas at the gasoline station, food in the grocery store, or tickets for the SuperBowl? Let’s consider some alternatives to dollar price as a rationing device.
Suppose first come, first served is the rationing device. For example, suppose thereare only 40,000 Super Bowl tickets. If you are one of the first 40,000 in line for a SuperBowl ticket, then you get a ticket. If you are the 40,001st person in line, you don’t. Sucha method discriminates against those who can’t get in line quickly. What about slowwalkers or people with a disability? What about people without cars who can’t drive towhere the tickets are distributed?
Or suppose brute force is the rationing device. For example, if there are 40,000Super Bowl tickets, then as long as you can take a ticket away from someone who has aticket, the ticket is yours. Who does this rationing method discriminate against? Obvi-ously, it discriminates against the weak.
Or suppose beauty is the rationing device. The more beautiful you are, the betteryour chance of getting a Super Bowl ticket. Again, the rationing device discriminatesagainst someone.
These and many other alternatives to dollar price could be used as a rationingdevice. However, each discriminates against someone, and none is clearly superior todollar price.
In addition, if first come, first served, brute force, beauty, or another alternative todollar price is the rationing device, what incentive would the producer of a good haveto produce the good? With dollar price as a rationing device, a person produces comput-ers and sells them for money. He then takes the money and buys what he wants. But ifthe rationing device were, say, brute force, he would not have an incentive to produce.Why produce anything when someone will end up taking it away from you? In short, ina world where dollar price isn’t the rationing device, people are likely to produce muchless than in a world where dollar price is the rationing device.
Scarcity and Competition Do you see much competition in the world today? Are peoplecompeting for jobs? Are states and cities competing for businesses? Are students compet-ing for grades? The answer to all these questions is yes. The economist wants to knowwhy this competition exists and what form it takes. First, the economist concludes, com-petition exists because of scarcity. If there were enough resources to satisfy all our seeminglyunlimited wants, people would not have to compete for the available but limitedresources.
Second, the economist sees that competition takes the form of people trying to getmore of the rationing device. If dollar price is the rationing device, people will competeto earn dollars. Look at your own case.You are a college student working for a degree.One reason (but perhaps not the only reason) you are attending college is to earn a
4 Part 1 Economics: The Science of Scarcity
Rationing DeviceA means for deciding who gets whatof available resources and goods.
38014_01_c01_001-016.qxd 11/10/06 4:50 PM Page 4
higher income after graduation. But why do you want a higher income? You want itbecause it will allow you to satisfy more of your wants.
Suppose muscular strength (measured by lifting weights) were the rationing deviceinstead of dollar price. People with more muscular strength would receive more resourcesand goods than people with less muscular strength would receive. In this situation, peo-ple would compete for muscular strength. (Would they spend more time at the gym lift-ing weights?) The lesson is simple: Whatever the rationing device, people will compete for it.
SELF-TEST (Answers to Self-Test questions are in the Self-Test Appendix.)
1. Scarcity is the condition of finite resources. True or false? Explain your answer.
2. How does competition arise out of scarcity?
3. How does choice arise out of scarcity?
Key Concepts in Economics There are numerous key concepts in economics—concepts that define the field.We dis-cuss a few of these concepts next.
Opportunity CostAs noted earlier, people must make choices because scarcity exists. Because our seem-ingly unlimited wants push up against limited resources, some wants must go unsatisfied.We must therefore choose which wants we will satisfy and which we will not.The mosthighly valued opportunity or alternative forfeited when a choice is made is known asopportunity cost. Every time you make a choice, you incur anopportunity cost. For example, you have chosen to read this chapter.In making this choice, you denied yourself the benefits of doingsomething else. You could have watched television, e-mailed afriend, taken a nap, eaten a few slices of pizza, read a novel, shoppedfor a new computer, and so on. Whatever you would have chosen todo had you decided not to read this chapter is the opportunity costof your reading this chapter. For example, if you would havewatched television had you chosen not to read this chapter—if thiswas your next best alternative—then the opportunity cost of readingthis chapter is watching television.
OPPORTUNITY COST AND BEHAVIOR Economists believe that a changein opportunity cost will change a person’s behavior. For example,consider Bill, who is a sophomore at the University of Kansas. Heattends classes Monday through Thursday of every week. Every timehe chooses to go to class, he gives up the opportunity to do some-thing else, such as the opportunity to earn $8 an hour working at ajob.The opportunity cost of Bill spending an hour in class is $8.
Now let’s raise the opportunity cost of attending class. On Tues-day, we offer Bill $70 to skip his economics class. He knows that ifhe attends his economics class, he will forfeit $70.What will Bill do?An economist would predict that as the opportunity cost of attend-ing class increases relative to the benefits of attending class, Bill is lesslikely to attend class.
What Economics Is About Chapter 1 5
Economists are fond of saying
that there is no such thing as
a free lunch. This catchy phrase expresses the idea
that opportunity costs are incurred when choices are
made. Perhaps this is an obvious point, but consider
how often people mistakenly assume there is a free
lunch. For example, some parents think education is
free because they do not pay tuition for their children
to attend public elementary school. Sorry, but there is
no such thing as a free lunch. Free implies no sacrifice,
no opportunities forfeited, which is not true in regard
to elementary school education. Resources that could be
used for other things are used to provide elementary
school education.
Consider the people who speak about free medical
care, free housing, free bridges (“there is no charge to
cross it”), and free parks. None of these is actually
free.The resources that provide medical care, housing,
bridges, and parks could have been used in other ways.
Thinking likeAN ECONOMIST
Opportunity CostThe most highly valued opportunity oralternative forfeited when a choice ismade.
38014_01_c01_001-016.qxd 11/10/06 4:50 PM Page 5
This is how economists think about behavior, whether it is Bill’s or your own. Thehigher the opportunity cost of doing something, the less likely it will be done. This is part of theeconomic way of thinking.
Before you continue, look at Exhibit 1, which summarizes some of the things aboutscarcity, choice, and opportunity cost up to this point.
Benefits and Costs If it were possible to eliminate air pollution completely, should all air pollution be elim-inated? If your answer is yes, then you are probably focusing on the benefits of eliminat-ing air pollution. For example, one benefit might be healthier individuals. Certainly,individuals who do not breathe polluted air have fewer lung disorders than people whodo breathe polluted air.
But benefits rarely come without costs.The economist reminds us that while thereare benefits to eliminating pollution, there are costs too.To illustrate, one way to elimi-nate all car pollution tomorrow is to pass a law stating that anyone caught driving a car
6 Part 1 Economics: The Science of Scarcity
economics 24/7
WHY LEBRON JAMES ISN’T IN COLLEGE
LeBron James was born on December 30, 1984. So, he iscurrently the age of many people attending college. ButLeBron James is not attending college. He went directlyfrom high school into the NBA. He is currently playing pro-fessional basketball.
Why isn’t LeBron James in college? It’s not because he can-not afford the tuition charged at most colleges. Also, it’s notbecause he wouldn’t be admitted to any college. LeBronJames is not in college because it is more expensive for himthan it is for most 18- to 25-year-olds to attend college.
To understand, think of what it costs you to attend college. Ifyou pay $1,000 tuition a semester for eight semesters, thefull tuition amounts to $8,000. However, $8,000 is not thefull cost of your attending college because if you were not astudent, you could be earning income working at a job. Forexample, you could be working at a full-time job earning$25,000 annually. Certainly, this $25,000, or at least part ofit if you are currently working part time, is forfeited becauseyou attend college. It is part of the cost of your attendingcollege.
Thus, the tuition cost may be the same for everyone whoattends your college, but the opportunity cost is not. Somepeople have higher opportunity costs for attending college
than others do. LeBron James has extremely high opportu-nity costs for attending college. He would have to give upthe millions of dollars he earns playing professional basket-ball and endorsing products if he were to attend college ona full-time basis.
This discussion illustrates two related points made in thischapter. First, the higher the opportunity cost of doingsomething, the less likely it will be done. The opportunitycost of attending college is higher for LeBron than it (prob-ably) is for you, and that is why you are in college andLeBron James is not.
Second, according to economists, individuals think and actin terms of costs and benefits and only undertake actions ifthey expect the benefits to outweigh the costs. LeBronJames is likely to see certain benefits to attending college—just as you see certain benefits to attending college. How-ever, those benefits are insufficient for him to attend collegebecause benefits are not all that matter. Costs matter too.For LeBron James, the costs of attending college are muchhigher than the benefits, and so he chooses not to attendcollege. In your case, the benefits are higher than the costs,and so you have decided to attend college.
38014_01_c01_001-016.qxd 11/10/06 4:50 PM Page 6
What Economics Is About Chapter 1 7
exhibit 1
Because of scarcity, arationing device is needed.
Whatever the rationing device, people will competefor it. Scarcity and competition are linked.
Because of scarcity, peoplemust make choices.
When choices are made,opportunity costs are incurred.
Changes in opportunity costaffect behavior.
Scarcity
Scarcity and Related Concepts
will go to prison for 40 years.With such a law in place, and enforced, very few peoplewould drive cars, and all car pollution would be a thing of the past. Presto! Cleaner air!However, many people would think that the cost of obtaining that cleaner air is toohigh. Someone might say, “I want cleaner air, but not if I have to completely give updriving my car. How will I get to work?”
What distinguishes the economist from the noneconomist is that the economistthinks in terms of both costs and benefits. Often, the noneconomist thinks in terms ofone or the other. There are benefits from studying, but there are costs too. There arebenefits from coming to class, but there are costs too.There are costs to getting up earlyeach morning and exercising, but let’s not forget that there are benefits too.
economics 24/7
THE COSTS AND BENEFITS OF ATTENDING CLASS
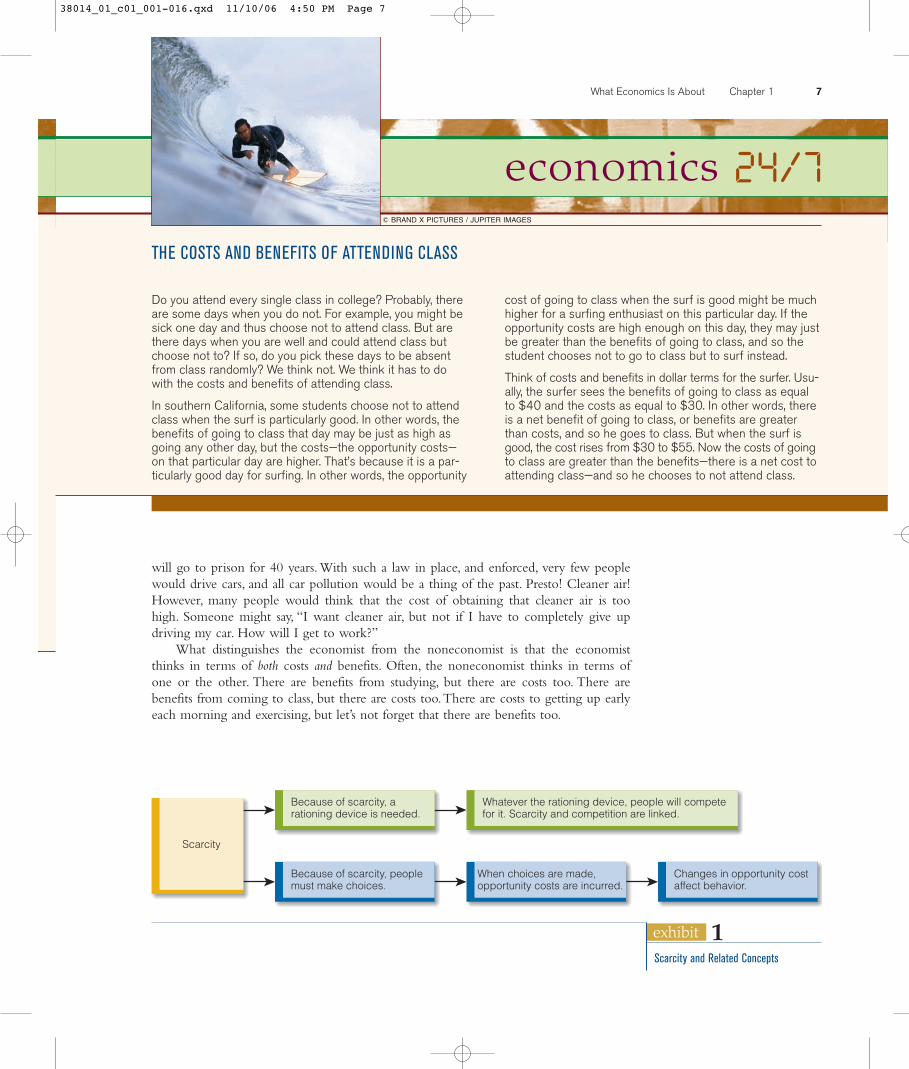
Do you attend every single class in college? Probably, thereare some days when you do not. For example, you might besick one day and thus choose not to attend class. But arethere days when you are well and could attend class butchoose not to? If so, do you pick these days to be absentfrom class randomly? We think not. We think it has to dowith the costs and benefits of attending class.
In southern California, some students choose not to attendclass when the surf is particularly good. In other words, thebenefits of going to class that day may be just as high asgoing any other day, but the costs—the opportunity costs—on that particular day are higher. That’s because it is a par-ticularly good day for surfing. In other words, the opportunity
cost of going to class when the surf is good might be muchhigher for a surfing enthusiast on this particular day. If theopportunity costs are high enough on this day, they may justbe greater than the benefits of going to class, and so thestudent chooses not to go to class but to surf instead.
Think of costs and benefits in dollar terms for the surfer. Usu-ally, the surfer sees the benefits of going to class as equalto $40 and the costs as equal to $30. In other words, thereis a net benefit of going to class, or benefits are greaterthan costs, and so he goes to class. But when the surf isgood, the cost rises from $30 to $55. Now the costs of goingto class are greater than the benefits—there is a net cost toattending class—and so he chooses to not attend class.
© BRAND X PICTURES / JUPITER IMAGES
38014_01_c01_001-016.qxd 11/10/06 4:50 PM Page 7
Decisions Made at the MarginIt is late at night and you have already studied three hours for your biology test tomor-row.You look at the clock and wonder if you should study another hour. How wouldyou summarize your thinking process? What question or questions do you ask yourselfto decide whether or not to study another hour?
Perhaps without knowing it, you think in terms of the costs and benefits of furtherstudy. You probably realize that there are certain benefits from studying an additionalhour (you may be able to raise your grade a few points), but there are costs too (you willget less sleep or have less time to watch television or talk on the phone with a friend).Thinking in terms of costs and benefits, though, doesn’t tell us how you think in termsof costs and benefits. For example, when deciding what to do, do you look at the totalcosts and total benefits of the proposed action, or do you look at something less than thetotal costs and benefits? According to economists, for most decisions, you think in termsof additional, or marginal, costs and benefits, not total costs and benefits. That’s becausemost decisions deal with making a small, or additional, change.
To illustrate, suppose you just finished eating a hamburger and drinking a soda forlunch.You are still a little hungry and are considering whether or not to order anotherhamburger. An economist would say that in deciding whether or not to order anotherhamburger, you will compare the additional benefits of the additional hamburger to theadditional costs of the additional hamburger. In economics, the word marginal is a synonymfor additional. So we say that you will compare the marginal benefits of the (next)hamburger to the marginal costs of the (next) hamburger. If the marginal benefits aregreater than the marginal costs, you obviously expect a net benefit to ordering the nexthamburger, and therefore, you order the next hamburger. If, however, the marginal costsof the hamburger are greater than the marginal benefits, you obviously expect a net costto ordering the next hamburger, and therefore, you do not order the next hamburger.
What you don’t consider when making this decision are the total benefits and totalcosts of hamburgers.That’s because the benefits and costs connected with the first ham-burger (the one you have already eaten) are no longer relevant to the current decision.Youare not deciding between eating two hamburgers and eating no hamburgers; your decisionis whether to eat a second hamburger after you have already eaten a first hamburger.
According to economists, when individuals make decisions by comparing marginalbenefits to marginal costs, they are making decisions at the margin. The president ofthe United States makes a decision at the margin when deciding whether or not to talkanother 10 minutes with the speaker of the House of Representatives, the employeemakes a decision at the margin when deciding whether or not to work two hours over-time, and the college professor makes a decision at the margin when deciding whetheror not to put an additional question on the final exam.
EfficiencyWhat is the right amount of time to study for a test? In economics, the “right amount”of anything is the “optimal” or “efficient” amount, and the efficient amount is theamount for which the marginal benefits equal the marginal costs. Stated differently, youhave achieved efficiency when the marginal benefits equal the marginal costs.
Suppose you are studying for an economics test, and for the first hour of studying,the marginal benefits (MB) are greater than the marginal costs (MC):
MB studying first hour � MC studying first hour
Given this condition, you will certainly study for the first hour. After all, it is worth-while:The additional benefits are greater than the additional costs, so there is a net ben-efit to studying.
8 Part 1 Economics: The Science of Scarcity
Marginal BenefitsAdditional benefits. The benefitsconnected to consuming an additionalunit of a good or undertaking one moreunit of an activity.Marginal CostsAdditional costs. The costs connectedto consuming an additional unit of agood or undertaking one more unit ofan activity.
Decisions at the MarginDecision making characterized byweighing the additional (marginal)benefits of a change against theadditional (marginal) costs of achange with respect to currentconditions.
EfficiencyExists when marginal benefits equalmarginal costs.
38014_01_c01_001-016.qxd 11/10/06 4:50 PM Page 8
Suppose for the second hour of studying, the marginalbenefits are still greater than the marginal costs:
MB studying second hour � MC studying second hour
You will study for the second hour because the additionalbenefits are still greater than the additional costs. In otherwords, it is worthwhile studying the second hour. In fact, youwill continue to study as long as the marginal benefits aregreater than the marginal costs. Exhibit 2 graphically illus-trates this discussion.
The marginal benefit (MB) curve of studying is downwardsloping because we have assumed that the benefits of studyingfor the first hour are greater than the benefits of studying forthe second hour and so on.The marginal cost (MC) curve ofstudying is upward sloping because we assume that it costs aperson more (in terms of goods forfeited) to study the secondhour than the first, more to study the third than the second,and so on. (If we assume the additional costs of studying areconstant over time, the MC curve is horizontal.)
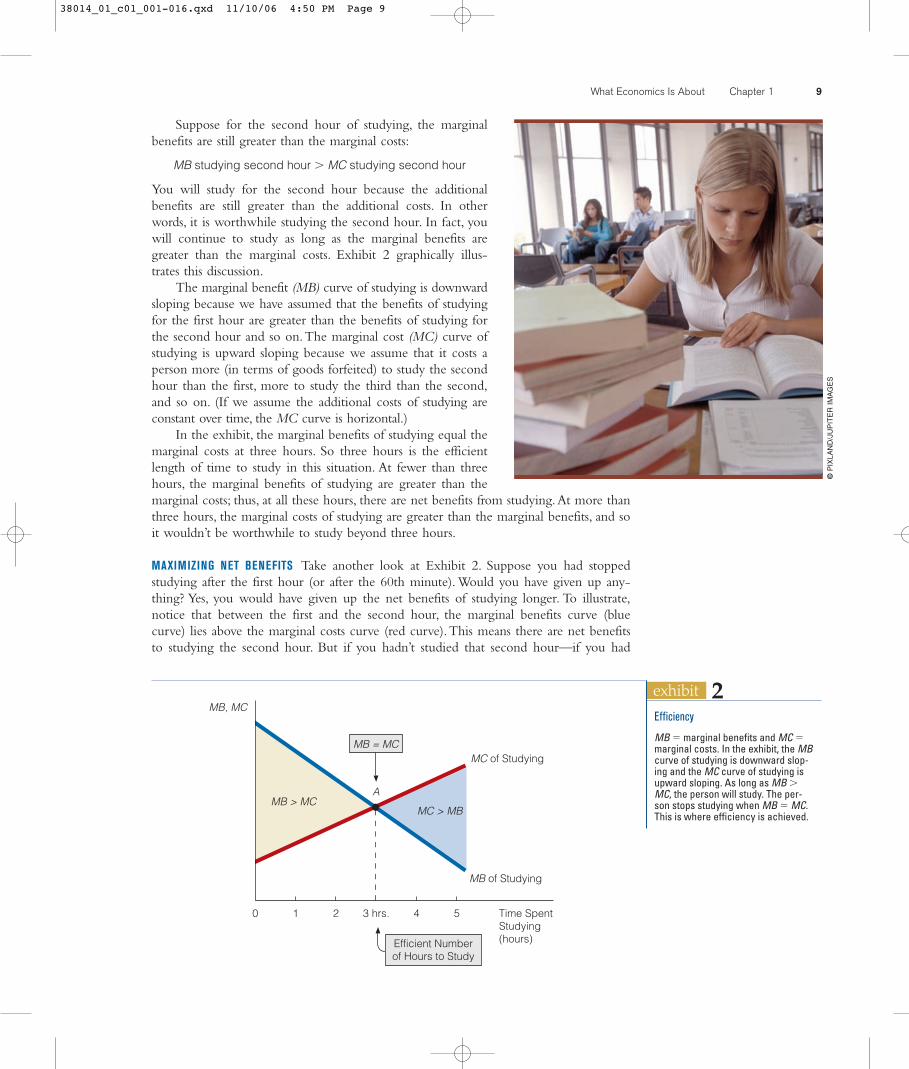
In the exhibit, the marginal benefits of studying equal themarginal costs at three hours. So three hours is the efficientlength of time to study in this situation. At fewer than threehours, the marginal benefits of studying are greater than themarginal costs; thus, at all these hours, there are net benefits from studying.At more thanthree hours, the marginal costs of studying are greater than the marginal benefits, and soit wouldn’t be worthwhile to study beyond three hours.
MAXIMIZING NET BENEFITS Take another look at Exhibit 2. Suppose you had stoppedstudying after the first hour (or after the 60th minute). Would you have given up any-thing? Yes, you would have given up the net benefits of studying longer. To illustrate,notice that between the first and the second hour, the marginal benefits curve (bluecurve) lies above the marginal costs curve (red curve).This means there are net benefitsto studying the second hour. But if you hadn’t studied that second hour—if you had
What Economics Is About Chapter 1 9
exhibit 2
0 1 2 4 5
MB, MC
3 hrs.
MC of Studying
MB of Studying
MC > MB
A
MB = MC
Time Spent Studying(hours)Efficient Number
of Hours to Study
MB > MC
Efficiency
MB � marginal benefits and MC �marginal costs. In the exhibit, the MBcurve of studying is downward slop-ing and the MC curve of studying isupward sloping. As long as MB �MC, the person will study. The per-son stops studying when MB � MC.This is where efficiency is achieved.
©P
IXLA
ND
/JU
PIT
ER
IM
AG
ES
38014_01_c01_001-016.qxd 11/10/06 4:50 PM Page 9

stopped after the first hour—then you would have given up theopportunity to collect those net benefits. (That’s like leaving a $10 billon the sidewalk.) The same analysis holds for the third hour.We con-clude that by studying three hours (but not one minute longer), youhave maximized net benefits. In short, efficiency (which is consistentwith MB � MC ) is also consistent with maximizing net benefits.
Unintended EffectsHas anything turned out differently from what you intended? Nodoubt, you can provide numerous examples. Economists think interms of unintended effects. Consider an example. Andres, 16 yearsold, currently works after school at a grocery store. He earns $6.50an hour. Suppose the state legislature passes a law specifying that theminimum dollar wage a person can be paid to do a job is $8.50 anhour. The legislators’ intention in passing the law is to help peoplelike Andres earn more income.
Will the $8.50 an hour legislation have the intended effect? Per-haps not. The manager of the grocery store may not find it worth-
while to continue employing Andres if she has to pay him $8.50 an hour. In otherwords, Andres may have a job at $6.50 an hour but not at $8.50 an hour. If the lawspecifies that no one will earn less than $8.50 an hour and the manager of the grocerystore decides to fire Andres rather than pay this amount, then an unintended effect ofthe $8.50 an hour legislation is Andres’ losing his job.
As another example, let’s analyze mandatory seatbelt laws to see if they have anyunintended effects. Many states have laws that require drivers to wear seatbelts. Theintended effect is to reduce the number of car fatalities by making it more likely driverswill survive an accident.
Could these laws have an unintended effect? Some economists think so.They lookat accident fatalities in terms of this equation:
Total number of fatalities � Number of accidents � Fatalities per accident
For example, if there are 200,000 accidents and 0.10 fatalities per accident, the totalnumber of fatalities is 20,000.
The objective of a mandatory seatbelt program is to reduce the total number offatalities by reducing the fatalities per accident. Many studies have found that wearingseatbelts does just this. If you are in an accident, you have a better chance of not beingkilled if you are wearing a seatbelt.
Let’s assume that with seatbelts, there are 0.08 instead of 0.10 fatalities per accident.If there are still 200,000 accidents, this means that the total number of fatalities falls from20,000 to 16,000. Thus, there is a drop in the total number of fatalities if fatalities peraccident are reduced and the number of accidents is constant.
Number of Accidents Fatalities per Accident Total Number of Fatalities
200,000 0.10 20,000200,000 0.08 16,000
However, some economists wonder if the number of accidents stays constant.Specifically, they suggest that seatbelts may have an unintended effect: The number of acci-dents may increase. This happens because wearing seatbelts may make drivers feel safer.Feeling safer may cause them to take chances that they wouldn’t ordinarily take—such asdriving faster or more aggressively, or concentrating less on their driving and more on
10 Part 1 Economics: The Science of Scarcity
Does a person have to know about
marginal costs and marginal benefits
before he or she can achieve efficiency?
There may be people who do not know the definition of
marginal cost and marginal benefit, but this doesn’t
prevent them from achieving efficiency in much the
same way that a person who doesn’t know much about
how a car works can still drive a car. All the person
has to “sense” is whether or not doing more of some-
thing comes with greater benefits than costs. As long as
a person can do this—and there is plenty of evidence
that people do this as naturally as they breathe air or
walk—then efficiency can be achieved.
Q&A
38014_01_c01_001-016.qxd 11/10/06 4:50 PM Page 10
the music on the radio. For example, if the number of accidents rises to 250,000, thenthe total number of fatalities is 20,000.
Number of Accidents Fatalities per Accident Total Number of Fatalities
200,000 0.10 20,000250,000 0.08 20,000
We conclude the following: If a mandatory seatbelt law reduces the number of fatal-ities (intended effect) but increases the number of accidents (unintended effect), it may,contrary to popular belief, not reduce the total number of fatalities. In fact, some eco-nomic studies show just this.
What does all this mean for you? You may be safer if you know that this unintendedeffect exists and you adjust accordingly.To be specific, when you wear your seatbelt, yourchances of getting hurt in a car accident are less than if you don’t wear your seatbelt. Butif this added sense of protection causes you to drive less carefully than you would other-wise, then you could unintentionally offset the measure of protection your seatbelt pro-vides.To reduce the probability of hurting yourself and others in a car accident, the bestpolicy is to wear a seatbelt and to drive as carefully as you would if you weren’t wearing a seatbelt.Knowing about the unintended effect of wearing your seatbelt could save your life
Exchange Exchange or trade is the process of giving up one thing for something else. Econom-ics is sometimes called the “science of exchange” because so much that is discussed ineconomics has to do with exchange.
What Economics Is About Chapter 1 11
economics 24/7
WHY DID THE BRITISH SOLDIERS WEAR RED UNIFORMS?
When George Washington and the colonists fought theBritish, the colonists were dressed in rags, while the Britishtroops were clad in fine bright red uniforms. Commenting onthis difference, people often say, “The British were foolish tohave worn bright red uniforms. You could see them comingfor miles.”
Economists would not be so quick to label the British asfoolish. Instead, they would ask why the British troops worebright red. For instance, David Friedman, an economist,thinks it is odd that the British, who at the time were thegreatest fighting force in the world, would make such aseemingly obvious mistake. He has an alternative explana-tion, an economic explanation.
Friedman reasons that the British generals did not wanttheir men to break ranks and desert because winning the
war would be hard, if not impossible, if a lot of men deserted.Thus, the generals had to think up a way to make the oppor-tunity cost of desertion high for their soldiers. The generalsreasoned that the higher the cost of desertion, the fewerdeserters there would be. The British generals effectivelytold their soldiers that if they deserted, they would have toforfeit their freedom or their lives.
Of course, the problem is that a stiff penalty is not effectiveif deserters cannot be found. Therefore, the generals hadto make it easy to find deserters, which they did by dressingthem in bright red uniforms. Certainly, it was possible for adeserter to throw off his uniform and walk through the coun-tryside in his underwear alone, but in the harsh winters ofNew England, doing so would guarantee death. He had almostno choice but to wear the bright red uniform.
Exchange (Trade) The process of giving up one thing foranother.
38014_01_c01_001-016.qxd 11/10/06 4:50 PM Page 11
We start with a basic question:Why do people enter into exchanges? The answer isthat they do so to make themselves better off.When a person voluntarily trades $100 fora jacket, she is saying, “I prefer to have the jacket instead of the $100.” And of course,when the seller of the jacket voluntarily sells the jacket for $100, he is saying,“I prefer tohave the $100 instead of the jacket.” In short, through trade or exchange, each persongives up something he or she values less for something he or she values more.
You can think of trade in terms of utility or satisfaction. Imagine a utility scale thatgoes from 1 to 10, with 10 being the highest utility you can achieve. Now suppose youcurrently have $40 in your wallet and you are at 7 on the utility scale. A few minuteslater, you are in a store looking at some new CDs.The price of each is $10.You end upbuying four CDs for $40.
Before you made the trade, you were at 7 on the utility scale. Are you still at 7 onthe utility scale after you traded your $40 for the four CDs? The likely answer is no. Ifyou expected to have the same utility after the trade as you did before, it is unlikely youwould have traded your $40 for the four CDs. The only reason you entered into thetrade is that you expected to be better off after the trade than you were before the trade.In other words, you thought trading your $40 for the four CDs would move you up theutility scale from 7 to, say, 8.
SELF-TEST1. Give an example to illustrate how a change in opportunity cost can affect behavior.
2. There are both costs and benefits of studying. If you continue to study (say, for a test) as long as the marginal benefits of studying are greater than the marginal costs and stopstudying when the two are equal, will your action be consistent with having maximized the net benefits of studying? Explain your answer.
3. You stay up an added hour to study for a test. The intended effect is to raise your test grade.What might be an unintended effect of staying up an added hour to study for the test?
Economic CategoriesEconomics is sometimes broken down into different categories according to the type ofquestions economists ask. Four common economic categories are positive economics,normative economics, microeconomics, and macroeconomics.
Positive and Normative EconomicsPositive economics attempts to determine what is. Normative economics addresseswhat should be. Essentially, positive economics deals with cause-effect relationships thatcan be tested. Normative economics deals with value judgments and opinions that can-not be tested.
Many topics in economics can be discussed within both a positive framework and anormative framework. Consider a proposed cut in federal income taxes. An economistpracticing positive economics would want to know the effect of a cut in income taxes.For example, she may want to know how a tax cut will affect the unemployment rate,economic growth, inflation, and so on. An economist practicing normative economicswould address issues that directly or indirectly relate to whether the federal income taxshould be cut. For example, she may say that federal income taxes should be cut becausethe income tax burden on many taxpayers is currently high.
This book mainly deals with positive economics. For the most part, we discuss theeconomic world as it is, not the way someone might think it should be. Keep in mind,too, that no matter what your normative objectives are, positive economics can shed
12 Part 1 Economics: The Science of Scarcity
Positive EconomicsThe study of “what is” in economicmatters.Normative EconomicsThe study of “what should be” ineconomic matters.
38014_01_c01_001-016.qxd 11/10/06 4:50 PM Page 12
some light on how they might be accomplished. For example, suppose you believe thatabsolute poverty should be eliminated and the unemployment rate should be lowered.No doubt you have ideas as to how these goals can be accomplished. But will your ideaswork? For example, will a greater redistribution of income eliminate absolute poverty?Will lowering taxes lower the unemployment rate? There is no guarantee that the meansyou think will bring about certain ends will do so. This is where sound positive eco-nomics can help. It helps us see what is.As someone once said,“It is not enough to wantto do good; it is important also to know how to do good.”
Microeconomics and MacroeconomicsIt has been said that the tools of microeconomics are microscopes, and the tools ofmacroeconomics are telescopes. Macroeconomics stands back from the trees to see theforest. Microeconomics gets up close and examines the tree itself, its bark, its limbs, andits roots. Microeconomics is the branch of economics that deals with human behaviorand choices as they relate to relatively small units—an individual, a firm, an industry, a
What Economics Is About Chapter 1 13
a r e a d e r a s k s . . . . . .A R e a d e r A s k s . . .A R e a d e r A s k s . . .
This i s my fi rs t course in economics . Themater ia l i s in terest ing , and I have g ivensome thought to major ing in economics .Please te l l me something about the majorand about job prospects for an economicsgraduate. What courses do economicsmajors t ake? What i s the s t ar t ing sa lar y of economics graduates? Do the peoplewho run large companies th ink h ighly ofpeople who have majored in economics?
If you major in economics, you will certainly not bealone. Economics is one of the top three majors at Har-vard, Brown, Yale, the University of California at Berke-ley, Princeton, Columbia, Cornell, Dartmouth, and Stan-ford. U.S. colleges and universities awarded 16,141degrees to economics majors in the 2003–2004 aca-demic year, which was up nearly 40 percent from fiveyears earlier. The popularity of economics is probablybased on two major reasons. First, many people findeconomics an interesting course of study. Second, whatyou learn in an economics course is relevant and appli-cable to the real world.
Do executives who run successful companies thinkhighly of economics majors? Well, a BusinessWeek sur-vey found that economics was the second favoriteundergraduate major of chief executive officers (CEOs)
of major corporations. Engineering was their favoriteundergraduate major.
An economics major usually takes a wide variety ofeconomics courses, starting with introductory courses—principles of microeconomics and principles of macro-economics—and then studying intermediate microeco-nomics and intermediate macroeconomics. Upperdivision electives usually include such courses as pub-lic finance, international economics, law and econom-ics, managerial economics, labor economics, healtheconomics, money and banking, environmental eco-nomics, and more.
According to the National Association of Collegesand Employers Salary Survey in Spring 2004, the aver-age starting salary for a college graduate in economicswas $43,000. For a college graduate in business admin-istration, the average starting salary was $36,515, andfor a college graduate in computer science, the averagestarting salary was $46,536. Also, according to theEconomics and Statistics Administration of the U.S.Department of Justice, economics undergraduates haverelatively higher average annual salaries than studentswho have majored in other fields. Specifically, of 14different majors, economics majors ranked third. Onlypersons with bachelor’s degrees in engineering or agri-culture/forestry had higher average annual salaries.
What’s in Store for an Economics Major?
MicroeconomicsThe branch of economics that dealswith human behavior and choices asthey relate to relatively small units—an individual, a firm, an industry, asingle market.
38014_01_c01_001-016.qxd 11/10/06 4:50 PM Page 13
14 Part 1 Economics: The Science of Scarcity
single market. Macroeconomics is the branch of economics that deals with humanbehavior and choices as they relate to an entire economy. In microeconomics, econo-mists discuss a single price; in macroeconomics, they discuss the price level. Microeco-nomics deals with the demand for a particular good or service; macroeconomics dealswith aggregate, or total, demand for goods and services. Microeconomics examines howa tax change affects a single firm’s output; macroeconomics looks at how a tax changeaffects an entire economy’s output.
Microeconomists and macroeconomists ask different types of questions. A micro-economist might be interested in answering such questions as:
• How does a market work?
• What level of output does a firm produce?
• What price does a firm charge for the good it produces?
• How does a consumer determine how much of a good he or she will buy?
• Can government policy affect business behavior?
• Can government policy affect consumer behavior?
On the other hand, a macroeconomist might be interested in answering such ques-tions as:
• How does the economy work?
• Why is the unemployment rate sometimes high and sometimes low?
• What causes inflation?
• Why do some national economies grow faster than other national economies?
• What might cause interest rates to be low one year and high the next?
• How do changes in the money supply affect the economy?
• How do changes in government spending and taxes affect the economy?
! analyzing the sceneIs Jackie more likely to miss some classes than she is tomiss other classes? What determines which classesJackie will attend and which classes she won’t attend?
The lower the cost of not attending class, the more likelyJackie will not attend. On this particular day, Jackie is fairlysure that “her professor will be discussing a subject she alreadyknows well.”Therefore, the cost of missing this class is proba-bly lower than missing, say, a class where the professor will bediscussing an unfamiliar subject or a class in which a midtermexam will be given. Not all classes are alike for Jackie becausethe cost of attending each class isn’t the same.
What does a basic economic fact have to do withStephanie’s buying two books at her campus bookstore?
Stephanie uses money to buy the two books. She pays thedollar price of each book. But what is dollar price? It is arationing device.And why do we need rationing devices in
society? Because scarcity—a basic economic fact—exists.Both Stephanie and the long shadow of scarcity are togetherin the campus bookstore.
Does whether or not Jackie will go on to get a master’sdegree have anything to do with economics?
Jackie is undecided about whether or not she will pursue amaster’s degree.When she says she is not sure she wants itenough, she is really thinking about the costs and benefits ofgetting a master’s degree.The benefits of getting the degreerelate to (1) how much higher her annual income will bewith a master’s degree than without it, (2) how much sheenjoys studying history, and so on.The costs relate to (1) theincome she will lose while she is at graduate school workingon a master’s degree, (2) the less leisure time she will enjoyduring the time she is studying, writing papers, and attendingclasses, (3) the tuition costs of the program, and so on.Are thebenefits greater than the costs, or are the costs greater than the
MacroeconomicsThe branch of economics that dealswith human behavior and choices asthey relate to highly aggregatemarkets (e.g., the goods and servicesmarket) or the entire economy.
38014_01_c01_001-016.qxd 11/10/06 4:50 PM Page 14
What Economics Is About Chapter 1 15
Goods, Bads, and Resources• A good is anything that gives a person utility or satis-
faction.• A bad is anything that gives a person disutility or dissat-
isfaction.• Economists divide resources into four categories: land,
labor, capital, and entrepreneurship.• Land includes natural resources, such as minerals, forests,
water, and unimproved land.• Labor refers to the physical and mental talents that peo-
ple contribute to the production process.• Capital consists of produced goods that can be used as
inputs for further production, such as machinery, tools,computers, trucks, buildings, and factories.
• Entrepreneurship refers to the particular talent thatsome people have for organizing the resources of land,labor, and capital to produce goods, seek new businessopportunities, and develop new ways of doing things.
Scarcity• Scarcity is the condition in which our wants are greater
than the limited resources available to satisfy them.• Scarcity implies choice. In a world of limited resources,
we must choose which wants will be satisfied andwhich will go unsatisfied.
• Because of scarcity, there is a need for a rationing device.A rationing device is a means of deciding who getswhat quantities of the available resources and goods.
• Scarcity implies competition. If there were enoughresources to satisfy all our seemingly unlimited wants,people would not have to compete for the available butlimited resources.
Opportunity Cost• Every time a person makes a choice, he or she incurs
an opportunity cost. Opportunity cost is the most
highly valued opportunity or alternative forfeited whena choice is made. The higher the opportunity cost ofdoing something, the less likely it will be done.
Costs and Benefits• What distinguishes the economist from the nonecono-
mist is that the economist thinks in terms of both costsand benefits. Asked what the benefits of taking a walkmay be, an economist will also mention the costs oftaking a walk. Asked what the costs of studying are, aneconomist will also point out the benefits of studying.
Decisions Made at the Margin• Marginal benefits and costs are not the same as total
benefits and costs.When deciding whether to talk on thephone one more minute, an individual would not con-sider the total benefits and total costs of speaking onthe phone. Instead, the individual would compare onlythe marginal benefits (additional benefits) of talking onthe phone one more minute to the marginal costs (addi-tional costs) of talking on the phone one more minute.
Efficiency• As long as the marginal benefits of an activity are
greater than its marginal costs, a person gains by contin-uing to do the activity—whether the activity is study-ing, running, eating, or watching television. The netbenefits of an activity are maximized when the mar-ginal benefits of the activity equal its marginal costs.Efficiency exists at this point.
Unintended Effects• Economists often think in terms of causes and effects.
Effects may include both intended effects and unin-tended effects. Economists want to denote both types ofeffects when speaking of effects in general.
benefits? Jackie is thinking through an economic calculation,although she may know nothing about economics.
Stephanie stopped studying at 9:00 P.M. Would she havebeen better off if she had studied 30 more minutes?
Stephanie stopped studying after three hours. Studying for 30 more minutes might have provided some benefits forStephanie, but she also would have incurred some costs.
Remember, Stephanie considers both the benefits and thecosts of studying for 30 more minutes. If the costs are greaterthan the benefits, Stephanie is better off not studying for 30more minutes. Stephanie likely believes she has studied theefficient amount of time—the amount of time at which themarginal benefits of studying equal the marginal costs ofstudying. It is possible to study too much (MC � MB), too little (MB � MC), or just the right amount (MB � MC).
chapter summary
38014_01_c01_001-016.qxd 11/10/06 4:50 PM Page 15
Exchange • Exchange or trade is the process of giving up one thing
for something else. People enter into exchanges tomake themselves better off.
Economic Categories• Positive economics attempts to determine what is; nor-
mative economics addresses what should be.
16 Part 1 Economics: The Science of Scarcity
• Microeconomics deals with human behavior andchoices as they relate to relatively small units—an indi-vidual, a firm, an industry, a single market. Macroeco-nomics deals with human behavior and choices as theyrelate to an entire economy.
Good
Utility
Bad
Disutility
Land
Labor
Capital
Entrepreneurship
Scarcity
Economics
Rationing Device
Opportunity Cost
Marginal Benefits
Marginal Costs
Decisions at the Margin
Efficiency
Exchange (Trade)
Positive Economics
Normative Economics
Microeconomics
Macroeconomics
key terms and concepts
8 Smith says that we should eliminate all pollution in theworld. Jones disagrees. Who is more likely to be aneconomist, Smith or Jones? Explain your answer.
9 A layperson says that a proposed government projectsimply costs too much and therefore shouldn’t beundertaken. How might an economist’s evaluation bedifferent?
10 Economists say that individuals make decisions at themargin.What does this mean?
11 How would an economist define the efficient amountof time spent playing tennis?
12 A change in X will lead to a change in Y; the predictedchange is desirable, so we should change X. Do youagree or disagree? Explain.
13 Why do people enter into exchanges?14 What is the difference between positive economics and
normative economics? between microeconomics andmacroeconomics?
1 The United States is considered a rich country becauseAmericans can choose from an abundance of goods andservices. How can there be scarcity in a land of abun-dance?
2 Give two examples for each of the following: (a) anintangible good, (b) a tangible good, (c) a bad.
3 What is the difference between the resource labor andthe resource entrepreneurship?
4 Explain the link between scarcity and each of the fol-lowing: (a) choice, (b) opportunity cost, (c) the need fora rationing device, (d) competition.
5 Is it possible for a person to incur an opportunity costwithout spending any money? Explain.
6 Discuss the opportunity costs of attending college forfour years. Is college more or less costly than youthought it was? Explain.
7 Explain the relationship between changes in opportu-nity cost and changes in behavior.
questions and problems
38014_01_c01_001-016.qxd 11/10/06 4:50 PM Page 16
A picture is worth a thousand words.With this familiar saying in mind, economists con-struct their diagrams or graphs.With a few lines and a few points, much can be conveyed.
Two-Variable DiagramsMost of the diagrams in this book represent the relationship between two variables.Economists compare two variables to see how a change in one variable affects the othervariable.
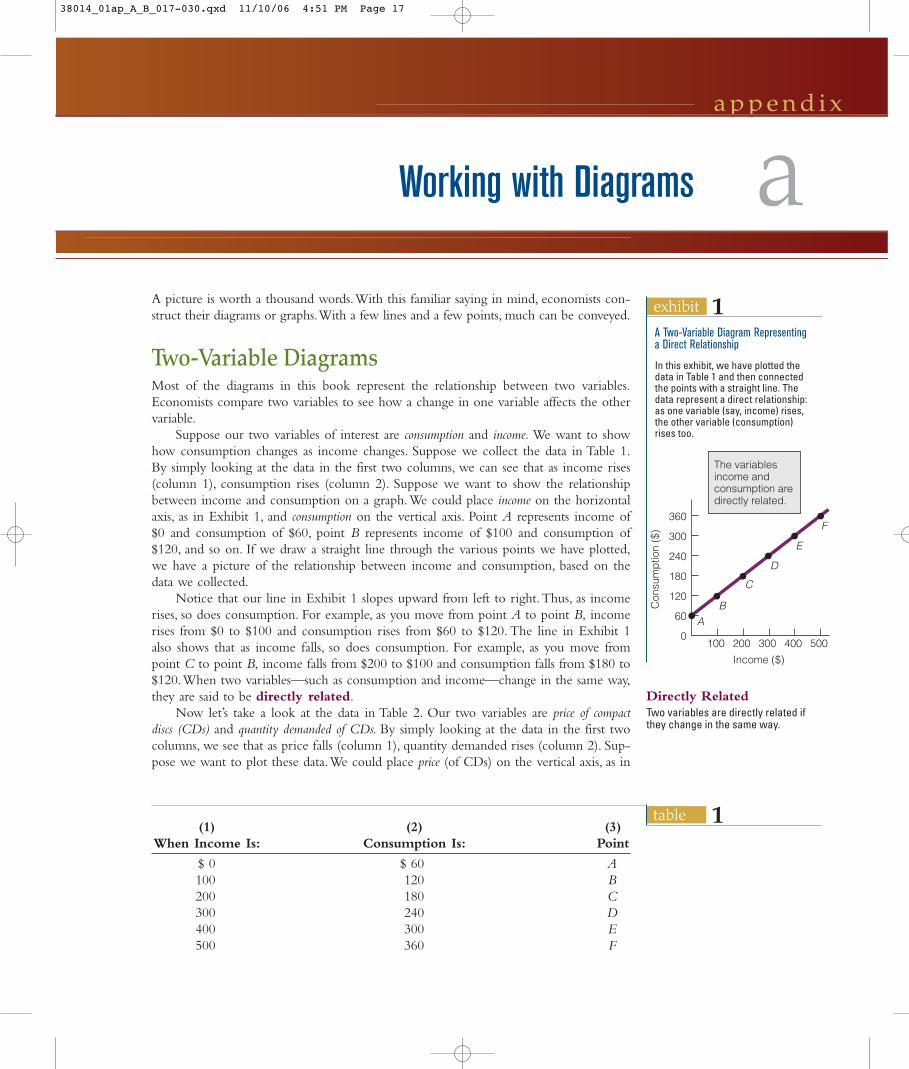
Suppose our two variables of interest are consumption and income. We want to showhow consumption changes as income changes. Suppose we collect the data in Table 1.By simply looking at the data in the first two columns, we can see that as income rises(column 1), consumption rises (column 2). Suppose we want to show the relationshipbetween income and consumption on a graph.We could place income on the horizontalaxis, as in Exhibit 1, and consumption on the vertical axis. Point A represents income of$0 and consumption of $60, point B represents income of $100 and consumption of$120, and so on. If we draw a straight line through the various points we have plotted,we have a picture of the relationship between income and consumption, based on thedata we collected.
Notice that our line in Exhibit 1 slopes upward from left to right.Thus, as incomerises, so does consumption. For example, as you move from point A to point B, incomerises from $0 to $100 and consumption rises from $60 to $120. The line in Exhibit 1also shows that as income falls, so does consumption. For example, as you move frompoint C to point B, income falls from $200 to $100 and consumption falls from $180 to$120.When two variables—such as consumption and income—change in the same way,they are said to be directly related.
Now let’s take a look at the data in Table 2. Our two variables are price of compactdiscs (CDs) and quantity demanded of CDs. By simply looking at the data in the first twocolumns, we see that as price falls (column 1), quantity demanded rises (column 2). Sup-pose we want to plot these data.We could place price (of CDs) on the vertical axis, as in
a p p e n d i x
aWorking with Diagrams
exhibit 1A Two-Variable Diagram Representing a Direct Relationship
In this exhibit, we have plotted thedata in Table 1 and then connectedthe points with a straight line. Thedata represent a direct relationship:as one variable (say, income) rises,the other variable (consumption)rises too.
360
300
240
180
120
60
0
Con
sum
ptio
n ($
)Income ($)
100 200 300 400 500
The variablesincome andconsumption aredirectly related.
AB
C
D
E
F
Directly RelatedTwo variables are directly related ifthey change in the same way.
table 1(1) (2) (3)
When Income Is: Consumption Is: Point
$ 0 $ 60 A100 120 B200 180 C300 240 D400 300 E500 360 F
38014_01ap_A_B_017-030.qxd 11/10/06 4:51 PM Page 17
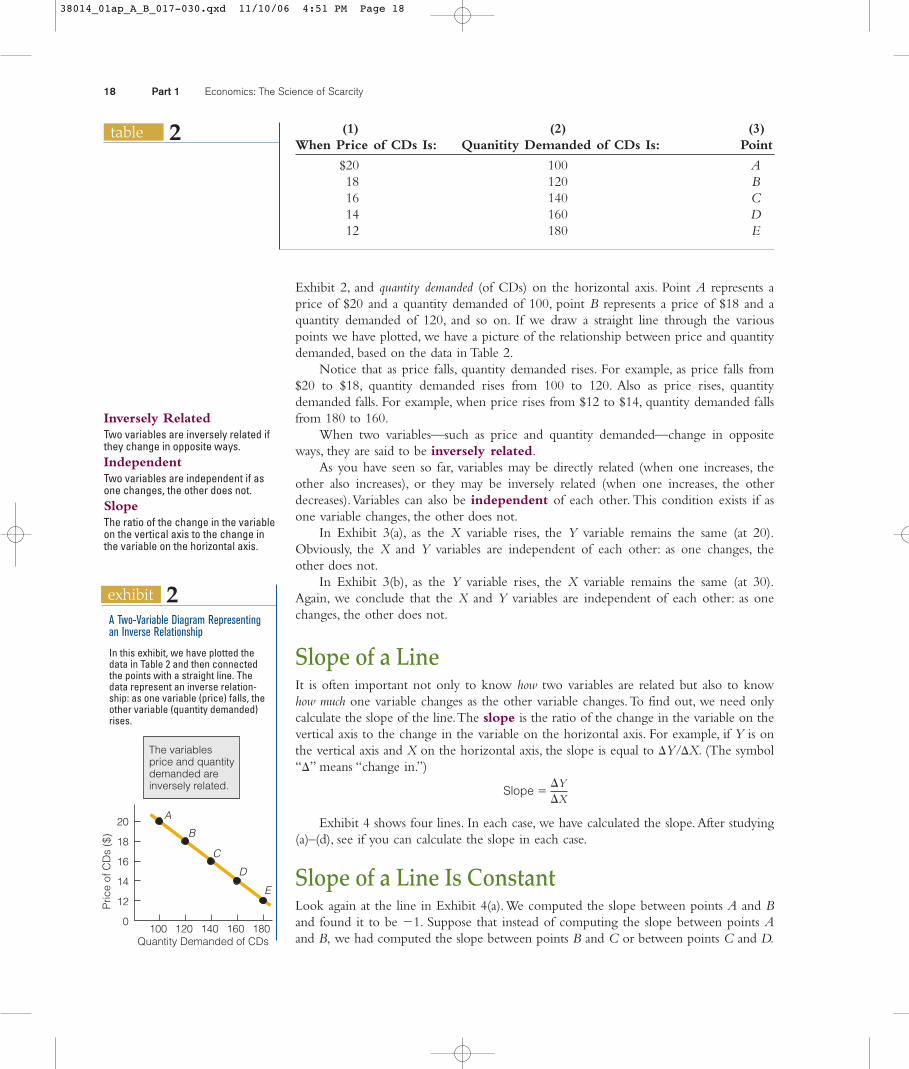
Exhibit 2, and quantity demanded (of CDs) on the horizontal axis. Point A represents aprice of $20 and a quantity demanded of 100, point B represents a price of $18 and aquantity demanded of 120, and so on. If we draw a straight line through the variouspoints we have plotted, we have a picture of the relationship between price and quantitydemanded, based on the data in Table 2.
Notice that as price falls, quantity demanded rises. For example, as price falls from$20 to $18, quantity demanded rises from 100 to 120. Also as price rises, quantitydemanded falls. For example, when price rises from $12 to $14, quantity demanded fallsfrom 180 to 160.
When two variables—such as price and quantity demanded—change in oppositeways, they are said to be inversely related.
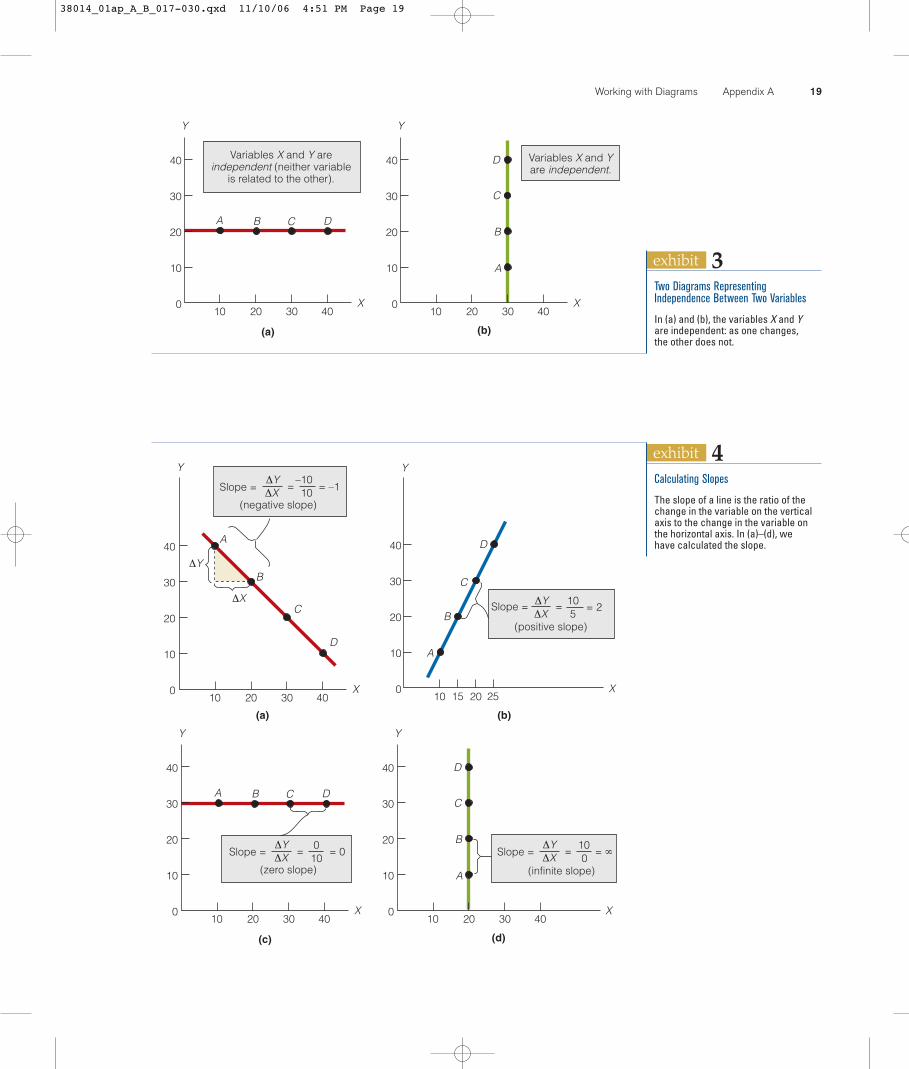
As you have seen so far, variables may be directly related (when one increases, theother also increases), or they may be inversely related (when one increases, the otherdecreases).Variables can also be independent of each other. This condition exists if asone variable changes, the other does not.
In Exhibit 3(a), as the X variable rises, the Y variable remains the same (at 20).Obviously, the X and Y variables are independent of each other: as one changes, theother does not.
In Exhibit 3(b), as the Y variable rises, the X variable remains the same (at 30).Again, we conclude that the X and Y variables are independent of each other: as onechanges, the other does not.
Slope of a LineIt is often important not only to know how two variables are related but also to knowhow much one variable changes as the other variable changes.To find out, we need onlycalculate the slope of the line.The slope is the ratio of the change in the variable on thevertical axis to the change in the variable on the horizontal axis. For example, if Y is onthe vertical axis and X on the horizontal axis, the slope is equal to �Y/�X. (The symbol“�” means “change in.”)
Slope ��Y�X
Exhibit 4 shows four lines. In each case, we have calculated the slope.After studying(a)–(d), see if you can calculate the slope in each case.
Slope of a Line Is ConstantLook again at the line in Exhibit 4(a).We computed the slope between points A and Band found it to be �1. Suppose that instead of computing the slope between points Aand B, we had computed the slope between points B and C or between points C and D.
18 Part 1 Economics: The Science of Scarcity
exhibit 2A Two-Variable Diagram Representingan Inverse Relationship
In this exhibit, we have plotted thedata in Table 2 and then connectedthe points with a straight line. Thedata represent an inverse relation-ship: as one variable (price) falls, theother variable (quantity demanded)rises.
20
18
16
14
12
0
Pric
e of
CD
s ($
)
100 120 140 160 180
The variablesprice and quantitydemanded areinversely related.
A
B
C
D
E
Quantity Demanded of CDs
table 2 (1) (2) (3)When Price of CDs Is: Quanitity Demanded of CDs Is: Point
$20 100 A18 120 B16 140 C14 160 D12 180 E
Inversely RelatedTwo variables are inversely related ifthey change in opposite ways.IndependentTwo variables are independent if asone changes, the other does not.SlopeThe ratio of the change in the variableon the vertical axis to the change inthe variable on the horizontal axis.
38014_01ap_A_B_017-030.qxd 11/10/06 4:51 PM Page 18
Working with Diagrams Appendix A 19
exhibit 4
010
100
ΔYΔX
= 10 5
= 2Slope =
Slope =ΔY
= = –1
Slope =ΔY
= = ∞ΔX(infinite slope)A
B
C
D
Slope =ΔY
= = 0ΔX(zero slope)
–1010
40
30
20
10
010 20 30 40
(a)
A
B
C
D
ΔX
ΔY
Y
X
40
30
20
10
010 20
(b)
A
B
C
D
X
Y
15
(negative slope)
(d)(c)
40
30
20
10
010 20 30 40
A B C D
Y
X
40
30
20
10
010 20 30 40
Y
X
ΔX
(positive slope)
25
Calculating Slopes
The slope of a line is the ratio of thechange in the variable on the verticalaxis to the change in the variable onthe horizontal axis. In (a)–(d), wehave calculated the slope.
exhibit 3
(b)(a)
40
30
20
10
010 20 30 40
A B C D
Y
X
Variables X and Y areindependent (neither variable
is related to the other).
40
30
20
10
010 20 30 40
A
B
C
D
Y
X
Variables X and Yare independent.
Two Diagrams RepresentingIndependence Between Two Variables
In (a) and (b), the variables X and Yare independent: as one changes,the other does not.
38014_01ap_A_B_017-030.qxd 11/10/06 4:51 PM Page 19
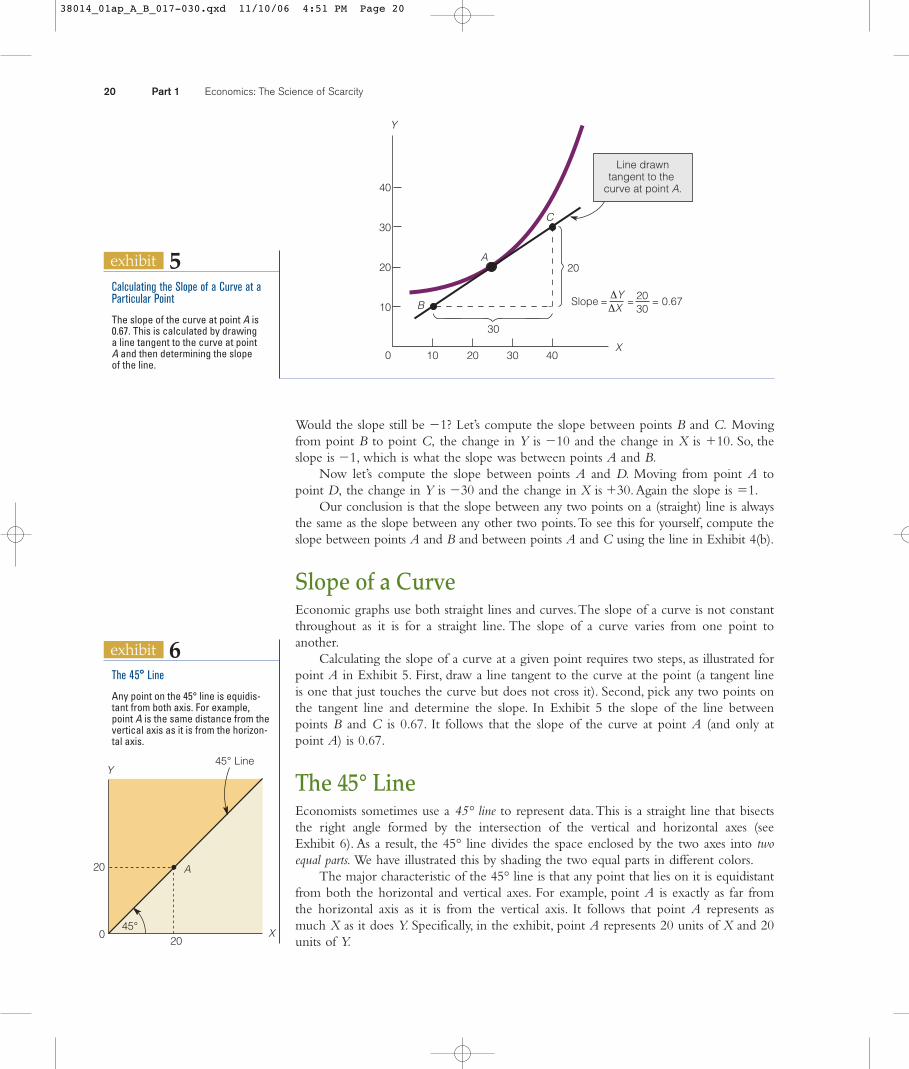
Would the slope still be �1? Let’s compute the slope between points B and C. Movingfrom point B to point C, the change in Y is �10 and the change in X is �10. So, theslope is �1, which is what the slope was between points A and B.
Now let’s compute the slope between points A and D. Moving from point A topoint D, the change in Y is �30 and the change in X is �30. Again the slope is �1.
Our conclusion is that the slope between any two points on a (straight) line is alwaysthe same as the slope between any other two points.To see this for yourself, compute theslope between points A and B and between points A and C using the line in Exhibit 4(b).
Slope of a CurveEconomic graphs use both straight lines and curves.The slope of a curve is not constantthroughout as it is for a straight line. The slope of a curve varies from one point toanother.
Calculating the slope of a curve at a given point requires two steps, as illustrated forpoint A in Exhibit 5. First, draw a line tangent to the curve at the point (a tangent lineis one that just touches the curve but does not cross it). Second, pick any two points onthe tangent line and determine the slope. In Exhibit 5 the slope of the line betweenpoints B and C is 0.67. It follows that the slope of the curve at point A (and only atpoint A) is 0.67.
The 45° LineEconomists sometimes use a 45° line to represent data.This is a straight line that bisectsthe right angle formed by the intersection of the vertical and horizontal axes (seeExhibit 6). As a result, the 45° line divides the space enclosed by the two axes into twoequal parts. We have illustrated this by shading the two equal parts in different colors.
The major characteristic of the 45° line is that any point that lies on it is equidistantfrom both the horizontal and vertical axes. For example, point A is exactly as far fromthe horizontal axis as it is from the vertical axis. It follows that point A represents asmuch X as it does Y. Specifically, in the exhibit, point A represents 20 units of X and 20units of Y.
20 Part 1 Economics: The Science of Scarcity
exhibit 5
10 20 30 40
A
B
C
X
Y
0
40
30
20
10
Line drawntangent to the
curve at point A.
Slope = = = 0.67ΔYΔX
2030
30
20
Calculating the Slope of a Curve at aParticular Point
The slope of the curve at point A is0.67. This is calculated by drawing a line tangent to the curve at point A and then determining the slope of the line.
exhibit 6The 45° Line
Any point on the 45° line is equidis-tant from both axis. For example,point A is the same distance from thevertical axis as it is from the horizon-tal axis.
20
20
Y
X
A
45°
45° Line
0
38014_01ap_A_B_017-030.qxd 11/10/06 4:51 PM Page 20
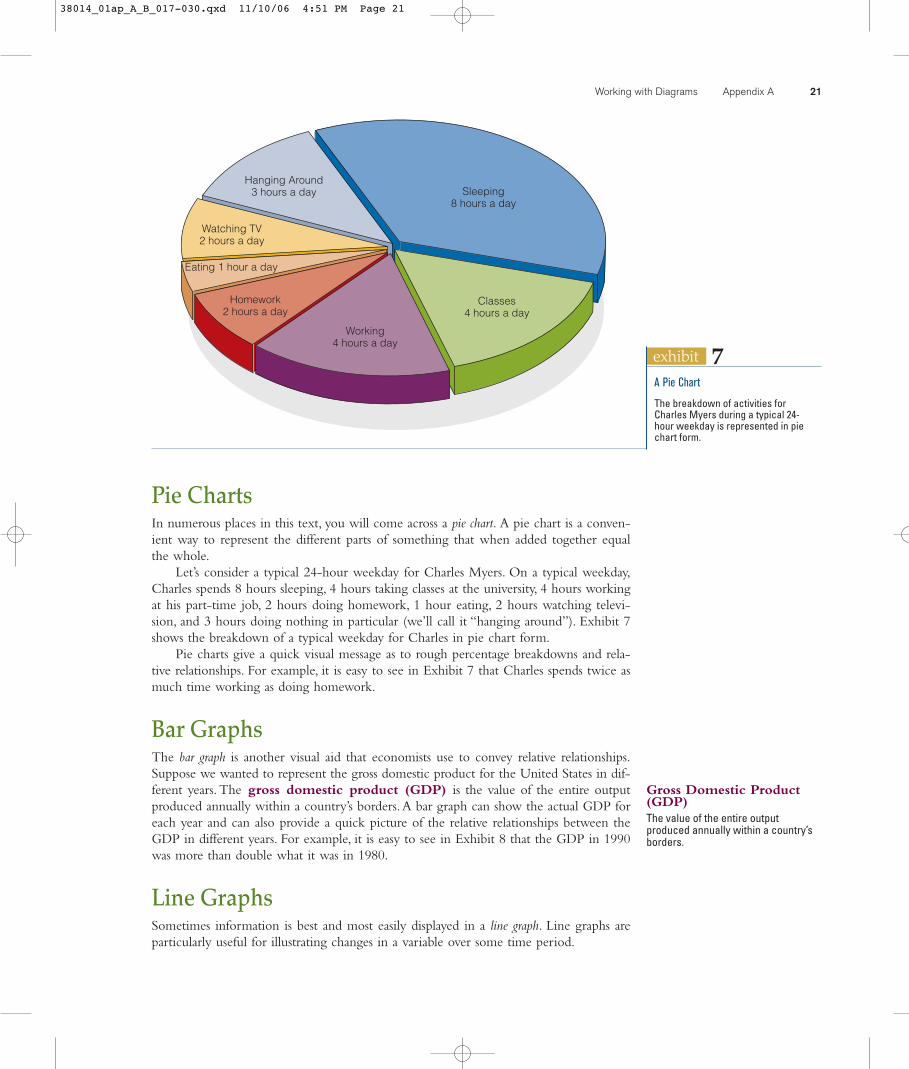
Pie ChartsIn numerous places in this text, you will come across a pie chart. A pie chart is a conven-ient way to represent the different parts of something that when added together equalthe whole.
Let’s consider a typical 24-hour weekday for Charles Myers. On a typical weekday,Charles spends 8 hours sleeping, 4 hours taking classes at the university, 4 hours workingat his part-time job, 2 hours doing homework, 1 hour eating, 2 hours watching televi-sion, and 3 hours doing nothing in particular (we’ll call it “hanging around”). Exhibit 7shows the breakdown of a typical weekday for Charles in pie chart form.
Pie charts give a quick visual message as to rough percentage breakdowns and rela-tive relationships. For example, it is easy to see in Exhibit 7 that Charles spends twice asmuch time working as doing homework.
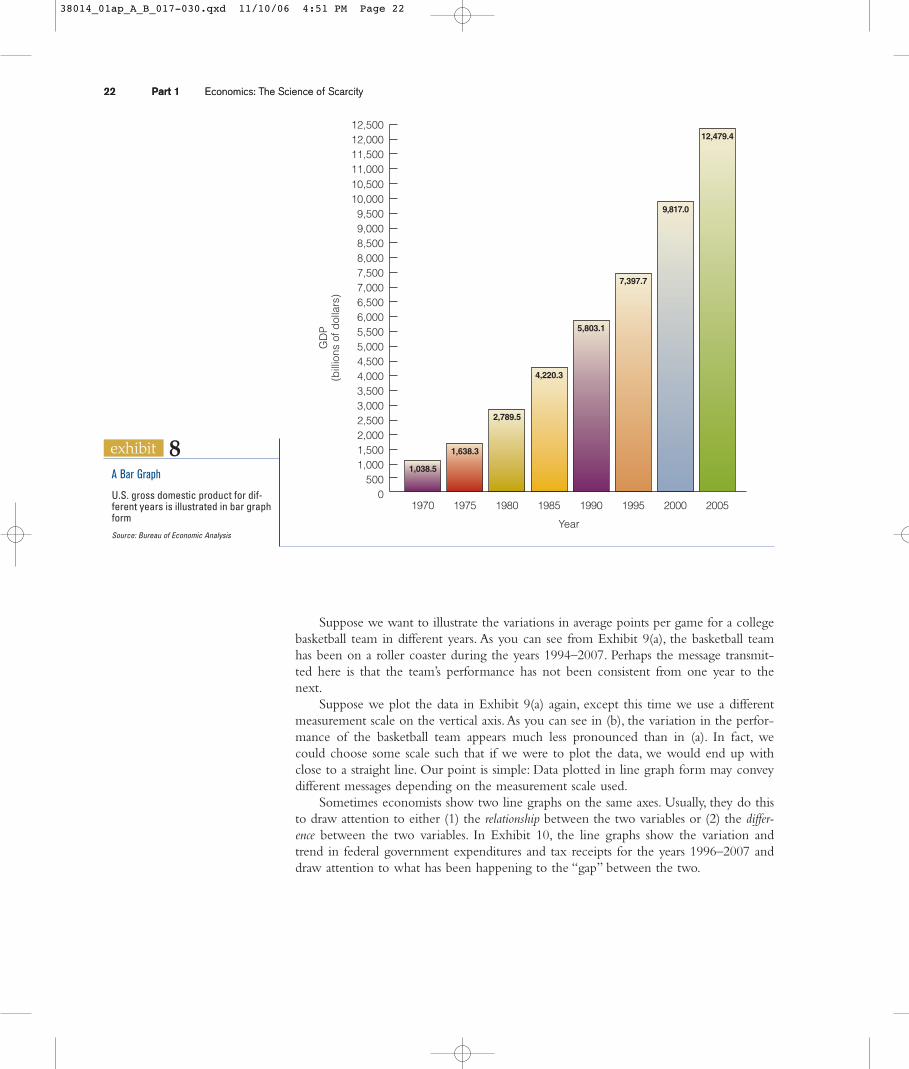
Bar GraphsThe bar graph is another visual aid that economists use to convey relative relationships.Suppose we wanted to represent the gross domestic product for the United States in dif-ferent years. The gross domestic product (GDP) is the value of the entire outputproduced annually within a country’s borders.A bar graph can show the actual GDP foreach year and can also provide a quick picture of the relative relationships between theGDP in different years. For example, it is easy to see in Exhibit 8 that the GDP in 1990was more than double what it was in 1980.
Line GraphsSometimes information is best and most easily displayed in a line graph. Line graphs areparticularly useful for illustrating changes in a variable over some time period.
Working with Diagrams Appendix A 21
exhibit 7
Sleeping8 hours a day
Hanging Around3 hours a day
Watching TV2 hours a day
Eating 1 hour a day
Homework2 hours a day
Working4 hours a day
Classes4 hours a day
A Pie Chart
The breakdown of activities forCharles Myers during a typical 24-hour weekday is represented in piechart form.
Gross Domestic Product(GDP) The value of the entire outputproduced annually within a country’sborders.
38014_01ap_A_B_017-030.qxd 11/10/06 4:51 PM Page 21
22 Part 1 Economics: The Science of Scarcity22 Part 1 Economics: The Science of Scarcity
exhibit 8
2000199519901985198019751970
1,038.5
1,638.3
2,789.5
4,220.3
5,803.1
7,397.7
9,817.0
2005
12,479.4
0
1,000500
2,000
3,000
4,000
5,000
6,000
7,000
8,000
9,000
1,500
2,500
3,500
4,500
5,500
6,500
7,500
8,500
9,50010,00010,500
Year
GD
P(b
illio
ns o
f dol
lars
)
11,000
12,00011,500
12,500
A Bar Graph
U.S. gross domestic product for dif-ferent years is illustrated in bar graphform
Source: Bureau of Economic Analysis
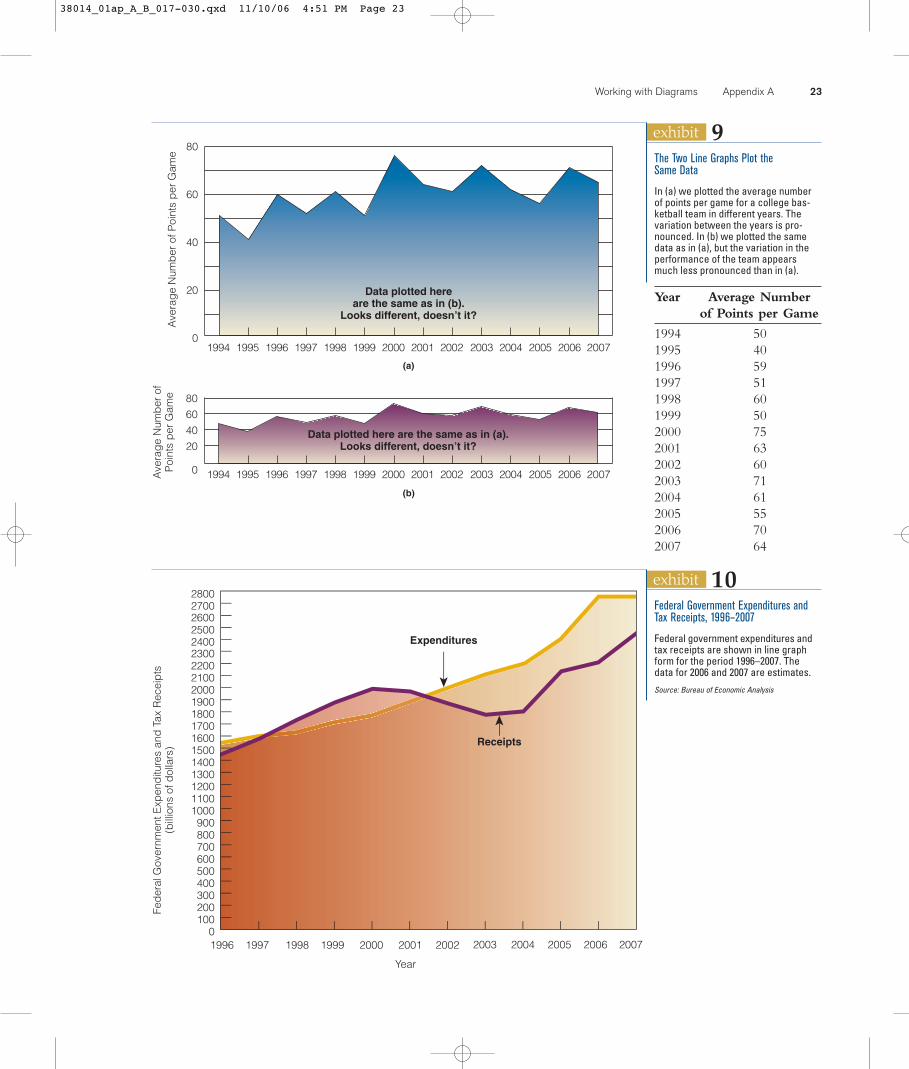
Suppose we want to illustrate the variations in average points per game for a collegebasketball team in different years. As you can see from Exhibit 9(a), the basketball teamhas been on a roller coaster during the years 1994–2007. Perhaps the message transmit-ted here is that the team’s performance has not been consistent from one year to thenext.
Suppose we plot the data in Exhibit 9(a) again, except this time we use a differentmeasurement scale on the vertical axis.As you can see in (b), the variation in the perfor-mance of the basketball team appears much less pronounced than in (a). In fact, wecould choose some scale such that if we were to plot the data, we would end up withclose to a straight line. Our point is simple: Data plotted in line graph form may conveydifferent messages depending on the measurement scale used.
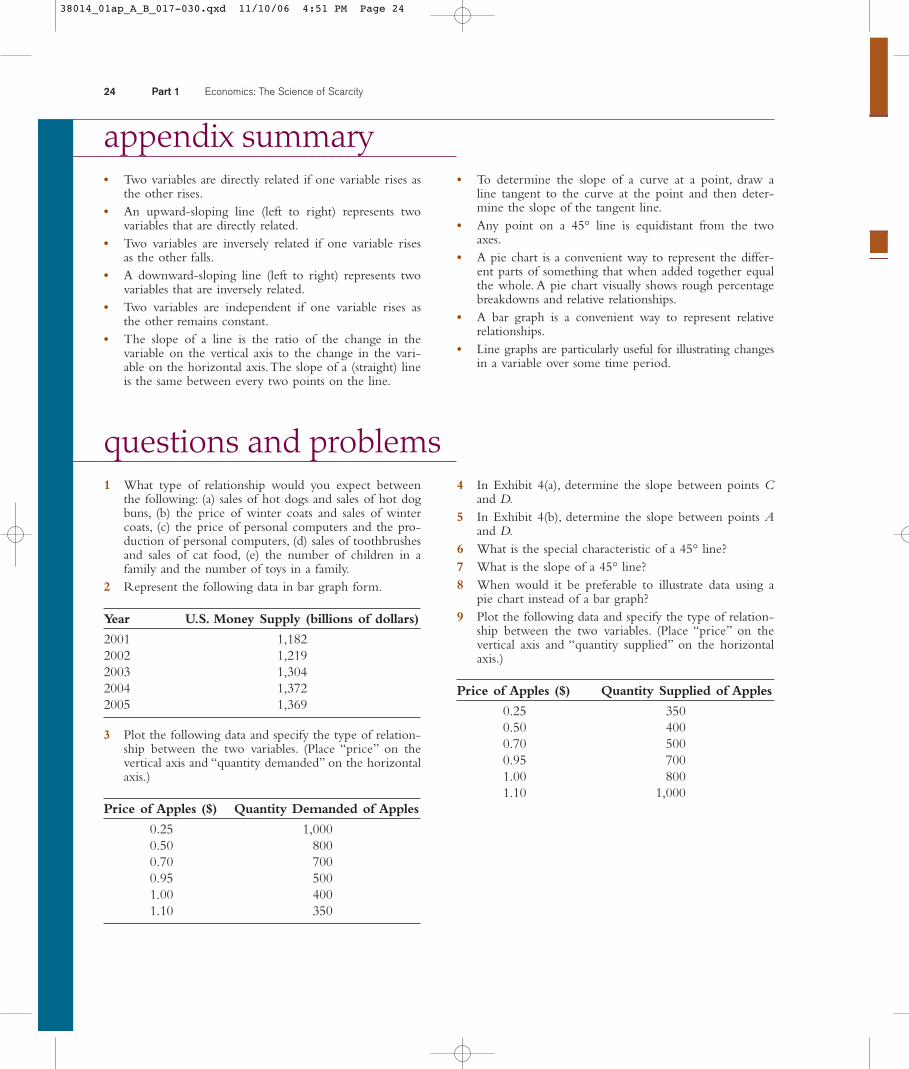
Sometimes economists show two line graphs on the same axes. Usually, they do thisto draw attention to either (1) the relationship between the two variables or (2) the differ-ence between the two variables. In Exhibit 10, the line graphs show the variation andtrend in federal government expenditures and tax receipts for the years 1996–2007 anddraw attention to what has been happening to the “gap” between the two.
38014_01ap_A_B_017-030.qxd 11/10/06 4:51 PM Page 22
Working with Diagrams Appendix A 23
exhibit 9A
vera
ge
Num
ber
of P
oint
s p
er G
ame
Ave
rag
e N
umb
er o
fP
oint
s p
er G
ame
0
20
40
60
80
Data plotted hereare the same as in (b).
Looks different, doesn’t it?
0
20406080
Data plotted here are the same as in (a).Looks different, doesn’t it?
(a)
200220012000199919981997199619951994 20042003 20062005 2007
200220012000199919981997199619951994 20042003 20062005 2007
(b)
The Two Line Graphs Plot the Same Data
In (a) we plotted the average numberof points per game for a college bas-ketball team in different years. Thevariation between the years is pro-nounced. In (b) we plotted the samedata as in (a), but the variation in theperformance of the team appearsmuch less pronounced than in (a).
Year Average Number of Points per Game
1994 501995 401996 591997 511998 601999 502000 752001 632002 602003 712004 612005 552006 702007 64
exhibit 10
Expenditures
1996
Fed
eral
Gov
ernm
ent E
xpen
ditu
res
and
Tax
Rec
eip
ts(b
illio
ns o
f dol
lars
)
Year
2002200120001997 1998 1999 20062005 2007200420030
100200300400500600700800900
1000110012001300140015001600170018001900200021002200230024002500260027002800
Receipts
Federal Government Expenditures andTax Receipts, 1996–2007
Federal government expenditures andtax receipts are shown in line graphform for the period 1996–2007. Thedata for 2006 and 2007 are estimates.
Source: Bureau of Economic Analysis
38014_01ap_A_B_017-030.qxd 11/10/06 4:51 PM Page 23
24 Part 1 Economics: The Science of Scarcity
4 In Exhibit 4(a), determine the slope between points Cand D.
5 In Exhibit 4(b), determine the slope between points Aand D.
6 What is the special characteristic of a 45° line?7 What is the slope of a 45° line?8 When would it be preferable to illustrate data using a
pie chart instead of a bar graph?9 Plot the following data and specify the type of relation-
ship between the two variables. (Place “price” on thevertical axis and “quantity supplied” on the horizontalaxis.)
Price of Apples ($) Quantity Supplied of Apples
0.25 3500.50 4000.70 5000.95 7001.00 8001.10 1,000
1 What type of relationship would you expect betweenthe following: (a) sales of hot dogs and sales of hot dogbuns, (b) the price of winter coats and sales of wintercoats, (c) the price of personal computers and the pro-duction of personal computers, (d) sales of toothbrushesand sales of cat food, (e) the number of children in afamily and the number of toys in a family.
2 Represent the following data in bar graph form.
Year U.S. Money Supply (billions of dollars)
2001 1,1822002 1,2192003 1,3042004 1,3722005 1,369
3 Plot the following data and specify the type of relation-ship between the two variables. (Place “price” on thevertical axis and “quantity demanded” on the horizontalaxis.)
Price of Apples ($) Quantity Demanded of Apples
0.25 1,0000.50 8000.70 7000.95 5001.00 4001.10 350
questions and problems
• To determine the slope of a curve at a point, draw aline tangent to the curve at the point and then deter-mine the slope of the tangent line.
• Any point on a 45° line is equidistant from the twoaxes.
• A pie chart is a convenient way to represent the differ-ent parts of something that when added together equalthe whole. A pie chart visually shows rough percentagebreakdowns and relative relationships.
• A bar graph is a convenient way to represent relativerelationships.
• Line graphs are particularly useful for illustrating changesin a variable over some time period.
• Two variables are directly related if one variable rises asthe other rises.
• An upward-sloping line (left to right) represents twovariables that are directly related.
• Two variables are inversely related if one variable risesas the other falls.
• A downward-sloping line (left to right) represents twovariables that are inversely related.
• Two variables are independent if one variable rises asthe other remains constant.
• The slope of a line is the ratio of the change in thevariable on the vertical axis to the change in the vari-able on the horizontal axis.The slope of a (straight) lineis the same between every two points on the line.
appendix summary
38014_01ap_A_B_017-030.qxd 11/10/06 4:51 PM Page 24
You are probably reading this textbook as part of your first college course in economics.You may be taking this course because you need it to satisfy the requirements in yourmajor. Economics courses are sometimes required for students who plan to major inbusiness, history, liberal studies, social science, or computer science. Of course, you mayalso be taking this course because you plan to major in economics.
If you are like many college students, you may complain that not enough informa-tion is available to students about the various majors at your college or university. Forexample, students who major in business sometimes say they are not quite certain what abusiness major is all about, but then they go on to add that majoring in business is a safebet.“After all,” they comment,“you are pretty sure of getting a job if you have a businessdegree.That’s not always the case with other degrees.”
Many college students choose their majors based on their high school courses. His-tory majors sometimes say that they decided to major in history because they “liked his-tory in high school.” Similarly, chemistry, biology, and math majors say they chose chem-istry, biology, or math as a college major because they liked studying chemistry, biology,or math in high school. In addition, if a student had a hard time with chemistry in highschool and found it boring, then he doesn’t usually want to major in chemistry in col-lege. If a student found both math and economics easy and interesting in high school,then she is likely to major in math or economics.
Students also often look to the dollars at the end of the college degree.A student mayenjoy history and want to learn more history in college but tell herself that she will earn ahigher starting salary after graduation if she majors in computer science or engineering.
Thus, when choosing a major, students often consider (1) how much they enjoystudying a particular subject, (2) what they would like to see themselves doing in thefuture, and (3) income prospects.
Different people may weight these three factors differently. But no matter whatweights you put on each of the factors, it is always better to have more information thanless information, ceteris paribus. (We note “ceteris paribus” because it is not necessarily bet-ter having more information than less information if you have to pay more for the addi-tional information than the additional information is worth.Who wants to pay $10 for apiece of information that only provides $1 in benefits?)
We believe this appendix is a fairly low-cost way of providing you with more infor-mation about an economics major than you currently have.We start by dispelling someof the misinformation you might possess about an economics major. Stated bluntly, somethings that people think about an economics major and about a career in economics arejust not true. For example, some people think that economics majors almost never studysocial relationships; instead, they only study such things as inflation, interest rates, andunemployment. Not true. Economics majors study some of the same things that sociol-ogists, historians, psychologists, and political scientists study. We also provide you withsome information about the major that you may not have.
a p p e n d i x
bShould You Major in Economics?
38014_01ap_A_B_017-030.qxd 11/10/06 4:51 PM Page 25
Next, we tell you the specifics of the economics major—what courses you study ifyou are an economics major, how many courses you are likely to have to take, and more.
Finally, we tell you something about a career in economics. Okay, so you have optedto become an economics major. But the day will come when you have your degree inhand.What’s next? What is your starting salary likely to be? What will you be doing? Areyou going to be happy doing what economists do? (If you never thought economics wasabout happiness, you already have some misinformation about economics. Contrary towhat most laypeople think, economics is not just about money. It is about happiness too.)
Five Myths About Economics and an Economics MajorMYTH 1: ECONOMICS IS ALL MATHEMATICS AND STATISTICS. Some students choose not tomajor in economics because they think economics is all mathematics and statistics. Mathand statistics are used in economics, but at the undergraduate degree level, the math andstatistics are certainly not overwhelming. Economics majors are usually required to takeone statistics course and one math course (usually an introductory calculus course). Evenstudents who say,“Math isn’t my subject” are sometimes happy with the amount of maththey need in economics. Fact is, at the undergraduate level at many colleges and univer-sities, economics is not a very math-intensive course of study.There are many diagramsin economics, but there is not a large amount of math.
A proviso:The amount of math in the economics curriculum varies across collegesand universities. Some economics departments do not require their students to learnmuch math or statistics, but others do. Speaking for the majority of departments, we stillhold to our original point that there isn’t really that much math or statistics in econom-ics at the undergraduate level.The graduate level is a different story.
MYTH 2: ECONOMICS IS ONLY ABOUT INFLATION, INTEREST RATES, UNEMPLOYMENT, ANDOTHER SUCH THINGS. If you study economics at college and then go on to become apracticing economist, no doubt people will ask you certain questions when they learnyour chosen profession. Here are some of the questions they ask:
• Do you think the economy is going to pick up?
• Do you think the economy is going to slow down?
• What stocks would you recommend?
• Do you think interest rates are going to fall?
• Do you think interest rates are going to rise?
• What do you think about buying bonds right now? Is it a good idea?
People ask these kinds of questions because most people believe that economists onlystudy stocks, bonds, interest rates, inflation, unemployment, and so on. Well, economistsdo study these things. But these topics are only a tiny part of what economists study. It isnot hard to find many economists today, both inside and outside academia, who spendmost of their time studying anything but inflation, unemployment, stocks, bonds, and so on.
As we hinted earlier, much of what economists study may surprise you. There areeconomists who use their economic tools and methods to study crime, marriage,divorce, sex, obesity, addiction, sports, voting behavior, bureaucracies, presidential elec-tions, and much more. In short, today’s economics is not your grandfather’s economics.Many more topics are studied today in economics than were studied in your grandfa-ther’s time.
26 Part 1 Economics: The Science of Scarcity
38014_01ap_A_B_017-030.qxd 11/10/06 4:51 PM Page 26
MYTH 3: PEOPLE BECOME ECONOMISTS ONLY IF THEY WANT TO “MAKE MONEY.” Awhile backwe asked a few well-respected and well-known economists what got them interested ineconomics. Here is what some of them had to say:1
Gary Becker, the 1992 winner of the Nobel Prize in Economics, said: “I got inter-ested [in economics] when I was an undergraduate in college. I came into college with astrong interest in mathematics, and at the same time with a strong commitment to dosomething to help society. I learned in the first economics course I took that economicscould deal rigorously, à la mathematics, with social problems.That stimulated me becausein economics I saw that I could combine both the mathematics and my desire to dosomething to help society.”
Vernon Smith, the 2002 winner of the Nobel Prize in Economics, said:“My father’sinfluence started me in science and engineering at Cal Tech, but my mother, who wasactive in socialist politics, probably accounts for the great interest I found in economicswhen I took my first introductory course.”
Alice Rivlin, an economist and former member of the Federal Reserve Board, said:“My interest in economics grew out of concern for improving public policy, bothdomestic and international. I was a teenager in the tremendously idealistic period afterWorld War II when it seemed terribly important to get nations working together tosolve the world’s problems peacefully.”
Allan Meltzer said: “Economics is a social science. At its best it is concerned withways (1) to improve well being by allowing individuals the freedom to achieve their per-sonal aims or goals and (2) to harmonize their individual interests. I find working onsuch issues challenging, and progress is personally rewarding.”
Robert Solow, the 1987 winner of the Nobel Prize in Economics, said: “I grew upin the 1930s and it was very hard not to be interested in economics. If you were a highschool student in the 1930s, you were conscious of the fact that our economy was indeep trouble and no one knew what to do about it.”
Charles Plosser said: “I was an engineer as an undergraduate with little knowledgeof economics. I went to the University of Chicago Graduate School of Business to getan MBA and there became fascinated with economics. I was impressed with the serious-ness with which economics was viewed as a way of organizing one’s thoughts about theworld to address interesting questions and problems.”
Walter Williams said: “I was a major in sociology in 1963 and I concluded that itwas not very rigorous. Over the summer I was reading a book by W.E.B. DuBois, BlackReconstruction, and somewhere in the book it said something along the lines that blackscould not melt into the mainstream of American society until they understood econom-ics, and that was something that got me interested in economics.”
Murray Weidenbaum said: “A specific professor got me interested in economics. Hewas very prescient: He correctly noted that while lawyers dominated the policy-makingprocess up until then (the 1940s), in the future economics would be an important toolfor developing public policy. And he was right.”
Irma Adelman said:“I hesitate to say because it sounds arrogant. My reason [for get-ting into economics] was that I wanted to benefit humanity. And my perception at thetime was that economic problems were the most important problems that humanity hasto face.That is what got me into economics and into economic development.”
Lester Thurow said: “[I got interested in economics because of] the belief, somewould see it as naïve belief, that economics was a profession where it would be possibleto help make the world better.”
Should You Major in Economics? Appendix B 27
1See various interviews in Roger A. Arnold, Economics, 2d edition (St. Paul, Minnesota:West Publishing Company,1992).
38014_01ap_A_B_017-030.qxd 11/10/06 4:51 PM Page 27
MYTH 4: ECONOMICS WASN’T VERY INTERESTING IN HIGH SCHOOL, SO IT’S NOT GOING TO BEVERY INTERESTING IN COLLEGE. A typical high school economics course emphasizes con-sumer economics and spends much time discussing this topic. Students learn aboutcredit cards, mortgage loans, budgets, buying insurance, renting an apartment, and othersuch things.These are important topics because not knowing the “ins and outs” of suchthings can make your life much harder. Still, many students come away from a highschool economics course thinking that economics is always and everywhere about con-sumer topics.
However, a high school economics course and a college economics course are usu-ally as different as day and night. Simply leaf through this book and look at the varietyof topics covered compared to the topics you might have covered in your high schooleconomics course. Go on to look at texts used in other economics courses—courses thatrange from law and economics to history of economic thought to international eco-nomics to sports economics—and you will see what we mean.
MYTH 5: ECONOMICS IS A LOT LIKE BUSINESS, BUT BUSINESS IS MORE MARKETABLE.Although business and economics have some common topics, much that one learns ineconomics is not taught in business and much that one learns in business is not taught ineconomics.The area of intersection between business and economics is not large.
Still, many people think otherwise.And so thinking that business and economics are“pretty much the same thing,” they often choose to major in the subject they believe hasgreater marketability—which they believe is business.
Well, consider the following:
1. A few years ago BusinessWeek magazine asked the chief executive officers (CEOs) ofmajor companies what they thought was the best undergraduate degree. Their firstchoice was engineering. Their second choice was economics. Economics scoredhigher than business administration.
2. The National Association of Colleges and Employers undertook a survey in thesummer of 2005 in which they identified the starting salary offers in different disci-plines. The starting salary in economics/finance was $42,928. The starting salary inbusiness administration was 7.8 percent lower.
What Awaits You as an Economics Major?If you become an economics major, what courses will you take? What are you going tostudy?
At the lower-division level, economics majors must take both the principles ofmacroeconomics course and the principles of microeconomics course.They usually alsotake a statistics course and a math course (usually calculus).
At the upper-division level, they must take intermediate microeconomics and inter-mediate macroeconomics, along with a certain number of electives. Some of the electivecourses include: (1) money and banking, (2) law and economics, (3) history of economicthought, (4) public finance, (5) labor economics, (6) international economics, (7) antitrustand regulation, (8) health economics, (9) economics of development, (10) urban andregional economics, (11) econometrics, (12) mathematical economics, (13) environmen-tal economics, (14) public choice, (15) global managerial economics, (16) economicapproach to politics and sociology, (17) sports economics, and many more courses. Mosteconomics majors take between 12 and 15 economics courses.
One of the attractive things about studying economics is that you will acquire manyof the skills employers highly value. First, you will have the quantitative skills that areimportant in many business and government positions. Second, you will acquire the
28 Part 1 Economics: The Science of Scarcity
38014_01ap_A_B_017-030.qxd 11/10/06 4:51 PM Page 28
writing skills necessary in almost all lines of work.Third, and perhaps most importantly,you will develop the thinking skills that almost all employers agree are critical to success.
A study published in the 1998 edition of the Journal of Economic Education rankedeconomics majors as having the highest average scores on the Law School AdmissionTest (LSAT). Also, consider the words of the Royal Economic Society: “One of thethings that makes economics graduates so employable is that the subject teaches you tothink in a careful and precise way. The fundamental economic issue is how societydecides to allocate its resources: how the costs and benefits of a course of action can beevaluated and compared, and how appropriate choices can be made. A degree in eco-nomics gives a training in decision making principles, providing a skill applicable in avery wide range of careers.”
Keep in mind, too, that economics is one of the most popular majors at some of themost respected universities in the country.As of this writing, economics is the top majorat Harvard, Princeton, Columbia, Stanford, University of Pennsylvania, and University ofChicago. It is the second most popular major at Brown,Yale, and the University of Cali-fornia at Berkeley. It is the third most popular major at Cornell and Dartmouth.
What Do Economists Do?Employment for economists is projected to grow between 21 and 35 percent between2000 and 2010. According to the Occupational Outlook Handbook:
Opportunities for economists should be best in private industry, especially inresearch, testing, and consulting firms, as more companies contract out for eco-nomic research services.The growing complexity of the global economy, competi-tion, and increased reliance on quantitative methods for analyzing the currentvalue of future funds, business trends, sales, and purchasing should spur demand foreconomists. The growing need for economic analyses in virtually every industryshould result in additional jobs for economists.
Today, economists work in many varied fields. Here are some of the fields and some ofthe positions economists hold in those fields:
Should You Major in Economics? Appendix B 29
EducationCollege ProfessorResearcherHigh School Teacher
JournalismResearcherIndustry AnalystEconomic Analyst
AccountingAnalystAuditorResearcherConsultant
General BusinessChief Executive OfficerBusiness AnalystMarketing AnalystBusiness ForecasterCompetitive Analyst
GovernmentResearcherAnalystSpeechwriterForecaster
Financial ServicesBusiness JournalistInternational Analyst
Newsletter EditorBrokerInvestment Banker
BankingCredit AnalystLoan OfficerInvestment AnalystFinancial Manager
OtherBusiness ConsultantIndependent ForecasterFreelance AnalystThink Tank AnalystEntrepreneur
Economists do a myriad of things. For example, in business, economists often ana-lyze economic conditions, make forecasts, offer strategic planning initiatives, collect andanalyze data, predict exchange rate movements, and review regulatory policies, amongother things. In government, economists collect and analyze data, analyze international
38014_01ap_A_B_017-030.qxd 11/10/06 4:51 PM Page 29
economic situations, research monetary conditions, advise on policy, and much more. Asprivate consultants, economists work with accountants, business executives, governmentofficials, educators, financial firms, labor unions, state and local governments, and others.
Median annual earnings of economists were $68,550 in 2002. The middle 50 per-cent earned between $50,560 and $90,710. The lowest 10 percent earned less than$38,690, and the highest 10 percent earned more than $120,440.
Places to Find More InformationIf you are interested in an economics major and perhaps a career in economics, here aresome places where you can go and some people you can speak with to acquire moreinformation:
• To learn about the economics curriculum, we urge you to speak with the economics pro-fessors at your college or university. Ask them what courses you would have to take asan economics major. Ask them what elective courses are available. In addition, ask themwhy they chose to study economics. What is it about economics that interested them?
• For more information about salaries and what economists do, you may want to visit theOccupational Outlook Handbook Web site at http://www.bls.gov/oco/.
• For starting salary information, you may want to visit the National Association of Collegesand Employers Web site at http://www.naceweb.org/.
• To see a list of famous people who have majored in economics, go to http://www.marietta.edu/~ema/econ/famous.html.
Concluding RemarksChoosing a major is a big decision and therefore should not be made too quickly andwithout much thought. In this short appendix, we have provided you with some infor-mation about an economics major and a career in economics. Economics may not befor everyone (in fact, economists would say that if it were, many of the benefits of spe-cialization would be lost), but it may be right for you. Economics is a major wheremany of today’s most marketable skills are acquired—the skills of good writing, quantita-tive analysis, and thinking. It is a major in which professors and students daily ask andanswer some very interesting and relevant questions. It is a major that is highly regardedby employers. It may just be the right major for you. Give it some thought.
30 Part 1 Economics: The Science of Scarcity
38014_01ap_A_B_017-030.qxd 11/10/06 4:51 PM Page 30