Embed Size (px)
Citation preview
1
URL: www.walden.co.jp
Written by Yoshiyuki Muroya
E-mail: [email protected]
Phone:+81 3 3553 3769
AVANT (3836)
1.0 Executive Summary (21 November 2017)
Frontloaded Investment
AVANT, mainly involved with running operations of selling DivaSystem, i.e., packaged software for
consolidated management and accounting, on a licensing basis together with related services, is currently
suffering from frontloaded investment to drive sales and earnings in a long-term view. In the development
and/or version upgrade for the Company’s product, i.e., DivaSystem as well as in the provision of diverse
services, the key source of creating value is nothing but manual labor by own personnel, suggesting it is just
indispensable to expand own human resources to drive growth going forward. Still, most recently, the
Company is increasing the number of own personnel roughly the fastest ever, while coping with work style
reform on a full-fledged basis at the same time. Due mainly to this, the Company currently sees temporary
increases of human-resource-related expenses to a considerable extent, giving negative impacts to
short-term earnings. However, this drives long-term earnings at the same time as far as we could gather.
The Company’s midterm management plan (FY06/2018 to FY06/2020) is calling for prospective sales of
¥13,433m and operating profit of ¥1,626m in FY06/2020, i.e., the last year of the plan. When based on the
FY06/2017 results, sales are to see CAGR of 8.4% and of 7.6% for operating profit during the same period.
Meanwhile, according to Tetsuji Morikawa who founded the Company and is currently President Group
CEO, the Company, having offered solutions on “accounting (accounts processing of the past results)”, is now
starting up offering solutions on “finance (optimum allocations of business assets for the future growth)”, in
order to further beef up earnings growth in a long-term view.
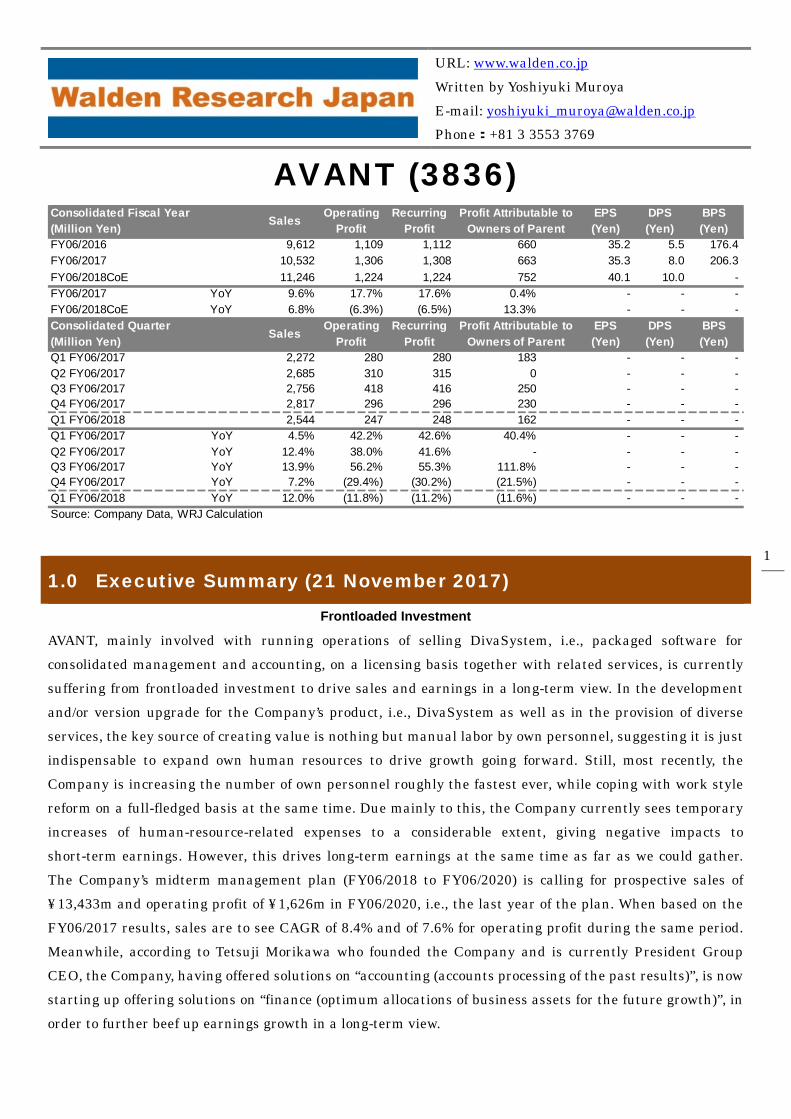
Consolidated Fiscal Year Operating Recurring Profit Attributable to EPS DPS BPS
(Million Yen) Profit Profit Owners of Parent (Yen) (Yen) (Yen)
FY06/2016 9,612 1,109 1,112 660 35.2 5.5 176.4
FY06/2017 10,532 1,306 1,308 663 35.3 8.0 206.3
FY06/2018CoE 11,246 1,224 1,224 752 40.1 10.0 -
FY06/2017 YoY 9.6% 17.7% 17.6% 0.4% - - -
FY06/2018CoE YoY 6.8% (6.3%) (6.5%) 13.3% - - -
Consolidated Quarter Operating Recurring Profit Attributable to EPS DPS BPS
(Million Yen) Profit Profit Owners of Parent (Yen) (Yen) (Yen)
Q1 FY06/2017 2,272 280 280 183 - - -
Q2 FY06/2017 2,685 310 315 0 - - -
Q3 FY06/2017 2,756 418 416 250 - - -
Q4 FY06/2017 2,817 296 296 230 - - -
Q1 FY06/2018 2,544 247 248 162 - - -
Q1 FY06/2017 YoY 4.5% 42.2% 42.6% 40.4% - - -
Q2 FY06/2017 YoY 12.4% 38.0% 41.6% - - - -
Q3 FY06/2017 YoY 13.9% 56.2% 55.3% 111.8% - - -
Q4 FY06/2017 YoY 7.2% (29.4%) (30.2%) (21.5%) - - -
Q1 FY06/2018 YoY 12.0% (11.8%) (11.2%) (11.6%) - - -
Source: Company Data, WRJ Calculation
Sales
Sales
2
In Q1 FY06/2018, sales came in at ¥2,544m (up 12.0% YoY), operating profit ¥247m (down 11.8%) and
operating profit margin 9.7% (down 2.6% points). Business performance as a whole for the Company hinges
on that of Consolidated Accounting Related to sell DivaSystem, i.e., packaged software for consolidated
management and accounting, on a licensing basis together with related services to a large extent. Sales
came in at ¥1,392m (up 7.7% YoY), operating profit ¥145m (down 17.7%) and operating profit margin 10.4%
(down 3.2% points), while having accounted for 54.7% of sales as a whole for the Company and 66.8% of
operating profit. Sales of DivaSystem on a licensing basis were favorable, having resulted in the number of
accumulated customers as many as 950 as of the end of Q1 since the launch in FY06/1998. At the same time,
given utilization rate remaining high, sales of maintenance services were also favorable. On top of this, sales
are even firmer than ever in regards to those associated with introducing DivaSystem, etc. in line with
increasing adoptions of IFRS and increasing needs to cope with sophistication of business administration.
Meanwhile, sales were buoyant and thus earnings on the Business Intelligence side as well as on the
Outsourcing side. While the former represents system integration services by an operating company under
management of the Company to have been acquired by merger and the latter offering of outsourcing services
to undertake duties of consolidated accounting and tax payment for existing customers to have been
cultivated by adoptions of DivaSystem. Nevertheless, earnings came down as a whole for the Company due
to fall of earnings larger on the mainstay Consolidated Accounting Related side.
FY06/2018 initial Company forecasts have remained unchanged, going for prospective sales of ¥11,246m (up
6.8% YoY), operating profit of ¥1,224m (down 6.3%) and operating profit margin of 10.9% (down 1.5% points).
It appears that increasing sales but decreasing earnings in Q1 were in line with assumptions, while the
same being assumed on a full-year basis too. That is to say, demand for product and services offered by the
Company is to remain buoyant, but increasing human-resource-related expenses are to generate negative
impacts more than offsetting buoyant sales in terms of earnings. Even so, as far as assuming both
FY06/2018 Company forecasts and earnings target of midterm management plan are to be met, earnings
correction stemming from increasing human-resource-related expenses is not to reappear in FY06/2019.
Based on said assumptions, the Company is to see operating profit up 15.1% over the previous year in
FY03/2019 and up 15.4% in FY06/2020.
IR Representative: Office of Group Management and Control, Nobue Aoki([email protected])
3
2.0 Company Profile
Providing Consolidated Management and Accounting with Solutions
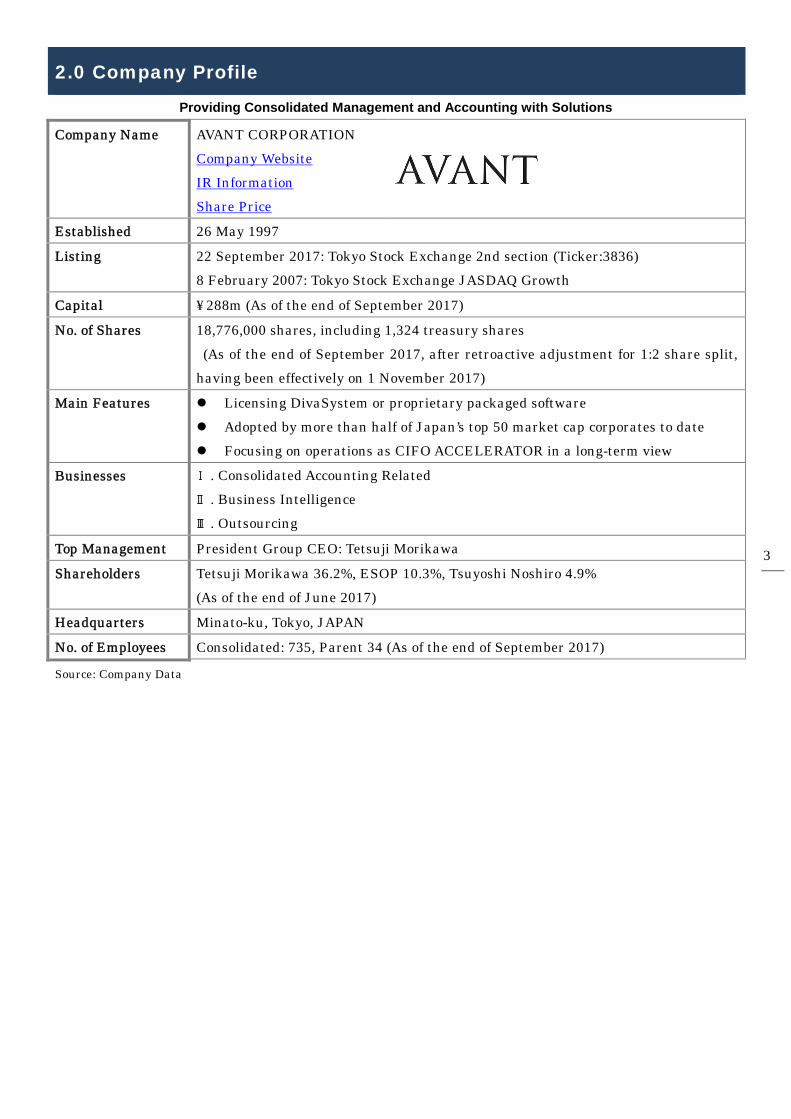
Company Name AVANT CORPORATION
Company Website
IR Information
Share Price
Established 26 May 1997
Listing 22 September 2017: Tokyo Stock Exchange 2nd section (Ticker:3836)
8 February 2007: Tokyo Stock Exchange JASDAQ Growth
Capital ¥288m (As of the end of September 2017)
No. of Shares 18,776,000 shares, including 1,324 treasury shares
(As of the end of September 2017, after retroactive adjustment for 1:2 share split,
having been effectively on 1 November 2017)
Main Features Licensing DivaSystem or proprietary packaged software
Adopted by more than half of Japan’s top 50 market cap corporates to date
Focusing on operations as CIFO ACCELERATOR in a long-term view
Businesses Ⅰ. Consolidated Accounting Related
Ⅱ. Business Intelligence
Ⅲ. Outsourcing
Top Management President Group CEO: Tetsuji Morikawa
Shareholders Tetsuji Morikawa 36.2%, ESOP 10.3%, Tsuyoshi Noshiro 4.9%
(As of the end of June 2017)
Headquarters Minato-ku, Tokyo, JAPAN
No. of Employees Consolidated: 735, Parent 34 (As of the end of September 2017)
Source: Company Data
4
3.0 Recent Trading and Prospects
Q1 FY06/2018 Results
In Q1 FY06/2018, sales came in at ¥2,544m (up 12.0% YoY), operating profit ¥247m (down 11.8%), recurring
profit ¥248m (down 11.2%) and profit attributable to owners of parent ¥162m (down 11.6%), while operating
profit margin 9.7% (down 2.6% points). Thus, sales increased while earnings came down, which was
attributable to a one-off factor. Meanwhile, when compared with FY06/2018 initial Company forecasts, the
Company saw progress rate of 22.6% in sales and 20.2% in operating profit, roughly in line with results in
the previous year. In FY06/2017 results, the Company saw 21.6% and 21.5%, respectively, in Q1, suggesting
that initial Company forecasts have been initially assuming increasing sales but decreasing earnings due to
a one-off factor.
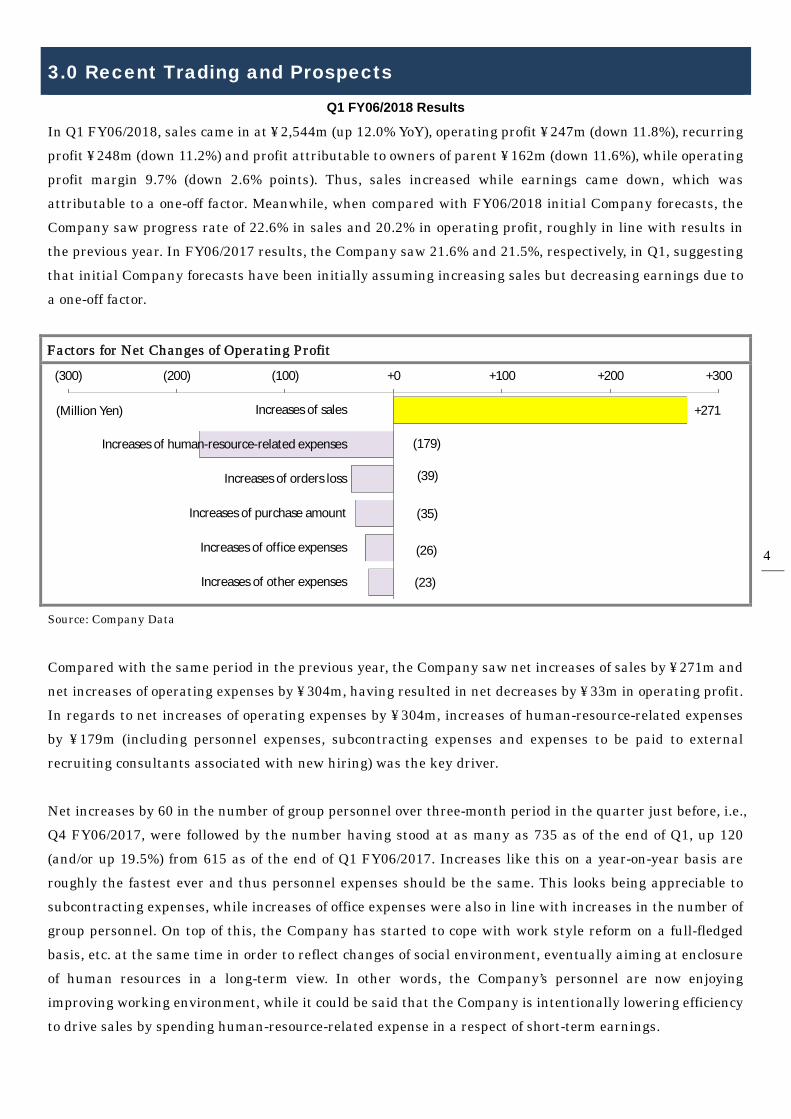
Factors for Net Changes of Operating Profit
Source: Company Data
Compared with the same period in the previous year, the Company saw net increases of sales by ¥271m and
net increases of operating expenses by ¥304m, having resulted in net decreases by ¥33m in operating profit.
In regards to net increases of operating expenses by ¥304m, increases of human-resource-related expenses
by ¥179m (including personnel expenses, subcontracting expenses and expenses to be paid to external
recruiting consultants associated with new hiring) was the key driver.
Net increases by 60 in the number of group personnel over three-month period in the quarter just before, i.e.,
Q4 FY06/2017, were followed by the number having stood at as many as 735 as of the end of Q1, up 120
(and/or up 19.5%) from 615 as of the end of Q1 FY06/2017. Increases like this on a year-on-year basis are
roughly the fastest ever and thus personnel expenses should be the same. This looks being appreciable to
subcontracting expenses, while increases of office expenses were also in line with increases in the number of
group personnel. On top of this, the Company has started to cope with work style reform on a full-fledged
basis, etc. at the same time in order to reflect changes of social environment, eventually aiming at enclosure
of human resources in a long-term view. In other words, the Company’s personnel are now enjoying
improving working environment, while it could be said that the Company is intentionally lowering efficiency
to drive sales by spending human-resource-related expense in a respect of short-term earnings.
+271
(179)
(39)
(35)
(26)
(23)
(300) (200) (100) +0 +100 +200 +300
Increases of sales
Increases of human-resource-related expenses
Increases of orders loss
Increases of purchase amount
Increases of office expenses
Increases of other expenses
(Million Yen)
5
The other issue to mention is that new graduates and so-called the second new graduates are to start up
contributing to sales gradually after three-month preparatory training and OJT (On-the-Job Training) in
each department to follow. In Q1, given the number of all those new personnel increasing over the same
period in the previous year, it should be the case that lead time to drive sales after spending of
human-resource-related expenses is now rather extending. Nevertheless, negative impacts are to calm down
eventually, in regards to both of them, i.e., intentionally lowering efficiency for spending of
human-resource-related expenses and extending lead time, as far as no further acceleration prevailing on
new hiring and progress of work style reform.
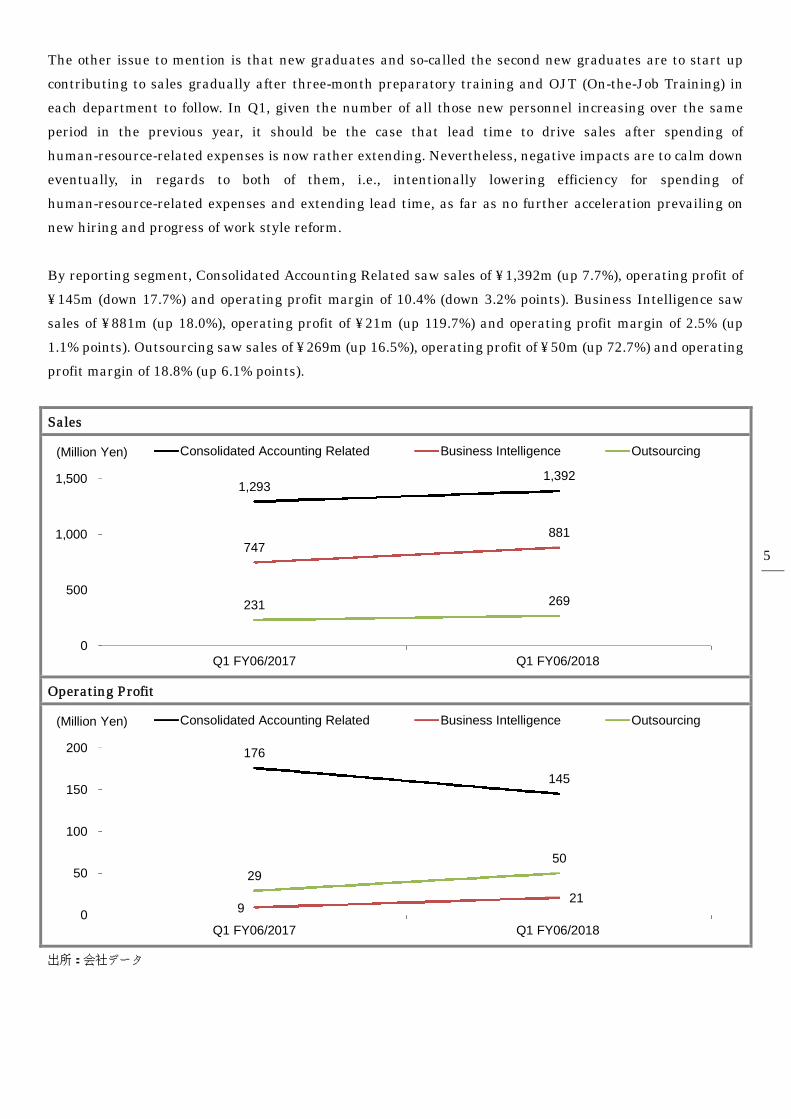
By reporting segment, Consolidated Accounting Related saw sales of ¥1,392m (up 7.7%), operating profit of
¥145m (down 17.7%) and operating profit margin of 10.4% (down 3.2% points). Business Intelligence saw
sales of ¥881m (up 18.0%), operating profit of ¥21m (up 119.7%) and operating profit margin of 2.5% (up
1.1% points). Outsourcing saw sales of ¥269m (up 16.5%), operating profit of ¥50m (up 72.7%) and operating
profit margin of 18.8% (up 6.1% points).
Sales
Operating Profit
出所:会社データ
1,2931,392
747881
231 269
0
500
1,000
1,500
Q1 FY06/2017 Q1 FY06/2018
Consolidated Accounting Related Business Intelligence Outsourcing(Million Yen)
176
145
921
29
50
0
50
100
150
200
Q1 FY06/2017 Q1 FY06/2018
Consolidated Accounting Related Business Intelligence Outsourcing(Million Yen)
6
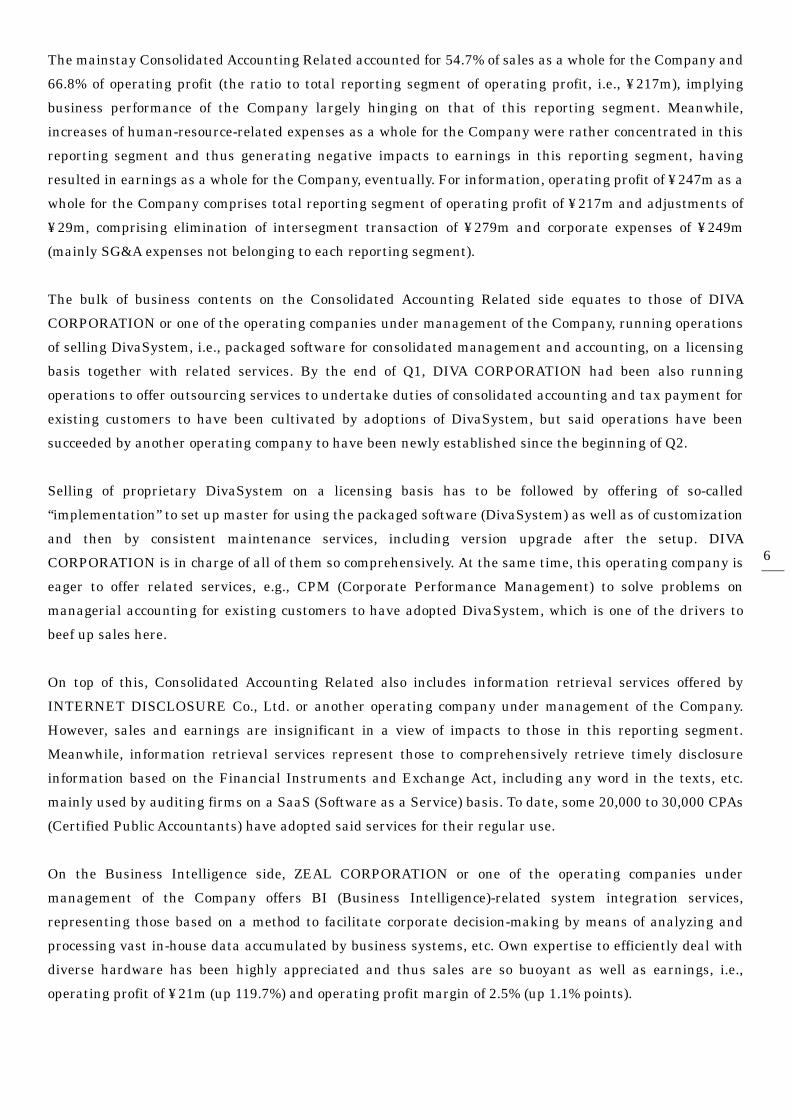
The mainstay Consolidated Accounting Related accounted for 54.7% of sales as a whole for the Company and
66.8% of operating profit (the ratio to total reporting segment of operating profit, i.e., ¥217m), implying
business performance of the Company largely hinging on that of this reporting segment. Meanwhile,
increases of human-resource-related expenses as a whole for the Company were rather concentrated in this
reporting segment and thus generating negative impacts to earnings in this reporting segment, having
resulted in earnings as a whole for the Company, eventually. For information, operating profit of ¥247m as a
whole for the Company comprises total reporting segment of operating profit of ¥217m and adjustments of
¥29m, comprising elimination of intersegment transaction of ¥279m and corporate expenses of ¥249m
(mainly SG&A expenses not belonging to each reporting segment).
The bulk of business contents on the Consolidated Accounting Related side equates to those of DIVA
CORPORATION or one of the operating companies under management of the Company, running operations
of selling DivaSystem, i.e., packaged software for consolidated management and accounting, on a licensing
basis together with related services. By the end of Q1, DIVA CORPORATION had been also running
operations to offer outsourcing services to undertake duties of consolidated accounting and tax payment for
existing customers to have been cultivated by adoptions of DivaSystem, but said operations have been
succeeded by another operating company to have been newly established since the beginning of Q2.
Selling of proprietary DivaSystem on a licensing basis has to be followed by offering of so-called
“implementation” to set up master for using the packaged software (DivaSystem) as well as of customization
and then by consistent maintenance services, including version upgrade after the setup. DIVA
CORPORATION is in charge of all of them so comprehensively. At the same time, this operating company is
eager to offer related services, e.g., CPM (Corporate Performance Management) to solve problems on
managerial accounting for existing customers to have adopted DivaSystem, which is one of the drivers to
beef up sales here.
On top of this, Consolidated Accounting Related also includes information retrieval services offered by
INTERNET DISCLOSURE Co., Ltd. or another operating company under management of the Company.
However, sales and earnings are insignificant in a view of impacts to those in this reporting segment.
Meanwhile, information retrieval services represent those to comprehensively retrieve timely disclosure
information based on the Financial Instruments and Exchange Act, including any word in the texts, etc.
mainly used by auditing firms on a SaaS (Software as a Service) basis. To date, some 20,000 to 30,000 CPAs
(Certified Public Accountants) have adopted said services for their regular use.
On the Business Intelligence side, ZEAL CORPORATION or one of the operating companies under
management of the Company offers BI (Business Intelligence)-related system integration services,
representing those based on a method to facilitate corporate decision-making by means of analyzing and
processing vast in-house data accumulated by business systems, etc. Own expertise to efficiently deal with
diverse hardware has been highly appreciated and thus sales are so buoyant as well as earnings, i.e.,
operating profit of ¥21m (up 119.7%) and operating profit margin of 2.5% (up 1.1% points).
7
Still, operating profit and operating profit margin have remained relatively small in terms of absolute value.
Although direct sales are starting to pick up most recently, this operating company has been basically
involved with indirect sales through major system integrators. Meanwhile, ZEAL CORPORATION has been
under management by the Company since Q2 FY06/2013 through merger & acquisition, while goodwill
write-off (¥113m pa) stemming from here was completed in Q1 FY06/2018. Thus, the Company is to see
decreases of expenses as much as corresponding to this starting in Q2.
Meanwhile, on the Outsourcing side, sales are roughly no more than one third of Business Intelligence, but
operating profit margin even higher than Consolidated Accounting Related being enjoyed. By the end of Q1,
DIVA CORPORATION to run the operations of Consolidated Accounting Related as one of the operating
companies under management of the Company had been in charge of all those operations too, but they have
been succeeded by FIERTE CORPORATION (100% consolidated subsidiary) or newly-established operating
company under management of the Company since the beginning of Q2.
On the Outsourcing side, representing operations to offer those to undertake duties of consolidated
accounting and tax payment, it appears that there remains huge room to newly cultivate in regards to
existing customer base to have been cultivated by adoptions of DivaSystem. More importantly, new strategy
to further enhance sales by cultivating new customer base other than existing one has been introduced,
where it is to be driven by taking advantage of own new brand to have been newly created in line with the
company split. As planned, the company split was enforced on 1 October 2017 as well as having been
effective since then.
8
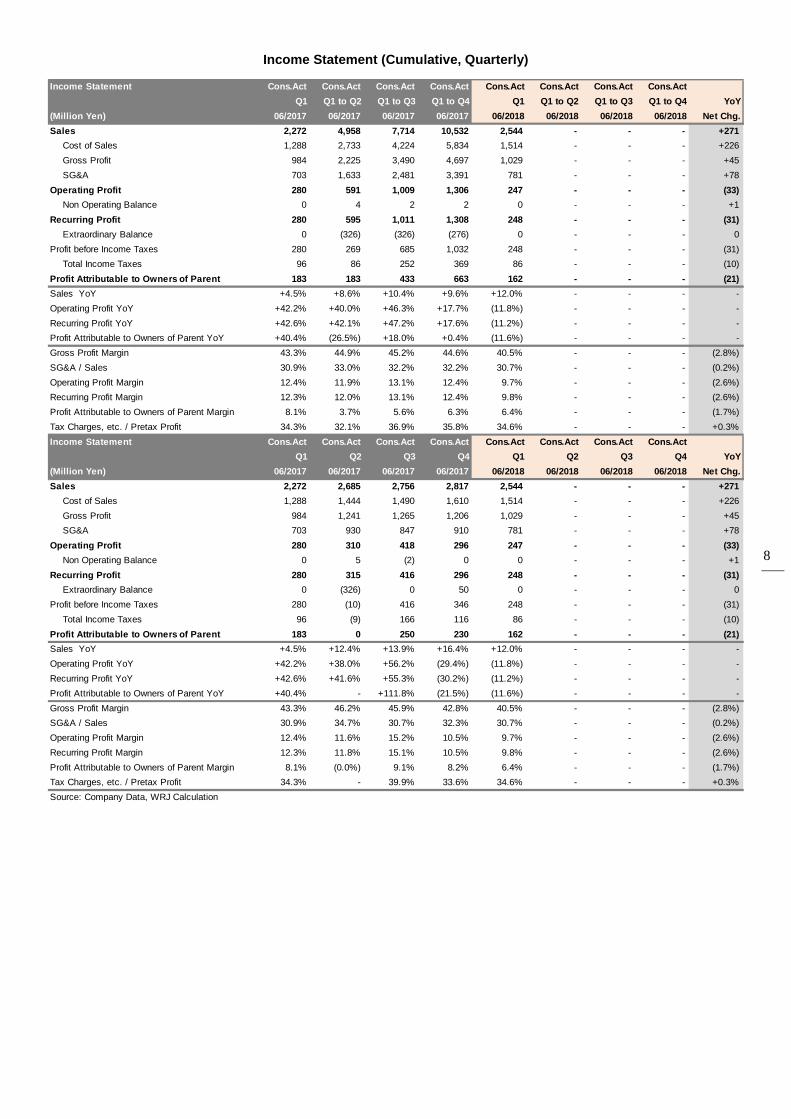
Income Statement (Cumulative, Quarterly)
Income Statement Cons.Act Cons.Act Cons.Act Cons.Act Cons.Act Cons.Act Cons.Act Cons.Act
Q1 Q1 to Q2 Q1 to Q3 Q1 to Q4 Q1 Q1 to Q2 Q1 to Q3 Q1 to Q4 YoY
(Million Yen) 06/2017 06/2017 06/2017 06/2017 06/2018 06/2018 06/2018 06/2018 Net Chg.
Sales 2,272 4,958 7,714 10,532 2,544 - - - +271
Cost of Sales 1,288 2,733 4,224 5,834 1,514 - - - +226
Gross Profit 984 2,225 3,490 4,697 1,029 - - - +45
SG&A 703 1,633 2,481 3,391 781 - - - +78
Operating Profit 280 591 1,009 1,306 247 - - - (33)
Non Operating Balance 0 4 2 2 0 - - - +1
Recurring Profit 280 595 1,011 1,308 248 - - - (31)
Extraordinary Balance 0 (326) (326) (276) 0 - - - 0
Profit before Income Taxes 280 269 685 1,032 248 - - - (31)
Total Income Taxes 96 86 252 369 86 - - - (10)
Profit Attributable to Owners of Parent 183 183 433 663 162 - - - (21)
Sales YoY +4.5% +8.6% +10.4% +9.6% +12.0% - - - -
Operating Profit YoY +42.2% +40.0% +46.3% +17.7% (11.8%) - - - -
Recurring Profit YoY +42.6% +42.1% +47.2% +17.6% (11.2%) - - - -
Profit Attributable to Owners of Parent YoY +40.4% (26.5%) +18.0% +0.4% (11.6%) - - - -
Gross Profit Margin 43.3% 44.9% 45.2% 44.6% 40.5% - - - (2.8%)
SG&A / Sales 30.9% 33.0% 32.2% 32.2% 30.7% - - - (0.2%)
Operating Profit Margin 12.4% 11.9% 13.1% 12.4% 9.7% - - - (2.6%)
Recurring Profit Margin 12.3% 12.0% 13.1% 12.4% 9.8% - - - (2.6%)
Profit Attributable to Owners of Parent Margin 8.1% 3.7% 5.6% 6.3% 6.4% - - - (1.7%)
Tax Charges, etc. / Pretax Profit 34.3% 32.1% 36.9% 35.8% 34.6% - - - +0.3%
Income Statement Cons.Act Cons.Act Cons.Act Cons.Act Cons.Act Cons.Act Cons.Act Cons.Act
Q1 Q2 Q3 Q4 Q1 Q2 Q3 Q4 YoY
(Million Yen) 06/2017 06/2017 06/2017 06/2017 06/2018 06/2018 06/2018 06/2018 Net Chg.
Sales 2,272 2,685 2,756 2,817 2,544 - - - +271
Cost of Sales 1,288 1,444 1,490 1,610 1,514 - - - +226
Gross Profit 984 1,241 1,265 1,206 1,029 - - - +45
SG&A 703 930 847 910 781 - - - +78
Operating Profit 280 310 418 296 247 - - - (33)
Non Operating Balance 0 5 (2) 0 0 - - - +1
Recurring Profit 280 315 416 296 248 - - - (31)
Extraordinary Balance 0 (326) 0 50 0 - - - 0
Profit before Income Taxes 280 (10) 416 346 248 - - - (31)
Total Income Taxes 96 (9) 166 116 86 - - - (10)
Profit Attributable to Owners of Parent 183 0 250 230 162 - - - (21)
Sales YoY +4.5% +12.4% +13.9% +16.4% +12.0% - - - -
Operating Profit YoY +42.2% +38.0% +56.2% (29.4%) (11.8%) - - - -
Recurring Profit YoY +42.6% +41.6% +55.3% (30.2%) (11.2%) - - - -
Profit Attributable to Owners of Parent YoY +40.4% - +111.8% (21.5%) (11.6%) - - - -
Gross Profit Margin 43.3% 46.2% 45.9% 42.8% 40.5% - - - (2.8%)
SG&A / Sales 30.9% 34.7% 30.7% 32.3% 30.7% - - - (0.2%)
Operating Profit Margin 12.4% 11.6% 15.2% 10.5% 9.7% - - - (2.6%)
Recurring Profit Margin 12.3% 11.8% 15.1% 10.5% 9.8% - - - (2.6%)
Profit Attributable to Owners of Parent Margin 8.1% (0.0%) 9.1% 8.2% 6.4% - - - (1.7%)
Tax Charges, etc. / Pretax Profit 34.3% - 39.9% 33.6% 34.6% - - - +0.3%
Source: Company Data, WRJ Calculation
9
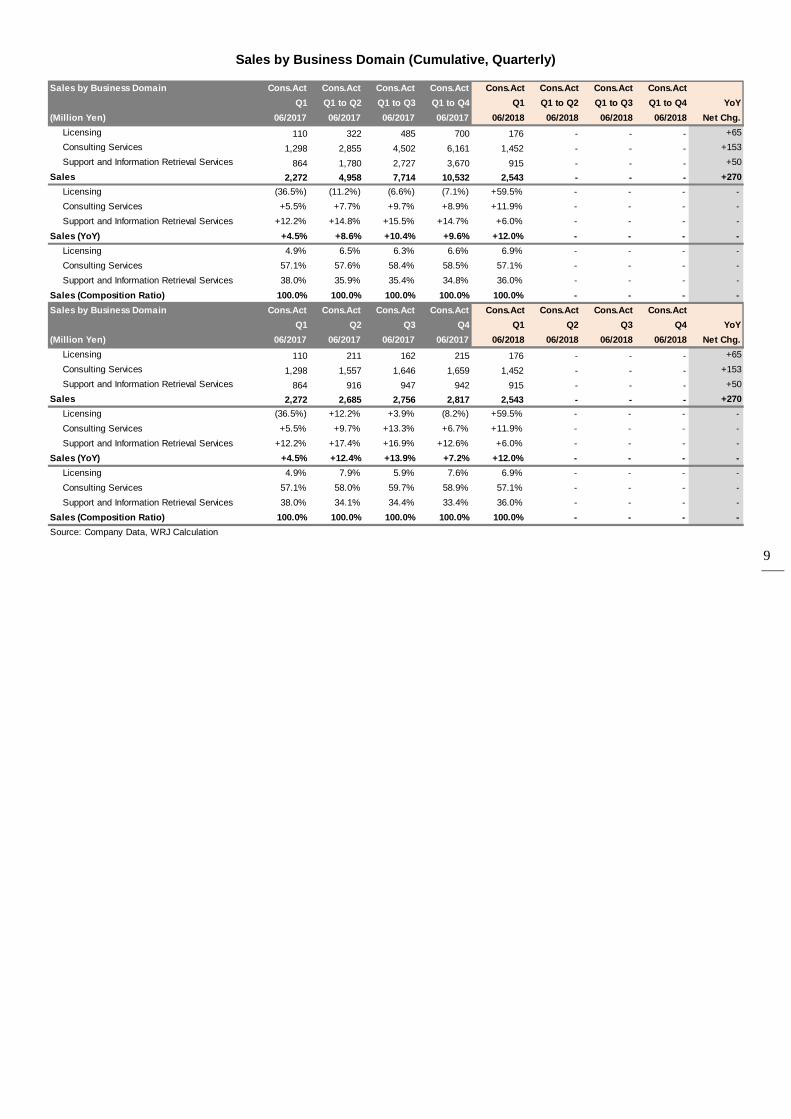
Sales by Business Domain (Cumulative, Quarterly)
Sales by Business Domain Cons.Act Cons.Act Cons.Act Cons.Act Cons.Act Cons.Act Cons.Act Cons.Act
Q1 Q1 to Q2 Q1 to Q3 Q1 to Q4 Q1 Q1 to Q2 Q1 to Q3 Q1 to Q4 YoY
(Million Yen) 06/2017 06/2017 06/2017 06/2017 06/2018 06/2018 06/2018 06/2018 Net Chg.
Licensing 110 322 485 700 176 - - - +65
Consulting Services 1,298 2,855 4,502 6,161 1,452 - - - +153
Support and Information Retrieval Services 864 1,780 2,727 3,670 915 - - - +50
Sales 2,272 4,958 7,714 10,532 2,543 - - - +270
Licensing (36.5%) (11.2%) (6.6%) (7.1%) +59.5% - - - -
Consulting Services +5.5% +7.7% +9.7% +8.9% +11.9% - - - -
Support and Information Retrieval Services +12.2% +14.8% +15.5% +14.7% +6.0% - - - -
Sales (YoY) +4.5% +8.6% +10.4% +9.6% +12.0% - - - -
Licensing 4.9% 6.5% 6.3% 6.6% 6.9% - - - -
Consulting Services 57.1% 57.6% 58.4% 58.5% 57.1% - - - -
Support and Information Retrieval Services 38.0% 35.9% 35.4% 34.8% 36.0% - - - -
Sales (Composition Ratio) 100.0% 100.0% 100.0% 100.0% 100.0% - - - -
Sales by Business Domain Cons.Act Cons.Act Cons.Act Cons.Act Cons.Act Cons.Act Cons.Act Cons.Act
Q1 Q2 Q3 Q4 Q1 Q2 Q3 Q4 YoY
(Million Yen) 06/2017 06/2017 06/2017 06/2017 06/2018 06/2018 06/2018 06/2018 Net Chg.
Licensing 110 211 162 215 176 - - - +65
Consulting Services 1,298 1,557 1,646 1,659 1,452 - - - +153
Support and Information Retrieval Services 864 916 947 942 915 - - - +50
Sales 2,272 2,685 2,756 2,817 2,543 - - - +270
Licensing (36.5%) +12.2% +3.9% (8.2%) +59.5% - - - -
Consulting Services +5.5% +9.7% +13.3% +6.7% +11.9% - - - -
Support and Information Retrieval Services +12.2% +17.4% +16.9% +12.6% +6.0% - - - -
Sales (YoY) +4.5% +12.4% +13.9% +7.2% +12.0% - - - -
Licensing 4.9% 7.9% 5.9% 7.6% 6.9% - - - -
Consulting Services 57.1% 58.0% 59.7% 58.9% 57.1% - - - -
Support and Information Retrieval Services 38.0% 34.1% 34.4% 33.4% 36.0% - - - -
Sales (Composition Ratio) 100.0% 100.0% 100.0% 100.0% 100.0% - - - -
Source: Company Data, WRJ Calculation
10
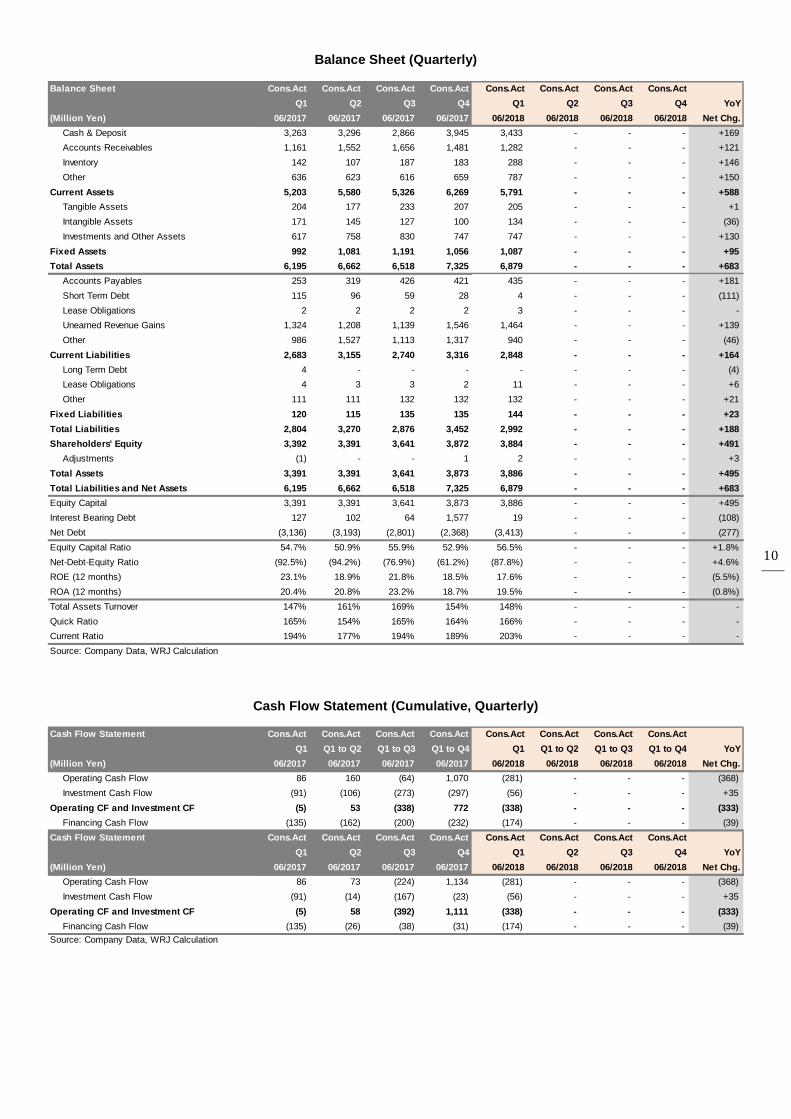
Balance Sheet (Quarterly)
Cash Flow Statement (Cumulative, Quarterly)
Balance Sheet Cons.Act Cons.Act Cons.Act Cons.Act Cons.Act Cons.Act Cons.Act Cons.Act
Q1 Q2 Q3 Q4 Q1 Q2 Q3 Q4 YoY
(Million Yen) 06/2017 06/2017 06/2017 06/2017 06/2018 06/2018 06/2018 06/2018 Net Chg.
Cash & Deposit 3,263 3,296 2,866 3,945 3,433 - - - +169
Accounts Receivables 1,161 1,552 1,656 1,481 1,282 - - - +121
Inventory 142 107 187 183 288 - - - +146
Other 636 623 616 659 787 - - - +150
Current Assets 5,203 5,580 5,326 6,269 5,791 - - - +588
Tangible Assets 204 177 233 207 205 - - - +1
Intangible Assets 171 145 127 100 134 - - - (36)
Investments and Other Assets 617 758 830 747 747 - - - +130
Fixed Assets 992 1,081 1,191 1,056 1,087 - - - +95
Total Assets 6,195 6,662 6,518 7,325 6,879 - - - +683
Accounts Payables 253 319 426 421 435 - - - +181
Short Term Debt 115 96 59 28 4 - - - (111)
Lease Obligations 2 2 2 2 3 - - - -
Unearned Revenue Gains 1,324 1,208 1,139 1,546 1,464 - - - +139
Other 986 1,527 1,113 1,317 940 - - - (46)
Current Liabilities 2,683 3,155 2,740 3,316 2,848 - - - +164
Long Term Debt 4 - - - - - - - (4)
Lease Obligations 4 3 3 2 11 - - - +6
Other 111 111 132 132 132 - - - +21
Fixed Liabilities 120 115 135 135 144 - - - +23
Total Liabilities 2,804 3,270 2,876 3,452 2,992 - - - +188
Shareholders' Equity 3,392 3,391 3,641 3,872 3,884 - - - +491
Adjustments (1) - - 1 2 - - - +3
Total Assets 3,391 3,391 3,641 3,873 3,886 - - - +495
Total Liabilities and Net Assets 6,195 6,662 6,518 7,325 6,879 - - - +683
Equity Capital 3,391 3,391 3,641 3,873 3,886 - - - +495
Interest Bearing Debt 127 102 64 1,577 19 - - - (108)
Net Debt (3,136) (3,193) (2,801) (2,368) (3,413) - - - (277)
Equity Capital Ratio 54.7% 50.9% 55.9% 52.9% 56.5% - - - +1.8%
Net-Debt-Equity Ratio (92.5%) (94.2%) (76.9%) (61.2%) (87.8%) - - - +4.6%
ROE (12 months) 23.1% 18.9% 21.8% 18.5% 17.6% - - - (5.5%)
ROA (12 months) 20.4% 20.8% 23.2% 18.7% 19.5% - - - (0.8%)
Total Assets Turnover 147% 161% 169% 154% 148% - - - -
Quick Ratio 165% 154% 165% 164% 166% - - - -
Current Ratio 194% 177% 194% 189% 203% - - - -
Source: Company Data, WRJ Calculation
Cash Flow Statement Cons.Act Cons.Act Cons.Act Cons.Act Cons.Act Cons.Act Cons.Act Cons.Act
Q1 Q1 to Q2 Q1 to Q3 Q1 to Q4 Q1 Q1 to Q2 Q1 to Q3 Q1 to Q4 YoY
(Million Yen) 06/2017 06/2017 06/2017 06/2017 06/2018 06/2018 06/2018 06/2018 Net Chg.
Operating Cash Flow 86 160 (64) 1,070 (281) - - - (368)
Investment Cash Flow (91) (106) (273) (297) (56) - - - +35
Operating CF and Investment CF (5) 53 (338) 772 (338) - - - (333)
Financing Cash Flow (135) (162) (200) (232) (174) - - - (39)
Cash Flow Statement Cons.Act Cons.Act Cons.Act Cons.Act Cons.Act Cons.Act Cons.Act Cons.Act
Q1 Q2 Q3 Q4 Q1 Q2 Q3 Q4 YoY
(Million Yen) 06/2017 06/2017 06/2017 06/2017 06/2018 06/2018 06/2018 06/2018 Net Chg.
Operating Cash Flow 86 73 (224) 1,134 (281) - - - (368)
Investment Cash Flow (91) (14) (167) (23) (56) - - - +35
Operating CF and Investment CF (5) 58 (392) 1,111 (338) - - - (333)
Financing Cash Flow (135) (26) (38) (31) (174) - - - (39)
Source: Company Data, WRJ Calculation
11
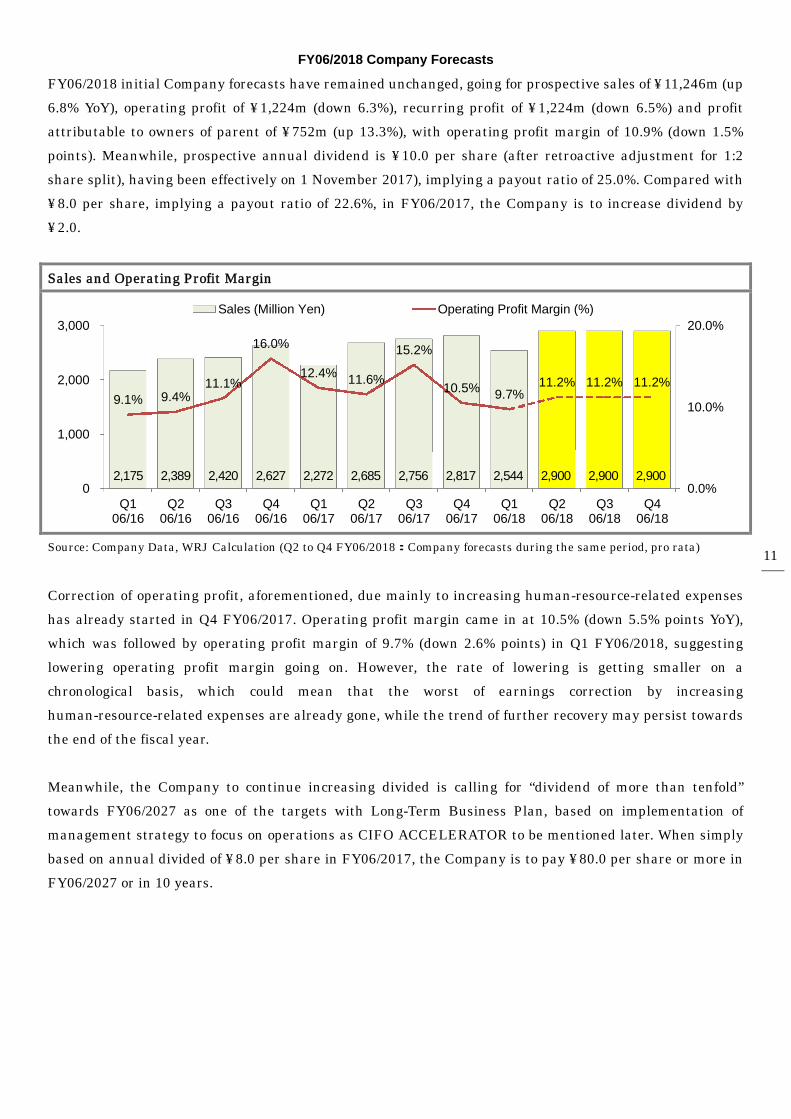
FY06/2018 Company Forecasts
FY06/2018 initial Company forecasts have remained unchanged, going for prospective sales of ¥11,246m (up
6.8% YoY), operating profit of ¥1,224m (down 6.3%), recurring profit of ¥1,224m (down 6.5%) and profit
attributable to owners of parent of ¥752m (up 13.3%), with operating profit margin of 10.9% (down 1.5%
points). Meanwhile, prospective annual dividend is ¥10.0 per share (after retroactive adjustment for 1:2
share split), having been effectively on 1 November 2017), implying a payout ratio of 25.0%. Compared with
¥8.0 per share, implying a payout ratio of 22.6%, in FY06/2017, the Company is to increase dividend by
¥2.0.
Sales and Operating Profit Margin
Source: Company Data, WRJ Calculation (Q2 to Q4 FY06/2018:Company forecasts during the same period, pro rata)
Correction of operating profit, aforementioned, due mainly to increasing human-resource-related expenses
has already started in Q4 FY06/2017. Operating profit margin came in at 10.5% (down 5.5% points YoY),
which was followed by operating profit margin of 9.7% (down 2.6% points) in Q1 FY06/2018, suggesting
lowering operating profit margin going on. However, the rate of lowering is getting smaller on a
chronological basis, which could mean that the worst of earnings correction by increasing
human-resource-related expenses are already gone, while the trend of further recovery may persist towards
the end of the fiscal year.
Meanwhile, the Company to continue increasing divided is calling for “dividend of more than tenfold”
towards FY06/2027 as one of the targets with Long-Term Business Plan, based on implementation of
management strategy to focus on operations as CIFO ACCELERATOR to be mentioned later. When simply
based on annual divided of ¥8.0 per share in FY06/2017, the Company is to pay ¥80.0 per share or more in
FY06/2027 or in 10 years.
2,175 2,389 2,420 2,627 2,272 2,685 2,756 2,817 2,544 2,900 2,900 2,900
9.1% 9.4%11.1%
16.0%
12.4%11.6%
15.2%
10.5% 9.7%11.2% 11.2% 11.2%
0.0%
10.0%
20.0%
0
1,000
2,000
3,000
Q106/16
Q206/16
Q306/16
Q406/16
Q106/17
Q206/17
Q306/17
Q406/17
Q106/18
Q206/18
Q306/18
Q406/18
Sales (Million Yen) Operating Profit Margin (%)
12
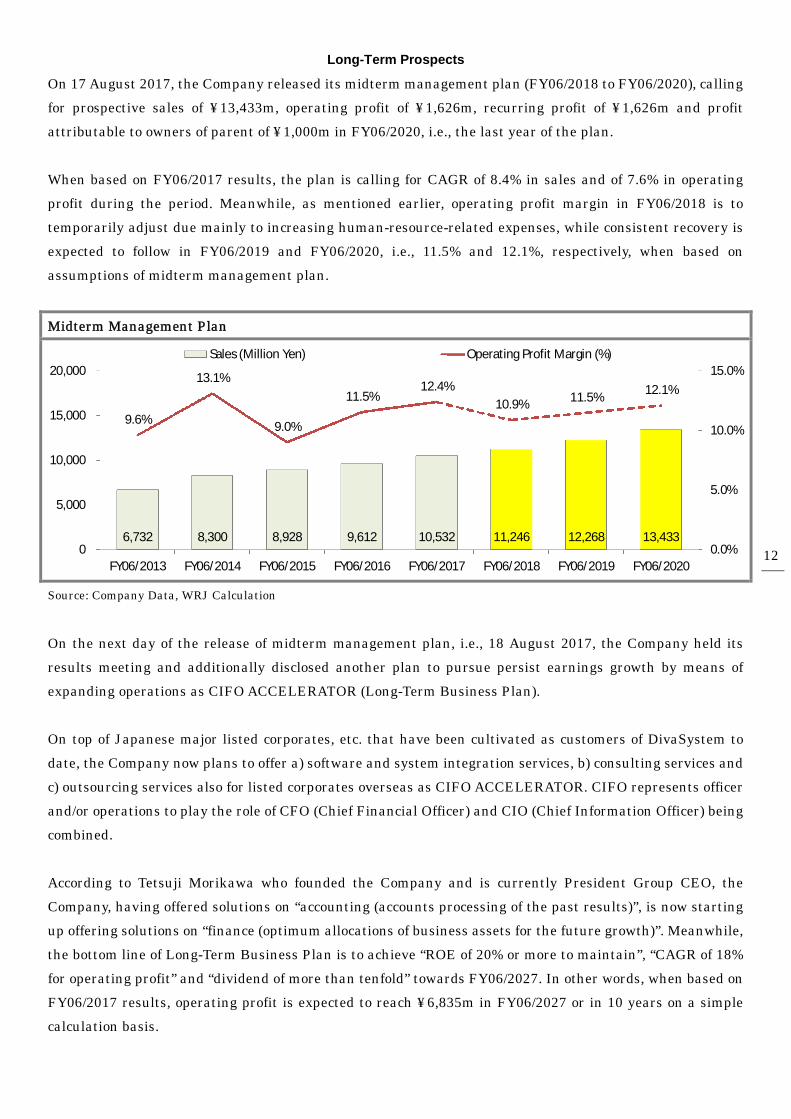
Long-Term Prospects
On 17 August 2017, the Company released its midterm management plan (FY06/2018 to FY06/2020), calling
for prospective sales of ¥13,433m, operating profit of ¥1,626m, recurring profit of ¥1,626m and profit
attributable to owners of parent of ¥1,000m in FY06/2020, i.e., the last year of the plan.
When based on FY06/2017 results, the plan is calling for CAGR of 8.4% in sales and of 7.6% in operating
profit during the period. Meanwhile, as mentioned earlier, operating profit margin in FY06/2018 is to
temporarily adjust due mainly to increasing human-resource-related expenses, while consistent recovery is
expected to follow in FY06/2019 and FY06/2020, i.e., 11.5% and 12.1%, respectively, when based on
assumptions of midterm management plan.
Midterm Management Plan
Source: Company Data, WRJ Calculation
On the next day of the release of midterm management plan, i.e., 18 August 2017, the Company held its
results meeting and additionally disclosed another plan to pursue persist earnings growth by means of
expanding operations as CIFO ACCELERATOR (Long-Term Business Plan).
On top of Japanese major listed corporates, etc. that have been cultivated as customers of DivaSystem to
date, the Company now plans to offer a) software and system integration services, b) consulting services and
c) outsourcing services also for listed corporates overseas as CIFO ACCELERATOR. CIFO represents officer
and/or operations to play the role of CFO (Chief Financial Officer) and CIO (Chief Information Officer) being
combined.
According to Tetsuji Morikawa who founded the Company and is currently President Group CEO, the
Company, having offered solutions on “accounting (accounts processing of the past results)”, is now starting
up offering solutions on “finance (optimum allocations of business assets for the future growth)”. Meanwhile,
the bottom line of Long-Term Business Plan is to achieve “ROE of 20% or more to maintain”, “CAGR of 18%
for operating profit” and “dividend of more than tenfold” towards FY06/2027. In other words, when based on
FY06/2017 results, operating profit is expected to reach ¥6,835m in FY06/2027 or in 10 years on a simple
calculation basis.
6,732 8,300 8,928 9,612 10,532 11,246 12,268 13,433
9.6%
13.1%
9.0%
11.5%12.4%
10.9%11.5%
12.1%
0.0%
5.0%
10.0%
15.0%
0
5,000
10,000
15,000
20,000
FY06/2013 FY06/2014 FY06/2015 FY06/2016 FY06/2017 FY06/2018 FY06/2019 FY06/2020
Sales (Million Yen) Operating Profit Margin (%)
13
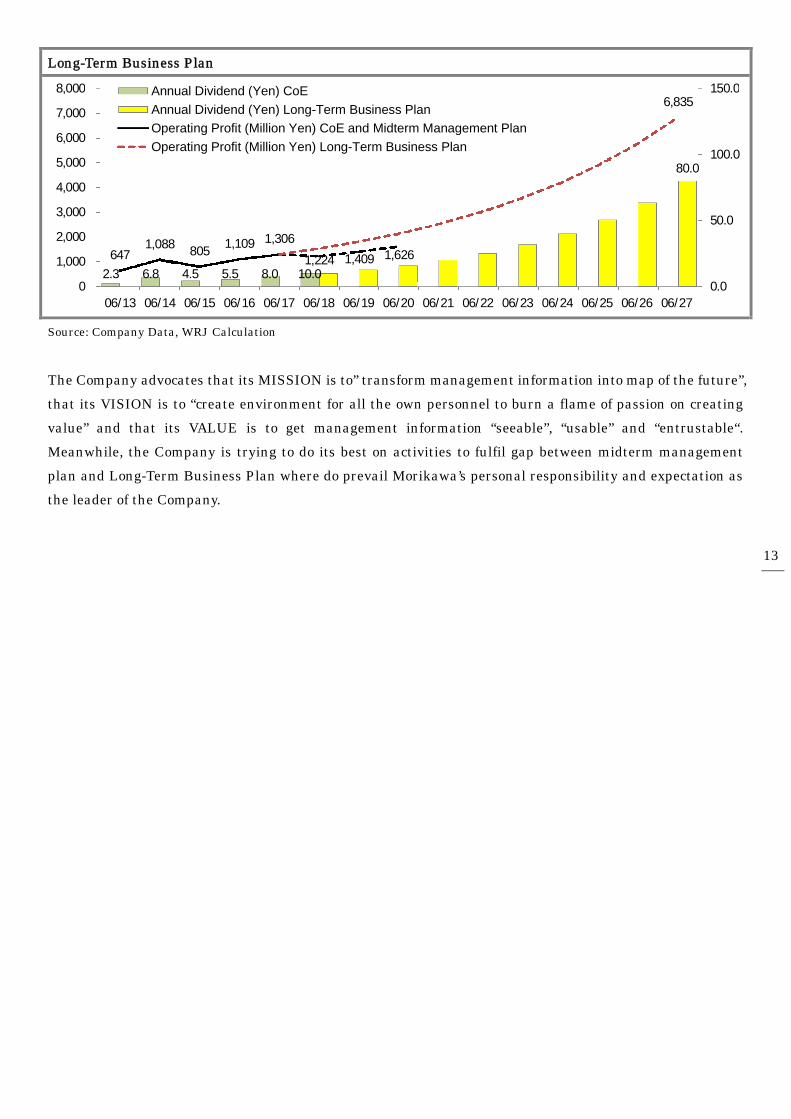
Long-Term Business Plan
Source: Company Data, WRJ Calculation
The Company advocates that its MISSION is to” transform management information into map of the future”,
that its VISION is to “create environment for all the own personnel to burn a flame of passion on creating
value” and that its VALUE is to get management information “seeable”, “usable” and “entrustable“.
Meanwhile, the Company is trying to do its best on activities to fulfil gap between midterm management
plan and Long-Term Business Plan where do prevail Morikawa’s personal responsibility and expectation as
the leader of the Company.
2.3 6.8 4.5 5.5 8.0 10.0
80.0
6471,088
8051,109 1,306
1,224 1,409 1,626
6,835
0.0
50.0
100.0
150.0
0
1,000
2,000
3,000
4,000
5,000
6,000
7,000
8,000
06/13 06/14 06/15 06/16 06/17 06/18 06/19 06/20 06/21 06/22 06/23 06/24 06/25 06/26 06/27
Annual Dividend (Yen) CoE
Annual Dividend (Yen) Long-Term Business Plan
Operating Profit (Million Yen) CoE and Midterm Management Plan
Operating Profit (Million Yen) Long-Term Business Plan
14
4.0 Business Model
Providing Consolidated Management and Accounting with Solutions
The Company, having provided consolidated management and accounting with solutions as the key
operations, saw designation change to Tokyo Stock Exchange 2nd section from Tokyo Stock Exchange
JASDAQ Growth on 22 September 2017. Meanwhile, the current holding company scheme has been
established through incorporation-type company split enforced on 1 October 2013, where the Company
converted into holding company to run 5 operating companies (all 100% consolidated subsidiaries)
collectively and own business operations were succeeded by one of them, i.e., newly established DIVA
CORPORATION. Meanwhile, the Company was newly identified as AVANT CORPORATION. The overview
of 5 operating companies is as follows:
a) DIVA CORPORATION: running operations of selling DivaSystem, i.e., packaged software for consolidated
management and accounting, on a licensing basis together with related services.
b) DIVA BUSINESS INOVATION: running operations of ERP-related system integration services (having
been merged and acquired by DIVA CORPORATIO as of the end of FY06/2016 and the business to be
converged).
c) INTERNET DISCLOSURE Co., Ltd.: running operations of information retrieval services.
d) ZEAL CORPORATION: running operations of BI (Business Intelligence)-related system integration
services.
e) DIVA CORPORATION OF AMERICA: exploring opportunities to start up operations in the United States.
As mentioned above, the number of operating companies under management of the Company came down by
one as a result of a merger between own operating companies as of the end of FY06/2016. Meanwhile, the
Company set up FIERTE CORPORATION (100% consolidated subsidiary) or a new operating company
under management of the Company at the beginning of Q2 FY06/2018 and it has started up outsourcing
services.
Meanwhile, on top of exploring opportunities to start up operations in the United States through operations
of DIVA CORPORATION OF AMERICA, the Company is also doing so in all the other markets overseas at
the same time. Most recently, the Company has started up some aggressive initiatives in some parts.
In fact, “Going global” is mentioned as the key strategy to increase the number of customers in management
strategy to focus on operations as CIFO ACCELERATOR. Now, the Company is most keen on customer
cultivations in Singapore, Indonesia and other Southeast Asian countries. In Singapore, the Company has
locally hired an Indian people, belonging to the largest group of people in there second only to Chinese
people, to become the sales representative. To date, he has actually started up his activities of marketing
and sales.
15
DivaSystem (Image Pictures )
Source: Company Data
Disclaimer
Information here is a summary of “IR Information” of the Company, compiled by Walden Research Japan,
from a neutral and professional standing point, in the form of a report. “IR Information” of the Company
comprises a) contents of our interview with the Company, b) contents of presentations for institutional
investors, c) contents of timely disclosed information and d) contents of the homepage, etc.
Company name: Walden Research Japan Incorporated
Head office: 4F Hulic Ginza 1-chome Building, 1-13-1 Ginza, Chuo-city, Tokyo 104-0061 JAPAN
URL: www.walden.co.jp
E-mail: [email protected]
Phone:+81 3 3553 3769
Copyright 2017 Walden Research Japan Incorporated