Embed Size (px)
Citation preview
O.I.V.2015
World vitiviniculture situation
38th World Congress of Vine and Wine
Mainz, 6th July 2015
Jean-Marie AURAND
Director General
1

O.I.V.2015
State of the vitiviniculture world market
Surface area
Grape
− Global grape production
− Grape for fresh consumption
− Dried Grape
Wine
− Production
− Consumption
− Trade
2015 Special focus: Rosé wine market
2

O.I.V.2015
Surface area of vineyards

O.I.V.2015
Surface area of vineyards worldwide
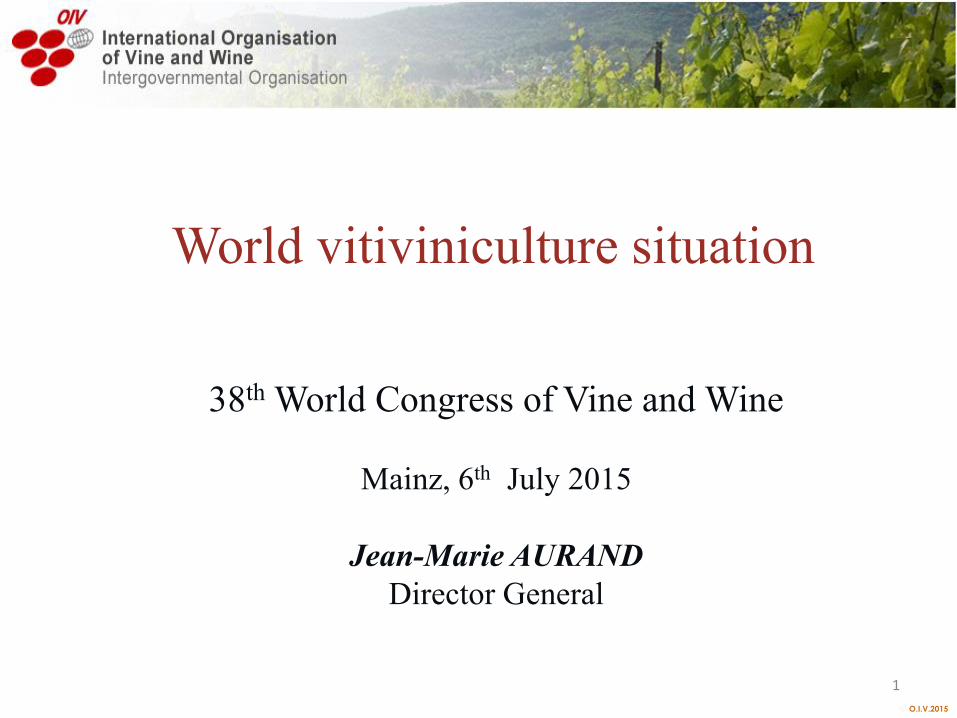
Area under vines
Europe’s share of world’s vineyards has declined from 63% in 2000 to 54% in 2014, effect of EU
permanent abandonment premiums ended in 2011
the share of all other regions is increasing, in particular in Asia, which now accounts for 25% of the
world’s vineyards.
7847
7573
7 300
7 500
7 700
7 900
8 100
8 300Europe
63%Asia…
America12%
Africa 4%
Oceania 2%
Europe 54%
Asia24%
America14%
Africa5%
Oceania 3%

O.I.V.2015
Recent developments of the leading vineyards
Since 2000 :
area under vine has fallen considerably in Spain, France and Italy. Since the
end in 2011 of the EU grubbing up programme the surface area is stable.
strong increasing in China area under vines, which is now the 2nd world
vineyard.
vineyards and plantations are reducing in Turkey and Iran.
1038
799 792
690
502425
228 224 223 211
0
200
400
600
800
1 000
1 200
1 400
kha Trends, 2000-14
O.I.V.2015
Area under vines
Vitivinicultural production potential
O.I.V.2015
Grape
Global grape production
– Grape for fresh consumption
– Dried Grapes
O.I.V.2015
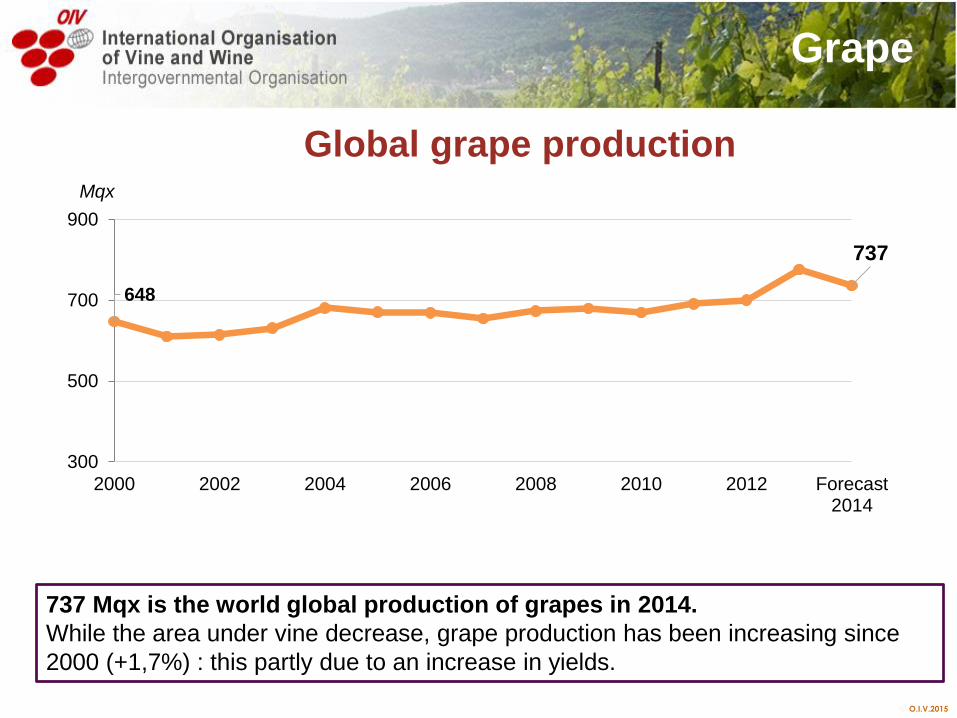
Global grape production
737 Mqx is the world global production of grapes in 2014.
While the area under vine decrease, grape production has been increasing since
2000 (+1,7%) : this partly due to an increase in yields.
Grape
648
737
300
500
700
900
2000 2002 2004 2006 2008 2010 2012 Forecast2014
Mqx
O.I.V.2015
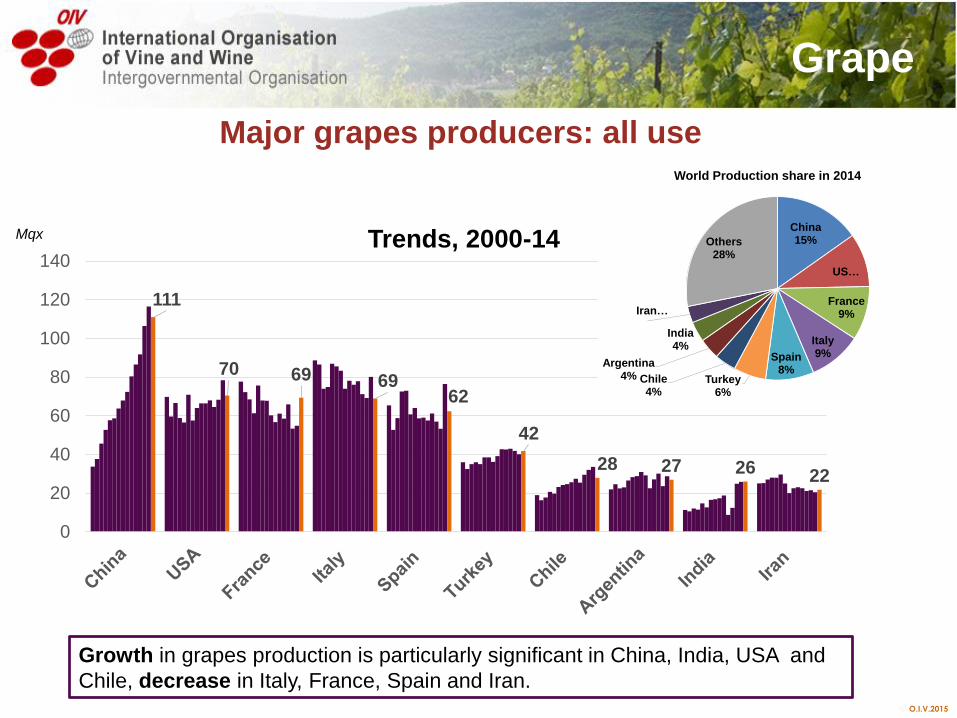
Major grapes producers: all use
Grape
Growth in grapes production is particularly significant in China, India, USA and
Chile, decrease in Italy, France, Spain and Iran.
111
70 69 6962
42
28 27 26 22
0
20
40
60
80
100
120
140
Mqx Trends, 2000-14China 15%
US…
France 9%
Italy 9%Spain
8%Turkey
6%
Chile 4%
Argentina4%
India 4%
Iran …
Others 28%
World Production share in 2014

O.I.V.2015
Grape production by type of products

O.I.V.2015
Grape

O.I.V.2015
Wine
– Production of wine
– Consumption of wine
– Wine trade

O.I.V.2015
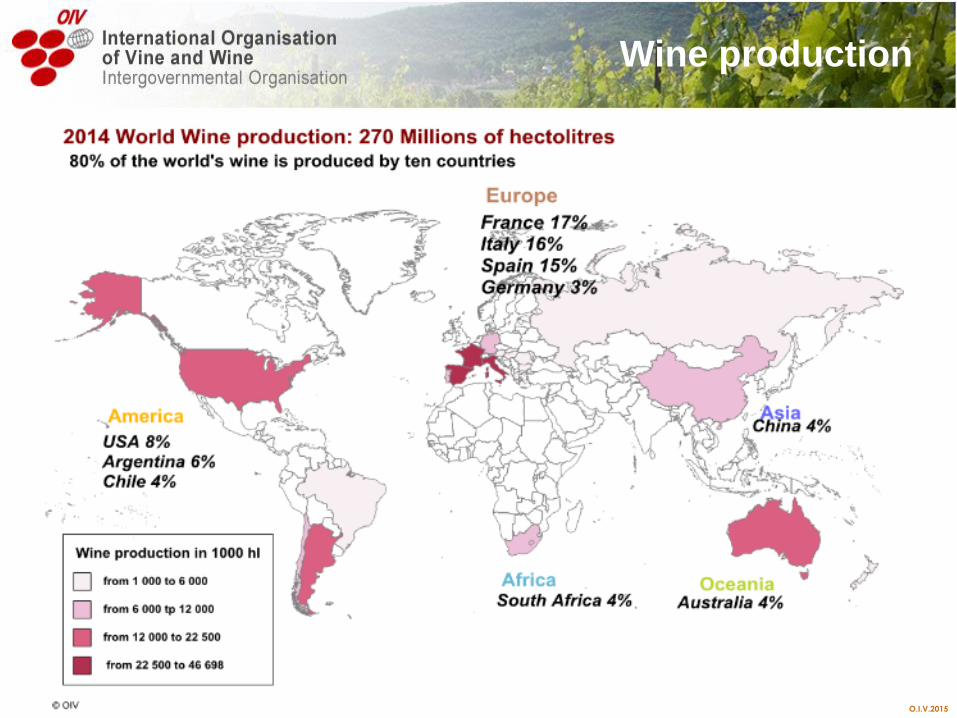
World wine production
Wine production
270 is the global wine production in 2014 – a decrease of 7% compared to 2013. This decrease is in parts due to bad weather in some countries. A level almost equal to the average global wine production over the period 2000-2012.
282266 257 264
296278 283
268 269 273 265 268258
291270
100
150
200
250
300
350
400
Mhl
Trends, 2000-14excluding juice & musts

O.I.V.2015
Wine production
Wine production (excluding juice and musts) (1)
Mhl
2010 2011 2012 2013
2014
Forecast
(2)
2014/2013
Variation in
volume
2014/2013
Variation in
%
France 44,4 50,8 41,5 42 46,7 4,7 11%
Italy 48,5 42,8 45,6 54 44,7 -9,3 -17%
Spain 35,4 33,4 31,1 45,3 38,2 -7,1 -16%
USA 20,9 19,1 21,7 23,6 22,3 -1,3 -5%
Argentina 16,3 15,5 11,8 15 15,2 0,2 1%
Australia 11,4 11,2 12,3 12,3 12 -0,3 -2%
South Africa 9,3 9,7 10,6 11 11,3 0,3 3%
China 13 13,2 13,5 11,8 11,2 -0,6 -5%
Chile 8,8 10,5 12,6 12,8 10,5 -2,3 -18%
Germany 6,9 9,1 9,0 8,4 9,2 0,8 9%
Portugal 7,1 5,6 6,3 6,3 6,2 -0,1 -2%
Romania 3,3 4,1 3,3 5,1 3,7 -1,4 -27%
New Zealand 1,9 2,4 1,9 2,5 3,2 0,7 29%
Greece 3,0 2,8 3,1 3,3 2,9 -0,4 -13%
Brazil 2,5 3,5 3,0 2,7 2,7 0,0 1%
Hungary 1,8 2,8 1,8 2,7 2,6 -0,1 -4%
Austria 1,7 2,8 2,1 2,4 2 -0,4 -16%
OIV World Total 265 268 258 291 270 -21 -7%(1): Countries for which information has been provided with a wine production of more than 1 Mhl
(2): Include data/comments received by May 2015
O.I.V.2015
Wine production

O.I.V.2015
How is the 2014 wine
production compared with the
last 15 years?
O.I.V.2015
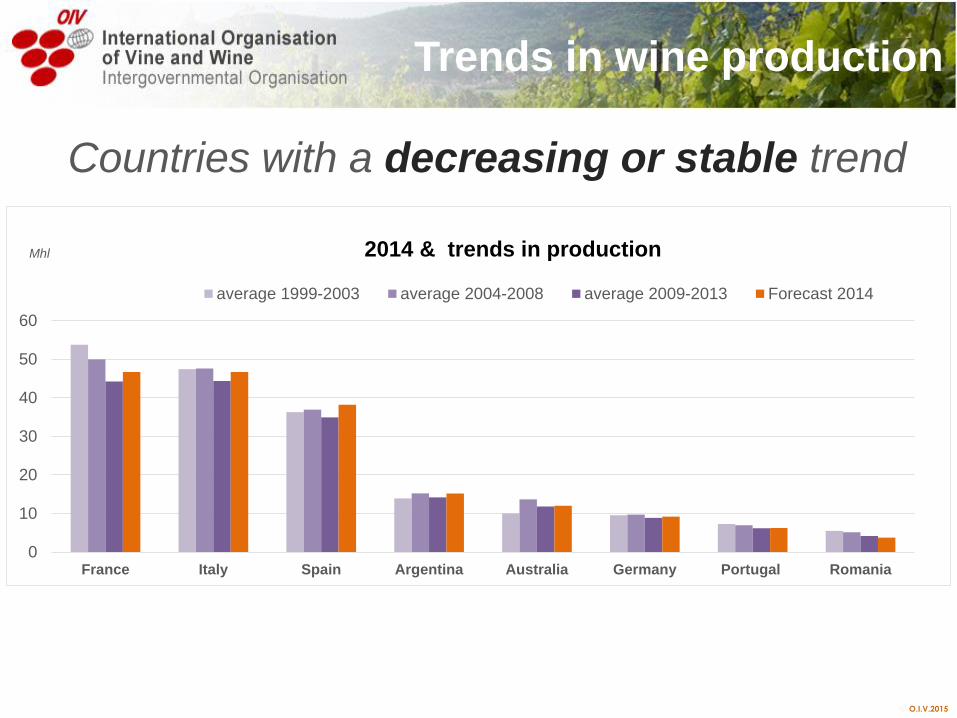
Countries with a decreasing or stable trend
Trends in wine production
0
10
20
30
40
50
60
France Italy Spain Argentina Australia Germany Portugal Romania
Mhl 2014 & trends in production
average 1999-2003 average 2004-2008 average 2009-2013 Forecast 2014

O.I.V.2015
Countries with an increasing trend
Trends in wine production
0
5
10
15
20
25
USA China South Africa Chile New Zealand
Mhl
2014 & trends in production
average 1999-2003 average 2004-2008 average 2009-2013 Forecast 2014

O.I.V.2015
Wine consumption

O.I.V.2015
Wine consumption
240 Mhl is the estimation for the wine consumption in 2014.
Wine consumption is still marked by the effects of the economic and financial
crisis of 2008.
World wine consumption
20
226 228 230237 237 237
245250 250
242 240 243 243 243 240
200
210
220
230
240
250
260
270
Mhl Trends, 2000-14
O.I.V.2015
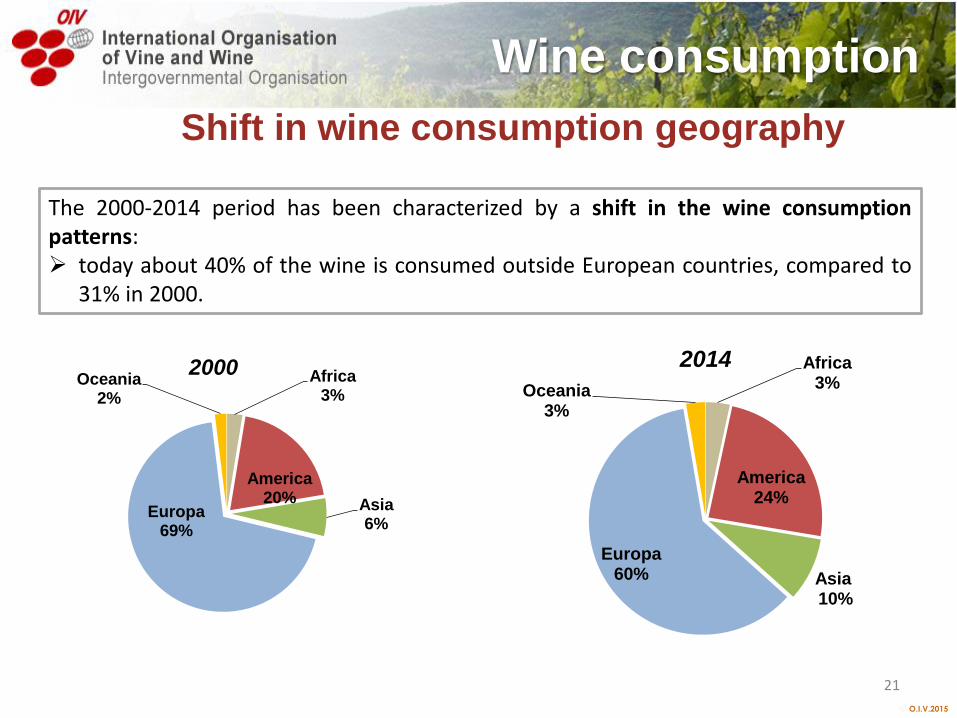
The 2000-2014 period has been characterized by a shift in the wine consumptionpatterns: today about 40% of the wine is consumed outside European countries, compared to
31% in 2000.
Shift in wine consumption geography
Wine consumption
21
Africa 3%
America20% Asia
6%Europa
69%
Oceania2%
2000 Africa3%
America24%
Asia10%
Europa 60%
Oceania 3%
2014
O.I.V.2015
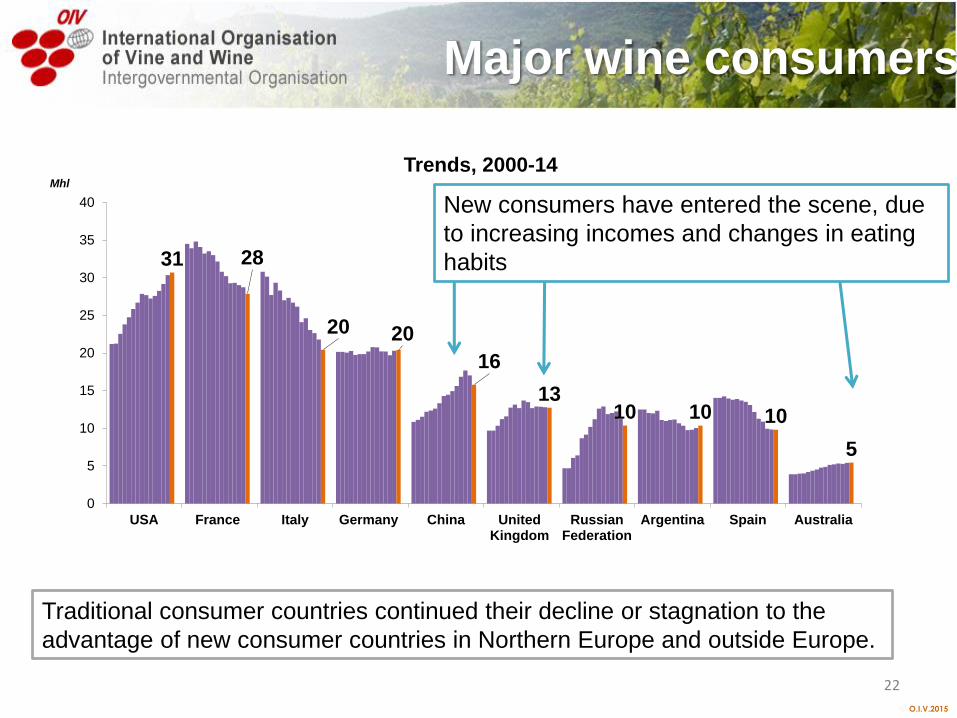
31 28
20 20
16
1310 10 10
5
0
5
10
15
20
25
30
35
40
USA France Italy Germany China UnitedKingdom
RussianFederation
Argentina Spain Australia
Mhl
Trends, 2000-14
Major wine consumers
Traditional consumer countries continued their decline or stagnation to the
advantage of new consumer countries in Northern Europe and outside Europe.
22
New consumers have entered the scene, due
to increasing incomes and changes in eating
habits
O.I.V.2015
23
O.I.V.2015
24
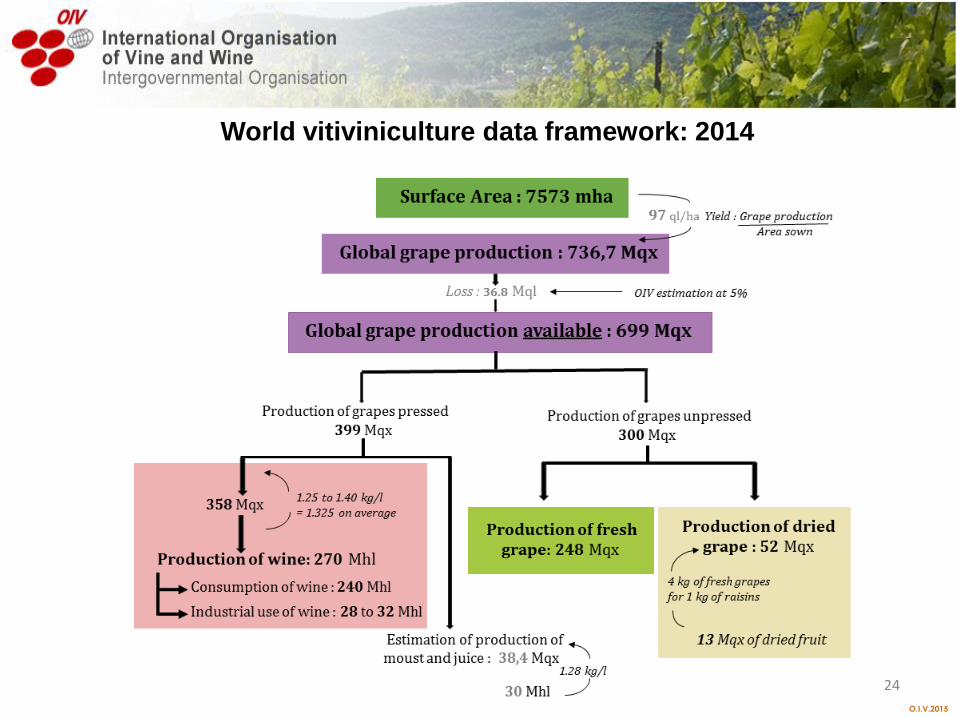
World vitiviniculture data framework: 2014

O.I.V.2015
Wine trade
- World wine trade: value & volume
- Top world Exporters
- Top world Importers

O.I.V.2015
In 2014 the trade in wine slightly increased by 2,5% in volume, representing
104 million of hl, but remained at the same level in value terms 26 Billion
of Euros.
World wine Export
104
26
1
6
11
16
21
26
0
20
40
60
80
100
120
140
160
180
200
2000 2001 2002 2003 2004 2005 2006 2007 2008 2009 2010 2011 2012 2013 2014
Billion of EUR Mhl World wine exportsMhl. Bill €
O.I.V.2015
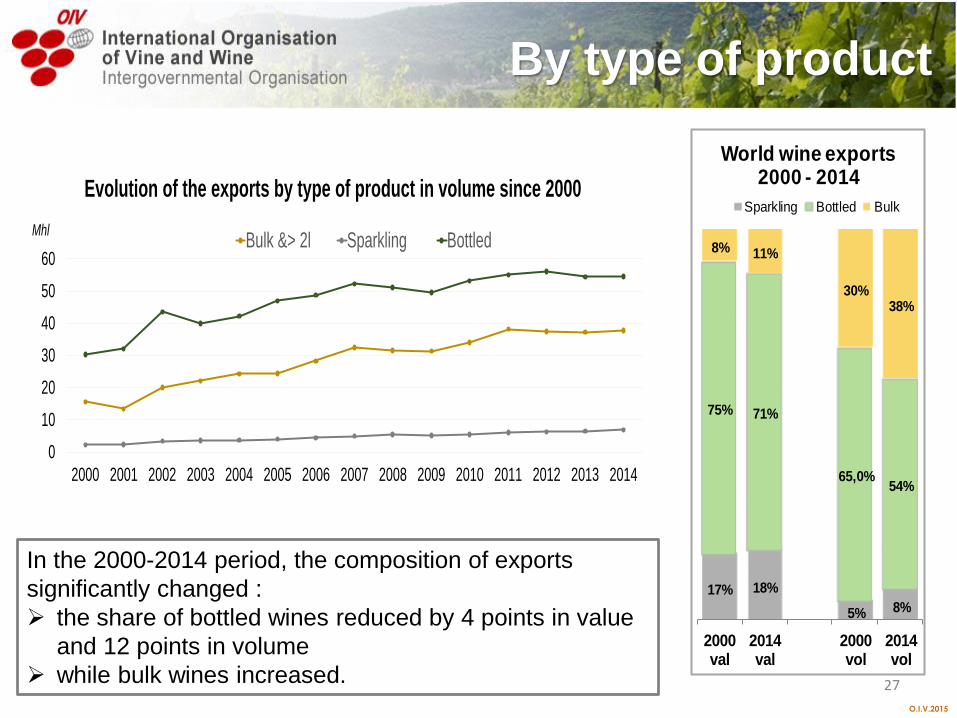
In the 2000-2014 period, the composition of exports
significantly changed :
the share of bottled wines reduced by 4 points in value
and 12 points in volume
while bulk wines increased.
By type of product
27
17% 18%
5% 8%
75% 71%
65,0%54%
8% 11%
30%38%
2000val
2014val
2000vol
2014vol
World wine exports 2000 - 2014
Sparkling Bottled Bulk
0
10
20
30
40
50
60
2000 2001 2002 2003 2004 2005 2006 2007 2008 2009 2010 2011 2012 2013 2014
Mhl
Evolution of the exports by type of product in volume since 2000
Bulk &> 2l Sparkling Bottled
O.I.V.2015
Top world Exporters
28
O.I.V.2015
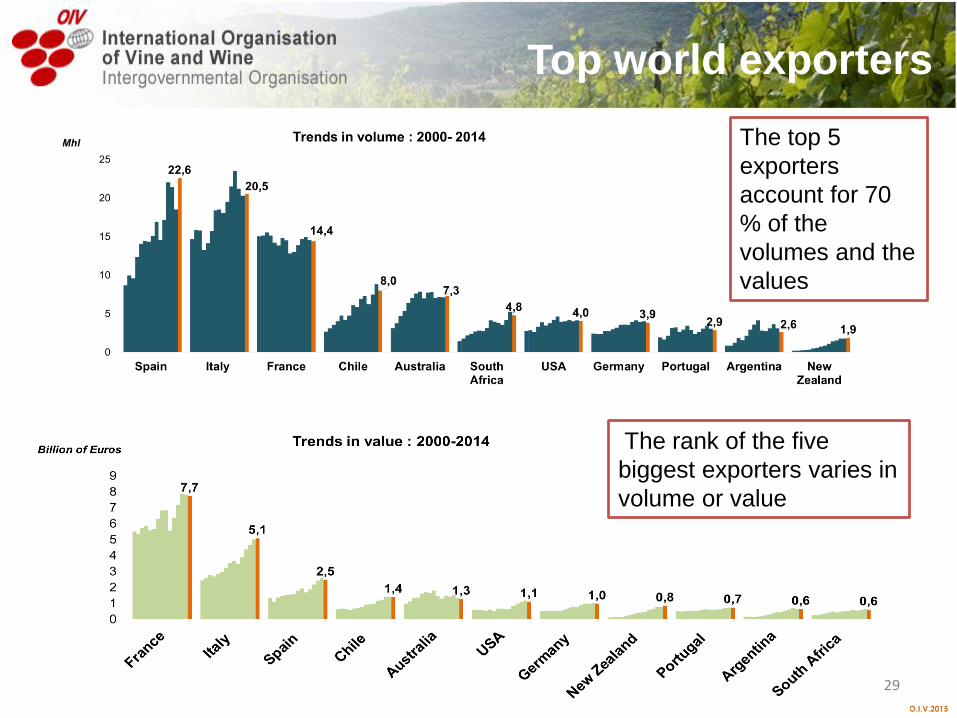
Top world exporters
29
The top 5
exporters
account for 70
% of the
volumes and the
values
The rank of the five
biggest exporters varies in
volume or value

O.I.V.2015
Top world Importers
30

O.I.V.2015
6 countries account for more than 50% of total imports:
Germany is stagnating, but still dominates the market in volume
USA keeps increasing his imports, both in volume and value
Top world Importers
15,213,4
10,7
6,54,7 4,6
0
2
4
6
8
10
12
14
16
18
Germany UK USA France Russia China
Mhl Trends imports volume: 2000- 2014
4,03,6
2,5
1,5 1,2 1,1 0,9
0
1
2
3
4
5
USA UK Germany Canada Japon China Russia
Billion of Euros Trends imports value: 2000-2014
O.I.V.2015
41
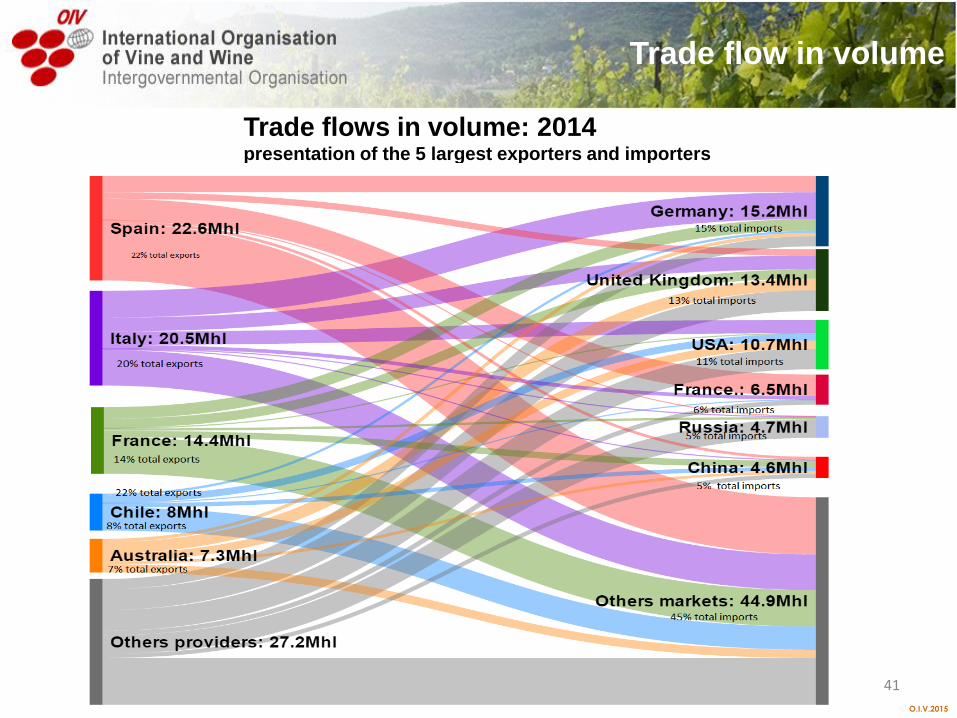
Trade flow in volume
Trade flows in volume: 2014presentation of the 5 largest exporters and importers

O.I.V.2015
Internal market coverage ratio
FR
IT
ES
US
AR
AU
ZA
CN
CL
DE
PT
NZ
BRAT
UKRU
CA
0
5
10
15
20
25
30
35
0 10 20 30 40 50
Consumption in Mhl
Production in Mhl
net exporting countries
net importing countries

O.I.V.2015
2015 thematic report:
The rosé wines market

O.I.V.2015
35source : CIVP / FranceAgrimer - Abso
Conseil, 2014
24 Mhl in 2013
World total wine
consumption has
increased by 6% in
the last 10
years…rosé wine
recorded a 25%
increase.
Rosé
consumption
represents
almost 10% of
the total wine
consumption
Consumption of rosé wine
19 2023
2323 24
230 237250 243 243
0
50
100
150
200
250
300
2002 2003 2004 2005 2006 2007 2008 2009 2010 2011 2012 2013
Mhl
Evolution wine consumptionsources: OIV, Observatoire du Rosé CIVP, FranceAgrimer -Abso Conseil
Sparkling wines Rosé wines Total wines
8,3% 8,1% 8,3% 8,6% 8,9% 9,1% 9,1% 9,3% 9,3% 9,5% 9,5% 9,8%
0%
5%
10%
15%
2002 2003 2004 2005 2006 2007 2008 2009 2010 2011 2012 2013
Share of rosé in total wines consumptionSource : OIV, Observatoire du Rosé CIVP / FranceAgrimer - Abso Conseil
O.I.V.2015
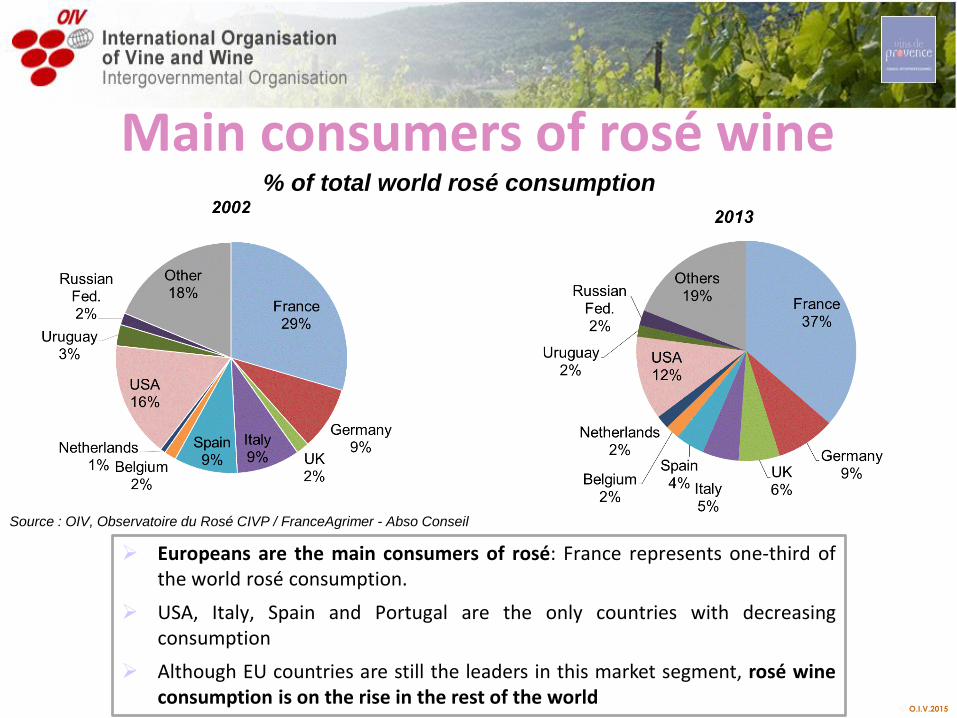
Main consumers of rosé wine
36source : CIVP / FranceAgrimer - Abso
Conseil, 2014
.
Source : OIV, Observatoire du Rosé CIVP / FranceAgrimer - Abso Conseil
% of total world rosé consumption
Europeans are the main consumers of rosé: France represents one-third ofthe world rosé consumption.
USA, Italy, Spain and Portugal are the only countries with decreasingconsumption
Although EU countries are still the leaders in this market segment, rosé wineconsumption is on the rise in the rest of the world

O.I.V.2015
Thank you for your attention
Vielen Dank für Ihre Aufmerksamkeit
Grazie per la Loro attenzione
Gracias por su atención
Merci de votre attention

![International Organisation of Vine and Wine · The International Organisation of Vine and Wine is an intergovernmental Organisation made up of: [Ag. Article 3.2, 3.5 and 8] a) Members,](https://img.pdfslide.net/doc/110x75/5f0e98877e708231d43fff61/international-organisation-of-vine-and-the-international-organisation-of-vine-and.jpg)