Embed Size (px)
Citation preview
Comp. by: Sunselvakumar Stage: Galleys ChapterID: 0000868359 Date:12/1/09 Time:18:58:36
E
3D Ear Biometrics
BIR BHANU, HUI CHEN
Center for Research in Intelligent Systems, University
of California, Riverside, CA, USA
Synonyms
Ear identification; Ear recognition; Ear verification
Definition
The human ear is a new class of relatively stable
biometrics. After decades of research of anthropomet-
ric measurements of ear photographs of thousands of
people, it has been found that no two ears are alike, even
in the cases of identical and fraternal twins, triplets, and
quadruplets [1]. It is also found that the structure of
the ear does not change radically over time. Ear bio-
metric has played a significant role in forensic science
and its use by law enforcement agencies for many years
[1] but most of this work has been on analyzing the ear
prints manually. Recent work on ear biometrics focuses
on developing automated techniques for ear recogni-
tion [2]. Ear biometrics can be based on a 2D gray scale
or color image, 3D range image, or a combination of
2D and 3D images. Typically, an ear biometric system
consists of ear detection and ear recognition modules.
Introduction
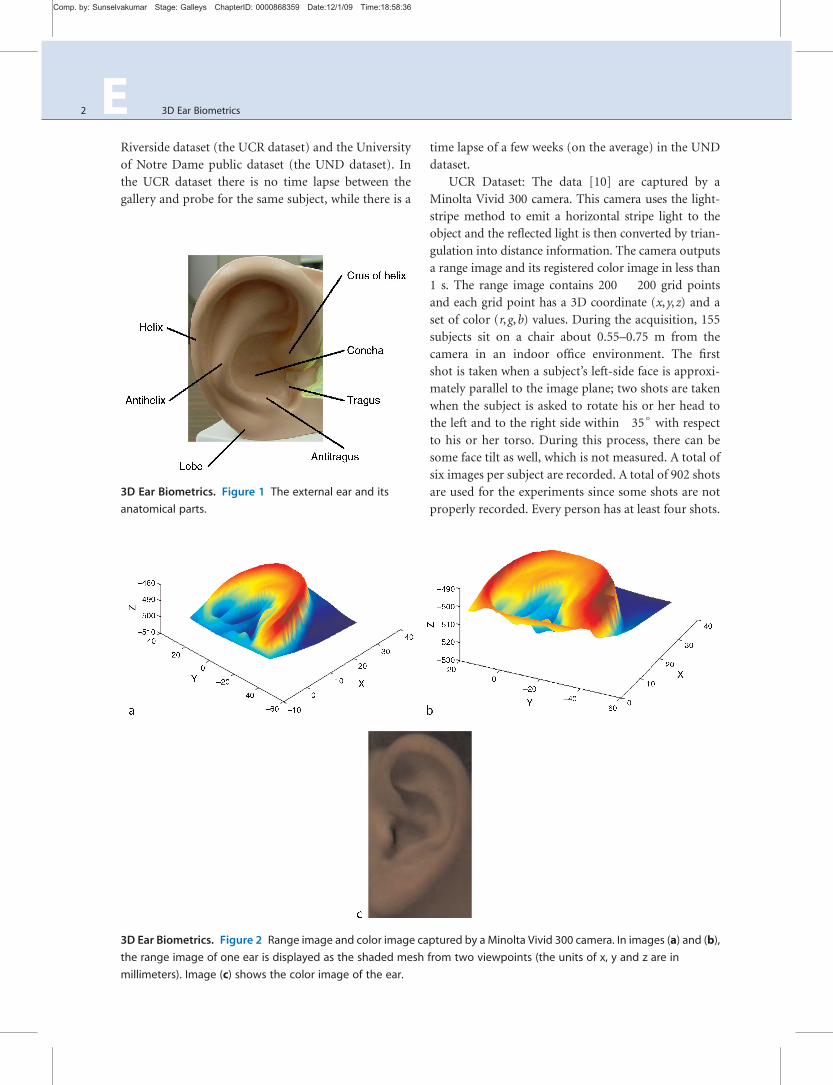
Rich in features, the human ear is a stable structure
that does not change much in shape with the age
and with facial expressions (see Fig.1). Ear can be
easily captured from a distance without a fully cooper-
ative subject although it can sometimes be hidden
by hair, muffler, scarf, and earrings. Researchers have
developed several biometric techniques using the 2D
intensity images of human ears [3–8].
Burge and Burger [3, 4] developed a computer
vision system to recognize ears in the intensity images.
Their algorithm consisted of four components: edge
extraction, curve extraction, construction of a graph
model from the Voronoi diagram of the edge segments,
and graph matching. Hurley et al. [5] applied a force
field transform to the entire ear image and extracted
wells and channels. The wells and channels form the
basis of an ear’s signature. To evaluate differences
among ears, they used a measure of the average nor-
malized distance of the well positions, together with
the accumulated direction to the position of each well
point from a chosen reference point. Later, Hurley
et al. [6] measured convergence to achieve greater
potency in recognition. Chang et al. [8] used principal
component analysis for ear and face images and per-
formed experiments with face, ear, and face plus ear.
Their results showed that multi-modal recognition
using both face and ear achieved a much better perfor-
mance than the individual biometrics.
The performance of these 2D techniques is greatly
affected by the pose variation and imaging conditions.
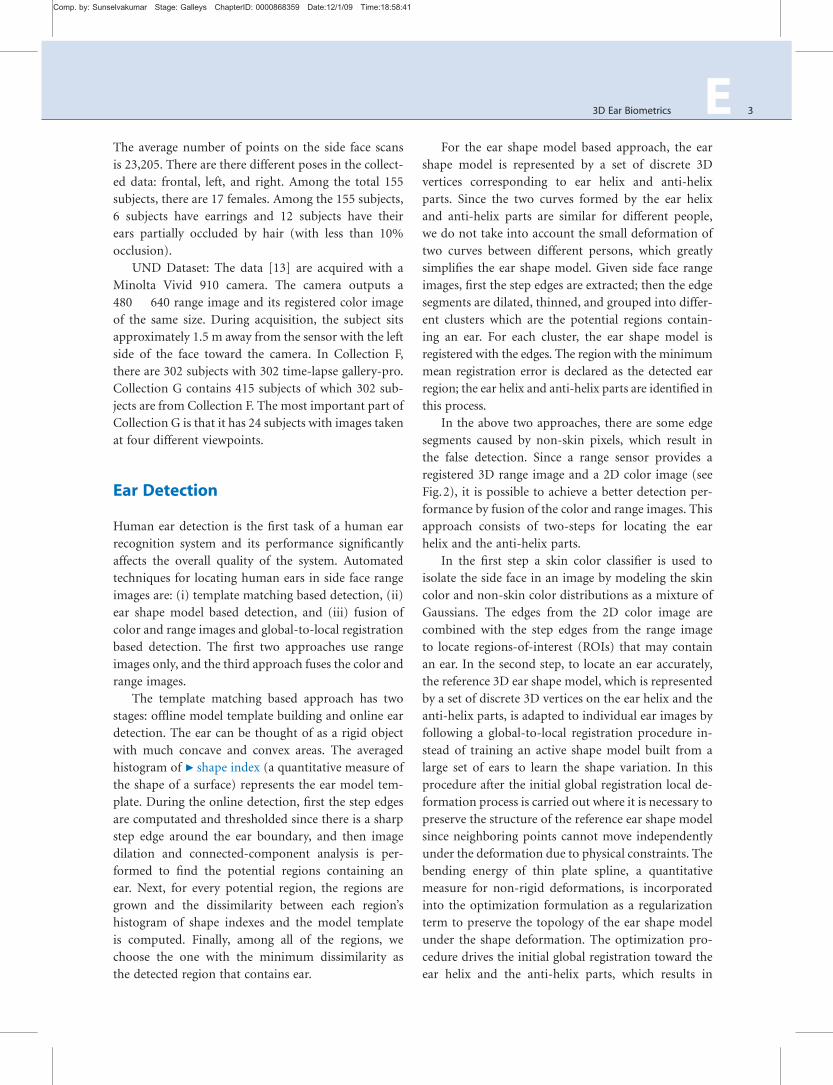
However, ear can be imaged in 3D using a range sensor
which provides a registered color and range image.
Figure 2 shows an example of a range image and the
registered color image acquired by a Minolta Vivid
300 camera. A range image is relatively insensitive to
illuminations and contains surface shape information
related to the anatomical structure, which makes it
possible to develop a robust 3D ear biometrics. Exam-
ples of ear recognition using 3D data are [9–13]. The
performance of 3D approaches for ear recognition is
significantly higher than the 2D approaches. In the
following, we focus on 3D approaches for ear detection
and recognition.
Datasets
There are currently two datasets for 3D ear per-
formance evaluation: The University of California at
# Springer-Verlag Berlin Heidelberg 2009
Comp. by: Sunselvakumar Stage: Galleys ChapterID: 0000868359 Date:12/1/09 Time:18:58:36
Riverside dataset (the UCR dataset) and the University
of Notre Dame public dataset (the UND dataset). In
the UCR dataset there is no time lapse between the
gallery and probe for the same subject, while there is a
time lapse of a few weeks (on the average) in the UND
dataset.
UCR Dataset: The data [10] are captured by a
Minolta Vivid 300 camera. This camera uses the light-
stripe method to emit a horizontal stripe light to the
object and the reflected light is then converted by trian-
gulation into distance information. The camera outputs
a range image and its registered color image in less than
1 s. The range image contains 200 � 200 grid points
and each grid point has a 3D coordinate (x,y,z) and a
set of color (r,g,b) values. During the acquisition, 155
subjects sit on a chair about 0.55–0.75 m from the
camera in an indoor office environment. The first
shot is taken when a subject’s left-side face is approxi-
mately parallel to the image plane; two shots are taken
when the subject is asked to rotate his or her head to
the left and to the right side within�35∘ with respect
to his or her torso. During this process, there can be
some face tilt as well, which is not measured. A total of
six images per subject are recorded. A total of 902 shots
are used for the experiments since some shots are not
properly recorded. Every person has at least four shots.
3D Ear Biometrics. Figure 1 The external ear and its
anatomical parts.
3D Ear Biometrics. Figure 2 Range image and color image captured by a Minolta Vivid 300 camera. In images (a) and (b),
the range image of one ear is displayed as the shaded mesh from two viewpoints (the units of x, y and z are in
millimeters). Image (c) shows the color image of the ear.
2 E 3D Ear Biometrics
Comp. by: Sunselvakumar Stage: Galleys ChapterID: 0000868359 Date:12/1/09 Time:18:58:41
The average number of points on the side face scans
is 23,205. There are there different poses in the collect-
ed data: frontal, left, and right. Among the total 155
subjects, there are 17 females. Among the 155 subjects,
6 subjects have earrings and 12 subjects have their
ears partially occluded by hair (with less than 10%
occlusion).
UND Dataset: The data [13] are acquired with a
Minolta Vivid 910 camera. The camera outputs a
480 � 640 range image and its registered color image
of the same size. During acquisition, the subject sits
approximately 1.5 m away from the sensor with the left
side of the face toward the camera. In Collection F,
there are 302 subjects with 302 time-lapse gallery-pro.
Collection G contains 415 subjects of which 302 sub-
jects are from Collection F. The most important part of
Collection G is that it has 24 subjects with images taken
at four different viewpoints.
Ear Detection
Human ear detection is the first task of a human ear
recognition system and its performance significantly
affects the overall quality of the system. Automated
techniques for locating human ears in side face range
images are: (i) template matching based detection, (ii)
ear shape model based detection, and (iii) fusion of
color and range images and global-to-local registration
based detection. The first two approaches use range
images only, and the third approach fuses the color and
range images.
The template matching based approach has two
stages: offline model template building and online ear
detection. The ear can be thought of as a rigid object
with much concave and convex areas. The averaged
histogram of ▶ shape index (a quantitative measure of
the shape of a surface) represents the ear model tem-
plate. During the online detection, first the step edges
are computated and thresholded since there is a sharp
step edge around the ear boundary, and then image
dilation and connected-component analysis is per-
formed to find the potential regions containing an
ear. Next, for every potential region, the regions are
grown and the dissimilarity between each region’s
histogram of shape indexes and the model template
is computed. Finally, among all of the regions, we
choose the one with the minimum dissimilarity as
the detected region that contains ear.
For the ear shape model based approach, the ear
shape model is represented by a set of discrete 3D
vertices corresponding to ear helix and anti-helix
parts. Since the two curves formed by the ear helix
and anti-helix parts are similar for different people,
we do not take into account the small deformation of
two curves between different persons, which greatly
simplifies the ear shape model. Given side face range
images, first the step edges are extracted; then the edge
segments are dilated, thinned, and grouped into differ-
ent clusters which are the potential regions contain-
ing an ear. For each cluster, the ear shape model is
registered with the edges. The region with the minimum
mean registration error is declared as the detected ear
region; the ear helix and anti-helix parts are identified in
this process.
In the above two approaches, there are some edge
segments caused by non-skin pixels, which result in
the false detection. Since a range sensor provides a
registered 3D range image and a 2D color image (see
Fig.2), it is possible to achieve a better detection per-
formance by fusion of the color and range images. This
approach consists of two-steps for locating the ear
helix and the anti-helix parts.
In the first step a skin color classifier is used to
isolate the side face in an image by modeling the skin
color and non-skin color distributions as a mixture of
Gaussians. The edges from the 2D color image are
combined with the step edges from the range image
to locate regions-of-interest (ROIs) that may contain
an ear. In the second step, to locate an ear accurately,
the reference 3D ear shape model, which is represented
by a set of discrete 3D vertices on the ear helix and the
anti-helix parts, is adapted to individual ear images by
following a global-to-local registration procedure in-
stead of training an active shape model built from a
large set of ears to learn the shape variation. In this
procedure after the initial global registration local de-
formation process is carried out where it is necessary to
preserve the structure of the reference ear shape model
since neighboring points cannot move independently
under the deformation due to physical constraints. The
bending energy of thin plate spline, a quantitative
measure for non-rigid deformations, is incorporated
into the optimization formulation as a regularization
term to preserve the topology of the ear shape model
under the shape deformation. The optimization pro-
cedure drives the initial global registration toward the
ear helix and the anti-helix parts, which results in
3D Ear Biometrics E 3
Comp. by: Sunselvakumar Stage: Galleys ChapterID: 0000868359 Date:12/1/09 Time:18:58:42
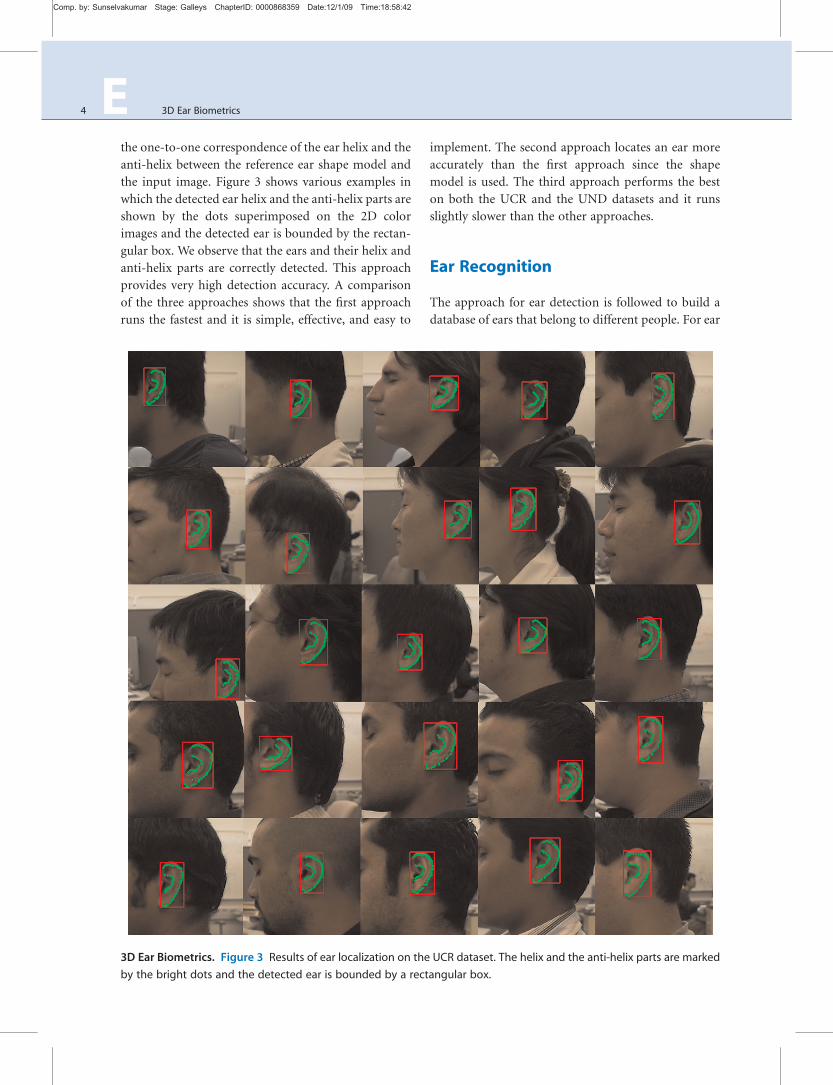
the one-to-one correspondence of the ear helix and the
anti-helix between the reference ear shape model and
the input image. Figure 3 shows various examples in
which the detected ear helix and the anti-helix parts are
shown by the dots superimposed on the 2D color
images and the detected ear is bounded by the rectan-
gular box. We observe that the ears and their helix and
anti-helix parts are correctly detected. This approach
provides very high detection accuracy. A comparison
of the three approaches shows that the first approach
runs the fastest and it is simple, effective, and easy to
implement. The second approach locates an ear more
accurately than the first approach since the shape
model is used. The third approach performs the best
on both the UCR and the UND datasets and it runs
slightly slower than the other approaches.
Ear Recognition
The approach for ear detection is followed to build a
database of ears that belong to different people. For ear
3D Ear Biometrics. Figure 3 Results of ear localization on the UCR dataset. The helix and the anti-helix parts are marked
by the bright dots and the detected ear is bounded by a rectangular box.
4 E 3D Ear Biometrics

Comp. by: Sunselvakumar Stage: Galleys ChapterID: 0000868359 Date:12/1/09 Time:18:58:45
recognition, two representations are used: the ear
helix/ antihelix representation obtained from the detec-
tion algorithm and a new ▶ local surface patch repre-
sentation computed at feature points to estimate the
initial rigid transformation between a gallery-probe
pair. For the ear helix/antihelix representation, the
correspondence of ear helix and antihelix parts (avail-
able from the ear detection algorithm) between a
gallery-probe ear pair is established and it is used to
compute the initial rigid transformation. For the local
surface patch (LSP) representation, a local surface de-
scriptor (see Fig. 4) is characterized by a centroid, a
local surface type, and a 2D histogram. The 2D histo-
gram and surface type are used for comparison of LSPs
and the centroid is used for computing the rigid trans-
formation. The patch encodes the geometric informa-
tion of a local surface. The local surface descriptors are
computed for the feature points, which are defined as
either the local minimum or the local maximum of
shape indexes. By comparing the local surface patches
for a gallery and a probe image, the potential cor-
responding local surface patches are established and
then filtered by geometric constraints. Based on the
filtered correspondences, the initial rigid transforma-
tion is estimated. Once this transformation is obtained
using either of the two representations, it is then
applied to randomly selected control points of the
hypothesized gallery ear in the database. A modified
iterative closest point (ICP) (▶ ICP algorithm) algo-
rithm is run to improve the transformation, which
brings a gallery ear and a probe ear into the best
alignment, for every gallery probe pair. The root
mean square (RMS) registration error is used as the
matching error criterion. The subject in the gallery
with the minimum RMS error is declared as the recog-
nized person in the probe.
The experiments are performed on the the UCR
data set and the UND data
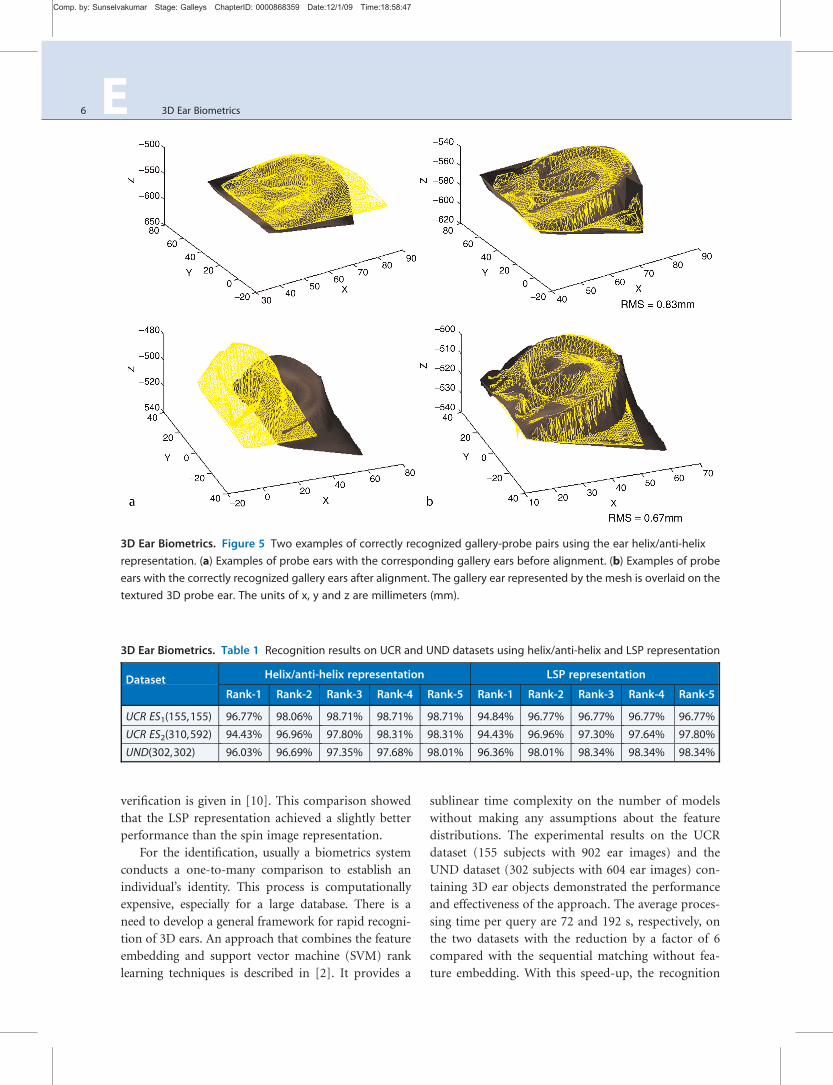
Examples of correctly recognized gallery-probe ear
pairs using the helix/anti-helix representation is shown
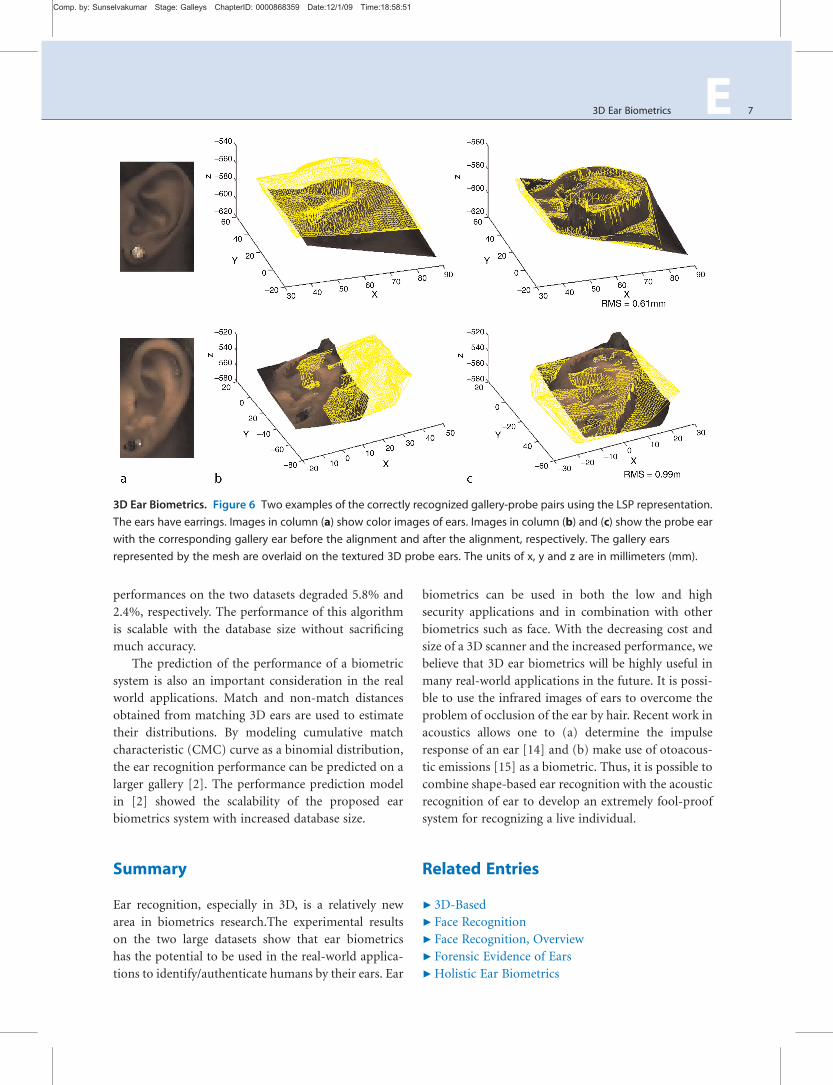
in Fig. 5. Similarly, examples of correctly recognized
gallery-probe ear pairs using local surface patch repre-
sentation are shown in Fig.6. From Figs.5 and 6, we
observe that each gallery ear is well aligned with the
corresponding probe ear.
The recognition results are shown in Table 1. In
order to evaluate the proposed surface matching
schemes, we perform experiments under two scenar-
ios: (1) One frontal ear of a subject is in the gallery set
and another frontal ear of the same subject is in the
probe set and (2) Two frontal ears of a subject are in
the gallery set and the rest of the ear images of the
same subject are in the probe set. These two scenarios
are denoted as ES1 and ES2, respectively. ES1 is used
for testing the performance of the system to recognize
ears with the same pose; ES2 is used for testing the
performance of the system to recognize ears with pose
variations.
A comparison of the LSP representation with
the spin image representation for identification and
3D Ear Biometrics. Figure 4 Illustration of a local surface patch (LSP). (a) Feature point P is marked by the asterisk and
its neighbors N are marked by the interconnected dots. (b) LSP representation includes a 2D histogram, a surface
type and centroid coordinates. (c) The 2D histogram is shown as a gray image in which the brighter areas correspond
to bins with the high frequency of occurrence.
3D Ear Biometrics E 5
Comp. by: Sunselvakumar Stage: Galleys ChapterID: 0000868359 Date:12/1/09 Time:18:58:47
verification is given in [10]. This comparison showed
that the LSP representation achieved a slightly better
performance than the spin image representation.
For the identification, usually a biometrics system
conducts a one-to-many comparison to establish an
individual’s identity. This process is computationally
expensive, especially for a large database. There is a
need to develop a general framework for rapid recogni-
tion of 3D ears. An approach that combines the feature
embedding and support vector machine (SVM) rank
learning techniques is described in [2]. It provides a
sublinear time complexity on the number of models
without making any assumptions about the feature
distributions. The experimental results on the UCR
dataset (155 subjects with 902 ear images) and the
UND dataset (302 subjects with 604 ear images) con-
taining 3D ear objects demonstrated the performance
and effectiveness of the approach. The average proces-
sing time per query are 72 and 192 s, respectively, on
the two datasets with the reduction by a factor of 6
compared with the sequential matching without fea-
ture embedding. With this speed-up, the recognition
3D Ear Biometrics. Figure 5 Two examples of correctly recognized gallery-probe pairs using the ear helix/anti-helix
representation. (a) Examples of probe ears with the corresponding gallery ears before alignment. (b) Examples of probe
ears with the correctly recognized gallery ears after alignment. The gallery ear represented by the mesh is overlaid on the
textured 3D probe ear. The units of x, y and z are millimeters (mm).
3D Ear Biometrics. Table 1 Recognition results on UCR and UND datasets using helix/anti-helix and LSP representation
Dataset Helix/anti-helix representation LSP representation
Rank-1 Rank-2 Rank-3 Rank-4 Rank-5 Rank-1 Rank-2 Rank-3 Rank-4 Rank-5
UCR ES1(155,155) 96.77% 98.06% 98.71% 98.71% 98.71% 94.84% 96.77% 96.77% 96.77% 96.77%
UCR ES2(310,592) 94.43% 96.96% 97.80% 98.31% 98.31% 94.43% 96.96% 97.30% 97.64% 97.80%
UND(302,302) 96.03% 96.69% 97.35% 97.68% 98.01% 96.36% 98.01% 98.34% 98.34% 98.34%
6 E 3D Ear Biometrics
Comp. by: Sunselvakumar Stage: Galleys ChapterID: 0000868359 Date:12/1/09 Time:18:58:51
performances on the two datasets degraded 5.8% and
2.4%, respectively. The performance of this algorithm
is scalable with the database size without sacrificing
much accuracy.
The prediction of the performance of a biometric
system is also an important consideration in the real
world applications. Match and non-match distances
obtained from matching 3D ears are used to estimate
their distributions. By modeling cumulative match
characteristic (CMC) curve as a binomial distribution,
the ear recognition performance can be predicted on a
larger gallery [2]. The performance prediction model
in [2] showed the scalability of the proposed ear
biometrics system with increased database size.
Summary
Ear recognition, especially in 3D, is a relatively new
area in biometrics research.The experimental results
on the two large datasets show that ear biometrics
has the potential to be used in the real-world applica-
tions to identify/authenticate humans by their ears. Ear
biometrics can be used in both the low and high
security applications and in combination with other
biometrics such as face. With the decreasing cost and
size of a 3D scanner and the increased performance, we
believe that 3D ear biometrics will be highly useful in
many real-world applications in the future. It is possi-
ble to use the infrared images of ears to overcome the
problem of occlusion of the ear by hair. Recent work in
acoustics allows one to (a) determine the impulse
response of an ear [14] and (b) make use of otoacous-
tic emissions [15] as a biometric. Thus, it is possible to
combine shape-based ear recognition with the acoustic
recognition of ear to develop an extremely fool-proof
system for recognizing a live individual.
Related Entries
▶ 3D-Based
▶ Face Recognition
▶ Face Recognition, Overview
▶ Forensic Evidence of Ears
▶Holistic Ear Biometrics
3D Ear Biometrics. Figure 6 Two examples of the correctly recognized gallery-probe pairs using the LSP representation.
The ears have earrings. Images in column (a) show color images of ears. Images in column (b) and (c) show the probe ear
with the corresponding gallery ear before the alignment and after the alignment, respectively. The gallery ears
represented by the mesh are overlaid on the textured 3D probe ears. The units of x, y and z are in millimeters (mm).
3D Ear Biometrics E 7

Comp. by: Sunselvakumar Stage: Galleys ChapterID: 0000868359 Date:12/1/09 Time:18:58:54
References
1. Iannarelli, A.: Ear Identification. Forensic Identification Series.
Paramont Publishing Company, (1989)
2. Bhanu, B., Chen, H.: Human Ear Recognition by Computer.
Springer (2008)
3. Burge, M., Burger, W.: Ear biometrics. in A. Jain, R. Bolle, S.
Pankanti, Biometrics - Personal Identification in Networked
Society, Kluwer Academic Publishers (1999)
4. Burge, M., Burger, W.: Ear biometrics in computer vision. Proc.
Int. Conf. on Pattern Recognition 2, 822–826 (2000)
5. Hurley, D.J., Nixon, M., Carter, J.N.: Force field energy func-
tionals for image feature extraction. Image and Vision Comput-
ing 20(5–6), 311–317 (2002)
6. Hurley, D., Nixon, M., Carter, J.: Force field feature extraction
for ear biometrics. Computer Vision and Image Understanding
98(3), 491–512 (2005)
7. Hurley, D., Arbab-Zavar, B., Nixon, M.: The ear as a biometric.
in A. Jain, P. Flynn, A. Ross, Handbook of Biometrics, Springer
(2007)
8. Chang, K., Bowyer, K.W., Sarkar, S., Victor, B.: Comparison and
combination of ear and face images in appearance-based
biometrics. IEEE Trans. Pattern Analysis and Machine Intelli-
gence 25(9), 1160–1165 (2003)
9. Bhanu, B., Chen, H.: Human ear recognition in 3D. Proc. Work-
shop on Multimodal User Authentication pp. 91–98 (2003)
10. Chen, H., Bhanu, B.: Human ear recognition in 3D. IEEE Trans.
Pattern Analysis and Machine Intelligence 29(4), 718–737 (2007)
11. Chen, H., Bhanu, B.: 3D free-form object recognition in range
images using local surface patches. Pattern Recognition Letters
28(10), 1252–1262 (2007)
12. Yan, P., Bowyer, K.W.: Multi-biometrics 2D and 3D ear recogni-
tion. Proc. Audio and Video Based Biometric Person Authenti-
cation pp. 503–512 (2005)
13. Yan, P., Bowyer, K.W.: Biometric recognition using 3D ear shape.
IEEE Trans. Pattern Analysis and Machine Intelligence 29(8),
1297–1308 (2007)
14. Akkermans, A., Kevenaar, T., Schobben, D.: Automatic ear rec-
ognition for person identification. Proc. IEEE Workshop on
Automatic Identiifcation Advanced Technologies pp. 219–223
(2005)
15. Swabey, M., Beeby, S.P., Brown, A.: Using otoacoustic emissions
as a biometric. Proc. First International Conference on Bio-
metric Authentication pp. 600–606 (2004)
8 E 3D Ear Biometrics