Embed Size (px)
Citation preview

3D Modeling of Geothermal Reservoirs
Case Study from Subtatric Basin in Western Carpathians, Slovakia
Lucia Hlavácová

3D MODELING OF GEOTHERMAL RESERVOIRS
Case Study from Subtatric Basin in Western Carpathians, Slovakia
Lucia Hlaváčová
A 30 credit units Master´s thesis
Supervisors:
Dr. Juraj Janočko (Professor, Technical University of Kosice, Slovakia) Dr. Axel Bjornsson (Professor, Univ. of Akureyri)
Dr. Hrefna Kristmannsdottir (Professor, Univ. of Akureyri)
A Master’s thesis done at
RES │ the School for Renewable Energy Science
in affiliation with
University of Iceland &
the University of Akureyri
Akureyri, February 2009

3D Modeling of Geothermal Reservoirs
Case Study from Subtatric Basin in Western Carpathians, Slovakia
A 30 credit units Master’s thesis
© Lucia Hlavácová, 2009
RES │ the School for Renewable Energy Science
Solborg at Nordurslod
IS600 Akureyri, Iceland
telephone: + 354 464 0100
www.res.is
Printed in 14/05/2009
at Stell Printing in Akureyri, Iceland

i
ABSTRACT
Geothermal energy is a potential renewable energy source that should be taken into account
by the Slovak government. To aid geothermal exploration, 3D modeling is a very useful tool.
The objective of this project was to model Poprad basin and the northern part of Hornad
basin, in the Inner Carpathian system in Slovakia, to assess future prospective geothermal
areas. These two are considered active geothermal areas. The main aquifers are built by
Triassic carbonates – dolomites and limestones of Choc and Krizna nappe. In the central part
of the Poprad basin, on the basis of seismic interpretation, Choc nappe thicknesses from 200
to 1100 m were obtained. Larger nappe thicknesses from 1200 to 1500 m were obtained on
the east and southeast part of the studied area. The average value of the temperature gradient
reaches 32.6 – 34.5° C/km and the average value of the heat flow density was estimated on
67mW/m2. Temperatures on the top of the Pre-Paleogene basement reach 50 – 85° C. In this
work the geologic structure of the Gerlachov area, which is situated in the northwestern part
of Poprad Basin, was also interpreted. From a geothermal point of view the formations with
the most potential are Mesozoic units represented by Choc and Krizna Nappes underlying
Paleogene rocks. Based on the geologic composition of Choc Nappe, the existence of very
good conditions for a geothermal water reservoir can be expected. Krizna Nappe has less
positive conditions for geothermal waters exploitation. General discharge of groundwater in
Choc Nappe should be more than 22 l.s-1
. The temperature in Choc Nappe is between 35 and
45° C.

ii
PREFACE
This thesis is submitted to RES | The School for Renewable Energy Science as partial
fulfillment of the requirements for the M.Sc. degree. The work presented here is the product
of three months of data gathering and 3D modelling. The work was conducted in the
Department of Geosciences in the Technical University of Košice in Slovakia.
This M.Sc. work is focused on the 3D modelling of geothermal reservoirs in Subtatric basin
in Western Carpathian area in Slovakia. Modelling was specialized on reservoirs in Poprad
basin and the northern part of Hornad basin.
These three months started with collecting data from the study areas, followed by work with
this data and preparing it for 3D modelling software. I am very grateful to Ing. Miloš Varga
PhD. for helping me with data processing. I am also very grateful to Prof. Ing. Juraj Janočko
CSc., Dr.scient. for all the time, guidance and support given to me during the elaboration of
this thesis.
I would also like to thank:
Everyone at the Department of Geosciences who helped me in one way or another;
Everyone from RES The School for Renewable Energy Science
My family and everyone close to me for all the support and for dealing with my
absence while I was here;
My friends and my colleagues from RES for all the support they gave me;
Thank you very much for giving me the opportunity to study at the RES school.
Lucia Hlaváčová, Akureyri, Iceland 18th
of February 2009

iii
TABLE OF CONTENTS
1 Introduction ........................................................................................................................ 1
2 Project outline .................................................................................................................... 2
3 Background information .................................................................................................... 3
3.1 Geologic background ................................................................................................. 3
3.2 Geology of Inner Carpathians .................................................................................... 3
3.3 Geothermal energy of the Slovak Republic ............................................................... 7
3.3.1 Hydrogeothermics .................................................................................................. 8
3.3.2 Geothermal resources and potential ..................................................................... 10
3.3.3 Košice Basin ........................................................................................................ 12
3.3.4 Poprad Basin ........................................................................................................ 13
3.3.5 Liptov Basin ......................................................................................................... 13
3.3.6 Skorusina depression ........................................................................................... 14
3.3.7 Central depression of the Danube basin – Galanta area ...................................... 14
3.3.8 Ziar basin ............................................................................................................. 15
4 CharacteristicS of study area: Poprad basin..................................................................... 17
4.1 Geomorphologic classification ................................................................................ 17
4.2 Climatic conditions .................................................................................................. 18
4.3 Geologic characteristics ........................................................................................... 18
4.3.1 Geologic composition .......................................................................................... 20
4.4 Tectonic composition ............................................................................................... 26
4.5 Hydrogeological characteristics ............................................................................... 27
4.6 Hydrogeothermal characteristics ............................................................................. 29
4.6.1 Depth composition and characterization of geothermal boreholes ...................... 31
4.6.2 Geothermic conditions ......................................................................................... 36
5 3D geothermal reservoir modeling approach ................................................................... 39
5.1 Petrel background .................................................................................................... 39
5.1.1 Geomodeling ........................................................................................................ 39
5.2 Process resolution and methodology of seismic interpretation – Poprad basin ....... 40
5.2.1 Analysis of seismic profiles ................................................................................. 40
5.2.2 Import data ........................................................................................................... 41
5.2.3 Seismic interpretation .......................................................................................... 44
5.2.4 Structural Modeling ............................................................................................. 46

iv
5.3 Process resolution and methodology of seismic interpretation – Gerlachov ........... 49
5.3.1 Fault Interpretation............................................................................................... 50
5.3.2 Horizons interpretation ........................................................................................ 50
5.3.3 Make Surfaces ...................................................................................................... 50
5.3.4 Structural Modeling ............................................................................................. 52
6 Results and discussion ..................................................................................................... 54
6.1 Poprad basin ............................................................................................................. 54
6.1.1 The Paleogene base .............................................................................................. 54
6.1.2 Choc Nappe .......................................................................................................... 55
6.1.3 Krizna nappe ........................................................................................................ 57
6.1.4 Tectonic structure................................................................................................. 59
6.2 Gerlachov ................................................................................................................. 62
6.2.1 Seismic profiles interpretation ............................................................................. 62
6.2.2 Seismic unit I - Paleogene deposits ..................................................................... 63
6.2.3 Seismic unit II - Choc Nappe ............................................................................... 64
6.2.4 Seismic unit III – Krizna Nappe .......................................................................... 64
6.2.5 Tectonic structure................................................................................................. 65
7 Conclusion ....................................................................................................................... 68
References ................................................................................................................................ 69
Appendix A ................................................................................................................................ 1

v
LIST OF FIGURES
Figure 3.1 - Map of Carpathian region: studied area located inside the black box ................... 3
Figure 3.2 - Tectonic map with geologic formations of the Slovak Republic (Biely Ed., 1996)
.................................................................................................................................................... 4
Figure 3.3 - Position of Western Carpathians in the Carpathian Mountain system ................... 6
Figure 3.4 - Geothermal boreholes and their temperatures characteristics in Slovakia ........... 10
Figure 3.5 - Potential geothermal areas and structures of the Slovakia ................................... 12
Figure 4.1 - Location of study area in geomorphological units in Slovakia (Mazúr and Lukniš,
1986) ........................................................................................................................................ 17
Figure 4.2 – Geologic position of the Inner Carpathian Paleogene basin, location of Poprad
basin and Gerlachov area ......................................................................................................... 18
Figure 4.4 - Geological map of study area: Poprad basin, North part of Hornad basin and
Gerlachov area (Polák et.al.,2008) ........................................................................................... 19
Figure 4.3 - Geologic composition of Gerlachov area ............................................................. 19
Figure 4.5 - Post – Tertiary thicknesses around Gerlachov ..................................................... 21
Figure 4.6 - Litostratigraphic column of Paleogene sediments in interested area ................... 21
Figure 4.7 - Kríţna nappe Litho-stratigraphic table ................................................................. 25
Figure 4.8 - Hydrogeological regionalization of Slovakia (Šuba et al., 1984) ........................ 27
Figure 4.9 - Boreholes location in study area; Gerlachov village location .............................. 31
Figure 4.10 - Isothermal lines in interested area ...................................................................... 38
Figure 5.1 - Location of seismic profiles in studied area ......................................................... 42
Figure 5.2 - Imported seismic profiles ..................................................................................... 42
Figure 5.3 - Imported boreholes ............................................................................................... 43
Figure 5.4 - Well stratigraphy .................................................................................................. 44
Figure 5.5 - Polygons of Paleogene base ................................................................................. 45
Figure 5.6 - Surface of Paleogene base .................................................................................... 45
Figure 5.7 - Key pillar representation ...................................................................................... 46
Figure 5.8 - Fault modeling ..................................................................................................... 47
Figure 5.9 - Skeleton grid ........................................................................................................ 47
Figure 5.10 - Interpreted horizons ........................................................................................... 48
Figure 5.11 - Interpreted zones ................................................................................................ 48
Figure 5.12 - Situation of imported 2 D diagrams, polygon for surfaces creating .................. 49
Figure 5.13 - Faults and horizons interpretation on seismic section Nr. 30 and 40 ................. 51
Figure 5.14 - Interpreted surfaces ............................................................................................ 51

vi
Figure 5.15 - Grid of the model showing grid boundary and faults ........................................ 52
Figure 5.16 - Grid of model ..................................................................................................... 52
Figure 5.17 - Grid model with Choc and Krizna nappe surfaces ............................................. 53
Figure 6.1 - Surface of the Paleogene base .............................................................................. 54
Figure 6.2 - Representation of the body of the Paleogene unit ................................................ 55
Figure 6.3 - Choc Nappe and Krizna Nappe horizons as interpreted in PETREL................... 56
Figure 6.4 - Base of the Choc Nappe ....................................................................................... 56
Figure 6.5 - Choc Nappe thickness in the southern part of the study area .............................. 57
Figure 6.6 - Representation of the body of Choc nappe .......................................................... 57
Figure 6.7 - Basal surface of Krizna Nappe ............................................................................. 58
Figure 6.8 - Representation of the Krizna nappe body ............................................................ 58
Figure 6.9 - Demonstration of interpreted faults intersecting the base of Paleogene unit ....... 59
Figure 6.10 - West - East intersection of the modeled area showing all interpreted faults ..... 59
Figure 6.11 - West - East intersection of the modeled area showing the syncline and anticline
structures .................................................................................................................................. 60
Figure 6.12 - Demonstration of interpreted faults on the base of Krizna Nappe ..................... 60
Figure 6.13 - Faults surfaces with Paleogene base .................................................................. 61
Figure 6.14 - Faults surfaces with base of Choc nappe ........................................................... 61
Figure 6.15 - Model of interpreted geological units ................................................................ 62
Figure 6.16 - Interpreted seismic units .................................................................................... 63
Figure 6.17 - Seismic unit I Paleogene deposit........................................................................ 63
Figure 6.18 - Seismic unit II Choc Nappe ............................................................................... 64
Figure 6.19 - Seismic unit III Krizna Nappe............................................................................ 65
Figure 6.20 - Faulted Choc nappe ............................................................................................ 65
Figure 6.21 - Intersection of model showing faults intersecting Paleogene and Choc Nappes
.................................................................................................................................................. 66
Figure 6.22 - Choc nappe segment .......................................................................................... 66

vii
LIST OF TABLES
Table 1 – Summary of geothermal areas in Slovakia .............................................................. 16
Table 2 - Choc nappe borehole descriptions ............................................................................ 22
Table 3 - Kríţna nappe borehole descriptions ......................................................................... 24
Table 4 - Tatricum envelope borehole description .................................................................. 25
Table 5 - Productive sectors in borehole PP-1 ......................................................................... 34
Table 6 - Geothermic data of Poprad basin deep boreholes (Daniel et al. 1998) .................... 36
Table 7 - Geothermic data of Hornad basin deep boreholes (Daniel et al. 1998) .................... 37
Table 8 - Statigraphy table ....................................................................................................... 43

1
1 INTRODUCTION
Renewable energy sources are domestic energy sources which help to increase the safety of
energy supply and diversification. In addition, utilization of renewable energy sources usually
fulfils the conditions of environmental acceptability. An increase in renewable energy
utilization, through heat and electricity production is one of the EU strategies for dealing with
current climatic changes because, for example, they contribute to reducing the emission of
green house gases. Also, renewable energy sources play an important role in the area of local
and regional development and employment.
In the year 2001, the European parliament and European Council directive announced the
objective of reaching 20% of energy consumption from renewable energy sources by 2020.
The directive confirmed the EU priority of increasing the utilization of renewable energy
sources till 2010.
The new conception of renewable energy source utilization was approved by decree of the
Slovak government No. 282/2003. Technically available potential of renewable energy
sources, according to Energetic conception of the Slovak republic, is from biomass (46,7 % ,
60,458 TJ), geothermal (17,5%, 22,680 TJ), solar ( 14,5 %, 18,720 TJ), waste (9,8 %, 12,726
TJ ), biological fuels (6,9 %, 9,000 TJ ), small water power plants (2,9 %, 3,722 TJ ), wind
(1,7 %, 2,178 TJ ). In total there is energy potential of 129,484 TJ that can be extracted from
renewable energy sources (Decree of the Slovak Government No. 282/2003)
Geothermal energy is a promising option. Its energy is derived from the heat contained within
the earth. It is a form of renewable energy and has proved to be reliable, economic,
environmentally friendly and sustainable. The use and study of geothermal energy was
greatly improved in the 1990´s in order to supply reusable energy for the increased
worldwide energy demand (Dickson and Fanelli 2004). Geothermal resources are found in all
types of rocks: sedimentary, metamorphic and volcanic. On average the formation
temperature increases by about 30ºC/km, which means that temperatures of about 100ºC can
generally be found at depths of 3 to 4 km. It is not enough to find temperatures suitable for
utilization. Locations must be found where water is present at a suitable depth, and the local
permeability is sufficient to absorb heat stored in the rocks and carry it up to the surface.
Several geological surveys showed that Slovakia is relatively rich in geothermal sources. The
water temperature of these sources varies between 75 and 130°C. The Slovak economy is
90% dependent on imported energy sources; therefore utilization of this non-traditional
renewable energy source is imperative. The current utilization of geothermal energy in
Slovakia is only about 6 % of the country‘s renewable energy production.

2
2 PROJECT OUTLINE
The main objective of this project is to characterize the geothermal potential of the Subtatric
region, as it is a vital part of a long-term governmental plan for the use of renewable energy
sources, mostly for heating and electrical production. The whole study is subdivided in the
following partial items:
Geological analysis - The study area covers the Paleogene depressions known as
Subtatric depression and extends further to the southeast, to the Hornad Depression.
The great advantage for the proposed project is a large number of older
hydrogeological and geothermal wells in the area providing huge amounts of data
needed for the planned analysis. The geological analysis will be devoted to the
evaluation of the lithology of potential reservoir rocks and the role of tectonics in
exploitation of the reservoir rocks.
Data available for the thesis:
o Para-3D seismics, locality Gerlachov, Subtatric depression
o Several 2D seismic profiles from the Subtatric depression
o Geological map from the Subtatric and Hornad depressions at scale 1:50 000
o Interpreted gravity data showing basement of the Subtatric depression, 5
geothermal wells from Subtatric depressions showing lithology, stratigraphy,
hydrogeology and some of the geothermal parameters
Hydrogeological analysis - In this part the hydrogeological units made of different
potential reservoir rocks will be evaluated. The hydrogeological parameters will be
obtained from existing archive manuscripts and published papers. This part will also
include petrophysical analysis (porosity, permeability, type of hydrogeological
reservoir, circulation etc.) of the evaluated rock units.
Geothermal conditions - Based on archive works and wells, geothermal
characteristics of the selected region will be presented.

3
3 BACKGROUND INFORMATION
The modeled geothermal reservoir is situated in Inner Western Carpathians, Slovakia. The
studied area is shown in Figure 3.1.
Figure 3.1 - Map of Carpathian region: studied area located inside the black box
Legend: Location of Slovakia in Europe, Division of the Carpathians: 1-Outer Western Carpathians, 2-Inner
Western Carpathians, 3-Outer Eastern Carpathians, 4-Inner Eastern Carpathians, 5-Southern Carpathians, 6-
Western Romanian Carpathians, 7-Transylvanian Plateau, 8-Serbian Carpathian
3.1 Geologic background
The geological structure of the Western Carpathians in Slovak territory and favorable
geothermic conditions create a suitable setting for the occurrence of geothermal energy
resources. The Western Carpathians are classified according to the age of development of the
Alpine nappe structure as the Outer, with Neo-Alpine nappes, and the Inner, with Paleo-
Alpine and Pre-Paleogene nappe structures. The Klippen Belt marks the boundary between
them (Fig. 5). The structure of the Western Carpathians is characterized by zoning. The
Mesozoic and Tertiary formations, arrayed in a series of arched belts, have been tectonically
transformed from qualitatively and temporally different sedimentary basins into the fold-
nappe ranges, which may either be composed of sedimentary filling alone, or may include the
original basement (Biely Ed. 1996). The geological setting is favorable for the occurrence of
geothermal waters with temperatures higher than 20oC only to the south of the Klippen Belt.
Geothermal waters are largely associated with Triassic dolomites and limestones of the
Kríţna and Choč nappes (Fatricum and Hronicum), less frequently with Neogene sands,
sandstones, conglomerates, andesites and related pyroclastics. A map with the geologic
formations in the Slovak Republic is shown in Figure 3.2.
3.2 Geology of Inner Carpathians
The characteristic feature of this zone is the pre-Senonian (Mediterranean) age of nappe
thrusting, manifestations of Alpine metamorphism and magmatism and large areal extent of
post-nappe sedimentary and volcanogenic formations. The pre-Senonian nappe structure

4
consists of two kinds of nappes. The first type is composed of the pre-upper Carboniferous
fundament overlain by Late Paleozoic and Mesozoic in normal position. This nappe group
includes the Tatricum, Veporicum and Gemericum. The second type comprises rootless
nappes composed of Mesozoic and sometimes Late Paleozoic rocks which are entirely
separated from their substratum. This type includes nappes in the Fatricum, Hronicum and
Silicikum.
Figure 3.2 - Tectonic map with geologic formations of the Slovak Republic (Biely Ed., 1996)
Tatricum
Tatricum is widespread in the core mountains (Malé Karpaty, Povaţský Inovec, Stráţovské
vrchy, Malá Fatra, Tatry, Veľká Fatra, Nízke Tatry, and Branisko) in the outer section of the
Inner Carpathians. It is dominated by crystalline schists, granitoids and the envelope which in
some mountain chains starts with Permian continental sediments. The Tatric Mesozoic
sediments range in age from the Lower Triassic to cenomanian in the Tatry Mts. to the Lower
Turonian. The Mesozoic succession of strata is interrupted by hiatuses in the Upper Triassic
and Lower Cretaceous. It is dominated by carbonate rocks except for the Lower and Upper
Triassic where detrital sediments prevail.
Veporicum
Veporicum also consists of crystalline schists, granitoids and the Late Paleozoic and
Mesozoic envelope. It is fringed by the Čertovica line in the north and the Lubeník-
Margecany line in the south. The envelope of the crystalline formations was preserved mostly
in the northern Veporic subzones where its Lower Triassic – Neocomian succession of strata
is similar in character to the Fatricum. The Mesozoic rarely occurs in the southern subzones.
The Late Paleozoic formations have a detrital character. The whole envelope is mildly
metamorphosed. The Veporicum is overthrust onto the Tatricum.

5
Gemericum
Gemericum is widespread in the Inner Carpathians‘ southern tract. This term now refers only
to the Paleozoic part of the originally larger unit. It comprises the Early Paleozoic Gelnica
Group dominated by flysch rocks with abundant acid effusive volcanics and the Rakovec
Group composed of flyschoid and mafic effusive volcanic rocks. In addition it includes
Upper Carboniferous detrital sediments, Permian continental sediments with acid effusive
volcanics and, in the south, Permian marine detrital sediments are also present. In the Alpine
period, the Early Paleozoic sequences were intruded by granitoids.
The Meliaticum and Tornaicum in the southern Inner Carpathians, which were formerly
assigned into the Gemericum, are now regarded as separate units. Their areal extent is very
small, and their mutual relationships and position have not yet been cleared up sufficiently.
The Gemericum is overthrust onto the Veporicum.
Fatricum
Fatricum consists of rootless nappes overlying the Tatricum (Kríţna and Vysoká nappes). It
is a succession of strata ranging from the Lower Triassic to Cenomanian. Only in the Staré
Hory area the Kríţna nappe includes earlier rocks which are Permian and crystalline. The
Fatric basin of deposition is likely to have been situated between the Tatricum and
Veporicum.
Hronicum
Hronicum is made up of higher rootless nappes resting on the Fatricum largely in the Tatric
and partly also in the Veporic area. The nappe rocks are Carboniferous to Neocomian in age.
Permian continental sediments are accompanied by mafic volcanics. The Triassic in the Choč
nappe has a variegated marine carbonate character whereas the Šturec nappe is essentially
dolomitic. The Hronicum basin of deposition was probably situated south of the Gemericum.
Silicikum
Silicikum (Mesozoic of the Slovak Kras, Galmus, Muráň, Plateau, Drienok nappe, etc.) is the
highest group of rootless nappes composed of Lower Triassic shale facies but mainly Middle
to Upper Triassic carbonates. They were probably deposited in the same sedimentary area as
the Hronicum.
The Middle Cretaceous Inner Carpathian tectogenesis is characterized by the complete
reduction of the crystalline basement which originally underlay the rootless nappes. After the
nappes were overthrust, this area was partly inundated by a Senonian sea whose sediments
were preserved only very rarely. In the Paleogene, the Inner Carpathians became a basin of
deposition. Thick flysch formations, the Inner Carpathian Paleogene, were deposited in the
northern section. The Buda- (Pannonian) facies Paleogene was laid down in the south. Late
tectonic and post-tectonic molasse basins evolved in the inner Carpathians after the Sava
folding, a process accompanied by intensive volcanism. The felling of these basins is
dominated by brackish and freshwater sediments. The Neogene tectonic regime crushed the
Inner Carpathians into blocks. Tectonic activity of the blocks resulted in the ascent of

6
magma, particularly along the block limits. The volcanics belong to the effusive series
rhyolite-andesite-basalt, and the intrusive rocks in the granite-granodiorite group.
Figure 3.3 - Position of Western Carpathians in the Carpathian Mountain system
Legend: A - Neogene Sedimentary rocks, B - Neogene volcanics, C - Inner Carpathian Paleogene basin, D -
Outer Flysch belt, E - Neogene volcanic rocks, F - Pieniny Klippen Belt, G - Inner units of Carpathians 1 - State
border, 2 - faults, 3 - Silesian nappe of the Outer Carpathian Flysch belt (OCF belt), 4 – Foremagura units of
the OCF belt: 4a - Dukla unit, 4b - Grybow unit, 5 - External Magura nappes of the OCF belt: 5a - Bystrica
unit,5b - Lrynica unit, 5c - Raca unit, 6 - Internal Magura nappes of the OCF belt: 6a - Biele Karpaty unit, 6b -
equivalents, 7 - Pieniny Klippen Belt, 8 - Neogene and Quaternary rocks, 9 - Alkali basalts, 10 - Andesitic
volcanic rocks (Neogene), 11 - Rhyolitic volcanic rocks (Neogene), 12 - Eocene to early Miocene sediments of
Are
a o
f in
tere
st

7
the Hungarian (Buda) basin, 13 - sediments of the Inner Carpathian Paleogene basin, 14 - sediments of the
Gosau, Myjava, and Hricov groups, 15 - Tatricum: 15a - crystalline basement, 15b - sedimentary cover, 16 -
Veporicum, Zemplinicum: 16a - crystalline basement, 16b - sedimentary cover and Krížna nappe, 17 -
Hronicum, 18 - Gemericum, 19 - Meliaticum, 20 - Tornaicum, 21 - Silicicum (Janočko et al. 2006)
3.3 Geothermal energy of the Slovak Republic
The geothermal fields in the West Carpathian area are very variable. Their regional character
and spatial distribution of geothermic activity are controlled mainly by:
different deep structure of West Carpathian neotectonic blocks, mainly different from
the earth‗s crust thicknesses and irregular introduction of heat from the mantle,
course of principal discontinuities and fault lines seated deep in the earth‗s crust
spatial distribution of Neogene volcanism,
distribution of radioactive sources in the upper sections of the earth‗s crust and
hydrogeological setting.
The thermal field, at depths up to 3000 m, is controlled to a great extent by hydrogeological
conditions. Its local variations result from the surface morphology, shallow, thermally active
tectonics, local manifestations of Neogene volcanism and different thermal conductivities.
The thermal field at depths greater than 3000 m, however, reflects geothermic activity of
deeper morphologic structures of the earth´s crust.
From a geothermic point of view, the West Carpathians may be divided into two parts which
differ considerably in their geothermic activities and spatial distribution of the earth‘s heat.
Relatively low temperatures and slight surface heat flow are characteristic of the central and
northern sections of the Inner Carpathians and the western section of the outer Flysch Belt. In
contrast, high subsurface temperatures and high heat flow are typical of the Inner West
Carpathian Neogene basins and volcanic mountains. These two geothermally different
regions are separated from one to another by zone of intensive horizontal thermal gradients,
at the contact between the volcano-sedimentary complex and pre-Neogene units of the West
Carpathians. Transient geothermic activity occurs in the Inner Carpathian Paleogene and the
eastern section of the Outer Flysch Belt.
The maximum differences in mean surface heat flow density in individual West Carpathian
structural-tectonic units reach as much as 55 mW.m-2
(between the Eastern Slovakian and
Vienna basins). The differences are a result of the different structure and dynamics of basic
neotectonic blocks. High heat flows are associated with weakened sections of the earth‗s
crust whereas low heat flow typically occurs in thick crust.
Heat flow density in the West Carpathians is highly variable and regionally falls from
the Inner Carpathians towards the outer arc. The highest values between 82 and 121,6
mW.m-2
, averaging 110,9 mW.m-2
,have been recorded in the Eastern Slovakian Basin. The
heat flow density pattern corresponds to the basin´s deep structure and spatial distribution of
centers of deposition which characterize its geodynamic history. This basin is regarded as a
tectonically reworked basin of thermal origin formed by lithospheric extension. Its
geothermal activity was further increased by huge volcanism. High heat-flow densities in this
area occur in a place where the earth‗s crust was thinned at the expense of thermally
predisposed lithosphere and where more heat ascends from the upper mantle.

8
Areal distribution of heat-flow density at the Mohorovičič discontinuity (division between the
earth‗s crust and upper mantle) suggests major differences between the deep geological
structures of individual tectonic blocks in the West Carpathians. It has turned out that
different surface heat –flow densities in individual main structural-tectonic units in the West
Carpathians can only be explained by different introduction of heat from the upper mantle.
This important source of heat varies from one area to another. Regional difference in heat-
flow densities at the core / mantle boundary below the Neogene depressions and Outer
Carpathians attains as much as 50 – 55 mW.m-2
. These great differences are of prime
importance for the geodynamics of the whole Carpathian system and mobility of the
neotectonics of the whole Carpathian system and mobility of its neotectonic blocks. They
cause differences of 400 – 500°C at the base of the earth‗s crust underlying the Eastern
Slovakian Basin and Outer Flysch Belt. Such big temperature differences over a relatively
small area give rise to intensive horizontal thermal gradients, also at great depths, which in
turn may cause thermoelastic stresses, increased seismic activity and tectonic instability of
the area concerned (Franko et al. 1995)
3.3.1 Hydrogeothermics
Thermal springs as manifestations of geothermal energy also occur outside active volcanic
zones (seismic zones). Areas richly endowed with these waters also include young orogenic
belts, such as the Alps and Carpathians (Franko, O. 1990).
The assessment of geothermal activity of a given territory is based on generally valid criteria
(Franko, O. 1979; Remšík, A. 1987a):
geothermic activity equal or higher than world average (heat-flow density q = 70
mW.m-2; geothermic gradient Gg = 30 K.km-1),
extensive spatial distribution of suitable geothermal aquifers.
The most extensive geothermal aquifers are Triassic dolomite-limestone complexes in the
Inner West Carpathians. The above-mentioned springs are associated with these carbonates.
Some other significant aquifers are neogene sands and clastics followed by andesites and
related pyroclastics. Because of their lithology, the Flysch Belt (alternating sandstones and
claystones) and Klippen Belt (limestones and flyschoid sediments) are virtually devoid of
geothermal waters.
The main geothermal aquifers are Triassic dolomites and limestones, basal Paleogene
conglomerates and breccias of Inner Carpathian nappes and envelope units, as well as Eastern
Alpine nappes (Vienna Basin). They are widespread in inter-mountain depressions. The
thickness of the aquifers varies from one nappe or envelope unit to another, For example, in
the Kríţna nappe, where these aquifers have fissure and fissure-karst permeability.
Transmissivity coefficients T in individual tested aquifers vary from 6,7.10-6 to 2,3. 10-2 m 2
.s -1 averaging 3,08.10-3 m2.s-1.
The relationship between geothermal waters and these aquifers is best indicated by natural
thermal springs. The springs result from the fold-nappe structure of Mesozoic formations
with extensive folds plunging from mountain slopes to substantial depths and from
longitudinal and transverse faulting. The catchment areas are connected with transit-
accumulation areas through large fold flanks while longitudinal and transverse faults or their

9
intersections allow the waters to rise onto the surface through a Tertiary and Quaternary
cover. This is particularly the case in inter-mountain depressions.
Geothermal waters are also bound to aquifers without natural springs as is the case in the
hydrogeothermal structure of the Danube Basin central depression. They can also be hosted
by aquifers lacking catchment areas, such as deep geothermal aquifers in pre-Tertiary
substratum of lowlands. Prospecting for geothermal waters is focused mainly on aquifers
without natural springs. Further significant, although less widely distributed, aquifers are
Miocene and Pliocene sands. They can be found in the Danube and South Slovakian basins.
In the former basin the sands alternate with clays (Franko, O. et al. 1985) wile in the later the
sands form a more or less single layer (Franko, O. et al. 1967). The aquifers have
intergranular permeability.
Andesites and related pyroclastics in the Eastern Slovakian Basin are less important
geothermal aquifers. These Miocene aquifers contain geothermal waters because they are at
substantial depths and are faulted (Rudinec, M. 1989).
In Slovakia three types of geothermal waters have been classified (Franko, O. 1985; Franko,
O. et al. 1986, Remšík, A. 1987a):
high-temperature waters whose surface temperature exceeds 150°C (aquifer
temperature exceeds 180°C)
medium-temperature waters whose surface temperature is 100 – 150°C (aquifer
temperature is 130 – 180°C)
low-temperature waters whose surface temperature is less than 100°C (aquifer
temperature is below 130°C).
Low-temperature waters can be tapped by wells 3000-4000 m deep. Medium-temperature
waters are widespread in seven areas, the most favorable of which, at depths 3000-4000 m,
are the Košice Basin, Beša–Čičarovce structure and central depression. The high temperature
waters occur in four areas and, except in the Beša – Čičarovce structure, at depths greater
than 4000 m.
Based on chemical composition, three basic genetic types of geothermal waters have been
classified (Bodiš D. – Franko, O. 1986):
Geothermal waters with marinogene mineralization, which include:
connate waters whose mineralization corresponds to the paleo-salinity of their
aquifers and which were metamorphosed only in the water-rock system and/or by
CO2 addition,
connate waters infiltration-, biogenic-, or pertogenic-degraded to various degrees and
at different periods,
highly mineralized geothermal waters formed through halite dissolution by sea water
or through local thickening of sea water;
Geothermal waters with petrogene mineralization whose T.D.S. does not exceed 5 g.l-
1 exemplified by meteoric waters of fairly deep or deep circulation;
Geothermal waters of mixed origin and complex chemistry.

10
3.3.2 Geothermal resources and potential
In Slovakia geothermal resources were documented by wells in 26 prospective areas. In total,
117 geothermal wells are registered in Slovakia, 5 of them were negative. The amount of app.
1690 l/s of geothermal water were documented by geothermal wells. The temperature on the
well head reaches 18 – 129ºC (Figure 3.4).
Figure 3.4 - Geothermal boreholes and their temperatures characteristics in Slovakia
Geothermal waters are largely bound to Triassic dolomites and limestones of the Kríţna and
Choc nappes, and less frequently to Neogene sands, sandstones, conglomerates, andesites and
related pyroclastics.
Geothermal waters were reached by wells 92 – 3616 m deep. Free outflow of the wells
ranged from 0.1 up to 100 l/s, Na-HCO3-Cl, Ca-Mg-HCO3 and Na-Cl chemical type of water
with the T.D.S. value of 0.4 – 90.0 g/l prevails (Fendek and Fendekova, 2005).
The history of utilization of geothermal energy in the Slovak Republic is mainly the history
of utilization of the thermal springs. Many archeological finds discovered at the site and the
surrounding thermal springs indicate that man was attracted to settle in these friendly areas.
The first utilization of geothermal waters for energetic purposes is connected with space
heating in spas and can be dated to the year 1958. Three systems of direct utilization of
geothermal waters were tested (Uhliarik, 1977):
direct space heating
utilization of heat pumps
space-heating and heating of hot service water through heat exchangers
These first steps created conditions for more extensive research on the field of geothermal
energy utilization for direct use in the Slovak Republic.
Geothermal resources in Slovakia are recently used in agricultural farms, for space heating,
fish farming and recreational purposes (swimming pools). In 12 agricultural farms
Geothermal borehole
Temperature Depth of borehole
of water
11
geothermal water is used for greenhouse and soil heating. This allows the early production of
vegetables and flowers. The total area covered by greenhouses is about 25,86 hectares. The
number of locations where geothermal water is used for space heating has increased
significantly from 6 in 1999 to 13 in 2004. This type of heating is used to heat hotels, blocks
of flats, a hospital, and a sport hall. Eight geothermal heat pump installations are reported
with a total installed capacity of 1,4 MWt and producing 12,1 TJ/yr of heat. A total of 32
individual projects using thermal energy are reported for the Slovak Republic, with a major
district-heating project being proposed for the eastern city of Košice. The individual direct-
heat uses are: district heating (31,6 MWt and 576,9 TJ/yr); greenhouse heating (31,8 MWt
and 502,3 TJ/yr); fish farming (4,6 MWt and 72,4 TJ/yr); and bathing and swimming
(118,3 MWt and 1,870.3 TJ/yr); for a total, including heat pumps, of 187,7 MWt and
3,034.0 TJ/yr (Lund 2005). Total thermal installed capacity in MWt: 187,7, direct use in
TJ/year: 3,034, direct use in GWh/year: 842,8 , capacity factor: 0,51. Geothermal power
plants have not been installed in Slovakia in the meantime.
Based on existing research the most prospective spots for geothermal energy usage would be
the Neogene basins and depressions: Vienna, Danube and East-Slovakian Basins, south-
Slovakian depressions and intermountain depressions in the Western Carpathians (Figure
3.5). Eastern Slovakia is among the areas with the most geothermal potential in Central
Europe. This is evident by both the thermal regime of the region, related to the mantle
upheaval in the Pannonian domain, as well as to geological structure of the region; the
Mesozoic carbonate complexes overlain by thick shale-to-sand sedimentary cover are the best
water reservoirs in the area.
As was mentioned before, geothermal resources can be classified, according to their
temperature, into three types:
Low temperature sources - Areas which contain low temperature sources (20 –
100°C) in Slovakia are: Komarno high block, Danube basin central depression,
Bánovce basin, Topoľčany embayment, Trnava embayment, Piešťany embayment,
Central Slovakian Neogene volcanics (NW part), Central Slovakian Neogene
volcanics (SE part), Upper Nitra Basin, Levoča Basin (W and S parts, Horne Strhare –
Trenc graben, Rimava Basin, Trenčín Basin, Ilava Basin, Levice marginal block,
Komarno marginal block, Vienna Basin, Komjatice depression, Levoča basin (N
part), Humenné ridge, Košice Basin, Beša-Čičarovce structure, Dubnik depression
(Fig.3). All determined areas have favorable conditions for low temperature
geothermal waters occurrence at depths of 150 – 3500 m.
Medium temperature sources - Areas with medium temperature sources (100 –
150°C) are Beša-Čičarovce structure, Košice Basin, Danube Basin central
depression, Humenné ridge, Levoča Basin (N part), Ţilina Basin, Trnava embayment,
Piešťany embayment, Central Slovakian Neogene volcanics (NW parts), Vienna
Basin. Favorable conditions for medium temperature geothermal waters occurrence
are at depths of 2500-4500 m.
High temperature sources - Areas with water temperatures higher than 150°C are:
Beša-Čičarovce structure, central Slovakian Neogene volcanics (NW part) and in
Vienna Basin at the depth of 3500 – 5500 m (Fendek and Fendekova, 2005).

12
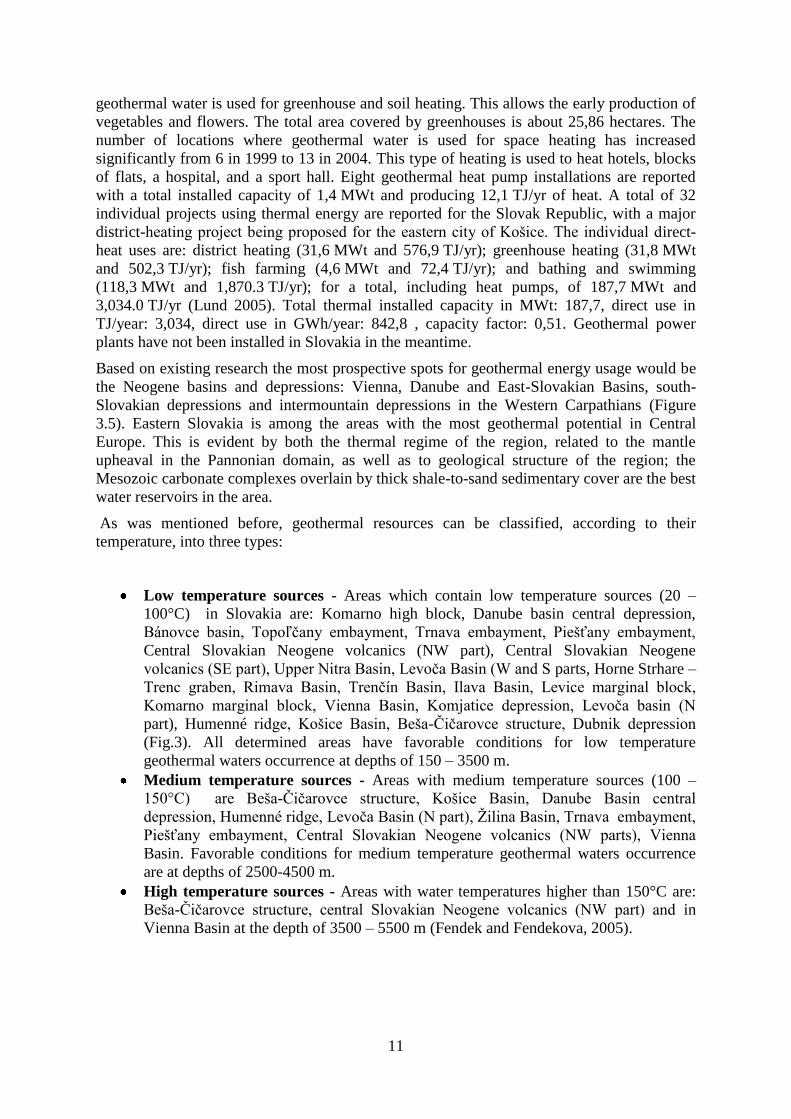
Figure 3.5 - Potential geothermal areas and structures of the Slovakia
Legend: 1 - serial number of the prospective area or structure/number of drilled geothermal wells, 2 – Klippen
Belt, 3- prospective areas with geothermal water verified by geothermal wells, 4 – prospective areas
geologically assessed for the purpose of prospecting and exploration of geothermal waters, 5 prospective area
with assumed occurrence of geothermal waters (based on general knowledge of geological conditions).
List of prospective areas: 1-Danube Basin central depression, 2-Komarno high block, 3-Komarno marginal
block, 4-Vienna Basin, 5-Levice marginal block, 6-Banovce Basin and Topolcany embayment, 7-Upper Nitra
Basin, 8-Skorusina Basin, 9-Liptov basin, 10-Levoca Basin (W and S parts), 11-Kosice Basin, 12-Turiec Basin,
13-Komjatice depression, 14-Dubnik depression, 15-Trnava embayment, 16-Piestany embayment, 17-central
Slovakian neogene volcanics (NW part), 18-Trencin Basin, 19-Ilava Basin, 20-Zilina Basin, 21-Central
Slovakian Neogene volcanics (SE part), 22-Horne Strhare – Trenc graben, 23-Rimava Basin, 24-Levoca basin
(N part), 25-Humenne ridge, 26-Besa – Čičarovce structure (Fendek and Fendekova, 2005)
3.3.3 Košice Basin
Ďurkov area (Vranovská et al., 1999) is located in the south-eastern part of the Košice Basin,
bordered in the East by neovolcanic rocks of Slanske vrchy Mts. Three geothermal wells
GDT-1, 2 and 3 were drilled, casted and tested throughout 1998 and the first half of
1999.Their vertical depths were 2252 - 3210 m.
A reservoir of geothermal waters is located at a depth of 2000 – 3500 m. The most important
inflow zones were identified on the top of the Triassic dolomites of the Veporicum unit,
having fissure and fissure-karst permeability. Free outflow of the wells reached 50 – 65 l/s
during performed short-term hydrodynamic tests. The temperature on wellheads varied from
123 up to 129ºC. Measured temperature in the bearing at the depth of the 3000 m reached
143°C. Average heat flow density value was estimated at 94.4 mW/m2.
The Ďurkov area is typical, with its complicated system of water –water vapor – solid phase.
The value of TDS varies in the range of 25 – 32 g/l. Chemical composition is of distinct Na-
Cl type with the low presence of Na-HCO3 component.
The available amount of geothermal energy was estimated to be 92.63 MWt based on the
results of mathematical modeling.

13
3.3.4 Poprad Basin
Geothermal water aquifers (Daniel et al., 1998) are built by Triassic carbonates of the Choc
and Kríţna nappes located under the Tertiary strata. The thickness of the Choc nappe
sequences reaches 200 – 1100 m in the central part of the Poprad basin. Unusually thick –
1200 to 2000 m - are Choc nappe sequences to the east and south-east of the Vrbov fault at
the point of contact between the basin and the Levoča Mts.
The average value of the temperature gradient reaches 32.6 – 34.5°C/km and the average
value of the heat flow density was estimated to be 67mW/m2. Temperatures on the top of the
Pre-Paleogene basement reach 50 – 85°C.
The value of the specific thermal-energy potential varies from 0.023 to 10.007 GJ/m2.
Geothermal water is of Ca- Mg-HCO3 SO4 chemical type. The value of TDS ranging from
2.9 to 4.1 g/l. CO2 prevails in gas composition.
The total amount of natural geothermal waters in Poprad basin was estimated to be 216.2 l/s.
This amount represents 33.884 MWt of thermal energy.
3.3.5 Liptov Basin
The pre-Paleogene basement of the Liptov basin (Remšík et al., 1998) is built by Choc and
Kríţna nappe sequences. It can be divided into some depressions and elevations according to
its morphological structure. Paleogene sediments are the most thick in Liptovska Mara
depression – up to 2200 – 2300 m.
The thermal field of the basin is very variable. It is disturbed by convective heat transport in
the Kokava depression and in the Besenova elevation. Temperatures at the depth of 1000 m
range from 29 to 46°C, and at the depth of 2000 m they range from 46 to 76°C. The average
value of the geothermic gradient at depths of 2000 – 2500 m reaches 17.8 – 31,9°C/km for
Paleogene and Mesozoic rocks. Heat flow density varies from 52,0 do 71,7 mW/m2.
According to values of the geothermic gradient and heat flow, Liptov basin can be divided
into two geothermically different areas – the western, with higher geothermic activities, and
the eastern, which has distinctly lower geothermic activities. Hydrogeothermal structures of
the Choc nappe (Ivachnova depression, depression of the Liptovska Mara, Demanova
depression, Vavrisovo-Kokava depression and Biely Vah depression) are typical for the
occurrence of geothermal waters at temperatures of 20 – 90°C at depths of 500 – 3000 m.
Chemical composition represents Ca-Mg-HCO3 but also Ca Na-Mg-HCO3-SO4 type with
the amount of TDS ranging from 0.35 to 5.0 g/l. CO2 is the dominant gas in all
morphological structures of the Liptov basin. All these structures can be characterized as
semi-open hydrogeothermal structures.
Hydrogeothermal structures of the Kríţna nappe (Kokava depression, Besenova elevation,
structures in the area of the Liptovska Mara depression, and Ivachnova depression) bear
geothermal waters at depths of 900 – 3500 m with water temperatures of 30 – 100°C.
Chemical composition is represented by Ca-Mg-HCO3-SO4, and Ca-Mg-SO4-HCO3 type of
water, and the amount of TDS ranges from 3 to 5 g/l. Structures can be characterized as open
or semi-open hydrogeothermal structures.
The total natural amount of geothermal waters was estimated to be 248 l/s, which represents
the total amount of thermal energy of 34.589 MWt. This estimate is in quite good accord with
the results of the geothermic balance (30.103 MWt). However, the geothermic balance seems
to be underestimated because it does not take into account the infiltration area of the Earth‘s
heat (Fendek and Fendekova, 2005).

14
3.3.6 Skorusina depression
The Skorusina depression is built by Central-Carpathian Paleogene sequences with
thicknesses of 200 to 2600 m, underlain by Choc and Kríţna nappes, an envelope unit and a
crystalline core. Geothermal waters are bound to Triassic dolomites of the Choc and Kríţna
nappes. Their thickness ranges from 300 to 600 m, with the maximal depth of -3600 m a. s. l.
in the north-eastern part of the depression. Depending on the depth of aquifer occurrence, the
water temperature ranges from 25 to 125°C. Four geothermal structures were identified in the
Skorusina depression (Bajo et al., 2004). The largest and most prospective is the Zabiedovo
structure, built by Kríţna nappe sequences, which has the shape of a syncline with a depth
ranging from -1400 up to 1600 m a.s.l. Temperatures on the top of carbonates reach values of
60 – 120°C. The adjacent structure is called the Dolny Kubin structure, creating an elevation
located in the central part of the Skorusina basin. Carbonatic aquifers in its south-western part
are developed at depths of 0 to – 800 m a.s.l., and temperatures increase from 30 to 45°C. In
the north-eastern part, carbonates lay at depths of -600 up to 1200 m a.s.l. and water
temperatures vary between 40 and 55°C. The third structure, named Velicne structure, is
located roughly between Parnica and Oravska Poruba villages. Carbonates building the
structure are developed at depths of -400 to -1800 m a.s.l. and temperatures vary from 35 to
70°C. The structure of Male Borove is built by Triassic carbonates of the Choc nappe.
Carbonates can be found at depths of +800 up to -600 m a.s.l. and the temperature at their
bottom is 10 – 50°C.
Value of the free outflow, documented by long-term hydrodynamic test performed on OZ-2
Oravice geothermal well, reached 86.8 l/s with a water temperature of 52.5°C on the well
head. The exploitable amount was estimated using the mathematical model of 65 l/s by the
maximum depression of 0.331 MPa. Natural resources of the geothermal energy represent
24.0 MWt, from which 4.0 MWt are bound to the Choc nappe, representing 48 l/s of
geothermal waters with the temperature of 28 – 35°C on the well head. The remaining 20
MWt are bound to Kríţna nappe, representing 118 l/s of geothermal waters with temperatures
of 43 – 60°C on the well head.
3.3.7 Central depression of the Danube basin – Galanta area
The central depression of the Danube basin – Galanta area (Bondarenkova et al., 1998) is
represented by Galanta depression and its closest surroundings. It stretches to Senec and Zlate
Klasy surroundings in the West, and down to the connection line Zlate Klasy – Horne Myto –
Kralov Brod in the South. The eastern border is delineated by villages Ziharec, Selice,
Trnovec and Dlha nad Vahom and the northern border continues from Vahovce through
Dolna Streda, Majcichov and Cataj up to Senec.
Two depth intervals 1200 – 1600 and 1600 – 2100 m differ by qualitative parameters of
geothermal waters bearing in aquifers. The first level consists of sequences of the Pontian up
to the upper Pannonian sediments. They are built of sands, partially by clayey sands. The
total thickness of the sediments is 400 m. Layers decline in the southern to southwestern
direction. The total area of aquifers is 322 km2. The second group of aquifers consists of
sequences of the lower Pontian up to the upper most Sarmatian ages. Aquifers are built by
fine to middle grained sands, locally by weakly cemented sandstone. The total thickness of
the sequence reaches up to 500 m.
Petrogenic geothermal waters occur in the area. They are of Na-HCO3 type with the value of
TDS up to 1g/l, or Na-Cl type with TDS up to 10 g/l (Fendek and Fendekova, 2005).

15
The Galanta area can be characterized as an area with high geothermic activity. The average
value of the temperature at a depth of 1000 m is 50.3°C, at a depth of 1500 m it reaches
69.6°C, at a depth of 2000 m up to 88.5°C and at the depth of 2500 m up to 106.0°C. The
average value of the geothermic gradient was estimated to be 40°C/km, and the main part of
the area can be characterized by the heat flow density value of 78 MW/m2. The value of the
heat flow density varies in the interval of 71,4 – 81,6 mW/m2 with an average value of 76,8
mW/m2.
The value of the specific thermal-energy potential of the natural amount of groundwater at a
depth of 1200 m varies, ranging from 0.420 to 4.288 GJ/m2 with a mean value of 2.074
GJ/m2. At a depth of 1600 m the value ranges in the interval 0.747 – 3.809 GJ/m2 with an
average value of 1.161 GJ/m2.
The total exploitable amount of geothermal water was estimated using a mathematical model.
The total withdrawal of geothermal water (taking into account also existing geothermal wells)
has the value of 176.0 l/s which represents 39.77 MWt of thermal energy. Results of the
model and performed geothermic balance estimation were in agreement.
3.3.8 Ziar basin
A geological-geophysical interpretation of the latest results gained by geothermal
investigation in the Ziar basin (Remšík et al., 2000) was used for compilation of a new
morphological-tectonic and geological scheme of the Pre- Tertiary basement. A map of the
surface and thicknesses of the Choc nappe carbonates, Velky Bok series and Kríţna nappe
was compiled as well. Pre-Tertiary basement is built by Choc nappe sequences. In the south-
eastern and northwestern parts Triassic carbonates prevail, in the central part Ipoltica series
(shales, sandstone) is a main building element. In the deeper part, under the Choc nappe,
Mesozoic sequences (Triassic-Cretaceous) of the Velky Bok series and Kríţna nappe are
developed. Heat flow density ranges in the interval between 80–100 mW/m2, with a
characteristic value of 95 mW/m2. A large (central) part of the Pre-Tertiary basement of the
basin can be characterized by temperatures of 100ºC and higher at depths of -2100 m a.s.l.
and deeper. The highest temperatures are in the central part of the basin in a partial
depression between Lovca and Ziar nad Hronom where at depths from -3400 to -3500 m a.s.l.
the temperature is about 130°C.
The upper hydrogeothermal structures are built by Triassic carbonates of the Choc nappe It is
supposed that they contain geothermal waters with reservoir temperatures of 20–150ºC at
depths from 200 up to 4100 m a.s.l. Triassic carbonates of the Velky Bok series or Kríţna
nappe built the lower hydrogeothermal structures where, at depths from 600 up to -4700 m
a.s.l., geothermal water with reservoir temperatures from 30 up to 160°C could be reached.
The chemical composition of geothermal water in the Ziar basin is probably of Ca-Mg-SO4,
and Ca-Mg-SO4- HCO3 type with the amount of TDS 2 – 4 g/l. CO2 or H2S gases could be
present as well. The specific thermal-energy potential of the natural geothermal water for
Triassic carbonates of the Choc nappe was estimated to be 0.091 – 6.307 GJ/m2, with an
average value of 3.251 GJ/m2. For Triassic carbonates of the Velky Bok series and Kríţna
nappe it was estimated to be 0.329 – 3.658 GJ/m2 with an average value of 2.357 GJ/m2.
The amount of natural geothermal water with a temperature of 60°C (Sklene Teplice
structure) and 110°C (Ziar structure) represents 65.3 l/s, which is equivalent to 22.296 MWt
of prognostic geothermal energy from the natural resources (Fendek and Fendekova, 2005).

16
Table 1 – Summary of geothermal areas in Slovakia
Locality Aquifers
Depth of
perforated
intervals
[m]
Discharge
[l/s]
Water
temp.
[°C]
Heat
power
[MWt]
T.D.S.
[g/l]
Chemical
type of
waters
Komarno
block
Triassic
dolomites,
limestones,
Neogene
sandstones,
conglomer
ates
77-1761 5,5-70 20 -56 0,12-7,33 0,7-90
Ca-Mg-
HCO3-So4
Na-Cl ,
mixed type
Central
depression
neogene
sands,
sandstones,
conglomer
ates
276-2487 0,3-25 23-91,5 0,13-6,80 0,5-8,3
Na-HCO3,
Na-HCO3-
Cl
Dubnik
Depression
Badenian
sandstones,
conglomer
ates
745-1905 1,5-15 52-75 0,25-2,40 10-30 Na-Cl, Na-
SO4-Cl
Levice
Block
Badenian
clastics,
Triassic
dolomites
995-1740 28-53 69 - 80 6,3-14,42 19,2-19,6 Na-Cl
Komjatice
depression
pannonian
sands,
sandstones
1509-1700 12 78 2,5 20,1 Na-Ca-Cl-
HCO3
Bánovce
basin
Triassic
dolomites 1512-2025 2,0-17 40-55 0,33-1,78 0,7-6,0
Na-HCO3-
Cl-SO4,
Na-Cl
Upper Nitra
basin
Triassic
limestones,
dolomites
1677-1851 26,9 66 4,85 0,93 Ca-Na-Mg-
HCO3-SO4
Liptov
basin
Triassic
dolomites,
limestones
1315-286 6-31 32-62 0,43-5,89 0,5-4,8
Ca-Mg-
HCO3-SO4,
Ca-Mg-
HCO3
Poprad
basin
Triassic
dolomites 835-1983 20-33 46- 59 2,58-6,08 3,0-4,0
Ca-Mg-
HCO3-SO4
Skorusina
Mts.
Triassic
dolomites 950-1565 100 54 16,3 1,2
Ca-Mg-
HCO3-SO4
Viena basin
Triassic
dolomites,
limestones
1242-2570 12-25 73- 78 2,91-6,59 6,8-10,9
Na-Ca-Cl-
SO4,
Ca-Mg-
HCO3

17
4 CHARACTERISTICS OF STUDY AREA: POPRAD BASIN
4.1 Geomorphologic classification
The Subtatric basin is a geomorphological unit situated in northern Slovakia. It is part
of province Western Carpathians, sub-province Inner Western Carpathians (Figure 4.1) and
Fatra-Tatric area. The Subtatric basin is one of the high laid basins in Slovakia.
It is bound on all sides to geomorphological units. In the North they are the Choč mountains,
Tatra mountains and Spiš Magura, in the East the Levoča mountains, in the Southeast is the
Hornad depression, in the South are the Kozie chrbty and Nízke Tatry mountains and in the
West the Veľká Fatra mountains.
The Subtatric basin is divided into two units: the Liptov basin in the West and the
Poprad basin in the East. The study area is situated mainly in the Poprad basin, more to the
southeast near the Hornad depression (Figure 4.1)
Figure 4.1 - Location of study area in geomorphological units in Slovakia (Mazúr and
Lukniš, 1986)

18
4.2 Climatic conditions
From a climatic point of view, the Poprad basin area, the west and central part of the Hornad
basin, belongs to a temperature zone with western air flow. It is a mildly warm area, mildly
humid with cold winters characteristic of valleys.
In terms of climatic-geographic types, this area has a mildly warm to mildly cold basin
climate. Annual average air temperature is 6,4°C. Global sun radiation is 104 – 106 kcal.m-2
.
In the summer it is typically 41 – 42 kcal.m-2
and in winter it is usually around 10 kcal.m-2
.
Relative sun outshine is 44 – 46 %.
The number of summer days with a max. temperature › 20°C is 20–40. The area has around
130 – 136 frost free days. The number of days in which the average temperature is under 0°C
is roughly 98 - 115. Heating season starting on 15.9. and is 238 – 250 days long. The warmest
month is July and the coldest is January. Mountain influences in annual temperatures mean
that autumn is warmer than spring. Daily temperature (the difference between maximum and
minimum temperature) is highest in the end of the summer and reaches 16°C; in December it
drops to 7°C.
4.3 Geologic characteristics
Poprad basin is, from a geological standpoint, Inner Carpathian Paleogene (Figure 4.2). In the
North the basin is Inner Carpathian Paleogene, with sharp bounded elevations of the West
Tatra Mountains, which are created by crystalline units (Kryštalinikum). In the South it is
Inner Carpathian Paleogene, bounded by the Low Tatra Mountains, which have similar sharp
boundaries like those in the North.
Figure 4.2 – Geologic position of the Inner Carpathian Paleogene basin, location of Poprad
basin and Gerlachov area
Stratigraphic units in the studied area are: upper unit, which is for geothermal exploitation,
with a negligible layer of Post-Tertiary sediments. Under this layer is a thick unit created by

19
Paleogene sediments made up of claystones and sandstones. Under this unit are Mesozoic
sediments which are created by carbonate rocks,–in this unit carbonates are geothermal
deposits. The Mesozoic unit is divided into 3 base units in this area: Choč nappe, Kríţna
nappe and the envelope Mesozoic. All units have complicated tectonic structure, which
influences the property of geothermal deposits. The undermost unit is basement, crystalline
rock.
In this work two 3 D reservoir models will be designed.
One is a model of Poprad basin and the northern part of
Hornad Basin, and the second is a detailed model from
Gerlachov area, which is situated in Poprad basin
(Figure 4.4) The geologic composition of Gerlachov is
showed in (Figure 4.3).The highest unit is the Post-
Tertiary sediments unit, which is not important for this
research. Under this unit is thick Paleogene sedimentary
filling, made up of claystones and sandstones rocks.
Under this unit is a layer of Mesozoic sediments. Those
are built mainly by carbonate rocks, where a geothermal
deposit is expected. The Mesozoic unit is divided into
three subunits, which make up the study area: Choc
nappe, Kríţna nappe and Mesozoic envelope. The
lowest unit is Crystalline basement. All units in the
studied area are described in the next chapter.
Figure 4.4 - Geological map of study area: Poprad basin, North part of Hornad basin and
Gerlachov area (Polák et.al.,2008)
Figure 4.3 - Geologic composition
of Gerlachov area
Gerlachov area
20
4.3.1 Geologic composition
In the area of the Poprad Basin, rocks of following geological units and formations are found:
Post-Tertiary
Paleogene
Choc nappe of Hronicum
Younger Paleozoic of Hronicum
Kríţna nappe
Mesozoic of Tatricum envelope
Crystalline of Tatricum
In the area of Hornad Basin, rocks of the following geological units were found and assumed:
Post-Tertiary
Paleogene
Vernar nappe of Silicicum
Muran nappe of Silicicum
Younger Paleozoic of Gemericum
Choc nappe of Hronicum
Post-Tertiary
Sediments of the Post-Tertiary unit overlap the Paleogene basin‘s fill as well as older units on
the border of the basin.
The biggest representation is seen in moraine. They are augmented from the Tatra foothills to
the Poprad Basin in the form of flat glaci-fluvial cone.
Glacial moraines are gravel-boulder sediments with thicknesses of 63–92 m. Glaci-fluvial
cones with thicknesses up to 20 m are represented by thick layers of boulders and gravel. The
composition of the sediments is mainly granitoids of Tatricum. The sediments are old to
young Pleistocene, less than Holocene age. The rest of the Poprad Basin, the Post-Tertiary
unit is represented mainly by deluvial, loam waste Paleogene sub-base. This is shown in
Figure 4.5. The Pre-Tertiary unit of Hornad Basin has the same evolution as that of Poprad
Basin.
Paleogene
The Paleogene rock sequences of Poprad Basin are quite large, and they overlap geothermal
aquifers. Paleogene (upper Lutet–lower Oligocene) in both basins is built by Borovske,
Hutianske and Zuberecke groups of strata.
In Borovske group of strata, on the base of Paleogene we can see the composition of rocks
and how they were deposited. On Choc Nappe, mesozoicum is a group of strata created by
carbonates breccias, conglomerates, sandstones and in Western part of Poprad Basin,
limestones. In this case, because of the permeability of cavern faults, groups of strata can
indicate a geothermal aquifer. In the upper part of the strata are sandstones and claystones
giving way to small grainy conglomerates. Thicknesses of Borovske strata in Poprad Basin
21
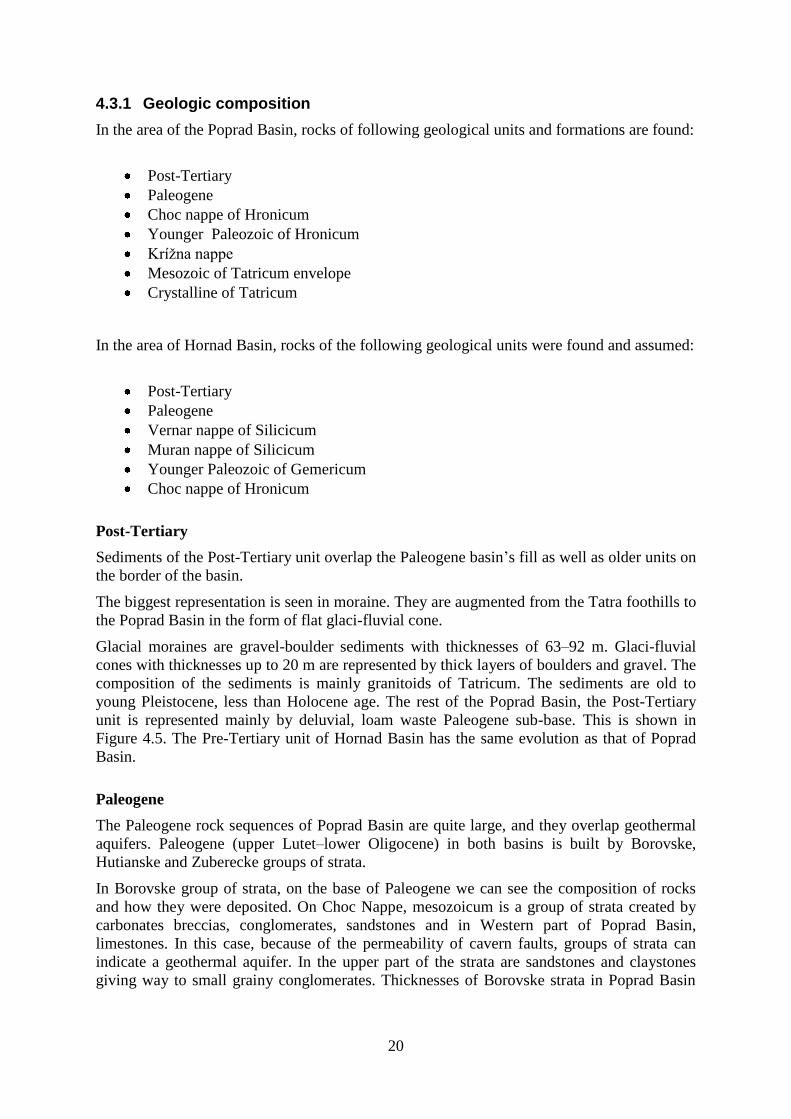
are from 5 m (HV-3) to 14,5 m (Vr1). In the Southern part of basin are thicknesses of 10 –
50 m. In Hornad Basin, thicknesses from 29 (HKJ-4) to 114 m (HKJ-2) were documented.
Figure 4.5 - Post – Tertiary thicknesses around Gerlachov
Hutianske group of strata have similar lithologic composition in both basins. In this strata are
claystones and siltstones of gray and dark gray colors. In some places sandstones can be
found. Thin layers of Mn-ores are evolved in the southern part of Poprad Basin. Thicknesses
of strata between the basins are different. The following thicknesse can be found in boreholes
in Poprad: FGP-1– 525 m and Vr-2 – 773 m, PP- 1 - 423 m. Thicknesses of Hutianske strata
in Hornad Basin are smaller: borehole BS-3 -67 m, HKJ-3 -186 m and in DH-1 -490 m.
Zuberecke group of strata is characterised by alternating gray and dark gray claystones,
siltstones and sandstones. Sandstones are fine-grained to coarse-grained. Usually muscovite
is found in sandstones, and micro-layers of coal are locally found in claystones and siltstones.
In Poprad Basin the largest thicknesses are found in boreholes Vr-2 –708 m and FGP-1 –880
m. In Hornad Basin, smaller thicknesses are found: borehole DH-1 –260 m, BS-3 –187 m,
HKJ-3 –156 m.
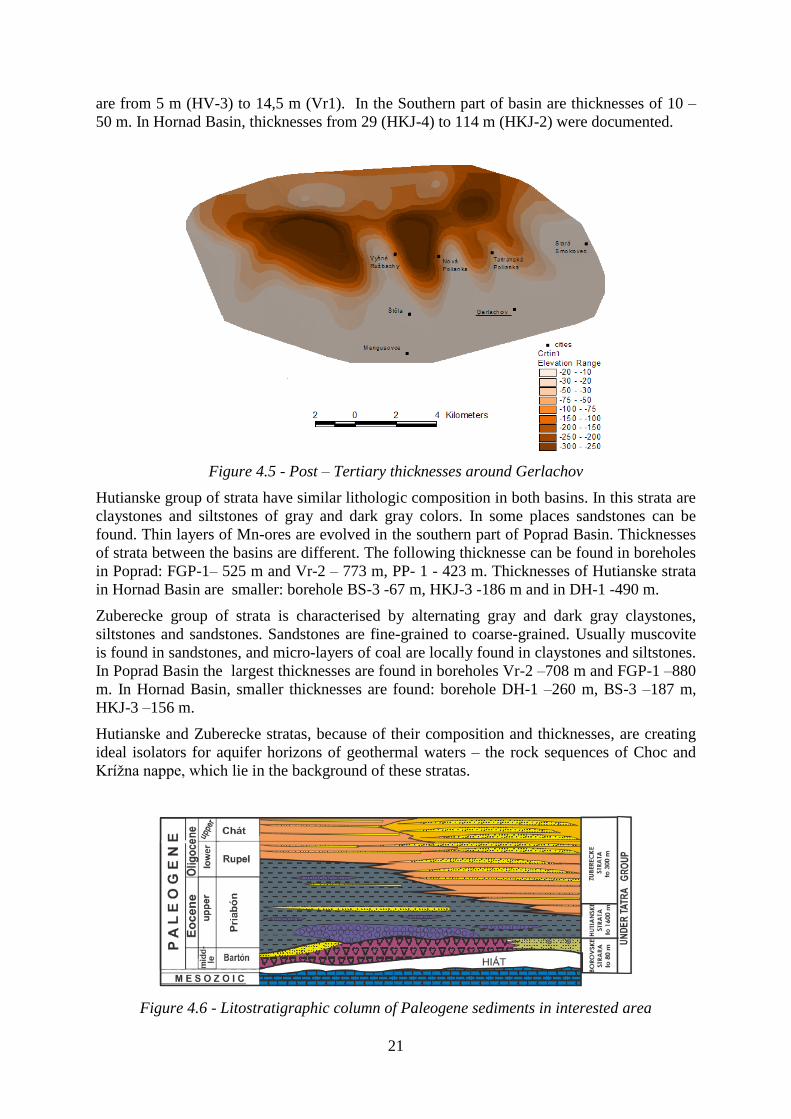
Hutianske and Zuberecke stratas, because of their composition and thicknesses, are creating
ideal isolators for aquifer horizons of geothermal waters – the rock sequences of Choc and
Kríţna nappe, which lie in the background of these stratas.
Figure 4.6 - Litostratigraphic column of Paleogene sediments in interested area

22
Choc nappe
In the studied area, the rock sequences of Choc nappe contain the main geothermal aquifer.
Nappe with rock filling are known from surface data of the middle and western parts of the
Kozie Mts. and from boreholes in Poprad Basin. Carbonate rocks of nappe are only found in
the northern part of Hornad Basin.
In Kozie chrbty, on the border of Poprad Basin, the main rocks of the nappe are gray colored
dolomites. Dolomites are fine-grained sludges, and are rarely crystalline. In tectonics zones
dolomite breccias are common. Foliation and lamine beddings are common in upper Triassic
dark dolomites, while at another site they are rare in middle Triassic brighter dolomites.
Layer inclination is, on average, 20–50° to the north, north-east. They belong to the main
dolomite (karn – norik) and dolomite of Ciernovazska facial zone (anis-norik). Thicknesses
are 400–500 m, and in some places up to 1000 m. Other important stratigraphic layers have
gutenstein layers (limestones with dolomites parts, breccias thickness to 250 m). Less
important layers have reiflings limestones and lunzke layers (shales and sandstones).
For the characterization of Choc nappe filling, 4 boreholes are important: FGP-1, Vr-2, Vr-1
and PP-1. Choc nappe rocks which were documented in the mentioned boreholes include:
Table 2 - Choc nappe borehole descriptions
Borehole FGP-1 Stara Lesna
Depth (m) Thickness(m) Rocks type, geologic age
1440-1730 290 Main Dolomite – norik
1730-1820 90 Reiflings limestones – ladin – spodný karn
1820-1865 45 Ramsau dolomites – upper anis – ladin
Together 425
Borehole Vr-2 Vrbov
Depth (m) Thickness(m) Rocks type, geologic age
1488-1951 463 Compact dolomite, light-gray to brown-gray, flawed by
tectonics, calcite within faults
Borehole Vr-1 Vrbov
Depth (m) Thickness(m) Rocks type, geologic age
1495-1640 145 Crystalline dolomite, strong fissured, karsified – upper trias
1640-1725 85 Black claystones with thin carbonate layers, Lunzke layers,
Karn age
1725-1742 17 Crystalline dolomite – middle trias
Together 247

23
Borehole PP-1 Poprad
Depth (m) Thickness(m) Rocks type, geologic age
643,3-823,4 180,1 Dark-gray and gray fine-grained dolomites and breccias
dolomite, often decaying to pieces and brash, upper trias
823,4-836,4 13,0 Dolomite brash with dolomite pieces and dark shales –
lunzke layers, karn age
836,4-1155 18,6 Gray and light-gray fine-grained dolomite
1155-1193 38,0 Dark-gray cavernous dolomite limestones with calcite
grains
1193-1205 12,0 Light-gray fine-grained dolomites and brash. From
836,4 m middle trias
Together 261,7
Younger Paleozoic of Hronicum
Rocks of this unit are present up to the Paleogene level in the southern part of Poprad Basin
in Kozie chrbty. Younger Paleozoic rock has been associated with the Bocky nappe of
Hronicum. In the area of Kozie chrbty these rocks belong to the Ipoloticka group, generated
by the Maluzina group of strata (perm) and also Niznobocianske strata (upper carbon). Perm
rock sequences are predominant, with thicknesses of 1,5 - 2 km and they are made by colorful
conglomerate sandstones, shales, and locally by evaporites, alkaline rocks and puff-stones.
Stratas and layers are in an east-west direction, with 10°– 40° incline to the north.
Krížna nappe
Nappe rock fillings are known from surface data in Belianske Tatry , Ruzbassky ostrov and
from boreholes FGP-1 and Vr-2 in Poprad Basin.
In the Belianske Tatra Mts., rocks are over 1500 m thick. The main rocks are ramsau
dolomites, limestones of Jura age, keuper layers and dark Triassic limestones. The incline of
the layers is around 30° to the north.
In Ruţbašský ostrov part have nappe sequence to 950 m thicknesses. Dominant rocks
(approx. 859 m, 90%) are various dolomites, breccia dolomite, less limey claystone and
claystones. Some less frequently found rocks in the area are quartz sandstones and quartzite.
Kríţna nappe sequences of Poprad basin were documented in two boreholes. Borehole FGP-1
bore the nappe to the Mesozoic strata of the Tatricum envelope, and borehole Vr – 2 ended in
Kríţna nappe.
Figure 4.7 shows a Litho-stratigraphic table of Kríţna nappe

24
Table 3 - Krížna nappe borehole descriptions
Borehole FGP-1 Stara Lesna
Depth (m) Thickness(m) Rocks type, geologic age
1865-2138 273 Low sandy limestone, back, organodetric limestone with
shale layers, apt – low alb age
292 Limestone in fragments, marly, black, marly shale,
Barém - Valangin age
2430-2525 95 Marly limestone, Titón - Berias
2525-2560 35 Limestone, low marly, fine-grained, fragments of red shales,
Kimeridţ age
95 Sandy limestone, organodetric, fine-grained, shales, dark
gray, black
2835-3310 475 Carpat keuper – norik Group of strata
Together 1445
Borehole Vr-2 Vrbov
Depth (m) Thickness(m) Rocks type, geologic age
1951-2083,5 132,5 Limey claystone, faulted by tectonics, with coal mass,
calcite within faults, lower Krieda - Neokom
2083,5-2321 237,5 Compact dolomite, gray, flawed by tectonics, calcite
within faults
2321-2502 181,0 Limey claystone, dark gray, faulted by tectonics, with coal
mass, calcite within faults,
Together 551,0
Mesozoic of Tatricum envelope
Rocks of the Tatricum envelope were documented in the northern part of the basin, in the
Belianske Tatra Mts. The envelope documented by borehole FGP-1 is in the middle part of
the basin.
In an envelope in the Belianske Tatra Mts. can be found quartzite, conglomerates, silicious-
sandstones and shales and, in a few isolated cases, gutenstein layers – dark limestones and
bright dolomites. In borehole VRS-1 are non-carbonate rocks– sandstones, silicious-
sandstones, quartzite in absolute superiority. They are assigned to the Triassic age. A deeper
group of strata is compose of colorful shales, wacke sandstones, conglomerates and belongs
to the lower Trias to Perm.
In the Tatricum envelope, Carbonatic rocks have been found in very small concentrations;
therefore we can say that this area is not suitable for geothermal water circulation. The
Tatricum envelope is documented by borehole FGP-1 and has the following structure:

25
Table 4 - Tatricum envelope borehole description
Vrt FGP-1
Depth (m) Thickness(m) Rocks type, geologic age
3310-3320 10 Limestone, shale, light siliceous – Doger age
3320-3450 130 Limestone, shale, marly, black – upper Lias age
3450-3510 60 Limestone, shale, sandy, black, dark gray, lower Lias - Ret
3510-3616 106 Quartzite, pink, gray – lower Trias
Together 306
Figure 4.7 - Krížna nappe Litho-stratigraphic table

26
Crystalline of Tatricum – basement
Close to the High Tatras are two dominant rock groups: biotite granodiorite, with tonalities
passing to muscovite-biotite granitoids. We can assume that there is continuation in the
Poprad basin mesozoicum envelope. Tatricum crystalline reach to the south is not known, but
it can be assumed that in the southern part of the basin these crystalline formations have
contact with veporic crystalline formations.
4.4 Tectonic composition
In the studied Poprad basin area, on the beginning of Miocene were moving processes with
folded and faulted structures starting. It started structures with East-West direction form:
Tatra mega-anticlinal
Poprad basin synclinal
Low Tatra mega-anticlinal
Tatra mega-anticlinal have asymmetric form, with steep inclination to the south totaled by
crystalline. Choc-under Tatra fault bonded crystalline formations with Mesozoic envelope
areas and nappes to south. In Poprad basin this fault is generated by a 3-5 km wide parallel
faults system with 50 – 60° incline to the south and southeast. From the Baden age to now
there has been an intensive uplift of the Tatra Mts. and a relative drop of the Poprad basin. It
is expected that the uplift will reach approx. 5000 m.
The syncline of the Poprad basin has a west-east direction with a twist to the northeast.
The oldest faults are situated in a deep Paleogene base filling. Sub-horizontal border lines of
Choc nappe, Kríţna nappe and Mesozoic envelope make tectonic nappe surfaces. These are
documented in boreholes FGP-1 and VR-2 (Choc and Kríţna nappe contact), VRS-1 (Kríţna
nappe and Tatricum envelope contact).
Poprad basin is bounded by a fault under the Tatra in the North and North-West. In the South
this basin is bounded by west-east faults parallel with Kozie chrbty. In the south-eastern part
of the basin is the 0,5 km wide Vrbov fault zone. The fault zone starts from Kozie chrbty, lies
on the east side of Vrbov and goes to the north-east. The fault has a rapid incline to the
northwest and borders the Choc nappe Mesozoic. Inside the Poprad basin, between Under
Tatra and Vrbov fault, the fault system was interpreted. The faults have north-east directions
and drop characters, which is the reason for the elevations and depressions form of the
basin‘s sub-base. In the West, between Tatranska Strba and Gerlachovo, the sub-base dropps
1000 m.
The western part of Hornad Basin is situated on the mega-anticline Spis-Gemer Rudohorie. In
this basin, Paleogene and sub-base structure three fault systems are formed. In the North are
west-east faults, which follow the elevation of Kozie chrbty. The most common are
southwest–northeast direction faults in the western part of the Hornad basin. Under the most
important Muran fault is Paleogene contact with younger Paleozoic strata of Hronicum with
dolomites of Vernar nappe. Blocks of basin filling are drooped on the faults to the East.

27
4.5 Hydrogeological characteristics
Based on hydrogeological regionalization of Slovakia (Šuba et al., 1984) the studied area
belongs to the following hydrogeological zones (Figure 4.8):
PQ 115 Paleogene of Hornad and Poprad Basins
P 119 Paleogene of Levoča Mts.
QG 139 Crystalline of High Tatras and their Post-Tertiary foreland
Partially intervened to this area are the following hydrogeological divisions:
MG 116 Mesozoic of Slovensky raj and Havranie Mts. with Paleozoicum
M 140 Mesozoic of Kozie chrbty part
Figure 4.8 - Hydrogeological regionalization of Slovakia (Šuba et al., 1984)
PQ 115 Paleogene of Hornad and Poprad Basin
This area is divided into a subarea of Paleogene in the Hornad Basin and a subarea of
Paleogene in the Poprad Basin. Special attention will be given to a partial area in the south-
western part of PQ 115 that contains a ―melaphyre series‖.
This hydrogeological area is constructed of low watered claystone (Hutianske) and sandstone
(Zuberecke) groups of strata of the Under-Tatra Mts. group (Gross et al.. 1984), which have
low permeability. The partial area of ―melaphyre series‖(ipolitic group – Vozárová - Vozár
1981) contains sandstones, shales, melaphyres and arkose outrcoppings of Permian age on the
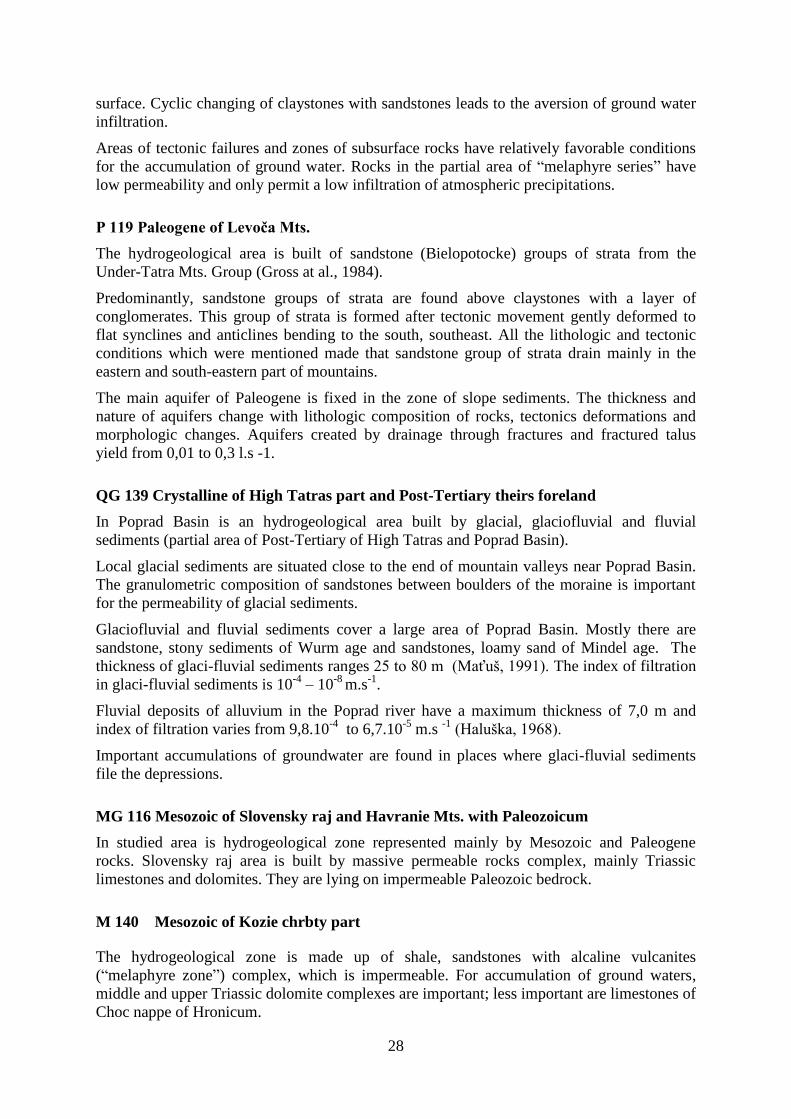
28
surface. Cyclic changing of claystones with sandstones leads to the aversion of ground water
infiltration.
Areas of tectonic failures and zones of subsurface rocks have relatively favorable conditions
for the accumulation of ground water. Rocks in the partial area of ―melaphyre series‖ have
low permeability and only permit a low infiltration of atmospheric precipitations.
P 119 Paleogene of Levoča Mts.
The hydrogeological area is built of sandstone (Bielopotocke) groups of strata from the
Under-Tatra Mts. Group (Gross at al., 1984).
Predominantly, sandstone groups of strata are found above claystones with a layer of
conglomerates. This group of strata is formed after tectonic movement gently deformed to
flat synclines and anticlines bending to the south, southeast. All the lithologic and tectonic
conditions which were mentioned made that sandstone group of strata drain mainly in the
eastern and south-eastern part of mountains.
The main aquifer of Paleogene is fixed in the zone of slope sediments. The thickness and
nature of aquifers change with lithologic composition of rocks, tectonics deformations and
morphologic changes. Aquifers created by drainage through fractures and fractured talus
yield from 0,01 to 0,3 l.s -1.
QG 139 Crystalline of High Tatras part and Post-Tertiary theirs foreland
In Poprad Basin is an hydrogeological area built by glacial, glaciofluvial and fluvial
sediments (partial area of Post-Tertiary of High Tatras and Poprad Basin).
Local glacial sediments are situated close to the end of mountain valleys near Poprad Basin.
The granulometric composition of sandstones between boulders of the moraine is important
for the permeability of glacial sediments.
Glaciofluvial and fluvial sediments cover a large area of Poprad Basin. Mostly there are
sandstone, stony sediments of Wurm age and sandstones, loamy sand of Mindel age. The
thickness of glaci-fluvial sediments ranges 25 to 80 m (Maťuš, 1991). The index of filtration
in glaci-fluvial sediments is 10-4
– 10-8
m.s-1
.
Fluvial deposits of alluvium in the Poprad river have a maximum thickness of 7,0 m and
index of filtration varies from 9,8.10-4
to 6,7.10-5
m.s -1
(Haluška, 1968).
Important accumulations of groundwater are found in places where glaci-fluvial sediments
file the depressions.
MG 116 Mesozoic of Slovensky raj and Havranie Mts. with Paleozoicum
In studied area is hydrogeological zone represented mainly by Mesozoic and Paleogene
rocks. Slovensky raj area is built by massive permeable rocks complex, mainly Triassic
limestones and dolomites. They are lying on impermeable Paleozoic bedrock.
M 140 Mesozoic of Kozie chrbty part
The hydrogeological zone is made up of shale, sandstones with alcaline vulcanites
(―melaphyre zone‖) complex, which is impermeable. For accumulation of ground waters,
middle and upper Triassic dolomite complexes are important; less important are limestones of
Choc nappe of Hronicum.

29
Drain of the interested area
Outflow of the water from Poprad and Hornad Basins is realized by the Poprad and Hornad
rivers. The Poprad river is fed by runoff from the Poprad Basin and flows to the Baltic sea
and the Hornad river is runoff from the Hornad Basin and flows to to the Black sea.
Poprad river
The Poprad river is 169 km long and surface 1 889,2 km2 all of river-basin in Slovak area.
Runoff largely comes from the southern and south-eastern slopes of the High Tatras, the
Belianske Tatras, Spis Maruga and Lubovinianska highlands, the Levoca Mts., the Cergov
north-western slopes and the Poprad Basin. In the gauging station Strazky (670 km2) the
average annual flow is 9,03 m 3.s
-1, max. 383 m
3.s
-1, and the minimum average daily flow is
1,38 m3.s
-1.
Hornad river
The Hornad river stretches 186,3 km through the Slovak area. The river is fed by runoff from
the Levoca Mts., Branisko, Cierna mount, part of the Saris highlands, Cergov and Slanske
Mts., the eastern part of Slovenske Rudohorie, and the Hornad and Kosice basins.
In the gauging station Kysak average annual flow is 19,4 m 3.s
-1. Documented maximum flow
is 689 m3.s
-1 and minimum flow is 2,5 m
3.s
-1.
4.6 Hydrogeothermal characteristics
The main area of interest in terms of existent geothermal waters is the Levoča basin (Franko,
1979), mostly its western and south-western parts.
The term ―Levoča basin‖ was introduced by Franko (1979) as it contains geothermal aquifers
(Triassic dolomites and limestones) in basined position. The vast Levoča basin is separated
by faults from the Klippen Belt in the north and northeast and borders the Tatry in the
northwest, as well as eastern tracts of the Nízke Tatry, Slovenské Rudohorie and Čierna hora
Mts. in the south. The western branch of the Hornád fault separates it from the northern
Košice Basin. The Branisko horst is confined by faults in the west and east, and stretches
from the Slovenské Rudohorie northward, and also into the Levoča Basin. The Ruţbachy
inlier rises from the subtratum of the Paleogene between the Spišská Magura and Levočské
vrchy Mts. In the southeast, the inlier is lined by a fault representing a continuation of the
Subtatric fault.
The basin is filled with the Inner Carpathian Paleogene, composed of a tens-of-meters thick
basal conglomerate formation and an overlying flyschoid formation up to 4000 m in
thickness.
The Pre-Tertiary substratum of Levoča basin has a few characteristic features. The Ruţbachy
elevation stretches between the Tatry and Ruţbachy and a similar one extends in the south as
a continuation of the Vikartovský chrbát Ridge and as far as the Branisko Mts. The
substratum surface between these two elevations declines from the Štrbský chrbát Ridge
(separating the Liptov Basin from the Levoča Basin) in the northeast to a depth of more than
2500 m south of Stará Ľubovňa, from where it continues to decline in a narrow belt along the
Klippen belt to a depth of 4000 m north of Prešov. A shallow trough (Hornád trough) has
evolved between the Vikartovský chrbát Ridge in the north and Nízke Tatry and Slovenské
Rudohorie in the south. From the edge of the Čierna hora, the Pre-Tertiary substratum

30
plunges to the northeast, first gently, then steeply towards the Klippen Belt. The Pre-Tertiary
substratum of the Spišská Magura dips gently from the Tatry and Ruţbašský chrbát Ridge
towards the northeast to a depth of 2000 m.
The geologic structure of the pre-Tertiary substratum includes all tectonic units of the Inner
West Carpathians. The Gemeric Paleozoic and Mesozoic complexes of the Galmus and
Stratenska hornatina Mts. extend into the southern tract of the Spiš Basin below the
Paleogene. To the north the pre-Tertiary substratum consist of a wide belt of the Choč nappe,
which stretches as far as north of the Branisko. Tertiary rocks of the Šarišská Vrchovina rest
on the Permian-Mesozoic envelope. It is assumed that Paleogene in the Levoča basin, i.e. the
Spišská Magura, Levočské vrchy and a whole belt along the Klippen Belt as far as Prešov, is
underlain mostly by the Kríţna nappe. The Ipoltica Group and a part of the Choč nappe in the
south of the basin rest on the Mesozoic envelope of the Veporic crystalline (Veľký Bok
series), whereas the Kríţna nappe in the central and northern sectors overlies the Tatric
envelope Mesozoic. The Mesozoic complexes in different units reach different depths. The
southern Šarišská Vrchovina and Klčov area at a depth of 1000 m are dominated by the
crystalline unit (crystalline schists, granitoids) whose extent grows with depth. The
Ruţbachy elevation at 3000 m is presumably also composed of granitoids, while the southern
and central sectors of the basin at this depth are filled with the veporic and Tatric envelope
Mesozoic. The Kríţna nappe is expected at this depth in a belt fringing the Klippen Belt and a
depression south of Stará Ľubovňa. At 4000 m the basin is dominated by the crystalline unit,
while Mesozoic elements are probably confined to a belt along the Klippen Belt and to the
Vikartovský chrbát Ridge area. At 5000 m the whole Levoča Basin is underlain by the
crystalline unit except for a narrow strip along the Klippen Belt.
Geothermal activity in the area (Fendek et al. 1992, Franko et al. 1994a) is medium and
rangers from 61,8 to 77,0 mW.m-2
,averaging 66,8 mW.m-2
. Activity in the geothermal field
rises from the margins of adjacent mountains towards sunken sectors of the basin. It exceeds
70 mW.m-2
in the Spišská Magura area, 65 mW.m-2
in the Levočské vrchy, and 75 mW.m-2
along the Klippen Belt towards the southeast. The temperature field has a similar pattern,
with temperatures ranging from 30 to 45°C. Geothermal aquifers, i.e. Triassic carbonates of
the Tatric and Veporic envelope units, as well as Kríţna and Choč nappes, reach depths of
1000-4000 m where aquifer temperatures vary from 37 to 109°C. In the depth interval 2000-
4000 m the temperatures ranges from 61-109°C.
Evidence of geothermal activity in the area concerned includes natural thermal springs at
Gánovce (Struňák, 1994), Baldovce (Haluška-Petrivaldský, 1994), Lipovce (Malík, 1994)
and Vyšné Ruţbachy (Mlynarčík-Petrivaldský, 1990). The springs at Baldovce (including
Sivá brada) are recharged from carbonates of the Tatric and Veporic envelope units, those at
Vyšné Ruţbachy from Kríţna nappe carbonates, and those at Gánovce and Lipovce from
Choč nappe carbonates. The existence of the waters at these localities has been proven by
shallow wells. Deep wells have proven geothermal water occurrences in the above tectonic
units at Klčov (Biely at al. 1965), Lúčka (Haluška-Petrivalský, 1994), near Baldovce (Tatric
and Veporic envelope units), at Plavnica, Lipany, Šariš (Fendek et al. 1992, Kríţna nappe),
Vrbov (Fendek et al. 1992), Poprad (Choč nappe, Daniel, 1994, pers. comm.), Arnutovce and
Letanovce (Vernár nappe, Jetel et al. 1990). Waters from springs and shallow wells are 13,6-
26,7°C and those from deep wells 19-107°C. The transmissivity coefficient T of Vernár
nappe carbonates intersected by these wells is 1,4 . 10 -3
– 8,8.10 -4
m 2
. s -1
, the coefficient in
wells Vr -1 and Vr-2 in the Choč nappe is 1,2 – 6,4 . 10-4
m 2
. s -1
, in Kríţna nappe
carbonates intersected by wells VRŠ-1, Vr-2, 5 and 9 at Vyšné Ruţbachy 2,2 -2,3.10-5
m2.s
-1.

31
Geothermal waters hosted by Vernár nappe carbonates are of Ca(Mg)-HCO3 type and those
bound to Choč nappe carbonates discharged by shallow and deep wells alike are of Ca(Mg)-
HCO3 type. Waters bound to Kríţna nappe carbonates and discharged by natural springs are
of Ca(Mg)-HCO3 type and those from deep wells are of Na-HCO3, Na-Ca(Mg)-HCO3-Cl-
SO4 and Na-Cl types. Waters hosted by carbonates in the Tatric and Veporic envelope units
are of Ca(Mg)HCO3 type. Genetically, the waters are atmospherogenic with petrogenic
mineralization. Aside from their chemistry, this origin is suggested also by δ18 O content in
well Vr-2 at Vrbov, which oscillated around – 13‰. This attests to the infiltration of
extremely ―light‖ precipitation waters from all wells, except for those at Gánovce and Vyšné
Ruţbachy, which tapped natural springs, and have a marinogenic component seeped from
Paleogene sea. Water from well Šariš-1 is of marinogenic origin.
Waters in the Levoča Basin typically have strong incrustation properties. Oversaturation with
free Ca2+
ions at well top attains 80-90 mg.l-1
(wells Pl-1, Pl-2 at Plavnica). Sulfates (over
1000 mg.l-1) and free CO2 (about 600 mg.l-1
in wells Vr-1 and Vr-2 and about 1300 mg.l-1 in
Pl-1 and Pl-2) are likely to cause strong sulfate and carbonate corrosion on those sections of
installations which are not covered with incrustations. Fe contents from 0,9 to 1,9 mg.l-
1would give rise to brown precipitation.
The probable recoverable amount of renewable geothermal energy in the western and
southern sectors of the basin is 75,4 MWt and the probable nonrenewable amount in the
northern tract is 1316 MWt (Franko et al. 1995).
4.6.1 Depth composition and characterization of geothermal boreholes
Figure 4.9 - Boreholes location in study area; Gerlachov village location
In Poprad basin few deep boreholes were drilled. They provided important information and
data for this work. From a geothermal point of view, the most important boreholes are: FGP-
1 Stara Lesna, PP-1 Poprad, VR -1, VR-2, VR-2A, and HV3 in Vrbov. Close to the study
area, Gerlachov, are boreholes FGP-1 and PP-1. Geological composition can be very similar
to the Gerlachov area. The model will represent the whole basin, so boreholes FGP -1, PP-1
and also VR 2 will be described in more detail.

32
Hydrogeothermal borehole FGP -1 Stara Lesna
Depth [m] Lithology
Post-Tertiary
0,0 – 27,5 gravel, coarse grained, sandy
Paleogene (Oligocene, Ribbon)
27,5 – 905,0 sandstones litofacies – Zuberecke group of strata
905,0-1430,0 claystones litofacies – Hutianske group of strata
1430,0-1440,0 base conglomerate – Borovske group of strata
Mesozoic – Choc Nappe
1440,0-1730,0 main dolomite – norik
1730,0-1820,0 reiflings limestones – ladin – spodný karn
1820,0-1865,0 ramsau dolomites – upper anis – ladin
Mesozoic – Krížna nappe
1865,0-2138,0 Low sandy limestone, back, organodetric limestone
with shale layers, apt–low alb age
2138,0-2430,0 Limestone in fragments, marly, black, marly
shale, Barém-Valangin age
2430,0-2525,0 Marly limestone, Titón - Berias
2525,0-2560,0 Limestone, low marly, fine-grained, fragments of red
shales, Kimeridţ age
2560,0-2695,0 Sandy limestone, organodetric, fine-grained, shales,
dark gray, black
2835,0-3310,0 Carpat keuper – norik Group of strata
Mesozoic - Tatricum envelope
3310,0-3320,0 Limestone, shale, light siliceous – Doger age
3320,0-3450,0 Limestone, shale, marly, black – upper Lias age
3450,0-3510,0 Limestone, shale, sandy, black, dark gray, lower Lias
3510,0-3616,0 Quartzite, pink, gray – lower Trias

33
Hydrogeology and geothermal characteristic of borehole FGP-1
Borehole yield at the well bottom was measured to be 22,2 l/s with a temperature of 58°C.
Hydrostatic pressure before the hydrodynamics test was 0,181 MPa on the surface and 13,866
MPa at a depth of 1400 m.
In borehole FGP-1, geothermal waters of Ca-Mg-HCO3 type with a general mineralization of
3,1 – 3,3 g/l were found. The main gas elements in the water are CO2 (97%) and N2 (2,8 %).
Geothermal waters are mainly found in Triassic dolomites of Choc nappe. The hydraulic
properties of aquifers are characterized by a coefficient of absolute flow capacity of 2,696.10-
11m
3, a coefficient of flow capacity of 5,406.10
-4 m
2/s, a coefficient of permeability of
5,392.10-13
m2 and a coefficient of filtration of 1,081.10
-5 m/s.
The Choc nappe average geothermal gradient is 21,9°C/km and the density of thermal flow is
69,3 mW/m2,given for borehole FGP-1.
Based on a more complex interpretation of the borehole, the maximum flow of useful
geothermal waters is 40 l/s using a pump. The temperature on the well bottom is 58°C and
the maximum thermal power is 7,1 MWt.
Hydrogeothermal borehole PP-1 Poprad
Depth [m] Lithology
Post-Tertiary
0,0 – 10,5 loam, clay with rocks fragments
Paleogene
10,5–556,0 dark gray claystones with gray fine-grained sandstones layers
556,0–559,2 tectonic claystones with claystones fragments
559,2–609,0 light gray lime siltstone
Mesozoic – Choc nappe
609,0–643,3 tectonic area represented by claystone, sandstone, siltstone,
claystones and carbonates
643,3-823,4 dark-gray and gray fine-grained dolomites and breccia
dolomite, often decaying to pieces and brash, upper trias
823,4-836,4 Dolomite brash with dolomite pieces and dark shales
lunzske layers, karn age
836,4-1155 Gray and light-gray fine-grained dolomite
1155-1193 Dark-gray cavernous dolomite limestones with calcite
grains
1193-1205 Light-gray fine-grained dolomites and brash. From 836,4
middle trias

34
Hydrogeology and geothermal characteristic of borehole PP-1
Based on logging measurements, productive sectors were specified and are shown in Table 5.
Table 5 - Productive sectors in borehole PP-1
Productive sectors in PP – 1 Poprad borehole
Interval
[m]
Discharge
[l.s-1
]
General discharge
[%]
Water temperature in
inflow depth [0C]
635-660 7,76 12,68 48,2
695-700 1,06 1,73 48,2
745-790 14,52 23,73 48,2
835-900 18,32 29,73 49,0
910-921 2,34 3,84 49,1
931-935 9,11 14,89 49,7
970-990 2,94 4,80 50,0
1090-1105 5,14 8,40 50,5
The geothermal water supply of borehole PP-1 was specified to be 48,2 l.s-1
and the
temperature on the well bottom is 48°C. The static pressure on the well bottom is 0,51 MPa.
The geothermal water amount with this temperature has a thermal power of 6,647 MWt. The
main aquifers are Triassic dolomites of Choc nappe faulted by tectonics. Geothermal waters
of Ca-Mg-HCO3 type with a general mineralization of 2,88 g/l-1
and pH=6,21 were found.

35
Hydrogeothermal borehole Vr-2 Vrbov
Depth [m] Lithology
0,0-3,0 Post-Tertiary
Paleogene
3-708,0 siltstone, silty claystones change with fine-grained sandstones,
Zuberecke strata
708 -1481 claystones and siltstones more than sandstones, Hutianske strata
Choc nappe
1488-1951 Compact dolomite, light-gray to brown-gray, flawed by
tectonics,Calcite within faults
Krížna nappe
1951-2083 Limy claystone, faulted by tectonics, with coal mass, calcite
Within faults, lower Krieda – Neokom
2083-2321 Compact dolomite, gray, flawed by tectonics, calcite within
faults
2321-2502 Limy claystone, dark gray, faulted by tectonics, with coal mass,
calcite within faults
Hydrogeology and geothermal characteristic of borehole VR-2

36
The geothermal water supply of borehole VR-2 was specified to be 33 l.s-1
and the
temperature at the well bottom is 50°C. The main flows were localized in Mesozoic Choc
unit in interval 1918 – 1972 m, lower in some intervals from 1488 to 1972 m.
The hydraulic properties of aquifers are characterized by a coefficient of absolute flow
capacity of 1,061.10-10
m3, a coefficient of flow capacity of 2,4.10
-3 m
2/s. Thermal water is of
Ca-Mg(SO4)-HCO3 type and mineralization of 3891 mg.l-1
. The pressure on the well bottom
is 500 kPa.
The thermal power at a temperature drop to 35°C is 4,6 MWt.
4.6.2 Geothermic conditions
From a regional point of view, the Poprad and Hornad basins have the characteristics of a
depression. Both depressions are bounded mainly by faults from the surrounding mountains.
Geothermal waters are fixed in carbonate rocks which are under the Paleogene filling of both
basins.
Thermal conditions
Temperatures have relatively stable character without strong temperature anomaly. The
average temperature at a depth of 1000 m is 40,2 ± 1,5°C in Poprad basin and 35–40°C in
Hornad basin. At 2000 m depth, the average temperature is 66,8 ± 2,3°C in Poprad basin, and
in the north the temperatures are around 60°C. At 2000 m the typical temperature is 55°C in
Hornad basin. At 3000 m, in the Poprad basin, the central area has an average temperature of
92,2 ± 1,7°C and the border region to the south and southwest the temperatures are between
80–85°C. In Hornad basin temperatures of 75–80°C are typical at 3000 m depth. At 4000 m
depth the Poprad basin temperatures are between 110–117°C and in Hornad basin they are
105–110°C.
Documented thermal gradients in the Poprad basin Paleogene group of strata are 32,6 to
34,5°C/km, and Choc nappe dolomites are characterized by gradients of 19,8 to 21,9°C/km.
Kríţna nappe has a 24,6 to 29,8°C geothermal gradient. Geothermic data documented in
Poprad basin deep boreholes are in Table 6.
Table 6 - Geothermic data of Poprad basin deep boreholes (Daniel et al. 1998)
Boreholes
Temperature in depth FGP - 1 VR -2 HV - 3
T 500 [°C ] 24,4 22,3 23,7
T 1000 [°C ] 41,5 38,6 40,5
T 1500 [°C ] 58,5 54,7 57,3
T 2000 [°C ] 68,4 65,1 -
T 2500 [°C ] 81,2 80 -
T 3000 [°C ] 93,4 - -
T 3500 [°C ] 104,7 - -
Geothermal gradient FGP - 1 VR -2 HV - 3

37
G Paleogene [°C/km] 34,5 32,6 33,5
G Choc nappe [°C/km] 21,9 19,8 -
G Krížna nappe [°C/km] 24,6 29,8 -
G Mesozoic envelope [°C/km] 25,2 - -
The temperature profile from borehole VR-1 Vrbov is not available, but during
hydrodynamic tests the temperature was 55°C, measured on the Paleogene base at 1495 m
depth. On the well bottom at 1730 m depth the temperature was 61,9°C. In the PP-1 Poprad
borehole in the depth interval 1090–1105 m the temperature was 50,5°C. This temperature is
higher because of flowing groundwater coming from deeper formations through fault
dislocations. Geothermal temperature at 1000 m depth is approximately 40°C.
The Hornad basin temperature field is represented by data from HKJ-3 Arnutovce and HKJ-4
Letanovce boreholes. Data are shown in table below.
Table 7 - Geothermic data of Hornad basin deep boreholes (Daniel et al. 1998)
Boreholes
Temperature in depth HKJ-3 HKJ-4
T 200 [°C ] 13,9 14,1
T 400 [°C ] 20,7 20,7
T 500 [°C ] 23,5 23
T 600 [°C ] 25,7 25,2
T 800 [°C ] 30,1 -
T 1000 [°C ] 34,5 -
Geothermal gradient HKJ-3 HKJ-4
G Paleogene [°C/km] 33,3 33
G Paleogene sub-base [°C/km] 22 22,5
In the southern area of Hornad basin temperatures are lower. The relevant area in this work is
the northern part of the basin; the southern part will not be described. In boreholes HKJ-3
Arnutovce and HKJ-4 Letanovce, Triassic breccias dolomite and dolomite breccias (Jetel et.
al., 1990), which are characterized by a geothermal gradient of 22 to 22,5°C/km in the
Paleogene sub-base were documented.
Temperatures of the Paleogene sub-base in Poprad and Hornad basins confirmed that those
areas have potential for geothermal water exploitation. In Poprad basin, with its carbonate
base, it is possible to reach a maximum ambient temperature of approximately 85°C in 3200
– 3300 m depth in Spišská Bela. In the biggest part of the basin temperatures of more than
50°C at 1500 m depth can be found. This shows that the considered area belongs to high
potential areas for geothermal water exploitation.

38
The potential for low temperature sources exploitation is also found in the Hornad basin, in
areas where temperatures are 30–35°C in Mesozoic carbonate aquifers.
Figure 4.10 - Isothermal lines in interested area

39
5 3D GEOTHERMAL RESERVOIR MODELING APPROACH
A 3D model of the geothermal reservoir was made in the modeling program Petrel, Version
2008.1. After a description of the observed area, data were collected from existing wells and
from geologic reports. This was a base for the characterization of the stratigraphy, spatial
distribution, and depth of the analyzed reservoirs and petro physical properties of geothermal
reservoirs. The next step was the modeling of reservoir rocks and making a 3D model of the
study area. In this work two models based on two different types of data were submitted. The
first model is from the whole Poprad Basin and the northern part of Hornad Basin, and the
second model is from a small area situated close to the village Gerlachov. Gerlachov is in the
Poprad Basin and is situated in northwest part of the basin (Figure 4.4).The modeling in the
Poprad Basin was based on analysis of bitmaps (in jpg format) of seismic profiles from this
area. The modeling in the Gerlachov area was based on digital seismic data in SEGY format.
The main advantages of 3D modeling when compared to 2D modeling are:
More reliable data for the interpretation of geological and tectonic structure
Geological risk evaluation
Economic assesment, feasibility study
Image – higher chance to convince potential partners
5.1 Petrel background
Petrel is a PC-based workflow application for subsurface interpretation and modeling. It
allows users to perform all manner of workflows, from seismic interpretation to reservoir
simulation. Geophysicists, geologists and reservoir engineers can move across domains,
rather than applications, through the Petrel integrated toolkit.
Benefits of the program include:
All tools from seismic interpretation to simulation are integrated in one application,
eliminating import and export problems and promoting collaboration.
Strong visualization capabilities give instant QC of all data in 3D.
Models can be updated instantly when new data arrives, allowing the user to make
quick and reliable decisions.
All results can be copy and pasted to any Windows application, making it quick and
easy to report and present your latest results.
Petrel has a familiar Windows user interface, undo/redo functionality, and stores
modeling history, making it easy to use and learn (Petrel 2008.1—What‘s New).
5.1.1 Geomodeling
Geological models are created for many different purposes, but common to all of them is the
desire to build a representation of the subsurface. Depending on the purposes, different
aspects of the model may be important.
In the case of a regional exploration model, the shape of the structures may be most
important. Geological models may be used to achieve accurate volume calculations or to test
the effect of different depositional regimes against observed data. With simulation models,
the size and complexity may be the limiting factor in creating a model that achieves a good

40
history match. Petrel uses a 3D grid to supply the building blocks with which the user can
recreate representations of reality (Petrel 2008.1—What‘s New).
5.2 Process resolution and methodology of seismic interpretation – Poprad basin
Before working in Petrel program it was necessary to prepare all the data from the
investigated area. Data were collected from geologic, geophysical and hydrogeological
reports stored in the Slovakian state geological archive GEOFOND at the State geological
institute of Dionyz Stur (ŠGÚDŠ) in Bratislava. Based on this data, the geological, tectonics,
hydrogeological and hydrogeothermal situation were described in the study area. The main
goal was the geologic interpretation of seismic profiles that are located in the interested area
that represent a main proxy for the definition of geothermal reservoirs in the area. The
interpretation was focused on the identification of the following main surfaces:
pre-Tertiary (Paleogene) surface
interpretation of the Paleogene fill thickness of Poprad Basin and the northern part of
the Hornad Basin
the interpretation of the base of the Mesozoic Choc Nappe
the interpretation of the base of the Mesozoic Kríţna Nappe
interpretation of the tectonic structure (fault analysis)
For this purpose the following seismic profiles were interpreted: 750/92, 751/93, 752/93,
753/93 and 756/93. Those seismic profiles were made in the years 1992 – 1995 by the survey
―Flysch of East Slovakia – geophysics, study‖.
5.2.1 Analysis of seismic profiles
The analyzed seismic sections from the Poprad Basin and the northern part of the Hornad
Basin were reprocessed profiles of medium quality. This also influenced the resolution of my
interpretations. The base of Paleogene fill, represented by high amplitude reflectors, is very
distinct in all seismic sections. Below this, two complexes separated by an unconformity
were also interpreted. The upper complex represents Choc Nappe, the lower one the Kríţna
Nappe, both assigned to the all Mesozoic units covering the crystalline basement and,
occasionally, the Upper Paleozoic–Mesozoic envelope unit of so called Tatricum.
Seismic profile 750/92
The profile 750/92 passes in a northeast–southwest direction toward the southern margin of
the basin and approximately in the middle part it bends northwest–southeastward, towards
Spišská Magura Mts. and it ends near the Klippen Belt on the border with Poland. In the
southern part it records the so called Vikartovce ridge consisting of the Permian rocks of
Choc nappe. Further on it continues across the Poprad Depression to the High Tatry Mts.
separated by a sub-Tatric fault. In the northern part it records the striking elevation of the
Mesozoic Ruţbachy Island and the partial Spišská Magura Paleogene Basin.

41
Seismic profile 751/93
The profile begins approx. 2 km west of Markušovce village and continues along Levoča
town to the north where the profile changes its direction to the northeast. Visible on this
profile are the crystalline rocks in the lowermost part overlain by the Kríţna Nappe
(Mesozoic rocks) and Choc Nappe. The whole sequence is topped by the Paleogene rocks.
Seismic profile 752/92
Profile 752/92 has an approximately west–east orientation and is located more or less in the
central part of Levočské vrchy Mts. In the eastern part of the profile the front of Choc Nappe,
overthrusted by Kríţna Nappe (or Mesozoic sediments of Kríţna type), is visible. In the
easternmost part of the profile an elevation of the Paleogene base elevating the Mesozoic
rocks of Kríţna Nappe is well recorded. This structure was also confirmed by the borehole
Sariš – 1.
Seismic profile 753/93
Profile 753/93 has northwest-southeast orientation from the margin of the High Tatra Mts. to
the southern boundary of the basin. In the northwestern part it records the foothills of the
High Tatra Mts. with reduced, probably only envelope, Mesozoic of Tatricum, and a system
of listric sub-Tatric faults. The profile passes southeastward across the Poprad Depression
toward the southern margin of the basin and it records Mesozoic units in considerably greater
thicknesses, which were also confirmed by drills. An obduction of Veporicum crystalline
complexes over Tatricum complexes can be assumed in greater depths in the southeastern
part of the profile.
Seismic profile 756/93
The profile runs parallel with the southeast margin of the High Tatra Mts. and Ruţbachy
Mesozoic Island over the deepest part of the sub-Tatric fault system. Beneath the Paleogene
base the profile interprets Choc Nappe underlain by the Kríţna Nappe and Mesozoic
envelope. The lowermost part is formed by the crystalline rocks of the Tatricum.
5.2.2 Import data
Data which can be imported into Petrel are lines/point data, 2D grids (isochors, depth and
time grids, 2D trends, etc.), seismic interpretations, seismic (SEG-Y), wells and well tops,
and more. Before importing data it is necessary to know the formats of the imported data and
the formats that are supported by Petrel. An important part of importing data into a new
project is to check the quality of the input data.
In this case 2D data was available. It was 5 seismic profiles in jpg format from the studied
area (Figure 5.1). Before importing profiles into the program it was necessary to prepare
bitmaps of those seismics and define the coordinates of the seismic profiles.
The entire process consists of the following steps: It was needed to find the real co-ordinates
X,Y in the Slovak JTSK system (geodetics X,Y, co-ordinates). An situation map of seismic
profiles (lines) was imported to the MicroStation program with a map of Slovakia and
geodetical points. X,Y coordinates of the profiles were defined for the imported profiles
(Figure 5.1). The coordinates represented the beginning and end X,Y points of profiles.
Certain profiles had two different orientations. In these cases the profiles were subdivided

42
into two segments and each segment was treated as an individual profile. The tables with
points were prepared for every profile in txt format for importing the lines into the program.
The next step was preparing the pictures in jpg format for importation to Petrel. It was
necessary to fit each profile to the same depth and start from zero level (Z=0). Every 6
profiles were cut off to zero level and the co-ordinate for Z – depth was assigned to -5000 m.
Figure 5.1 - Location of seismic profiles in studied area
After preparing bitmaps and co-ordinates data was imported into Petrel. It was made by
polygons (line) from founding co-ordinates X, Y, Z and then importing the bitmaps with
seismic to the program (Figure 5.2)
Figure 5.2 - Imported seismic profiles

43
Import well data
Petrel handles two types of well data: well tops (points) and well trajectories, with or without
logs. When importing well data in the supported well formats, Petrel automatically saves the
data in appropriate folders and sub-folders in panes. The general workflow for importing well
data into Petrel is: import of well heads, insert well path/deviation data and add logs to the
wells (Figure 5.3).
Figure 5.3 - Imported boreholes
This system ensures flexibility and accuracy in the import. The procedure allows for multiple
well imports, easy updating of previously imported wells, and the option to further organize
the imported wells into sub folders.
Well trace and well logs are stored independently, which allows logs with different sampling
intervals to be attached to the same well trace. This may have an effect when using the
calculator (Petrel Manual).
Well co-ordinates and lithology from the interested area were known from the collected
report. It was prepared with tables in txt format with co-ordinates and names of wells. The
locations of cities were imported the same way.
Time stratigraphy was prepared in the Templates panel - Discrete property templates in Time
stratigraphy. In a copy of the time stratigraphy the names and colors for stratigraphy zones,
which are present in studied area and were documented in wells, were prepared (Table 8).
Table 8 - Statigraphy table

44
Figure 5.4 - Well stratigraphy
5.2.3 Seismic interpretation
Seismic interpretation was made straight on imported bitmaps with seismics. Faults were
interpreted straight on the pictures one by one on profiles.
Horizons were interpreted as polygons. It was not possible to interpret horizons in the
geophysics panel by interpreting grid horizons function. Normal seismic diagrams were not
available, only the bitmaps of profiles. Horizons were interpreted manually by polygons in
Utilities – Make edit polygons. Three polygons were interpreted on each profile: base of the
pre-Tertiary (Paleogene) polygon, base of Choc Nappe and base of Kríţna Nappe polygons
(Figure 5.5). Those polygons were then used as input for the formation of surfaces (Figure
5.6)

45
Figure 5.5 - Polygons of Paleogene base
Figure 5.6 - Surface of Paleogene base

46
5.2.4 Structural Modeling
Structural modeling in Petrel is subdivided into three processes:
Fault modeling
Pillar gridding
Make horizons
Fault Modeling
Fault modeling, which defines the faults in the geological model, forms the basis for
generating the 3D grid. These faults define breaks in the grid, lines along which the horizons
inserted later may be offset. The offset which occurs is entirely dependent upon the input
data, so modeling reverse faults is just as easy as modeling normal faults. All pillars in the 3D
grid are extended to meet the top and base of the horizons defining the grid. This was done in
Make Horizon, so it was necessary to make sure that all fault models were modeled above the
top and base horizon. A modeled fault must never cross another fault without being
connected (Petrel Manual).
Figure 5.7 - Key pillar representation
Faults are built using Key Pillars. A Key Pillar is a vertical, linear, listric or curved line
described by two, three or five so called Shape Points; two for vertical and linear, three for
listric and five for curved. Several Key Pillars joined together by these Shape Points define
the fault plane (Figure 5.7).
When building a structural model in Petrel, fault modeling is the first step. It was needed to
create Key Pillars along all the faults to incorporate them into the model (Figure 5.8).
Pillar Gridding
Pillar gridding generates the grid from the fault model. Limits on the geometry or the grid can
be defined during the process so it is easy to generate two grids from the same fault model,
one designed for geological modeling and another optimized for simulation.
The process of Pillar Gridding consisted of generating the 3D grid from the fault model.
Pillar Gridding is the process of making the ‗Skeleton Framework‘. The skeleton is a grid
consisting of a Top, a Mid and a Base skeleton grid (Figure 5.9), each attached to the Top, the
Mid and the Base points of the Key Pillars (the fault model). In addition to the three skeleton
grids, there are pillars connecting every corner point of every grid cell to their corresponding
corners on the adjacent skeleton grid(s).

47
Figure 5.8 - Fault modeling
When the skeleton grid was being created it was working with the Mid Skeleton grid. The
Mid Skeleton grid is the grid attached to the mid-lines that connect the Key Pillars. The
purpose is to create a grid that looks correct at the midpoint level, with respect to the grid cell
size, orientation and appearance of the cells. The next step was to extrapolate this Mid
Skeleton grid upwards and downward in order to create the Top and Base skeletons.
Figure 5.9 - Skeleton grid

48
Make Horizons
The Make Horizons tool is used for building the vertical layering in the model. It is here that
the offset on the faults is defined. Make Horizons generates independent geological horizons
from XYZ input data. To generate additional horizons using relative distance to existing
horizons, Make Zones must be used. These two processes are used to create the geological
zones within the model. It is expected that each zone will have similar petrophysical
properties and can therefore be modeled using a single set of input data. (Figure 5.10 and
Figure 5.11)
These three processes should always be considered together and it is possible go back and
forth between them. Problems with the fault model will often not be obvious before Pillar
Gridding begins, and problems with the pillar grid may not be obvious before horizons are
built. Similarly, many problems identified when using Make Horizons will require an edit of
the pillar gridding options or even the fault model (Petrel Manual).
Figure 5.10 - Interpreted horizons
Figure 5.11 - Interpreted zones

49
5.3 Process resolution and methodology of seismic interpretation – Gerlachov
This studied area is situated on the western border of Gerlachov village. The area is
characterized by thick Paleogene rock complexes mainly consisting of claystones and
occasional sandstones underlain by Mesozoic and crystalline rocks. . The Mesozoic rocks
form the Choc Nappe underlain by the Krizna Nappe. The Mesozoic envelope of Tatricum is
expected below the Krizna Nappe. The crystalline rocks are composed of similar rocks lto
those that are exposed in the neighboring Tatra Mts.
In the study area 73 seismic profiles were made covering an area stretching in a northwest–
southeast direction with approximately 25 m distance between them and approx. 1.8 – 3.0 km
in length (Figure 5.12). Only 35 profiles were useful for interpretation. All the others were
either too small or were not clear enough for interpretation. The realized seismic research had
―pseudo – 3 D‖ seismic status. Data from field measurements were then processed by 2D
seismic profiles methodology. Each seismic profile was interpreted. Interpretation was made
in 2D diagrams imported to the Petrel in SEGY format.
Figure 5.12 - Situation of imported 2 D diagrams, polygon for surfaces creating
After data import to the Petrel program the profiles suitable for interpretation were selected.
Altogether 35 profiles were selected. Those profiles were interpreted in the interpretation
folder by manual interpretation. The process panel was used for seismic interpretation from
the geophysics menu. The seismic horizons and faults were interpreted manually.

50
5.3.1 Fault Interpretation
There are two ways to interpret faults in Petrel: classical interpretation (drawing fault
segments) in the seismic interpretation and by modeling faults directly on the seismic in 3D
through the Fault modeling process.
Classical interpretation gives all the flexibility of traditional interpretation together with the
added clarity of fault planes triangulated in 3D.
The advantage of using the fault modeling process is that after the interpretation, the model is
ready for gridding as soon as the interpretation is complete. Furthermore, the interpreter is
forced to solve problems regarding fault hierarchy and connections during interpretation, thus
avoiding the need for reinterpretation before fault modeling.
Fault segments are interpreted simply by digitizing directly on a seismic intersection. To start
a new fault interpretation, right click on an existing interpretation folder (or if needed insert a
new interpretation folder first) and select Insert fault. Then, select Interpret faults or press F
and begin digitizing. The new fault object has appeared in the interpretation folder with a
name in bold, indicating that it is the active fault.
Faults are digitized in segments (lines), which are automatically triangulated in Petrel to give
a fault surface (Petrel Manual).
5.3.2 Horizons interpretation
Horizons were interpreted in the Seismic interpretation process in the Processes pane.
Interpretation tools were available on the toolbar to the right of the Display window. The
Horizon Interpretation icon in the tool bar must always be depressed to perform horizon
interpretation of any kind. The short cut key H will toggle this on automatically. To be able to
do any horizon interpretation, a seismic horizon must exist and be active. It is needed to
Insert seismic horizon, or left click on an existing horizon to activate it (name in bold text).
Auto tracking settings for each of the interpreted horizons are held in the settings for that
horizon. To begin a new interpretation, it must be added to an interpretation folder if one is
not already present in the project, (Insert, New Folder, New Interpretation Folder), then select
Insert seismic horizon. In the settings dialog for the new horizon is an Auto tracking tab
function, this holds the autotracking settings for that horizon (Petrel Manual). An example of
Faults and horizons interpretation is shown in Figure 5.13. For visualization, surfaces were
made. In the Utilities menu a polygon was prepared for making boundaries of the interested
area. To make surfaces, 4 horizons were inserted one by one within the boundaries of the
polygon.
5.3.3 Make Surfaces
The Make/Edit Surface utility can be used to construct a surface (grid) from different types of
input data. This can also be used to make trend surfaces for the property modeling task and to
make fault surfaces.
Once a surface has been constructed using the make surface operation, it can be updated,
taking account of any changes in input data, boundaries, trends etc. by selecting regenerate
from the right mouse button options. An image can be used as the main input.
Surfaces were made in the Process diagram - the Make/Edit Surface process dialog (Petrel
Manual).

51
In the Execute tab, input data were entered into the Main input area. The area of the new
surface was limited by a boundary; boundary data was entered into the Boundary area. In the
Output data, was entered an existing surface in the Surface area.
Figure 5.13 - Faults and horizons interpretation on seismic section Nr. 30 and 40
The type of input data was selected from the pull-down menu and the Suggest method and the
settings tab was pressed.
Figure 5.14 - Interpreted surfaces

52
Appropriate settings under the Geometry tab were chosen. If Polygons or lines are used as
input, this data can be refined under the Pre Processing tab. A trend for the data could also be
added here. Every 4 horizons were inserted through this process. An example of this is shown
Figure 5.14.
5.3.4 Structural Modeling
After manual interpretation of seismic profiles, structural modeling was made. Structural
modeling is subdivided into three processes: fault modeling, pillar gridding and making
horizons. These processes are similar to the first modeling (Poprad basin) and they are
described in the previous methodology. Results from structural modeling are shown in the
pictures below.
Figure 5.15 - Grid of the model showing grid boundary and faults
Figure 5.16 - Grid of model

53
Figure 5.17 - Grid model with Choc and Krizna nappe surfaces

54
6 RESULTS AND DISCUSSION
6.1 Poprad basin
Based on the results from my model the following bases were characterized:
The Paleogene base
the base of Mesozoic Choc Nappe
the base of Mesozoic Krizna Nappe
The tectonic structure (faults) in the studied area was also interpreted. Larger and more
detailed images are found in Appendix A.
6.1.1 The Paleogene base
On the seismic profiles the Paleogene base (Figure 6.1) was possible to interpret precisely.
The Paleogene part of the unit is formed by chaotic reflectors in the higher part, probably
representing alternating sandstones and claystones. In the lower part the reflectors are less
visible and this part is probably represented by monotonous claystones. This interpretation is
also documented by the geological structure of the wider area confirmed by several wells (i.e.
PP-1, FGP-1, VR -1, 2).
The Paleogene rocks in Poprad Basin area are represented by thick rocks formations. They
are the isolator for geothermal water aquifers which are situated under this unit.
The thicknesses of Paleogene unit are from 400 to approx. 1400 m.
Figure 6.1 - Surface of the Paleogene base
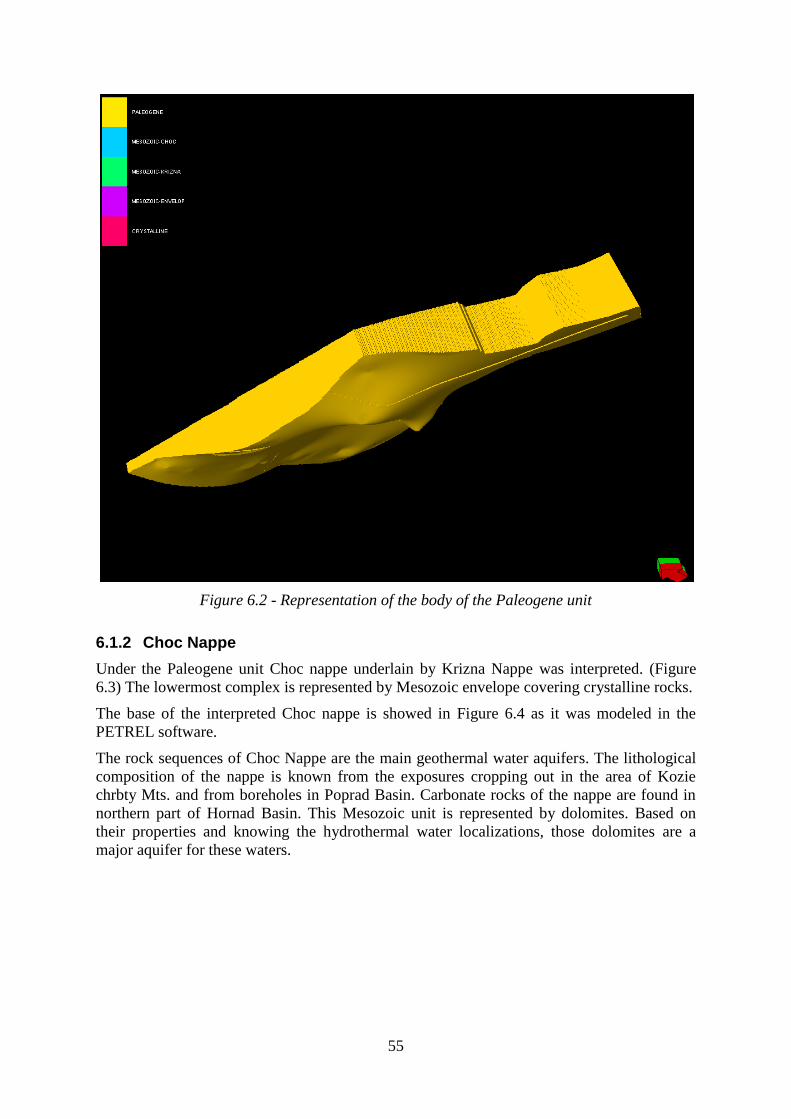
55
Figure 6.2 - Representation of the body of the Paleogene unit
6.1.2 Choc Nappe
Under the Paleogene unit Choc nappe underlain by Krizna Nappe was interpreted. (Figure
6.3) The lowermost complex is represented by Mesozoic envelope covering crystalline rocks.
The base of the interpreted Choc nappe is showed in Figure 6.4 as it was modeled in the
PETREL software.
The rock sequences of Choc Nappe are the main geothermal water aquifers. The lithological
composition of the nappe is known from the exposures cropping out in the area of Kozie
chrbty Mts. and from boreholes in Poprad Basin. Carbonate rocks of the nappe are found in
northern part of Hornad Basin. This Mesozoic unit is represented by dolomites. Based on
their properties and knowing the hydrothermal water localizations, those dolomites are a
major aquifer for these waters.

56
Figure 6.3 - Choc Nappe and Krizna Nappe horizons as interpreted in PETREL
Figure 6.4 - Base of the Choc Nappe
Choc nappe thicknesses are variable in the interested area. In the central part of the basin the
thickness of the nappe varies from 200 to 1100 m. The thickness increases from southwest to
northeast. The highest elevation of the Choc Nappe surface occurs in the northern part of the
study area where thickness varies from 700 to 1000 m. Smaller thicknesses of around 400 m
are close to borehole FGP-1. Toward the south, the thicknesses are again larger-
approximately 700 m and more. The bigger thicknesses in elevations and lower thicknesses in
depressions in Choc Nappe showed the more advantageous places for hydrothermal water
localization. (Figure 6.11)
Choc nappe
Krizna nappe

57
A different situation can be seen in the southeast of Vrbov fault toward the Hornad basin. In
this area the thicknesses of the Choc Nappe varies from 1200 to 2000 m. (Figure 6.5)
Figure 6.5 - Choc Nappe thickness in the southern part of the study area
Figure 6.6 - Representation of the body of Choc nappe
6.1.3 Krizna nappe
Krizna nappe is separate from the Mesozoic envelope by tectonized surface. The base of the
Krizna nappe unit was the last base to be interpreted. (Figure 6.7)
Choc nappe

58
Krizna nappe rocks were documented in two wells – FGP –1 (drilled all part of Krizna nappe)
and VR- 2 (finished in Krizna nappe).
The main rocks are limestones of Jurassic age, Keuperian formation and Triassic dark
limestones. In the borehole FGP – 1 the documented nappe thickness is 1445 m.
Based on the rock composition of Krizna and Choc Nappes and well information we can
conclude that the Krizna unit is less favorable from the viewpoint of water accumulation and
circulation.
Figure 6.7 - Basal surface of Krizna Nappe
Figure 6.8 - Representation of the Krizna nappe body

59
6.1.4 Tectonic structure
The main faults in the Poprad Basin are the Subtatric fault and the Vrbov fault. The Subtatric
fault occurs close to the north-western border of the studied area. Vrbov fault trends from
south-west to north-east and is situated on the south-eastern part of Poprad Basin. In the study
area, four faults have been interpreted that importantly influence the structure of the basin
(Figure 6.9).
The subtatric dips toward southeast and south. Vrbov fault dips toward north-west and the
amplitude of throw varies from 200 to 700 m.
Figure 6.9 - Demonstration of interpreted faults intersecting the base of Paleogene unit
Between them a fault going from south (Vrbov fault) to north-west (Subtatric fault) was
interpreted. This fault bounds the depression from the western margin (Figure 6.9). The base
of the Poprad Basin gradually sinks from west to north-east between Subtatric and Vrbov
faults. The deepest depression occurs close to Subtatric fault. Those faults form the basic
structure of Poprad Basin.
Figure 6.10 - West - East intersection of the modeled area showing all interpreted faults

60
Based on wells from the surrounding areas as well as on the intepretation of the seismic,
dolomites of Choc Unit below the Paleogene unit were interpreted. These are underlain by
carbonates of Krizna nappe. Dolomites are the main aquifers for geothermal waters.
Depressions and elevations of dolomite base between the faults are the structures of synclinal
and anticline with elevation differences from 200 to 800 m (Figure 6.10 and Figure 6.11).
These structures are covered by thick Paleogene strata. Paleogene sediments are isolators for
water transfer. Permeable dolomite structures are places for geothermal waters cumulating
under impermeable top seal. There are expectations that water is getting inside to the
dolomite base by faults zones. Figure 6.13 and Figure 6.14 show the faults surfaces in the
different bases.
Figure 6.11 - West - East intersection of the modeled area showing the syncline and anticline
structures
Figure 6.12 - Demonstration of interpreted faults on the base of Krizna Nappe

61
Figure 6.13 - Faults surfaces with Paleogene base
Figure 6.14 - Faults surfaces with base of Choc nappe

62
Figure 6.15 - Model of interpreted geological units
Based on the 3 D model (Figure 6.15) we can see the general geologic composition,
thicknesses of Paleogene sediments, Choc and Krizna Nappe carbonates in study area. The
most important tectonics structures were interpreted (Figure 6.9). As was mention before, the
Choc nappe is the main reservoir for geothermal waters. After modeling that we can see the
reservoir position, tectonic breach of this layer and thicknesses. This model can show us the
possible places for geothermal well locations.
6.2 Gerlachov
6.2.1 Seismic profiles interpretation
The analysis of seismic profiles shows 3 distinctive seismic units (Figure 6.16). The
differences depend on their different physical properties.
The first seismic unit was defined in the highest part of the profiles, and it reaches some 1300
ms depth. This group is made by transparent reflectors, which are chaotic and faint in the
topmost part of the profiles. They are more visible farther down in the profiles.
The second seismic unit is made by strong reflectors, which reflect acoustic impedance
changes along striking lithologic boundaries. In each profile there occur these reflexes below
the first seismic unit. They start at 800 ms TWT and on the left side of profiles they reach
1300 ms. The reflectors are more organized and parallel than in first unit.
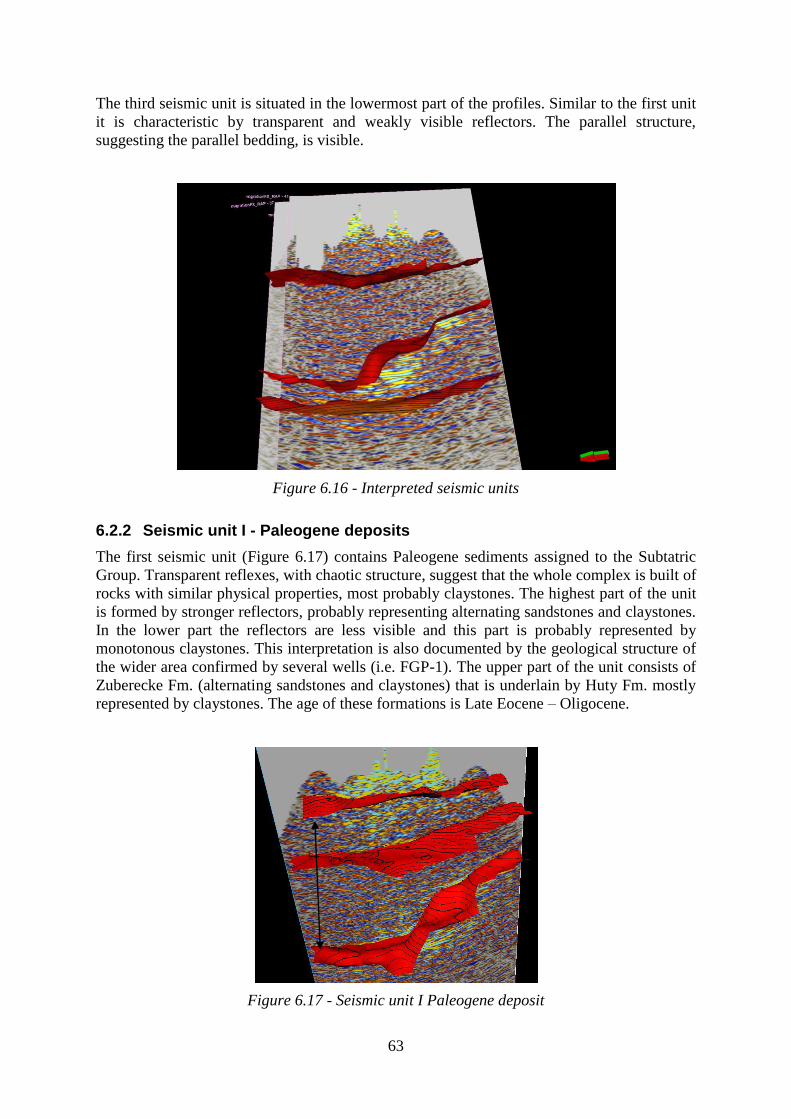
63
The third seismic unit is situated in the lowermost part of the profiles. Similar to the first unit
it is characteristic by transparent and weakly visible reflectors. The parallel structure,
suggesting the parallel bedding, is visible.
Figure 6.16 - Interpreted seismic units
6.2.2 Seismic unit I - Paleogene deposits
The first seismic unit (Figure 6.17) contains Paleogene sediments assigned to the Subtatric
Group. Transparent reflexes, with chaotic structure, suggest that the whole complex is built of
rocks with similar physical properties, most probably claystones. The highest part of the unit
is formed by stronger reflectors, probably representing alternating sandstones and claystones.
In the lower part the reflectors are less visible and this part is probably represented by
monotonous claystones. This interpretation is also documented by the geological structure of
the wider area confirmed by several wells (i.e. FGP-1). The upper part of the unit consists of
Zuberecke Fm. (alternating sandstones and claystones) that is underlain by Huty Fm. mostly
represented by claystones. The age of these formations is Late Eocene – Oligocene.
Figure 6.17 - Seismic unit I Paleogene deposit

64
6.2.3 Seismic unit II - Choc Nappe
The second seismic unit (Figure 6.18) is characterized by strong reflectors with relatively
good internal organization showing parallel reflectors. This suggests alternating thick bedded
lithology like dolomites typical for Choč Nappe. The thickness of Choc Nappe interpreted
from seismic profiles 753/93 and 756/93 (mentioned in the interpretation from the Poprad
Basin) varies from 400 to 600 m. Choc Nappe thickness documented in borehole FGP-1 Stara
Lesna was 425 m while the thickness of the nappe based on our interpretation is max. 600 m.
Figure 6.18 - Seismic unit II Choc Nappe
6.2.4 Seismic unit III – Krizna Nappe
The seismic unit III (Figure 6.19) is typical by high-amplitude chaotic reflectors. The change
of the reflector characteristics compared to the unit II suggests a change of the lithology.
Based on the geological structure revealed by deep wells (see geological profile of FGP-1,
PP-1) we assume that this unit represents the rocks of Krizna Nappe. The thickness of Krizna
Nappe is about 500 – 600 m. For geothermal research, the highest part of this area is
interesting, especially the Choc Nappe sequence.

65
Figure 6.19 - Seismic unit III Krizna Nappe
6.2.5 Tectonic structure
Fault interpretation was made manually in the seismic interpretation–geophysics window. On
every interpreted profile, faults and horizons were drawn at the same time. In the documented
area we can see expressive tectonic deformation and a system of normal faults trending from
south to north (Figure 6.20). Those faults determined the subsidence of the Paleogene base
northward. From the interpretation we can see that in the northern part of the study area the
thickness of the Paleogene unit is more than 1000 m.
Figure 6.20 - Faulted Choc nappe

66
Figure 6.21 - Intersection of model showing faults intersecting Paleogene and Choc Nappes
Figure 6.22 - Choc nappe segment

67
Interpretation of seismic profiles showed the geologic composition of the interested area
close to Gerlachov village. The area in this part of the Poprad Basin is built of Subtatric
Group sediments from claystones of the Huty Formation and Mesozoic rocks of Choc Nappe
and Krizna Nappe. Beneath this there can be expected Mesozoic envelope rocks and
crystalline basement. Based on seismic profiles we can see the tectonic structure of the study
area mainly represented by normal faults. The faults gradually drop down toward the north,
resulting in deformation of the Paleogene base. This is an important aspect when considering
geothermal drilling.
From the interpreted profiles the boundary is visible between the Paleogene and Mesozoic
rocks. Besides these two seismic units it is possible to see the third unit, which is
characterised by parallel reflections. This unit probably contains Mesozoic envelope rocks
and the crystalline rocks forming the basement.
Based on the 3 D model we can see the general geologic composition of the studied area. The
thicknesses of Paleogene sediments, tectonic deformation and the Choc Nappe position
suggest possible sites for geothermal well location. In this case it is the place in the southern
part of the modeled area.

68
7 CONCLUSION
The objective of this work was to model the geothermal reservoirs of Poprad basin, the north
part of Hornad basin area and a small area in detail, which is close to the village of Gerlachov
in Poprad basin. The model allowed for the visualization of the different layers and surfaces
of the studied area.
The main aquifers are built by Triassic carbonates – dolomites and limestones of Choc and
Krizna nappe. In the central part of Poprad basin, on the basis of seismic interpretation, Choc
nappe thicknesses from 200 to 1100 m were obtained. Larger nappe thicknesses from 1200 to
1500 m were obtained on the east and southeast part of the studied area.
Based on geothermal reviewing we can say that Poprad basin and northern part of Hornad
basin are active geothermal areas. The average geothermal gradient is 32,6 – 34,5°C/km, the
average density of heat flow is 67 mW.m-2
. Under Poprad basin Paleogene sediments,
temperatures are between 50 -85°C and in Hornad basin temperatures are between 30 – 35°C.
The general natural flow of water is 232,9 l.s-1
, which corresponds to 34,8 MWt.
The existing boreholes from the interested area were described. From this, boreholes VR-1
and VR-2 are currently utilized and boreholes PP-1 and FGP-1 in Poprad basin along with
HKJ-3 and HKJ-4 in Hornad basin are still not utilized.
In this work the geologic structure of Gerlachov area was also interpreted. This area also has
potential for geothermal energy exploitation. Gerlachov is situated in the northwestern part of
Poprad Basin. Seismic interpretation showed different geological units from a geothermal
point of view: those with the most potential are Mesozoic units represented by Choč and
Kríţna Nappes underlying Paleogene rocks. Based on the geologic composition of Choc
Nappe we can expect very good conditions for the existence of geothermal water reservoir.
Krizna Nappe has less positive conditions for geothermal water exploitation. The general
discharge of groundwater in Choc Nappe should be more than 22 l.s-1
. Temperatures in Choc
Nappe are between 35 and 45°C. By drilling to the deepest structure, Krizna Nappe, the
temperature can increase 10 or 20°C. But it is the risk and possibility here that the discharge
will be lower in Krizna Nappe than in Choc Nappe.
Based on interpretation and mentioned conditions we can state that the Gerlachov area is
suitable for geothermal utilization.

69
REFERENCES
Bajo, I., Franko, O., Kral, M., and Grexova, S., 2004: Hydrogeothermal evaluation of the
Skorusina depression, (in Slovak). Podzemna voda, X, No. 1, 136-143.
Biely A. Ed. 1996: Geological map of Slovakia, 1:500 000, Ministry of Environment –
Geological Survey of Slovak Republic.
Biely, A., Franko, O., Gross, P., 1965: Estimate report of structural borehole Kl-1 in Klcovo,
(in Slovak). In: Geological research reports in 1964, GÚDŠ, Bratislava, 68-69.
Bodiš, D., Franko, O., 1986: Genesis of Slovak geothermal waters and theirs exploitation, (in
Slovak). In: Year-book from scientific workshop ―Geothermal energy and utilization of the
Slovak republic.‖ Conferences, symposiums, workshops. GÚDŠ, Bratislava, 71 – 79.
Bondarenkova, Z., Vranovska, A., Fendek, M. and Kral, M. 1998: Central depression of the
Danube basin, Galanta area – regional hydrogeothermal evaluation, (in Slovak). Final report,
Ministry of Environment, Bratislava.
Daniel, J., Fendek, M., Novotny, L., Grand, T., Lucivjansky, L., Vika, K., Komon, J., Daniel,
S., Michalko, J. and Kral, M. 1998: Poprad basin – regional hydrogeothermal evaluation, (in
Slovak).Final report, Ministry of Environment, Bratislava.
Decree of the Slovak Government No. 861/1996.
Decree of the Slovak Government No. 282/2003.
Dickson, M., H., Fanelli M., 2004: What is Geothermal Energy? Instituto di Geoscienze e
Georisorse, CNR, Pisa,Italy.
Directive 2001/77/EC of the European Parliament and of the Council of 27 September 2001
on the promotion of electricity produced from renewable energy sources in the internal
electricity market.
Fendek M., and Fendekova M., 2005: Country Update of the Slovak Republic, Proceedings
World Geothermal Congress 2005, Antalya, Turkey, 24-29 April
Fendek, M., Hanzel, V., Bodiš, D., Nemčok, J. 1992: Hydrothermal conditions of Poprad
basin, West Carpathian, (in Slovak). Series hydrogeology and geological engineering 10,
GÚDŠ, Bratislava, 99-129.
Franko, O., Remšík, A., and Fendek, M., Eds. 1995: Atlas of Geothermal Energy of Slovakia.
Dionýz Štúr Institute of Geology, Bratislava, 1-268.
Franko, O., 1979: Perspective of thermal waters hydrogeological structures in Slovakia with
regard of geothermal energy utilization, (in Slovak). Geological reports 72, GÚDŠ, Bratislava
Franko, O., 1985: Geothermal waters existence as an energy source in SSR, (in Slovak). In: I.
Conference ―Complex utilization of geothermal waters in SSR‖ Research institute of water
service, Bratislava, 67 – 86.
70
Franko O., 1990: Geothermal energy of Slovak republic, doctoral thesis, (in Slovak). Archive
GÚDŠ, Bratislava, 145 s.
Franko O., Fendek, M., Bodiš, D., Bondarenková, Z., 1985: Hydrogeothermal conditions of
geothermal waters exploitation in Galanta area, (in Slovak). In: I. Conference ―Complex
utilization of geothermal waters in SSR‖ Research institute of water service, Bratislava, 235 –
254.
Franko, O., Fusán, O., Král, M., Majcin, D., 1986: High temperature and middle temperature
distribution of geothermal waters and hot dry rocks in Slovakia, (in Slovak). In: Geothermal
energy and utilization of Slovakia. Year-book reports from scientific seminar. GÚDŠ,
Bratislava, 81-92.
Franko, O., Gazda, S., Choma, M., 1967: Mineral waters of South Slovakian coal basin, (in
Slovak). Geologic science year-book, Western Carpathians, file ZK 8, GÚDŠ, Bratislava,
169-218.
Franko, O., Fusán, O., Franko, J., Král, M., 1994: Lithological, tectonics and geothermal
conditions of Levoca basin thermal waters, (in Slovak). In: International symposia ―Mineral
waters of East Slovakia „. Slovak hydrogeologist association, Bratislava, 121 – 130.
Gross, P., Kohler, E.,Samuel, O., 1984: Lithostratigraphy classification of inner carpathian
paleogene sedimentary cycle, (in Slovak). Geologic reports, 81, GÚDŠ
Haluška, M., 1968: Alluvium of Poprad – hydrogeologic research, (in Slovak). Script,
Geofond GS SR, Spišská Nová Ves.
Haluška, M., Petrivalský, P., 1994: Mineral waters in Baldovce, (in Slovak). In: Scientific
year-book from intermational symposial „Mineral waters of East Slovakia―. Slovak
hydrogeologist association, Bratislava, 27 - 38.
Janočko, J., M. Pereszlényi, D. Vass, V. Bezák, S. Jacko Jr., S. Jacko, M. Kohút, M. Polák ,
and J. Mello, 2006, Geology and hydrocarbon resources of the Inner Western Carpathians,
Slovakia, and Poland, in J. Golonka and F. J. Picha, eds., The Carpathian and their foreland:
Geology and hydrocarbon resources: AAPG Memoir 84, p. 569 – 603.
Jetel, J., Molnár, J., Vranovská, A., 1990: Hydrogeologic research of Hornad basin, Final
report, (in Slovak). Script, informatics department GS SR, Bratislava
Malík, P., 1994: Results from hydrogeologic research of mineral waters in Lipovce area, (in
Slovak). In: Scientific year-book from intermational symposial „Mineral waters of East
Slovakia―. Slovak hydrogeologist association, Bratislava, 15 - 26.
Maťuš, J., 1991: Final report- High Tatra forefield – hydrogeology, (in Slovak). Script,
informatics department GS SR, Bratislava
Mazúr E. and Lukniš M., 1986: Geomorfological units in SSR. Slovak cartography, Slovakia
Mlynarčík, M., Petrivalský, P., 1990: Vyšné Ruţbachy – Protective zones, II. Stage, (in
Slovak). Manuskript. Geogond, Bratislava.
Petrel 2008.1—What‘s New [online] [cited: January 10, 2009] www.slb.com/sis

71
Petrel Manual [online] [cited: January 10, 2009] www.slb.com
Polák M., Janočko J., Jacko ml. S., Potfaj M., Elečko M., Kohút M., Broska I., Maglay J.,
2008: General geological map of the Slovak Republic 1:200 000, Map sheet 27 Poprad,
Ministry of Environment – Geological Survey of Slovak Republic.
Remsik , A., et al. 1987a: New knowledge from geothermal energy research in SSR, (in
Slovak). Geologic research, 21,8, SNTL, Praha, 229-232.
Remsik, A., Fendek, M., Mello, J., Kral, M., Bodis, D. and Michalko, J. 1998: Liptov basin –
Regional hydrogeothermal evaluation, (in Slovak). Final report, Ministry of Environment,
Bratislava.
Remsik, A., Konecny, V., Fendek, M., Kral, M., Lexa, J., Hok, J., Madar D., Vika, K. and
Drozd, V. 2000: Ziar basin – hydrogeothermal evaluation. Final report, Ministry of
Environment, Bratislava.
Rudinec, R., 1989: Resources of oil, natural gas and geothermal energy of the East Slovakia,
(in Slovak). Alfa, Brafislava, 162 s.
Struňák, V., 1994: Spring structure in Ganovce, (in Slovak). In: Scientific year-book from
intermational symposial „Mineral waters of East Slovakia―. Slovak hydrogeologist
association, Bratislava, 39 – 47.
Šuba, J. et al., 1984: Hydrogeologic regionalization of Slovakia. SHMÚ Bratislava
Uhliarik, J. 1977: Utilization of thermal energy of curative thermal waters in Slovak spas.
Proceeding of the conference: Research, investigation, utilization and protection of the
thermal waters in CSSR, SVTS, Bratislava, pp. 131-141
Vozárová, A., Vozár, J., 1981: Litostratigraphic characterization of Hronicum younger
Paleozoic. Mineralia Slovaca, 13,5, Bratislava, 385-403
Vranovska, A., Bondarenkova, Z., Kral, M. and Drozd, V. 1999: Kosice basin – Durkov
structure – hydrogeothermal evaluation. Final report, Ministry of Environment, Bratislava.

1
APPENDIX A
Poprad basin - 3D geothermal reservoir modelling

2

3

4

5
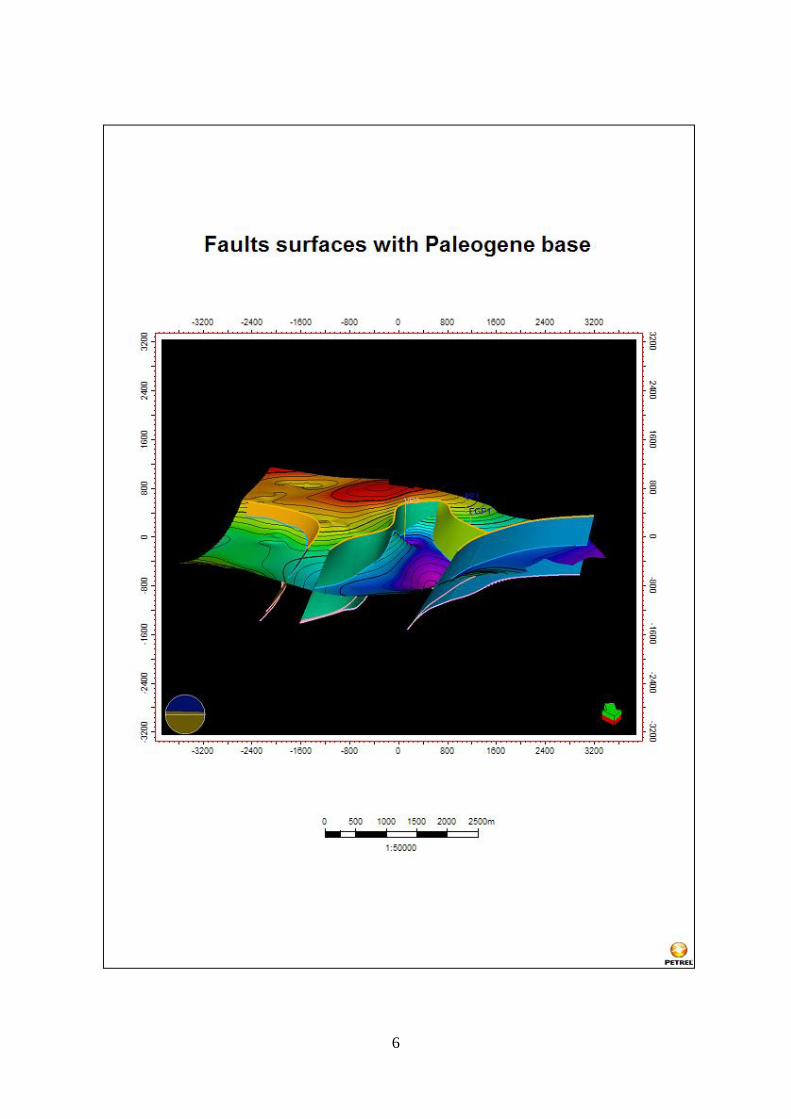
6

7

8

9

10

11

12

13

14

15

16

17

18

19

TH
E S
CH
OO
L F
O
R R E N E W A B L E E NE R
GY
SC
IE
NC
E
I C E L A N D
© 2009RES | the School for Renewable Energy Science, Iceland

20