Embed Size (px)
Citation preview
i
3D MOUSE LUNG CANCER PHANTOM DEVELOPMENT AND MRI PERFORMANCE EVALUATION
BY
ZHENGYI LU
A Thesis Submitted to the Graduate Faculty of
WAKE FOREST UNIVERSITY GRADUATE SCHOOL OF ARTS AND SCIENCES
in Partial Fulfillment of the Requirements
for the Degree of
MASTER OF SCIENCE
School of Biomedical Engineering and Sciences
May 2019
Winston-Salem, North Carolina
Approved By:
Dawen Zhao, MD, PhD, Advisor
Dawen Zhao, MD, PhD, Chair
Youngkyoo Jung, PhD
David R. Soto-Pantoja, PhD
ii
ACKNOWLEDGEMENTS
First and foremost, I offer my sincere gratitude to my advisor, Dr. Dawen Zhao. He
taught me not only the principles of conducting research, but also the way to
effectively present ideas. He provided many helpful suggestions for experiment
conduction, thesis writing and presentation. His flexibility and openness allowed
me to explore ideas outside of the box which broadened my horizons.
I am also very much grateful to William Neil Crowe for all of his contributions of
time and ideation to make my graduate experience productive. He taught me in
various aspects-medical imaging, 3D printing, tool use, language, etc. He always
explained everything in detail and gave very helpful suggestions whenever I had
difficulty during research. He offered great help in all the imaging work of this
project. He also edited my writing and provided many valuable comments to make
it more scientific and readable. I appreciate everything he has done for me.
I would like to thank Deeksha Maheswari Sankepalle for her excellent explanations
of many image processing concepts and support during image analysis work. She
also offered much assistance for phantom assembly and testing.
I an appreciative of Drs. Lulu Wang and Yang Liu. Their expertise in mouse
physiology inspired me during phantom modeling.
Special thanks to Dr. Philip J. Brown for his wise advice on 3D printing regarding
material selection and printing strategy.

iii
I would like to give my thanks to Andrea Morgan Rich for her many helpful
suggestions on modeling and guiding me through 3D printing. I also want to thank
Scotty Chung for showing me how to perform post-processing of 3D printing.
I am appreciative of Dr. Guohua Cao from Virginia Tech, Gregory James Gillispie,
and Peter Prim for their help when I was looking for a data source to begin lung
modeling.

iv
Table of Contents
LIST OF ILLUSTRATIONS AND TABLES.................................. v
LIST OF ABBREVIATIONS .................................................... vi
ABSTRACT .......................................................................... ix
Chapter 1 Introduction ................................................... - 1 -
Chapter 2 Method ........................................................ - 12 -
Chapter 3 Results .......................................................... - 24 -
Chapter 4 Discussion .................................................... - 33 -
Chapter 5 Conclusions .................................................. - 37 -
References .................................................................... - 38 -
v
LIST OF ILLUSTRATIONS AND TABLES
Figure 2.1 Workflow of applied software starting with 3D slicer to import raw micro-CT
images for segmentation, developing a mesh in Meshmixer, creating a solid and modifying
the model in Inventor, and preparing the model for 3D printing in Preform. ............. - 12 -
Figure 2.2 Lung segmentation and reconstruction from raw image. (a) Representative
contrast enhanced raw micro-CT image of mouse lung and surrounding tissues (b)
Reconstructed model in 3D Slicer after segmentation in 3 orthogonal directions. ..... - 13 -
Figure 2.3 Mesh in Meshmixer in 3 orthogonal directions after exporting segmented mesh
from 3D slicer, mesh resolution reduced for use with downstream software. ........... - 13 -
Figure 2.4 Model in Inventor after conversion of mesh to hollow solid. (a) Lung model. X,
y, and z illustrate different directions. (b) Lung model with custom case (c) Control lung
model half (d) Lung cancer model half (e) Complementary model half for (c) and (d) (f)
Case model allowing for custom fit to MR coil. ............................................................ - 14 -
Figure 2.5 Cutaway 3D model of tumor lung phantom and detailed regions surrounding
tumors. Spheres representing tumors are attched to inner lung surface, with diameters
of 1 to 5 mm. ................................................................................................................. - 14 -
Figure 2.6 Models prepared to be printed in Preform. Supports were generated below
models to allow optimal 3D printability while keeping excess resin from becoming trapped
in hollow spaces ............................................................................................................ - 14 -
Figure 2.7 3D printed phantom components and fabricated phantom. (a) Lung cancer
phantom half (b) Control lung phantom half (c) Complementary lung half for (a) and (b)
(d) Case to hold lung phantom (e) Lung phantom inside the case (f) Phantom assembled
with septa and ready for imaging ................................................................................. - 17 -
Figure 2.8 Schematic of how phantom case fits the coil. (a) Diagram for separate parts in
imaging (b) Diagram showing the combination of different parts during imaging. The case
cross section enables a tight and consistent fit of the phantom into the RF coil. ....... - 17 -
Figure 2.9 Sealed gas tank and phantom. PTFE septas were fixed by compression fittings
to seal the openings of regulator and lung phantom so that no leak would occur and the
phantom could hold vacuum. ....................................................................................... - 17 -
Figure 2.10 Gas sampling equipment. A syringe was used for gas sampling from gas tank.
A valve was set on the top of syringe for gas storage. ................................................. - 17 -
Figure 2.11 Sequence for gas sampling and injection. (a) SF6 gas was released from gas
tank to regulator until the output pressure reached 20 psi. (b) The inlet of regulator was
closed and gas inside regulator was released to a syringe for storage. (c) Another syringe
was applied to extract air from phantom to make it vacuum inside. (d) SF6 was injected
into phantom for 19F MRI. ............................................................................................. - 17 -
vi
Figure 3.1 3D reconstructed image from 1H MRI. Red spheres represent tumors. Numbers
indicate actual tumor diameters (mm).. ....................................................................... - 17 -
Figure 3.2 Representative 1H images in tumor quantification for tumor with different
diameters. The first column is from tumor lung phantom. The second column is from
control lung phantom. The second column is from control lung phantom. The third
column is overlaid images of tumor and control images. The last column shows tumor ROI
in green. ........................................................................................................................ - 17 -
Table 3-I Comparison of actual and measured tumor volume. .................................... - 17 -
Figure 3.3 Linear regression curve for measured and actual tumor volume. R2=0.9987,
P<0.001.. ....................................................................................................................... - 17 -
Figure 3.4 1H, 19F and overlay images. Images of 1H, 19F MRI and corresponding 3D view
from coronal, sagittal and axial directions were shown. 1H images were contrast-
enhanced. 19F images were co-registered for the same pixel size with 1H images. Red
regions represent ROIs in 19F images. 19F ROIs were then overlaid with 1H images.. - 17 -
Table 3-II Properties of 1H image projections and 19F images..................................... - 17 -
vii
LIST OF ABBREVIATIONS
2D - two-dimensional
3D - three-dimensional
C2F6 - hexafluoroethane
C3F8 - perfluoropropane
CF4 - tetrafluoromethane
COPD - Chronic Obstructive Pulmonary Disease
CT - Computed Tomography
DWI - Diffusion Weighted Imaging
F - Fluorine
FLASH - Fast Low-Angle Shot Sequence
GRE - Gradient Echo
He - helium
HP - hyperpolarized
mm - millimeter
O2 - oxygen
RARE - Rapid Acquisition with Relaxation Enhancement
viii
SE - spin echo
SF6 - sulfur hexafluoride
SNR - signal to noise ratio
UTE - Ultra-short Echo Time
VDV - ventilation defect volume
VR - volume rendered
Xe - xenon
ix
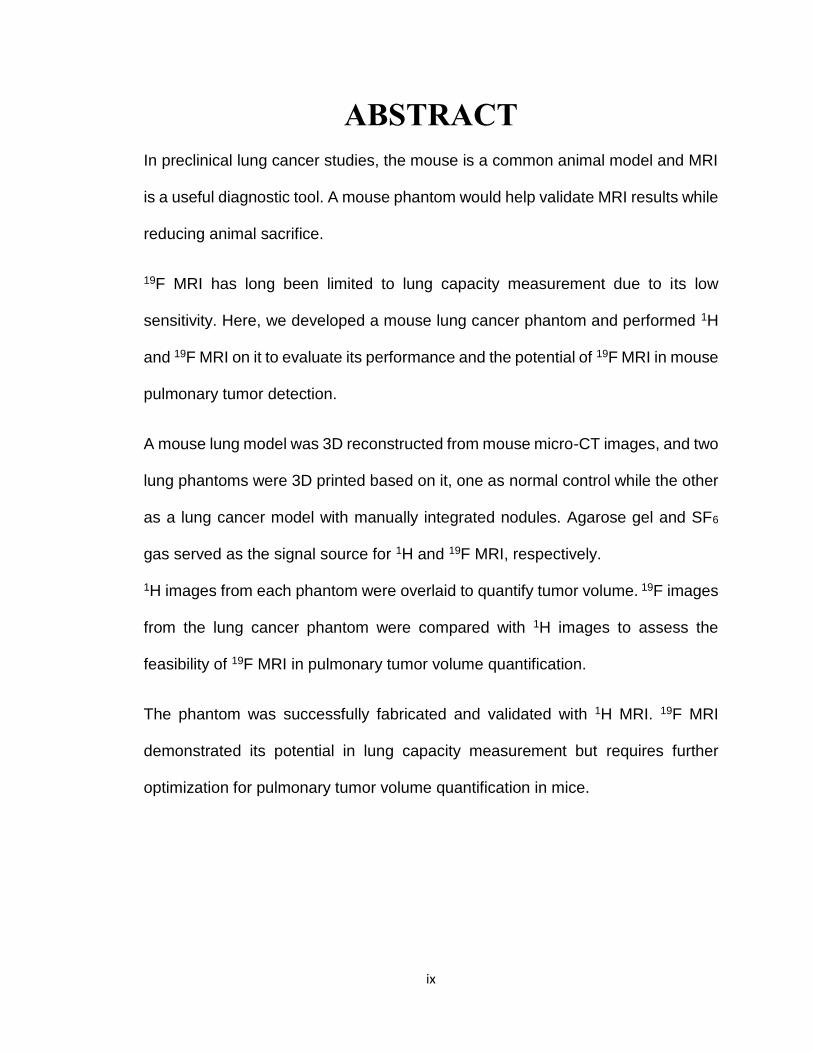
ABSTRACT
In preclinical lung cancer studies, the mouse is a common animal model and MRI
is a useful diagnostic tool. A mouse phantom would help validate MRI results while
reducing animal sacrifice.
19F MRI has long been limited to lung capacity measurement due to its low
sensitivity. Here, we developed a mouse lung cancer phantom and performed 1H
and 19F MRI on it to evaluate its performance and the potential of 19F MRI in mouse
pulmonary tumor detection.
A mouse lung model was 3D reconstructed from mouse micro-CT images, and two
lung phantoms were 3D printed based on it, one as normal control while the other
as a lung cancer model with manually integrated nodules. Agarose gel and SF6
gas served as the signal source for 1H and 19F MRI, respectively.
1H images from each phantom were overlaid to quantify tumor volume. 19F images
from the lung cancer phantom were compared with 1H images to assess the
feasibility of 19F MRI in pulmonary tumor volume quantification.
The phantom was successfully fabricated and validated with 1H MRI. 19F MRI
demonstrated its potential in lung capacity measurement but requires further
optimization for pulmonary tumor volume quantification in mice.
- 1 -
Chapter 1
Introduction
Lung cancer remains the leading cause of cancer death worldwide with a five-year
survival rate of less than 15%.[1] In 2018, more than 154,000 people are expected
to have died from lung cancer, about 83,500 men and 70,500 women. This number
represents about 25% of all deaths due to cancer.[2] As the probability of
malignancy is closely related to the size of the nodules, the ability to noninvasively
monitor tumor progression and response to therapy would enhance our ability to
effectively provide therapy.[3,4] Therefore, improvements to existing imaging
techniques to improve longitudinal lung metastasis detection are in great need.
Imaging technique evaluation sometimes requires animal experiments for
demonstration of suitability and effectiveness. In these cases, histopathologic
measurements are always required to validate imaging results in tumor
quantification, in which mouse lungs are inflated and fixed to obtain certain
quantitative information.[5,6,7]
However, validation with animal models may has disadvantages. First, the
anatomy and physiology of different animal individuals varies, making some
experiments difficult to control and reproduce. Second, animal experiments can be
complex, costly, and require specialized equipment and trained personnel.
Furthermore, for ethical reasons, a reduction in the use of animal models is
desirable. An alternative to validate imaging techniques when a new sequence or
protocol is developed is to use an imaging phantom, which can be, faster, easier,
- 2 -
cheaper, and more ethical. As a standardized testing, it allows for assessment of
higher accuracy and has a high degree of reproducibility.[8]
The mouse has been a popular animal model for studying human diseases for
more than a century. They are small, making them cheap to care for and
convenient to manipulate. Adult mice reproduce as often as every three weeks,
providing scientists a great number of individuals to work with. Their life span is
only about two years in laboratory care, making them ideal for studying chronic
diseases. Additionally, almost all mouse genes share functions with those in
humans. Since the mouse genome is easy to manipulate, scientists can create
precise models of specific diseases with them. As a scientific tool, mice have
helped to accelerate the progress of research and enabled the development of
new drugs.[9,10]
One important application of mouse models is lung cancer. The high degree of
pathophysiological similarity between lung tumors from mouse models and their
human counterparts makes mice a preferred model for pre-clinical tests in lung
cancer studies.[11] In addition, immunodeficient mice can also be used as hosts to
grow both normal and malignant human tissue, making them a useful tool in cancer
research.[9] Therefore, a mouse lung phantom serves as an important step towards
imaging technique improvement in pulmonary tumor detection.
Investigators have proposed different methods for imaging phantoms construction.
Segars et al developed a digital mouse phantom, which could model cardiac and
respiratory motion.[12,13] Assigned with different tissue properties, CT and SPECT
- 3 -
imaging could be simulated.[12] Similarly, Heyden at al developed a 4D digital
mouse lung phantom to investigate the influence of respiratory motion on dose
delivery in a mouse lung tumor irradiation.[13] However, virtual models cannot
always mimic the artifacts and challenges of real imaging experiments. With
respect to physical phantoms, Swailes et al developed a dynamic phantom which
could mimic heart, lung, and blood motion to test new MRI sequences. Chang et
al developed a deformable lung phantom for deformable registration in CT.
However, in both of these cases the lung was oversimplified into cellulose sponge
filled plastic bags or latex balloons, which could not represent the result of real lung
imaging.[8, 14] Laude created a 3D printed lung phantom based on CT and MRI
images. However, it is not applicable for mouse imaging because the data came
from humans, whose lungs have different anatomic geometry and much larger
volume, and would require extensive modification if simply downscaled for 3D
printing.[15] Biological phantoms from cadavers represent another alternative, from
the research of Keereman et al, who conducted CT, MRI, and PET on excised and
inflated pig lungs. However, this method shared many downsides with a real
animal model such as non-reproducibility and animal sacrifice. Great difficulty may
also occur when it comes to the size of a mouse.[16] Most current mouse lung-
related phantoms are solid models built for CT. For instance, Welch et al
constructed an anatomically accurate mouse phantom made with materials with
similar density and attenuation to tissue. Slices of tissue equivalent materials at
certain thickness were overlaid to produce an imaging phantom, which was
validated by CT, for radiation dosimetry studies.[40]
- 4 -
CT has served as a clinical modality for structural lung imaging in humans due to
its high spatial resolution and speed of data acquisition. Based on the success of
CT in humans, micro-CT has been adapted to animal models for monitoring
pulmonary tumors. However, they usually suffer from poor soft-tissue contrast, and
radiation exposure from CT may affect tumor growth and elicit some immune
response, especially when serial imaging is conducted, altering the experimental
outcomes particularly in longitudinal studies.[17] MRI, with no concerns regarding
radiation exposure and dramatically enhanced tissue contrast, is an attractive
option in lung cancer studies.
The lung environment presents several challenges to conventional 1H MRI. First,
low water content induced by low tissue density severely limits the signal intensity,
which makes structural 1H MRI of the lung microstructure challenging. Second,
numerous tissue-air interfaces lead to high local susceptibility, contributing to
locally shortened T2* times. Third, respiratory and cardiac motion can result in
significant motion artifacts, if not corrected. For short T2* values, the use of UTE
can substantially mitigate the effect of T2* decay and improve signal. To reduce
motion artifacts, respiratory and cardiac gating are performed.[1,18,19,20]
In an MRI-based lung capacity quantification, lung volume was calculated by
measuring the area of the lungs in each MR slice, multiplying by the slice thickness
to determine the slice volume, and summing all slice volumes. In 2014, Egger et
al quantified the lung volume of mice and rats with a 3D UTE sequence to study
extracellular-matrix deposition and altered pulmonary function in bleomycin
- 5 -
models of fibrosis. With the use of fast T2-weighted imaging sequences to reduce
motion artifacts.
For pulmonary tumor quantification, a common protocol is that multi-slice images
which span the entire mouse, are collected, contrast between healthy and
pathologic tissue is enhanced, and tumor region is segmented semi-automatically
based on specific or dynamic thresholding.[21] Similar to the method in lung
capacity quantification, contiguous regions from adjacent slices were grouped
together and multiplied by slice thickness to yield individual tumor volume.[6] To
detect the edge of lung tissue, Tidwell et al developed and validated a new 2D
parametric model for automated lung segmentation of MR images for mouse lungs
with diffuse metastatic disease which replaces the majority of lung parenchyma
with tumors. Their algorithm preserves the overall shape of lung and avoided the
inclusion or exclusion of large lung sections which may occur with nonparametric,
threshold-based approaches. They then correlated the average lung image signal
intensity derived from the segmentation with lung weights, which was used as a
quantitative measurement of tumor in mice and demonstrated the former to be a
valid measurement of lung tumor burden.[10] With respect to the ability of MRI to
detect tumors, Garbow et al successfully detected mouse primary lung tumors with
diameter ranging from smaller than 0.6 mm to around 2 mm by respiratory-gated,
spin-echo MRI at 4.7 T. 128×128 coronal images were used for tumor
quantification, with a FOV of 2.5×2.5 cm2. Slice thickness was set as 0.5 mm.[22]
Kubo et al detected pulmonary solitary tumors in mice by cardiac-respiratory gated
MR microscopy at 4.7 T. A 2D GRE was applied first as a screening image for
- 6 -
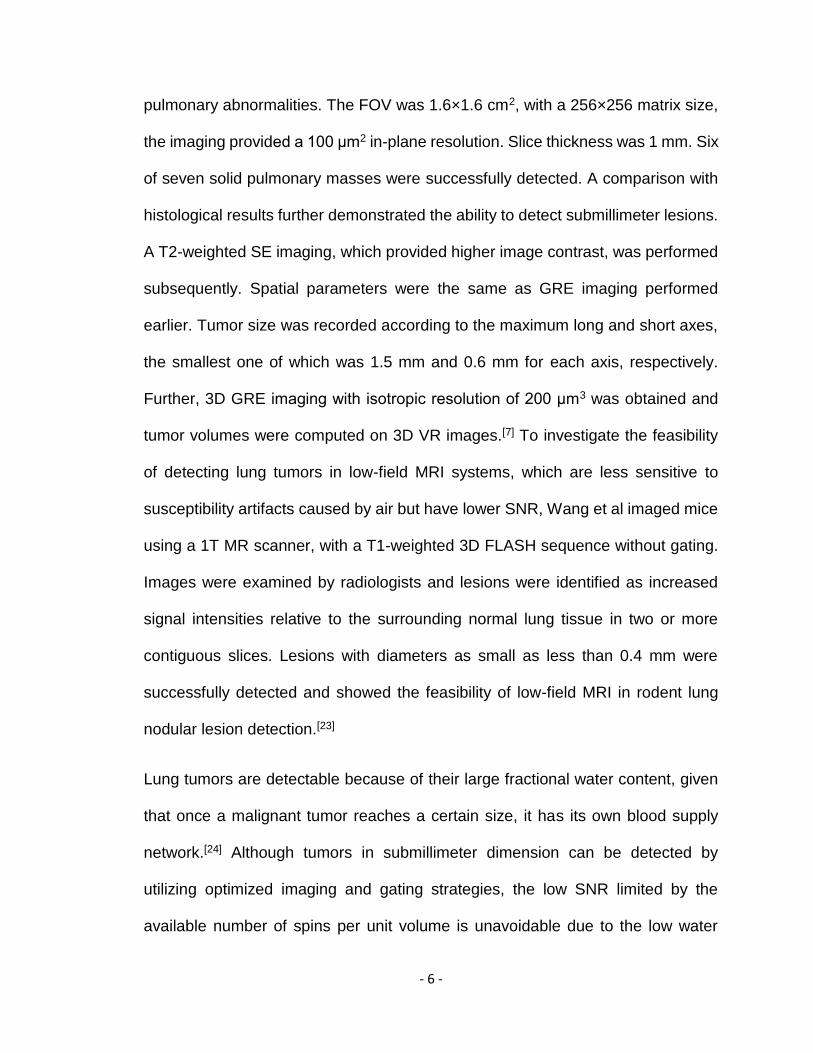
pulmonary abnormalities. The FOV was 1.6×1.6 cm2, with a 256×256 matrix size,
the imaging provided a 100 μm2 in-plane resolution. Slice thickness was 1 mm. Six
of seven solid pulmonary masses were successfully detected. A comparison with
histological results further demonstrated the ability to detect submillimeter lesions.
A T2-weighted SE imaging, which provided higher image contrast, was performed
subsequently. Spatial parameters were the same as GRE imaging performed
earlier. Tumor size was recorded according to the maximum long and short axes,
the smallest one of which was 1.5 mm and 0.6 mm for each axis, respectively.
Further, 3D GRE imaging with isotropic resolution of 200 μm3 was obtained and
tumor volumes were computed on 3D VR images.[7] To investigate the feasibility
of detecting lung tumors in low-field MRI systems, which are less sensitive to
susceptibility artifacts caused by air but have lower SNR, Wang et al imaged mice
using a 1T MR scanner, with a T1-weighted 3D FLASH sequence without gating.
Images were examined by radiologists and lesions were identified as increased
signal intensities relative to the surrounding normal lung tissue in two or more
contiguous slices. Lesions with diameters as small as less than 0.4 mm were
successfully detected and showed the feasibility of low-field MRI in rodent lung
nodular lesion detection.[23]
Lung tumors are detectable because of their large fractional water content, given
that once a malignant tumor reaches a certain size, it has its own blood supply
network.[24] Although tumors in submillimeter dimension can be detected by
utilizing optimized imaging and gating strategies, the low SNR limited by the
available number of spins per unit volume is unavoidable due to the low water
- 7 -
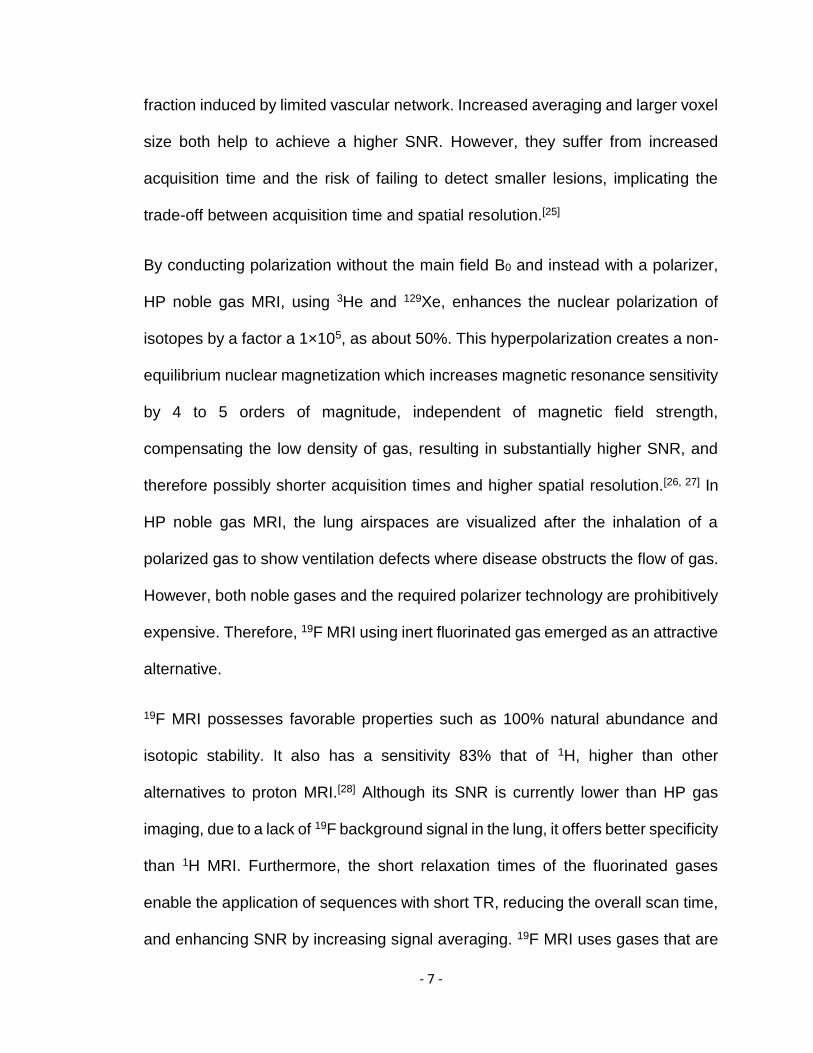
fraction induced by limited vascular network. Increased averaging and larger voxel
size both help to achieve a higher SNR. However, they suffer from increased
acquisition time and the risk of failing to detect smaller lesions, implicating the
trade-off between acquisition time and spatial resolution.[25]
By conducting polarization without the main field B0 and instead with a polarizer,
HP noble gas MRI, using 3He and 129Xe, enhances the nuclear polarization of
isotopes by a factor a 1×10⁵, as about 50%. This hyperpolarization creates a non-
equilibrium nuclear magnetization which increases magnetic resonance sensitivity
by 4 to 5 orders of magnitude, independent of magnetic field strength,
compensating the low density of gas, resulting in substantially higher SNR, and
therefore possibly shorter acquisition times and higher spatial resolution.[26, 27] In
HP noble gas MRI, the lung airspaces are visualized after the inhalation of a
polarized gas to show ventilation defects where disease obstructs the flow of gas.
However, both noble gases and the required polarizer technology are prohibitively
expensive. Therefore, 19F MRI using inert fluorinated gas emerged as an attractive
alternative.
19F MRI possesses favorable properties such as 100% natural abundance and
isotopic stability. It also has a sensitivity 83% that of 1H, higher than other
alternatives to proton MRI.[28] Although its SNR is currently lower than HP gas
imaging, due to a lack of 19F background signal in the lung, it offers better specificity
than 1H MRI. Furthermore, the short relaxation times of the fluorinated gases
enable the application of sequences with short TR, reducing the overall scan time,
and enhancing SNR by increasing signal averaging. 19F MRI uses gases that are
- 8 -
abundant and inexpensive compared with HP gases, it also eliminates the need
for costly polarizers as a result of the signal being derived from its thermal
equilibrium polarization, similar to conventional 1H MRI. Besides, unlike HP gases,
whose T1 and T2 relaxation rates will be increased due to the paramagnetism of
O2, they have a relaxation which is so rapid that O2 does not significantly prolong
it. Therefore, they can be mixed with a physiological concentration of O2 (21%)
without a large decrease in SNR, which reduces the risk involved with long-
duration imaging.[29]
Gas MRI has many applications such as DWI and dynamic MRI, which investigates
the kinetics of pulmonary ventilation by measuring the wash-in and wash-out of
gases.[19,20] One important application is static breath-hold imaging to study
functional pulmonary capacity. To quantify VDV, thoracic cavity and ventilation
volume were segmented from 1H MRI and Gas MRI. Co-registration was
performed for anatomic and functional images. Images from both imaging were
then overlaid and ventilation defects were obtained from signal voids.[30,31] The
diffusivity of gases is an important factor in ventilation defect size interpretation.
From a comparison of VDV measurements applying HP 3He and 129Xe MRI on
COPD patients, 129Xe MRI showed larger disease-related defects due to its lower
diffusivity which led to slower filling in the terminal airways during the scanning
period.[26] Halaweish et al showed that fluorinated gas MRI had the ability to detect
ventilation defects in COPD patients in a similar manner to HP noble gas MRI.[19]
Although fluorinated gases such as SF6 and C2F6 have a lower diffusivity than
noble gases, a continuous breathing to reach a steady-state gas concentration
- 9 -
before imaging may compensate for the slow filling and make ventilation defects
appear smaller.[16,19] Pulmonary tumors typically start in the cells lining the bronchi
and parts of the lung such as the bronchioles or alveoli.[2] Before they grow large
enough to block the airway, 19F MRI may be useful in tumor quantification by
reflecting the ventilation defects induced by tumors.
19F MRI is performed with gases containing molecules possessing multiple fluorine
atoms, such as CF4, SF6, C2F6 and C3F8, which enhances their detectability.[32] The
first 19F gas lung images were acquired by Edwin Heidelberger and Paul Lauterbur
in 1982 by applying CF4 in excised rabbit lung.[33] In 1998, Kuethe et al
demonstrated a 700 μm resolution 3D imaging of rat lungs with a mixture of 80%
C2F6 and 20% O2.[34] In 2008, Wolf et al reported the first 19F MRI of human lungs
using a mixture of 70% SF6 and 30% O2. Although the SNR did not exceed 9, this
work was an important milestone in the history of diagnostic 19F MRI.[35] In 2013,
Couch et al reported a mean SNR (±standard deviation) of 32±6 for 19F human
lung imaging using 3D UTE sequence after several wash-out breaths and a 15 s
breath-hold of 79% C3F8 and 21% O2 mixture.[36]
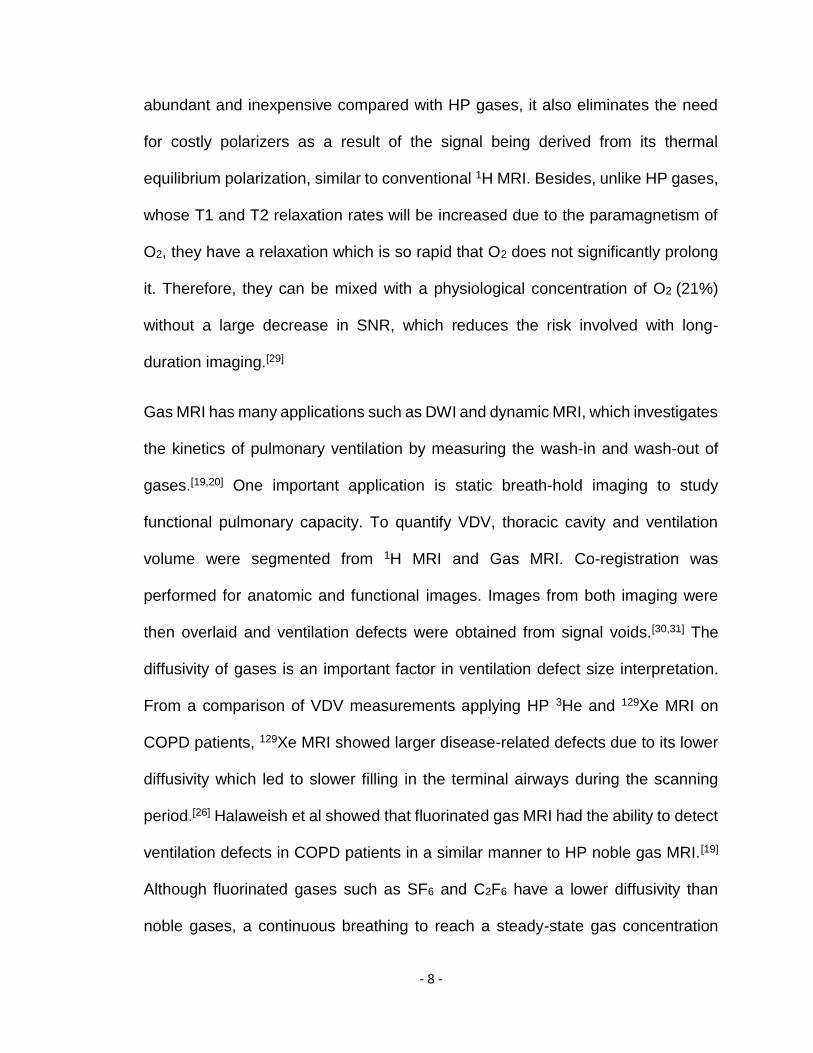
All the gases mentioned above are nontoxic and safe for repeatable inhalation,
among which SF6 and C3F8 are most commonly used.[6] Compared with SF6, C3F8
possesses two additional fluorine atoms, providing greater spin density.[37]
However, it has two resonance peaks separated by 48 ppm, for which there does
not seem to be reported characterization of relaxation time and the relaxation
values were taken to be that of the main peak, leading to reduced image quality.[26]
On the other hand, SF6 has a single peak and its very short T1 and T2 allow
- 10 -
extensive signal averaging. Moreover, its solubility in blood and lung tissue is lower
than He and Xe allowing SF6 to remain within air spaces when inhaled without
diffusing into the blood or tissue, improving image specificity and decreasing the
risk of side-effects.[38,39,40]
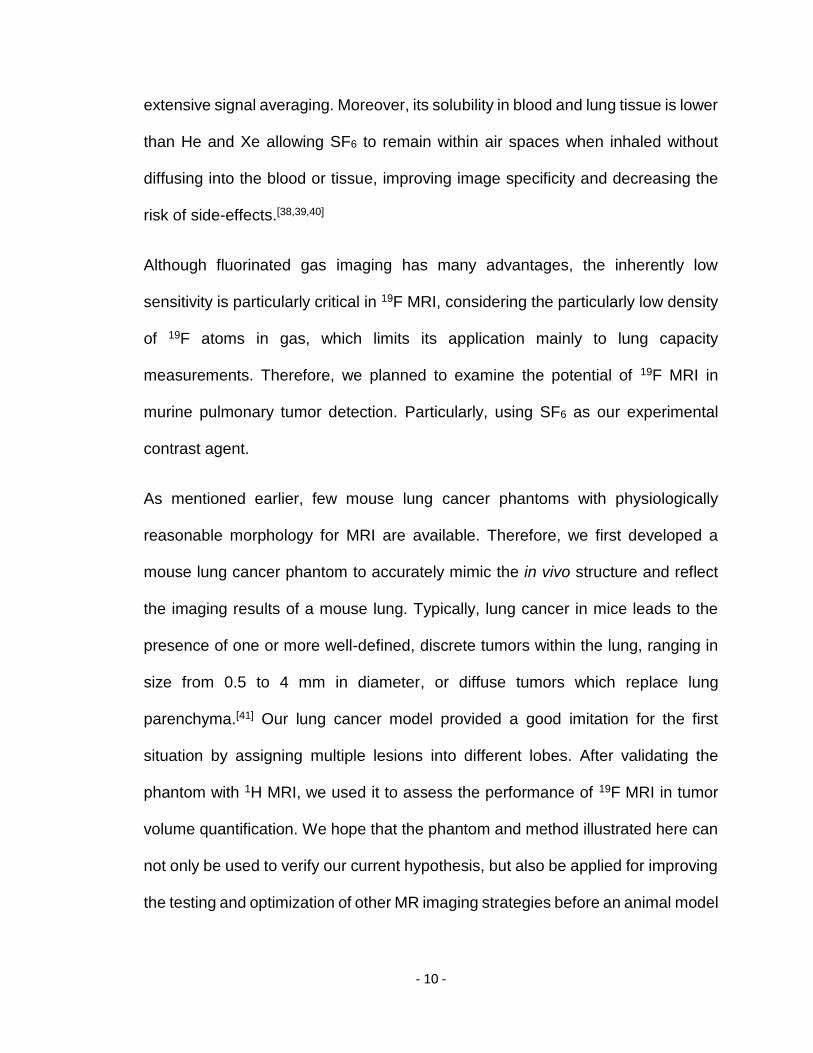
Although fluorinated gas imaging has many advantages, the inherently low
sensitivity is particularly critical in 19F MRI, considering the particularly low density
of 19F atoms in gas, which limits its application mainly to lung capacity
measurements. Therefore, we planned to examine the potential of 19F MRI in
murine pulmonary tumor detection. Particularly, using SF6 as our experimental
contrast agent.
As mentioned earlier, few mouse lung cancer phantoms with physiologically
reasonable morphology for MRI are available. Therefore, we first developed a
mouse lung cancer phantom to accurately mimic the in vivo structure and reflect
the imaging results of a mouse lung. Typically, lung cancer in mice leads to the
presence of one or more well-defined, discrete tumors within the lung, ranging in
size from 0.5 to 4 mm in diameter, or diffuse tumors which replace lung
parenchyma.[41] Our lung cancer model provided a good imitation for the first
situation by assigning multiple lesions into different lobes. After validating the
phantom with 1H MRI, we used it to assess the performance of 19F MRI in tumor
volume quantification. We hope that the phantom and method illustrated here can
not only be used to verify our current hypothesis, but also be applied for improving
the testing and optimization of other MR imaging strategies before an animal model

- 11 -
is used. We also expect that 19F MRI can measure tumor volume with high
accuracy.
- 12 -
Chapter 2
Method
Model
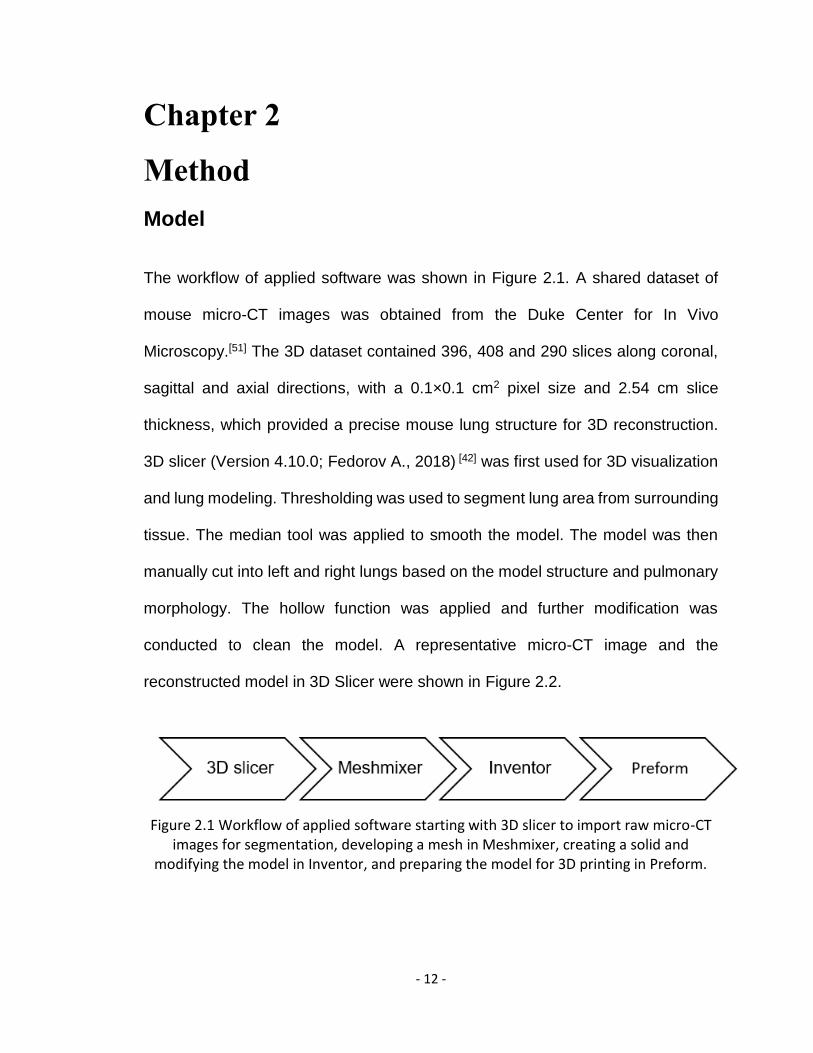
The workflow of applied software was shown in Figure 2.1. A shared dataset of
mouse micro-CT images was obtained from the Duke Center for In Vivo
Microscopy.[51] The 3D dataset contained 396, 408 and 290 slices along coronal,
sagittal and axial directions, with a 0.1×0.1 cm2 pixel size and 2.54 cm slice
thickness, which provided a precise mouse lung structure for 3D reconstruction.
3D slicer (Version 4.10.0; Fedorov A., 2018) [42] was first used for 3D visualization
and lung modeling. Thresholding was used to segment lung area from surrounding
tissue. The median tool was applied to smooth the model. The model was then
manually cut into left and right lungs based on the model structure and pulmonary
morphology. The hollow function was applied and further modification was
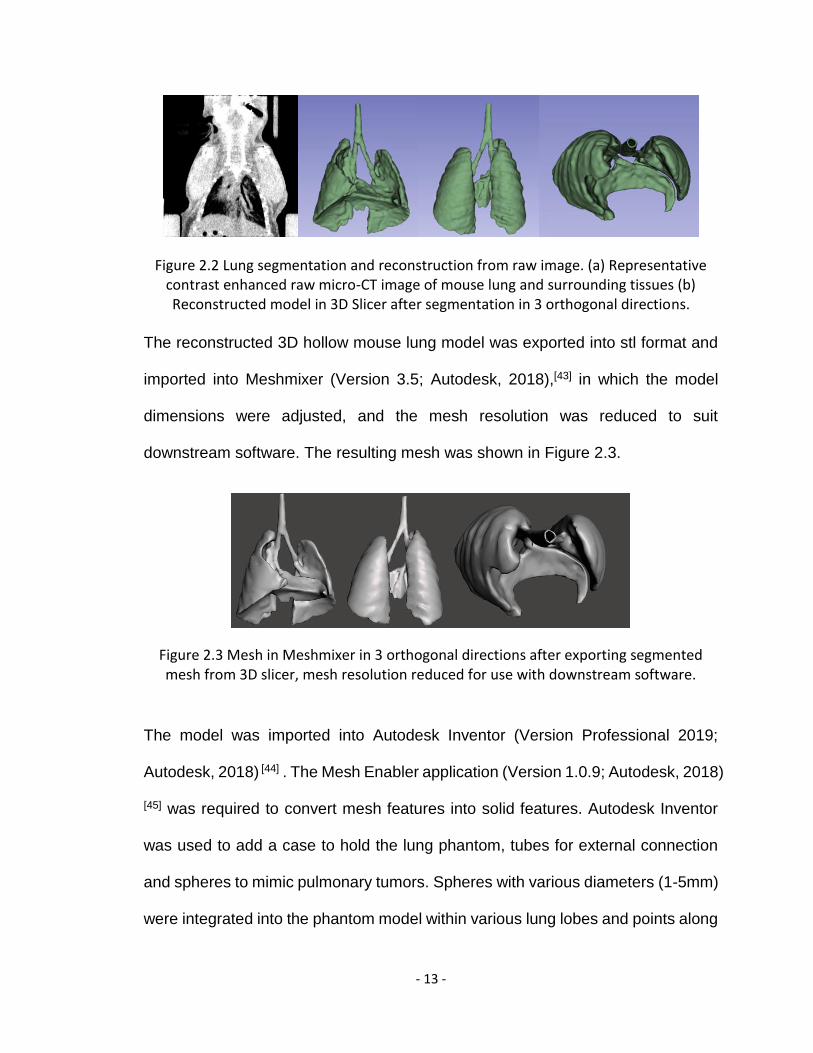
conducted to clean the model. A representative micro-CT image and the
reconstructed model in 3D Slicer were shown in Figure 2.2.
Figure 2.1 Workflow of applied software starting with 3D slicer to import raw micro-CT
images for segmentation, developing a mesh in Meshmixer, creating a solid and modifying the model in Inventor, and preparing the model for 3D printing in Preform.
- 13 -
Figure 2.2 Lung segmentation and reconstruction from raw image. (a) Representative contrast enhanced raw micro-CT image of mouse lung and surrounding tissues (b) Reconstructed model in 3D Slicer after segmentation in 3 orthogonal directions.
The reconstructed 3D hollow mouse lung model was exported into stl format and
imported into Meshmixer (Version 3.5; Autodesk, 2018),[43] in which the model
dimensions were adjusted, and the mesh resolution was reduced to suit
downstream software. The resulting mesh was shown in Figure 2.3.
Figure 2.3 Mesh in Meshmixer in 3 orthogonal directions after exporting segmented mesh from 3D slicer, mesh resolution reduced for use with downstream software.
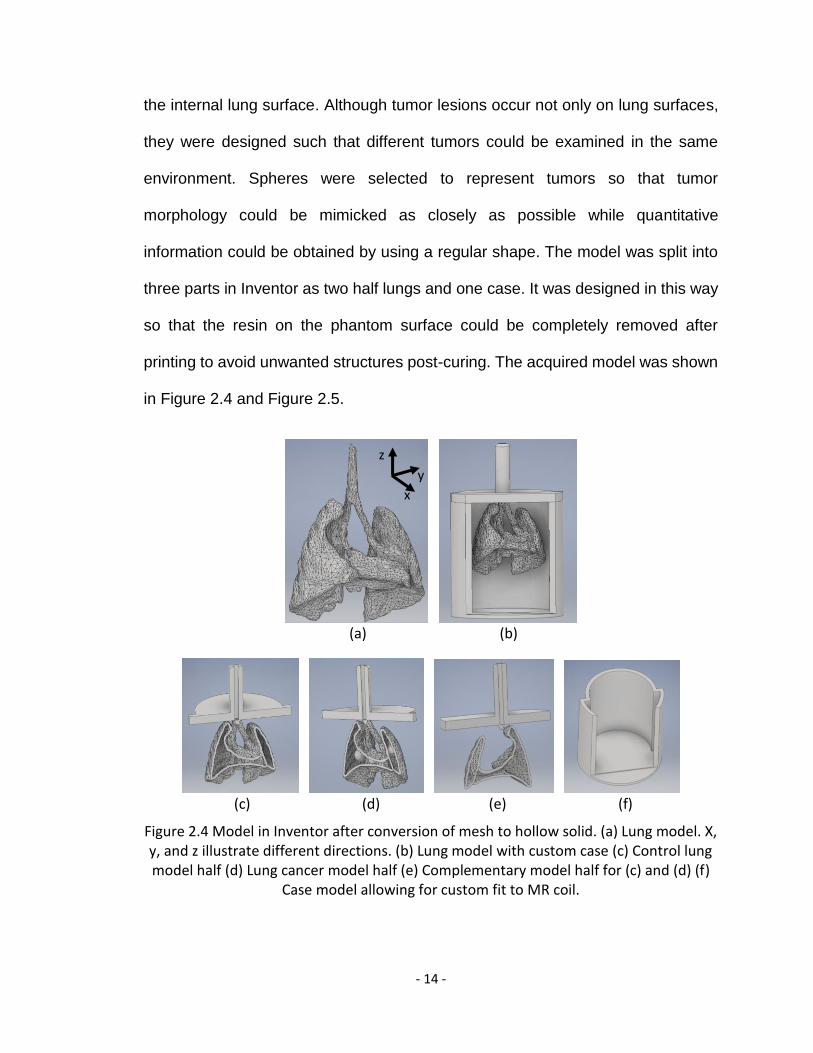
The model was imported into Autodesk Inventor (Version Professional 2019;
Autodesk, 2018) [44] . The Mesh Enabler application (Version 1.0.9; Autodesk, 2018)
[45] was required to convert mesh features into solid features. Autodesk Inventor
was used to add a case to hold the lung phantom, tubes for external connection
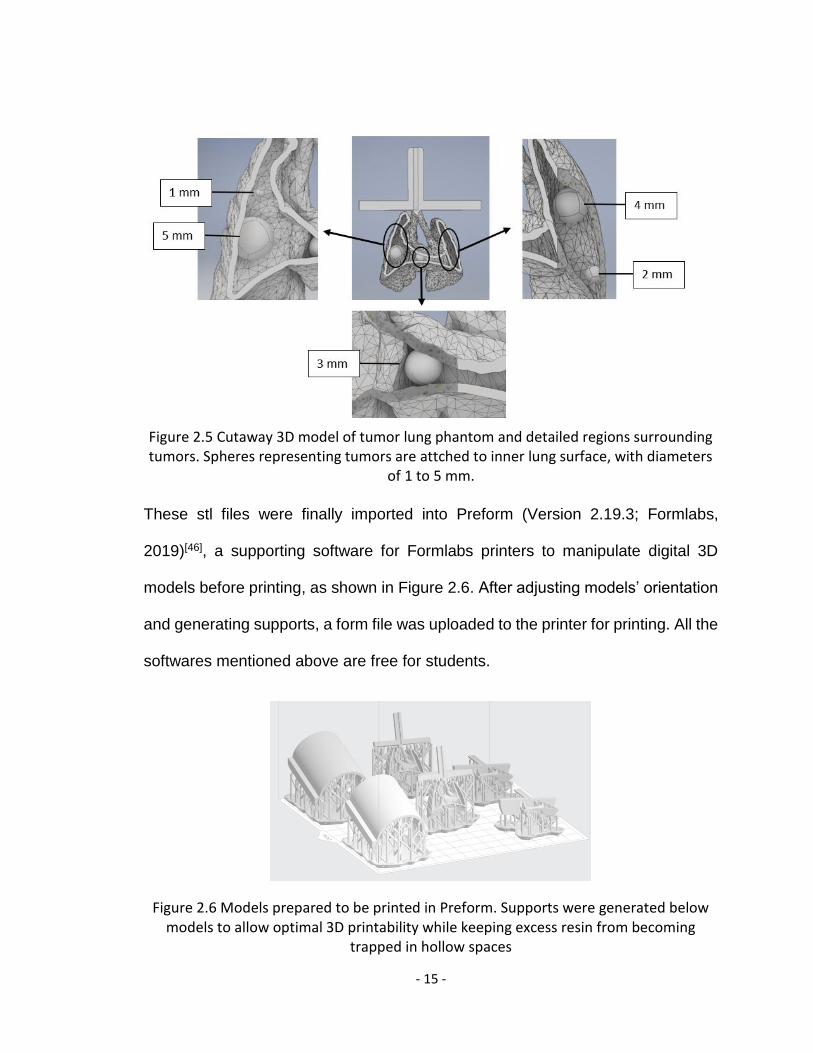
and spheres to mimic pulmonary tumors. Spheres with various diameters (1-5mm)
were integrated into the phantom model within various lung lobes and points along
- 14 -
the internal lung surface. Although tumor lesions occur not only on lung surfaces,
they were designed such that different tumors could be examined in the same
environment. Spheres were selected to represent tumors so that tumor
morphology could be mimicked as closely as possible while quantitative
information could be obtained by using a regular shape. The model was split into
three parts in Inventor as two half lungs and one case. It was designed in this way
so that the resin on the phantom surface could be completely removed after
printing to avoid unwanted structures post-curing. The acquired model was shown
in Figure 2.4 and Figure 2.5.
(a) (b)
(c) (d) (e) (f)
Figure 2.4 Model in Inventor after conversion of mesh to hollow solid. (a) Lung model. X, y, and z illustrate different directions. (b) Lung model with custom case (c) Control lung model half (d) Lung cancer model half (e) Complementary model half for (c) and (d) (f)
Case model allowing for custom fit to MR coil.
x
y
z
- 15 -
Figure 2.5 Cutaway 3D model of tumor lung phantom and detailed regions surrounding tumors. Spheres representing tumors are attched to inner lung surface, with diameters
of 1 to 5 mm.
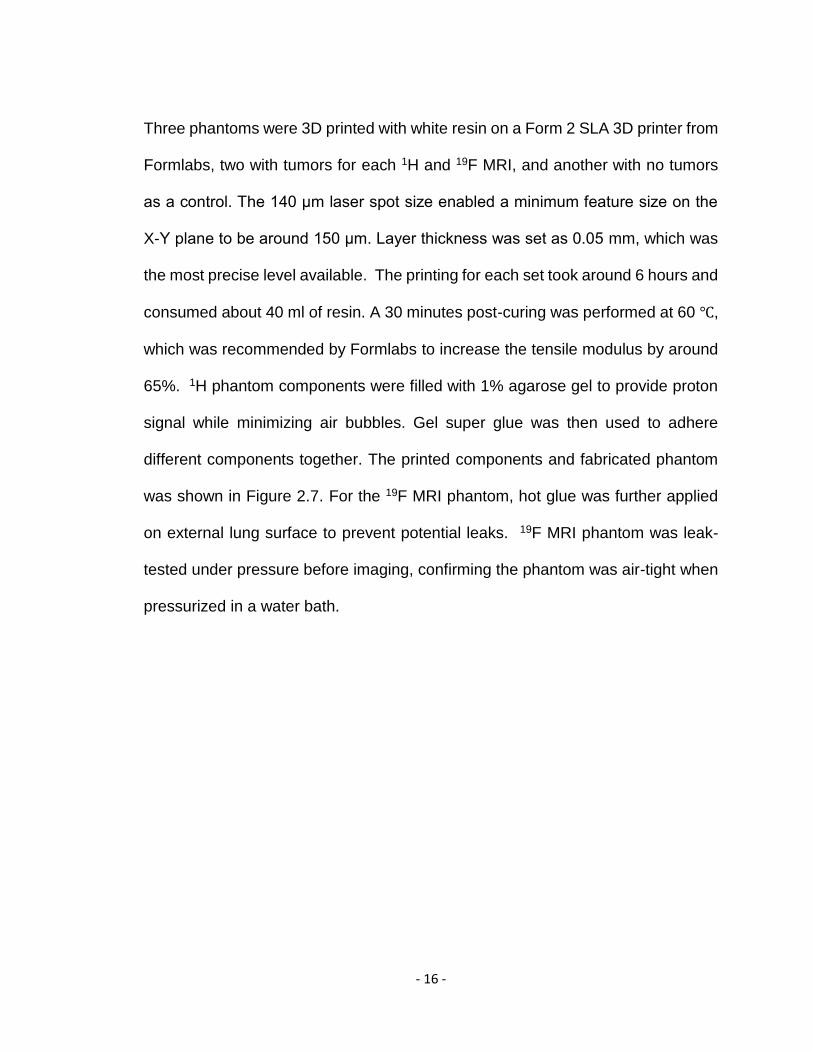
These stl files were finally imported into Preform (Version 2.19.3; Formlabs,
2019)[46], a supporting software for Formlabs printers to manipulate digital 3D
models before printing, as shown in Figure 2.6. After adjusting models’ orientation
and generating supports, a form file was uploaded to the printer for printing. All the
softwares mentioned above are free for students.
Figure 2.6 Models prepared to be printed in Preform. Supports were generated below models to allow optimal 3D printability while keeping excess resin from becoming
trapped in hollow spaces
- 16 -
Three phantoms were 3D printed with white resin on a Form 2 SLA 3D printer from
Formlabs, two with tumors for each 1H and 19F MRI, and another with no tumors
as a control. The 140 μm laser spot size enabled a minimum feature size on the
X-Y plane to be around 150 μm. Layer thickness was set as 0.05 mm, which was
the most precise level available. The printing for each set took around 6 hours and
consumed about 40 ml of resin. A 30 minutes post-curing was performed at 60 ℃,
which was recommended by Formlabs to increase the tensile modulus by around
65%. 1H phantom components were filled with 1% agarose gel to provide proton
signal while minimizing air bubbles. Gel super glue was then used to adhere
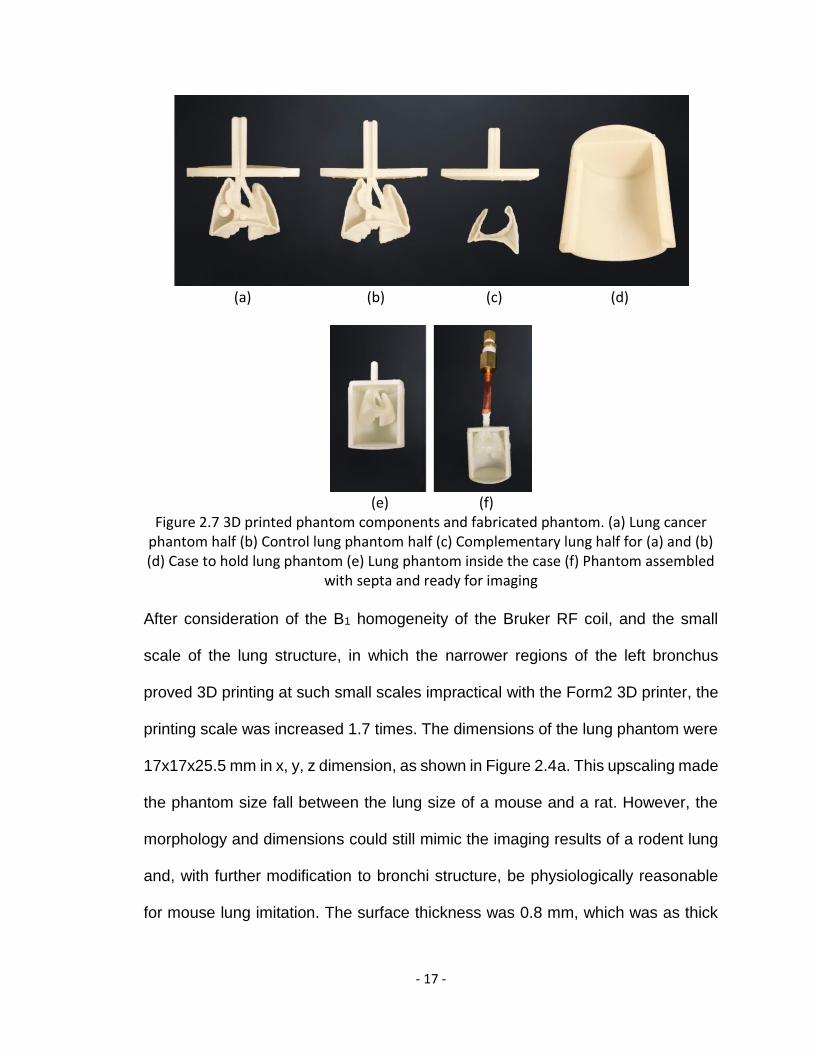
different components together. The printed components and fabricated phantom
was shown in Figure 2.7. For the 19F MRI phantom, hot glue was further applied
on external lung surface to prevent potential leaks. 19F MRI phantom was leak-
tested under pressure before imaging, confirming the phantom was air-tight when
pressurized in a water bath.
- 17 -
(a) (b) (c) (d)
(e) (f)
Figure 2.7 3D printed phantom components and fabricated phantom. (a) Lung cancer phantom half (b) Control lung phantom half (c) Complementary lung half for (a) and (b) (d) Case to hold lung phantom (e) Lung phantom inside the case (f) Phantom assembled
with septa and ready for imaging
After consideration of the B1 homogeneity of the Bruker RF coil, and the small
scale of the lung structure, in which the narrower regions of the left bronchus
proved 3D printing at such small scales impractical with the Form2 3D printer, the
printing scale was increased 1.7 times. The dimensions of the lung phantom were
17x17x25.5 mm in x, y, z dimension, as shown in Figure 2.4a. This upscaling made
the phantom size fall between the lung size of a mouse and a rat. However, the
morphology and dimensions could still mimic the imaging results of a rodent lung
and, with further modification to bronchi structure, be physiologically reasonable
for mouse lung imitation. The surface thickness was 0.8 mm, which was as thick
- 18 -
as possible so that the phantom could prevent SF6 leaking from particularly thin
locations within the 3D print, hold pressure induced by hydrogel, and support the
vacuum induced by air extraction while preventing unwanted interaction between
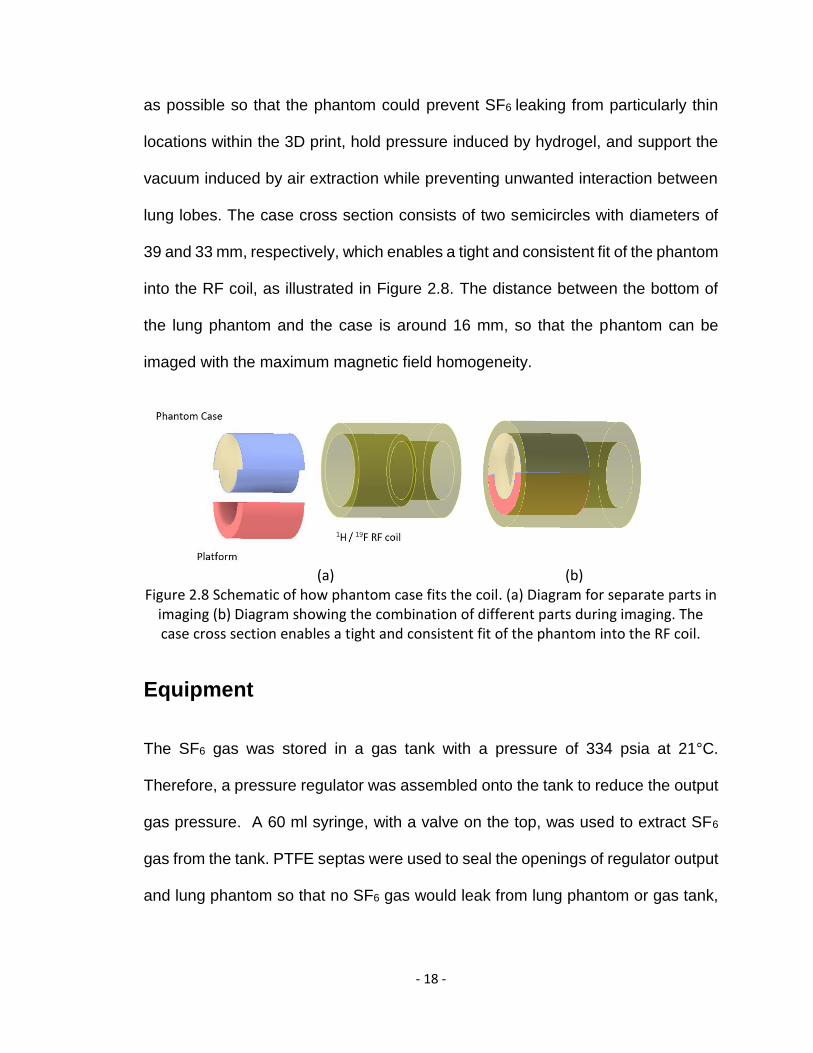
lung lobes. The case cross section consists of two semicircles with diameters of
39 and 33 mm, respectively, which enables a tight and consistent fit of the phantom
into the RF coil, as illustrated in Figure 2.8. The distance between the bottom of
the lung phantom and the case is around 16 mm, so that the phantom can be
imaged with the maximum magnetic field homogeneity.
(a) (b) Figure 2.8 Schematic of how phantom case fits the coil. (a) Diagram for separate parts in
imaging (b) Diagram showing the combination of different parts during imaging. The case cross section enables a tight and consistent fit of the phantom into the RF coil.
Equipment
The SF6 gas was stored in a gas tank with a pressure of 334 psia at 21°C.
Therefore, a pressure regulator was assembled onto the tank to reduce the output
gas pressure. A 60 ml syringe, with a valve on the top, was used to extract SF6
gas from the tank. PTFE septas were used to seal the openings of regulator output
and lung phantom so that no SF6 gas would leak from lung phantom or gas tank,
- 19 -
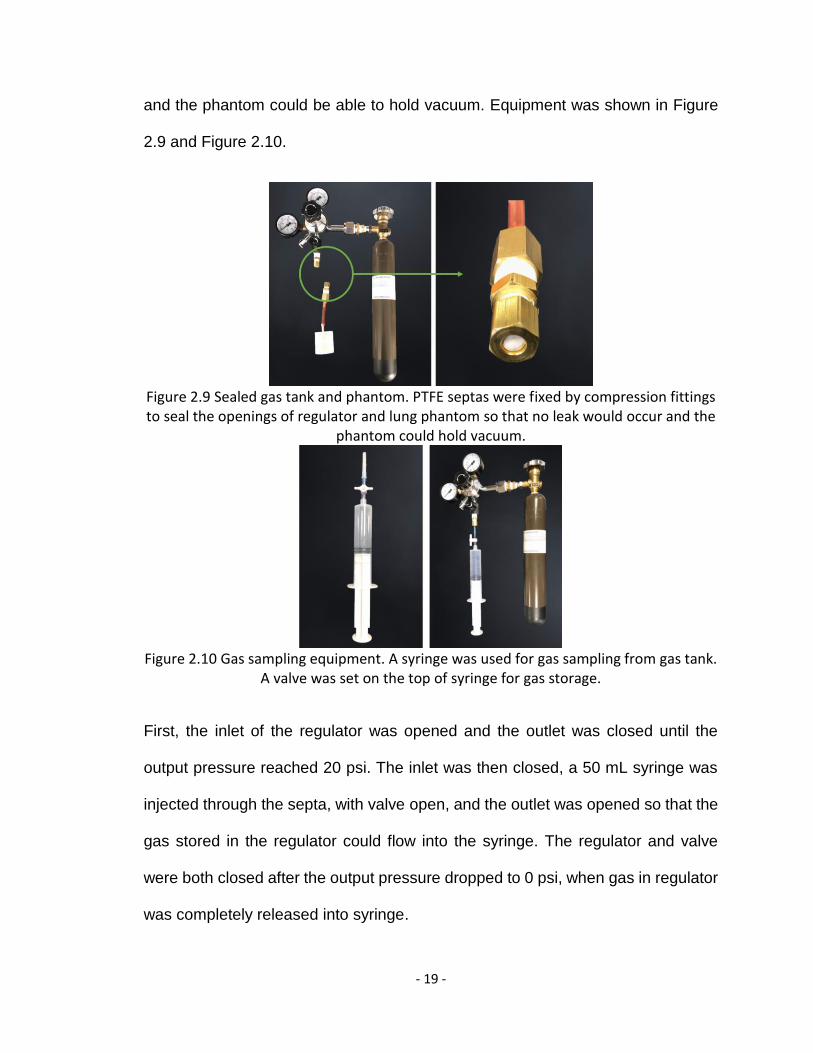
and the phantom could be able to hold vacuum. Equipment was shown in Figure
2.9 and Figure 2.10.
Figure 2.9 Sealed gas tank and phantom. PTFE septas were fixed by compression fittings to seal the openings of regulator and lung phantom so that no leak would occur and the
phantom could hold vacuum.
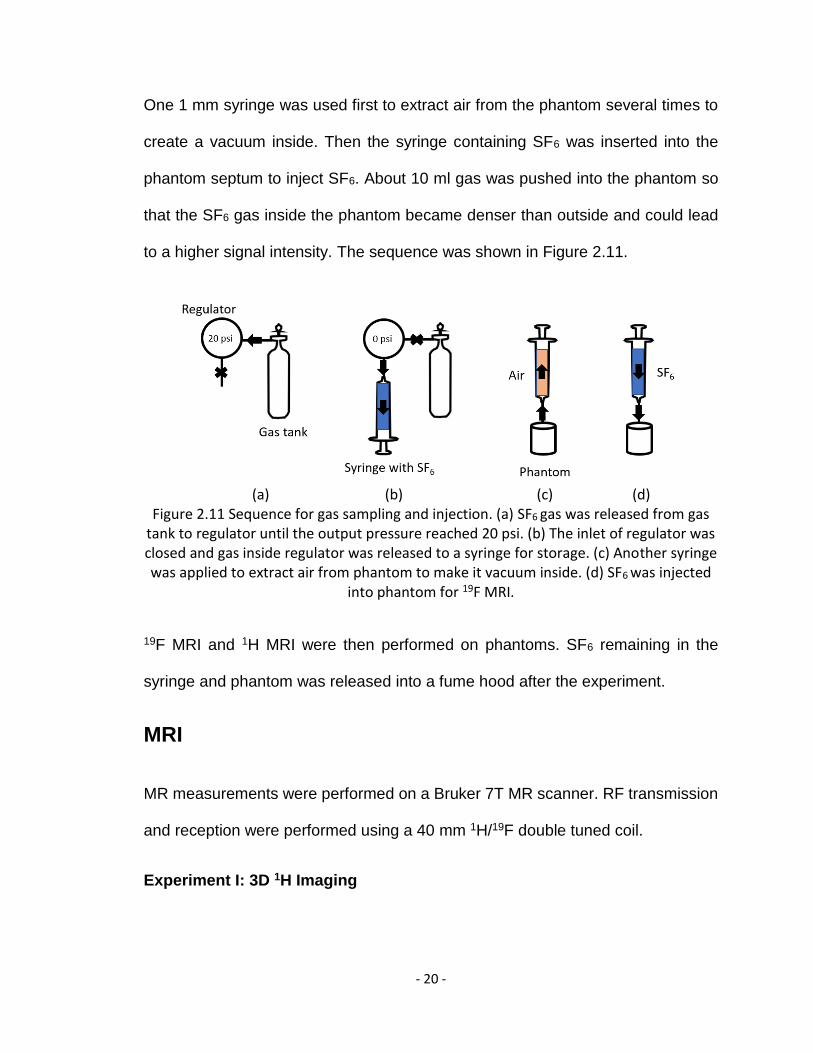
Figure 2.10 Gas sampling equipment. A syringe was used for gas sampling from gas tank.
A valve was set on the top of syringe for gas storage.
First, the inlet of the regulator was opened and the outlet was closed until the
output pressure reached 20 psi. The inlet was then closed, a 50 mL syringe was
injected through the septa, with valve open, and the outlet was opened so that the
gas stored in the regulator could flow into the syringe. The regulator and valve
were both closed after the output pressure dropped to 0 psi, when gas in regulator
was completely released into syringe.
- 20 -
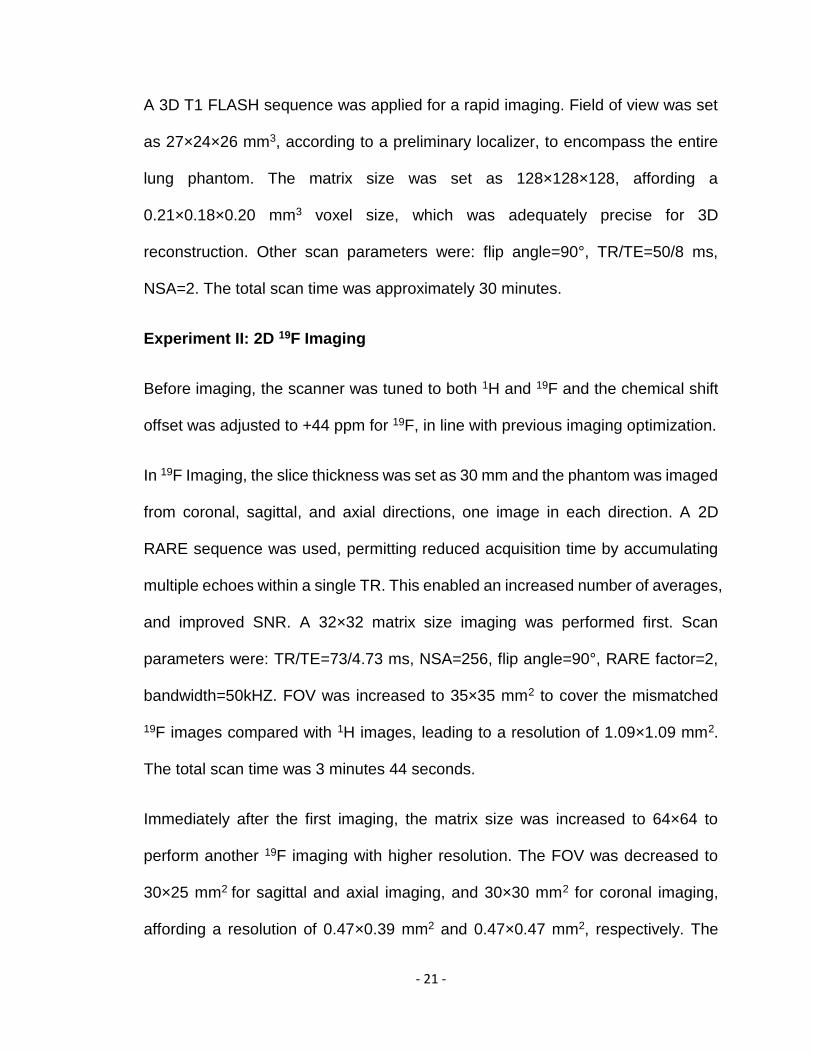
One 1 mm syringe was used first to extract air from the phantom several times to
create a vacuum inside. Then the syringe containing SF6 was inserted into the
phantom septum to inject SF6. About 10 ml gas was pushed into the phantom so
that the SF6 gas inside the phantom became denser than outside and could lead
to a higher signal intensity. The sequence was shown in Figure 2.11.
(a) (b) (c) (d)
Figure 2.11 Sequence for gas sampling and injection. (a) SF6 gas was released from gas tank to regulator until the output pressure reached 20 psi. (b) The inlet of regulator was closed and gas inside regulator was released to a syringe for storage. (c) Another syringe was applied to extract air from phantom to make it vacuum inside. (d) SF6 was injected
into phantom for 19F MRI.
19F MRI and 1H MRI were then performed on phantoms. SF6 remaining in the
syringe and phantom was released into a fume hood after the experiment.
MRI
MR measurements were performed on a Bruker 7T MR scanner. RF transmission
and reception were performed using a 40 mm 1H/19F double tuned coil.
Experiment I: 3D 1H Imaging
- 21 -
A 3D T1 FLASH sequence was applied for a rapid imaging. Field of view was set
as 27×24×26 mm3, according to a preliminary localizer, to encompass the entire
lung phantom. The matrix size was set as 128×128×128, affording a
0.21×0.18×0.20 mm3 voxel size, which was adequately precise for 3D
reconstruction. Other scan parameters were: flip angle=90°, TR/TE=50/8 ms,
NSA=2. The total scan time was approximately 30 minutes.
Experiment II: 2D 19F Imaging
Before imaging, the scanner was tuned to both 1H and 19F and the chemical shift
offset was adjusted to +44 ppm for 19F, in line with previous imaging optimization.
In 19F Imaging, the slice thickness was set as 30 mm and the phantom was imaged
from coronal, sagittal, and axial directions, one image in each direction. A 2D
RARE sequence was used, permitting reduced acquisition time by accumulating
multiple echoes within a single TR. This enabled an increased number of averages,
and improved SNR. A 32×32 matrix size imaging was performed first. Scan
parameters were: TR/TE=73/4.73 ms, NSA=256, flip angle=90°, RARE factor=2,
bandwidth=50kHZ. FOV was increased to 35×35 mm2 to cover the mismatched
19F images compared with 1H images, leading to a resolution of 1.09×1.09 mm2.
The total scan time was 3 minutes 44 seconds.
Immediately after the first imaging, the matrix size was increased to 64×64 to
perform another 19F imaging with higher resolution. The FOV was decreased to
30×25 mm2 for sagittal and axial imaging, and 30×30 mm2 for coronal imaging,
affording a resolution of 0.47×0.39 mm2 and 0.47×0.47 mm2, respectively. The
- 22 -
scan took around 30 minutes. Scan parameters were: TR/TE=73/4.73 ms,
NSA=1024, flip angle=90°, RARE factor=2, bandwidth=50kHZ, slice thickness=28
mm.
Image Analysis
3D reconstruction based on 1H MRI
The 3D 2dseq data for control and tumor phantoms from Bruker ParaVision were
converted to NIfTI using an open source program (GitHub, 2017) [47] and imported
into 3D slicer. Lung area was isolated from tumor lung image by threshold-based
segmentation. Images from both phantoms were overlaid and co-registered in 3D
slicer. Tumor area was defined accordingly and marked on 2D images manually.
A 3D tumor-only model was then generated based on the overlap of tumor and
control phantoms and was integrated into the previous lung model, creating a
model with both lung and tumors apparent. Opacity of lung surface was adjusted
to make tumors inside visible. Smoothing and noise reduction were applied for
presentation purpose.
Home-built Matlab code was used for quantitative analysis of MR images.
Tumor volume quantification with 1H MRI
Axial slices were used for tumor volume calculation. Slices with tumors were
selected based on tumor location in the model. Images of control and tumor lung
phantom were compared slice by slice to determine the slices with a best match
which overcame the mis-match along z-axis of the magnetic field. Matched slices
- 23 -
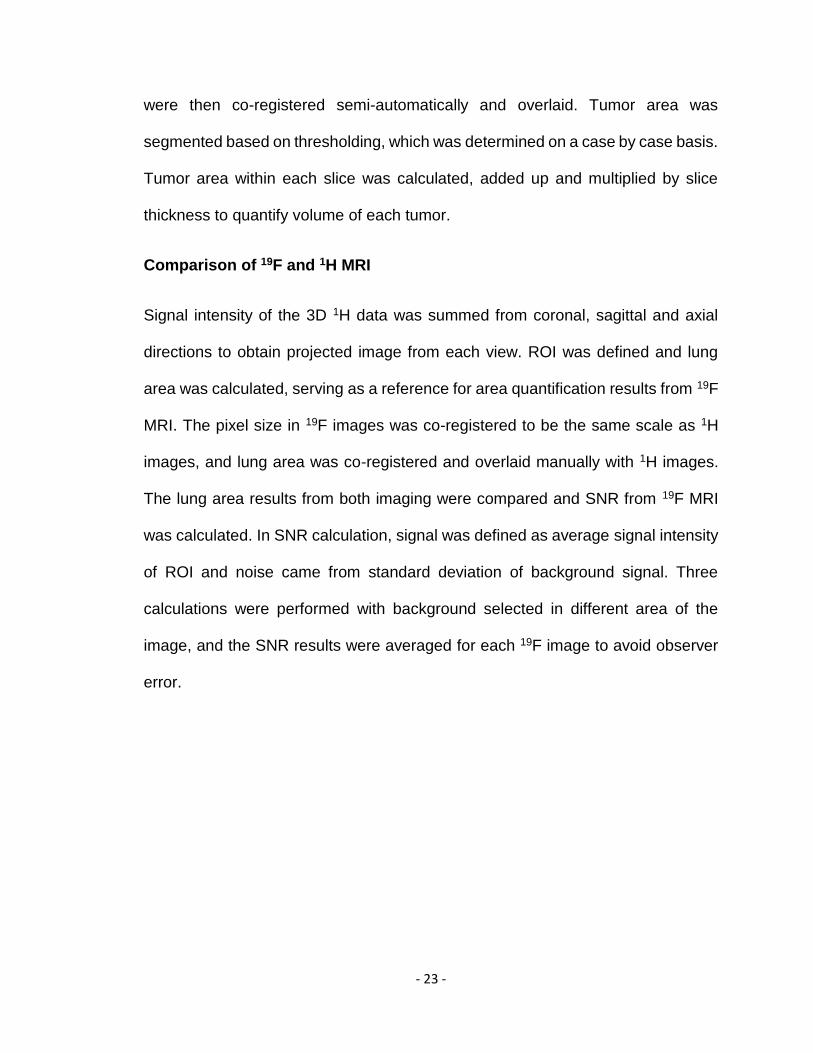
were then co-registered semi-automatically and overlaid. Tumor area was
segmented based on thresholding, which was determined on a case by case basis.
Tumor area within each slice was calculated, added up and multiplied by slice
thickness to quantify volume of each tumor.
Comparison of 19F and 1H MRI
Signal intensity of the 3D 1H data was summed from coronal, sagittal and axial
directions to obtain projected image from each view. ROI was defined and lung
area was calculated, serving as a reference for area quantification results from 19F
MRI. The pixel size in 19F images was co-registered to be the same scale as 1H
images, and lung area was co-registered and overlaid manually with 1H images.
The lung area results from both imaging were compared and SNR from 19F MRI
was calculated. In SNR calculation, signal was defined as average signal intensity
of ROI and noise came from standard deviation of background signal. Three
calculations were performed with background selected in different area of the
image, and the SNR results were averaged for each 19F image to avoid observer
error.
- 24 -
Chapter 3
Results 1H MRI accuracy in reproducing tumor location and volume
A 3D tumor lung model was successfully reconstructed based on the 3D 1H MRI
data, as shown in Figure 3.1.
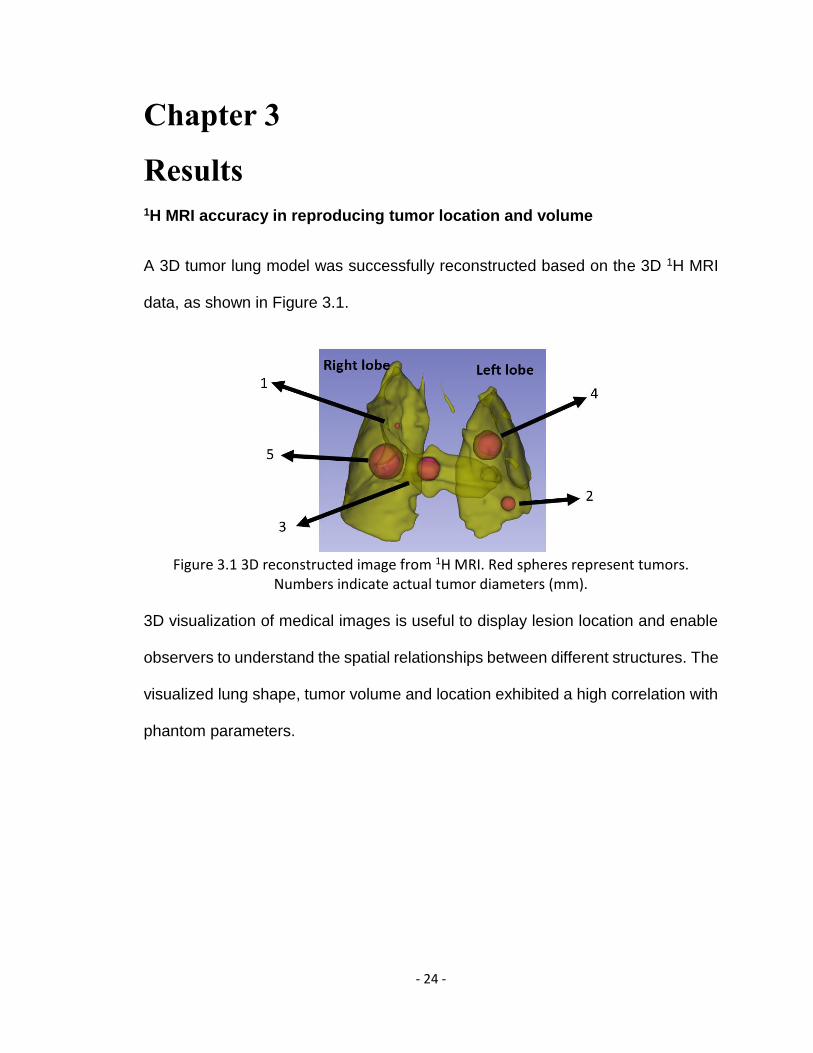
Figure 3.1 3D reconstructed image from 1H MRI. Red spheres represent tumors.
Numbers indicate actual tumor diameters (mm).
3D visualization of medical images is useful to display lesion location and enable
observers to understand the spatial relationships between different structures. The
visualized lung shape, tumor volume and location exhibited a high correlation with
phantom parameters.
- 25 -
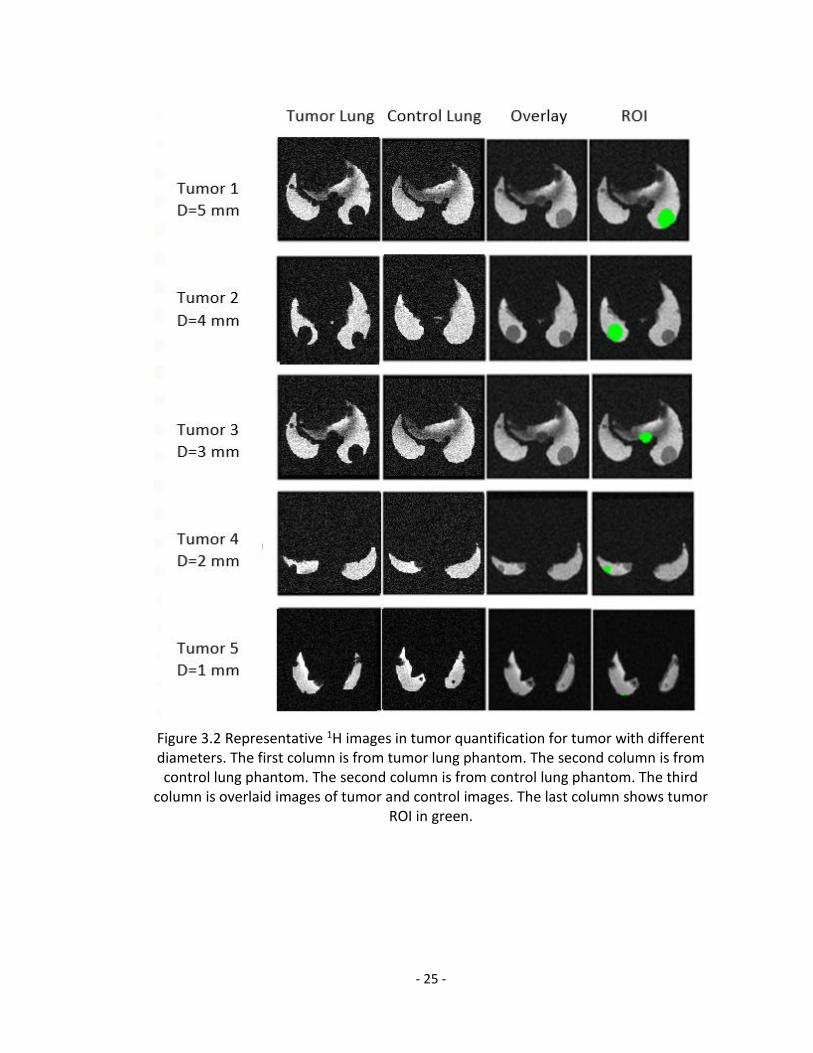
Figure 3.2 Representative 1H images in tumor quantification for tumor with different diameters. The first column is from tumor lung phantom. The second column is from control lung phantom. The second column is from control lung phantom. The third
column is overlaid images of tumor and control images. The last column shows tumor ROI in green.
- 26 -
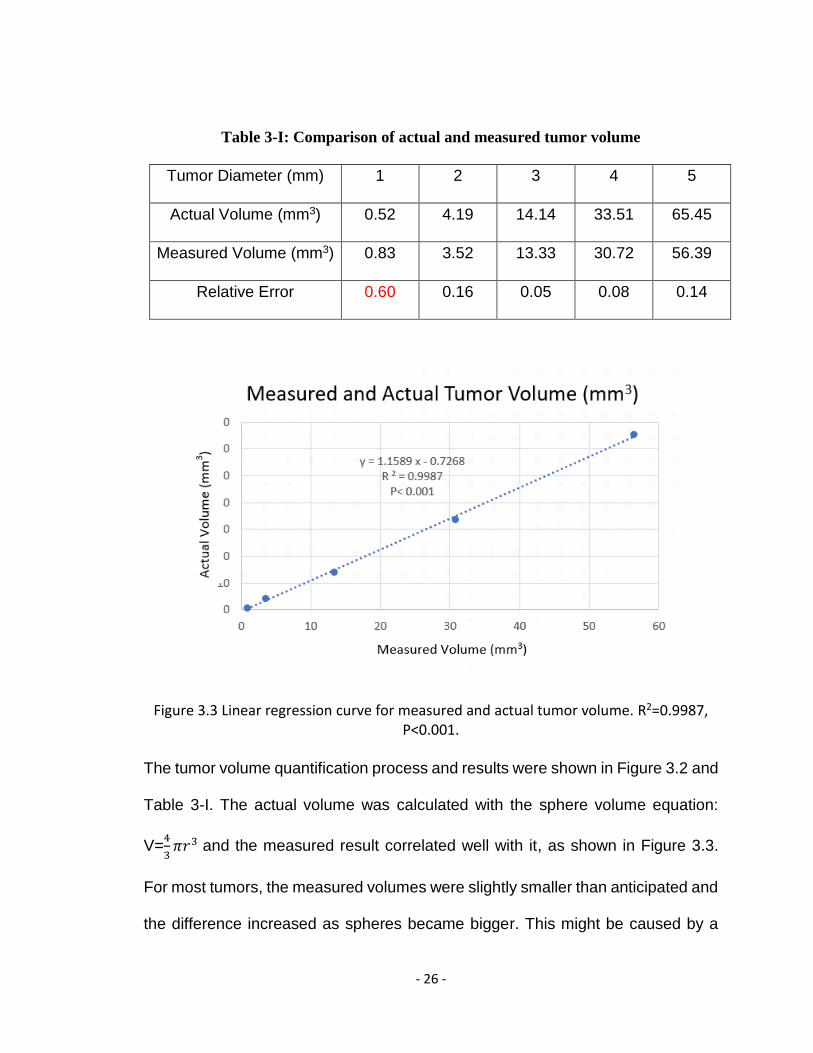
Table 3-I: Comparison of actual and measured tumor volume
Tumor Diameter (mm) 1 2 3 4 5
Actual Volume (mm3) 0.52 4.19 14.14 33.51 65.45
Measured Volume (mm3) 0.83 3.52 13.33 30.72 56.39
Relative Error 0.60 0.16 0.05 0.08 0.14
Figure 3.3 Linear regression curve for measured and actual tumor volume. R2=0.9987, P<0.001.
The tumor volume quantification process and results were shown in Figure 3.2 and
Table 3-I. The actual volume was calculated with the sphere volume equation:
V=4
3𝜋𝑟3 and the measured result correlated well with it, as shown in Figure 3.3.
For most tumors, the measured volumes were slightly smaller than anticipated and
the difference increased as spheres became bigger. This might be caused by a
- 27 -
tumor overlap with lung surface, implemented to improve the 3D printability of the
phantom. These decreased sphere volumes that could be measured and, as tumor
volume increased, the overlap area always tended to increase. The measured
volume was larger than actual volume and the relative error was greatest in D=1
mm tumor. This may come from observer error due to the small tumor size. An
improved co-registration strategy and a blind ROI segmentation from multiple
observers will help to reduce the error.
- 28 -
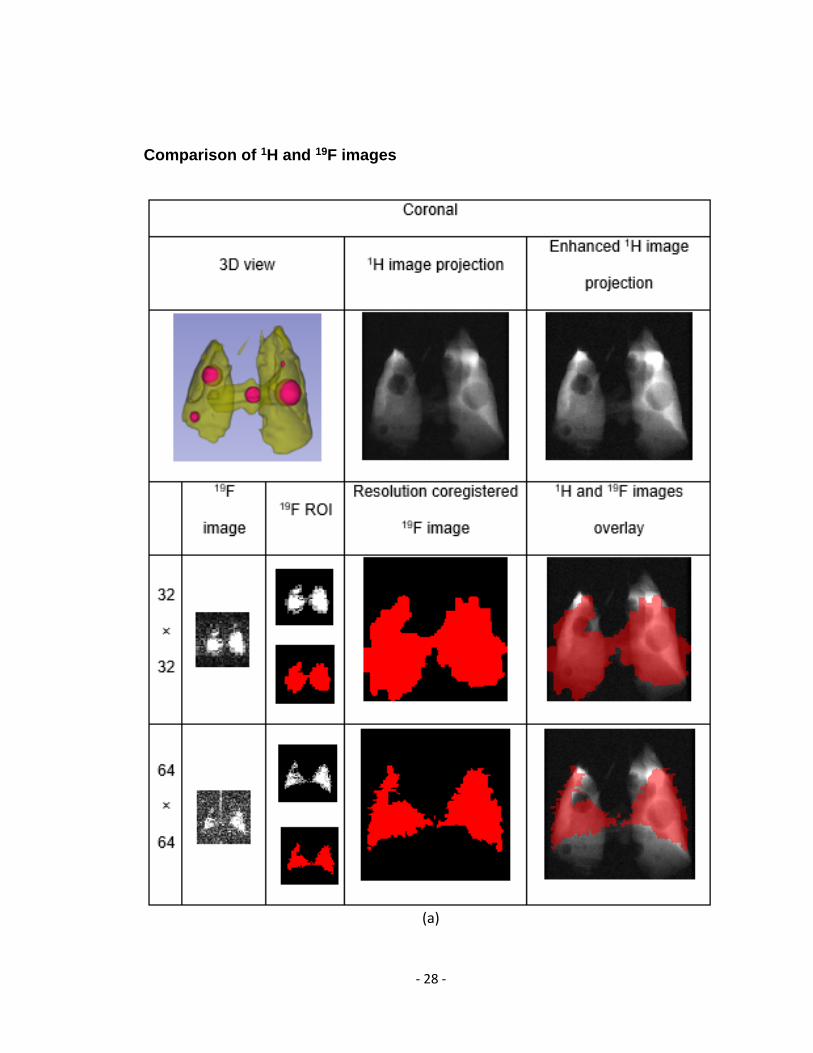
Comparison of 1H and 19F images
(a)
- 29 -
(b)
- 30 -
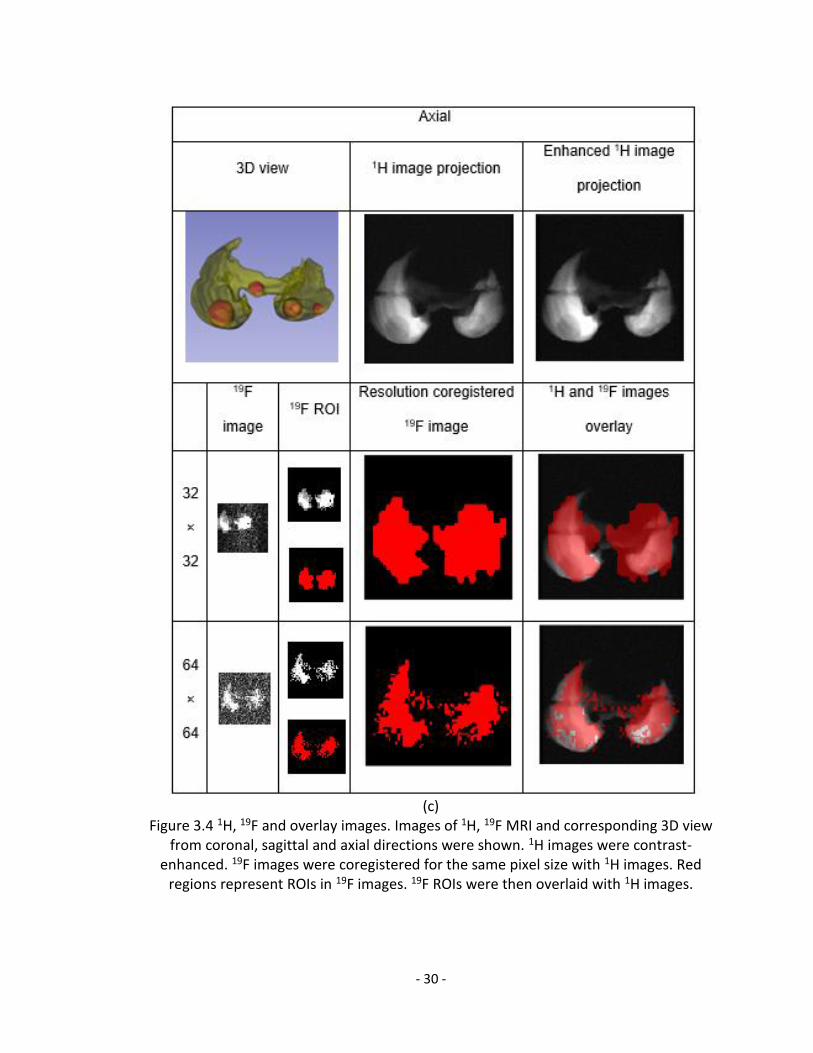
(c)
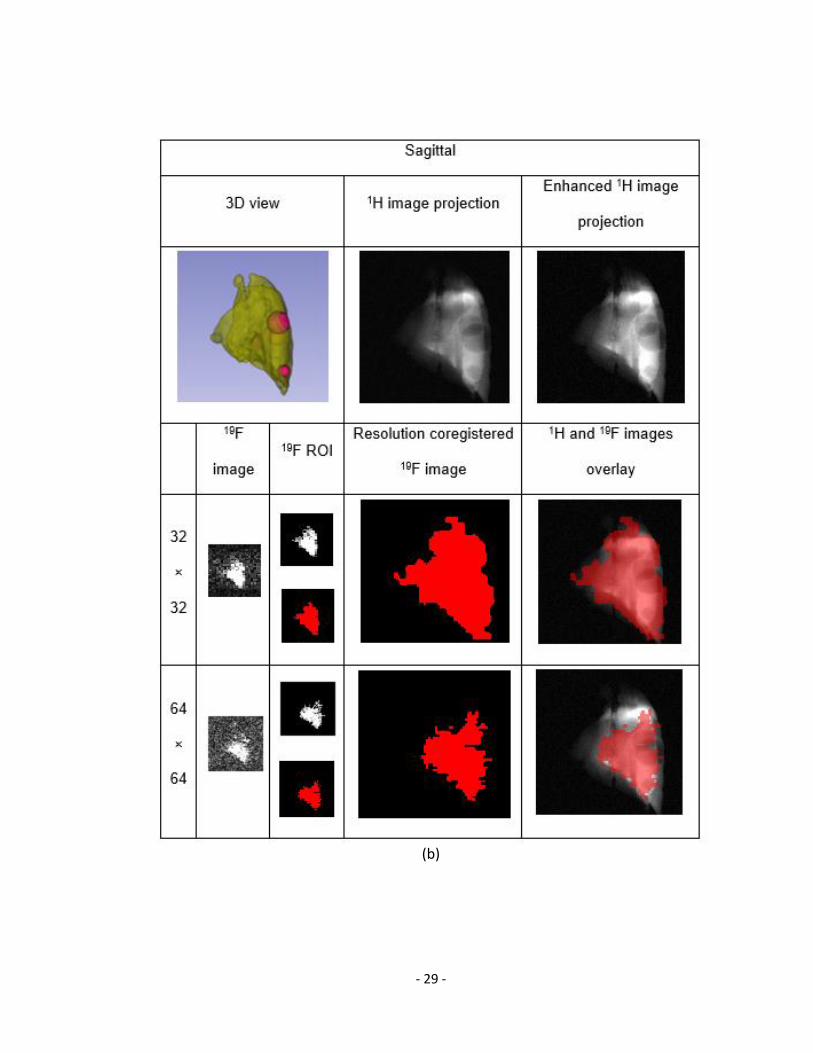
Figure 3.4 1H, 19F and overlay images. Images of 1H, 19F MRI and corresponding 3D view from coronal, sagittal and axial directions were shown. 1H images were contrast-
enhanced. 19F images were coregistered for the same pixel size with 1H images. Red regions represent ROIs in 19F images. 19F ROIs were then overlaid with 1H images.
- 31 -
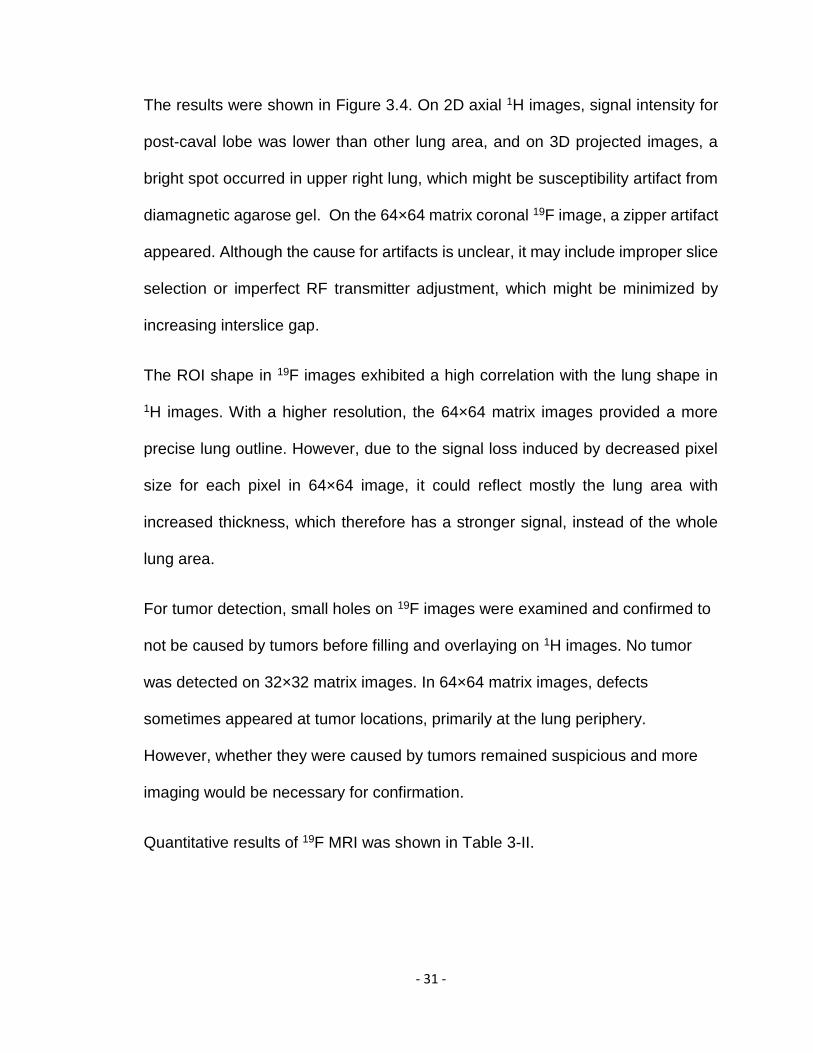
The results were shown in Figure 3.4. On 2D axial 1H images, signal intensity for
post-caval lobe was lower than other lung area, and on 3D projected images, a
bright spot occurred in upper right lung, which might be susceptibility artifact from
diamagnetic agarose gel. On the 64×64 matrix coronal 19F image, a zipper artifact
appeared. Although the cause for artifacts is unclear, it may include improper slice
selection or imperfect RF transmitter adjustment, which might be minimized by
increasing interslice gap.
The ROI shape in 19F images exhibited a high correlation with the lung shape in
1H images. With a higher resolution, the 64×64 matrix images provided a more
precise lung outline. However, due to the signal loss induced by decreased pixel
size for each pixel in 64×64 image, it could reflect mostly the lung area with
increased thickness, which therefore has a stronger signal, instead of the whole
lung area.
For tumor detection, small holes on 19F images were examined and confirmed to
not be caused by tumors before filling and overlaying on 1H images. No tumor
was detected on 32×32 matrix images. In 64×64 matrix images, defects
sometimes appeared at tumor locations, primarily at the lung periphery.
However, whether they were caused by tumors remained suspicious and more
imaging would be necessary for confirmation.
Quantitative results of 19F MRI was shown in Table 3-II.
- 32 -
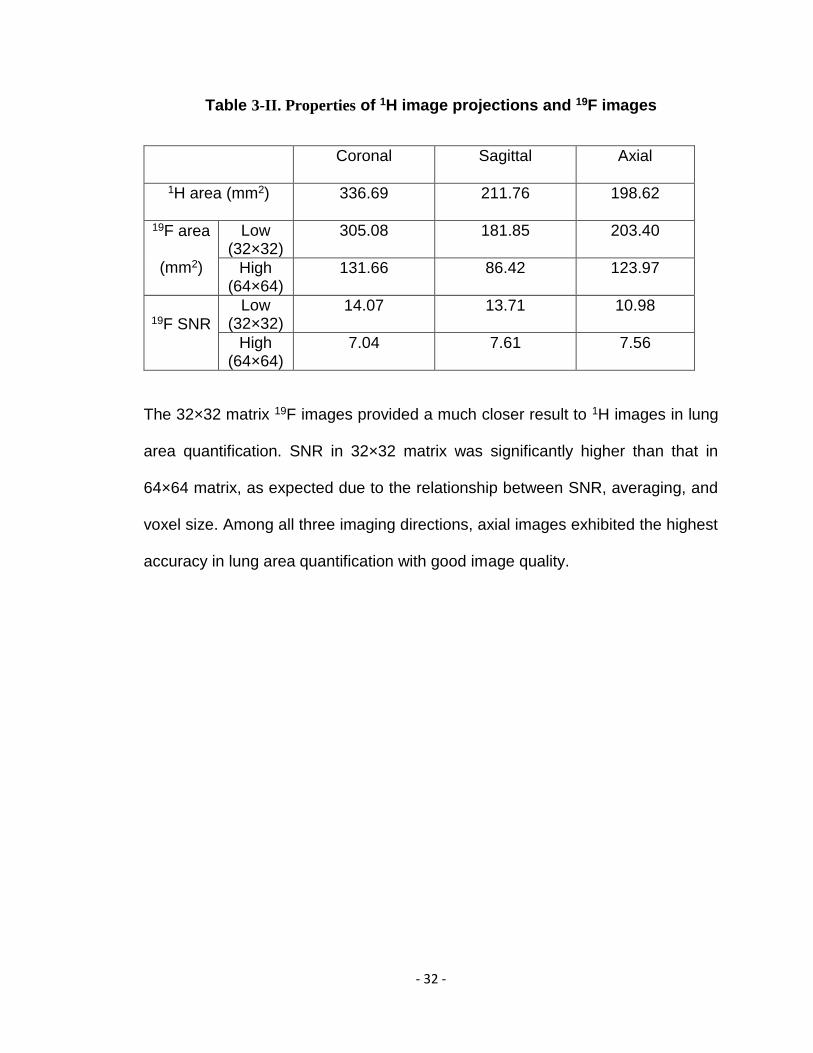
Table 3-II. Properties of 1H image projections and 19F images
Coronal Sagittal Axial
1H area (mm2) 336.69 211.76 198.62
19F area
(mm2)
Low (32×32)
305.08 181.85 203.40
High (64×64)
131.66 86.42 123.97
19F SNR
Low (32×32)
14.07 13.71 10.98
High (64×64)
7.04 7.61 7.56
The 32×32 matrix 19F images provided a much closer result to 1H images in lung
area quantification. SNR in 32×32 matrix was significantly higher than that in
64×64 matrix, as expected due to the relationship between SNR, averaging, and
voxel size. Among all three imaging directions, axial images exhibited the highest
accuracy in lung area quantification with good image quality.
- 33 -
Chapter 4
Discussion
The mouse lung cancer phantom examined here was successfully fabricated and
validated by 1H MRI though a 3D reconstructed model and tumor quantification
results. Although artifacts were present, the ROI shape in 19F images exhibited a
high correlation with the lung shape in 1H images. The 19F imaging with 32×32
matrix provided a much closer lung area quantification result to projected 1H
imaging and higher SNR. On the other hand, the 64×64 matrix 19F imaging seemed
to reflect some tumor existence, although more imaging would be required for
confirmation. The spatial resolution for the 64×64 matrix imaging was relatively
small for a SF6 19F MRI, which is usually larger than 0.49 mm2.
The lung outline in 32×32 matrix 19F images sometimes extended that of 1H images,
which may be due to low resolution and noise around ROI. The latter made ROI
definition less certain, which may have led to some quantification error. The
repetition and averaging for SNR calculation might help to increase accuracy.
Tumors were not readily visible in 19F MRI, particularly when they weren’t located
peripherally in the image’s perspective. This is because there was still SF6 gas
within the large voxels including the tumors and the low sensitivity of 19F MRI made
it hard to differentiate the signal intensity relative to the area without a tumor.
This phantom primarily served to test preclinical animal 19F MRI. Novel lung
phantoms which are more physiologically significant could be developed based on
- 34 -
it. For example, inside the phantom could be integrated with sponge of similar
porosity as lung tissue or similar structure during modeling to mimic the gas
distribution in real lung tissue. With a material having similar magnetic
susceptibility to lung tissue, the susceptibility artifact can be mimicked as well.
Furthermore, flexible materials can be used to study artifacts caused by lung
motion due to breath for imaging and gating strategy refinement.
With modification to bronchial structures, the phantom could be further downscaled.
With a modified scale, the phantom could be used to mimic rodents of different
species with differing lung sizes. Furthermore, the fabrication and validation
strategy illustrated could be widely applicable on a variety of experimental animals.
For larger animals, it should be easier to apply, avoiding the printing issue present
at smaller scale. In the current model, the lung was separated into left and right
parts. Space for heart was vacated properly and presents image quality similar to
that of preclinical mouse lung MR images. Different lobes in the right lung, i.e.
superior, middle, inferior and post-caval lobes could be specified for a more precise
investigation in the future.
In image analysis, the overlay of 19F images and 1H images was manually co-
registered. A further improvement would be the addition of a 1H and 19F MRI image-
able standard during imaging, potentially in cross shape, which could serve as a
landmark for mismatch co-registration regarding distance and angle.
A potential solution to make the tumor area visible is to reduce slice thickness.
However, based on the 64×64 matrix images, significant signal loss would occur
- 35 -
when pixel size or slice thickness was reduced, preventing 19F MRI from reflecting
the actual lung shape. Although 19F MRI did not delineate tumors clearly in our
experiments, it still exhibited its ability to indicate lung shape and at least the
potential for tumor detection. To improve image quality, other imaging strategies
can also be examined. For instance, from the research of Wolf et al, C2F6, with a
longer T1 and thus a lower bandwidth than SF6 at 1.5T, has lower electronic noise
which leads to higher SNR per acquisition, making it a promising substitute for
SF6.[48] Additionally, UTE sequence, which enables a minimized TE and is suitable
for objects with short T2, may also increase signal intensity. In addition, since
higher magnetic fields tend to induce higher susceptibility, effecting the image
quality, a lower magnetic field may also be applied. In a further study, the image
quality for a mixture of 80% SF6 and 20% O2 should also be examined, which is
common protocol for clinical study.
It is important to note that in pulmonary tumor quantification, 19F MRI is mainly
applicable for those lesions which are intrapulmonary and in early stage, when the
tumor has not blocked any airway. Otherwise, a larger ventilation defect will occur
and lead to a larger quantification result. Since no reliable prediction of tumor-
induced airway block is available, we suggest that 1H MRI is applied as a
supplement to assess whether the signal void is caused wholly by tumor or a
blocked airway, as well as quantifying tumors developing outside the lung.
Although 19F MRI with SF6 did not perform well in tumor quantification in this
experiment, the success of 1H imaging motivates the testing of a liquid 19F MRI
strategy on this phantom. Liquid ventilation is a technique in which the lungs are
- 36 -
filled with highly oxygenated perfluorochemical liquid to support gas exchange.
This technique is primarily used for ventilation issue caused by lung injury while
studies on its applications in other areas are in progress as well, and its feasibility
has been shown in both animals and humans. As the oxygen carrier, PFC liquids
have the advantages of high oxygen solubility and biological inertness. On the
other hand, they are also good contrast agents for MRI.[49] Although more
technically complex than a gas 19F MRI, liquid 19F MRI has been applied for rats
lung imaging.[50] With the phantom illustrated here, preclinical imaging strategies
may be tested and improved before they are applied in vivo.
- 37 -
Chapter 5
Conclusions
A mouse lung cancer phantom was successfully fabricated. The phantom and
method illustrated here were validated with 1H MRI for future studies on lung
capacity and pulmonary tumor volume quantification. 19F MRI demonstrated its
potential in lung capacity measurement but needs further optimization for
pulmonary tumor volume quantification in mice.
- 38 -
References
1. Viswanath, P., Peng, S., Singh, R., Kingsley, C., Balter, P. A., & Johnson, F. M. (2018). A Novel Method for Quantifying Total Thoracic Tumor Burden in Mice. Neoplasia, 20(10), 975-984.
2. Miller, G. W., Mugler III, J. P., Sá, R. C., Altes, T. A., Prisk, G. K., & Hopkins, S. R. (2014). Advances in functional and structural imaging of the human lung using proton MRI. NMR in biomedicine, 27(12), 1542-1556.
3. Kumar, S., Liney, G., Rai, R., Holloway, L., Moses, D., & Vinod, S. K. (2016). Magnetic resonance imaging in lung: a review of its potential for radiotherapy. The British journal of radiology, 89(1060), 20150431.
4. Hong, M. J., Na, D. G., Baek, J. H., Sung, J. Y., & Kim, J. H. (2018). Impact of Nodule Size on Malignancy Risk Differs according to the Ultrasonography Pattern of Thyroid Nodules. Korean journal of radiology, 19(3), 534–541. doi:10.3348/kjr.2018.19.3.534
5. Tidwell, V. K., Garbow, J. R., Krupnick, A. S., Engelbach, J. A., & Nehorai, A. (2012). Quantitative analysis of tumor burden in mouse lung via MRI. Magnetic resonance in medicine, 67(2), 572-579.
6. Garbow, J. R., Wang, M., Wang, Y., Lubet, R. A., & You, M. (2008). Quantitative monitoring of adenocarcinoma development in rodents by magnetic resonance imaging. Clinical Cancer Research, 14(5), 1363-1367.
7. Kubo, S., Levantini, E., Kobayashi, S., Kocher, O., Halmos, B., Tenen, D. G., & Takahashi, M. (2006). Three‐dimensional magnetic resonance microscopy of pulmonary solitary tumors in transgenic mice. Magnetic Resonance in Medicine: An Official Journal of the International Society for Magnetic Resonance in Medicine, 56(3), 698-703.
8. Swailes, N. E., MacDonald, M. E., & Frayne, R. (2011). Dynamic phantom with heart, lung, and blood motion for initial validation of MRI techniques. Journal of Magnetic Resonance Imaging, 34(4), 941-946.
9. yourgenome, (2017). Why use the mouse in research? Available at: https://www.yourgenome.org/facts/why-use-the-mouse-in-research [Accessed 3 Mar. 2017]
10. The Jackson Laboratory, (2011) Why are mice considered excellent models for humans? Retrieved from https://www.jax.org/why-the-mouse/excellent-models
11. de Seranno, S., & Meuwissen, R. (2010). Progress and applications of mouse models for human lung cancer. European Respiratory Journal, 35(2), 426-443.
12. Segars, W. P., Tsui, B. M., Frey, E. C., Johnson, G. A., & Berr, S. S. (2004). Development of a 4-D digital mouse phantom for molecular imaging research. Molecular Imaging & Biology, 6(3), 149-159.45.
- 39 -
13. Biederer, J., Hintze, C., & Fabel, M. (2008). MRI of pulmonary nodules: technique and diagnostic value. Cancer Imaging, 8(1), 125.
13. van der Heyden, B., van Hoof, S. J., Schyns, L. E., & Verhaegen, F. (2017). The influence of respiratory motion on dose delivery in a mouse lung tumour irradiation using the 4D MOBY phantom. The British journal of radiology, 90(1069), 20160419.
14. Chang, J., Suh, T. S., & Lee, D. S. (2010). Development of a deformable lung phantom for the evaluation of deformable registration. Journal of applied clinical medical physics, 11(1), 281-286.
15. Broncano, J. (2018). Hybrid (CT and MR) 3D printing models in chest tumors: How I do it step-by-step. European Congress of Radiology. https://doi.org/10.1594/ecr2018/c-3131
16. Keereman, V., Mollet, P., Fierens, Y., Espana, S., & Vandenberghe, S. (2011, October). Design of a realistic PET-CT-MRI phantom. In 2011 IEEE Nuclear Science Symposium Conference Record (pp. 3173-3177). IEEE.
17. Yi, C. A., Jeon, T. Y., Lee, K. S., Lee, J. H., Seo, J. B., Kim, Y. K., & Chung, M. J. (2007). 3-T MRI: usefulness for evaluating primary lung cancer and small nodules in lobes not containing primary tumors. American Journal of Roentgenology, 189(2), 386-392.
18. Krupnick, A. S., Tidwell, V. K., Engelbach, J. A., Alli, V. V., Nehorai, A., You, M., ... & Garbow, J. R. (2012). Quantitative monitoring of mouse lung tumors by magnetic resonance imaging. nature protocols, 7(1), 128.
19. Couch, M. J., Ball, I. K., Li, T., Fox, M. S., Ouriadov, A. V., Biman, B., & Albert, M. S. (2014). Inert fluorinated gas MRI: a new pulmonary imaging modality. NMR in Biomedicine, 27(12), 1525-1534.
20. Kruger, S. J., Nagle, S. K., Couch, M. J., Ohno, Y., Albert, M., & Fain, S. B. (2016). Functional imaging of the lungs with gas agents. Journal of Magnetic Resonance Imaging, 43(2), 295-315.
21. Couch, M. J., Ball, I. K., Li, T., Fox, M. S., Littlefield, S. L., Biman, B., & Albert, M. S. (2013).
Pulmonary ultrashort echo time 19F MR imaging with inhaled fluorinated gas mixtures in
healthy volunteers: feasibility. Radiology, 269(3), 903-909.
22. Garbow, J. R., Zhang, Z., & You, M. (2004). Detection of primary lung tumors in rodents by magnetic resonance imaging. Cancer research, 64(8), 2740-2742.
23. Wang, F., Akashi, K., Murakami, Y., Inoue, Y., Furuta, T., Yamada, H., ... & Kiryu, S. (2014). Detection of lung tumors in mice using a 1-Tesla compact magnetic resonance imaging system. PloS one, 9(4), e94945.
24. Zhou, X., Bao, H., Al-Hashem, R., Ji, H., Albert, M., Wong, K. K., & Sun, Y. (2008). Magnetic resonance imaging of the response of a mouse model of non-small cell lung cancer to tyrosine kinase inhibitor treatment. Comparative medicine, 58(3), 276-281.
- 40 -
25. Wild, J. M., Marshall, H., Bock, M., Schad, L. R., Jakob, P. M., Puderbach, M., ... & Biederer, J. (2012). MRI of the lung (1/3): methods. Insights into imaging, 3(4), 345-353.
26. Fox, M. S., Gaudet, J. M., & Foster, P. J. (2015). Fluorine-19 MRI contrast agents for cell tracking and lung imaging. Magnetic resonance insights, 8, MRI-S23559.
27. Wang, Wei, "Micro-imaging of the Mouse Lung via MRI" (2012). All Theses and Dissertations
(ETDs). 733. http://openscholarship.wustl.edu/etd/73
28. Mastropietro, A., De Bernardi, E., Breschi, G. L., Zucca, I., Cametti, M., Soffientini, C. D., ... & Resnati, G. (2014). Optimization of rapid acquisition with relaxation enhancement (RARE) pulse sequence parameters for 19F‐MRI studies. Journal of Magnetic Resonance Imaging, 40(1), 162-170.
29. Kuethe, D. O., Caprihan, A., Gach, H. M., Lowe, I. J., & Fukushima, E. (2000). Imaging obstructed ventilation with NMR using inert fluorinated gases. Journal of applied physiology, 88(6), 2279-2286.
30. Halaweish, A. F., Moon, R. E., Foster, W. M., Soher, B. J., McAdams, H. P., MacFall, J. R., ... &
Charles, H. C. (2013). Perfluoropropane gas as a magnetic resonance lung imaging contrast
agent in humans. Chest, 144(4), 1300-1310.
31. van Beek, E. J., & Wild, J. M. (2005). Hyperpolarized 3-helium magnetic resonance imaging to probe lung function. Proceedings of the American Thoracic Society, 2(6), 528-532.
32. Ruiz‐Cabello, J., Barnett, B. P., Bottomley, P. A., & Bulte, J. W. (2011). Fluorine (19F) MRS and MRI in biomedicine. NMR in Biomedicine, 24(2), 114-129.
33. Heidelberger, E., and P. C. Lauterbur. "Gas phase 19F NMR zeugmatography: a new
approach to lung ventilation imaging." First Annual Meeting of the Society of Magnetic
Resonance in Medicine. Boston, MA. 1982.
34. Kuethe, Dean O., et al. "Imaging lungs using inert fluorinated gases." Magnetic resonance in
medicine 39.1 (1998): 85-88.
35. Wolf, W., Presant, C. A., & Waluch, V. (2000). 19F-MRS studies of fluorinated drugs in
humans. Advanced drug delivery reviews, 41(1), 55-74.
36. Pfirschke, C., Engblom, C., Rickelt, S., Cortez-Retamozo, V., Garris, C., Pucci, F., ... & Lin, Y. J. (2016). Immunogenic chemotherapy sensitizes tumors to checkpoint blockade therapy. Immunity, 44(2), 343-354.
37. Cander, L. (1959). Solubility of inert gases in human lung tissue. Journal of applied physiology, 14(4), 538-540.
- 41 -
38. Kruger, S. J., Nagle, S. K., Couch, M. J., Ohno, Y., Albert, M., & Fain, S. B. (2016). Functional
imaging of the lungs with gas agents. Journal of Magnetic Resonance Imaging, 43(2), 295-315.
39. Kirby, M., Svenningsen, S., Owrangi, A., Wheatley, A., Farag, A., Ouriadov, A., ... & Parraga, G.
(2012). Hyperpolarized 3He and 129Xe MR imaging in healthy volunteers and patients with
chronic obstructive pulmonary disease. Radiology, 265(2), 600-610.
40. Welch, D., Harken, A. D., Randers-Pehrson, G., & Brenner, D. J. (2015). Construction of mouse phantoms from segmented CT scan data for radiation dosimetry studies. Physics in Medicine & Biology, 60(9), 3589.
41. Krupnick, A. S., Tidwell, V. K., Engelbach, J. A., Alli, V. V., Nehorai, A., You, M., ... & Garbow, J. R. Quantitative Monitoring of Murine Lung Tumors by Magnetic Resonance Imaging. Nature protocols, 7(1).
42. Fedorov A., Beichel R., Kalpathy-Cramer J., [3D Slicer]. (2018). Retrieved from https://download.slicer.org/
43. Autodesk, [Meshmixer]. (2018). Retrieved from http://www.meshmixer.com/download.html
44. Autodesk, [Inventor]. (2018). Retrieved from https://www.autodesk.com/education/free-
software/inventor-professional
45. Autodesk, [Mesh Enabler]. (2018). Retrieved from
https://apps.autodesk.com/INVNTOR/en/Detail/Index?id=6950391119076900441&appLang=en
&os=Win64
46. Formlabs, [Preform]. (2019). Retrieved from https://formlabs.com/software/#Preform
47. GitHub, Bru2Nii. (2017) https://github.com/neurolabusc/Bru2Nii/
48. Wolf, U., Scholz, A., Heussel, C. P., Markstaller, K., & Schreiber, W. G. (2006). Subsecond fluorine‐19 MRI of the lung. Magnetic Resonance in Medicine: An Official Journal of the International Society for Magnetic Resonance in Medicine, 55(4), 948-951.
49. Shaffer, T. H., Wolfson, M. R., & Clark Jr, L. C. (1992). Liquid ventilation. Pediatric
pulmonology, 14(2), 102-109.
50. Huang, M. Q., Ye, Q., Williams, D. S., & Ho, C. (2002). MRI of lungs using partial liquid
ventilation with water‐in‐perfluorocarbon emulsions. Magnetic Resonance in Medicine: An
Official Journal of the International Society for Magnetic Resonance in Medicine, 48(3), 487-492.
51. Duke Center for In Vivo Microscopy. (2017). Lung Micro-CT image acquired with prospective
gating . Retrieved from https://sites.duke.edu/pcqiba/shared-data/
- 42 -
Zhengyi Lu
Medical Center Boulevard, Winston-Salem, NC 27157 (336)473-6704 [email protected]
Education
Virginia Tech-Wake Forest University School of Biomedical Engineering & Sciences
Winston-Salem, NC
M.Sc., Biomedical Engineering Aug.2017 - May.2019
Tianjin University Tianjin, China
B.Sc., Electrical Engineering Sept.2013 - Jul.2017
Poster presentation
Development of a Lung Metastasis Mouse Phantom for Inert Fluorinated Gas 19F MRI
Winston-Salem, NC
SBES Symposium May.2018

![Handout-p40-Lung, Skin, Head and Neck - Biocare Medical · An Immunohistochemical Analysis of p40 Mouse Monoclonal [BC28] in Lung, Skin, Head and Neck, Esophageal, Cervix, Bladder,](https://img.pdfslide.net/doc/110x75/5b0ad4d57f8b9ae61b8cafb3/handout-p40-lung-skin-head-and-neck-biocare-medical-an-immunohistochemical-analysis.jpg)