Embed Size (px)
Citation preview

University of Bath
PHD
3D printed membranes for oil-water separation processes
Al-Shimmery, Abouther
Award date:2019
Awarding institution:University of Bath
Link to publication
Alternative formatsIf you require this document in an alternative format, please contact:[email protected]
Copyright of this thesis rests with the author. Access is subject to the above licence, if given. If no licence is specified above,original content in this thesis is licensed under the terms of the Creative Commons Attribution-NonCommercial 4.0International (CC BY-NC-ND 4.0) Licence (https://creativecommons.org/licenses/by-nc-nd/4.0/). Any third-party copyrightmaterial present remains the property of its respective owner(s) and is licensed under its existing terms.
Take down policyIf you consider content within Bath's Research Portal to be in breach of UK law, please contact: [email protected] with the details.Your claim will be investigated and, where appropriate, the item will be removed from public view as soon as possible.
Download date: 08. Apr. 2022

Citation for published version:Al-Shimmery, A 2019, '3D printed membranes for oil-water separation processes', University of Bath.
Publication date:2019
Document VersionPublisher's PDF, also known as Version of record
Link to publication
University of Bath
General rightsCopyright and moral rights for the publications made accessible in the public portal are retained by the authors and/or other copyright ownersand it is a condition of accessing publications that users recognise and abide by the legal requirements associated with these rights.
Take down policyIf you believe that this document breaches copyright please contact us providing details, and we will remove access to the work immediatelyand investigate your claim.
Download date: 11. Nov. 2019

Page | 1
3D printed membranes for oil-water separation
processes
Abouther Al-Shimmery
A thesis submitted for the degree of Doctor of Philosophy
University of Bath
Department of Chemical Engineering
June 2019
COPYRIGHT
Attention is drawn to the fact that copyright of this thesis rests with its author. A
copy of this thesis has been supplied on condition that anyone who consults it is
understood to recognise that its copyright rests with the author and they must not
copy it or use material from it except as permitted by law or with the consent of the
author.
This thesis may be made available for consultation within the University Library and
may be photocopied or lent to other libraries for the purposes of consultation.
Abouther

Page | I
Acknowledgements
‘Praise be to Allah’
I would like to thank my leading supervisor, Professor Davide Mattia, for being so
patient with me during my research journey. I am grateful for his kindness, advice,
support and assistance, which enabled me to think outside the box. I really respect his
leadership style and guidance, which kept me on my toes and encouraged me to
persevere, even during the toughest times. His generosity with both his information
and his time empowered me to complete my journey. It is doubtful I would have made
it this far had it not been his support, and for that I say thank you very much.
I would also like to express my sincere gratitude to my supervisor, Dr. John Chew, for
his support along my study path. I really appreciate his advice on my study plan and
in our discussions about my results. I feel so fortunate to have worked with him and I
have benefitted immensely from his knowledge. For his help in these ways, I say thank
you very much.
I am also very grateful to my group, namely Dr. Saeed Mazinani, Dr. Jing Ji, Dr. Ze
Xian Low (Nicholas), Serena and Ejaz, for their help and support, really we had an
amazing time during our group meetings.
Deep thanks go to my friends in the postgraduate office, in particular Mariano, Dan,
Lili, Luz, Parimala and Ida for their support and advice.
I wish to express my love and gratitude to my family for their love, prayer and support
throughout the duration of my study.
Many thanks also go to the technical staff (Mr Fernando Acosta, Mrs Suzanne Barkley,
Mr John Bishop, Mr Rebert Brain, Dr. Alex Ciupa, Dr. Daniel Lou – Hing and Dr
Brigite Rodrigues) for their help and advice.
Finally, I would like to thank the Ministry of Higher Education and Scientific
Research/Iraq for funding my study at the University of Bath.

Page | II
Abstract
The oil-in-water separation process is an essential aspect of the crude oil and natural
gas production sector due to the tremendous amount of produced water generated. The
challenge of oil-in-water emulsion is that when an oil droplet’s diameter is < 20 µm,
traditional techniques, such as American petroleum institution (API) skimmers, are
not efficient at breaking down this type of emulsion. Membrane separation technology
provides an efficient method of breaking down the oil-in-water emulsions [1] using
two techniques: rejection phase-based and coalescence-based. However, fouling
propensity is a serious challenge facing the use of membrane separation technology in
the crude oil production field. Further, most traditional fabrication methods are not
able to fabricate a membrane with complex geometry, which would enhance the
coalescence process. In this study the 3D printing technology was presented as a new
technique to fabricate the 3D printed membranes. All the challenges that face the
traditional fabrication method of the membranes, such as controlling productivity,
membrane fouling and pore structure, have been tried to be controlled using the 3D
printing technology. The 3D printing technology represents an advance approach over
the current membrane fabrication methods owing to its ability to fabricate any
complex geometry. However, the big challenge of this technology as a membrane
fabrication method is nominal resolution. The resolution of the 3D printer used in this
study was far away to print the pore size in the range of micro/ultrafiltration
membranes. The characterisation results indicated that the nominal resolution of our
3D printer (i.e. 29 µm) was insufficiently precise to produce pores with geometric
shape. However, hexagonal-based pore geometry was used to fabricate the 3D printed
membranes and a symmetric membranes were printed with different heights.
For an antifouling membrane, a 3D wavy support structure was designed and
fabricated. Further, a novel method was used to make a selective layer on the 3D
structure, where a thin layer of the polyethersulfone membrane (PES) (16 ± 1 µm) was
deposited on the 3D support structure using the vacuum filtration process. Compared
with a flat membrane, the 3D wavy composite membrane displayed better

Page | III
performance. That is, after the first cycle it achieved a pure water permeance and
permeance recovery ratio of 30 % and 52 % respectively.
This study further presents the fabrication process of a contactor membrane based on
triply periodic minimal surfaces (TPMS). Two types of membrane contactor were
fabricated: Schwarz-P-based and Gyroid-based. The contactors were used for the oil-
in-water demulsification process and their performance compared with a cylindrical-
based contactor. The Gyroid-based contactor showed a 5 % higher separation
efficiency than the other contactors and a 22 % higher efficiency than natural
demulsification. This directly related to high internal surface area and high tortuosity.
The internal surface area of Gyroid-based contactor was 11.07 × 10⁻³ m2, and for
the Schwarz-P and Cylindrical-based contactors were 8.37 × 10⁻³ m2 and 7.07 ×
10−3 m2 respectively. Additionally, the tortuosity of the Gyroid-based contactor was
1.5 compared to the 1 of both the Schwarz-P and the Cylindrical-based contactors.

Page | IV
Table of Contents
Acknowledgements...................................................................................................... I
Abstract ...................................................................................................................... II
List of figures .......................................................................................................... VIII
List of tables ............................................................................................................ XIII
Nomenclature .......................................................................................................... XIV
Chapter 1 ............................................................................................................. 1
The need for oil-water emulsion treatment ................................................... 2
Membrane technology for breaking of oil-water emulsion ........................... 2
3D printing technology .................................................................................. 4
Aim and Objectives ....................................................................................... 4
Structure of Thesis......................................................................................... 5
Chapter 2 ............................................................................................................. 7
A review of membrane for oil water separation processes ................................. 7
Membrane separation processes .................................................................... 8
2.1.1 Ultrafiltration ....................................................................................... 12
2.1.2 Dead end and cross flow modules........................................................ 13
2.1.3 Composite membrane .......................................................................... 14
Methods for the fabrication of polymeric membranes ................................ 15
2.2.1 Phase inversion .................................................................................... 15
2.2.2 Interfacial polymerization .................................................................... 20
2.2.3 3D printing technology ........................................................................ 21
Membrane transport mechanisms ................................................................ 25
Application of membranes for oil water separation .................................... 28
2.4.1 Phase rejection process ........................................................................ 29
2.4.2 Membrane fouling ................................................................................ 33
Membrane fouling mechanism .................................................................... 38
Modification methods of antifouling membrane ......................................... 41
2.6.1 Surface chemistry ................................................................................. 42

Page | V
2.6.2 Patterned membranes ........................................................................... 44
Coalescence process .................................................................................... 46
Summary ..................................................................................................... 49
Chapter 3 ........................................................................................................... 51
Aims and objectives .............................................................................................. 51
Fabrication of porous membranes by using 3D printing .................................. 52
Introduction ................................................................................................. 53
Materials and methods................................................................................. 55
3.2.1 Materials............................................................................................... 55
3.2.2 CAD design of the 3D membrane ........................................................ 55
3.2.3 3D printed membrane........................................................................... 57
3.2.4 Wax removal ........................................................................................ 58
3.2.5 Membrane characterisation .................................................................. 58
3.2.6 Membrane permeance .......................................................................... 59
3.2.7 Membrane permeability and resistance................................................ 60
Results and discussions ............................................................................... 60
Wax removal ............................................................................................... 64
3.4.1 Solvents-based removal ....................................................................... 64
3.4.2 Filtration-based removal ...................................................................... 66
3.4.3 Membrane characterisations ................................................................ 69
3.4.4 Structural characterisation of membrane ............................................. 71
3.4.5 Membrane performance ....................................................................... 73
Conclusions ................................................................................................. 75
Conclusions and outcomes of the chapter 3 ................................................ 76
Chapter 4 ........................................................................................................... 77
Aims and objectives .............................................................................................. 77
3D printed composite membranes with enhanced anti-fouling behaviour ..... 78
Introduction ................................................................................................. 79
Materials and methods................................................................................. 81

Page | VI
4.2.1 Materials............................................................................................... 81
4.2.2 Preparation of wavy and flat membrane support ................................. 81
4.2.3 Preparation of PES selective layer ....................................................... 82
4.2.4 Preparation of wavy and flat 3D composite membranes ..................... 83
4.2.5 Characterisations of wavy and flat 3D composite membranes ............ 83
4.2.6 Emulsions preparation and characterization ........................................ 84
4.2.7 Membrane preparation and characterization ........................................ 84
4.2.8 Chemical cleaning ................................................................................ 87
Results and discussion ................................................................................. 87
4.3.1 Characterization of support, selective layer and 3D composite
membranes .......................................................................................................... 87
4.3.2 Permeance – rejection performance ..................................................... 90
Conclusions ................................................................................................. 96
Acknowledgements ..................................................................................... 97
Supplementary information ......................................................................... 98
Appendix 1 .............................................................................................................. 102
A1.1 Computational fluid dynamics (CFD) modelling ........................................ 102
A1.1.1 Governing equations (conservation equations) ..................................... 102
A1.1.2 Geometry dimensions ........................................................................... 104
A1.1.3 Boundary conditions ............................................................................. 105
A1.1.4 Optimization of wavy surface design ................................................... 106
A1.2 Permeability measurements ......................................................................... 109
A1.3 Coating methods .......................................................................................... 111
A1.3.1 Spin coating .......................................................................................... 112
A1.3.2 Interfacial polymerization ..................................................................... 113
A1.4 Effect of humidity on the PES membranes casting ................................. 114
Conclusions and outcomes chapter 4 ........................................................ 116
Chapter 5 ......................................................................................................... 117
Aims and objectives ............................................................................................ 117
3D Printed Contactors for Enhanced Oil Droplet Coalescence ..................... 118

Page | VII
Introduction ............................................................................................... 119
Materials and methods............................................................................... 121
5.2.1 Materials............................................................................................. 121
5.2.2 Design of 3D printed membrane contactors ...................................... 122
5.2.3 Fabrication and characterization of 3D printed membrane contactors
123
5.2.4 Preparation and characterization of emulsions .................................. 126
5.2.5 Contactor permeance and rejection performance ............................... 126
5.2.6 Visual observation.............................................................................. 127
Results and discussions ............................................................................. 128
5.3.1 Structural characterization of 3D printed contactors ......................... 128
5.3.2 3D printed contactor flow characterisation ........................................ 131
5.3.3 3D printed contactors separation performance .................................. 134
5.3.4 Oil coalescence .................................................................................. 136
Conclusions ............................................................................................... 138
Acknowledgements ................................................................................... 139
Supplementary Information ....................................................................... 140
5.6.1 Equation Parameters .......................................................................... 140
5.6.2 Volume Fraction Estimation and Design Plots .................................. 140
5.6.3 Surface Area Estimations and Design Plots ....................................... 142
5.6.4 Pore Size Estimations......................................................................... 143
5.6.5 Wall thickness .................................................................................... 145
5.6.6 Experimental Apparatus and Additional Data ................................... 146
Conclusions and outcomes chapter 5 ........................................................ 150
Chapter 6 ......................................................................................................... 151
Conclusion and future work .............................................................................. 151
Conclusions ............................................................................................... 152
6.1.1 3D printed porous membranes ........................................................... 152
6.1.2 Wavy 3D composite membranes ....................................................... 153
6.1.3 Triply periodic minimal surfaces ....................................................... 154

Page | VIII
Future work ............................................................................................... 154
6.2.1 Printed material and support materials of 3D polyjet ........................ 155
6.2.2 3D wavy composite membranes for new applications: ..................... 156
6.2.3 New design geometry......................................................................... 156
6.2.4 Hybrid process ................................................................................... 157
References ................................................................................................................ 158
List of figures
Fig. 1.1. Schematic of oil water separation processes (a) oil separation based on oil
rejection, (b) Oil separation process based oil droplet coalescence. ............................ 3
Fig. 2.1. The process of selective separation by a semi-permeable membrane adapted
from [33], where ∆C is the chemical driven force, ∆P is the pressure driven force, ∆T
is the thermal driven force and ∆E is the electrical driven force. ................................ 9
Fig. 2.2. SEM micrographs of different types of membranes (a) (PES/ hydrous
manganese dioxide) mixed matrix membrane [42], (b) Sartorius symmetric membrane
[43], (c) Asymmetric membrane (PES) [44] and (d) Poly(diallyl dimethyl ammonium
carbonate) composite membrane [45]. ....................................................................... 10
Fig. 2.3. Differences between the pressure-driven membrane separation process
adapted from [59]. ...................................................................................................... 11
Fig. 2.4. Schematic diagram of the types of operation processes adapted from [67]: (a)
dead end (b) cross flow. ............................................................................................. 14
Fig. 2.5. Isothermal ternary diagram for polymer – solvent – non solvent system,
(adapted from [83]). Sol 1: Dope solution (homogeneous solution), (polymer +
solvent), Sol 2: Heterogeneous system (polymer, solvent, nonsolvent) including a C'
rich in polymer, C" poor in polymer; Gel is a single phase region; A, B and C represent
the positions of the polymer solution, demixing and solidification step respectively.
.................................................................................................................................... 16
Fig. 2.6. Two types of membrane structures related to the demixing rate, adapted from
[86]. ............................................................................................................................ 17
Fig. 2.7. Chemical structure of polyether sulfone [92]. ............................................. 18

Page | IX
Fig. 2.8. Cross section of the PES membrane prepared via phase separation process
[93], PES 6020P (Mw = 29,000, BASF), 18 wt.% PES in 82 wt. % DMF, and
deionized water was used as a coagulant in the coagulation bath. ............................ 19
Fig. 2.9. Schematic diagram of interfacial polymerization process [99]. .................. 21
Fig. 2.10. Comparison of CAD and STL files, (a) CAD file, (b) STL format file [105].
.................................................................................................................................... 22
Fig. 2.11. Schematic diagram of 3D material jetting process. ................................... 23
Fig. 2.12. Limitation of 3D printing technologies for membrane fabrication. Adapted
from [115] .................................................................................................................. 24
Fig. 2.13. Different tortuosity of porous membrane [60]. ......................................... 26
Fig. 2.14. Membranes with different structures (a) PP track etching [126], (b) PS
finger-like structure [127], (c) Poly(styrene)-b-poly(dimethylsiloxane) nodular-like
structure [128]. ........................................................................................................... 28
Fig. 2.15. Rejection process by capillary process [49]. ............................................. 30
Fig. 2.16. The relationship between flux decline and contact angle decline [146]. .. 34
Fig. 2.17. The surface roughness of the PES membrane prepared by the phase
inversion process [98]. ............................................................................................... 36
Fig. 2.18. Membrane flux during oil-in-water emulsion filtration, membrane flux as
function with time (𝐽(𝑡)), time in the beginning of the filtration process (𝑡0), time in
the beginning of emulsion filtration process (𝑡1), time in the beginning of washing
process (𝑡2), time at the end of filtration process (𝑡3), pure water flux (𝐽0), oil-in-
water emulsion flux (𝐽1), pure water flux after cleaning (𝐽2), total fouling resistance
(𝑅𝑓), irreversible fouling resistance (𝑅𝑖𝑟𝑟𝑒𝑣) and reversible fouling resistance
(𝑅𝑟𝑒𝑣), adapted from [163]. ...................................................................................... 41
Fig. 2.19. Patterned surfaces, (a) prism-patterned membrane [193], (b and c) pyramid
and reverse pyramid-patterned membranes [192], (d) prism-patterned hollow-fibre
membrane [194] (e) cuboidal patterned, (f) channelled-patterned, (g) cylindrical
patterned [195], (h) sharklet patterned RO membrane [196], (i) line-patterned [190],
(k) reverse-pyramid [197], (l) cross pillars [198]. ..................................................... 45
Fig. 2.20. Oil droplets coalescence process [21]. ...................................................... 46
Fig. 3.1. Steps of the general fabrication process of 3D model. ................................ 56
Fig. 3.2. Fabrication steps of 3D models. .................................................................. 57
Fig. 3.3. Labelled photo of the vacuum filtration equipment set up. ......................... 59

Page | X
Fig. 3.4. CAD file of the 3D design model, where the pore height is equal to the
membrane thickness and all the dimensions are in mm. ............................................ 61
Fig. 3.5. CAD models, STL files and micrographs of the Triangle (a, b, c), Square (d,
e, f), Hexagonal (g, h, j) and Circle (j, k, l) 3D printed membranes. ......................... 61
Fig. 3.6. The difference between the CAD file and the STL file adapted from [235].
.................................................................................................................................... 62
Fig. 3.7. Optical micrographs of the 3D printed membranes with different pore size:
(a) 50 µm; (b) 50 µm; (c) 50 µm; (d) 50 µm; (e) 100 µm; (f) 200 µm; (g) 200 µm; (h)
200 µm; (i) 250 µm; (j) 300 µm; (k) 300 µm; (l) 400 µm; (m) 400 µm; (n) 600 µm;
(o) 1000 µm; (p) 1000 µm; Thickness of the 3D printed membranes = 1 mm,
hexagonal-based pore geometry. ................................................................................ 64
Fig. 3.8. Microscopic images of wax removal from the 1000 µm, hexagonal 3DPMs
after ultrasonic cleaning for 6 hours in different solvents: (a) EZ Rinse – C solution;
(b) Sunflower oil; (c) Acetonitrile; (d) Cyclohexane; (e) Ethanol; (f) Ethyl methyl
ketone; (g) Hexane; (h) Propanol; (i) Toluene; and (j) Xylene. Thickness of the 3D
printed membranes = 1 mm, hexagonal-based pore geometry. ................................. 65
Fig. 3.9. Microscopic images of wax removal from the 100 µm hexagonal 3DPMs
after ultrasonic cleaning for 6 hours in different solvents: (a) with wax; (b) EZ Rinse
– C solution; (c) Toluene; (d) THF; (e) Hexane; (f) Xylene; (g) Acetonitrile; and (h)
sunflower oil. Thickness of the 3D printed membranes = 1mm, hexagonal-based pore
geometry..................................................................................................................... 66
Fig. 3.10. Microscopic images of wax removal using 100 µm, hexagonal-based 3D
membrane put in the dead end cell at pressure = 50 bar, temperature = 80 °C and
treated with different solvents. ................................................................................... 66
Fig. 3.11. Microscopic images of wax removal using 200 µm, hexagonal 3D
membrane which was subjected to the crossflow cleaning cycle and treated with
different solvents (time = 6 h, temperature = 60 °C), (a) CAD model; (b) control
membrane; (c) ethanol; (d) propanol; (e) acetone; (f) cyclohexane; (g) sunflower oil;
and (h) water. Thickness of the membrane = 1mm, hexagonal-based pore geometry.
.................................................................................................................................... 67
Fig. 3.12. Theoretical dimentions of the 3D dot or voxel of the ProJet 3500 HD Max.
.................................................................................................................................... 68
Fig. 3.13. A 3D membrane with hexagonal pores after Utrasonication (a) 100 µm; (b)
150 µm, (c) 200 µm; (d) 300 µm; (e) 1000 µm; and (f) 3000 µm. The oil was supplied
by 3D printer company. ............................................................................................. 69
Fig. 3.14. FTIR spectra of VisiJet® S300 support material (i.e. wax) and the 3D
printed membrane after cleaning. ............................................................................... 70
Fig. 3.15. Contact angles of the 3D printed membranes, (a) Water drop (contact angle
= 83° ± 2°); (b) oil drop (contact angle = 20° ± 2°). .................................................. 71

Page | XI
Fig. 3.16. SEM micrographs of the 3D membrane, cross section, pore diameter = 300
µm, and distance between the pores = 300 µm. ......................................................... 72
Fig. 3.17. Images of the 3D printed membranes-based hexagonal pore geometry (a, b,
c) 1000 µm, (d, e, f) 300 µm. ..................................................................................... 72
Fig. 3.18. Permeability and resistance as a function of different thickness of the
membranes. Each data point is the average of 3 repeats on different 3D printed
membranes and the error bar represents the standard deviation. ............................... 74
Fig. 3.19. Permeance of the F3Dmembranes as a function of vacuum pressure (a)
vacuum pressure = 10 mbar; and (b) vacuum pressure = 20 mbar. Each data point is
the average of 3 repeats on different 3D printed membranes and the error bar
represents the standard deviation. .............................................................................. 75
Fig. 4.1. CAD of 3D wavy support: (a) top view; (b) enlarged cross section; and (c)
side view, with amplitude = 0.5 mm, frequency = 2 s-1, and wave length = 3 mm. All
dimensions are in mm. The wavy surface is described using the equation 𝑓𝑥, 𝑦 =0.5 sin𝑥sin (𝑦). ........................................................................................................... 82
Fig. 4.2. Preparation of wavy 3D composite membranes: (a) 3D wavy support; (b)
PES thin layer is laid over the wavy support; (c) vacuum filtration to adhere the
selective layer onto the support; and (d) resulting 3D composite membrane. ........... 83
Fig. 4.3. Schematic of the filtration (fouling-cleaning) cycle: (a) Pure water permeance
(𝑃𝑊, 𝑖) recorded for 30 minutes, (b) oil-in-water emulsion permeance (𝑃𝐸, 𝑖 ) recorded for 90 minutes, (c) cleaning with pure water for 15 minutes, (d) pure water
permeance (𝑃𝑊, 𝑖 + 1 ) for 30 minutes, reversible permeance decline ratio (𝑅𝑃𝑅𝑖), irreversible permeance decline ratio (𝐼𝑟𝑃𝑅𝑖), and total permeance decline ratio
(𝑃𝐷𝑅𝑖). The transmembrane pressure was maintained at 1 bar throughout the fouling-
cleaning cycle. ............................................................................................................ 86
Fig. 4.4. Digital micrographs of the wavy support showing (a) a regular structure (top
view) and (b) open porosity (side view). The color map represents height with red
indicating peaks and green valleys. Pore diameter = 0.2 mm, distance between pores =
0.2 mm, amplitude = 0.5 mm, frequency = 2 s-1, and wave length = 3 mm. ............. 88
Fig. 4.5. SEM micrographs of PES selective layer: (a) top surface and (b) cross
section. ....................................................................................................................... 89
Fig. 4.6. SEM micrographs of 3D composite membrane, (a) top view, (b) side view,
and (c) 3D topographic optical image. ....................................................................... 90
Fig. 4.7. Variation of permeance with time during crossflow filtration of flat 3D
composite membranes for Re = 1000 and as a function of oil concentration (a = 0.3
vol. %, b = 0.4 vol. %, c = 0.5 vol. %). In all cases ∆p = 1 bar. Regions identified by
roman numerals I and II represent the first and second cycle. Each data point is the
average of 3 repeats on different membranes from the same batch, with an average
error of ± 0.1 LMH bar-1 (error bars are not shown for clarity). The error bar represents
the standard deviation. ............................................................................................... 90
Page | XII
Fig. 4.8. Variation of Permeance with time during crossflow filtration of wavy 3D
composite membranes as a function of Reynolds numbers (Re = 100, 500, 1000 for
top, middle and bottom row, respectively) and oil concentration (a, d, g = 0.3 vol. %,
b, e, h = 0.4 vol. %, c, f, i = 0.5 vol. %). In all cases ∆p = 1 bar. Regions identified by
roman numerals I and II represent the first and second cycle. Each data point is the
average of 3 repeats on different membranes from the same batch, with an average
error of ± 0.8 LMH bar-1 (error bars are not shown for clarity). The error bar represents
the standard deviation. ............................................................................................... 91
Fig. 4.9. PRR, and PDR (sum of RPR and IrPR) during crossflow filtration of flat 3D
composite membranes for Re = 1000 and as a function of oil concentration (a = 0.3
vol. %, b = 0.4 vol. %, c = 0.5 vol. %). In all cases ∆p = 1 bar. Each data point is the
average of 3 repeats on different membranes from the same batch and the error bar
represents the standard deviation. .............................................................................. 93
Fig. 4.10. PRR and PDR (sum of RPR and IrPR) during crossflow filtration of wavy
3D composite membranes as a function of Reynolds numbers (Re = 100, 500, 1000
for top, middle and bottom row, respectively) and oil concentration (a, d, g = 0.3
vol. %, b, e, h = 0.4 vol. %, c, f, i = 0.5 vol. %). In all cases ∆p = 1 bar. Each data point
is the average of 3 repeats on different membranes from the same batch and the error
bar represents the standard deviation. ........................................................................ 94
Fig. 4.11. Variation of Permeance (a, b, c) and PRR, and PDR (sum of RPR and IrPR)
(d, e, f) with time during crossflow filtration of wavy 3D composite membrane for Re
= 1000 and as a function of oil concentration (a, d = 0.3 vol. %, b, e = 0.4 vol. %, c, f
= 0.5 vol. %). In all cases ∆p = 1 bar. Regions identified by roman numerals represent
the 6 complete filtration cycle. Each data point is the average of 3 repeats on different
membranes from the same batch, (average error of ± 0.8 LMH bar-1 for a, b, c - error
bars are not shown for clarity) and (for d, e, f - error bar represents the standard
deviation). .................................................................................................................. 95
Fig. 4.12. PRR (a) after chemical cleaning using different chemical agents, all at 0.1
M, for a wavy 3D composite membrane after the 6th filtration cycle, and (b) for flat
and wavy 3D composite membrane after the 2nd filtration cycle. Error bar represents
the standard deviation. ............................................................................................... 96
Fig. 5.1. Gyroid structure built using Equation (5.3), with set level parameter t = ±0.5,
creating a volume between the surface, thereby determining the thickness of the
Gyroid’s walls. ......................................................................................................... 123
Fig. 5.2. STL file prepared with different resolutions for Gyroid-based 3D printed
contactor (grid point values: a = 150, b = 300, c = 600, d = 800)............................ 124
Fig. 5.3. Gyroid-based 3D printed membrane contactors (a) STL digital file; (b) SEM
micrograph of the 3D printed membrane contactor (cross-section). ....................... 125
Fig. 5.4. Optical micrographs, CAD models, surface and cross-section SEM
micrographs for Cylindrical (a, b, c, d), Schwarz-P (e, f, g, h) and Gyroid (i, j, k, l) 3D
printed contactors. The diameter of all contactors is 25 mm, including a 2.5 mm rim,
with a thickness of 4.68 mm or 9.36 mm. ................................................................ 129

Page | XIII
Fig. 5.5. Liquid flow pathway through the unit cell of (a) Cylindrical (b) Schwarz-P
and (c) Gyroid-based 3D printed contactors. ........................................................... 131
Fig. 5.6. Pure water and oil-in-water emulsion (0.3, 0.4 and 0.5 vol. %) permeance of
the 3D printed contactors for (a) thickness = 4.68 mm, vacuum pressure = 10 mbar,
(b) thickness = 4.68 mm, vacuum pressure = 20 mbar, (c) thickness = 9.36 mm,
vacuum pressure = 10 mbar, and (d) thickness = 9.36 mm, vacuum pressure = 20 mbar.
Each data point is the average of 3 repeats on different 3D printed contactor and the
error bar represents the standard deviation. ............................................................. 133
Fig. 5.7. Separation efficiency of natural demulsification process and of the 3D printed
contactors for oil-in-water emulsions (0.3, 0.4 and 0.5 vol. %) and for (a) thickness =
4.68 mm, vacuum pressure = 10 mbar, (b) thickness = 4.68 mm, vacuum pressure =
20 mbar, (c) thickness = 9.36 mm, vacuum pressure = 10 mbar, and (d) thickness =
9.36 mm, vacuum pressure = 20 mbar. Each data point is the average of 3 repeats on
different 3D printed contactor and the error bar represents the standard deviation.
.................................................................................................................................. 135
Fig. 5.8. Oil droplet size distribution in the oil-in-water emulsion feed and in the
permeate, with different oil concentrations going through the Gyroid-based 3D printed
contactors. Each data point is the average of 3 repeats on different 3D printed contactor
(error bars are not shown for clarity). .................................................................... 137
Fig. 5.9. Demulsification using Gyroid-based 3D printed contactor at vacuum pressure
= 10 mbar with different oil concentrations (a) 0.3 vol. %, (b) 0.4 vol. % and (c) 0.5
vol. %, compared to natural demulsification. .......................................................... 138
List of tables
Table 2.1. State of the art oil rejection process. ........................................................ 32
Table 2.2. Characterisation and performance of the membranes [148] .................... 35
Table 2.3. Effects of different types of membranes on oil in water separation
efficiency [200]. ......................................................................................................... 47
Table 3.1. OpenScad designed pore geometries with different design features and pore
shapes, pore size 300 µm, pore height 1 mm. ............................................................ 63
Table 4.1. Physical properties of wavy 3D composite membrane, Ra is the surface
roughness and Rm is the intrinsic permeability. ......................................................... 89
Table 4.2. Performance indicators for wavy and flat 3D composite membrane at Re =
1000 and 0.3 vol. % oil concentration for the first complete cleaning cycle, pure water
permeance (PW), oil-in-water emulsion permeance (PE), permeance recovery ratio
(PRR), reversible permeance decline ratio (RPR), irreversible permeance decline ratio
(IrPR), total decline ratio (PDR). ............................................................................... 92

Page | XIV
Table 5.1. Physical characterizations of 3D printed contactors, contact angle (CA),
porosity (), average pore diameter (Dp), roughness (Ra), tortuosity () and internal
surface area (SAint). ................................................................................................. 130
Table 5.2. Intrinsic permeability (𝑘), actual intrinsic permeability (𝑘𝑒𝑥𝑝), theoretical
intrinsic permeability (𝑘𝑆𝑇𝐿), effective intrinsic permeability (𝑘𝑒𝑓𝑓), membrane
resistance (Rm) and pure water permeance (𝐾𝑤) for 3D printed membrane contactors
with thickness 4.68 mm. ........................................................................................ 131
Table S 4.1. Differences between literature review and this study, FRR flux recover
ratio. ......................................................................................................................... 101
Table S 5.1 Summary of the coalescer membranes used for demulsification process.
.................................................................................................................................. 149
Nomenclature
Abbreviation
2D Two dimensions
2PP Two photon polymerization
3D Three dimensions
AM Additive Manufacturing
AFM Atomic Force Microscopy
API American petroleum institution
BSA Bovine serum albumin
CA Cellulose acetate
CAD Computer aided design
CFD Computational fluid dynamics
DLP Digital light processing
DMAc N,N-dimethylacetamide
DMF N,N-dimethylformamide
DMSO Dimethyl sulfoxide
FTIR Fourier Transform Infrared spectroscopy
NIL Nanoimprint lithography
NMP N-methylpyrrolidone
NTU Nephelometric turbidity units
PA Aromatic polyamides
PAN Polyacrylonitrile
PDMS Polydimethylsiloxane
PEG Polyethylene glycol
PES Polyether sulfone
PP Polypropylene
PS Polysulfone
PTFE Polytetrafluoroethylene
PVC Polyvinylchloride
PVDF Polyvinylidene fluoride

Page | XV
PVP Polyvinyl pyrrolidone
SCAD Solid Computer Aided Design
SDS Sodium dodecyl sulfate
SEM Scanning Electron Microscopy
SLA Stereolithography
SLS Selective laser sintering
STL Standard Tessellation Language or STereoLithography
UV Ultraviolet
Symbols Unit
𝐴 Effective membrane surface area m2
Ci,f Solute concentration in the feed side, mg l-1
Ci,p Solute concentration in the permeation side mg l-1
𝑑 Oil droplet diameter m
𝑓 Frequency s-1
𝑔 Acceleration due to gravity m s-2
𝐼𝑟𝑃𝑅𝑖 Irreversible permeance decline ratio -
𝐽 Flux across a membrane LMH
𝐾𝐶 Kozeny constant -
k Intrinsic permeability m2
𝐾 Membrane permeance LMH bar-1
𝑙 Membrane thickness m
𝑀1 Mass of contactor before wax removal kg
𝑀2 mass of the contactor with clean, open pores after
wax removal
kg
𝑁 Total number of points in the measured area -
𝑝 Pressure Pa
𝑃𝑐 Capillary pressure Pa
𝑃𝐸 Oil-in-water permeance LMH bar-1
𝑃𝑅𝑅𝑖 Permeance recovery ratio -
𝑃𝑊 Pure water permeance LMH bar-1
𝑟𝑐 Pore radius m
𝑅𝑎 Adsorption resistance m-1
𝑅𝑎𝑣𝑔 average roughness nm
𝑅𝑐 Gel or cake layer resistance m-1

Page | XVI
𝑅𝑐𝑝 Concentration polarization resistance m-1
𝑅𝑒 Reynold’s number -
𝑅𝑖𝑟𝑟𝑒𝑣 irreversible fouling m-1
Rj,i Membrane rejection -
𝑅𝑚 Hydraulic resistance m-1
𝑅𝑃𝑅𝑖 Reversible permeance decline ratio -
𝑅𝑟𝑒𝑣 Reversible fouling m-1
𝑅𝑡 Total resistance m-1
𝑆𝑂 Specific surface of the porous medium -
𝑡 Permeation time h
𝑢 Velocity m s-1
𝑉𝑎 Volume of selective layer m3
𝑊𝑑 Weight of the dry membrane, mg
𝑊𝑤 Weight of the wet membrane mg
�� Average of the peaks height nm
𝑍𝑛 Peak height at point n nm
Greek letters
𝛾𝑜/𝑤 Interfacial tension between the oil and water N m-1
𝛾𝑚/𝑤 Membrane-water interfacial tension N m-1
𝛾𝑚/𝑜 Membrane-oil interfacial tension N m-1
∆C Chemical driven force Kg m-3
∆E Electrical driven force v
∆𝑝 Pressure difference through a membrane Pa
∆T Thermal driven force ° C
∆𝑡 Interval time h
𝜀 Surface porosity -
𝜃 Contact angle deg.
𝜇 Emulsion viscosity Pa s
𝑣 Volume of permeate l
π Pi 3.1427

Page | XVII
𝜌𝑜 Oil density kg m-3
𝜌𝑤 Water density kg m-3
σ Surface tension N m-1
𝜏 tortuosity -
Chapter 1 Introduction
Page | 1
Chapter 1
This chapter provides an introduction to the research, which covers the scope and overview
of this PhD research including: (1) a short definition of the produced water generation
process and its effect on the environment; (2) application of membrane filtration processes
for oil-water separation; (3) the fundamental principles and the practical advantages of the
demulsification processes as they relate to the rejection of the oil phase and the oil droplets
coalescence process; (4) the definition of the 3D printing technology used in this study as a
new fabrication method. The chapters of this thesis are also outlined.

Chapter 1 Introduction
Page | 2
The need for oil-water emulsion treatment
Increasing global consumption of energy has led to an increase in the production of
crude oil and gas, which in turn has led to increased generation of wastewater or
produced water. In fact, today eight barrels of water are needed to produce just one
barrel of crude oil [2]. Produced water, or oil-in-water emulsion, is a heterogeneous
system composed of two immiscible liquids, one is a dispersed phase (oil droplets)
and the other is a continuous phase (water) [3]. The range of oil concentration in the
produced water from the crude oil field is between 100 – 5000 mg l-1 [4]. The produced
water contains different categories of oil, including floating oil, unstable oil and stable
emulsified oil [5]. Guidelines state that disposed of water must not contain oil and
grease in concentration higher than 10 – 15 mg l-1 [6]. Should wastewater exceeding
this concentration be discharged into the environment without effective treatment, it
would result in the contamination of the soil, surface water and groundwater [7, 8].
There are many processes that can be applied to separate oil from oil-in-water
emulsions, including traditional processes such as gas flotation [9], the use of chemical
demulsifiers [10], American petroleum institution (API) skimmers [11], hydrocyclone
[12] and electrostatic processes [13]. However, their application is limited by high
operating costs and the generation of waste [14], which would need to be properly
managed to avoid environmental pollution. Moreover, many of these conventional
techniques are ineffective in demulsifying the stable oil (oil droplets < 20 µm), hence
there is a need to find alternative technologies that could be applied to efficiently treat
stable oil [5]. Membrane technology is a potential candidate for this due to its
simplicity, low operating costs and high purification capabilities [4, 15].
Membrane technology for breaking of oil-water emulsion
Membrane processes for oil water separation can be divided into two basic operations.
The first, separation, is based on oil phase rejection and the second, on oil droplets
coalescence (see Fig. 1.1.)

Chapter 1 Introduction
Page | 3
Fig. 1.1. Schematic of oil water separation processes (a) oil separation based on oil
rejection, (b) Oil separation process based oil droplet coalescence.
Oil phase rejection (cfr. Fig. 1.1a) can successfully produce high permeate quality of
up to 99 % purity. Its main drawback is flux decline due to fouling but two key
techniques have been investigated to mitigate this problem. One technique is to
increase the hydrophilicity of the membrane surface by changing the surface chemistry
by blending the dope solution with hydrophilic polymer such as polyvinylpyrrolidone
(PVP) and polyethylene glycol (PEG) [16], cellulose acetate phthalate [17] or titanium
dioxide nano particles [18]. Another is to generate hydrodynamic turbulence in the
vicinity of the membrane surface, preventing the fouling material from adhering to the
walls of the membrane, via membrane patterning [19].
A membrane process based on oil droplet coalescence (cfr. Fig. 1.1b) is generally
preferred because they have lower energy requirements and higher throughput.
Fouling phenomena does not occur as the highly porous membranes that are used
prevent it. Oil droplet coalescence is the process whereby two or more oil droplets
merge to form a larger one [20]. In this process, demulsification begins by increasing
the diameter of the oil droplet using the membrane and is followed by gravity
separation [21]. The main aim of increasing the oil droplet diameter is to ensure
efficient oil in water separation (i.e. demulsification). According to Stokes’ law, there
Chapter 1 Introduction
Page | 4
is a direct relationship between the settling velocity and the square of the oil droplet
diameter. Stokes’ law can be represented as follows:
𝑣 = 𝑑2 (𝜌𝑤 − 𝜌𝑜) 𝑔
18 µ (1.1)
where 𝑣 is the rising velocity (m s-1) of oil droplet, 𝑑 is the droplet diameter (m),
(𝜌𝑤 − 𝜌𝑜) is the difference of the water and oil density (kg m-3), 𝑔 is the acceleration
due to gravity (m s-2) and µ is the emulsion viscosity (Pa s).
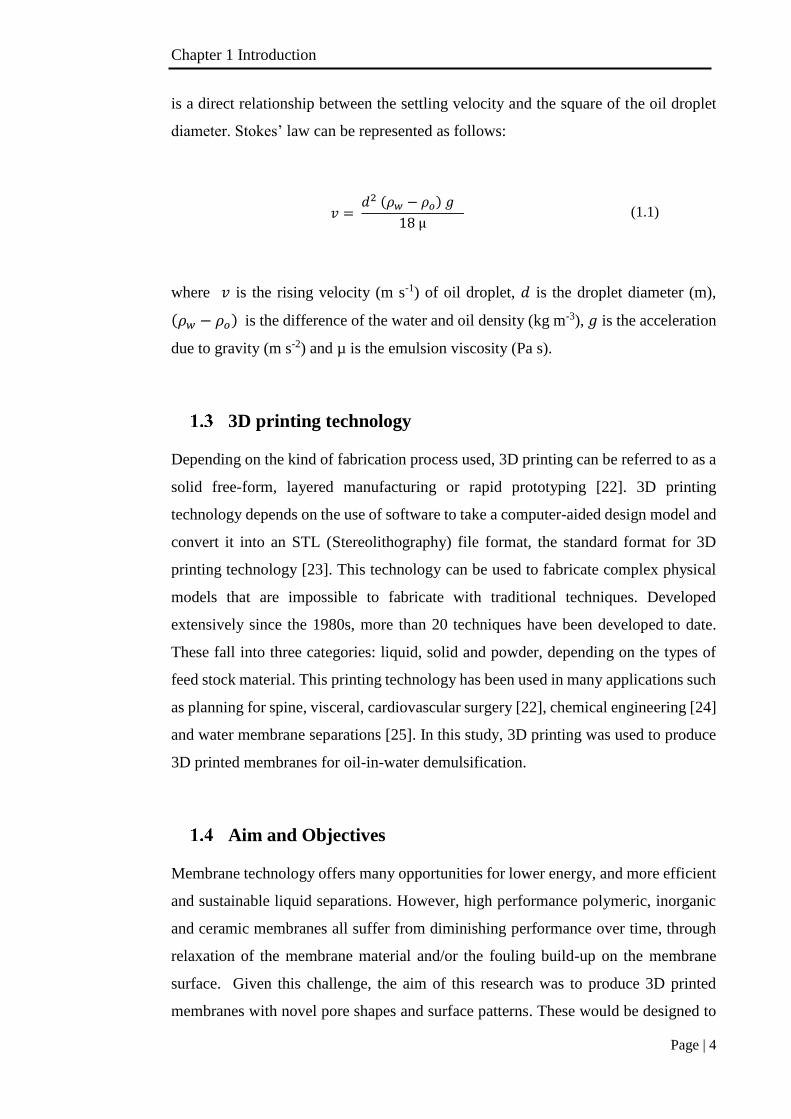
3D printing technology
Depending on the kind of fabrication process used, 3D printing can be referred to as a
solid free-form, layered manufacturing or rapid prototyping [22]. 3D printing
technology depends on the use of software to take a computer-aided design model and
convert it into an STL (Stereolithography) file format, the standard format for 3D
printing technology [23]. This technology can be used to fabricate complex physical
models that are impossible to fabricate with traditional techniques. Developed
extensively since the 1980s, more than 20 techniques have been developed to date.
These fall into three categories: liquid, solid and powder, depending on the types of
feed stock material. This printing technology has been used in many applications such
as planning for spine, visceral, cardiovascular surgery [22], chemical engineering [24]
and water membrane separations [25]. In this study, 3D printing was used to produce
3D printed membranes for oil-in-water demulsification.
Aim and Objectives
Membrane technology offers many opportunities for lower energy, and more efficient
and sustainable liquid separations. However, high performance polymeric, inorganic
and ceramic membranes all suffer from diminishing performance over time, through
relaxation of the membrane material and/or the fouling build-up on the membrane
surface. Given this challenge, the aim of this research was to produce 3D printed
membranes with novel pore shapes and surface patterns. These would be designed to

Chapter 1 Introduction
Page | 5
improve the flux and selectivity as well as the fouling and ageing resistance of those
membranes in the oily wastewater treatment applications (by both oil-water emulsion
coalescence and oil rejection). This approach was used to prepare membranes that
could feasibly be applied in the treatment of oil and petrochemical wastewater.
Moreover, they could be used to recover molecules from a wide range of industrial
wastewaters, such as those produced by the dairy industry or pharmaceutical and other
chemical processes.
This research had three distinctive points of focus:
(1) To assess the feasibility of using the 3D printing process as a new method to design
and fabricate an engineered membrane. Integral to this, it sought to determine the
optimum structure and performance of a 3D printed porous membrane; (2) To design
and fabricate antifouling 3D wavy composite membranes for oil-in-water emulsion
separation process, based on the oil rejection phase; and (3) To design and fabricate
membrane contactors with a complex structure (i.e. Schwarz-based and Gyroid-based
pore geometry) to enhance the oil-in-water demulsification process, based on oil
droplets’ coalescence process.
Structure of Thesis
This thesis was prepared in a paper based format, the following paragraphs provide a
short description of each chapter:
Chapter 1 provides a general introduction and details the aim of the research.
Chapter 2 presents a literature review, which includes the basic principles of
membrane technology, membrane fabrication methods and the application of
membranes for oil/water separation.
Chapter 3 presents the results and discussion of the design and fabrication of
the 3D printed membranes, including the wax removal processes. The paper
related to this chapter is still under preparation.
Chapter 4 contains the results and discussion pertaining to the design,
fabrication and the application of the 3D wavy composite membranes to
determine their anti-fouling behavior/performance in the oil-in-water emulsion

Chapter 1 Introduction
Page | 6
separation process. This chapter has previously been published in an academic
journal
Al-Shimmery A.; Mazinani S.; Jing Ji.; Chew J. and Mattia D., 3D printed
composite membranes with enhanced anti-fouling behaviour. Journal of
Membrane Science, 2019. 574: p. 76-85.
Chapter 5 addresses the results and discussion in terms of the design and the
fabrication process of the triply periodic minimal surface (Schwarz-P and
Gyroid) to enhance the demulsification process based on coalescence
mechanism.
The following paper has been generated from this chapter:
Al-Shimmery A.; Mazinani S.; Flynn J.; Chew J. and Mattia D., 3D Printed
porous Contactor for Enhanced Oil Droplets Coalescence. Journal of
Membrane Science, 2019. 590.
Chapter 6 provides a conclusion and indicates future research work.

Chapter 2 A review of membrane for oil water separation processes
Page | 7
Chapter 2
A review of membrane for oil water separation processes
This chapter provides a review of the literature regarding the principles of the membrane
separation processes and the methods of the fabrication of membranes, including phase
inversion and 3D printing. The review focuses on the pressure-driven filtration process for
oil rejection and demulsification based on oil droplets coalescence. It also documents how
membrane processes are modified to enhance their antifouling behaviour. Finally, the
section discusses the implications of relevant literature and identifies the current knowledge
gaps.

Chapter 2 A review of membrane for oil water separation processes
Page | 8
Membrane separation processes
In the past two centuries, various separation techniques have been developed and
implemented by industry and academia across the globe. These techniques include,
but are not limited to, adsorption, crystallization, distillation, ion exchange,
precipitation and extraction [26]. In the last forty years, membrane technology has
become an alternative to these conventional separation processes [27]. Membrane
technology’s main attractions are its low cost and low energy requirements [28, 29].
Its processes also reduce the number of the separation steps and it produces final
products of a high quality [30-32]. Moreover, the physical separation process in this
technology can be achieved at ambient temperature without any chemical changes or
damage to the main components, which is vital, especially in the pharmaceutical, food
and bioprocessing industries [28].
The semi-permeable membrane is the heart of any membrane process [33, 34], it is a
selective barrier that allows one component of the feed solution, usually the solvent,
to pass through as a permeate while blocking some solutes [35] (see Fig. 2.1). The
selectivity and flux across the membrane are the main characteristics that determine
the membrane’s performance [36]. Generally, membrane selectivity can be explained
by its rejection factor, which is the fraction of the total solute rejected by a membrane,
and can be expressed by Equation (2.1) [37].
𝑅𝑗,𝑖 (%) = (1 − 𝑐𝑜𝑛𝑐𝑒𝑛𝑡𝑟𝑎𝑡𝑖𝑜𝑛 𝑜𝑓 𝑠𝑝𝑒𝑐𝑖𝑒𝑠 𝑖 𝑖𝑛 𝑝𝑒𝑟𝑚𝑒𝑎𝑡𝑒
𝑐𝑜𝑛𝑐𝑒𝑛𝑡𝑟𝑎𝑡𝑖𝑜𝑛 𝑜𝑓 𝑠𝑝𝑒𝑐𝑖𝑒𝑠 𝑖 𝑖𝑛 𝑓𝑒𝑒𝑑) × 100
(2.1)
= (1 − 𝐶𝑖,𝑝
𝐶𝑖,𝑓) × 100
where 𝑅𝑗,𝑖 is the membrane rejection, 𝐶𝑖,𝑓 is the solute concentration on the feed side,
𝐶𝑖,𝑝 is the solute concentration on the permeate side.

Chapter 2 A review of membrane for oil water separation processes
Page | 9
The rejection factor can vary between 100 % (complete separation) to 0 % (no
separation). Another concept, which is used to characterise the selectivity of the UF
membranes is the molecular weight cut-off (MWCO) [35], which can be determined
by 90 % retention of the lowest molecular weight of organic solutes [38].
Fig. 2.1. The process of selective separation by a semi-permeable membrane adapted from
[33], where ∆C is the chemical driven force, ∆P is the pressure driven force, ∆T is the
thermal driven force and ∆E is the electrical driven force.
Membranes can be classified according to many factors, such as their material,
morphology, preparation method and geometry [39, 40]. In terms of material,
membranes are usually either organic (polymeric), inorganic (ceramic) or biological
(natural) [41]. However, a mixed material membrane, usually referred to as a hybrid
membrane or a mixed matrix, is normally prepared with an inorganic material that is
supported by a polymer matrix [42] (Fig. 2.2a).

Chapter 2 A review of membrane for oil water separation processes
Page | 10
Fig. 2.2. SEM micrographs of different types of membranes (a) (PES/ hydrous manganese
dioxide) mixed matrix membrane [42], (b) Sartorius symmetric membrane [43], (c)
Asymmetric membrane (PES) [44] and (d) Poly(diallyl dimethyl ammonium carbonate)
composite membrane [45].
In terms of a membrane structure, there are symmetric isotropic membranes, which
tend to have uniform structure and can be classified as: microporous membranes,
nonporous dense film membranes and electrically charged membranes [38]. Porous
membranes generally apply a size-sieving mechanism to separate solutes on the
membrane surface [35]. The other type is asymmetric anisotropic membranes,
whereby the porosity is distributed across the membrane thickness [46]. Anisotropic
membranes are sub-divided into Loeb–Sourirajan membranes (i.e. the phase-
separation membrane) and composite membranes (Fig. 2.2d) [47]. The Loeb–
Sourirajan or integrally skinned asymmetric membranes, characterised by a
homogeneity of the chemical composition [48], are similar to isotropic porous
membranes, but the porosity varies with the thickness of the membrane [38].

Chapter 2 A review of membrane for oil water separation processes
Page | 11
Membranes also can be classified according to the driving force utilised across the
membrane, these includes hydraulic pressure, osmotic pressure, thermal and electrical
driving force [33, 46]. The pressure driven membrane processes such as,
microfiltration, ultrafiltration, nanofiltration and reverse osmosis have been used to
deal with oil-in-water emulsions [49-55] because they are highly efficient in removing
oil from water [56]. Furthermore, they require no chemical additives and are more
economical than traditional separation techniques [57]. The mean pore size of the
membrane is the main distinction among these different processes [58]. This
distinction is illustrated in Fig. 2.3, which shows the separation potential of solutes by
these processes.
Fig. 2.3. Differences between the pressure-driven membrane separation process adapted from
[59].
Membranes with a pore size range from 0.1 to 10 µm are typically used in
microfiltration processes [59]. High water flux can be obtained from microfiltration at
a low operating pressure and it is suitable for separating suspended particles [33, 35].
Two types of microfiltration filters can be used: screen filters and depth filters. Screen
filters use small pores to collect the particles on the surface of membrane. The main
disadvantage of this type of filter is that the pores rapidly become blocked as a result
of particles accumulating on the surface, whereas depth filters have a large pore sizes

Chapter 2 A review of membrane for oil water separation processes
Page | 12
and this leads to particles being captured inside the pores or absorbed inside the wall
of the pores [60]. Nanofiltration and reverse osmosis have the same basic principle
[33], but the main difference is the transport mechanism. In nanofiltration this
transport operates at the interface between the porous and nonporous membranes.
Therefore, it depends on two mechanisms: pore flow and the diffusion transport model
[39]. In comparison with reverse osmosis membranes, nanofiltration membranes have
a higher water permeability and can retain multivalent salts and low molecular weight
organic compounds [61]. Reverse osmosis is a process which has been widely used
for the desalination of seawater as it is able to remove almost all dissolved matter from
solutions [39]. The range of operating pressure in reverse osmosis is 30 – 60 bar.
Asymmetric membranes, which have two layers, an upper dense layer of less than 1
µm thickness and a porous support layer of 50 – 150 µm thickness, are used in reverse
osmosis and nanofiltration processes [33].
2.1.1 Ultrafiltration
Ultrafiltration is a membrane process somewhere between microfiltration and
nanofiltration, pore sizes range from 0.05 µm to 1 nm [33]. The ultrafiltration process
is commonly used for the removal of colloids and macromolecules from aqueous
solution. Ultrafiltration and microfiltration have the same basic separation principle,
which depends on the sieving mechanism, where the rejection is determined by the
size of the solutes in relation to the pore size of the membrane, as well as where the
mobility of the solvent is directly proportional to the pressure applied in the system
[60]. However, distinctively, the porous ultrafiltration membrane tends to have an
asymmetric structure [62]. This refers to a dense top layer (i.e. less porosity and high
hydraulic resistance) with the thickness ranging from 0.1 to 5 µm and a porous support
layer (i.e., high porosity and less hydraulic resistance) with the thickness ranging
between 100 and 300 µm [26]. The material most common used to prepare porous
membranes in the first decade of ultrafiltration membranes was Cellulose acetate
(CA) [40, 63]. However, such membranes were marred by some deficiencies
associated with the biodegradability of the CA, as well as the limitations of the
material, such as its low chemical and thermal stability and a relatively narrow range
of pH tolerance [63].

Chapter 2 A review of membrane for oil water separation processes
Page | 13
As a result, CA was replaced by other polymers or polymer blends, including
polyacrylonitrile (PAN), aromatic polyamides (PA), polysulfone (PS), polyether
sulfone (PES), polyvinylchloride (PVC) and polyvinylidene fluoride (PVDF) [40, 63].
The ultrafiltration membranes prepared from these polymer materials exhibited a wide
range of pH and a resistance to high temperatures [40, 64]. In addition, when it comes
to the treatment of oily wastewater, ultrafiltration has been proven to be more effective
than conventional treatment methods [65]. This is because it provides high oil removal
efficiency without using chemical additives and it uses little energy, thereby reducing
energy costs; plus it occupies a small operational space [66] due to the compact nature
of the membrane module.
Today there are four basic ultrafiltration membrane module designs being used: open
tubes with (0.5 – l) inch diameter ranges; hollow fibers; the thin-channel devices that
can be configured into flat-plate or tubular and spiral wound modules [33, 46, 63]. The
membrane surface and the fouling phenomena in the ultrafiltration process have had a
significant influence on the design of the membrane module and on the entire
ultrafiltration system [46]. For instance, the high shear rates at the surface of the
membrane are critical for the minimisation of the effects of concentration polarisation.
Moreover, the reticulation pumping costs of the tubular and the laminar thin-channel
devices represent a moderate portion of the operating costs of the ultrafiltration system
[63].
2.1.2 Dead end and cross flow modules
There are two main architectures of filtration that can be used in membrane processes:
the dead-end filtration mode and the cross-flow mode [38]. These are shown in Fig.
2.4.

Chapter 2 A review of membrane for oil water separation processes
Page | 14
Fig. 2.4. Schematic diagram of the types of operation processes adapted from [67]: (a) dead
end (b) cross flow.
Dead-end filtration is commonly used for small scale experiments (e.g. in a laboratory)
because it is rapid and cost effective [38, 68]. However, the accumulation of solutes
on the membrane surface can occur because of the movement of the feed through and
perpendicular to the membrane surface [39]. This occurrence is minimised in the
cross-flow process due to the tangential movement of the feed with the membrane
surface, which then leads to the removal of the accumulated solutes/foulants and the
subsequent production of higher flux than in the dead-end [69]. Therefore, the cross
flow operation regime is commonly used in commercial membrane plants [68].
However, complex equipment is needed for this system, and the operating cost is
higher than that of the dead end operation mode due to the energy required to recycle
the feed solution [39, 70].
2.1.3 Composite membrane
In the composite membranes, the structure consists of two main layers: the dense and
extremely thin surface layer, and the porous and thick support layer [34, 41, 71] (cfr.
Fig. 2.2d). These membranes are characterised by a heterogeneous structure and
chemical composition [38]. Transportation of the solutes across these membranes is
predominantly influenced by the characterisation of the top layer, including the pore
size, porosity and thickness of the membrane [47]. Composite membranes have
superior advantages over the integrally-skinned asymmetric membranes. For instance,

Chapter 2 A review of membrane for oil water separation processes
Page | 15
there is a wide variety of materials that can be used to prepare the support and selective
layer of a porous composite membrane. Additionally, the preparation of the selective
layer and the porous support for the composite membrane can be done separately [72,
73]. This provides the possibility of individual formulation and optimization of these
two separate layers, leading to the achievement of the required selectivity,
permeability, chemical and thermal stability properties of each layer [34].
Generally, porous composite membranes exhibit asymmetric pore structures, which
are formed when the top thin selective layer is deposited on a porous support layer,
which is made of a different material [74].
There are four types of procedure for preparing composite membranes [74-76]:
The polymer solution is cast very thinly over the surface of the water bath
before being laminated on a microporous membrane support;
The microporous support is coated with a polymer, followed by either drying,
heat treatment or radiation;
Plasma polymerization i.e. a barrier film is deposited from reactive monomers
in gaseous phase;
Interfacial polymerization over a microporous membrane support structure.
Composite membranes are most common in industrial applications due to their
excellent solute rejection and solvent flux properties, as well as their high mechanical
strength [75]. Most of the pressure-driven membrane processes utilize composite
membranes [77]. Hence, composite membranes were prepared and assessed in this
research work, and more details can be found in Chapter 4.
Methods for the fabrication of polymeric membranes
2.2.1 Phase inversion
Most traditional polymeric membranes can be prepared by phase inversion technique,
which is a process that converts a polymer solution into solid matter [78]. An
immersion precipitation technique can then be used to complete the conversion

Chapter 2 A review of membrane for oil water separation processes
Page | 16
process. This process consists of three main steps. First, a polymer is dissolved in a
suitable solvent to form a solution which contains 10 – 30 wt. % polymer [79], the
range of the polymer concentration used to prepare an ultrafiltration membrane is
between 12 to 20 wt. % [80]. Then, the solution is cast on a support layer (e.g. a non-
woven polymer – in this project, however, this is a glass plate). This can be done using
a doctor blade, spin coating or another alternative method. Finally, the cast membrane
is immersed in a non-solvent coagulation bath [81] and the membrane forms as a result
of the interaction between the solvent and non-solvent.
From a thermodynamic point of view [82], the mechanism of phase inversion can be
explained by a three component system: polymer, solvent, and non-solvent [83]. The
isothermal ternary diagram, in Fig. 2.5, shows that several areas can be recognized:
the homogeneous region (one phase, Sol1), consisting of a casting polymer solution
(polymer, solvent and non-solvent); the heterogeneous region (two phases, Sol2),
consisting of two phases - polymeric rich and polymeric poor phases; and the gel
region, where the solidification process occurs in the polymeric rich phase [84].
Fig. 2.5. Isothermal ternary diagram for polymer – solvent – non solvent system, (adapted
from [84]). Sol 1: Dope solution (homogeneous solution), (polymer + solvent), Sol 2:
Heterogeneous system (polymer, solvent, nonsolvent) including a C' rich in polymer, C"
poor in polymer; Gel is a single phase region; A, B and C represent the positions of the
polymer solution, demixing and solidification step respectively.
Further to this, curved line 1 describes the phase inversion process. It starts from point
A, representing the polymer solution, solvent and non-solvent. When the path reaches

Chapter 2 A review of membrane for oil water separation processes
Page | 17
point B, at the binodal curve, de-mixing begins. This continues until reaching the
solidification step, which occurs through the gelation process [84].
Immediately after the casting film has been immersed in the non-solvent coagulation
bath, the liquid-liquid demixing takes place. Again, depending on the precipitation rate
of the dope solution (i.e. the demixing rate between the solvent from the dope solution
and the mixing of the nonsolvent with the dope solution [85]), two types of membrane
structures can be recognised (see Fig. 2.6). When “instantaneous” demixing (i.e.
immediate precipitation of the casting solution) has occurred, a membrane with a
highly-porous, thin-skin layer supported by a finger like layer (i.e. a high membrane
flux and low rejection) is produced [80, 86]. The fabricated membrane is characterized
by high flux and low rejection. Meanwhile, when “delayed” demixing (i.e. slow
precipitation of the casting solution) takes effect, the membrane with a relatively dense
skin layer supported by a sponge-like layer (a low membrane flux with high rejection)
is fabricated [85-87].
Fig. 2.6. Two types of membrane structures related to the demixing rate, adapted from [87].
Many factors have a direct effect on the demixing rate during the phase separation
process [33], including the polymer concentration, the polymer type and the suitable

Chapter 2 A review of membrane for oil water separation processes
Page | 18
solvent, as well as the solvent/nonsolvent miscibility. Increasing the polymer
concentration changes the membrane structure and then results in the production of a
membrane that has a low porosity top layer supported by a sponge-like structure [80].
This is attributed mainly to the slowdown of the demixing rate, as a result of an
increased polymer concentration at the interface between the casting solution and the
non-solvent [87]. Various types of polymer that have been used to prepare
micro/ultrafiltration membrane via phase inversion including, polyacrylonitrile (PAN)
[88], Polyvinylidene fluoride (PVDF) [89], Polytetrafluoroethylene (PTFE),
polyethersulfone (PES) [90], Polysulfone (PS) [91], and Polypropylene (PP). The
most commonly used materials for the preparation of ultrafiltration membranes are PS
and PES, meanwhile the popular polymers for microfiltration membranes are PVDF
and PP [58]. However, in this project PES has been chosen as the polymer material to
prepare the membrane primarily because of its commercial availability but also its
ease of processing. That is, asymmetric PES membrane can be easily prepared by
phase inversion, particularly when water is used as a coagulation bath [87]. In addition,
PES possesses distinctive features such as high selectivity, high permeability and
exceptional mechanical strength [92]. The chemical structure of PES is shown in Fig.
2.7. The cross section of the PES membrane prepared via phase separation process is
shown in Fig. 2.8.
Fig. 2.7. Chemical structure of polyether sulfone [93].

Chapter 2 A review of membrane for oil water separation processes
Page | 19
Fig. 2.8. Cross section of the PES membrane prepared via phase separation process [94],
PES 6020P (Mw = 29,000, BASF), 18 wt.% PES in 82 wt. % DMF, and deionized water
was used as a coagulant in the coagulation bath.
To successfully prepare a polymeric membrane by phase inversion, the polymer must
be either easily dispersed or completely soluble in the solvent [33]. Different solvents
have been used to prepare different kinds of membranes, however, the common
solvents that have been used for decades to prepare the PES membrane are N,N-
dimethylformamide (DMF) [95], N-methylpyrrolidone (NMP) [96], N,N-
dimethylacetamide (DMAc) [97] and dimethyl sulfoxide (DMSO) [98]. Meanwhile
water has been used as a non-solvent in the coagulation bath [33] during the immersion
precipitation step of the phase inversion process.
Another critical factor in the preparation of a polymeric membrane by phase separation
is the choice of a suitable solvent/nonsolvent regime that will ensure complete
miscibility [87]. The latter has a direct effect on the demixing rate and on the
membrane structure. For example, when the mutual affinity between the solvent and
the non-solvent is high, the miscibility between them is also high, and their exchange
rate is supposed to be high as well. Consequently, the demixing will be more
instantaneous, resulting in more porous membranes with macro voids in the sublayer
[85].
Moghimifar et al. [99] investigated the effect of the solvent types on the preparation
process of PES membranes. Four solvents were used, namely DMAc, DMF, NMP and
DMSO, to prepare PES membranes. The finding illustrated that the viscosity of the
dope solution that was prepared with different solvents had increased in the following

Chapter 2 A review of membrane for oil water separation processes
Page | 20
order DMAc < DMF < NMP < DMSO. The increase in the viscosity of the casting
solution led to the reduction of the miscibility between the solvent and nonsolvent.
This in turn led to the occurrence of the delayed demixing between the solvent and
non-solvent (water bath). Consequently, this produced a PES membrane with a dense
top layer and low porosity. A high porosity was displayed by the membrane prepared
using the DMAc solvent (membrane porosity was around 82 %), whereas the lowest
porosity was shown by the PES membrane prepared with the DMSO solvent
(membrane porosity was around 48 %). The same trend was also found by Barzin and
Sadatnia [97]. The results reported that the miscibility of the DMAc-PES dope
solution in water was much better than the miscibility of the NMP-PES dope solution
in water. This was mainly due to the NMP-PES dope solution having higher viscosity
than the DMAc-PES dope solution.
2.2.2 Interfacial polymerization
Interfacial polymerization can be defined as a step growth polymerization process
[60], which takes place between the interface of an aqueous solution, containing one
monomer, and an organic solution, containing another monomer. The process is shown
in Fig. 2.9. It starts with the support layer - a microfiltration or ultrafiltration
membrane. This is immersed in an aqueous solution which contains a reactive
monomer (usually an amine), and then removed to be immersed in another solution,
containing the other reactive monomer, such as a multifunctional acid chloride in
hexane. As a result, a polymeric thin layer is generated on the top surface of the
membrane due to the chemical reaction taking place between the two reactive
monomers [100]. The main advantage of membrane fabrication by interfacial
polymerization is the thickness of the active layer that can be obtained in the range
(0.1 - 1.0 µm); this layer is typically dense and mostly defect free. Consequently, this
potentially leads to increased membrane flux with a high rejection level of solute
[101].

Chapter 2 A review of membrane for oil water separation processes
Page | 21
Fig. 2.9. Schematic diagram of interfacial polymerization process [100].
2.2.3 3D printing technology
Additive manufacturing, or 3D printing, is making a significant contribution to the
areas of manufacturing, by providing an alternative and efficient manufacturing
method that is quicker and lower cost than traditional manufacturing techniques [102].
A variety of materials are available for construction in almost any shape or structure,
and the technology is capable of integrating a range of components [103]. In fact, 3D
printing pertains to manufacturing technologies that produce physical objects directly
from the computer aided design (CAD) model [104]. The process begins with the
development of the original design using a CAD program and ends up where the
design has been converted into a STL (Standard Tessellation Language or
STereoLithography) file [105]. This represents the golden standard to transfer the data
between the CAD files and 3D printers [106]. The development of the STL file
involves the conversion of the CAD model into small triangles [107]. Increasing
vertices number (i.e. the number of triangles) results in increased (i.e. enhanced)
resolution of the printed part [106]. A visual example of how an STL file triangulates
the defined surfaces can be seen in Fig. 2.10.

Chapter 2 A review of membrane for oil water separation processes
Page | 22
Fig. 2.10. Comparison of CAD and STL files, (a) CAD file, (b) STL format file [106].
This process is followed by dissecting the STL file into thin layers in the z direction.
After printing the model, any support material are removed from it and the necessary
post-processing done [105].
The 3D printing techniques can be classified into the following broad processes:
liquid-based (e.g. inkjet technique), wire-based, powder-based and foil-based [104].
In this study, the material jetting technique (i.e. inkjet) was used and is described
below. Material jetting: The two pioneering additive manufacturing device
producers, Stratasys and 3D Systems, have both developed inkjet 3D printers which
are a configuration of lithographic methods and material jetting; their printers bring
together high resolution and high surface quality, as well as high fabrication speed
and large build volume capabilities [108].
These have the same basic working principle of a traditional 2D printer [109], however
they use a different type of ink in the form of light-curable (photopolymer) resins (i.e.,
printed materials) and waxes (i.e., support materials) [25]. Photopolymers can provide
lower viscosity to enable much easier 3D printing process and fast curing reactions
[110]. They are known light sensitive thermoset polymeric materials that can
transform from liquid to solid state upon exposure to either UV light or a laser [104,
111]. The wax material is used to build support structures which are required to hold
the ejected material (i.e., polymeric material) [112]. The wax material and the light
curable resin are firstly heated and converted into droplets that are jetted by an array
of movable nozzles. Then, the wax material is deposited on the platform to create the
wax layer, which contains the spatial gaps (i.e., the supportive structure). Thereafter,
the light curable resin is dropped into the spatial gaps in the wax layer [113]. Finally,
a UV light is used for the solidification process [114]. Contrary to the
Stereolithography techniques, where the support material is only needed in areas with

Chapter 2 A review of membrane for oil water separation processes
Page | 23
high loads, the inkjet technique needs a fully support structure [108]. where the
quantity of each material (printed and wax) is almost equal to the whole build quantity
of the model, thus making this method less favourable because it is less cost effective
when compared to other Additive Manufacturing (AM) techniques [108].
Furthermore, the materials for inkjet technology are expensive and most of them have
been patented and therefore have materials proprietary rights attached to them [115].
However, a Polyjet printer has notable advantages, especially when multiple inkjet-
heads are used. For instance, it is possible to build multi materials at the same time,
something which has proven very difficult in the case of Stereolithography (SLA) and
digital light processing (DLP), respectively [108]. Additionally, with the exception of
two photon polymerization (2PP), this technique has a better resolution compared to
most photo curable 3D printing techniques [116]. A schematic diagram of a 3D
material jetting process is illustrated in Fig. 2.11.
Fig. 2.11. Schematic diagram of 3D material jetting process.
Using 3D printing technology in membrane engineering is a relatively new concern
[25]. Recently, 3D printing has been used in membrane separation technology. For

Chapter 2 A review of membrane for oil water separation processes
Page | 24
example, a novel membrane geometry based on a triply periodic minimal surface was
fabricated to enhance mass transfer, separation and the mixing process [117].
However, in the fabrication of membranes by 3D printing technologies, the resolution
and availability of appropriate materials are still the main challenges [25]. The
resolution of a 3D printer refers to the density of the printed droplets across a
particular length i.e. the closer the droplets are printed to each other, the higher the
printing resolution of the printed part becomes [118].
The resolution provided by current 3D printing technology is far from nano-scale
[116], which is where it needs to be in order to accurately print a wide range of
membranes. Two methods - superfine inkjet and two photon polymerization - can
provide the required resolution to print the pore size for a microfiltration membrane
(see Fig. 2.12)
Fig. 2.12. Limitation of 3D printing technologies for membrane fabrication. Adapted from
[116]
However, the material selection is also limited [25]. The polymeric material generally
used in 3D printing technologies comes in one of three forms: polymeric wire,
photopolymer resin and polymeric powder [116]. These have properties that are
amenable to 3D printing (i.e. melting of polymeric wire, UV curing of photopolymer
resin and sintering of polymeric powder). However, they are not necessarily amenable
to the fabrication of stable and accurate membranes (i.e. their mechanical and chemical
stability) [116]. Therefore, printing technology needs to expand its range of printing
materials to include polymers (i.e. high mechanical stability and chemical stability)
like Polyethersulfone, that are used in the fabrication of commercial membranes [25].

Chapter 2 A review of membrane for oil water separation processes
Page | 25
Membrane transport mechanisms
Darcy’s law and the equations of Hagen-Poiseuille and Carman-Kozeny are
commonly used to describe fluid flow (i.e. the membrane flux) through a porous
membrane when the fluid flow is laminar (i.e. fluid layers move in a regular route)
[35]. In membrane science, an equation can only be effectively applied if certain
parameters prevail. This is true of those related to the structure of the pores, such as
their size & distribution, their shape and average length, their connectivity and
tortuosity factor, their membrane surface porosity and the active membrane surface
area [28, 38].
Darcy’s law has been used extensively to describe the fluid flow through
micro/ultrafiltration membranes, where the flow rate is directly proportional to the
pressure difference over a known distance (i.e. a membrane thickness) of a porous
medium [119], and it is governed by the following Equation (2.2):
𝐽 = 𝑘
𝜇 ∆𝑝
𝑙 (2.2)
where 𝐽 is the membrane flux (m3 m-2 s-1), which represents the liquid volume (i.e. the
permeate) passing through the membrane area as a function of time [120], ∆𝑃 is the
pressure difference (Pa), l is the membrane thickness (m), 𝜇 is the viscosity of the
Newtonian fluid (Pa s), 𝑘 is the permeability of the system (m2).
Membrane permeability is the ability of a porous membrane to allow the passage of
the Newtonian fluid through its pores [121]. This permeability is highly significant in
ensuring the cost efficient application of the membrane filtration mechanism as it
directly influences production and energy consumption [28]. A high permeability
membrane requires less applied pressure and therefore less energy consumption,
which in turn saves cost [122].
There are many factors that can be used to determine membrane permeability, such as
membrane structure, porosity, tortuosity [123] and driving force [124]. These factors

Chapter 2 A review of membrane for oil water separation processes
Page | 26
in turn determine the membrane flux of a porous membrane, however, in the case of
an asymmetric membrane, the effective thickness of membrane permeability is
difficult to measure [125]. This is due to the irregularity of the pore geometry of the
membranes prepared by the phase inversion method (cfr. Fig. 2.14b) and high
tortuosity path flow [80], where the tortuosity refers to the average length of the
membrane pore in relation to the thickness of the membrane). The membrane
tortuosity values range between 1 and 2.5 [60] (cfr. Fig. 2.13).
Fig. 2.13. Different tortuosity of porous membrane [60].
In such cases, membrane resistance (𝑅𝑚, m-1), a specific membrane character formed
by combining permeability and thickness, is used to characterize the fluid flow rate
through the membrane [125]. Membrane resistance can be calculated by Equation
(2.3):
𝑅𝑚 = 𝑙
𝑘 (2.3)
and Equation (2.2) becomes:
𝐽 = ∆𝑝
𝜇 𝑅𝑚 (2.4)
In the case of a membrane consisting of multi cylindrical channels of the same
diameter being placed perpendicular to the membrane surface, and the membrane

Chapter 2 A review of membrane for oil water separation processes
Page | 27
thickness being equal to the channel length, the Hagen-Poiseuille equation would be
most relevant for determining the flow rate via the membrane pores [38].
where 𝑞 is the flowrate through a pore (m3 s-1), 𝑟 is the channel radius (m), 𝜏 is the
channel tortuosity.
The membrane flux is the sum of all the flows through the individual channels of equal
sizes [38], therefore Equation (2.5) becomes:
𝐽 = 𝑁𝑃 𝜋 𝑟4
8 𝜇 𝜏 ∆𝑝
𝑙 (2.6)
where 𝑁𝑃 is the number of pores per unit area [126]. In terms of the surface porosity
(ε) of a membrane, Equation (2.6) then becomes:
𝐽 = 𝜀 𝑟2
8 𝜇 ∆𝑝
𝑙 (2.7)
where ε is the membrane porosity, which is defined as the void fraction of the total
membrane.
𝜀 = ∫𝜋 𝑟𝑖
2
𝐴
𝑁𝑃
𝑖=1
(2.8)
where 𝐴 is the membrane area (m2).
𝑞 = 𝜋 𝑟4
8 𝜇 𝜏 ∆𝑝
𝑙 (2.5)

Chapter 2 A review of membrane for oil water separation processes
Page | 28
Few membranes, such as track etched membranes (cfr. Fig. 2.14a), follow the Hagen–
Poiseuille equation due to varying pore geometries [80].
In the case of membranes that have characteristically closely packed spheres, such as
a nodular top layer structure (cfr. Fig. 2.14c), Carman-Kozeny’s Equation (2.9) is
applied to best describe the flow via these membranes [33].
𝐽 = 𝜀3
𝐾𝐶 𝜇 (1 − 𝜀)2 𝑆𝑂
∆𝑝
𝑙 (2.9)
where 𝐾𝐶 is the Kozeny constant, (which depends on the shape of the pores and the
tortuosity), 𝑆𝑂 is the specific surface of the porous medium (i.e. the surface area of a
porous medium divided by the volume of the solids of a porous medium) [38].
+
Fig. 2.14. Membranes with different structures (a) PP track etching [127], (b) PS finger-like
structure [128], (c) Poly(styrene)-b-poly(dimethylsiloxane) nodular-like structure [129].
Application of membranes for oil water separation
The target application of the membranes in this project was oil-water separation,
focusing on the demulsification processes to help deal with the large amount of
emulsion is generated during petrochemical and crude oil production processes, as
outlined in Chapter 1. The demulsification process, that can be carried out by

Chapter 2 A review of membrane for oil water separation processes
Page | 29
membrane technology, converts emulsion into a mixture of free oil and water [130] in
conjunction with either a gravity-based separation or a skimming separation process.
There are two categories of membrane processes used for oil-in-water separation
process [131], namely phase rejection and coalescence.
2.4.1 Phase rejection process
The membrane can be considered as a sieve that separates the molecules or particles
according to their size [132]. In the case of pore size and the oil droplet, the latter has
the inherent characteristic of being able to change its original shape. It can then be
squeezed easily [16] through the membrane pore, even if the pore size is smaller than
the oil droplet, which is completely different from other particles or solutes.
However, Lee et al. [49] mentioned that the capillary pressure of oil droplets in the
membrane pores could play an essential role in the rejection performance. This can be
described by Equation (2.10):
𝑃𝑐 =2 𝛾𝑜/𝑤 𝑐𝑜𝑠𝜃𝑜/𝑤
𝑟𝑐 (2.10)
where 𝑃𝑐 is the capillary pressure (Pa), 𝛾𝑜/𝑤 is the interfacial tension between the oil
and water (N m-1), 𝑟𝑐 is the pore radius (m) and 𝜃𝑜/𝑤 is the contact angle of the oil
droplets on the membrane surface and can be calculated using Young Laplace
Equation [49].
𝑐𝑜𝑠𝜃 =𝛾𝑚/𝑤 − 𝛾𝑚/𝑜
𝛾𝑜/𝑤 (2.11)
where 𝛾𝑚/𝑤 is membrane-water interfacial tension, 𝛾𝑚/𝑜 is oil-membrane interfacial
tension and 𝛾𝑜/𝑤 is the oil-water interfacial tension.

Chapter 2 A review of membrane for oil water separation processes
Page | 30
Generally, when the capillary pressure is more than the transmembrane pressure (i.e.
the membrane is hydrophilic (more water wetness) and oil contact angle > 90°), the
oil droplets are prevented from entering the membrane pores, as shown in Fig. 2.15.
However, the oil droplets can be deformed and pass through the membrane pores when
the operating pressure becomes greater than the capillary pressure [49].
Fig. 2.15. Rejection process by capillary process [49].
Many experimental research studies (cfr. Table 2.1) have assessed how membrane
separation performance is affected by the membrane’s pore size and shape [133], the
operating conditions pertaining to transmembrane pressure [134], the cross flow
velocity [135] and the oil concentration [136]. In more detail, different trends have
been observed in terms of the effect of the pore size on membrane separation
efficiency. Cumming et al. [133], used microfiltration membranes (Nuclepore) with
pore sizes of 2, 5, 8 and 10 µm to assess the effect of the membrane pore size on the
separation efficiency of kerosene-in-water emulsion with an oil droplet range of 1 μm
to 40 μm. They found that when the pore size of the membranes was increased from
2µm to 10 µm, the oil rejection percentage decreased from 99 to 20 %, respectively.
Similar results were achieved by Ohya et al. [137], where oil rejection decreased from
98 % to 88 % when the pore size was increased from 0.27 µm to 1.47 µm. These
observations are directly related to the fact that oil droplets can easily pass through the

Chapter 2 A review of membrane for oil water separation processes
Page | 31
pores of the membrane, even if they are bigger than the pore size. This is because the
oil droplet can change its original shape, and the capillary pressure (Equation 2.10) is
insufficient to prevent the droplets from passing through the membrane pores [49].
However, the results of Mueller et al. [135] revealed that increasing the pore size of
the membrane did not generally reduce the rejection process. They attributed this
occurrence to the influence of the thin oily layer on the membrane surface rather than
the membrane itself. The differences between these studies could be related to the
properties of the membrane material used (i.e. wettability, mechanical stability), types
of feed solution and operating pressure (cfr. Table 2.1). Another factor known to affect
the separation performance is the transmembrane pressure. The majority of
experimental work reported that the separation efficiency decreased with increasing
transmembrane pressure [16, 133, 134, 138, 139]. This was directly related to the fact
that the concentration polarisation layer was enhanced by increasing the solvent
permeation as a function of increased pressure. This resulted in the passing of more
oil droplets from the concentration polarisation layer through the membrane pores.
However, a different trend was found by Wu. et al. [140], whose results showed that
oil rejection slightly increased with increasing pressure due to the compaction
phenomenon of the membrane, where the membrane becomes dense with high
pressure. In terms of cross flow velocity effect on oil rejection performance, three
separate studies observed a similar trend [134, 138, 141]. Their findings showed that
an increase in the Reynolds number can lead to enhanced membrane flux because a
high Reynolds number generates high shear stress, which is required to reduce the
concentration polarisation and the accumulated oily layer on the membrane surface.
On the other hand, the oil rejection percentage decreased with an increasing cross flow
rate, whereby oil droplets were broken into small fragments (due to the high shear
rate) which managed to pass through the pores together with the permeate.
Furthermore, fouling resistance decreased as the Reynolds number increased, thus
allowing more oil droplets to pass through the membrane. However, oil rejection
improved with increasing oil concentration in the feed solution and at the same time,
membrane flux declined [16, 140], this is associated with concentration polarisation,
and an increase in the oily film with increasing oil concentration that leads to an
increase in membrane resistance (i.e. second membrane effect).

Chapter 2 A review of membrane for oil water separation processes
Page | 32
Table 2.1. State of the art oil rejection process.
Membrane types Pore size Emulsion types Oil droplets
range size
Feed
concentration
Operating conditions Oil
rejection
Ref.
pressure Crossflow velocity
µm µm Vol.% bar m/s %
Polyvinyl alcohol (PVA) 2, 5, 8, 10 Kerosene-in-
water
1 - 40 0.12 0.004 – 0.03 Dead end filtration [133]
Tubular microporous
glass
0.27, 0.75
1.47
Mineral oil-in-
water
1 - 40 0.03, 0.1, 0.4 0.088 – 0.687 0.02 - 0.26 49, 80, 99 [137]
α-alumina ceramic 0.2, 0.8 A heavy crude
oil-in-water
1-10 0.025 - 0.1 0.67 - 1.3 0.24, 0.91 98 - 99.9 [135]
Polyacrylonitrile (PAN) 0.1
Polysulfone (PS) 0.003 –
0.0036
Crude oil-in-
water
0.03 – 5 0.01 - 0.02 0.67 - 1.7 Dead end filtration 90 [16]
Iris 3042 --- mineral oil-in-
water
--- 1 – 5 --- Dead end filtration --- [49]
Alumina 0.16 Kerosene-in-
water
--- 0.06 – 1.13 0.98 - 2.94 0.27 – 0.55 95.7 – 98 [142]
Zirconia 0.07 96.7 – 98
Polyamide 1.16 Industrial oily
wastewater
0.01 – 47 --- 0.69, 1.38, 2.07 0.266, 0.33, 0.5, 1.16,
1.5
94.9 – 98 [134]
Poly(vinyl alcohol) (PVA) 0.00935 Gasoline-in-
water
0.36 0.031 1 – 2 2.01 --- [140]
Polyvinylidene fluoride
(PVDF)
0.45 gas-oil-in-water --- --- 1 – 3 --- 80 – 84.7 [138]
Polysulfone (PS) crude oil-in-
water
0.502 – 0.938 0.011, 0.023,
0.035, 0.0467
1 – 4 Dead end filtration [139]
Polysulfone (PS) 0.00321 -
0.00362
Crude oil-in-
water
0.03 – 5 0.01 1.034 – 1.724 ---
---
90 [141]
Produced water 0.02 – 0.2 0.0366 --- 80

Chapter 2 Membrane for oil water separation processes: review
Page | 33
2.4.2 Membrane fouling
The main challenge with using membranes is still their fouling propensity, a process
whereby substances such as oil droplets or particles are deposited on the membrane
surface, in the openings of membrane pores or inside the pores, resulting in the
membrane flux decline over time [143, 144]. The characteristics of the membrane
surface, such as: wettability (hydrophilicity/hydrophobicity), surface roughness,
surface charge and pore size distribution have a direct influence on the fouling process
due to the filtration process being ‘a surface phenomenon’ [145] and must be
considered when defining membrane fouling. Understanding the influence of these
factors is vital for controlling membrane fouling. As such, a detailed discussion of
each aspect is presented below.
Wettability
The percentage of contaminants is usually supposed to decrease with an increase in
the hydrophilicity of a polymeric surface [145]. This seems a reasonable hypothesis,
as any increase in the hydrophobicity of the polymeric membranes would lead to more
hydrophobic molecules being pushed towards the membrane surface [145]. However,
the hydrophilic membrane has high surface tension, which enables the formation of
hydrogen bonds with water molecules that are in close proximity with the membrane
surface. This then leads to the development of a thin water layer over the membrane
surface [80]. These phenomena make it difficult for the hydrophobic solutes to occupy
the water boundary and destroy the orderly structure. This is because high energy input
would be required to cross the water film and expose the surface of the membrane
[146]. The surface can be considered hydrophilic when the contact angle 𝜃 < 90 °, and
hydrophobic when the contact angle 𝜃 > 90 ° [143]. To determine the wettability of a
membrane, a water droplet is placed on the surface of a membrane and a goniometer
is used to determine the contact angle between the surface and the water droplet [38].
Nabe et al. [147] studied the effect of the contact angle of five chemically modified
polysulfone membranes (PS) on the fouling behaviour of the membranes, using
bovine serum albumin (BSA) solution. The results showed that the normalised flux
decreased with an increase in the contact angle. In other words, the membrane fouling
by the BSA solution was enhanced by increased membrane hydrophobicity due to the
water film over the membrane surface being reduced with increasing the

Chapter 2 Membrane for oil water separation processes: review
Page | 34
hydrophobicity [148]. This observation can be seen in Fig. 2.16, which indicates a
direct relationship between an increase in contact angle and flux decline.
Fig. 2.16. The relationship between flux decline and contact angle decline [147].
Research by Janknecht et al. [149] used different microfiltration and ultrafiltration
membranes to treat industrial oily wastewater. The membranes’ performance and
characterization are illustrated in
Table 2.2. The findings showed that membrane permeability ranged from 1.6 to 939
LMH bar-1, while the oil rejection was between 3.42 - 99.99 %. However, the contact
angle was found to have limited effects on permeability and oil rejection. This
behaviour might be related to an oily layer formed on the membrane surface (i.e. the
membrane became hydrophobic). A similar observation was made by Mueller et al.
[135]. They noticed that the membrane became hydrophobic (i.e. high contact angle)
and attributed it to the thin oily layer that had adsorbed onto the membrane surface.

Chapter 2 Membrane for oil water separation processes: review
Page | 35
Table 2.2. Characterisation and performance of the membranes [149]
Membrane Pore
diameter
Permeance
Oil rejection Contact angle
nm LMH bar-1 % deg
Ultrafiltration membranes
Polysulfone 0.3 1.6 99.99 71
Fluorpolymer 0.8 9.0 99.99 81
Polysulfone 2.0 16.0 99.99 80
Cellulose 2.3 1.9 99.99 58
Polyacrylonitrile 3.0 2.2 99.98
Acryl 5.0 39.0 99.98 85
Polysulfone 5.0 4.9 99.99 80
Microfiltration membranes
Polypropylene 20.0 0 --- 105
Polypropylene 40.0 0 --- 116
Polypropylene 100.0 10.0 99.08 100
Unknown 200.0 19.0 6.58 92
Polyamide 200.0 46.0 94.12 98
Nylon 220.0 939.0 3.42 77
Acryl 800.0 147.0 33.95 100
Surface roughness
Surface roughness can be defined as the difference between the topography of the real
and ideal membrane surfaces [150]. Average roughness (𝑅𝑎𝑣𝑔) is the most common
value used due to its simplicity. It can be measured using the following Equation (2.12)
[151]:
𝑅𝑎𝑣𝑔 = ∑|𝑍𝑛 − ��|
𝑁
𝑁
𝑛=1
(2.12)
where 𝑍𝑛 is the peak height at point n, �� is the average of the peaks height, and 𝑁 is
the total number of points in the measured area.

Chapter 2 Membrane for oil water separation processes: review
Page | 36
Fig. 2.17 presents the surface roughness of the PES membrane. Surface roughness
plays a major role in enhancing the fouling behavior of a membrane [152]. Any
increase in membrane roughness leads to an increase in the contact surface area
between the membrane and the foulants [153, 154], which then leads to increased
fouling of the membrane. In relation to this, a study by Elimelech et.al [155] revealed
that the smooth surface of a hydrophilic cellulose acetate membrane displayed less
fouling than the rough surface of a hydrophobic polyamide. Further, Vrijenhoek et.al
[156] investigated the effect of the surface roughness of the RO and NF membranes
on membrane fouling by colloidal particles. The results showed that the membrane
fouling had a direct correlation with the surface roughness. The Atomic Force
Microscopy (AFM) images showed that the colloidal particles were more likely to be
deposited on rough rather than smooth membranes, as they accumulated in the "valley"
areas of these membranes. In Vrijenhoek et.al’s [156] study this caused the blockage
of a valley, resulting in a significant reduction of membrane flux compared to the
smooth membrane.
Fig. 2.17. The surface roughness of the PES membrane prepared by the phase inversion
process [99].

Chapter 2 Membrane for oil water separation processes: review
Page | 37
Surface charge
Electrostatic attraction or repulsion forces between the membrane surface and particles
can have a direct effect on the formation of fouling [157]. In the case of the
ultrafiltration membranes, the charge on the membrane surface can influence the
interactions between the membrane and the particles in the feed solution. When the
such charges exist on the surface of the membrane and on the particles, the repulsion
forces will be a dominating feature; this will result in less fouling and concentration
polarization, particularly on the membrane surface [158]. However, when the
membrane surface and the particles have opposite charges, the membrane will foul
easily and its performance will decrease, mainly due to the dominance of the attractive
forces [15]. Several attempts have been made to reduce membrane fouling by charging
the membrane surface. For example, Kato et al. [159] prepared ionic surfaces of the
poly(ethylene terephthalate) fibres to study the effect of the membrane charge on the
fouling process. The results revealed that the surfaces were attractive to particles which
had different charges, whereas surface repulsion occurred where the particle had the
same electric charge as that of the membrane surface. This observation highlights the
fact that using a membrane with the same surface charge as that of the colloidal
particles can be efficient in reducing the fouling behavior of the membrane [146].
Pore size distribution
Pore size distribution has a direct impact on membrane fouling especially when the
foulant’s size is much smaller than the pore diameter (i.e. 𝑑𝑖𝑎𝑚𝑒𝑡𝑒𝑟𝑝𝑎𝑟𝑡𝑖𝑐𝑙𝑒 ≪
𝑑𝑖𝑎𝑚𝑒𝑡𝑒𝑟𝑝𝑜𝑟𝑒). A typical porous membrane with a large pore size will exhibit high
membrane flux, which could lead to the rapid occurrence of irreversible fouling. This
happens when foulants pass through the membrane pores and accumulate in its internal
structure, resulting in reduced membrane porosity [160] as well as less available area
for the fluid flow [68]. This situation was demonstrated by Gatenholm et al. [161] who
investigated the fouling process in microfiltration and ultrafiltration membranes
during the harvesting the E. coli cell. Their experimental results showed that the
membrane flux decline in the microfiltration membrane was more significant than in
the ultrafiltration membrane. The main reason was that the large pore size of the
microfiltration membrane enhanced the deposition of the E.coli cells inside the
internal structure of the membrane pores.

Chapter 2 Membrane for oil water separation processes: review
Page | 38
Membrane fouling mechanism
The flux in the pressure driven membrane filtration processes can be described by
Equation (2.13) [162], where the membrane fouling is represented as the membrane
resistances in a series.
𝐽 = ∆𝑃
µ 𝑅𝑡 (2.13)
where ∆𝑃 is the pressure (pa), µ viscosity of permeate (Pa s), 𝑅𝑡 the total resistance
(m-1).
In addition to the clean membrane resistance or the hydraulic resistance, different
resistances can be generated during pressure-driven filtration processes, where the
rejected foulants start to accumulate on the membrane surface. These resistances
include the following:
Hydraulic resistance 𝑹𝒎 (m-1)
Hydraulic resistance represents a membrane constant (i.e. an intrinsic characteristic)
that is neither influenced by the feed composition nor the applied pressure [33].
Concentration polarization resistance 𝑹𝒄𝒑 (m-1)
Concentration polarization is a phenomenon synonymous with all pressure-driven
membrane separation processes [69] due to the selectivity properties of a membrane
[163]. It is related to the build-up (mainly reversible) of dissolved or suspended matter
(i.e. foulants) in the feed solution, which develops very close to the membrane-solution
interface (i.e. the boundary layer) [49, 68]. This build-up occurs as a result of a non-
balancing act between the convective drag across the membrane (attributable to
permeation by the water) and the reverse flow of the dissolved or suspended matter
from the membrane to the feed solution [63, 64]. Concentration polarization usually
leads to reduced permeation flux, increased osmotic pressure and the reduction in the
effective transmembrane pressure [68]. Wu et al. [136] and Li et al. [65] highlighted
the fact that the reduction in membrane flux during the ultrafiltration process of oil-
in-water emulsion was due mainly to the concentration polarisation phenomenon,
which added a new resistance to the membrane, and therefore led to the reduction of
membrane flux.

Chapter 2 Membrane for oil water separation processes: review
Page | 39
Adsorption resistance 𝑹𝒂 (m-1)
Adsorption resistance is an outcome of the interaction forces between the membrane
surface and the foulants [163] or the interaction between solutes that have already
fouled the membrane surface and those that are present in the feed solution [120]. The
three interaction forces are: van der Waals forces, electrostatic force and chemical
bonding [64]. Their continued interaction gives rise to membrane fouling. A negative
effect of these resistances is that, because they increase the membrane surface
resistance, they tend to prevent the fluid from flowing through the membrane [33] and
this affects membrane flux (i.e. leading to flux reduction).
Gel or cake layer resistance 𝑹𝒄 (m-1)
This resistance happens when particles in the solution, that are larger than the
membrane pores, settle on the membrane surface and form a layer that becomes part
of the size sieving filtration mechanism [68]. Over time this layer thickens, which
increases the flow resistance of the fluid through the membrane [64]. Chakrabarty et
al. [16], Singh et al. [134] and Masoudnia et al. [138] found that the flux decreased
rapidly at the beginning stage of the experiment, which could be due to the blocking
of membrane pores and the formation of a thin oil layer (i.e. cake layer) on the
membrane surface.
During the filtration process of oil-in-water emulsions [55, 164, 165], the oil droplets
are rejected and directly make contact with the membrane surface. The hydrophobic
affinity (i.e. interaction force) between the oil droplets and the membrane surface
releases low interfacial energy to the oil-membrane interface. Consequently, and as
defined by Young's equation (Equation 2.11), the contact angle is reduced and the
wetting and spreading processes of the oil droplets on the membrane surface are
enhanced. Then the slow coalescence and the migration processes of the oil droplets
create an oily layer over the surface of the membrane, causing an abrupt decrease in
membrane flux. The cake film (i.e. oily layer) can be summarized by the following
dynamic process: wetting → spreading → coalescence → migration → cake layer.
Fig. 2.18 illustrates the contribution of these resistances to the decline of the membrane
flux during membrane filtration of the oil-in-water emulsion, whereby three regions
can be recognised [94, 164, 166]. In Region Ι, where the pure water is filtrated, the

Chapter 2 Membrane for oil water separation processes: review
Page | 40
flux 𝐽0 becomes dependent on the membrane characterization (i.e. intrinsic), such as
pore size, porosity and applied pressure. In this stage the hydraulic resistance becomes
the dominant resistance. In Region ΙΙ, the oil-in-water emulsion is filtrated, the
membrane flux declines over time, from 𝐽0 to 𝐽1, as result of the fouling phenomenon.
Thereafter, the membrane flux drops drastically, then more gradually and finally the
flux reaches a steady state.
The fouling in this region can either be reversible (external) or irreversible (internal).
Reversible fouling is caused by concentration polarization and cake formation,
whereas irreversible fouling is caused by the foulants adsorption process [165] or by
the formation of an oily layer inside the membrane pores [143].
The membrane flux in terms of membrane fouling can be described by Equation (2.14)
[164].
𝐽 = ∆𝑃
µ (𝑅𝑚 + 𝑅𝑟𝑒𝑣 + 𝑅𝑖𝑟𝑟𝑒𝑣 ) (2.14)
where 𝑅𝑟𝑒𝑣 is the reversible fouling resistance (m-1), 𝑅𝑖𝑟𝑟𝑒𝑣 is the irreversible fouling
resistance (m-1).
In Region ΙΙΙ, where the pure water is filtrated to clean the membrane, the reversible
fouling can be removed and the membrane flux can be recovered to 𝐽2. On the other
hand, the irreversible fouling that cannot be removed by physical cleaning can be
removed by applying the chemical cleaning method.

Chapter 2 Membrane for oil water separation processes: review
Page | 41
Fig. 2.18. Membrane flux during oil-in-water emulsion filtration, membrane flux as
function with time (𝐽(𝑡)), time in the beginning of the filtration process (𝑡0), time in the
beginning of emulsion filtration process (𝑡1), time in the beginning of washing process (𝑡2),
time at the end of filtration process (𝑡3), pure water flux (𝐽0), oil-in-water emulsion flux (𝐽1),
pure water flux after cleaning (𝐽2), total fouling resistance (𝑅𝑓), irreversible fouling
resistance (𝑅𝑖𝑟𝑟𝑒𝑣) and reversible fouling resistance (𝑅𝑟𝑒𝑣), adapted from [164].
Modification methods of antifouling membrane
Lee et al. [49] found the adsorption of oil on the membrane surface to be the main
contributor to the membrane fouling phenomenon. Many factors control the degree of
oil adsorption, such as the interaction force caused by the membrane’s
hydrophilicity/hydrophobicity (i.e. wettability), Van-der Waals forces, electrostatic
force and hydrogen bonding [167]. Therefore, reducing the interaction force between
foulants and the membrane surface plays a major role in controlling the fouling process
[168]. There are two key options for controlling the interaction force between the foulants
and the membrane surface: controlling the surface chemistry [1] and changing the surface
topography, or taking a hydrodynamic approach (enhancing the local shear stress) [169].

Chapter 2 Membrane for oil water separation processes: review
Page | 42
2.6.1 Surface chemistry
Surface modification focuses on reducing the interaction force between foulants and
membrane surface [8]. This can be achieved by increasing membrane hydrophilicity
by applying the following methods:
Chemical reaction
Many studies have introduced hydrophilic groups via chemical reaction. For example,
perfluoroalkyl groups were successfully grafted on to an aminated PAN membrane
via the acylation reaction, to fabricate the fluorinated polyacrylonitrile (PAN)
membrane [170]. Moreover, hydrophilic polymers such as poly (ethylene glycol) methyl
ether methacrylate [171] can be placed over the membrane surface via covalent bonding.
This then leads to the formation of a water layer over the membrane surface, thus
preventing oil droplets from fouling the membrane [1].
Physical absorption
Via this method, hydrophilic polymers can be directly deposited over the membrane
surface to improve the antifouling properties of the membrane that is used for oil water
separation. Kasemset et al. [52] used this method successfully to improve the
antifouling properties of the polyamide membrane for oil water separation by
depositing polydopamine on the membrane surface. Again, Yoon et al. [172]
demonstrated a new method for preparing a composite membrane to treat oily
wastewater. They deposited a biopolymer (chitosan) as a hydrophilic and permeable
coating layer over electro-spun Nano-fibrous scaffold polyacrylonitrile (PAN)
membrane. In this case, the prepared membrane showed a decrease in flux (i.e. 25 %
during the experiment time), and this was mainly related to the fouling phenomenon.
Surface coating
Many methods can be used to produce a thin hydrophilic film over a membrane surface
[173]. Liu et al. [174] produced an antifouling composite membrane for oil water
separation by depositing a thin layer of Polyaniline (PANI) over a Polyvinylidene
Fluoride membrane (PVDF), using a dip coating method. Spin coating and spray
coating can also be used to cover the membrane surface with a hydrophilic polymer.
Indeed, Kim et al. [175] fabricated an antifouling composite membrane for oil water
ultrafiltration separation. A spin coating method was used to deposit

Chapter 2 Membrane for oil water separation processes: review
Page | 43
copolymers containing poly (ethylene glycol) methyl ether methacrylate and methyl
methacrylate over the Polysulfone membrane (PS). However, the instability of the
coating layer is the main disadvantage of these methods, leading to the probable
detachment of the coating layer from the membrane [1].
Blending process
Blending polymer matrices with various hydrophilic substances through the phased
inversion technique has been extensively investigated, it is proven to be both effective
and easy to achieve [1]. Numerous studies have used the blending hydrophilic
components in a membrane matrix to improve the membrane hydrophilicity (i.e.
antifouling) used for the oil-in-water separation process [176-178]. Those components
are mainly organic materials (i.e. polymers and amphiphilic copolymers) and
inorganic nanoparticles [8]. For example, polyethylene glycol (PEG)/cellulose acetate
were blended with polyethersulfone [179], and Pluronic F127 [56] was successfully
mixed with Polyether sulfone (PES). Further, a triblock copolymer was incorporated
with Polyvinylidene fluoride (PVDF) [180] and polyvinyl pyrrolidone
(PVP)/polyethylene glycol (PEG) with Polysulfone membranes (PS) [16]. Regarding
the use of inorganic nanoparticles, PS composite membranes were prepared by
blending the dope solution of PS with TiO2 nanoparticles [91], SiO2 nanoparticles
[181] and hydrous aluminum oxide (HAO) [182], respectively.
The findings generally showed that fouling by oil-in-water emulsion was reduced in
all the prepared membranes due to enhanced membrane hydrophilicity (i.e. high
hydrophilicity). The contact angle decreased from 70° to 56° when TiO2 was used with
PES membrane [183]. Similarly, the contact angle of PS membrane decreased from
75° to 53.5° as a result of the addition of PVP [184]. In terms of membrane flux, one
study reported a high steady state of membrane flux in the oil-in-water emulsion when
a graphene modified PES membrane was used. For instance, the flux drop was only
9 % after eight hours of cross flow filtration using a graphene modified PES membrane
compared to 65 % of PES based membrane under the same conditions [185]. However,
the combination of the high affinity of water for the blend additives and the weak
interaction between the additives and the polymer matrix has led to the leaching
tendency of the additives when the membrane was used long-term [1]. This

Chapter 2 Membrane for oil water separation processes: review
Page | 44
phenomenon reflects the issue of the instability of membrane blends, which needs to
be tackled [1]. Further, a satisfactory membrane flux recovery ratio of the fouled
membranes could not always be obtained by pure water cleaning [181, 186].
Moreover, the pure water permeability of the blended membranes was lower than that
of the pristine membrane as the skin layer became thicker (i.e. high resistance to the
fluid flow) [183].
2.6.2 Patterned membranes
Surface patterning has drawn attention over the recent years [169, 187-190]. The main
advantages of this strategy are increased membrane surface area (i.e. active area) and
reduction of foulants over the membrane surface due to the generated turbulence (i.e.
vortexes) [190].
Fig. 2.19 summarises different types of patterned surfaces that have been used. The
experimental and simulation studies showed that patterned membranes have a strong
influence on reducing membrane fouling. For instance, line-shaped membranes have
been fabricated by nanoimprint lithography (NIL) on commercial PSF UF membranes
[191] to evaluate their performances in terms of silica particle deposition. The
patterned membranes showed a better performance where a 19 – 45 % increase in
critical flux was observed for patterned membranes compared to compartment ones.
However, the water permeance of the patterned membranes reduced by 2.8 % due to
the fact that NIL actually decreased either the porosity or increased the overall
resistance of the membranes. The same patterned membranes have been generated
over the Polytetrafluoroethylene (PTFE) membranes [192]. The patterned and
unpatterned membranes were tested for BSA filtration in a membrane distillation
process (∆T= 30 °C). A stable water flux along with less BSA deposition (shown by
AFM and confocal microscopy) over the membrane’s surface was observed for
patterned membranes. Moreover, different patterned shapes such as pyramid, 45°
rotated pyramid and reverse-pyramid have been prepared using polydimethylsiloxane
molds on PVDF membranes [193] to investigate the ability of patterns for mitigating
of particle depositions. The results revealed that a lower particle deposition in all
studied patterned membranes compared to un-patterned membranes. In addition, the
water flux for all patterned membranes was more than for un-patterned membranes
due to the larger surface area provided by patterned membranes (1.6 times larger).

Chapter 2 Membrane for oil water separation processes: review
Page | 45
However, the increase in pure water flux was less than 1.6 due to the lack of enough
fidelity of the fabrication method. The numerical simulations [169, 193] were also
carried out to explain the effect of patterns on fouling mitigation of membranes. The
simulation results indicated patterned membranes are able to improve membrane
transport performance and effectively mitigate the deposition of various colloidal
fouling due to the hydrodynamic effects associated with the surface patterns.
However, limited attention has been focused, so far, on the patterned membranes due
to lack of effective methods to create different types of patterns on the membrane
surface and the effect of the patterning process on the durability and permeance of the
membrane [169, 191, 193]. More details about this technique can be found in Chapter
4.
Fig. 2.19. Patterned surfaces, (a) prism-patterned membrane [194], (b and c) pyramid and
reverse pyramid-patterned membranes [193], (d) prism-patterned hollow-fibre membrane
[195] (e) cuboidal patterned, (f) channelled-patterned, (g) cylindrical patterned [196], (h)
sharklet patterned RO membrane [197], (i) line-patterned [191], (k) reverse-pyramid [198],
(l) cross pillars [199].

Chapter 2 Membrane for oil water separation processes: review
Page | 46
Coalescence process
Coalescence is defined as the process of merging small droplets of one liquid phase
(i.e. internal phase) which is dispersed in another liquid phase (i.e. continuous phase)
to facilitate their separation into two discrete phases [200]. The demulsification
process, based on the oil droplets’ coalescence using membrane filtration, allows the
entire oil-in-water emulsion to pass through the membrane [201]. The oil droplets are
then, caught and coalesced via the internal structure of the membrane [202]. Later, the
larger oil droplet released with the permeance is easily separated by gravitational force
[203] as it illustrated in Fig. 2.20.
Fig. 2.20. Oil droplets coalescence process [21].
Many factors play a significant role in the oil droplets coalescence mechanism, such
as pore size [204], wettability (i.e. hydrophobicity) [201], oil concentration [205],
transmembrane pressure [206] and pore geometry [207]. From this analysis of the
literature, it can be concluded that it is essential to understand the contribution of these
parameters to coalescence performance. There are numerous examples in the literature
of using membranes as coalescers to demulsify oil-in-water and water-in-oil emulsions
are discussed here after. The effect of pore size on the performance of the coalescence
process was examined by Hong et al. [205], Wen-Feng et al. [206], Kocherginsky et

Chapter 2 Membrane for oil water separation processes: review
Page | 47
al. [204], Sun et al. [208] and Kawakatsu et al. [207] . They found that the pore size
had a significant influence on the coalescence of the membrane, whereby the
separation efficiency increased with decreasing pore size. This is related to the oil
droplet coalescence mechanism which is enhanced by two factors [205]. The first
factor is droplet disintegration from droplet interactions due to the generated shear
from the emulsion flow rate through the membrane. The second is droplet coalescence
from droplet – surface interactions due to pore size effects (i.e. lower separation
efficiency with increasing pore size). The effect of feed solution concentration on
coalescence behaviour was studied by Hong et al. [205], Kocherginsky et al. [204]
and Kukizaki and Goto [202]. Their results showed that increasing the feed
concentration of the dispersed phase can lead to improved oil droplet coalescence. The
main reason for this phenomenon is that at higher feed concentrations, droplets are
more likely to collide with each other or with the membrane surface [205]. Membranes
with both hydrophobic and hydrophilic characteristics have been assessed. Hlavacek
[201] found that the high separation efficiency of oil-in-water emulsion could be
achieved with a hydrophobic polypropylene membrane, the separation efficiency of
different membrane types are captured in Table 2.3.
Table 2.3. Effects of different types of membranes on oil in water separation efficiency [201].
Membrane Pore size Material Characteristic Separation
efficiency
µm %
Millipore GSWP 0.20 Nitrocellulose
acetate
hydrophilic 0
--- GVWP 0.20 PVDF hydrophilized 0
--- GVHP 0.20 PVDF hydrophobic 18
--- HVHP 0.45 PVDF hydrophobic 23
Fluoropore 0.20 PTFE hydrophobic 16
Gelman GN4
metricel
0.80 Cellulose
esters
hydrophilic 0
Nuclepore 0.20 Polycarbonate hydrophilized 5
Celgard 2500 0.12 Polypropylene hydrophobic 45
Enka IE PPHF 0.10 Polypropylene hydrophobic 45
Enka 2E PPHF 0.20 Polypropylene hydrophobic 60

Chapter 2 Membrane for oil water separation processes: review
Page | 48
Meanwhile, Kocherginsky et al. [204] evaluated the use of polymeric membranes to
demulsify the water-in-oil emulsion. Factors such as the type of membrane
(hydrophilic or hydrophobic) were investigated. The results showed that hydrophilic
membranes exhibited high separation performance compared to hydrophobic
membranes, which showed poor separation performance. Furthermore, Wen-Feng et
al. [206] and Sun et al. [208] successfully used hydrophilic membranes as the
coalescers to breakdown the water-in-oil emulsions. The main reason is that the
affinity (i.e. wettability) between the membrane and the droplets, where membrane
pores work as coalescing media [21, 201]. The results in Table 2.3 highlight the fact
that the highest oil-in-water separation efficiency achievable is 60 %, which was
achieved using Polypropylene hydrophobic membranes. Furthermore, it can be seen
that hydrophilic membranes have a poor oil-in-water separation efficiency. This then
suggests that for efficient oil-in-water separation, hydrophobic membranes,
particularly Polyropylene hydrophobic membranes, are the preferred choice.
Aside from membrane material, membrane geometry can also influence oil droplet
coalescence. For example, Hong et al. [205] found that the Polytetrafluoroethylene
(PTFE) membrane performed better when it was operated in a reverse orientation,
whereby it displayed high separation efficiency and permeability. This was due to the
pore geometries across the membrane, which were in reverse orientation and this
provided a cone-shaped flow path that improved the coalescence process and the
separation efficiency, respectively. Furthermore, Kawakatsu et al. [207] used a
microscope video system with micro - channels to observe the motion of an oil in
water emulsion (phase-inversion phenomena). They used a Trapeziform cross section
microchannel with the following dimensions: 1.3, 8.7, 4.6, and 4.2 µm, which
corresponded with the bottom width, top width, channel height and the equivalent
diameter, respectively. They also used a multilayer membrane configuration with
different pore sizes (i.e. 1, 5, 10 µm) for demulsification by coalescence. The
microscopic observation revealed how the oil droplets had coalesced at the entrance
of the microchannel array owing to high interaction between the surface of the
hydrophobic membrane and the oil droplets. An oily layer had also formed at the exit
of the microchannel array and moved down gradually towards the permeate side. The
multilayer membrane was very effective in breaking down the emulsion as a result of
a good mechanism provided by this configuration to demulsify it. This configuration

Chapter 2 Membrane for oil water separation processes: review
Page | 49
consisted of two-steps, with the first step ensuring that the emulsion was broken down
by passing through the first layer (1 µm), and the second step is the growth step,
provided by 5 µm and 10 µm layers. It is in the second step where more oil droplets
were accumulated and led to an increase in the oil droplet size.
Generally, purification processes based on gravity, such as those using an API
skimmer, have been used to enhance oil-water separation, especially for free oil [209].
Although as discussed in Chapter 1, this process is not effective at separating
emulsified oil, it could be used a pre-treatment step for oil coalescence from oil-in-
water emulsions using membrane contactors as it would increase the average size of
the droplets entering the contactor.
Owing to these effects of membrane geometry on oil droplet coalescence, one of the
objectives of this study was to investigate what effect changing the pore geometry
from cylindrical to complex geometry had on oil-in-water separation. To realise this
objective, the triply minimal surfaces were opted for and two types were used, namely:
P-surface and the G-surface or Gyroid. The P-surface was first created by Schwarz in
1867 [210], hence it is called Schwarz's primitive surface [211], whereas the G-surface
or Gyroid was discovered in the 1960's by Alan Schoen [212]. More details about
these triply periodic minimal surfaces can be found in Chapter 5.
Summary
From the analysis of the current literature, the following gaps, relating to the oil water
separation processes based on coalescence and rejection phase, have been identified.
In the oil rejection process, fouling is the main obstacle facing more extensive use of
membrane technology in the oil water separation process. Many attempts have been
made to mitigate the fouling process, such as enhancing the membrane hydrophilicity,
which includes coating or seeding the membrane matrix with hydrophilic materials.
Nevertheless, challenges remain, for example, in detaching the coating layer and
releasing the hydrophilic material from the membranes matrices. Another aspect of
reducing the fouling process is creating turbulence over the membrane surface.
Patterned membranes have been successfully used to enhance eddies in the vicinity of

Chapter 2 Membrane for oil water separation processes: review
Page | 50
the membrane surface. Different methods (e.g. micro moulding and nanolithography)
have been used to fabricate the patterned membranes. However, these processes have
many limitations in terms of the limited pattern that can be produced, and the pore
sealing, which in turn leads to a reduction in the membrane permeability.
For the oil water separation process, based on the coalescence process, pore geometry
has a direct effect on performance. However, traditional fabrication processes (e.g.
phase inversion) cannot produce a membrane with complex and controlled pore
geometry.
Therefore, this research has attempted to fill these gaps by:
Designing and printing 3D porous symmetrical membranes with different
pore shapes (i.e. circular, triangular, square, and hexagonal), different
membrane thickness, and controlled membrane porosity and tortuosity.
Designing and printing patterned composite membranes (e.g. wavy surface)
for oil-in-water separation, combining a 3D printed, patterned support with a
selective layer, prepared using conventional methods; and
Designing and printing complex pore structures, based on Schwarz-P and
Gyroid triply minimal surfaces, to enhance oil droplet coalescence in the
demulsification of oil-in-water emulsions.
The achievement of these aims contributes to the investigation and understanding of
the basic principles of using 3D printing technology in a new membrane’s fabrication
process. It firstly demonstrates how the technology can be used to create membranes
with a novel structure and topography, membranes which do not suffer significantly
from ageing or fouling over the lifetime of an industrial plant. Secondly, it shows the
possibilities for enhancing the permeability and selectivity of membranes used in oily
wastewater treatment via two processes, these being the membrane based on rejection
phase and membrane based on oil droplets coalescence process

Chapter 3 Fabrication of porous membranes by using 3D printing
Page | 51
Chapter 3
Aims and objectives
The main aim of Chapter 3 was to study how 3D printer technology can be sued as a
novel membrane fabrication method. This included finding a suitable software to
design a porous medium, searching for a suitable method for wax removal and, finally,
exploring the pore size range that can be printed by an industrial-grade 3D printer
(ProJet 3500 HD).
The outcome from Chapter 3 is still under preparation step to submit as an academic
journal paper:
Abouther Al-Shimmery; Ze Xian Low; Y.M. John Chew and Davide Mattia.,
Fabrication of porous membranes by using 3D printing.
Authors’ contributions
Abouther Al-Shimmery designed, printed and characterised the materials and
conducted the experiments.
Prof.s Davide Mattia and John Chew devised the experiments and supervised
the student.
Dr. Ze Xian Low contributed advise on the experimental and design process.

Chapter 3 Fabrication of porous membranes by using 3D printing
Page | 52
Fabrication of porous membranes by using 3D printing
Abstract
This study investigated a novel method for manufacturing membranes by 3D printing.
Autodesk Inventor and OpenScad software were utilised to draw the computer aided design
model (CAD) of the 3D printed membranes. It took several attempts and alterations to the
design before the 3D printable Stereolithography (STL) file was perfectly produced. A 3D
Systems Projet 3500 HD Max printer was used to produce the 3D printed membranes. This
material jetting 3D printer uses bespoke resins and polymers to fabricate the membrane, as
well as the hydroxylated wax to make the support structure. It was used to fabricate
membranes with 300 µm hexagonal pores, a diameter of 25 mm (i.e. 20 mm diameter of the
porous area plus 2.5 mm of the edge around the porous area) and a thickness of 1, 3, and 5
mm, respectively. To remove the wax from the 3D printed membranes, an ultrasonic cleaner
inside an oil bath was used for 6 hours at 60 °C. Complete removal of the wax and perfect
cleaning of the 3D printed membranes were realised after many months of process
optimisation. Several vacuum filtration experiments were conducted to investigate the
effect of the 3D printed membrane thickness on the permeance. The results illustrated that
both permeability and permeance were decreased by increasing the membrane thickness.
Furthermore, the results showed that 3D printing can be considered a new technique to
fabricate a symmetric membrane with a pore size of around 300 µm.

Chapter 3 Fabrication of porous membranes by using 3D printing
Page | 53
Introduction
Membrane separation processes compete directly with conventional separation
techniques in many applications due to their intrinsic characteristics, such as being
more energy efficient [130], being simpler to operate, and delivering high quality
products [31]. Moreover, the environmental impact of using membrane separation
technology is relatively low compared to traditional separation methods [55]. This is
due to the fact that when the separation process is applied, there is no use of hazardous
chemicals that could be discharged [213] into the final product or as part of the
generated waste (e.g., solid waste or wastewater). However, concentration polarization
and membrane fouling [1, 8, 214] are significant obstacles for this technology.
Furthermore, traditional fabrication methods, such as the phase inversion process,
have many limitations related to the formation of membranes with ideal
characteristics: high permeability (i.e. controlling membrane porosity, thickness, pore
size and shape), high selectivity and excellent antifouling properties. In this regard,
3D printing technology offers an alternative fabrication method able to produce
membranes with different topography, like a wavy surface of an antifouling membrane
[215] and complex pore geometry [117]. It can also control membrane porosity, by
controlling the number of pores and the distance between them. All these aspects make
the use of 3D printers in the membrane manufacturing process an exciting research
area [25].
The term 3D printing is an umbrella concept covering different types of technologies
with the ability to gradually fabricate physical objects on a layer by layer basis from a
computer aided design model (CAD) [216, 217]. This technology has many synonyms
based on the fabrication method, including rapid prototyping, solid free form, layered
manufacturing and computer automated [22]. The use of 3D printing started in 1980
when Charles Hull used it to fabricate plastic equipment with photopolymers. In 1986,
Hull patented the process and in the same year he founded the company 3D Systems
and developed a file format called Stereolithography (STL). In 1987, Hull and 3D
Systems produced the first 3D printer, Stereolithography. In recent years 3D printing
has become a very competitive technology, especially in terms of speed and cost [218].
Many 3D printing models have been developed for use in various fields of application,
such a chemical engineering [24], biology [219], chemicals synthesis [220], medical
applications such as plastic surgery [216], medical education [221], robotics [222],

Chapter 3 Fabrication of porous membranes by using 3D printing
Page | 54
micro-electro mechanical switches [223], pharmacy applications [109] food industry
usages [224] and passive sampling devices [225]. Students and scientists use 3D
printing technology to build models to enhance the theoretical understanding of
different processes [107].
In recent years, researchers, using different materials and 3D printing processes, have
had success in membranes fabricating. Four significant successes are discussed here.
Femmer et al. [226] developed a new technique to fabricate 3D polydimethylsiloxane
membranes for gas liquid contactors with a triply periodic minimal surface. In
comparison with a CFD simulation of a hollow fibre membrane, the results showed
that the 3D printed membrane has a superior carbon dioxide mass transfer through the
polydimethylsiloxane membrane into water. Gao et al. [227] established a novel
method to fabricate three types of nanostructured polymeric materials: nanotubes,
nanowires and a thin film. They combined a polycarbonate track etched membrane as
a template and connected it with a downstream vacuum system and a 3D inkjet printer
to print the polymeric materials on a layer by layer basis. The nanotubes were
fabricated by printing polyvinyl alcohol on the membrane with applied vacuum, while
the poly allyl amine hydrochloride and polystyrene sulfonate were printed separately
on a polycarbonate template. However, the thin film was produced by printing the poly
allyl amine hydrochloride and polystyrene sulfonate without applied vacuum.
Furthermore, 3D printing (a selective laser sintering) was also used successfully to
fabricate a 3D printed polysulphone membrane [228] and a 3D printed polyamide
microfiltration membrane [229]. The performance of the 3D membranes was
investigated for oil water separation and the rejection of the latex polystyrene,
respectively.
The limited amount of research done on 3D printed membranes indicates that there is
much scope for development in this area – and this study aimed at making a
contribution towards filling this significant literature gap. This study wanted to
determine the feasibility of fabricating porous membranes using 3D printing
technology.
The objective was to determine the optimal design characteristics of a 3D printed
porous membrane. This involved optimising the membranes’ pore size and shape and
the membranes’ thickness, in relation to what could actually be printed using the

Chapter 3 Fabrication of porous membranes by using 3D printing
Page | 55
available technology, considering both its software and hardware limitations. CAD
provided an opportunity to design different pore geometries and surface morphologies.
Furthermore, the study investigated suitable CAD software to design the membrane.
Additionally, several methods, including heating, vacuuming and washing with
different solvents, were tested to identify the optimal conditions for the complete
removal of the wax in the context of the 3D printing of porous membranes. This was
necessary due to the fact that complete wax removal from micro channels can be very
challenging due to high capillary forces [113].
Materials and methods 3.2.1 Materials
Urethane acrylate oligomers (acrylonitrile butadiene styrene), VisiJet® M3-X and a
proprietary paraffin wax (VisiJet® S300) were used in a 3D printer (ProJet 3500 HD
Max printer, 3D Systems, Rock Hill, SC, USA) to fabricate 3D printed membranes.
All these materials were purchased from 3D Systems, UK. Deionized water
(Millipore) was used to investigate the performance of the 3D printed membranes. The
following materials were used to remove the wax: Ethanol (C2H5OH), Toluene (C7H8),
Propanol (C3H70H) and Ethyl methyl ketone (C4H8O); these were purchased from
Fisher chemicals, UK. Hexane (C6H15OH) was purchased from VWR chemicals, UK,
and Xylene (C8H10) and Cyclohexane (C6H12) from Alfa Aesar, UK. Chloroform
(CHCl3) was purchased from Sigma – Aldrich, UK and EZ Rinse – C oil cleaner from
3D Systems, UK.
3.2.2 CAD design of the 3D membrane
Numerous commercial CAD software packages have been tested to develop the initial
design of the 3D membrane, including AutoCAD, Autodesk Inventor and Blender.
They share a basic principle and generally require two steps: the drawing of a two
dimensional model, followed by the conversion of the model into a three dimensional
one. However, none of the software listed above was capable of completing the
conversion from 2D to 3D dimensions because the generation of the very large number
of pores needed on the surface of the membrane model overwhelmed the software,
causing each to stop working.

Chapter 3 Fabrication of porous membranes by using 3D printing
Page | 56
To resolve this problem, OpenScad software was used. It uses Scad (Solid Computer
Aided Design) file format to define cubes, spheres, cylinders, and it transforms those
objects into text using a C-like syntax [230]. Moreover, it has a programming language
statement called “for loop”, [231] which allows the code to be repeatedly executed
which proved an invaluable tool in this this study. Given the functionality of the
OpenScad, the “for-loop” control flow statement was used to denote iterations and to
repeat the geometry of the pore. The code of the membrane pores was first drawn
individually in the x, y plane. This avoided drawing all the pores of the membrane at
the same time, which is a predominant challenge when using other software. The flow
diagram of the 3D printing processing steps and the fabrication set up method are
shown in Fig. 3.1 and Fig. 3.2, respectively.
Fig. 3.1. Steps of the general fabrication process of 3D model.
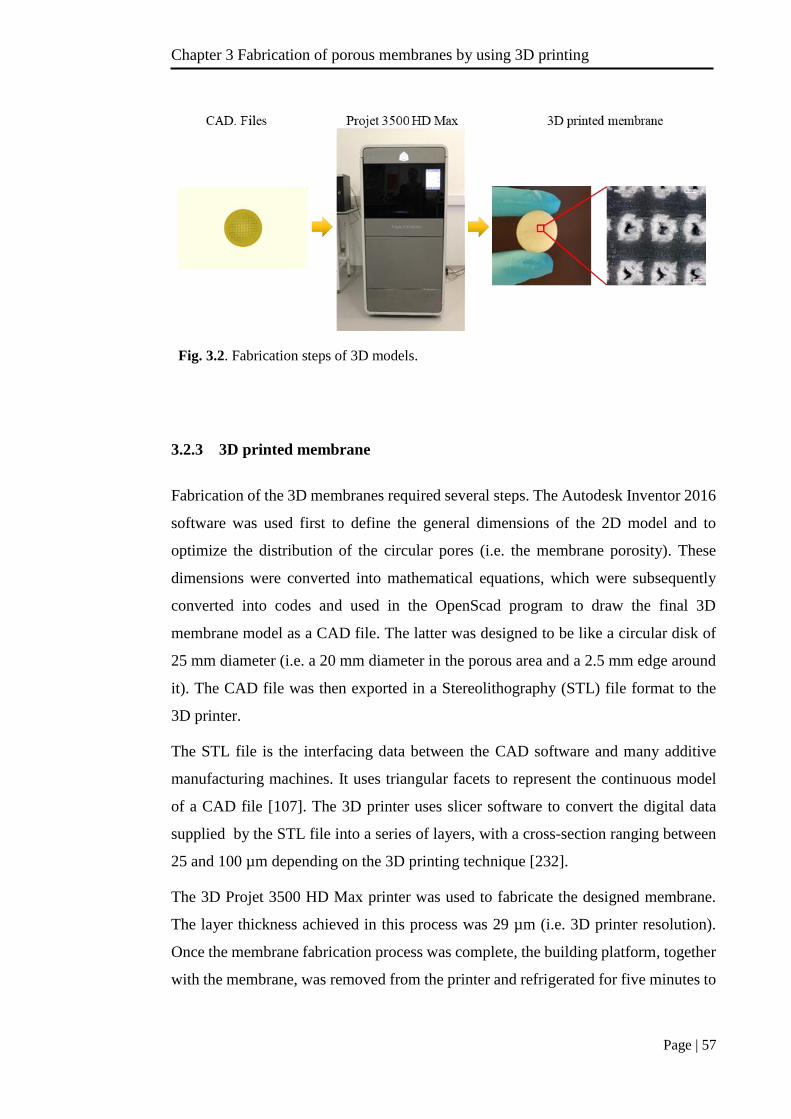
Chapter 3 Fabrication of porous membranes by using 3D printing
Page | 57
Fig. 3.2. Fabrication steps of 3D models.
3.2.3 3D printed membrane
Fabrication of the 3D membranes required several steps. The Autodesk Inventor 2016
software was used first to define the general dimensions of the 2D model and to
optimize the distribution of the circular pores (i.e. the membrane porosity). These
dimensions were converted into mathematical equations, which were subsequently
converted into codes and used in the OpenScad program to draw the final 3D
membrane model as a CAD file. The latter was designed to be like a circular disk of
25 mm diameter (i.e. a 20 mm diameter in the porous area and a 2.5 mm edge around
it). The CAD file was then exported in a Stereolithography (STL) file format to the
3D printer.
The STL file is the interfacing data between the CAD software and many additive
manufacturing machines. It uses triangular facets to represent the continuous model
of a CAD file [107]. The 3D printer uses slicer software to convert the digital data
supplied by the STL file into a series of layers, with a cross-section ranging between
25 and 100 µm depending on the 3D printing technique [232].
The 3D Projet 3500 HD Max printer was used to fabricate the designed membrane.
The layer thickness achieved in this process was 29 µm (i.e. 3D printer resolution).
Once the membrane fabrication process was complete, the building platform, together
with the membrane, was removed from the printer and refrigerated for five minutes to

Chapter 3 Fabrication of porous membranes by using 3D printing
Page | 58
lower the membrane’s temperature. After refrigeration, the membrane was removed
from the building platform and put in a storage pack before further processing.
3.2.4 Wax removal
The different methods that were used to remove wax from the 3D printed membrane
pores are described further:
3.2.4.1 Solvents-based removal
EZ Rinse – C solution, sunflower oil, acetonitrile, cyclohexane, ethanol, ethyl methyl
ketone, hexane, propanol and xylene were used to remove the wax from the fabricated
3D printed membranes, which were then placed in an ultrasonic bath for 6 hours at 60
°C.
3.2.4.2 Filtration-based removal
The filtration processes was conducted using the dead end cell and crossflow filtration
configurations. The dead end filtration experiments were carried out in a stainless steel
Sterlitech cell with an active area of 0.00146 m2. The dead end cell was placed on a
heater-stirrer in the water bath at a stirring speed of 300 rpm and the temperature was
controlled. The applied pressure was provided using compressed nitrogen. Ethyl
methyl ketone, Toluene, Xylene and EZ Rinse – C solution were used as cleaning
solvents, respectively.
The crossflow removal mechanism was then examined and compared to the dead-end
filtration removal mechanism to determine which of the two was more effective in
wax removal. The crossflow experiments were carried out in the Millipore cell made
of stainless steel with an active area of 0.00385 m2. During the crossflow experiments,
ethanol, propanol, acetone, cyclohexane, sunflower oil and water were used as
cleaning solvents, respectively.
3.2.5 Membrane characterisation
Several characterisation techniques, such as contact angle, Fourier Transform Infrared
spectroscopy (FTIR), and microscopic images, were performed to assess the
wettability, the performance of the wax removal process and the pore shape of the 3D
printed membranes. For the contact angle measurements, a contact angle goniometer

Chapter 3 Fabrication of porous membranes by using 3D printing
Page | 59
(OCA machine, Data Physics, Germany) was used to measure the water and oil contact
angles of the membrane surface at room temperature. About 5 µL droplets of water
were used and the values reported are the average of ten measurements in different
positions on the membrane surface. The microscopic images of membrane pores were
taken by means of a confocal microscopy (CARL Zeiss LSM, Germany) and a digital
microscope (VHX – 6000, Japan).
3.2.6 Membrane permeance
The effect of the pore length (i.e. the membrane thickness) with the same pore shape
was examined for the first time on the 3D printed membranes. This was motivated by
the fact that the 3D membrane can be designed to have the same pore shape with
different pore lengths, something that is not easily possible with the other membrane
fabrication techniques. Several vacuum filtration experiments were carried out to
investigate the effect of membrane thickness on membrane permeance. A quantity of
300 ml of pure water was used in each experimental run, and the experiments were
carried out using membranes of three different thickness, of 1, 3, and 5 mm. To
investigate the effect of pressure driving force across the membrane, two vacuum
pressure values were applied, 10 and 20 mbar. A schematic diagram of the
experimental system used in carrying out the experimental work is shown in Fig. 3.3.
Fig. 3.3. Labelled photo of the vacuum filtration equipment set up.

Chapter 3 Fabrication of porous membranes by using 3D printing
Page | 60
The permeance across the membranes (𝐾, LMH bar-1), can be experimentally
calculated using the following Equation (3.1):
𝐾 = 𝑉
∆𝑡 𝐴 ∆𝑝 (3.1)
where 𝑉 is the volume of the permeate (m3) over time ∆𝑡 (hr); 𝐴 is the effective
membrane surface area (m2), which is 2.833 × 10⁻⁴ m2 ; ∆𝑝 is the vacuum pressure
(bar).
3.2.7 Membrane permeability and resistance
The intrinsic permeability of the membranes to pure water was determined by using
the procedure described elsewhere [233]. The equations and the apparatus that were
used in this method can be found in Appendix 1. The resistance (𝑅𝑚, m-1) was defined
by using Equation (3.2):
𝑅𝑚 =𝑙
𝑘 (3.2)
where 𝑙 is the membrane thickness (m), 𝑘 is the intrinsic permeability (m2).
Results and discussions
Two main properties were achieved by using the membranes. Firstly, they have a
tortuosity value equal to one (i.e. symmetric membranes with cylindrical pore
geometry as shown in Fig. 3.4). Secondly, the membranes were designed with high
porosity, which was around 70 %. According to the Hagen-Poiseuille Equation (3.3),
where the membrane flux (𝐽, m3 m-2 s-1) has a proportional relationship with the
membrane porosity and an inverse relationship with the membrane tortuosity, the
productivity of the membrane could be increased dramatically with the use of the 3D
printing technology.
𝐽 = 𝜀 𝑟2
8 𝜇 𝜏 ∆𝑝
𝑙 (3.3)

Chapter 3 Fabrication of porous membranes by using 3D printing
Page | 61
where ε is the membrane porosity, 𝑟 is the channel radius (m), 𝜏 is the channel
tortuosity, 𝜇 is the viscosity of the Newtonian fluid (Pa.s).
Fig. 3.4. CAD file of the 3D design model, where the pore height is equal to the membrane
thickness and all the dimensions are in mm.
However, two main challenges emerged when using the 3D printing technology as a
fabrication method; these related to the nominal resolution [25, 234] of the 3D printer
and the wax removal [113]. Given these challenges, this study investigated the effect
of the pore shape on the permeability and selectivity of the membrane. Initially,
different pore geometries were designed, including triangular, square, hexagonal and
circular geometries. Despite the clear differences in the CAD designs for these shapes
(Fig. 3.5), the resulting printed structures did not show anything near the same level
of shape differentiation.
Fig. 3.5. CAD models, STL files and micrographs of the Triangle (a, b, c), Square (d, e, f),
Hexagonal (g, h, j) and Circle (j, k, l) 3D printed membranes.

Chapter 3 Fabrication of porous membranes by using 3D printing
Page | 62
This lack of differentiation is attributed to the insufficient resolution of the printer and
poor wax removal, both of which led to insignificant differences in the actual pore
shape of the membrane. In light of these results, the hexagonal pore was adopted for
further research, mainly because it was the easiest to print to a recognisable shape for
a small pore size and the simplest to achieve reasonable wax removal from. These
observations can be further explained by the variance in angle values of the different
pore shape geometries. These values are 60°, 90° 120°, 360° for triangle, square,
hexagon and circle, respectively. From a design perspective, the geometry with a big
angle would be able to provide sufficient space for wax removal.
Based on these considerations, a circular shape would logically be more suitable than
other geometries. However, the conversion process from a CAD to an STL file, where
the smooth surface in the CAD model is converted into small triangles (i.e. facets that
represent the whole surface of the 3D membrane) [235], resulted in curves becoming
straight lines (see Fig. 3.6).
Fig. 3.6. The difference between the CAD file and the STL file adapted from [236].
Consequently, in the final STL file, a circular-based pore shape becomes a hexagonal-
based one (see Fig. 3.5k). Additionally, the STL file size of the circular pore shape is
57 MB whereas the STL file size of the hexagonal pore shape is 4 MB, as shown in
Table 3.1. This has a direct influence on the productivity of the 3D printer, where the
number of the membranes that can be printed per batch is 25 of those with hexagonal-
based pore geometry compared to just 13 with circular-based pore geometry. As a
result, hexagonal-based pore geometry was preferred over circular-based pore
geometry.
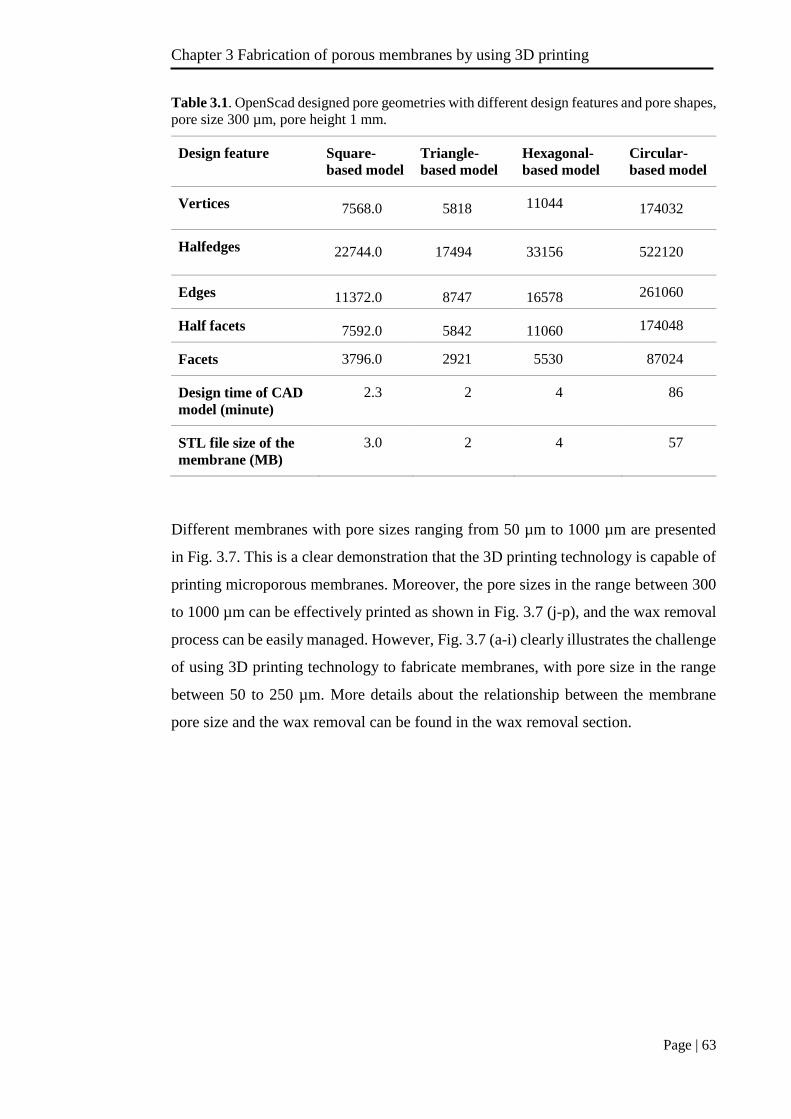
Chapter 3 Fabrication of porous membranes by using 3D printing
Page | 63
Table 3.1. OpenScad designed pore geometries with different design features and pore shapes,
pore size 300 µm, pore height 1 mm.
Design feature Square-
based model
Triangle-
based model
Hexagonal-
based model
Circular-
based model
Vertices 7568.0 5818 11044 174032
Halfedges 22744.0 17494 33156 522120
Edges 11372.0 8747 16578 261060
Half facets 7592.0 5842 11060 174048
Facets 3796.0 2921 5530 87024
Design time of CAD
model (minute)
2.3 2 4 86
STL file size of the
membrane (MB)
3.0 2 4 57
Different membranes with pore sizes ranging from 50 µm to 1000 µm are presented
in Fig. 3.7. This is a clear demonstration that the 3D printing technology is capable of
printing microporous membranes. Moreover, the pore sizes in the range between 300
to 1000 µm can be effectively printed as shown in Fig. 3.7 (j-p), and the wax removal
process can be easily managed. However, Fig. 3.7 (a-i) clearly illustrates the challenge
of using 3D printing technology to fabricate membranes, with pore size in the range
between 50 to 250 µm. More details about the relationship between the membrane
pore size and the wax removal can be found in the wax removal section.

Chapter 3 Fabrication of porous membranes by using 3D printing
Page | 64
Fig. 3.7. Optical micrographs of the 3D printed membranes with different pore size: (a) 50
µm; (b) 50 µm; (c) 50 µm; (d) 50 µm; (e) 100 µm; (f) 200 µm; (g) 200 µm; (h) 200 µm; (i)
250 µm; (j) 300 µm; (k) 300 µm; (l) 400 µm; (m) 400 µm; (n) 600 µm; (o) 1000 µm; (p) 1000
µm; Thickness of the 3D printed membranes = 1 mm, hexagonal-based pore geometry.
Wax removal
3.4.1 Solvents-based removal
The solubility of wax was investigated using a range of solvents on membranes with
differing pore sizes. The investigation of the control sample (i.e. wax only) was
undertaken to examine the wax solubility in different solvents. Pieces of the wax
material (VisiJet® S300) were placed in several glass vials containing different
solvents (i.e. ethanol, acetone, xylene, toluene, cyclohexane, hexane, sunflower oil,
EZ Rinse – C solution and ethyl methyl ketone). The vials were then subjected to
ultrasonic cleaning at 60 °C. The wax was easily dissolved by using one of the
experimental solvents after just a few minutes (5-15 minutes) of treatment.
Thereafter, these solvents were applied to the membranes with different pore sizes to
investigate their effect on wax removal when used by ultrasonic cleaning for 6 hours

Chapter 3 Fabrication of porous membranes by using 3D printing
Page | 65
at 60 °C. Fig. 3.8 shows the effect of different solvents on wax removal from
membranes with a 1000 µm pore size and hexagonal pore shape
Fig. 3.8. Microscopic images of wax removal from the 1000 µm, hexagonal 3DPMs after
ultrasonic cleaning for 6 hours in different solvents: (a) EZ Rinse – C solution; (b) Sunflower
oil; (c) Acetonitrile; (d) Cyclohexane; (e) Ethanol; (f) Ethyl methyl ketone; (g) Hexane; (h)
Propanol; (i) Toluene; and (j) Xylene. Thickness of the 3D printed membranes = 1 mm,
hexagonal-based pore geometry.
The EZ Rinse – C solution (Fig. 3.8a) and the sunflower oil (cfr. Fig. 3.8b) performed
better than Acetonitrile (Fig. 3.8c) and Propanol (Fig. 3.8h) in removing the wax from
the membrane. Additionally, the membrane showed better stability when these two
solvents were used. For instance, when the solvents Xylene, Toluene and Ethyl methyl
ketone were used, the membrane became brittle and displayed evidence of stress
cracking in different parts of the membranes, as is clearly seen in Fig. 3.7e.
However, the results in Fig. 3.9, relating to the 100 µm pore size of the membranes,
revealed that none of the solvents could completely remove the wax effectively from
such small pores. This is attributable to the concentration and viscosity of the solvents
and the residence time. Perhaps the geometry and the size of the pore, which are related
to the 3D printer resolution, or the material (surface chemistry) might also affect wax
removal efficiency; this could be the subject of future research.

Chapter 3 Fabrication of porous membranes by using 3D printing
Page | 66
Fig. 3.9. Microscopic images of wax removal from the 100 µm hexagonal 3DPMs after
ultrasonic cleaning for 6 hours in different solvents: (a) with wax; (b) EZ Rinse – C solution;
(c) Toluene; (d) THF; (e) Hexane; (f) Xylene; (g) Acetonitrile; and (h) sunflower oil.
Thickness of the 3D printed membranes = 1mm, hexagonal-based pore geometry.
3.4.2 Filtration-based removal
To investigate whether improved wax removal can be achieved, filtration under
pressure (i.e. blowing nitrogen through the membrane pores) was examined using the
hexagonal-based pore geometry membrane with 100 µm pore size. The effect of using
different solvents under pressure (50 bar) and at higher temperature (80 °C) was
investigated using a dead end filtration cell. As shown in Fig. 3.10, the dead end cell
filtration was also unable to completely remove the wax from the 100 µm pores.
Fig. 3.10. Microscopic images of wax removal using 100 µm, hexagonal-based 3D
membrane put in the dead end cell at pressure = 50 bar, temperature = 80 °C and treated with
different solvents.
For the crossflow cleaning cycle, only the larger pore size membranes (200 µm) were
used, given that those with a smaller pores could not be cleaned in the dead end cell.

Chapter 3 Fabrication of porous membranes by using 3D printing
Page | 67
Fig. 3.11 shows the effect of the crossflow process on wax removal from the
membrane when using different solvents at 60 °C and a flowrate of 0.1 × 10⁻³ m3 s-1
for 6 hours. The crossflow recirculation process was also ineffective in removing the
wax, as shown by the small number of open pores after treatment with solvents.
Fig. 3.11. Microscopic images of wax removal using 200 µm, hexagonal 3D membrane
which was subjected to the crossflow cleaning cycle and treated with different solvents (time
= 6 h, temperature = 60 °C), (a) CAD model; (b) control membrane; (c) ethanol; (d) propanol;
(e) acetone; (f) cyclohexane; (g) sunflower oil; and (h) water. Thickness of the membrane =
1mm, hexagonal-based pore geometry.
There are two potential scenarios that could explain the wax removal process of the
membranes with pore size in the range between 100 µm and 200 µm. The first is
related to the capillary forces (i.e. wicking phenomena that developed between the
wax and the pore wall) inside the small pores. The capillary pressure, (𝑃𝑐, Pa) inside
the membrane pores is defined by the Young−Laplace equation (3.4):
𝑃𝑐 =2 𝜎
𝑟𝑐 𝑐𝑜𝑠𝜃 (3.4)
where 𝜎 is the surface tension (N m-1), 𝜃 is the contact angle, 𝑟𝑐 is the capillary radius
(i.e. pore radius) (m). As can be seen from Equation (3.4), the capillary pressure has

Chapter 3 Fabrication of porous membranes by using 3D printing
Page | 68
an inverse relationship with the pore radius, therefore, the pressure that was applied
via the dead end filtration system was not sufficient to overcome the capillary pressure.
Another scenario is the inability of the 3D printer that was used in this research (ProJet
3500 HD Max) to accurately print the pores size according to the nominal resolution.
The resolution of a 3D printer is an indicator of the smallest feature size the instrument
(printer) can print (i.e. 3D dot) [234]. The 3D dot or voxel is the analogy word for
pixel in 3D printer technology, where a pixel has two dimensions, meanwhile the voxel
has three dimensions.
The Ultra High Definition mode (750 x 750 x 890 dot per inch (xyz)) was used to print
the 3D membrane. The highest resolution of this printer in z-direction is 890 dots per
inch (dpi), which is equivalent to 35 dots per mm, and the height of each dot is about
29 µm. This also means that the minimum thickness of the membrane layer is 29 μm.
However, the printer resolution in both x and y-directions was much lower, only 750
dot per inch. That led to the minimum printing resolution of 33 µm. This low resolution
in x-y directions led to some limitations in obtaining perfectly printed pore geometries.
Therefore, the voxel has the following dimensions in relation to this resolution: 33, 33
and 29 µm in the x, y and z directions, respectively, as illustrated in Fig. 3.12.
Fig. 3.12. Theoretical dimentions of the 3D dot or voxel of the ProJet 3500 HD Max.
These dimensions are too big to draw the small pore sizes (100 – 200 µm) required,
leading to an overlap of these drops with each other and eventual blocking of the pores.
Fig. 3.13 illustrates the different pore sizes of the 3D membrane and it further shows

Chapter 3 Fabrication of porous membranes by using 3D printing
Page | 69
that many 100 µm and 150 µm pores have not been printed, which could be linked to
the resolution of the 3D printer that was used. This provides a good evidence of the
3D printer’s nominal resolution being insufficient to print 100 – 200 µm pores.
However, it can be clearly seen in Fig. 3.13d that the 3D printed membrane with 300
µm pore size was well printed and almost all the pores were open. This demonstrates
that the 3D printer can effectively print the membrane with 300 µm pores using the
nominal resolution. As a result, the 300 µm pore size was chosen as the experimental
pore size of the 3D printed membranes.
Fig. 3.13. A 3D membrane with hexagonal pores after Utrasonication (a) 100 µm; (b) 150
µm, (c) 200 µm; (d) 300 µm; (e) 1000 µm; and (f) 3000 µm. The oil was supplied by 3D
printer company.
3.4.3 Membrane characterisations
The FTIR spectra of VisiJet® S300 support material (i.e. wax) and the 300 µm 3D
printed membrane were investigated to assess whether there were any traces of wax
still remaining in the membrane after 6 hours of ultrasonic cleaning at 60 °C. A FTIR
Spectrometer (PerlinElmer, Spectrum 100, UK) with a wavelength from 4000 cm-1 to
650 cm-1 was used in a transmission mode.

Chapter 3 Fabrication of porous membranes by using 3D printing
Page | 70
Some specific absorbance peaks for the wax were identifiable in the FTIR spectra (
Fig. 3.14), which suggests that residual wax was still present in the 3D membrane after
cleaning. Peaks for the wax in the 3D membrane can be seen clearly in the interval
2000 – 2300 cm-1, which represents the triple bond stretching region and it is the region
where the C ≡ C and C ≡ N bonds are located [237].
Fig. 3.14. FTIR spectra of VisiJet® S300 support material (i.e. wax) and the 3D printed
membrane after cleaning.
The wettability of the membrane was investigated through oil and water contact angle
measurements. It was found that the membranes have a water contact angle of about
83° ± 2°, which means that the polymer material is poorly wet by water. The 3D
printed membranes also showed oleophilic behaviour, where the contact angle of the
sunflower oil was found to be 20° ± 2°. Fig. 3.15 shows the optical images of contact
angles for the sunflower oil and water droplets on the membrane.
2018.13
cm-1
2160.14
cm-1
500 1000 1500 2000 2500 3000 3500 4000 4500
40
50
60
70
80
90
100
110
120
Tra
nsn
mit
tan
ce (
%)
Wavelength (cm-1)
3D printed membrane
Wax

Chapter 3 Fabrication of porous membranes by using 3D printing
Page | 71
Fig. 3.15. Contact angles of the 3D printed membranes, (a) Water drop (contact angle = 83°
± 2°); (b) oil drop (contact angle = 20° ± 2°).
3.4.4 Structural characterisation of membrane
Scanning Electron Microscopy (JEOL FESEM6301F) was used to characterise the
morphology of the 3D printed membrane. The shape of the pores was originally
designed in a hexagonal form, however, the resultant pores came out in a non-regular
shape, as can be observed in Fig. 3.16. The main reason for this change in pore shape
is the insufficient resolution of the 3D printer, as discussed previously. The side view
of the 3D printed membrane shows the layered structure resulting from the printing
process (cfr. Fig. 3.16). Further evidence of the irregularity of the pore shape was also
found in optical images taken using a digital microscope (VHX – 6000, Japan). The
images reveal irregular shaped pores with polymeric rims on their inner surface (Fig.
3.17). Additionally, the pore end became more obstructed with decreasing pore
diameter, eventually leading to pore closure. This could explain why the pores blocked
when the membrane printed in the range of the pore size, between 100 to 200 µm, as
displayed in Fig.s 3.6-8 and Fig. 3.13.

Chapter 3 Fabrication of porous membranes by using 3D printing
Page | 72
Fig. 3.16. SEM micrographs of the 3D membrane, cross section, pore diameter = 300 µm,
and distance between the pores = 300 µm.
Fig. 3.17. Images of the 3D printed membranes-based hexagonal pore geometry (a, b, c) 1000
µm, (d, e, f) 300 µm.
The effect of the fabrication process on the pore size of the actual 3D printed
membrane was investigated. The theoretical pore dimension extracted from the STL
file using the 3D Tool software was 300 µm, while the range of the actual dimensions
of the 3D printed membranes (obtained from the statistical image analysis of the SEM
micrographs, using Image J) was just (200 - 275) µm.

Chapter 3 Fabrication of porous membranes by using 3D printing
Page | 73
3.4.5 Membrane performance
As seen in Fig. 3.18, the membrane with a thickness of 5 mm demonstrated the lowest
intrinsic permeability, at 1.9 × 10⁻¹¹ m2, compared with 3.3 × 10⁻¹¹ m2 (for the
3mm) and 4.7 × 10⁻¹¹ m2 (for the 1 mm). The 5 mm membrane also showed the
highest resistance of the three thicknesses. It reached around 2.6 × 10⁸ m-1 resistance,
compared to 9.2 × 10⁷ m-1 (for the 3 mm) and 2.1 × 10⁷ m-1 (for the 1mm).
Although intrinsic permeability is a constant property of the porous medium [238] , it
is independent of the 3D printed membrane’s thickness. However, the results showed
that the permeability decreased with the increase in membrane thickness. There are
two possible explanations for this. The first is that the increase in the membrane
thickness resulted in the blockage of many of the membrane pores due to the 3D
printing resolution (see Fig. 3.16d, e, and f). The second is that with an increase in
membrane thickness, the wax removal process became a more difficult task; this is a
result of the high capillary forces [113] that can prevent the melted wax releasing from
the membrane pores. These issues, with resolution and wax removal possibly added
further resistance to fluid flow, which in turn led to a reduction in intrinsic
permeability. On the other hand, the resistance of the membrane increased with an
increase in the thickness of the membranes, due to their direct relationship with the
membrane thickness, as illustrated in Equation (3.2).
The results of membrane permeance, using pure water at 10 and 20 mbar, are presented
in Fig. 3.19. The permeance of the membrane increased linearly as the applied vacuum
pressure increased, meanwhile the permeance decreased dramatically with increasing
membrane thickness. This fact is related to the Hagen – Poiseuille model (Equation
3.3) and Darcy’s law (Equation 3.5).
𝐽 = 𝑘
𝜇
∆𝑝
𝑙 (3.5)
where 𝐽 is the membrane flux (m3 m-2 s-1), ∆𝑃 is the pressure difference (Pa), l is the
membrane thickness (m), 𝜇 is the viscosity of the Newtonian fluid (Pa s), 𝑘 is the
permeability of the system (m2).

Chapter 3 Fabrication of porous membranes by using 3D printing
Page | 74
In both models, the permeance has a direct correlation with the pressure difference
across the porous medium [239] and an inverse relationship with membrane thickness.
1 3 5
0
1x10-11
2x10-11
3x10-11
4x10-11
5x10-11
6x10-11
7x10-11
Permeability
Resistance
Thickness (mm)
Per
mea
bil
ity
(m
2)
0.0
5.0x10⁷
1.0x10⁸
1.5x10⁸
2.0x10⁸
2.5x10⁸
3.0x10⁸
Res
ista
nce
(m
-1)
Fig. 3.18. Permeability and resistance as a function of different thickness of the
membranes. Each data point is the average of 3 repeats on different 3D printed
membranes and the error bar represents the standard deviation.

Chapter 3 Fabrication of porous membranes by using 3D printing
Page | 75
1 3 5
0.0
5.0x10⁶
1.0x10⁷
1.5x10⁷
2.0x10⁷
2.5x10⁷
3.0x10⁷
3.5x10⁷
4.0x10⁷
Per
mea
nce
(L
MH
ba
r-1)
Thickness (mm)
Vacuum pressure = 10 mbar
Vacuum pressure = 20 mbar
Fig. 3.19. Permeance of the F3Dmembranes as a function of vacuum pressure (a) vacuum
pressure = 10 mbar; and (b) vacuum pressure = 20 mbar. Each data point is the average of 3
repeats on different 3D printed membranes and the error bar represents the standard deviation.
Conclusions
The results above indicate that it is possible to design and print porous membranes,
although there are limitations regarding what can be printed in relation to 3D printing
resolution and wax removal. The fabrication of the 3D printed membranes faced many
challenges in terms of modelling, wax removal and 3D printer resolution, which have
been understood and resolved, thus allowing future work to easily build upon this
research work. In terms of CAD modelling to produce 3D printed membranes, the best
software was found to be Autodesk inventor and OpenScad. Furthermore, the best
results in terms of wax removal were obtained by using the oil supplied by the 3D
printing company in conjunction with ultrasonic cleaning at 60 °C for 6 hours. The
limited resolution of the 3D printer did not allow for the fabrication of the 3D printed
membranes with a pore size of below 300 µm. Therefore, changing the thickness of
the 3D printed membrane was the only design factor that could be used to assess the
performance of the 3D printed membranes in terms of permeability, resistance and
permeance.

Chapter 3 Fabrication of porous membranes by using 3D printing
Page | 76
Conclusions and outcomes of the chapter 3
Symmetric porous 3D printed membranes (pore size = 300 µm, pore distance = 300
µm and tortuosity = 1) have been successfully fabricated using an industrial 3D printer
(ProJet 3500 HD). OpenScad software was found to be a suitable program to design
porous media. A successful method of wax removal from porous media based on using
ultrasonic with oil bath has been devised. The 3D printer resolution was insufficient
to print a membrane with pore size in the range of ultrafiltration process.

Chapter 4 3D printed composite membranes with enhanced anti-fouling behaviour
Page | 77
Chapter 4
Aims and objectives
The main aim of Chapter 4 is to optimise, design and fabricate fouling-resistant 3D
composite membranes. To achieve these, the following objectives were pursued: First,
computational fluid dynamics (CFD) simulations were used to optimise the design
parameters (i.e. peak amplitude, wave length) of the double sinusoidal 3D printed
support structure in terms of maximising turbulence over the membrane surface.
Second, an industrial multi-jet 3D printer was used to fabricate the optimised 3D
support. Third, the phase separation process was used to prepare ultrafiltration PES-
selective layers, subsequently deposited onto the 3D supports by vacuum filtration.
Finally, a cross-flow filtration setup was used to investigate the performance of the 3D
composite membranes for the coalescence of oil droplets starting from oil-in-water
emulsions, in terms of the permeance recovery ratio, reversible permeance decline
ratio, irreversible permeance decline ratio and total permeance decline ratio.
The outcomes from Chapter 4 has been published in an academic journal:
Abouther Al-Shimmery; Saeed Mazinani; Jing Ji; Y.M. John Chew and Davide
Mattia., 3D printed composite membranes with enhanced anti-fouling behaviour.
Journal of Membrane Science, 2019. 574: p. 76-85.
DOI: https://doi.org/10.1016/j.memsci.2018.12.058
Authors’ contributions
Abouther Al-Shimmery designed, printed and characterised the materials and
conducted the experiments.
Prof.s Davide Mattia and John Chew devised the experiments and supervised
the student.
Dr. Saeed Mazinani and Dr. Jing Ji contributed advise on the experimental
and design process.

Chapter 4 3D printed composite membranes with enhanced anti-fouling behaviour
Page | 78
3D printed composite membranes with enhanced anti-fouling
behaviour
Abstract
The fabrication of three dimensional (3D) printed composite membranes by depositing a
thin polyethersulfone (PES) selective layer onto ABS-like 3D printed flat and wavy
structured supports is presented here for the first time. The 50 mm disk supports were
printed using an industrial 3D printer with both flat and double sinusoidal, i.e. wavy, surface
structures. The thin selective layers were deposited onto the 3D supports via vacuum
filtration. The resulting flat and wavy composite membranes were characterised and tested
in terms of permeance, rejection, and cleanability by filtering oil-in-water emulsions of 0.3
- 0.5 vol. % through a cross-flow (Reynolds number, Re = 100, 500 and 1000) ultrafiltration
set-up under a constant transmembrane pressure of 1 bar. Results showed that pure water
permeance through the wavy membrane was 30 % higher than the flat membrane for Re =
1000. The wavy 3D printed membrane had a 52 % higher permeance recovery ratio
compared to the flat one after the first filtration cycle, with both membranes having an oil
rejection of 96 % ± 3 %. The wavy 3D composite membrane maintained some level of
permeation after 5 complete filtration cycles using only water as the cleaning/rinsing agent,
whereas the flat one was completely fouled after the first cycle. Cleaning with NaOCl after
the sixth cycle restored ~70 % of the initial permeance for the wavy membrane. These
results demonstrate that 3D printed wavy composite membranes can be used to significantly
improve permeation and cleanability performance, particularly in terms of reducing fouling
build-up, i.e. the main obstacle limiting more widespread adoption of membranes in
industrial applications.

Chapter 4 3D printed composite membranes with enhanced anti-fouling behaviour
Page | 79
Introduction
The push towards minimizing waste and reduce energy consumption in a wide range
of industrial processes is driving the replacement of legacy technology with
membrane-based processes [240]. However, fouling removal from membranes
remains a formidable challenge towards their more widespread adoption as cleaning
is costly and generates significant amounts of waste [241]. This is particularly true in
the oil industry where there is an urgent need to recover oil from waste process
streams, which are often in the form of oil-in-water emulsions with oil concentrations
as high as 1000 mg l-1 [242]. Traditional methods such as gas flotation, use of chemical
demulsifiers, skimmers, and electrostatic processes all generate secondary waste
streams [9, 10, 14], and are not always effective at demulsifying stable emulsions [5].
Although membrane processes are effective at breaking up oil-in-water emulsions
[243], they all suffer significantly from fouling, requiring extensive chemical cleaning
[244, 245]. Common methods, including using sodium dodecyl sulfate (SDS) [56],
micellar solutions of SDS [49], and alkali washing followed by acid washing [201],
while effective, all produce secondary waste streams and can, over time, damage the
membranes [246].
As a consequence, there is strong interest in novel membrane materials and/or
structures that can reduce the build-up of fouling and use of cleaning agents. In all
cases, the main goal is to reduce the interactions between the foulants and the membrane
surface [168], either by changing the membrane’s wetting behaviour [243] or by promoting
fluid turbulence at the membrane surface via surface structuring [191]. The latter approach
has the advantage of being applicable to commercial membrane materials and is, as such,
preferred. Turbulence is primarily achieved by generating vortexes in the vicinity of the
membrane surface due to the presence of regular or irregular patterned structures such
as pillars [247], lines [248], or indents [193]. These patterns are obtained by using a
variety of techniques e.g., micro-moulding [249], nanoimprint lithography [191], or
by mixing inorganic fillers in a mixed matrix membrane [189]. In all instances, the
structures induce localised turbulence near the membrane’s surface, leading to reduced
build-up of fouling, with a strong effect of the orientation of the structures vis-à-vis
the flow direction [191]. Computational fluid dynamics (CFD) and experiments
Chapter 4 3D printed composite membranes with enhanced anti-fouling behaviour
Page | 80
showed that particle deposition on prism-patterned membranes was mitigated
compared to a flat membrane of the same material due to vortex formation in the valley
areas [250]. Similar effects were also observed for microbial attachment on a line-
patterned polyvinylidene fluoride (PVDF) membrane, with low deposition in high
shear regions (i.e. peaks) and high deposition in low shear regions (i.e. valleys) [169].
The effects were similar for BSA fouling on a nanoimprinted membrane, with lower
fouling on the patterned membrane compared to a flat one [192].
While being effective, current patterning methods are limited in the types of structures
that can be produced on a membrane [190] and the effect the patterning process has
on the durability and permeance of the membrane [169, 193]. 3D printing is an
emerging membrane fabrication technology that enables the manufacture of more
complex and irregular membrane shapes and structures which cannot be obtained via
current methods [25]. There are still few examples of this approach including a 3D
printed CO2-water PDMS contactor, showing higher mass transfer of CO2 into water
compared to a hollow fibre membrane [226]; a 3D printed polysulphone support used
to prepare a membrane with switchable wettability surfaces via the coating of candle
soot [228]; the combination of ink-jet printing and interfacial polymerization to create
thin film composite membranes [251], and the combination of 3D printing and
photopolymerization to create patterns atop a commercial ultrafiltration membrane
[252].
In this paper, a new approach is presented to generate flat and wavy composite
membranes by depositing a thin polyethersulfone (PES) selective layer onto a 3D
printed membrane support. The anti-fouling property of the resulting 3D printed
composite membrane was tested using oil-in-water emulsions as model foulants,
studying the effect of cross-flow velocity and oil concentration on oil rejection and
flux recovery. Comparisons between the flat and wavy membranes were made in terms
of pure water permeance, oil-in-water emulsion permeance, and four fouling indices
namely, permeance recovery ratio, reversible permeance decline ratio, irreversible
permeance decline ratio, and total permeance decline ratio.

Chapter 4 3D printed composite membranes with enhanced anti-fouling behaviour
Page | 81
Materials and methods
4.2.1 Materials
Urethane acrylate oligomers (acrylonitrile butadiene styrene, VisiJet® M3-X, 3D
Systems) and a proprietary paraffin wax (VisiJet® S300, 3D Systems) were used by
3D printer (ProJet 3500 HD Max printer, 3D Systems) to fabricate 3D supports. After
printing, the support structure was removed with the EZ Rinse – C oil cleaner. All 3D
printing materials and removal agents were purchased from 3D Systems.
Polyethersulfone (PES, Radel A300, Mw = 15 kDa) and N, N- Dimethylacetamide
(DMAc) solvent from Acros organics were used to prepare casting solutions of PES
selective layer. Deionized water (Millipore) and pure sunflower oil (purchased from a
local supermarket) were used to prepare the oil-in-water emulsions feed solution with
different oil concentrations (0.3, 0.4 and 0.5 vol. %). For chemical cleaning of the
fouled membranes, sodium hydroxide (NaOH), sodium dodecyl sulfate (SDS)
(NaC12H25SO4) and sodium hypochlorite (NaOCl) were purchased from Sigma-
Aldrich. The concentration of chemicals used for all cleaning experiments was 0.1 M.
4.2.2 Preparation of wavy and flat membrane support
There were three main steps in fabricating the 3D printed wavy supports: First,
Autodesk Inventor professional 2016 was used to design the porous area, specifying
the diameter of the pores, the distance between the pores and the number of pores. The
dimensions were converted into codes for the OpenScad program. Second, an open-
access code https://github.com/KitWallace/openscad/blob/master/poly_surface.scad
for designing sinusoidal structures was modified by specifying the resolution, the
number of peaks, peak height and peak distance. Finally, the pore structure was
superimposed onto the wavy surface (37 mm diameter) and a 6.5 mm rim added
around the circular porous area (Fig. 4.1). The Computer-aided design (CAD) file was
converted to a stereolithography format file (STL) and input to the 3D printer (Project
3500 HD Max printer, 3D Systems). In turn, the printer converted the drawing into
two dimensional layers (or slices), each with a thickness of 16 µm, which were used
to print the supports. Once completed, the build platform was removed from the printer
and placed in a refrigerator for 5 min to detach the support from the platform.

Chapter 4 3D printed composite membranes with enhanced anti-fouling behaviour
Page | 82
Thereafter, several methods were tried to remove the wax from the support’s pores,
with the best results obtained using ultrasonication in EZ Rinse – C oil for 6 hr at 60
° C. Fig. 4.2a shows the 3D printed support after the cleaning process. A flat 3D
support with the same pore structure and footprint as the wavy one was also prepared
(Fig.S 4.1). The effective filtration areas for the flat and wavy supports are 1,074 and
1,216 mm2, respectively, calculated by surface integration using the built-in
MATLAB function (meshgrid (x, y)).
Fig. 4.1. CAD of 3D wavy support: (a) top view; (b) enlarged cross section; and (c) side
view, with amplitude = 0.5 mm, frequency = 2 s-1, and wave length = 3 mm. All dimensions
are in mm. The wavy surface is described using the equation 𝑓(𝑥, 𝑦) = 0.5 sin(𝑥) sin (𝑦).
4.2.3 Preparation of PES selective layer
The PES dope solution was prepared by first dissolving 15 wt. % of granular PES in
85 wt. % DMAc at room temperature. The mixture was stirred using a roller mixer
(SRT6D, Stuart Equipment) at 60 rpm for 48 hours until the PES was completely
dissolved, resulting in a yellowish transparent solution. The polymer solution was left
for at least 24 hours to release any air bubbles generated during mixing. Phase
inversion was used to fabricate the selective layer by casting the polymer solution
directly onto a clean glass plate using a casting knife with a gap height of 50 µm at
approximately 30 % relative humidity and room temperature (19 – 21 ° C). The glass
plate with the cast film was immediately immersed in a coagulation bath of deionised

Chapter 4 3D printed composite membranes with enhanced anti-fouling behaviour
Page | 83
water at room temperature to initiate the phase separation process. To remove any
traces of DMAc, the membrane was then stored in water for at least 3 days with fresh
water replaced every 24 hours.
4.2.4 Preparation of wavy and flat 3D composite membranes
Fig. 4.2 summarises the procedure that has been used to prepare the wavy 3D
composite membranes. A 3D wavy support is shown in Fig. 4.2 a. A piece of PES
selective layer with dimensions 7 × 7 cm was cut (Fig. 4.2b) after checking with a
backlit LED light box to identify any damage or holes. An undamaged film was then
placed over the 3D support and 250 mbar vacuum pressure (without water) was
applied for 1 minute to adhere the selective layer over the 3D support. Then, vacuum
filtration with pure water was applied for 30 minutes to increase adherence and
stability of the selective layer over the 3D support (Fig. 4.2c), resulting in a wavy 3D
composite membrane (Fig. 4.2d). The same procedure was followed to make flat 3D
composite membranes.
Fig. 4.2. Preparation of wavy 3D composite membranes: (a) 3D wavy support; (b) PES thin
layer is laid over the wavy support; (c) vacuum filtration to adhere the selective layer onto
the support; and (d) resulting 3D composite membrane.
4.2.5 Characterisations of wavy and flat 3D composite membranes
Scanning electron microscopy (JEOL FESEM6301F) was used to characterise the
morphology of the 3D support and selective layer. Samples were fractured in liquid
nitrogen and then coated with gold. The film thickness of PES membrane was
quantified from analysis of SEM micrographs at different locations using Image J and
the average value was recorded. The topography of the 3D support and composite

Chapter 4 3D printed composite membranes with enhanced anti-fouling behaviour
Page | 84
membrane was imaged using a digital microscope (VHX – 6000, Japan). A contact
angle goniometer (OCA machine, Data Physics, Germany) was used to measure the
water and oil contact angles on the 3D support and composite membrane at room
temperature. 5 µL droplets of water or sunflower oil were used and the values reported
are the average of ten measurements in different positions. Membrane resistance was
determined using the procedure reported in [253]. The porosity of the selective layer
was measured by the gravimetric method, using the following equation [254]:
𝑝𝑜𝑟𝑜𝑠𝑖𝑡𝑦 (𝜀 ) = 𝑊𝑤 − 𝑊𝑑
𝜌𝑤 𝑉𝑎× 100 (4.1)
where 𝑊𝑤 is the weight of the wet membrane, 𝑊𝑑 is the weight of the dry membrane,
𝜌𝑤 is the pure water density and 𝑉𝑎 is the volume of selective layer.
A 3 cm diameter circular piece of selective layer was soaked in pure water at room
temperature for 24 h. The membrane was then taken out and its wet weight directly
recorded after removing the excess surface water with a tissue. The selective layer was
then put in a vacuum oven for 6 h at 65 °C to obtain the dry weight. Four samples were
measured and the average value is reported. The POROLUX-1000 was used to
measure the average pore size of the selective layer.
4.2.6 Emulsions preparation and characterization
The oil-in-water emulsion was prepared by adding specific amounts of oil in one liter
of water (0.3, 0.4, and 0.5 vol. %). A homogenizer (ULTRA-TURRAX, T 25 basic,
IKA) was used to mix the oil with water at 19,000 rpm for 5 minutes. A master sizer
(Malvern) was used to determine the size distribution of the oil droplets.
4.2.7 Membrane preparation and characterization
Ultrafiltration experiments were carried out using a recirculating cross-flow setup (Fig.S
4.2). Each membrane was first pre-compacted with pure water at 1.5 bar for 2-3 h until

Chapter 4 3D printed composite membranes with enhanced anti-fouling behaviour
Page | 85
the water permeance reached a steady value. The permeance (𝐾, LMH bar-1) and oil
rejection percentage (𝑅, %) were calculated using the following equations:
𝐾 = 𝑉
∆𝑡 𝐴 ∆𝑝 (4.2)
𝑅 (%) = 𝐶𝐹 − 𝐶𝑃
𝐶𝐹 (4.3)
𝑅𝑚 =1
𝐾 𝜇 (4.4)
where 𝑉 is the volume of permeate (m3) over time ∆𝑡 (hr); 𝐴 is the effective membrane
area (m2) for the flat and wavy membranes (cfr. Section 2.2); ∆𝑝 is the transmembrane
pressure (bar); 𝐶𝐹 is the oil concentration in the feed solution (mg l-1) and 𝐶𝑃 is the oil
concentration on the permeate side (mg l-1); 𝜇 is the viscosity and 𝑅𝑚 is the hydraulic
resistance (m-1).
A turbidity meter (EUTECH TN-100, Thermo-Scientific) was used to determine the
oil concentration in the feed and permeate [255]. Three feed flow rates (0.14, 0.7 and
1.4 l min-1), corresponding to Reynolds number Re = 100, 500 and 1000, were used in
the filtration experiments. The oil-in-water emulsion was initially calibrated for
different known oil concentrations in terms of the intensity of scattered light in the
water in units of turbidity NTU (nephelometric turbidity units). The relationship
between the intensity of scattered light and the oil concentration was linear with R2 =
0.99. The generated equation was used to measure the unknown oil concentration
(Fig.S 4.3). For all experiments the average from three replicate tests is reported.
The antifouling behaviour of the membranes was assessed using the following
procedure: First, a 3D composite membrane was pressurized at 1.5 bar for 2-3 hours
until it reached steady state (pre-compaction). Oil-in-water emulsions with different oil
concentration (0.3, 0.4 and 0.5 vol. %) were then used as feed solution and repeat cycles
of filtrations (fouling – cleaning) were performed (Fig. 4.3). All fouling and cleaning
experiments were performed at a constant transmembrane pressure of 1 bar. For each cycle,

Chapter 4 3D printed composite membranes with enhanced anti-fouling behaviour
Page | 86
the initial pure water permeance, 𝑃𝑊,𝑖, was recorded for 30 minutes. The oil-in-water
emulsion was then flowed through the crossflow cell until the permeance, 𝑃𝐸,𝑖, reached
steady state (⁓ 90 minutes). The cleaning step was performed by flowing pure water at the
same operating conditions for 15 minutes. After the cleaning step, the recovered pure
water permeance, 𝑃𝑊,𝑖+1, was measured for 30 minutes. The fouling and cleaning
cycle was then repeated up to 6 times. To keep the oil concentration in the feed
constant, the feed solution was replaced with new emulsion at the start of every new
cycle. A magnetic stirrer rotating at a constant rate (480 rpm) was used to prevent the
oil droplets from coalescing in the feed for the whole duration of the tests. For all
experiments the average values from three replicate tests are reported.
Fig. 4.3. Schematic of the filtration (fouling-cleaning) cycle: (a) Pure water permeance
(𝑃𝑊,𝑖) recorded for 30 minutes, (b) oil-in-water emulsion permeance (𝑃𝐸,𝑖 ) recorded for 90
minutes, (c) cleaning with pure water for 15 minutes, (d) pure water permeance (𝑃𝑊,𝑖+1 )
for 30 minutes, reversible permeance decline ratio (𝑅𝑃𝑅𝑖), irreversible permeance decline
ratio (𝐼𝑟𝑃𝑅𝑖), and total permeance decline ratio (𝑃𝐷𝑅𝑖). The transmembrane pressure was
maintained at 1 bar throughout the fouling-cleaning cycle.
Four fouling indices namely, permeance recovery ratio, 𝑃𝑅𝑅𝑖, reversible permeance
decline ratio, 𝑅𝑃𝑅𝑖, irreversible permeance decline ratio, 𝐼𝑟𝑃𝑅𝑖, and total permeance
decline ratio, 𝑃𝐷𝑅𝑖, the sum of the previous two quantities, were calculated to evaluate
the anti-fouling property of the membranes during each cycle using the equations (4.5)
to (4.8) [40]:

Chapter 4 3D printed composite membranes with enhanced anti-fouling behaviour
Page | 87
𝑃𝑅𝑅𝑖 (%) = (𝑃𝑊,𝑖+1
𝑃𝑊,𝑖) × 100 (4.5)
𝑅𝑃𝑅𝑖(%) = (𝑃𝑊,𝑖+1 − 𝑃𝐸,𝑖
𝑃𝑊,𝑖) × 100 (4.6)
𝐼𝑟𝑃𝑅𝑖(%) = (𝑃𝑊,𝑖 − 𝑃𝑊,𝑖+1
𝑃𝑊,𝑖) × 100 (4.7)
𝑃𝐷𝑅𝑖(%) =𝑃𝑊,𝑖 − 𝑃𝐸,𝑖
𝑃𝑊,𝑖× 100 (4.8)
where 𝑖 the cycle number. All symbols are indicated on Fig. 4.3.
4.2.8 Chemical cleaning
After 6 cycles of fouling-cleaning using only pure water, the membranes were cleaned
using 0.1 M of NaOH, SDS or NaOCl for 1 h at a transmembrane pressure of 1 bar
and Re =1000, followed by washing with pure water for 15 minutes (to remove any
chemical residue) at the same operating conditions. Then, the pure water permeance
was measured for 30 minutes. This process was repeated for the flat 3D composite
membrane after the 2nd cycle.
Results and discussion
4.3.1 Characterization of support, selective layer and 3D composite membranes
The topographical analysis using a digital microscope of the 3D printed supports shows
regular distribution of the pores in the wavy structure (Fig. 4.4a), and that the pores are
indeed open (Fig. 4.4b).

Chapter 4 3D printed composite membranes with enhanced anti-fouling behaviour
Page | 88
Fig. 4.4. Digital micrographs of the wavy support showing (a) a regular structure (top view) and
(b) open porosity (side view). The color map represents height with red indicating peaks and green
valleys. Pore diameter = 0.2 mm, distance between pores = 0.2 mm, amplitude = 0.5 mm,
frequency = 2 s-1, and wave length = 3 mm.
The design parameters for the 3D printed support have been optimised based on a
systematic investigation of the resolution of the 3D printer, the material’s mechanical
properties and the amount of turbulence generated by the features. The first significantly
affected pore diameter and interpore distance: While the printer’s nominal resolution is 16
m, it was observed that printing features sizes less than 200 m did not result in regular,
open and circular pores, as in the present case (Fig. 4.4). The material’s mechanical
properties dictated the minimum thickness of the 3D printed support (Fig. 4.1c), below
which the support was not able to withstand any significant pressure. The double sinusoidal
design (amplitude, frequency, wavelength) was determined by CFD simulations showing
that higher amplitude, increased frequency and shorter wavelengths would generate
increased turbulence (Fig.S 4.4). At the same time, though, it was observed that when the
features were too sharp, the selective layer would not conform to the support’s shape or be
pierced through during the vacuum-driven adhesion step, resulting in the optimised values
used in the present work (amplitude = 0.5 mm, frequency = 2 s-1, and wave length = 3 mm).
The surface of the PES selective layer is smooth, with no visible pin-holes at 20,000
magnification (Fig. 4.5a). The cross section of the layer shows a typical asymmetric
structure membrane with a finger-like porous sublayer and a ~ 500 nm dense top layer
(Fig. 4.5b) with a total thickness of 16 1 m (analysis of the SEM micrographs was
carried out using Image J).

Chapter 4 3D printed composite membranes with enhanced anti-fouling behaviour
Page | 89
Fig. 4.5. SEM micrographs of PES selective layer: (a) top surface and (b) cross section.
SEM micrographs of the wavy 3D composite membrane show that it retains the wavy
structure of the underlying printed support (Fig. 4.6a), including the latter’s triangular
facets (Fig. 4.6b), an indication of a good adhesion between the selective layer and the
support. This is further reflected in the topographical image obtained by digital microscopy
where peaks are shown in red and the valleys in green (Fig. 4.6c). Table 4.1 shows a
summary of the physico-chemical characteristics of the 3D printed supports and the PES
selective layer. The latter’s porosity and average pore size are comparable with values for
other ultrafiltration PES selective layers prepared using 15 % polyethersulfone [256,
257], whereas the hydraulic resistance is towards the higher end of values found in the
literature [92]. The roughness of the composite membrane was 67 nm, slightly less
than that of the support, but significantly higher than the stand-alone PES layer. This
is further confirmation of the good adhesion of the PES layers onto the support.
Table 4.1. Physical properties of wavy 3D composite membrane, Ra is the surface roughness
and Rm is the intrinsic permeability.
porosity
av. pore
size thickness
roughness,
Ra Rm
contact
angle
% nm m nm m-1 deg
PES film 70 54 ± 10 16 1 3.1 0.551016 63 2
flat support 76† 2000 500 73.0 1.601012 83 2
Wavy support
† from model.

Chapter 4 3D printed composite membranes with enhanced anti-fouling behaviour
Page | 90
Fig. 4.6. SEM micrographs of 3D composite membrane, (a) top view, (b) side view, and (c)
3D topographic optical image.
4.3.2 Permeance – rejection performance
Crossflow filtration cycles were first conducted on the flat 3D composite membrane,
with any appreciable flux for the oil-in-water emulsion, observed only when tested at
Re = 1000 (Fig. 4.7). Even at this high value, the membrane fouled rapidly, with no
measurable permeance recovery after cleaning with water.
Fig. 4.7. Variation of permeance with time during crossflow filtration of flat 3D composite
membranes for Re = 1000 and as a function of oil concentration (a = 0.3 vol. %, b = 0.4 vol.
%, c = 0.5 vol. %). In all cases ∆p = 1 bar. Regions identified by roman numerals I and II
represent the first and second cycle. Each data point is the average of 3 repeats on different
membranes from the same batch, with an average error of ± 0.1 LMH bar-1 (error bars are not
shown for clarity). The error bar represents the standard deviation.
For the wavy 3D composite membrane, the behavior was significantly different from
the flat one: The pure water permeance, 𝑃𝑊, increases with increasing crossflow
velocity, from ~11 LMH bar-1 at Re = 100 to ~16 LMH bar-1 for Re = 1000 (the
corresponding crossflow velocity values are 0.014 and 0.14 m s-1, respectively). At the
highest crossflow velocity, the wavy 3D composite membrane has a ~30 % higher 𝑃𝑊
compared to the flat one (cfr. Fig. 4.7a and Fig. 4.8g). This is attributed to the 13 %
higher effective surface area of the former compared to the latter, given by the wavy
a b c
0 1 2 3 4 5
0
2
4
6
8
10
12
14
16
18
20
Per
mea
nce
(L
MH
ba
r-1)
Time (hr)
I II
0 1 2 3 4 5
0
2
4
6
8
10
12
14
16
18
20
Per
mea
nce
(L
MH
ba
r-1)
Time (hr)
I II
0 1 2 3 4 5
0
2
4
6
8
10
12
14
16
18
20P
erm
ean
ce (
LM
H b
ar-1
)
Time (hr)
I II

Chapter 4 3D printed composite membranes with enhanced anti-fouling behaviour
Page | 91
structure, while retaining the same footprint (50 mm diameter). This increase
highlights a key advantage of using 3D structured membranes, whose surface area
could be further enhanced by optimizing the wavy structure design: For example,
increasing the peak amplitude from 0.5 to 0.75 mm (cfr. Fig. 4.1), would lead to an
increase in the surface area of wavy to flat membrane from 13 to 27 % (not shown
here).
Fig. 4.8. Variation of Permeance with time during crossflow filtration of wavy 3D composite
membranes as a function of Reynolds numbers (Re = 100, 500, 1000 for top, middle and
bottom row, respectively) and oil concentration (a, d, g = 0.3 vol. %, b, e, h = 0.4 vol. %, c, f,
i = 0.5 vol. %). In all cases ∆p = 1 bar. Regions identified by roman numerals I and II represent
the first and second cycle. Each data point is the average of 3 repeats on different membranes
from the same batch, with an average error of ± 0.8 LMH bar-1 (error bars are not shown for
clarity). The error bar represents the standard deviation.
When the feed was switched from pure water to the oil-in-water emulsion, a sharp
decline in permeance was observed, for all crossflow velocities and oil concentrations,
a b c
0 1 2 3 4 5
0
2
4
6
8
10
12
14
16
18
20
Per
mea
nce
(L
MH
ba
r-1)
Time (hr)
0 1 2 3 4 5
0
2
4
6
8
10
12
14
16
18
20
Per
mea
nce
(L
MH
ba
r-1)
Time (hr)
0 1 2 3 4 5
0
2
4
6
8
10
12
14
16
18
20
Per
mea
nce
(L
MH
ba
r-1)
Time (hr)
0 1 2 3 4 5
0
2
4
6
8
10
12
14
16
18
20
Per
mea
nce
(L
MH
ba
r-1)
Time (hr)
0 1 2 3 4 5
0
2
4
6
8
10
12
14
16
18
20
Per
mea
nce
(L
MH
ba
r-1)
Time (hr)
0 1 2 3 4 5
0
2
4
6
8
10
12
14
16
18
20
Per
mea
nce
(L
MH
ba
r-1)
Time (hr)
d e f
g h i
0 1 2 3 4 5
0
2
4
6
8
10
12
14
16
18
20
Per
mea
nce
(L
MH
ba
r-1)
Time (hr)
I II
0 1 2 3 4 5
0
2
4
6
8
10
12
14
16
18
20
Per
mea
nce
(L
MH
ba
r-1)
Time (hr)
I II
0 1 2 3 4 5
0
2
4
6
8
10
12
14
16
18
20
Per
mea
nce
(L
MH
ba
r-1)
Time (hr)
I II

Chapter 4 3D printed composite membranes with enhanced anti-fouling behaviour
Page | 92
as expected. The permeance decline was observed during the initial 30 minutes from
the switch. The permeance values then reached approximately steady state after the
next hour. The decline can be attributed to the affinity between the oil droplets and
membrane surface due to the low hydrophilicity of PES (contact angle = 63° ± 2), and
fouling of the surface by the oil [55, 258]. After the first cycle (pure water → oil-in-
water emulsion (fouling) → pure water (cleaning)), a second fouling-cleaning cycle
was performed, with no chemical cleaning nor interruption between the two. A very
stark difference can be observed between the flat and wavy 3D composite membranes,
with 37 % permeance recovery ratio for the former and 89 % for the latter for Re =
1000 and oil concentration = 0.3 vol. % (Table 4.2).
A high oil rejection (96 % ± 3 %) was achieved for both the flat and wavy 3D composite
membranes (Table 4.2), with the permeate appearing completely clear (Fig.S 4.5). This
can be ascribed to the fact that the average oil droplet diameter (9.9 µm) was
significantly larger than the average membrane pore size (54 ± 10 nm).
Table 4.2. Performance indicators for wavy and flat 3D composite membrane at Re = 1000
and 0.3 vol. % oil concentration for the first complete cleaning cycle, pure water permeance
(PW), oil-in-water emulsion permeance (PE), permeance recovery ratio (PRR), reversible
permeance decline ratio (RPR), irreversible permeance decline ratio (IrPR), total decline ratio
(PDR).
PW PE Oil rejection PRR RPR IrPR PDR
LMH bar-1 LMH bar-1 %
flat 11 ± 0.9 ~ 0 96 ± 3
37 ± 2.7 37 ± 0.3 63 ± 2.7 100 ± 3
wavy 16 ± 0.5 3 ± 0.8 89 ± 2.7 71 ± 0.3 10.1 ± 2.7 81 ± 3
In terms of fouling performance, the flat 3D composite membrane had a permeance
decrease ratio close to 100 % (Table 4.2 and Fig. 4.9), with a large irreversible fouling
component (63 %). Furthermore, fouling of the flat 3D composite membrane at the
end of the second cycle is virtually all irreversible, with no permeance.

Chapter 4 3D printed composite membranes with enhanced anti-fouling behaviour
Page | 93
Fig. 4.9. PRR, and PDR (sum of RPR and IrPR) during crossflow filtration of flat 3D
composite membranes for Re = 1000 and as a function of oil concentration (a = 0.3 vol. %, b
= 0.4 vol. %, c = 0.5 vol. %). In all cases ∆p = 1 bar. Each data point is the average of 3 repeats
on different membranes from the same batch and the error bar represents the standard
deviation.
For the wavy 3D composite membrane, the permeance recovery ratio (𝑃𝑅𝑅) between the
first and second cycle increased significantly with increasing crossflow velocity, from ~18
to ~89 % when the Reynolds number increased from 100 to 1000 for the lowest oil
concentration (cfr. Fig. 4.10 a and g). The corresponding PRR value for the flat 3D
composite membrane at Re = 1000 is less than ~37 % (Fig. 4.9 a and Table 4.1). At the
highest oil concentration, there was virtually no recovery for the lowest crossflow velocity
(Fig. 4.10 c) and a decrease from ~88 to ~55 % for the highest crossflow velocity for the
wavy 3D composite membrane (cfr. Fig. 4.10g and i). The PRR of the wavy 3D
composite membrane well compares to literature values for pure PES membranes,
including a 56 % recovery ratio with comparable oil rejection for a 0.1 vol. % gas oil-
in-water emulsion in cross-flow at 4.65 L min-1 and ∆𝑝 = 1.5 bar [183]; and a 69 %
recovery ratio for and 0.1 vol. % vacuum oil-in-water emulsion in dead-end
configuration [258]. The addition of co-polymers [258] or inorganic fillers [183] to
pure PES or the use of chemical cleaning agents [56] can significantly improve the
recovery ratio to above 99 %. An in-depth analysis of PES membranes used for oil-
in-water separation can be found in Table S 4.1, where emsulsions with heavier oils,
approaching produced water from oil extraction, have been investigated. The PRR of
the wavy 3D composite membrane at the end of the second cycle showed a modest
decrease with increasing oil concentration, going from ~88 to ~80 %, for Re = 1000 and
0.3 vol. % oil concentration (Fig. 4.10g).
1 20
20
40
60
80
100
Per
cen
tag
e (%
)
Cycle number
IrFR
RFR
PRR
1 20
20
40
60
80
100
Per
cen
tag
e (%
)
Cycle number
IrFR
RFR
PRR
1 20
20
40
60
80
100
Per
cen
tag
e (%
)
Cycle number
IrFR
RFR
PRR
a b c

Chapter 4 3D printed composite membranes with enhanced anti-fouling behaviour
Page | 94
Fig. 4.10. PRR and PDR (sum of RPR and IrPR) during crossflow filtration of wavy 3D
composite membranes as a function of Reynolds numbers (Re = 100, 500, 1000 for top, middle
and bottom row, respectively) and oil concentration (a, d, g = 0.3 vol. %, b, e, h = 0.4 vol. %,
c, f, i = 0.5 vol. %). In all cases ∆p = 1 bar. Each data point is the average of 3 repeats on
different membranes from the same batch and the error bar represents the standard deviation.
In the case of the flat 3D composite membrane at Re = 1000, there was no recovery after
the second cycle or for higher oil concentrations (Fig. 4.9a-c). These divergent behaviours
can be convincingly attributed to the localized turbulence generated by the patterned
structure [169, 193]. It should be noted here that there is no chemical cleaning between the
two cycles. Hence, the permeance recovery can be entirely attributed to hydrodynamics
effects associated with vortices generated between the peaks of membrane surface, which
remove the oil from the membrane surface. The decrease in PRR with increasing oil
concentration further supports this idea, as the thicker the oil layer over the membrane
surface the harder it is to remove it entirely by pure water flushing alone [259]. The total
permeance decline ratio (PDR) reported in Fig. 4.9 and Fig. 4.10 for the flat and wavy
3D composite membranes, respectively, is the sum of the reversible (RFR) and
1 20
20
40
60
80
100
Per
cen
tag
e (%
)
Cycle number
IrFR
RFR
PRR
1 20
20
40
60
80
100
Per
cen
tag
e (%
)
Cycle number
IrFR
RFR
PRR
1 20
20
40
60
80
100
Per
cen
tag
e (%
)
Cycle number
IrFR
RFR
PRR
1 20
20
40
60
80
100
Per
cen
tag
e (%
)
Cycle number
IrFR
RFR
PRR
1 20
20
40
60
80
100
Per
cen
tag
e (%
)
Cycle number
IrFR
RFR
PRR
1 20
20
40
60
80
100
Per
cen
tag
e (%
)
Cycle number
IrFR
RFR
PRR
1 20
20
40
60
80
100
Per
cen
tag
e (%
)
Cycle number
IrFR
RFR
PRR
1 20
20
40
60
80
100
Per
cen
tag
e (%
)
Cycle number
IrFR
RFR
PRR
a b c
d e f
g h i
1 20
20
40
60
80
100
Per
cen
tag
e (%
)
Cycle number
IrFR
RFR
PRR

Chapter 4 3D printed composite membranes with enhanced anti-fouling behaviour
Page | 95
irreversible (IrFR) permeate decline ratios. The former is associated with the formation
of a continuous oil layer forms over the surface of the membrane as a result of droplets
accumulation on the surface followed by migration and coalescence [55], whereas the
latter corresponds to the oil droplets entering the membranes and depositing inside the
pores, leading to permanent fouling of the membrane [143]. The fouling behavior of
the wavy 3D composite membrane was further probed for up to 6 cycles of pure water
/ oil-in-water emulsion filtration / pure water cleaning, followed by a final chemical
cleaning, all for Re = 1000. The permeance recovery ratio and the reversible permeate
decline ratio declined with the number of cycles, with the PW and PRR both
approaching zero after the 5th cycle for the highest oil concentration (Fig. 4.11c), and,
conversely, with the IrFR reaching around 100 %, (Fig. 4.11c). It is noted that, in
comparison, the flat 3D composite membrane reached the same values after the first
cycle for Re = 1000 and oil concentration = 0.3 vol. % (Table 4.2).
Fig. 4.11. Variation of Permeance (a, b, c) and PRR, and PDR (sum of RPR and IrPR) (d, e,
f) with time during crossflow filtration of wavy 3D composite membrane for Re = 1000 and
as a function of oil concentration (a, d = 0.3 vol. %, b, e = 0.4 vol. %, c, f = 0.5 vol. %). In all
cases ∆p = 1 bar. Regions identified by roman numerals represent the 6 complete filtration
cycle. Each data point is the average of 3 repeats on different membranes from the same batch,
(average error of ± 0.8 LMH bar-1 for a, b, c - error bars are not shown for clarity) and (for d,
e, f - error bar represents the standard deviation).
0 2 4 6 8 10 12 14
0
2
4
6
8
10
12
14
16
18
20
Per
mea
nce
(L
MH
ba
r-1
)
Time (hr)
I II III IV V VI
0 2 4 6 8 10 12 14
0
2
4
6
8
10
12
14
16
18
20
Per
mea
nce
(L
MH
ba
r-1
)
Time (hr)
I II III IV V VI
0 2 4 6 8 10 12 14
0
2
4
6
8
10
12
14
16
18
20
Per
mea
nce
(L
MH
ba
r-1
)
Time (hr)
I II III IV V VI a b c
0 1 2 3 4 5 60
20
40
60
80
100
120
Per
cen
tag
e (%
)
Cycle number
IrFR
RFR
PRR
0 1 2 3 4 5 60
20
40
60
80
100
120
Per
cen
tag
e (%
)
Cycle number
IrFR
RFR
PRR
0 1 2 3 4 5 60
20
40
60
80
100
120
Per
cen
tag
e (%
)
Cycle number
IrFR
RFR
PRR
d e f

Chapter 4 3D printed composite membranes with enhanced anti-fouling behaviour
Page | 96
After the sixth cycle, the wavy 3D composite membranes were subjected to three
different chemical cleaning agents, i.e. NaOH, SDS, and NaOCl (Fig. 4.12 a). In all
cases, the PRR was significantly higher than the one achievable by using pure water
alone. The maximum PRR was around 70 % when the NaOCl was used, while the
NaOH showed the weakest cleaning performance with PRR of around 48 %. SDS had
a moderate effect with PRR of around 63 %. The better performance of NaOCl can be
attributed to its strong oxidative nature, leading to increased hydrophilicity, which, in
turn, reduces the interaction force between the foulants and membrane surface [260].
To investigate the effect of waviness on the chemical cleaning performance, a flat 3D
composite membrane was cleaned using 0.1 M NaOCl after two complete filtration
cycles with a PRR of ~55 % compared to ~75 % for the wavy one (Fig. 4.12 b). This
different behaviour can be attributed to an increase in the diffusion rate of the cleaning
agent into the fouling layer induced by the turbulence generated by the wavy structure
[261].
Fig. 4.12. PRR (a) after chemical cleaning using different chemical agents, all at 0.1 M, for
a wavy 3D composite membrane after the 6th filtration cycle, and (b) for flat and wavy 3D
composite membrane after the 2nd filtration cycle. Error bar represents the standard
deviation.
Conclusions
In this work, a novel thin film composite membrane was successfully fabricated by
depositing a PES selective layer onto a 3D printed support. The double-sinusoidal, or
wavy, pattern of the support imparted an increase of 30 % in pure water permeance
water SDS NaOH NaClO0
20
40
60
80
100 PRR
Per
cen
tag
e (%
)
Chemical agent
a b
Flat Wavy0
20
40
60
80
100 PRR
Per
cen
tag
e (%
)
3D composite membrane

Chapter 4 3D printed composite membranes with enhanced anti-fouling behaviour
Page | 97
and 52% higher permeance recovery ratio compared to a membrane with the same
selective layer but flat 3D printed support. The former is the result of a higher effective
area with the same overall footprint (50 mm disk), while the latter is due to the
increased turbulence generated near the membrane surface by the wavy structure. The
wavy 3D membrane still had permeation after 5 complete filtration cycles using water
as the only cleaning agent, compared to the flat one which was completely fouled after
the first cycle. Cleaning with NaOCl after the sixth cycle restored ~70 % of the initial
permeance of the wavy membrane. These membranes significantly outperform
literature results of pure PES membranes and are comparable to PES mixed matrix
membranes or PES-co-polymer membranes. The low irreversible fouling and the slow
fouling build-up of the 3D printed membranes opens the way to significantly lower
operational costs for membrane processes as well as reduction in the need for costly
and environmental harmful chemical cleaning.
Acknowledgements
The work is supported by Programme Grant EP/M01486X/1 (SynFabFun) funded by
the Engineering and Physical Sciences Research Council (EPSRC) UK. A. A.-S.
acknowledges the financial support of the Ministry of Higher Education and Scientific
Research of Iraq. The authors are grateful to Dr. Darrell Patterson, Dr. Ze Xian Low,
and Daniel Scott for fruitful discussions and Nicholas Marsh, Keyence UK Ltd, for
providing the images in Fig. 4.4 and 4.6c.
All data created during this research are openly available from the University of Bath
data archive at: https://doi.org/10.15125/BATH-00571
Feed

Chapter 4 3D printed composite membranes with enhanced anti-fouling behaviour
Page | 98
Supplementary information
Fig.S 4.1. CAD of 3D flat support: (a) top view, (b) enlarged cross section, the pore
diameter = 0.2 mm, the distance between pores = 0.2 mm and (c) side view, all dimensions
are in mm.
Fig.S 4.2. Schematic of the cross-flow filtration rig.

Chapter 4 3D printed composite membranes with enhanced anti-fouling behaviour
Page | 99
Fig.S 4.3. Calibration curve of oil in water emulsions measured using Turbidity meter
(EUTECH TN-100, Thermo-Scientific).
Fig.S 4.4. Flow streamlines, Re = 1000, (a) flat, (b) peak height = 0.125 µm, (c) peak height
= 0.25 µm, (d) peak height = 0.5 µm. Eddies region was expanded with the increase of the
peak height at constant velocity.

Chapter 4 3D printed composite membranes with enhanced anti-fouling behaviour
Page | 100
Fig.S 4.5. Oil in water emulsion (a) the permeate, (b) the feed before ultrafiltration process

Chapter 4 3D printed composite membranes with enhanced anti-fouling behaviour
Page | 101
Solvent Modification process Casting conditions
Compaction Operating
conditions
Oil in water
emulsion
Membrane performance Ref.
rel. humidity
(%)
temp. (° C)
pressure
(bar)
time (min)
pressure (bar)
flowrate (l min-1)
oil con. (mgl-1)
Type of oil
permeance (LMH bar-1)
FRR (%)
Oil rejection
(%) pure water o/w emulsion
NMP Mixing with Hydrous
manganese dioxide
(nanoparticles)
--- --- 1 30 1 --- 1000 Crude 573.2 ⁓ 100 75.4/ washing with
pure water
100 [262]
NMP Mixing with Cellulose
acetate / polyethylene
glycol
--- --- 4 --- 4 0.2 500 Kerosene 20.25 6.75 ----- 88 [179]
DMF Mixing with PEGMA and TFOA
--- --- 1.5 30 1 Dead end cell
900 Vacuum --- --- 99.8 / washing with pure water
99.5 [258]
DMAc Mixing with SiO2-g-
(PDMAEMA-co-
PDMAPS) nanoparticles
--- --- 1.6 60 1 Dead end
cell
900 Engine 172.30 79.83 84.26/ washing with
pure water
100 [263]
DMAc zwitterionic polymers from
a reactive amphiphilic
copolymer additive
--- --- 2.5 30 2 Dead end
cell
1500 --- 74.5 --- 99/ washing with pure
water ⁓ 100 [264]
DMAc Surface modification / corona air plasma
--- --- --- --- 1.5 --- 3000 Gas 108.46 37.86 --- 98.2 [256]
DMF Surface modification /
corona plasma – assisted coating TiO2 nanoparticles
--- --- --- --- 1.5 --- 3000 Gas 12.97 10.96 --- 99 [99]
Blending and surface
coating by NaX zeolite and
TiO2 nanoparticles
--- --- --- --- 1.5 3000 Gas --- 6.3 82.6/ washing with
pure water
99.1 [265]
DMF Mixing with Pluronic F127 --- --- 1.5 30 1 Dead end
cell
900 Soybean --- 82.98 93.33 / after chemical
washing
100 [56]
DMAc Wavy surface 30 19 – 21 1.5 90 -
120
1 1.4 2490 Sunflowe
r
16 ± 0.46 3 ± 0.8 89 ± 2.7/ washing with
pure water
96 ± 3 this
study
Table S 4.1. Differences between literature review and this study, FRR flux recover ratio.

Appendix
Page | 102
Appendix 1
A1.1 Computational fluid dynamics (CFD) modelling
A steady state two-dimensional simulation was developed to investigate the fluid
dynamic behaviour over the membrane surface and to find the best wavy model, in
terms of the number and height of peaks.
A1.1.1 Governing equations (conservation equations)
The equations governing CFD modelling are Navier-Stokes Equation (conservation of
momentum Equation) and the Continuity Equation (conservation of mass Equation).
They are presented as A1.1 and A1.2 hereunder:
Navier – Stokes equations
𝜌 (𝑢𝛻)𝑢 = 𝛻[−𝑝𝐼 + ƞ(𝛻𝑢 + (𝛻𝑢)𝑇] (A1.1)
Continuity equations
𝛻𝑢 = 0 (A1.2)
where 𝑢 is the velocity vector of the fluid (m s-1), 𝑝 is the pressure (Pa), 𝜌 is the fluid
density (kg m-3), ƞ is the viscosity of the fluid (Newtonian fluid was assumed) (Pa s).
The governing equations were discretised in the finite element method. The
calculations were made using the commercial software COMSOL Multiphysics
(COMSOL Multiphysics 5.4, Comsol Inc., USA). Table A1.1 shows the parameters
and variables used in CFD simulation.

Appendix
Page | 103
Table A1.1. Parameters and variables used in CFD simulation.
Water properties
Expression Unit Description
𝝆
1000 kg m-3 Density of water
𝝁
1.002 × 10⁻³ Pa s Viscosity of water
Model geometry
𝑯 4 × 10⁻³ m Height of cross-flow
cell
𝑳
50 × 10−3 m Length of membrane
𝑨
1 × 10⁻³ m Wave amplitude
𝒇
2 s-1 Wave frequency
Membrane properties
𝒆 2 × 10⁻⁵ m Thickness of active
layer
𝒌 1 × 10⁻¹⁷ m2 Permeabilityof active
layer
𝑳𝒆𝒅𝒈𝒆 0.13 × 𝐿 m Length of edge
𝑳𝒂𝒄𝒕𝒊𝒗𝒆 0.74 × 𝐿 m Length of active layer
𝒆𝒑
0.7 --- Porosity of active layer
Experimental
conditions
𝒖𝒎 0.14 m s-1 Average velocity inside
cross flow cell
𝑹𝒆 =
𝜌𝑢𝑚 𝐷ℎ
𝜇
--- Reynold number
𝑫𝒉
0.007 m Hydraulic diameter
𝑷𝒆𝒙𝒊𝒕
0 Pa Permeate pressure
𝑷𝒐𝒖𝒕𝒍𝒆𝒕
500 Pa Outlet pressure
Variables
𝑼𝒑 =
𝑘
𝜇 𝑒(𝑃 − 𝑃𝑒𝑥𝑖𝑡)
m s-1 Permeation velocity
𝑼𝒚 = 6 𝑢𝑚 ((
𝑦
𝐻) − (
𝑦
𝐻)
2
) m s-1 Velocity profile

Appendix
Page | 104
A1.1.2 Geometry dimensions
Wavy and flat surfaces were investigated in CFD simulation. CAD designs with the
same width and height for both geometries were set up to match the actual size of the
membrane in the cross-flow cell, as illustrated in Fig. A1.1 and Fig. A1.2. The overall
domain was set to 50 × 4 mm (width × height), and the length of the porous area was
set to 37 mm. The wavy surface consists of a sinusoidal wave with 0.5 mm peak height
and a 2 mm pitch. The number of elements used in this study were 74,364 for the wavy
surface and 42,264 for the flat surface.
Fig. A1.1. Schematic diagram of the computational domain of the wavy surface used in the CFD
study.

Appendix
Page | 105
Fig. A1.2. Schematic diagram of the computational domain of the flat surface used in the CFD
study.
A1.1.3 Boundary conditions
Free and Porous Media Flow was used to describe the flow model, with the following
assumptions made for CFD calculations:
Newtonian fluid with the physical properties of water was used at 20 °C.
A non-slip boundary condition was employed on wall 1 (the velocity on the
wall is zero).
Fully develop of the fluid flow via the channel inlet.
Velocity profile Equation illustrated in Table A1.1 was applied for the inlet
boundary conditions.
The permeation velocity Equation described in Table A1.1 was used to
describe the fluid flow through the membrane wall (porous medium, wall 2).
The inlet velocities was 0.14 m s-1 and it was associated with the Reynolds
number 1000.
The inlet boundary condition was imposed on the fully developed flow
assumption.
The slip/symmetry boundary condition was adopted in wall 3 (the velocity at
the vertical direction on the wall is zero).

Appendix
Page | 106
A1.1.4 Optimization of wavy surface design
The crucial feature of the wavy surface is its ability to generate recirculation regions
or turbulence over the membrane surface. Two geometric parameters, peak height (i.e.
wave amplitude) and peak numbers (i.e. wave frequency), had been studied to
investigate the optimal model. The wave amplitude varied from 0 (flat surface)
through 0.125, 0.25, 0.5, 0.75 to 1 mm. Meanwhile, wave frequency varied from 4 to
2 and 1 s-1.
As can be seen in Fig. A1.3, symmetrical streamlines were found over the flat wall
and the wavy structure at a wave amplitude of around 0.125 mm. Furthermore, as the
wave amplitude increased, the velocity streamlines were converted into asymmetrical
flow across the valley area, and circulating eddies start forming at 0.25 mm wave
amplitude. It was also observed that at more considerable wave amplitude, the eddies
grew further and the intensity of the recirculation zone (eddy) increased until reaching
the maximum size, where the peak height was around 1 mm. However, a back
streamline (i.e. stagnant flow zone) could be seen at the bottom of the valley. This
phenomenon is thought to enhanced the deposition of particles, as revealed by Jung et
al. [194].
The flow streamlines (i.e. turbulence) on the wavy surface at different frequencies are
illustrated in Fig. A1.4. As the number of peaks increased (i.e. high frequency), the
surface area (i.e. the contact area between the feed solution, which included the
foulants) and the membrane surface enlarged. Although this condition was expected
to enhance the attachment of foulants to the membrane surface, an increase in the
number of peaks was managed by cleaning the membrane surface effectively,
preventing foulant attachment. As seen in Fig. A1.4c, when the wave frequency was
1 s-1, the crests widened; in other words, the area exposed to the eddies
reduced/lessened. Meanwhile, when the wave frequency values were increased from
2 mm to 4 s-1, the crests became smaller (i.e. narrow) and exposed the area to
turbulence streamlines (cfr. Fig. A1.4g, k).

Appendix
Page | 107
Fig. A1.3. Velocity profile of the wavy surface (a, b) flat surface, (c, d) wavy surface peak height = 0.125
mm, (e, f) wavy surface peak height = 0.25 mm, (g, h) wavy surface peak height = 0.5 mm, (i, j) wavy
surface peak height = 0.75 mm, and (k, l) wavy surface peak height = 1 mm.

Appendix
Page | 108
Fig. A1.4. The effect of increasing the number of peak on eddies generation (a, b, c, d) number of peaks = 6,
(e, f, g, h) number of peaks = 12, (I, j, k, l) number of peaks = 24, Re = 1000.

Appendix
Page | 109
A1.2 Permeability measurements
The equipment (i.e. the filtration unit) that was used to determine intrinsic
permeability is illustrated schematically in Fig. A1.5.
Fig. A1.5. Apparatus used to measure permeability adapted from [233].
As reported in [233], the membrane was firstly clamped between the filtration unit
parts (i.e. between the open end of the measuring cylinder and the top part of the
funnel). The filtration unit was then filled with pure water to an initial level, where the
hydrostatic head of water level over the membrane provided the required driving force
of water to pass through the membrane. The decrease in the water level over time was
recorded manually using a stopwatch.

Appendix
Page | 110
The linear relationship between ln [ℎ0
ℎ] versus time was then plotted to calculate the
slop, where the membrane permeability is calculated from the following Equation
(A1.3):
𝑘 = 𝑠𝑙𝑜𝑝𝑒 µ 𝑙
𝜌 𝑔 𝛽 (A1.3)
where ℎ0 is the water level (m) at time = 0, ℎ is the water level (m) as function of time,
𝑙 is the membrane thickness (m), the dynamic viscosity of the pure water (Pa s), 𝜌 is
the density of water (kg m-3), 𝑔 is acceleration due to gravity (m s-2), 𝛽 is the
dimensionless ratio of the lower part diameter (𝑑𝑚) and the upper part diameter (𝑑𝑡)
of the measuring cylinder, 𝛽 =𝑑𝑚2
𝑑𝑡2 and 𝑘 is the membrane permeability (m2),
The derivative equation is described hereunder (Mass is conserved).
𝜌𝑢𝑡𝐴𝑡 = 𝜌𝑢𝐴𝑚 = 𝑚 (A1.4)
where 𝑢𝑡 is the velocity at the membrane (m s-1), 𝑢 is the membrane flux (m s-1), 𝐴𝑡 is
the cross-section area of the upper part of the glass column (m2), 𝐴𝑚 is the cross-
section of the lower part of the glass column (m2).
𝑢𝑡 (𝜋
4𝑑𝑡2) = 𝑢 (
𝜋
4𝑑𝑚2) (A1.5)
𝑢𝑡 = 𝑢 (𝑑𝑚2
𝑑𝑡2) (A1.6)

Appendix
Page | 111
𝑢𝑡 = − 𝑑ℎ
𝑑𝑡 (A1.7)
Pressure driving force
∆𝑝 = 𝜌𝑔ℎ (A1.8)
Darcy’s law
∆𝑝 = 𝜇𝑢𝑙
𝑘 (A1.9)
where ∆𝑝 is the pressure difference (Pa).
𝜌𝑔ℎ = µ𝑙
𝑘 (−
𝑑ℎ
𝑑𝑡)
1
𝛽 (A1.10)
𝑑ℎ
ℎ= −
𝜌𝑔𝑘
µ𝑙 𝛽 𝑑𝑡 (A1.11)
By integration
∫𝑑ℎ
ℎ
ℎ
ℎ0
= − 𝜌𝑔𝑘𝛽
µ𝑙∫ 𝑑𝑡
𝑡
𝑡=0
(A1.12)
− ln [ℎ
ℎ0] =
𝜌𝑔𝑘𝛽
µ𝑙𝑡 (A1.13)
ln [ℎ0
ℎ] =
𝜌𝑔𝑘𝛽
µ𝑙𝑡 (A1.14)
A1.3 Coating methods
A major challenge was the large pore size of 3D supports (200 µm). It was necessary
to produce a selective layer with the required pore size and still maintain the structure
of the wavy surface. Therefore, the phase inversion process was used to synthesis the

Appendix
Page | 112
selective layer over the 3D support by using spin coating and interfacial
polymerisation processes, which are described hereunder.
A1.3.1 Spin coating
The process of forming an active layer over the 3D substrate began with polymer
solution (5 ml) (15 wt. %, PES) being deposited over the entire surface of the 3D
support. Thereafter a spin coater (Laurell WS-650Mz-23NPP) was used to make a
homogeneous layer of the polymer solution. Finally, the coated 3D support was
immediately immersed in the water bath to initiate the phase inversion process. Both
speed and time of coating were controlled to produce a coating layer with different
thicknesses. For instance, at a low spin coating speed (e.g. 500 rpm), a thick coating
layer was formed and the wavy peaks disappeared, so the speed was increased. The
optimum speed and time of the spin coating were optimized at 2000 rpm for 1 min.
Fig. A1.6 illustrates the issues associated with the use of the spin coating method to
create a selective layer on the 3D wavy support. It is clear from Fig. A1.6, there are
noticeable pinholes on the 3D composite membrane.
Fig. A1.6. SEM micrographs of 3D wavy composite PES membrane top surface.

Appendix
Page | 113
A1.3.2 Interfacial polymerization
A cylindrical reactor was designed to create a film over the 3D support by interfacial
polymerization, as shown in Fig. A1.7. The aqueous phase was prepared by adding 2
grams of 1, 3-phenylenediamine into 100 ml of water. Hexane was used as an organic
phase with 0.1 w/v % concentration of trimesoyl chloride. Three key steps were used
to initiate the interfacial polymerization over the 3D wavy support. First, the lower
part of the reactor was filled with aqueous phase, then the 3D support was immersed
in the aqueous phase and the upper part of the reactor connected and tied well with
lower part. Finally, the organic phase was carefully poured over the wavy surface of
the 3D support using a small funnel. Fig. A1.8 shows that this method was ineffective
at covering the entire 3D surface (i.e. film formed on just some parts of the surface,
especially in the valley area).
Fig. A1.7. Interfacial polymerization process (a) dimensional schematic, (b) Schematic of interfacial
polymerization, (c) labelled photo of interfacial polymerization cell.

Appendix
Page | 114
Fig. A1.8. Labelled photos of interfacial polymerization process over 3D support with
different time (a) 1 hour, (b) 3 hours, (c) 6 hours, and (d) 24 hours.
A1.4 Effect of humidity on the PES membranes casting
As can be seen from the SEM micrographs, Fig. A1.9 a and b, there are many pinholes
on the membrane surface. High humidity means high water vapour content, a partial
phase inversion process, may have occurred during the membrane casting, as a result
of absorbing water from the humid air by the casting solution. To control the humidity
of the casting process, a glove box had been provided with dry air supplier unit (cfr.
Fig. A1.10). The latter generated dry air by passing pressurised air through a silica gel
column and, after around 10 minutes, when the relative humidity was reduced from
around 50 % to 29 %, the PES membrane was cast. It is clear to see from the SEM
micrographs, Fig. A1.9 c and d, that reducing the humidity led to the disappearance of
all the pin holes on the membrane surface.

Appendix
Page | 115
Fig. A1.9. SEM micrographs of PES membrane, casting thickness = 50 µm, (a, b) Relative humidity
= 59 %, (c, d) Relative humidity = 29 %.
Fig. A1.10. Labelled photos of casting machine.

Chapter 5 3D Printed Contactors for Enhanced Oil Droplet Coalescence
Page | 116
Conclusions and outcomes chapter 4
A double sinusoidal 3D support structure has been successfully designed, optimised
(i.e. peak height and number of peaks) and fabricated using an industrial 3D printer
(ProJet 3500 HD). A new coating method has been developed to deposit a selective
layer over the 3D printed support, where phase separation was used to first prepare the
selective layer, followed by adhesion onto the support by vacuum filtration. Both
permeance and fouling mitigation have been enhanced by using the 3D wavy
composite membrane, where the membrane permeance improved by 30 % and the
permeance recovery ratio improved by 89 % compared to a 3D flat composite
membrane.

Chapter 5 3D Printed Contactors for Enhanced Oil Droplet Coalescence
Page | 117
Chapter 5
Aims and objectives
The main aim of Chapter 5 is to design and fabricate 3D porous contactors based on
complex pore structures of triply periodic minimal surfaces (i.e. Schwarz-P and
Gyroid) and investigate their performance on oil droplets coalescence process in
comparison with a 3D porous contactor-based on cylindrical pore geometry.
Furthermore, in this chapter the ability of the 3D printer to fabricate a complex design
in terms of the required resolution and large STL files generated during the design step
was explored. Finally, vacuum filtration was used to probe the 3D porous contactors
performance in terms of permeance and demulsification process.
The outcomes from this chapter has been published in an academic journal:
Abouther Al-Shimmery; Saeed Mazinani; Joseph Flynn; Y.M. John Chew and Davide
Mattia., 3D Printed porous Contactor for Enhanced Oil Droplets Coalescence.
Journal of Membrane Science, 2019. 590.
DOI: https://doi.org/10.1016/j.memsci.2019.117274
Authors’ contributions
Abouther Al-Shimmery designed, printed and characterised the materials and
conducted the experiments.
Prof.s Davide Mattia and John Chew devised the experiments and supervised
the student.
Dr. Saeed Mazinani contributed advise on the experimental and design
process.
Dr. Joseph Flynn designed the Schwarz-P and Gyroid-based 3D contactors.

Chapter 5 3D Printed Contactors for Enhanced Oil Droplet Coalescence
Page | 118
3D Printed Contactors for Enhanced Oil Droplet Coalescence
Abstract
The fabrication of 3D printed contactors based on triply periodic minimal surfaces (TPMS)
is reported here for the first time. The structures, based on the Schwarz-P and Gyroid TPMS,
were tested for oil-in-water demulsification via oil droplet coalescence and compared to a
contactor with cylindrical pores and natural separation. The contactors were characterized
in terms of intrinsic permeability, resistance and oil separation efficiency, for different oil
concentrations (0.3, 0.4, 0.5 vol. %) in the oil-in-water emulsion, vacuum pressures (10 and
20 mbar) and thickness of the contactors (4.68 and 9.36 mm). Results show that while the
Gyroid contactor has the highest resistance and lowest intrinsic permeability of all three
structures, it has 18 % and 5 % higher separation efficiency than the cylindrical and
Schwarz-P structures, respectively. These characteristics reflect the higher tortuosity and
surface area of the Gyroid structure compared to the other two. At 90 %, the Gyroid
structure also has a 22 % higher separation efficiency and a two order of magnitude higher
separation rate for the permeate compared to natural coalescence, attributed to an 8-fold
increase in oil droplet diameter of the permeate compared to the feed, as a result of passage
through the contactor. Higher vacuum pressure and higher contactor thickness further
increase the separation efficiency of all structures, but the effect is more pronounced for the
Gyroid structure due to its higher tortuosity. These results show that 3D printing is an
effective tool for the design of porous contactors where a high surface area of interaction is
key to their success, paving their way to extended use in a variety of industrial applications

Chapter 5 3D Printed Contactors for Enhanced Oil Droplet Coalescence
Page | 119
Introduction
The production of crude oil requires the use of large volumes of water, with
approximately 8 barrels of produced water for every barrel of crude oil [2].
Environmental regulations mandate the recovery of the oil from the produced water
before the latter can be discharged. However, this can be costly as produced water
contains varying amounts of oil (100 – 5000 mg l-1) in the form of floating layers [4]
or emulsions, both unstable and stable [5]. While the first type can be easily recovered
by gravity separation, stable emulsions require further energy inputs to break-up [266].
Conventional processes for oil recovery from produced water include gas flotation [9],
use of chemical demulsifiers [10], American petroleum institute (API) skimmers [11],
and electrostatic processes [13]. However, all of these processes generate secondary
waste streams which require treatment before discharge and also present potential
environmental pollution risks that must be prevented [14], thus increasing operational
costs. Furthermore, the ability of these processes to effectively separate stable
emulsions from produced water is somewhat limited [5]. Membrane-based processes,
on the other hand, have shown significant potential in recovering oil from produced
water with relatively low operational costs [242]. Membrane-based processes for oil-
in-water separation can be broadly divided based on two operating principles: phase
rejection [141] and oil coalescence [201]. In the former, oil is generally retained by
the membrane and water passes through, whereas in the latter both oil and water pass
through the membrane. The membrane acts as a high surface area contactor, favouring
the coalescence of oil droplets into progressively larger ones [130] which can then be
recovered by gravity separation [267]. Membrane processes based on phase rejection
are fast and have high oil recovery (> 99 %) but suffer from rapid flux decline due to
fouling, requiring periodic cleaning to recover the initial intrinsic permeability [244,
245]. On the other hand, coalescence-based processes are less prone to fouling due to
the larger pore size used, thereby requiring significantly less energy. The effectiveness
of a membrane as coalescence-accelerating medium is determined by its surface
morphology, wettability and material thickness [203], with preference given to
membrane morphologies having high pore tortuosity and high internal surface area
[268]. The latter characteristics increase the collision frequency between the oil

Chapter 5 3D Printed Contactors for Enhanced Oil Droplet Coalescence
Page | 120
droplets and the oil droplet-interface, which, in turn, increase droplet coalescence
[269].
Numerical simulations of oil-in-water demulsification in a single symmetric pore
showed that membrane pores are easily blocked by the larger oil droplets formed on
the permeate side [267]. Therefore, more effective demulsification could be achieved
by using asymmetric membranes with pores of similar size to the emulsion droplets
on the feed side and larger pores on the permeate side. The simulations showed that
the larger pores on the permeate side facilitate the detachment of the larger oil droplets
formed during passage through the contactor. On the other hand, by decreasing the
average membrane pore size and increasing tortuosity, the internal surface area of the
membrane increases, which can also lead to enhanced coalescence [207]. Simulations
for oil-in-water emulsions also showed that demulsification is enhanced when the
contactor membrane is well wetted by the oil, as the pore wall acts as a coalescing
surface [21]. Furthermore, the coalescence performance could be improved by lower
flux, as this increased the emulsions’ contact time with the pore walls, as it flows through
the contactor [21].
An extensive review of membrane contactors for oil-in-water and water-in-oil
demulsification, reported in Table S 5.1, shows that the ideal morphology for a
membrane contactor requires large pores with an asymmetric structure, high surface
area and long residence times to maximise coalescence. However, a number of these
characteristics are in opposition to each other, as larger pores lower the available
internal surface area compared to smaller ones, and high tortuosity and long residence
times decrease the overall productivity of the process. These trade-offs can be
primarily attributed to limitations of current membrane manufacturing methods which
do not offer great control over all these parameters simultaneously. Many of these
limitations, however, could be overcome by using additive manufacturing, or 3D
printing, to fabricate complex membrane shapes, while also expanding the range of
usable materials beyond those currently available [25]. So far, few examples of this
concept have been reported in the literature, including the fabrication of 3D printed
low-fouling ultrafiltration (UF) membranes for oil-in-water separation based on phase
rejection [270]; and 3D printed polysulphone supports to prepare membranes with
switchable wettability surfaces via the coating of candle soot [228]. 3D printing has

Chapter 5 3D Printed Contactors for Enhanced Oil Droplet Coalescence
Page | 121
also been used to fabricate spacers for reverse osmosis and UF membranes, based on
triply periodic minimal surfaces (TPMS), to enhance membrane flux and antifouling
properties [271]. In a subsequent paper, the same group optimised the spacers to
increase mass transfer in flat sheet UF membranes for protein separation, reporting
significantly higher values than those obtained using conventional spacers [272].
Triply periodic minimal surfaces, based on the Schwarz-P model, have also been used
to design and fabricate polydimethylsiloxane membranes as gas – liquid contactors
via 3D printing [273]. A minimal surface is defined as a surface where the mean
curvature is equal to zero at any point [274]. This leads to the generation of a smooth
surface without any edge nor corner [272], such as soap films [275]. Triply periodic
minimal surfaces occur when the minimal surface is repeated in three dimensions, as
observed in many natural systems such as the mitochondria of amoebae Chaos
carolinensis [276].
In this work, additive manufacturing (3D printing) is used for the first time to fabricate
3D printed membrane contactors for oil-in-water demulsification using two TPMS
morphologies, Schwarz-P and Gyroid, and their performance compared with
cylindrical pore membrane contactors.
Materials and methods
5.2.1 Materials
Urethane acrylate oligomers (acrylonitrile butadiene styrene, VisiJet® M3-X, 3D
Systems) and a proprietary paraffin wax (VisiJet® S300, 3D Systems) were used to
fabricate the 3D printed membrane contactors. After printing, the wax was removed
by using the EZ Rinse - C oil cleaner. All of the 3D printing materials and wax removal
agents were purchased from 3D Systems. A ProJet 3500 HD Max printer (3D Systems)
was used in this work. Further details of the preparation and cleaning processes can be
found elsewhere [270]. Deionized water (Millipore) and pure sunflower oil (Tesco)
were used to prepare the oil-in-water emulsions as feed solution with different oil
concentration (0.3, 0.4 and 0.5 vol. %). Sudan Blue II (Sigma Aldrich) was used in the
visual observation tests to determine the thickness of the accumulated oil layer.

Chapter 5 3D Printed Contactors for Enhanced Oil Droplet Coalescence
Page | 122
5.2.2 Design of 3D printed membrane contactors
Lattice structures are typically created by tiling of a unit cell in space. However, tiling
tessellated meshes (Stereolithography (STL) files) can present significant challenges
at the interfaces between unit cells. If the union of two meshes is not successful, holes
may appear in the mesh. To avoid this issue, this research makes use of triply periodic
minimal surfaces. Here, the lattice geometry arises naturally from an infinitely
repeating, implicitly-defined equation in three-dimensional Cartesian space. The
general expression for the implicitly defined surface is given in (5.1). This formulation
implies that the surface lies between the regions of space where (1) evaluates to a
negative number, and those where it evaluates to a positive number. As such, the
surface is the level set of all points at which the equation evaluates to zero. Equations
(5.2) and (5.3), give good approximations of the Schwarz Primitive (Schwarz-P,
hereafter) and the Schoen Gyroid (Gyroid, hereafter) surfaces, respectively, which are
used to create lattice structures in this study:
𝐹(𝑥, 𝑦, 𝑧) = 0 (5.1)
𝐹(𝑥, 𝑦, 𝑧) = cos(𝑓𝑥𝑥) + cos(𝑓𝑦𝑦) + cos(𝑓𝑧𝑧) + 𝑡 = 0 (5.2)
𝐹(𝑥, 𝑦, 𝑧) = sin(𝑓𝑥𝑥) cos(𝑓𝑦𝑦) + sin(𝑓𝑦𝑦) cos(𝑓𝑧𝑧)
+ sin(𝑓𝑧𝑧) cos(𝑓𝑥𝑥) + 𝑡 = 0
(5.3)
Equations (5.2) and (5.3) both make use of frequency terms, 𝑓𝑥 , 𝑓𝑦 and 𝑓𝑧. These adjust
how often the surface repeats itself in space, which is the most convenient method for
scaling the size of a single unit cell. Both equations also include a level parameter, 𝑡.
This manipulates the distance field of the implicit function, moving the position of the
surface by changing the level set. Manipulation of the 𝑡-parameter will alter the
volume on one side of the surface (enclosed by the bounding cube) with respect to the
volume on the other side (Fig. 5.1). The mathematically defined surfaces are of limited
practical use in additive manufacturing as they are infinitely thin. To address this issue,

Chapter 5 3D Printed Contactors for Enhanced Oil Droplet Coalescence
Page | 123
in this work two surfaces are created, and a solid material is assigned to the volume
between them, resulting in a high surface-to-volume ratio structure. The level
parameter is used to create two similar surfaces, each offset from the other (Fig. 5.1).
These two surfaces never touch and therefore do not describe a manifold volume.
Hence, the final stage is to enclose the two surfaces in a containing geometry (e.g. a
cuboid or cylinder). Specific values of 𝑓and 𝑡 used for the Schwarz-P and Gyroid are
reported in section 5.6.1. The design of porous contactors using TPMSs additionally
requires equations to define the structures’ volume fraction, surface area, pore size and
wall thickness. Detailed information on the definition and estimation of these
quantities is reported in Sections 5.6.2-5.6.5.
Fig. 5.1. Gyroid structure built using Equation (5.3), with set level parameter t = ±0.5,
creating a volume between the surface, thereby determining the thickness of the Gyroid’s
walls.
A cylindrical-based 3D printed membrane contactor, with the same porosity as the
Schwarz-P and Gyroid ones, was fabricated using the method reported in [270].
5.2.3 Fabrication and characterization of 3D printed membrane contactors
The process of translating a digitally designed 3-dimensional object into a printed
membrane introduces a novel set of challenges compared to traditional membrane
fabrication processes: First, the more complex the object, the higher the resolution
required to accurately render the object in 3D. This, in turn, leads to very large digital

Chapter 5 3D Printed Contactors for Enhanced Oil Droplet Coalescence
Page | 124
file sizes. For example, increasing the number of grid points needed to create the
implicit surface from 150 to 800 (cfr. Fig. 5.2a-d), increased the file size of the Gyroid
contactor from 50 Mbyte to 1.8 Gbyte. The number of grid points is a measure of the
resolution of the printed object. The larger file size not only requires a longer time to
transfer the file to the printer (up to 72 hrs), but ultimately might exceed the handling
capacity of the printer software itself. After trial and error, a compromise resolution
of 600 grid points was found to provide an adequately high resolution for the 3D
printed samples and a manageable digital file.
Fig. 5.2. STL file prepared with different resolutions for Gyroid-based 3D printed contactor
(grid point values: a = 150, b = 300, c = 600, d = 800).
Furthermore, each 3D printer also has a physical resolution, with the one used in this
work having a nominal resolution of 16 m [270]. The difference between the digital
model and the resulting physical objects is shown in Fig. 5.3. The printer produces
macro- and microscopic roughness, which is quite distinct from what is obtained using
traditional membrane fabrication methods [25]. It is also noted that the printer’s
nominal resolution relates to printing of flat surfaces; complex, non-planar surfaces
are known to negatively affect it [277].
a b c d

Chapter 5 3D Printed Contactors for Enhanced Oil Droplet Coalescence
Page | 125
Fig. 5.3. Gyroid-based 3D printed membrane contactors (a) STL digital file; (b) SEM
micrograph of the 3D printed membrane contactor (cross-section).
Further details on the printing process, wax removal from the printed membranes and
their cleaning can be found in [270].
A contact angle goniometer (OCA machine, Data Physics, Germany) was used to
measure the water and oil contact angles of a flat 3D printed surface at room
temperature. 5 µL droplets of water and sunflower oil were used and the values
reported are the average of ten measurements in different positions over the membrane
surface. The surface and cross-section of the contactors was analysed via electron
microscopy using a JEOL FESEM6301F. The surface roughness of the contactors (Ra)
was determined using atomic force microscopy (AFM; Nanosurf EasyScan 2 Flex,
Switzerland) under ambient conditions in the tapping mode (scan size of 5 µm,
time/line of 1 s, samples/line of 256) with a monolithic silicon AFM probe (Tap190Al-
G, nominal tip radius: < 10 nm).
The actual porosity of the membrane contactors was determined by comparing the
mass difference before and after wax removal, i.e. with closed and open pores:
𝑀𝑎𝑠𝑠 𝑐ℎ𝑎𝑛𝑔𝑒 = (1 − 𝑀2
𝑀1) × 100
(5.4)
where 𝑀1 is the mass of contactor before wax removal (kg) and 𝑀2 is the mass of the
contactor with clean, open pores after wax removal (kg).

Chapter 5 3D Printed Contactors for Enhanced Oil Droplet Coalescence
Page | 126
5.2.4 Preparation and characterization of emulsions
The oil-in-water emulsions were prepared by adding specific amounts of oil (0.3, 0.4,
and 0.5 vol. %) in one litre of water. A homogenizer (ULTRA-TURRAX, T 25 basic,
IKA) was used to mix the oil with water at 19,000 rpm for 5 minutes. Volume-weighted
oil droplets size distributions were obtained for oil-in-water emulsions using a
Malvern Mastersizer X (300 mm lens, 1.2 − 600 μm detection range, dispersion unit
controller, 3000 rpm). Triplicate measurements were conducted on discrete samples
and the volume median diameter D (v, 0.5) was used to compare between the oil
droplet sizes in the feed and the permeate. To visualize the oil layer that had formed
during the visual observation tests, a stock solution prepared by mixing sunflower oil
with Sudan Blue II with ratio 99.9:0.1 (wt. %) was used. 1 litre each of oil-in-water
emulsion was prepared by mixing different amounts of (0.3, 0.4 and 0.5 vol.%) stock
solution with pure water.
5.2.5 Contactor permeance and rejection performance
The demulsification of the oil-in-water emulsions was carried out by using a vacuum
filtration setup (Fig.S 5.4): 300 ml of oil-in-water emulsions were used in each
experimental run: The first 250 ml were passed through the 3D printed contactors
using vacuum filtration and collected in a separating funnel. After 1 h, 20 ml samples
were taken from the bottom layer of the permeate in the separating funnel for analysis
following an established procedure [201]. Three types of 3D printed membrane
contactors, Cylindrical, Schwarz–P and Gyroid, were used. Their permeance (𝐾, LMH
bar-1), separation efficiency (𝑅, %) and resistance (𝑅𝑚, m-1) were calculated by using
the following equations:
𝐾 = 𝑉
∆𝑡 𝐴 ∆𝑝 (5.5)
𝑅 (%) = 𝐶𝐹 − 𝐶𝑃
𝐶𝐹 (5.6)

Chapter 5 3D Printed Contactors for Enhanced Oil Droplet Coalescence
Page | 127
𝑅𝑚 =𝑙
𝑘 (5.7)
where 𝑉 is the volume of permeate (m3) over time ∆𝑡 (hr); 𝐴 is the effective membrane
surface area (m2) (the available surface area of the membrane that the permeate can
pass through); ∆𝑝 is the vacuum pressure (bar); 𝐶𝐹 is the oil concentration in the feed
solution (mg l-1) and 𝐶𝑃 is the oil concentration in the permeate side (mg l-1) after one
hour; 𝑙 is the membrane thickness (m); 𝑘 is the intrinsic permeability (m2) and was
determined by using a dead-end filtration apparatus as described in [233]. Briefly, a
fixed volume of water was flowed through the contactors under hydrostatic pressure.
Based on Darcy’s law, the rate of the filtrate flow is proportional to the hydrostatic
pressure:
𝜇 𝑢(𝑡) 𝑙
𝑘= 𝜌 𝑔 ℎ(𝑡) (5.8)
where 𝜇 is the dynamic viscosity of water (kg m-1 s-1), ℎ(𝑡) is the liquid level above
the contactor which decreased with time and 𝑡 is time. As the rate of filtrate flow is
essentially the rate of decrease of liquid level, 𝑢(𝑡) = −𝑑ℎ
𝑑𝑡, 𝑘 can be obtained by
integrating equation (5.8).
A turbidity meter (EUTECH TN-100, Thermo-Scientific) was used to determine the
oil concentration in the feed and permeate [255]. The oil-in-water emulsion was
initially calibrated for different known oil concentrations in terms of the intensity of
scattered light in the water and read out in units of turbidity, NTU (nephelometric
turbidity units). The relationship between the intensity of scattered light and the oil
concentration was linear with R2 = 0.99 (Fig.S 5.5). The generated equation was used
to measure the experimental oil concentrations. For all experiments the average of
three replicate tests is reported.
5.2.6 Visual observation
The remaining 50 ml of the starting 300 ml emulsion were poured into a burette and a
picture (using a Canon EOS 600D) of the top layer was taken every 30 minutes for

Chapter 5 3D Printed Contactors for Enhanced Oil Droplet Coalescence
Page | 128
180 minutes to observe the increase in the thickness of the oil layer with time and
quantify the separation rate of the oil phase using the 3D printed contactors and natural
separation (Fig.s S7-9). Image J was used to measure the oil layer thickness in the
recorded images.
Results and discussions
5.3.1 Structural characterization of 3D printed contactors
A summary of the structural characteristics of the Cylindrical, Schwarz-P and Gyroid
3D printed contactors is shown in Fig. 5.4.

Chapter 5 3D Printed Contactors for Enhanced Oil Droplet Coalescence
Page | 129
Fig. 5.4. Optical micrographs, CAD models, surface and cross-section SEM micrographs
for Cylindrical (a, b, c, d), Schwarz-P (e, f, g, h) and Gyroid (i, j, k, l) 3D printed contactors.
The diameter of all contactors is 25 mm, including a 2.5 mm rim, with a thickness of 4.68
mm or 9.36 mm.
The overall effect of the fabrication process of the 3 types of 3D printed contactors is
reported in Table 5.1, where the theoretical pore dimension, porosity, and theoretical
surface area of the porous medium were extracted from the STL files using the 3D
Tool software and Autodesk Meshmixer software, respectively. The tortuosity of the

Chapter 5 3D Printed Contactors for Enhanced Oil Droplet Coalescence
Page | 130
Gyroid-based 3D printed contactor was taken as 1.5 from the literature [278]. The
average pore sizes of the 3D printed contactors were obtained from statistical image
analysis of SEM micrographs using image J. The pore size distribution curve of more
than 100 randomly selected pores from SEM micrographs of the cylindrical-based
contactors was obtained via statistical image analysis using ImageJ and shown in Fig.S
5.6. Porosity was measured according to Equation 5.4.
Table 5.1. Physical characterizations of 3D printed contactors, contact angle (CA), porosity
(), average pore diameter (Dp), roughness (Ra), tortuosity () and internal surface area (SAint). CA Dp Ra SAint
oil water STL Exper. STL SEM STL STL
deg (± 2) % µm nm - m2
Cylindrical 20
83
70
54 300 225 ± 21 73 ± 2
1 7.07 × 10⁻³
Schwarz-P 65 270 232 ± 14 1 8.37 × 10⁻³
Gyroid 52 700 624 ± 32 1.5 11.07 × 10⁻³
The flow pathway for the three structures produced is shown in Fig. 5.5. Although the
Schwarz-P has a higher surface area than the cylindrical structure, it still has the same
tortuosity, equal to 1 (Table 5.1). On the other hand, the Gyroid structure couples a
higher surface area with a larger tortuosity. As discussed in the literature, both of these
factors help the coalescence process as they increase the contact time between the oil
and the oleophilic surface, with the material used to print the structures being wetted
more by oil than by water (Table 5.1). These differences help to explain the differing
performance of the structures in terms of hydraulic resistance, permeability and oil
rejection.

Chapter 5 3D Printed Contactors for Enhanced Oil Droplet Coalescence
Page | 131
Fig. 5.5. Liquid flow pathway through the unit cell of (a) Cylindrical (b) Schwarz-P and (c)
Gyroid-based 3D printed contactors.
5.3.2 3D printed contactor flow characterisation
These structural differences help explain the differing performance of the structures in
terms of membrane resistance, with the Gyroid structure offering a higher resistance
compared to the Cylindrical and Schwarz-P ones (Table 5.2). This can be attributed to
two factors: First, a higher tortuosity leads to higher membrane resistance [38].
Second, the triply periodic minimal surfaces generate a complex internal structure
compared to the cylindrical-based 3D printed contactors, leading to an increase in the
internal area facing the fluid flow (Table 5.1), also resulting in an increase of the fluid
flow resistance through the two TPMS contactors. A higher intrinsic permeability of
Schwarz-P structures compared to Gyroid ones has been observed previously [279],
and attributed to the fact that the intrinsic permeability of a fluid is inversely
proportional to the corresponding smallest specific surface [117].
Table 5.2. Intrinsic permeability (𝑘), actual intrinsic permeability (𝑘𝑒𝑥𝑝), theoretical intrinsic
permeability (𝑘𝑆𝑇𝐿), effective intrinsic permeability (𝑘𝑒𝑓𝑓), membrane resistance (Rm) and
pure water permeance (𝐾𝑤) for 3D printed membrane contactors with thickness 4.68 mm.
𝒌𝒆𝒙𝒑 𝒌𝑺𝑻𝑳 𝒌𝒆𝒇𝒇 Rm 𝑲𝒘
10 mbar 20 mbar
m2 m-1 LMH bar-1
Cylindrical 7.39 × 10⁻¹⁰ 19.7 × 10⁻¹⁰ 8.54 × 10⁻¹⁰ 6.33 × 10⁶ 1.76 ± 0.02 × 10⁷ 3.61 ± 0.20 × 10⁷
Schwarz-P 1.05 × 10⁻¹⁰ 15.9 × 10⁻¹⁰ 10.9 × 10⁻¹⁰ 4.44 × 10⁷ 4.87 ± 0.04 × 10⁶ 1.00 ± 0.02 × 10⁷
Gyroid 5.44 × 10⁻¹¹ 71.4 × 10⁻¹⁰ 42.2 × 10⁻¹⁰ 8.60 × 10⁷ 3.00 ± 0.01 × 10⁶ 6.00 ± 0.05 × 10⁶
*error for all intrinsic permeability measured values is in the order of 10−13.
The fact that the contactors used in this work are designed with regular features, unlike
traditional membranes, allows using the experimental data for the membrane

Chapter 5 3D Printed Contactors for Enhanced Oil Droplet Coalescence
Page | 132
resistance to estimate the effect of deviation in structural parameters (pore size,
porosity, tortuosity) of the printed contactors from the digital drawing. From Darcy’s
law, the intrinsic permeability is:
𝑘 ∝ε D𝑝
2
32 𝜏 (5.9)
where the values for ε, D and τ are those defined in the digital drawing. For the
cylindrical case, Equation (5.9) becomes an exact relation (via the Haagen-Poiseuille
equation). Using the values from the digital drawing, one can calculate the theoretical
intrinsic permeability (𝑘𝑆𝑇𝐿). With the available experimental values for the average
pore size and porosity (Table 5.1), one can then calculate an effective intrinsic
permeability, corrected for those variables that can be directly measured (𝑘𝑒𝑓𝑓). This
corrected value can then be compared to the experimentally measured one (𝑘𝑒𝑥𝑝), as
reported in Table 5.2. For the cylindrical case, the difference between the measured
value and 𝑘𝑒𝑓𝑓 is small, signalling that deviations in the printed object from the digital
drawing for tortuosity and internal surface area, which cannot be independently
measured, are quite small. On the other hand, differences are much more significant
for the Schwarz-P and the Gyroid structures (Table 5.2), indicating not only larger
deviations between the digital drawing and the printed structures, but also the fact that
the more complex geometry cannot be simply modelled using Equation (5.9). This is
particularly the case for the Gyroid structure, which has a complex pore structure (Fig.
5.5) which cannot be effectively measured solely by statistical image analysis using
SEM (Table 5.1).
The pure water and oil-in-water emulsion permeance values for the three different 3D
printed membrane contactors (Cylindrical, Schwarz-P and Gyroid) are presented in
Fig. 5.6. Different oil concentrations (0.3, 0.4, and 0.5 vol. %) of the oil-in-water
emulsion and two vacuum pressure differences (10 and 20 mbar) were tested. The
permeance doubled for all the 3D printed contactors when the initial vacuum pressure
was doubled from 10 to 20 mbar, following Darcy’s law (Table 5.2). Similarly, the
permeance halved when the contactors’ thickness was doubled, also in line with

Chapter 5 3D Printed Contactors for Enhanced Oil Droplet Coalescence
Page | 133
Darcy’s law (cfr. Fig. 5.6a and 6c). On the other hand, permeance decreased with
increasing oil concentration. This is attributed to the high affinity between oil droplets
and contactor material (low oil contact angle, cfr. Table 5.1). Such good wettability
might have also led to the formation of a continuous oily layer on the inner surface of
the contactors, further increasing adhesion between the oil and the membrane surface
[131]. It has also been observed in the literature that an increase in thickness of the
oily layer on the membrane’s surface, resulting from the higher oil concentration in
the feed, leads, in turn, to an increase in the overall membrane resistance against fluid
flow [202].
Fig. 5.6. Pure water and oil-in-water emulsion (0.3, 0.4 and 0.5 vol. %) permeance of the
3D printed contactors for (a) thickness = 4.68 mm, vacuum pressure = 10 mbar, (b)
thickness = 4.68 mm, vacuum pressure = 20 mbar, (c) thickness = 9.36 mm, vacuum
pressure = 10 mbar, and (d) thickness = 9.36 mm, vacuum pressure = 20 mbar. Each data
point is the average of 3 repeats on different 3D printed contactor and the error bar
represents the standard deviation.
a b
c d
Cylindrical Schwarz-P Gyroid0.0
5.0x10⁶
1.0x10⁷
1.5x10⁷
2.0x10⁷
2.5x10⁷
3.0x10⁷
3.5x10⁷
4.0x10⁷
Per
mea
nce
(L
MH
bar
-1)
Water
Oil Con. = 0.3 vol.%
Oil Con. = 0.4 vol.%
Oil Con. = 0.5 vol.%
Cylindrical Schwarz-P Gyroid0.0
5.0x10⁶
1.0x10⁷
1.5x10⁷
2.0x10⁷
2.5x10⁷
3.0x10⁷
3.5x10⁷
4.0x10⁷
Perm
ea
nce (
LM
H b
ar
-1)
Water
Oil Con. = 0.3 vol.%
Oil Con. = 0.4 vol.%
Oil Con. = 0.5 vol.%
Cylindrical Schwarz-P Gyroid0.0
5.0x10⁶
1.0x10⁷
1.5x10⁷
2.0x10⁷
2.5x10⁷
3.0x10⁷
3.5x10⁷
4.0x10⁷
Per
mea
nce
(L
MH
bar
-1)
water
Oil Con. = 0.3 vol.%
Oil Con. = 0.4 vol.%
Oil Con. = 0.5 vol.%
Cylindrical Schwarz-P Gyroid0.0
5.0x10⁶
1.0x10⁷
1.5x10⁷
2.0x10⁷
2.5x10⁷
3.0x10⁷
3.5x10⁷
4.0x10⁷
Perm
ean
ce (
LM
H b
ar
-1)
Water
Oil Con. = 0.3 vol.%
Oil Con. = 0.4 vol.%
Oil Con. = 0.5 vol.%

Chapter 5 3D Printed Contactors for Enhanced Oil Droplet Coalescence
Page | 134
5.3.3 3D printed contactors separation performance
The effect of varying vacuum pressure, oil concentration in the feed emulsion and the
3D printed contactors thickness on the ability of the latter’s ability to separate the oil
from water is shown in Fig. 5.8. Doubling the vacuum pressure, while doubling the
permeance (cfr. Fig. 5.6a and b) leads only to a modest decrease in oil separation (cfr.
Fig. 5.7 a and b), for the three types of contactors tested. Although a higher permeance
would result in a shorter residence time, thereby reducing the overall coalescence [21],
the very good wetting of the contactors by the oil can explain the limited effect of
doubling the vacuum pressure on the separation efficiency. It can be speculated that
for a threshold higher vacuum value, the decrease in separation would be more
significant, mitigating the positive influence of the good wettability [203].

Chapter 5 3D Printed Contactors for Enhanced Oil Droplet Coalescence
Page | 135
Fig. 5.7. Separation efficiency of natural demulsification process and of the 3D printed
contactors for oil-in-water emulsions (0.3, 0.4 and 0.5 vol. %) and for (a) thickness = 4.68
mm, vacuum pressure = 10 mbar, (b) thickness = 4.68 mm, vacuum pressure = 20 mbar, (c)
thickness = 9.36 mm, vacuum pressure = 10 mbar, and (d) thickness = 9.36 mm, vacuum
pressure = 20 mbar. Each data point is the average of 3 repeats on different 3D printed
contactor and the error bar represents the standard deviation.
Oil separation increased with increasing oil concentrations (0.3, 0.4, 0.5 vol. %) in the
feed emulsion, for the three types of contactors tested. This can be attributed to an
enhancement of the collision rate between the oil droplets [246], which gave rise to
more efficient collisions between the dispersed droplets and thereby increasing the
rate of coalescence. A similar trend was observed for oil-in-water emulsions and
polytetrafluoroethylene (PTFE) flat sheet membranes, albeit for significantly higher
oil concentrations (from 0.5 to 5.0 vol. %) [205]. An opposite behaviour was observed
for 5 vol. % isodecane-in-water emulsions, also using PTFE flat sheet membranes
[280]. Finally, a doubling of the thickness of the contactor (from 4.68 to 9.36 mm),
yields a further increase in oil separation (Fig. 5.7 c and d). For 10 mbar of vacuum
pressure and 0.5 vol. % oil in the feed emulsion, the increase is 5, 6 and 6 % for the
Natural Cylindrical Schwarz-P Gyroid0
20
40
60
80
100
Sep
ara
tion
Eff
icie
ncy
%
0.3 vol.%
0.4 vol.%
0.5 vol.%
Natural Cylindrical Schwarz-P Gyroid0
20
40
60
80
100
Sep
ara
tio
n E
ffic
ien
cy %
0.3 vol.%
0.4 vol.%
0.5 vol.%
Natural Cylindrical Schwarz-P Gyroid0
20
40
60
80
100
Sep
ara
tio
n E
ffic
ien
cy %
0.3 vol.%
0.4 vol.%
0.5 vol.%
Natural Cylindrical Schwarz-P Gyroid0
20
40
60
80
100
Sep
ara
tio
n E
ffic
ien
cy %
0.3 vol.%
0.4 vol.%
0.5 vol.%
a b
c d

Chapter 5 3D Printed Contactors for Enhanced Oil Droplet Coalescence
Page | 136
cylindrical, Schwarz-P and Gyroid based 3D printed contactors, respectively. This is
attributed to an increase in the residence time through the contactors which allowed
more opportunities for the oil droplets to come in contact and merge, as also observed
via numerical simulation [21]. The increase for the Gyroid contactor over natural
demulsification was of 22 % and, at around 90 %, is broadly comparable with the
separation efficiency of conventional membrane coalescers with smaller pores in the
microfiltration range (Table S 5.1), but with significantly lower pressure loss.
5.3.4 Oil coalescence
As the role of a contactor is to accelerate the separation of the two phases, a proper
assessment of its performance requires observing what happens to the permeate after
leaving the contactor itself. An in-depth study of the coalescence of the permeate from
the Gyroid contactor was performed, as this structure provided the best results in terms
of separation efficiency. A Malvern Mastersizer was first used to measure the average
diameter of the oil droplets in the feed and permeate, showing an increase from D (v,
0.5) = 11 ± 1 m in the feed to 42 ± 2 m, 56 ± 3 m and 85 ± 4 m in the permeate
with initial concentration of 0.3, 0.4 and 0.5 vol. %, respectively (Fig. 5.8). This result
is further supported by optical observation of the permeate (Fig.S5.8).

Chapter 5 3D Printed Contactors for Enhanced Oil Droplet Coalescence
Page | 137
Fig. 5.8. Oil droplet size distribution in the oil-in-water emulsion feed and in the permeate,
with different oil concentrations going through the Gyroid-based 3D printed contactors.
Each data point is the average of 3 repeats on different 3D printed contactor (error bars are
not shown for clarity).
It is interesting to note that the average droplet size of the feed emulsion is significantly
smaller than the average pore diameter of the Gyroid-based membrane (Table 5.1). As
discussed in the introduction, the large pores of the contactors reported here should
work against oil coalescence given that they result in an overall lower surface area
compared to contactors with smaller pores [205]. However, herein lies the advantage
of using 3D printing which enables the fabrication of ordered, highly tortuous
structures, such as the Gyroid contactor, which increases contact time without
increasing the overall thickness of the contactor. This results in having the advantages
of a thin membrane (low resistance) and those of one with a high surface area (high
contact time).
Finally, the separation rate of the permeate from the Gyroid-based 3D printed
contactors into a burette for the three initial oil concentrations versus natural oil-in-
water demulsification is reported in Fig. 5.9, with the associated optical micrographs
shown in Fig. S 5.9-5.11.

Chapter 5 3D Printed Contactors for Enhanced Oil Droplet Coalescence
Page | 138
Fig. 5.9. Demulsification using Gyroid-based 3D printed contactor at vacuum pressure =
10 mbar with different oil concentrations (a) 0.3 vol. %, (b) 0.4 vol. % and (c) 0.5 vol. %,
compared to natural demulsification.
The Gyroid clearly leads to a significant acceleration of the demulsification process,
which increases with initial oil concentration. This effect is ascribed to the formation
of larger oil droplets resulting from the passage into the contactor. In fact, according
to Stoke’s law, the velocity of an oil droplet, 𝑣, in the stationary emulsion is
proportional to the square of the droplet diameter:
𝑣 =𝑑2 (𝜌𝑤 − 𝜌𝑜) 𝑔
18 𝜇
(5.10)
where g is the acceleration due to the gravity, 𝑑 the oil droplet diameter, 𝜇 is the water
viscosity (0.00102 kg m-1.s-1), 𝜌𝑤 is the water density (1000 kg m-3), 𝜌𝑜 is the oil phase
density (830 kg m-3). An increase in the average droplet diameter D (v, 0.5) from 11
m of the feed to 85 m of the permeate, would result in an increase in droplet rise
velocity of two orders of magnitude, from 0.11 to 6.65 × 10⁻⁶ m s-1. This would, in
turn, result in a much faster separation between the oil and the water phases, easing
the oil’s recovery.
Conclusions
In this work, a 3D printer was used to fabricate two different types of porous contactors
based on triply periodic minimal surfaces (TPMS), namely Schwarz-P and Gyroid
structures. The performance of these contactors was compared to both natural
0.0 0.5 1.0 1.5 2.0 2.5 3.00
1
2
3
4
5
Gyroid D-em.
Nat. D-em.
Th
ick
nes
s of
oil
y l
ay
er (
mm
)
Time (h)
0.0 0.5 1.0 1.5 2.0 2.5 3.00
1
2
3
4
5
Gyroid D-em.
Nat. D-em.
Th
ick
nes
s o
f o
ily
la
yer
(m
m)
Time (h)
0.0 0.5 1.0 1.5 2.0 2.5 3.00
1
2
3
4
5
Gyroid D-em.
Nat. D-em.
Th
ick
nes
s of
oil
y l
ay
er (
mm
)
Time (h)
a b c

Chapter 5 3D Printed Contactors for Enhanced Oil Droplet Coalescence
Page | 139
coalescence and a cylindrical pore contactor, also 3D printed, in terms of the efficiency
of separation of oil-in-water emulsions. The effects of several design and process
parameters including contactor thickness, the oil concentration in the feed and the
vacuum pressure on the separation performance of the 3D printed contactors were
studied, using a sunflower oil-in-water emulsion as a model system. The results
showed that the 3D printed Gyroid contactor had the highest separation performance
(93 %) using a low vacuum pressure of 10 mbar, whereas the cylindrical structure only
achieved 71 % separation, similar to natural coalescence. This is attributed to the
complex structure of the TPMS-based 3D printed Gyroid contactors, which provide
high surface area and tortuosity. These results show that 3D printing can be an
effective manufacturing technique for the fabrication of tailored porous contactors
providing high surface areas and long residence times, opening the way to their use in
a wide range of applications.
Acknowledgements
The work is supported by UK Engineering and Physical Sciences Research Council
(EP/M01486X/1). A. A.-S. Acknowledges the financial support of the Ministry of
Higher Education and Scientific Research of Iraq. All data created during this research
are openly available from the University of Bath data archive at:
https://doi.org/10.15125/BATH-00641

Chapter 5 3D Printed Contactors for Enhanced Oil Droplet Coalescence
Page | 140
Supplementary Information 5.6.1 Equation Parameters
The following parameters were used to create the Gyroid and Schwarz P lattices,
respectively. In both cases, the frequency term was given as follows:
𝑓 =32 𝜋
𝑥𝑙𝑖𝑚=
32 𝜋
12.5 (S5.1)
For a lattice unit cell of 1mm, a frequency term of 2𝜋 would be used. Accordingly,
the relationship between the frequency term and the side length of each unit cell is
given by:
𝑠𝑖𝑑𝑒 𝑙𝑒𝑛𝑔𝑡ℎ =2 𝜋
𝑓 (S5.2)
As such, the side length of the unit cells in our membrane filters are all
𝑠𝑖𝑑𝑒 𝑙𝑒𝑛𝑔𝑡ℎ =2 𝜋
𝑓=
2 𝜋 × 12.5
32 𝜋=
25
32= 781𝜇𝑚 (S5.3)
The other parameter that was varied was the level parameter, 𝑡, which was set as
follows (note the sign change on the parameters, which is necessary given the sign
convention in Equations (5.2) and (5.3) in the main document.
Schoen Gyroid Schwarz P
Surface 1 𝑡 = −0.46414 𝑡 = −0.66579
Surface 2 𝑡 = 0.463957 𝑡 = 0.356412
5.6.2 Volume Fraction Estimation and Design Plots
Lattice design plots help to generate lattice specimens with the required volume
fraction. In some cases, this can be solved analytically via the volume integral in

Chapter 5 3D Printed Contactors for Enhanced Oil Droplet Coalescence
Page | 141
(S5.1), or, if the volume is z-simple, via the projection of the three-dimensional surface
onto the 𝑧 = 0 plane, as in (S5.2).
∭ 𝑓(𝑥, 𝑦, 𝑧) 𝑑𝑉𝑇
(S5.4)
∬ (∫ 𝑓(𝑥, 𝑦, 𝑧)𝑑𝑧𝑧2(𝑥,𝑦)
𝑧1(𝑥,𝑦)
) 𝑑𝐴𝑅
(S5.5)
In the case of non z-simple surfaces, as with the Gyroid and Schwarz-P, the
cumbersome volume integral can be bypassed using a Monte Carlo integration
scheme. This scheme is used to estimate the volume fraction of single period of the
lattice structure, scaled to span the unit cube. The function of the implicit equations
are evaluated for each lattice using a large number of random samples (108) within
the unit cube. The ratio of the number of points that evaluate to a negative number and
the total number of samples gives an estimate of the volume enclosed on the negative
side of the surface. This shall be taken as the definition of the volume fraction.
When two Gyroid surfaces are used to enclose a volume between them, the enclosed
volume fraction is simply the volume fraction of the first surface, minus the volume
fraction of the second surface. These properties are shown in the contour plot of Fig.S
5.1-left, where the two axes represent the level parameters for each surface and the
contours represent constant volume fraction. The volume fraction is independent of
scale and can therefore applied to unit cells at different scales. A similar plot for the
Schwarz-P lattice is given in Fig.S 5.1-right.

Chapter 5 3D Printed Contactors for Enhanced Oil Droplet Coalescence
Page | 142
Fig.S 5.1. Left: The volume fraction of the volume enclosed between two Gyroid surfaces,
compared with the unit cube. The level parameter of each surface is controlled via 𝑡𝑖 and
𝑡𝑗, respectively. Right: The volume fraction of the volume enclosed between two Schwarz
P surfaces, compared with the unit cube. The level parameter of each surface is controlled
via 𝑡𝑖 and 𝑡𝑗, respectively.
5.6.3 Surface Area Estimations and Design Plots
Similar design charts can be created for the surface area arising from two Gyroid
surfaces within a unit cell (cfr. Fig. 5.1). To create the chart, Gyroid surfaces with
different level parameters were created inside the unit cube. The in-built isosurface
facility in MATLAB R2017b was then used to construct each implicit surface using a
300 x 300 x 300 meshgrid. This construction creates a triangular mesh on the
approximated surface. The summation of all triangle areas is then used to estimate the
surface area. Fig.S 5.2 is a contour plot describing the combined surface area of two
Gyroid surfaces with different level parameters. This plot is generated for unit cells
that span the unit cube. To scale the surface area to another unit cell size, the area from
this chart must be multiplied by the square of the scaling factor, i.e. 𝑆𝐹2.

Chapter 5 3D Printed Contactors for Enhanced Oil Droplet Coalescence
Page | 143
Fig.S 5.2. Left: Surface area arising from a single unit cell of Gyroid lattice, constructed
using two Gyroid surfaces with different level parameters, 𝑡𝑖 and 𝑡𝑗, respectively, surface
areas are reported in mm2. Right: Surface area arising from a single unit cell of Schwarz P
lattice, constructed using two Schwarz P surfaces with different level parameters, 𝑡𝑖 and 𝑡𝑗,
respectively, surface areas are reported in mm2.
5.6.4 Pore Size Estimations
Estimating the pore size of Schwarz and Gyroid specimens is non-trivial. This is
because the pores are arranged in a network, the network is made up of pores in
different orientations (potentially increasing tortuosity) and the hydraulic diameter of
the pores changes across the unit cell. In the Schwarz-P surface, pores are aligned to
(100), (010) and (001) directions in accordance with the Miller index notation. The
Gyroid, however, also clearly defined pores in (111) crystallographic direction. In
this study, an estimate of the pore sizes is given by inspection of the projection of the
lattice geometries along each of the aforementioned directions. As will now be shown,
this gives rise to quite different pore sizes in the case of the Gyroid.
In the case of the Schwarz-P surface, the pore sizes are of equal size and shape along
each viewing direction. In this study, the pore is classified by its maximum and
minimum inscribed circles, thereby accounting for the fact the pores are not circular
in cross-section. For the Schwarz-P unit cell, the pore size is taken at the 𝑧 =1
2 plane
for a unit cell that spans the unit cube. Worded crudely, the opening at the top of a unit

Chapter 5 3D Printed Contactors for Enhanced Oil Droplet Coalescence
Page | 144
cell. Inspection shows that the largest pore width occurs when 𝑦 = 0 and the minimum
pore width occurs when 𝑦 = 𝑥. For the unit cell spanning the unit cube, maximum
pore width is therefore determined by.
cos(2𝜋𝑥) + cos(2𝜋𝑦) + cos(2𝜋𝑧) + 𝑡 = 0 (S5.6)
Let us now set 𝑧 =1
2 and 𝑦 = 0. Hence,
cos(2𝜋𝑥) + cos(0) + cos(𝜋) + 𝑡 = 0 cos(2𝜋𝑥) + 𝑡 = 0
𝑥 =cos1(−𝑡)
2𝜋 (S5.7)
It should be noted that this number must be multiplied by the scaling factor, 𝑆𝐹, to
convert it into the correct pore size for a particular unit cell side length.
The minimum pore width occurs when 𝑦 = 𝑥, hence:
cos(2𝜋𝑥) + cos(2𝜋𝑥) + cos(𝜋) + 𝑡 = 0
2cos(2𝜋𝑥) − 1 + 𝑡 = 0
𝑥 =cos−1 (
1 − 𝑡2 )
2𝜋 (S5.8)
Using (S5.7) and (S5.8), the minimum and maximum pore size of the Schwarz P unit
cell can be specified. This wall thickness can be scaled to different unit cell sizes by
multiplying by the scaling factor, 𝑆𝐹 .
At the present time, an analytical solution to the pore size for the Gyroid is not
available. However, reasonable approximations of the various pore sizes is possible
through visual inspection. Fig.S 5.3-left shows one of the pores aligned to the (001)
direction, and Fig.S 5.3-right shows one of the pores aligned to the (111) direction.
Taking dimensions from the markers on the plots, the apparent pore sizes are 0.279
mm (001 direction) and 0.356 mm (111 direction) for the Gyroid specimens used to
create the membrane filters (not the unit cell spanning the unit cube).

Chapter 5 3D Printed Contactors for Enhanced Oil Droplet Coalescence
Page | 145
Fig.S 5.3. Left: A magnified view of one of the Gyroid pores aligned to with the (001)
direction. The apparent pore width is 0.279 mm for the specimens used to create the
membrane filters (not the unit cell spanning the unit cube). Right: Visual inspection of the
dimensions of a Gyroid pore aligned to the (111) direction. The apparent pore size is
0.356mm for the Gyroid specimens used to create the membrane filters (not the unit cell
spanning the unit cube).
5.6.5 Wall thickness
The wall thickness of a Schwarz P surface is estimated in an almost identical fashion
to the pore size. By creating coordinates for points of reference on each surface (outer
and inner), the wall thickness can be estimated. It is important to note that the wall
thickness does vary. An important piece of future work will be to derive analytical or
highly accurate numerical methods for the wall thickness. This is particularly pertinent
when operating at the limits of the additive manufacturing process resolution (as in
this study).

Chapter 5 3D Printed Contactors for Enhanced Oil Droplet Coalescence
Page | 146
5.6.6 Experimental Apparatus and Additional Data
Fig.S 5.4. Labelled photo of the vacuum filtration equipment set up.
Fig.S 5.5. Calibration curve of oil-in-water emulsions measured using Turbidity meter
(EUTECH TN-100, Thermo-Scientific).

Chapter 5 3D Printed Contactors for Enhanced Oil Droplet Coalescence
Page | 147
160 180 200 220 240 260 280 3000
5
10
15
20
25
Co
un
t
Pore size (m)
Fig.S 5.6. Pore size distribution of cylindrical-
based contactor.
0 200 400 600 8000
200
400
600
800
Act
ua
l p
ore
siz
e (
m)
Designed pore size (m)
Cylindrical
Schwarz-P
Gyroid
Fig.S 5.7. Deviation of 3D printed membrane
contactors from the CAD model.
Fig.S5.8. Optical photographs of oil droplets in oil in water emulsion at different volume
fractions (a = 0.3 vol. %, b = 0.4 vol. %, c = 0.5 vol. %) in the feed solution before filtration
process, (d, e, f) immediately after filtration process (g, h, i) 1 hour after filtration.

Chapter 5 3D Printed Contactors for Enhanced Oil Droplet Coalescence
Page | 148
Fig.S5.9. Demulsification process with and without Gyroid-based membrane, (a).
Thickness = 9.36 mm, oil concentration = 0.3 vol. %, vacuum pressure = 10 mbar, (b).
Natural demulsification, oil concentration = 0.3 vol. %.
Fig.S5.10. Demulsification process with and without Gyroid-based membrane, (a).
Thickness = 9.36 mm, oil concentration = 0.4 vol. %, vacuum pressure = 10 mbar, (b).
Natural demulsification, oil concentration = 0.4 vol. %.
Fig.S5.11. Demulsification process with and without Gyroid-based membrane, (a).
Thickness = 9.36 mm, oil concentration = 0.5 vol. %, vacuum pressure = 10 mbar, (b).
Natural demulsification, oil concentration = 0.5 vol. %.

Chapter 5 3D Printed Contactors for Enhanced Oil Droplet Coalescence
Page | 149
Table S 5.1 Summary of the coalescer membranes used for demulsification process.
Membrane Material
Configuration Surface properties
Pore size (µm)
Porosity
Thickness
(µm)
Emulsion type Droplet size
(µm),
before filtration
Con. (vol.
%)
contact
angl
e
Filtration process
Operational conditions
Settling time after
filtration
(hr)
Droplet size
(µm),
after filtration
Removal %
Ref.
Pressure
(bar)
Velocity
(m s-1)
PTFE Flat sheet + hollow fibre Hydrophobic
5 --- --- Isododecane in water
5 2.5 --- Microfiltration crossflow
0.003 – 0.15
--- --- 90 [280]
PTFE Flat sheet Hydropho
bic
0.22 62 65 Rolling oil in
water
4.7, 1.46 0.5 – 5 --- Microfiltrati
on Dead end
1 - 5 --- 1 --- 86 [205]
= = = 0.45 64 80 = --- = --- = = --- = --- 81 [205]
= = = 1.2 72 90 = --- = --- = = --- = --- 66 [205]
= = = 5 70 70 = --- = --- = = --- = --- 45 [205]
Polypropylene Hollow fibre Hydrophobic
0.2 --- 350 Oil in water 1.7 ± 0.5 3 --- Microfiltration crossflow
0.2 – 0.5
0.3 - 3 2 100 99 [201]
Sartorius Flat sheet Hydropho
bic
--- --- 110 Isododecane in
water
1 - 10 0.1 - 7 --- Microfiltrati
on
--- --- --- --- 80 - 98 [281]
PTFE Flat sheet Hydrophobic
--- --- --- Petroleum motor-oil in
water
--- 3.5 --- Microfiltration
--- --- --- --- --- [282]
hemodialysis Hollow fibre Hydrophili
c
--- --- --- Water in
kerosene
--- --- --- Microfiltrati
on
--- --- --- --- --- [204]
PTEF Flat sheet Hydropho
bic
0.45, 1.2 --- --- Rolling Oil in
water
1.5 --- --- Microfiltrati
on crossflow
--- 0.07 –
0.28
1 --- --- [269]
PVDF Flat sheet --- --- 48.2 98 ± 6.6 Crude oil in water
0.0612 --- --- Microfiltration crossflow
2.5 1 --- 0.0951 --- [283]
PVDF = --- --- 58.1 108 ±
8.5
--- = --- --- --- --- --- --- 0.3562 --- [283]
PVDF = --- --- 63.6 126 ± 4.8
--- = --- --- --- --- --- --- 1.335 --- [283]
PTFE Flat sheet multi-layer Hydropho
bic
1 + 5 +
10
--- --- Sunflower oil
in water
--- 5 --- Microfiltrati
on dead end
0.25 - 1 --- --- --- 80 [207]
--- Flat sheet Hydrophili
c
0.45 79 150 Water in
kerosene
0.5 - 30 --- --- Microfiltrati
on cross
flow
0.3 --- --- --- --- [206]
--- = = 0.22 75 150 = = --- --- = --- --- --- --- --- [206]
--- = = 0.05 70 120 = = --- --- = --- --- --- --- --- [206]
Glass membrane hydrophili
c
1.2 Water in
kerosene
2 - 10 Microfiltrati
on cross flow
0.6 96.2 [208]

Chapter 5 3D Printed Contactors for Enhanced Oil Droplet Coalescence
Page | 150
Conclusions and outcomes chapter 5
A complex pore structure of 3D contactors based on triply periodic minimal surface
(i.e. Schwarz-p and Gyroid) have been successfully fabricated using an industrial3D
printer (ProJet 3500 HD). It was found that the performance of the 3D printed
contactors in terms of oil-in-water separation process was enhanced by increasing the
tortuosity and internal surface area, with the best performance achieved using the
Gyroid-based 3D printed contactor compared to the Schwarz-P and Cylindrical-based
3D contactors.

Chapter 6 Conclusion and future work
Page | 151
Chapter 6
Conclusion and future work
This chapter provides a conclusion based on the main results of this research and
highlights areas for future studies as a continuation of the work reported in this
thesis.

Chapter 6 Conclusion and future work
Page | 152
Conclusions
In recent years, 3D printing technology or layer by layer manufacturing process has
attracted much attention due to its capability in designing and producing complex
structures and geometries in one-step, as well as delivering an economically efficient
production process directly from computer aided design model.
The use of 3D printing in the membrane fabrication process can provide a potential
solution to the current challenges of fabrication techniques, such as the phase
separation process. To this effect, 3D printing was employed in this study to generate
membranes with complex pore geometry and surface morphology. For instance,
membranes with wavy surface promoted turbulence which in turn enhanced anti-
fouling and cleaning ability, also membrane permeance. Further, fabrication of
membranes with complex pore geometry (i.e. high tortuosity) was able to deliver a
new technique to enhance the oil droplet coalescence process.
However, the fabrication process was not without its challenges. Finding suitable
software to design the 3D printed membrane, especially for modelling, was a
significant one. Equally challenging was identifying the optimal conditions in which
to print membranes, taking into account the limitations of the printer, materials and
processes.
The main conclusion is summarised in terms of 3D printed porous membranes, 3D
wavy composite membranes and triply periodic minimal surfaces.
6.1.1 3D printed porous membranes
The possibility of using the 3D printing technology to fabricate 3D printed porous
membranes was assessed and is presented in Chapter 3. The main conclusion is that it
is possible to design and print 3D printed porous membranes and that OpenScad is a
powerful and suitable software to design such membranes. This is due to its ability to
convert a 2D drawing into a 3D model, something the conventional software cannot
do. This conversion can only be achieved by combining the Autodesk inventor,
providing 2D drawing of the membrane porous area, with the generated mathematical

Chapter 6 Conclusion and future work
Page | 153
equations from the 2D drawing. These are then used in OpenScad as codes to generate
the final CAD file of the 3D printed membranes. The downside of using 3D printing
technology to fabricate a porous membrane relates to the resolution of the projet 3D
printer used to design the pore geometries. Unfortunately, its nominal resolution was
not sufficient to discriminate between different pore geometries, with only 300 µm
hexagonal-based pores designed as a result. Furthermore, the removal of the wax
support materials proved particularly challenging.
6.1.2 Wavy 3D composite membranes
The design and fabrication of composite membranes using 3D printing technology was
investigated and discussed in Chapter 4; it comprised of the following steps.
Firstly, the wavy 3D composite membrane was optimised in terms of amplitude (A)
and wavelength (λ) using CFD simulations. The simulation results showed that
turbulence increased as with the number of peaks, and that the best amplitude is 0.7
mm. However, the 3D printer produces a sharp edge with a peak height of 0.7 mm due
to its resolution limitation so a 0.5 mm amplitude was used as the peak height. Further,
the resolution limitation could not allow the printing of a wavy 3D support structure
with a pore size in the range of the micro/ultrafiltration membrane, therefore 200 µm
was chosen as the smallest pore size that can be printed as fully open.
Secondly, a successful methodology has been developed to coat the wavy 3D support
with a selective layer. This was established after first trying two coating methods:
interfacial polymerisation and spin coating methods, as shown in Appendix. The novel
method involved deposited a thin polyethersulfone (PES) selective layer onto a 3D
support structure. The results demonstrated that the wavy 3D printed composite
membranes were easily cleaned and could be used to significantly improve
permeation. The permeance and permeance recovery ratio of the wavy 3D composite
membranes were 16 ± 0.5 LMH bar-1 and 89 ± 2.7 respectively, meanwhile the
permeance and permeance recovery ratio of the 3D flat composite membrane were 11
± 0.9 LMH bar-1 and 37 ± 2.7 respectively.

Chapter 6 Conclusion and future work
Page | 154
6.1.3 Triply periodic minimal surfaces
The design and fabrication of complex pore geometries, based on triply periodic
minimal surfaces at the microscale, is described in Chapter 5. Complex geometries
were successfully fabricated using 3D printing technology, overcoming the numerous
challenges associated with the fabrication of triply periodic minimal surfaces. These
challenges, including the design process, the balance between the STL file size (i.e.
the required resolution to produce high definition features of the geometry) and the
ability of the 3D printer to upload the file from the computer, were successfully
managed. The complex pore geometry, especially for the Gyroid-based 3D printed
contactor membranes, showed a high oil removal percentage, of around 92.6 ± 0.4 %,
while the natural removal percent was relatively low, around 73 ± 4.2 %. High
tortuosity of Gyroid-based membrane contactor (1.5) increased the residence time
through the membrane, which in turn led to the increased probability of oil droplets
coalescing.
Future work
As indicated earlier in this study, 3D printing technology is a promising new technique
for fabricating membranes, especially using the polyjet 3D system, where different
materials can be printed at the same time. Therefore, it is important to use this feature
to print a membrane with specific characteristics, such as high hydrophilicity with
chemical and mechanical stability. However, problems remain in the wax removal
process, suggesting the need to try new materials (i.e. support materials) that could be
easily removed by simple physical cleaning to save time and cost.
As the 3D printed wavy composite membranes proved to be a good candidate on a lab
scale, in terms of delayed fouling process, the next step would be to probe the
performance of the 3D wavy composite membranes for a real wastewater (i.e.
produced water) under realistic conditions (i.e. high salinity and high solid contains).
If successful, it could then be scaled up for use in industrial applications. In addition,
as the 3D wavy composite membrane has higher surface contact area with less fouling
than a flat membrane surface, it might be worth employing this wavy structure in other
membrane applications, for example forward osmosis and membrane in fuel cell.

Chapter 6 Conclusion and future work
Page | 155
It is also observed here that triply periodic minimal surfaces provide complex pore
membrane structures that enhance the membrane’s characteristics (i.e. permeability
and selectivity). Therefore, it is here recommended to design, optimise (i.e. using CFD
simulation process) and fabricate different types of these structures.
As 3D printing technology has the ability to fabricate any complex design layer-by-
layer directly from a CAD model, it is worthy to try additional patterns for flat and
hollow fibre membranes.
A pre-treatment process for oil-in-water emulsion such as gravity separation process
could be used to further enhance the demulsification process based on the oil droplets
coalescence process. Therefore, it is important to study the effect of the pre-treatment
process on the overall demulsification performance.
To this effect, the future work is divided as follows:
6.2.1 Printed material and support materials of 3D polyjet
Printed material
Look for new jetting materials to fabricate membranes with specific
characterisations, such as antifouling, high selectivity and high permeability;
for example, a printing mixture of polymer solution with hydrophilic
nanoparticles to prepare antifouling membranes. Moreover, print a membrane
with different material specifications. For example, firstly print a support
structure with a material that can provide good mechanical as well thermal
stability, then print a selective layer of a different material which can enhance
both the permeability and selectivity of the printed membranes.
Support materials
The mechanism for complete removal of wax from the 3D printed membrane
is a serious problem that needs further research. Two crucial requirements are:
(i) develop a new method to ensure complete and time-efficient removal of
wax, and
(ii) develop a new support material that is easily removable just using water.

Chapter 6 Conclusion and future work
Page | 156
6.2.2 3D wavy composite membranes for new applications:
Evaluate the performance of the 3D wavy composite membranes for real wastewater
(i.e. produced water) generated by crude oil or natural gas fields. Produced water
contains many contaminants [284] including: salt, dissolved solids, suspended solids,
chemicals and organic matter, as well as oil of different categories (i.e. free, dissolved
and emulsified oil). Therefore, this would be a good opportunity to investigate the
performance of 3D wavy composite membranes in such kinds of wastewater.
Assess the 3D wavy composite membranes in other membrane separation processes,
for example, forward osmosis, where the potential chemical differences between the
feed solution and the draw solution works as a driving force (i.e., theoretically the
forward osmosis process does not require any energy). Further, fouling propensity in
the forward osmosis process is less than the pressure driven membrane separation
processes [285]. Therefore, mixing between the features provided by 3D wavy
composite membranes (i.e. high projection area, mechanical stability enhanced by the
3D structure and antifouling character and forward osmosis advantages) could provide
a good process for oil-in-water separation and for other applications, from an
economic point view.
Apply the 3D wavy composite membranes (as ion exchange membranes) in fuel cell
applications and determine their performance in providing a high mass transfer surface
area between cathode and anode, which would in turn enhance power generation.
6.2.3 New design geometry
Design and print other complex 3D pore geometry membranes based on triply
minimal surfaces, for example, Schwarz-D and Schoen-IWP as new 3D printed
membrane coalescers. There is a need to conduct further CFD simulation
studies to deeply understand fluid flow behaviour, pressure drop and the
permeability of the triply minimal surfaces.
Design a new model of hollow fibre membranes, that is, create surface
patterning to increase the internal and external surface areas of the hollow fibre
membranes, which could be useful in reducing membrane fouling.

Chapter 6 Conclusion and future work
Page | 157
Design new surface topographies inspired by nature, for example, shark skin
and ripples in surface water, and investigate their performance in terms of
permeability, selectivity and antifouling.
6.2.4 Hybrid process
Investigate the effect of using a hybrid process (i.e. a combination of separation
processes based on gravity and on oil droplet coalescence) on the overall
demulsification process. A fast settling time is the key to enhance the performance in
separation processes based on gravity, therefore it is essential to optimise the settling
time and study its effect on the overall performance of the hybrid proces

References
Page | 158
References
[1] Y. Zhu, D. Wang, L. Jiang, J. Jin, Recent progress in developing advanced membranes for emulsified oil/water separation, NPG Asia materials 6(5) (2014) e101. [2] D. Pierce, K. Bertrand, C. CretiuVasiliu, Water recycling helps with sustainability, SPE Asia Pacific Oil and Gas Conference and Exhibition, Society of Petroleum Engineers, 2010. [3] H.B. Bradley, Petroleum engineering handbook, (1987). [4] E.N. Tummons, V.V. Tarabara, J.W. Chew, A.G. Fane, Behavior of oil droplets at the membrane surface during crossflow microfiltration of oil–water emulsions, Journal of Membrane Science 500 (2016) 211-224. [5] M.-J. Um, S.-H. Yoon, C.-H. Lee, K.-Y. Chung, J.-J. Kim, Flux enhancement with gas injection in crossflow ultrafiltration of oily wastewater, Water research 35(17) (2001) 4095-4101. [6] S. Zhang, P. Wang, X. Fu, T.-S. Chung, Sustainable water recovery from oily wastewater via forward osmosis-membrane distillation (FO-MD), Water research 52 (2014) 112-121. [7] S. Weschenfelder, C. Borges, J. Campos, Oilfield produced water treatment by ceramic membranes: Bench and pilot scale evaluation, Journal of Membrane Science 495 (2015) 242-251. [8] M. Padaki, R.S. Murali, M.S. Abdullah, N. Misdan, A. Moslehyani, M. Kassim, N. Hilal, A. Ismail, Membrane technology enhancement in oil–water separation. A review, Desalination 357 (2015) 197-207. [9] R. Moosai, R.A. Dawe, Gas attachment of oil droplets for gas flotation for oily wastewater cleanup, Separation and purification technology 33(3) (2003) 303-314. [10] R. Mohammed, A. Bailey, P. Luckham, S. Taylor, Dewatering of crude oil emulsions 3. Emulsion resolution by chemical means, Colloids and Surfaces A: Physicochemical and Engineering Aspects 83(3) (1994) 261-271. [11] J. Veil, B. Langhus, S. Belieu, Downhole oil/water separators: An emerging produced water disposal technology, SPE/EPA exploration and production environmental conference, 1999, pp. 277-289. [12] K. Jepsen, M. Bram, S. Pedersen, Z. Yang, Membrane fouling for produced water treatment: A review study from a process control perspective, Water 10(7) (2018) 847. [13] C. Noïk, J. Chen, C.S. Dalmazzone, Electrostatic demulsification on crude oil: A state-of-the-art review, International Oil & Gas Conference and Exhibition in China, Society of Petroleum Engineers, 2006. [14] S. Maiti, I. Mishra, S. Bhattacharya, J. Joshi, Removal of oil from oil-in-water emulsion using a packed bed of commercial resin, Colloids and Surfaces A: Physicochemical and Engineering Aspects 389(1) (2011) 291-298. [15] T. Mohammadi, M. Kazemimoghadam, M. Saadabadi, Modeling of membrane fouling and flux decline in reverse osmosis during separation of oil in water emulsions, Desalination 157(1) (2003) 369-375. [16] B. Chakrabarty, A. Ghoshal, M. Purkait, Ultrafiltration of stable oil-in-water emulsion by polysulfone membrane, Journal of Membrane Science 325(1) (2008) 427-437. [17] A. Rahimpour, S.S. Madaeni, Polyethersulfone (PES)/cellulose acetate phthalate (CAP) blend ultrafiltration membranes: preparation, morphology, performance and antifouling properties, Journal of Membrane Science 305(1-2) (2007) 299-312. [18] E. Yuliwati, A. Ismail, Effect of additives concentration on the surface properties and performance of PVDF ultrafiltration membranes for refinery produced wastewater treatment, Desalination 273(1) (2011) 226-234.

References
Page | 159
[19] S.H. Maruf, A.R. Greenberg, J. Pellegrino, Y. Ding, Critical flux of surface-patterned ultrafiltration membranes during cross-flow filtration of colloidal particles, Journal of Membrane Science 471 (2014) 65-71. [20] P. Becher, Encyclopedia of Emulsion Technology, Vol. 2: Applications, New York: Marcel Dekker, 1985. [21] Y. Kagawa, T. Ishigami, K. Hayashi, H. Fuse, Y. Mino, H. Matsuyama, Permeation of concentrated oil-in-water emulsions through a membrane pore: numerical simulation using a coupled level set and the volume-of-fluid method, Soft matter 10(40) (2014) 7985-7992. [22] F. Rengier, A. Mehndiratta, H. von Tengg-Kobligk, C.M. Zechmann, R. Unterhinninghofen, H.-U. Kauczor, F.L. Giesel, 3D printing based on imaging data: review of medical applications, International journal of computer assisted radiology and surgery 5(4) (2010) 335-341. [23] P. Webb, A review of rapid prototyping (RP) techniques in the medical and biomedical sector, Journal of Medical Engineering & Technology 24(4) (2000) 149-153. [24] J.E. Bara, C.I. Hawkins, D.T. Neuberger, S.W. Poppell, 3D printing for CO2 capture and chemical engineering design, Nanomaterials and Energy 2(5) (2013) 235-243. [25] Z.-X. Low, Y.T. Chua, B.M. Ray, D. Mattia, I.S. Metcalfe, D.A. Patterson, Perspective on 3D printing of separation membranes and comparison to related unconventional fabrication techniques, Journal of Membrane Science 523 (2017) 596-613. [26] H. Strathmann, Fundamentals of Membrane Separation Processes, in: C.A. Costa, J.S. Cabral (Eds.), Chromatographic and Membrane Processes in Biotechnology, Springer Netherlands, Dordrecht, 1991, pp. 153-175. [27] R.L. Goldsmith, D.A. Roberts, D.L. Burre, Ultrafiltration of soluble oil wastes, Journal (Water Pollution Control Federation) (1974) 2183-2192. [28] A. Merdaw, A. Sharif, G. Derwish, Water permeability in polymeric membranes, Part I, Desalination 260(1) (2010) 180-192. [29] H.J. Tanudjaja, C.A. Hejase, V.V. Tarabara, A.G. Fane, J.W. Chew, Membrane-Based Separation for Oily Wastewater: A Practical Perspective, Water research (2019). [30] M.C. Porter, Handbook of industrial membrane technology, (1989). [31] J. Gu, P. Xiao, J. Chen, F. Liu, Y. Huang, G. Li, J. Zhang, T. Chen, Robust preparation of superhydrophobic polymer/carbon nanotube hybrid membranes for highly effective removal of oils and separation of water-in-oil emulsions, Journal of Materials Chemistry A 2(37) (2014) 15268-15272. [32] D. Liu, L. He, W. Lei, K.D. Klika, L. Kong, Y. Chen, Multifunctional polymer/porous boron nitride nanosheet membranes for superior trapping emulsified oils and organic molecules, Advanced Materials Interfaces 2(12) (2015). [33] J. Mulder, Basic principles of membrane technology, Springer Science & Business Media2012. [34] N. Ahmad, P. Goh, Z. Abdul Karim, A. Ismail, Thin Film Composite Membrane for Oily Waste Water Treatment: Recent Advances and Challenges, Membranes 8(4) (2018) 86. [35] B. Van der Bruggen, C. Vandecasteele, T. Van Gestel, W. Doyen, R. Leysen, A review of pressure‐driven membrane processes in wastewater treatment and drinking water production, Environmental progress 22(1) (2003) 46-56. [36] D. Paul, K. Ohlrogge, Membrane separation processes for clean production, Environmental progress 17(3) (1998) 137-141. [37] D. Patterson, Davey, C. and Rohani, R., Membrane separations:from purifications, minimisation, reuse and recycling to process intensification, Chemical processes for a sustainable future, Royal Society of Chemistry, Cambridge, U. K., 2014, pp. 467-497.

References
Page | 160
[38] A. Lee, J.W. Elam, S.B. Darling, Membrane materials for water purification: design, development, and application, Environmental Science: Water Research & Technology 2(1) (2016) 17-42. [39] L.K. Wang, J.P. Chen, Y.-T. Hung, N.K. Shammas, Membrane and desalination technologies, Springer2011. [40] A.T. Fane, R. Wang, Y. Jia, Membrane technology: past, present and future, Membrane and Desalination Technologies, Springer2011, pp. 1-45. [41] Z. Dai, L. Ansaloni, L. Deng, Recent advances in multi-layer composite polymeric membranes for CO2 separation: a review, Green Energy & Environment 1(2) (2016) 102-128. [42] R.J. Gohari, E. Halakoo, W. Lau, M. Kassim, T. Matsuura, A. Ismail, Novel polyethersulfone (PES)/hydrous manganese dioxide (HMO) mixed matrix membranes with improved anti-fouling properties for oily wastewater treatment process, RSC Advances 4(34) (2014) 17587-17596. [43] G. Koops, Preparation and characterization of micro-and ultrafiltration membranes, Encyclopedia of Desalination and Water Resource (2002). [44] M. Khorsand-Ghayeni, J. Barzin, M. Zandi, M. Kowsari, Fabrication of asymmetric and symmetric membranes based on PES/PEG/DMAc, Polymer Bulletin 74(6) (2017) 2081-2097. [45] P. Li, Z. Wang, Y. Liu, S. Zhao, J. Wang, S. Wang, A synergistic strategy via the combination of multiple functional groups into membranes towards superior CO2 separation performances, Journal of membrane science 476 (2015) 243-255. [46] H. Strathmann, Membrane separation processes: Current relevance and future opportunities, AIChE Journal 47(5) (2001) 1077-1087. [47] A. Kayvani Fard, G. McKay, A. Buekenhoudt, H. Al Sulaiti, F. Motmans, M. Khraisheh, M. Atieh, Inorganic membranes: Preparation and application for water treatment and desalination, Materials 11(1) (2018) 74. [48] A. Duarte, J. Bordado, Smart composite reverse-osmosis membranes for energy generation and water desalination processes, Smart Composite Coatings and Membranes, Elsevier2016, pp. 329-350. [49] S. Lee, Y. Aurelle, H. Roques, Concentration polarization, membrane fouling and cleaning in ultrafiltration of soluble oil, Journal of Membrane Science 19(1) (1984) 23-38. [50] A.B. Koltuniewicz, R. Field, T. Arnot, Cross-flow and dead-end microfiltration of oily-water emulsion. Part I: Experimental study and analysis of flux decline, Journal of Membrane Science 102 (1995) 193-207. [51] T. Arnot, R. Field, A. Koltuniewicz, Cross-flow and dead-end microfiltration of oily-water emulsions: Part II. Mechanisms and modelling of flux decline, Journal of Membrane Science 169(1) (2000) 1-15. [52] S. Kasemset, A. Lee, D.J. Miller, B.D. Freeman, M.M. Sharma, Effect of polydopamine deposition conditions on fouling resistance, physical properties, and permeation properties of reverse osmosis membranes in oil/water separation, Journal of membrane science 425 (2013) 208-216. [53] T. Yuan, J. Meng, T. Hao, Y. Zhang, M. Xu, Polysulfone membranes clicked with poly (ethylene glycol) of high density and uniformity for oil/water emulsion purification: effects of tethered hydrogel microstructure, Journal of membrane science 470 (2014) 112-124. [54] P. Kajitvichyanukul, Y.-T. Hung, L.K. Wang, Membrane technologies for oil–water separation, Membrane and desalination technologies, Springer2011, pp. 639-668. [55] X. Zhao, Y. Su, J. Cao, Y. Li, R. Zhang, Y. Liu, Z. Jiang, Fabrication of antifouling polymer–inorganic hybrid membranes through the synergy of biomimetic mineralization and nonsolvent induced phase separation, Journal of Materials Chemistry A 3(14) (2015) 7287-7295.

References
Page | 161
[56] W. Chen, J. Peng, Y. Su, L. Zheng, L. Wang, Z. Jiang, Separation of oil/water emulsion using Pluronic F127 modified polyethersulfone ultrafiltration membranes, Separation and Purification Technology 66(3) (2009) 591-597. [57] P. Srijaroonrat, E. Julien, Y. Aurelle, Unstable secondary oil/water emulsion treatment using ultrafiltration: fouling control by backflushing, Journal of Membrane Science 159(1-2) (1999) 11-20. [58] M.M. Pendergast, E.M. Hoek, A review of water treatment membrane nanotechnologies, Energy & Environmental Science 4(6) (2011) 1946-1971. [59] P. Wu, M. Imai, Novel biopolymer composite membrane involved with selective mass transfer and excellent water permeability, Advancing Desalination, IntechOpen2012. [60] W.B. Richard, Membrane technology and applications, John Wiley & Sons Ltd (2004). [61] H. Shon, S. Phuntsho, D. Chaudhary, S. Vigneswaran, J. Cho, Nanofiltration for water and wastewater treatment–a mini review, Drinking Water Engineering and Science 6(1) (2013) 47-53. [62] I. Xiarchos, D. Doulia, V. Gekas, G. Trägårdh, Polymeric Ultrafiltration Membranes and Surfactants, Separation & Purification Reviews 32(2) (2003) 215-278. [63] H. Lonsdale, The growth of membrane technology, Journal of membrane science 10(2-3) (1982) 81-181. [64] X. Shi, G. Tal, N.P. Hankins, V. Gitis, Fouling and cleaning of ultrafiltration membranes: a review, Journal of Water Process Engineering 1 (2014) 121-138. [65] H.-J. Li, Y.-M. Cao, J.-J. Qin, X.-M. Jie, T.-H. Wang, J.-H. Liu, Q. Yuan, Development and characterization of anti-fouling cellulose hollow fiber UF membranes for oil–water separation, Journal of Membrane science 279(1) (2006) 328-335. [66] Y. He, Z.-W. Jiang, Technology review: treating oilfield wastewater, Filtration & Separation 45(5) (2008) 14-16. [67] Z. Cui, H. Muralidhara, Membrane technology: a practical guide to membrane technology and applications in food and bioprocessing, Elsevier2010. [68] G. Belfort, R.H. Davis, A.L. Zydney, The behavior of suspensions and macromolecular solutions in crossflow microfiltration, Journal of membrane science 96(1-2) (1994) 1-58. [69] W. Ho, K. Sirkar, Membrane handbook, Springer Science & Business Media2012. [70] R.R. Bhave, Cross-flow filtration, Fermentation and biochemical engineering handbook, Elsevier1996, pp. 271-347. [71] S. Emani, R. Uppaluri, M.K. Purkait, Preparation and characterization of low cost ceramic membranes for mosambi juice clarification, Desalination 317 (2013) 32-40. [72] I. Pinnau, MEMBRANE SEPARATIONS | Membrane Preparation, in: I.D. Wilson (Ed.), Encyclopedia of Separation Science, Academic Press, Oxford, 2000, pp. 1755-1764. [73] K.P. Lee, T.C. Arnot, D. Mattia, A review of reverse osmosis membrane materials for desalination—development to date and future potential, Journal of Membrane Science 370(1) (2011) 1-22. [74] E. Drioli, A. Criscuoli, E. Curcio, Membrane contactors: fundamentals, applications and potentialities, Elsevier2011. [75] R.J. Petersen, Composite reverse osmosis and nanofiltration membranes, Journal of Membrane Science 83(1) (1993) 81-150. [76] J.E. Cadotte, R.J. Petersen, Thin-Film Composite Reverse-Osmosis Membranes: Origin, Development, and Recent Advances, Synthetic Membranes:, AMERICAN CHEMICAL SOCIETY1981, pp. 305-326. [77] H. Strathmann, L. Giorno, E. Drioli, Introduction to membrane science and technology, Wiley-VCH Weinheim, Germany2011. [78] L. Rozelle, J. Cadotte, R. Corneliussen, E. Erickson, K. Cobian, C. Kopp Jr, Phase Inversion Membranes, (2000).

References
Page | 162
[79] H. Strathmann, Asymmetric polyimide membranes for filtration of non-aqueous solutions, Desalination 26(1) (1978) 85-92. [80] B.S. Lalia, V. Kochkodan, R. Hashaikeh, N. Hilal, A review on membrane fabrication: Structure, properties and performance relationship, Desalination 326 (2013) 77-95. [81] K. Boussu, B. Van der Bruggen, C. Vandecasteele, Evaluation of self-made nanoporous polyethersulfone membranes, relative to commercial nanofiltration membranes, Desalination 200(1) (2006) 416-418. [82] S. Mazinani, S. Darvishmanesh, A. Ehsanzadeh, B. Van der Bruggen, Phase separation analysis of Extem/solvent/non-solvent systems and relation with membrane morphology, Journal of Membrane Science 526 (2017) 301-314. [83] M. Aroon, A. Ismail, M. Montazer-Rahmati, T. Matsuura, Morphology and permeation properties of polysulfone membranes for gas separation: Effects of non-solvent additives and co-solvent, Separation and Purification Technology 72(2) (2010) 194-202. [84] M.T. Doménech-Carbo, E. Aura-Castro, Evaluation of the phase inversion process as an application method for synthetic polymers in conservation work, Studies in conservation 44(1) (1999) 19-28. [85] A.K. Hołda, I.F. Vankelecom, Understanding and guiding the phase inversion process for synthesis of solvent resistant nanofiltration membranes, Journal of Applied Polymer Science 132(27) (2015). [86] H. Strathmann, K. Kock, P. Amar, R. Baker, The formation mechanism of asymmetric membranes, Desalination 16(2) (1975) 179-203. [87] G.R. Guillen, Y. Pan, M. Li, E.M. Hoek, Preparation and characterization of membranes formed by nonsolvent induced phase separation: a review, Industrial & Engineering Chemistry Research 50(7) (2011) 3798-3817. [88] Y. Peng, F. Guo, Q. Wen, F. Yang, Z. Guo, A novel polyacrylonitrile membrane with a high flux for emulsified oil/water separation, Separation and Purification Technology 184 (2017) 72-78. [89] J. Kong, K. Li, Oil removal from oil-in-water emulsions using PVDF membranes, Separation and purification technology 16(1) (1999) 83-93. [90] Q. Shi, Y. Su, W. Zhao, C. Li, Y. Hu, Z. Jiang, S. Zhu, Zwitterionic polyethersulfone ultrafiltration membrane with superior antifouling property, Journal of Membrane Science 319(1-2) (2008) 271-278. [91] Y. Yang, H. Zhang, P. Wang, Q. Zheng, J. Li, The influence of nano-sized TiO2 fillers on the morphologies and properties of PSF UF membrane, Journal of Membrane Science 288(1-2) (2007) 231-238. [92] G. Arthanareeswaran, V.M. Starov, Effect of solvents on performance of polyethersulfone ultrafiltration membranes: Investigation of metal ion separations, Desalination 267(1) (2011) 57-63. [93] C. Zhao, J. Xue, F. Ran, S. Sun, Modification of polyethersulfone membranes–a review of methods, Progress in Materials Science 58(1) (2013) 76-150. [94] W. Zhao, Y. Su, C. Li, Q. Shi, X. Ning, Z. Jiang, Fabrication of antifouling polyethersulfone ultrafiltration membranes using Pluronic F127 as both surface modifier and pore-forming agent, Journal of Membrane Science 318(1-2) (2008) 405-412. [95] C. Barth, M. Goncalves, A. Pires, J. Roeder, B. Wolf, Asymmetric polysulfone and polyethersulfone membranes: effects of thermodynamic conditions during formation on their performance, Journal of Membrane Science 169(2) (2000) 287-299. [96] K.J. Baik, J.Y. Kim, H.K. Lee, S.C. Kim, Liquid–liquid phase separation in polysulfone/polyethersulfone/N‐methyl‐2‐pyrrolidone/water quaternary system, Journal of applied polymer science 74(9) (1999) 2113-2123.

References
Page | 163
[97] J. Barzin, B. Sadatnia, Theoretical phase diagram calculation and membrane morphology evaluation for water/solvent/polyethersulfone systems, Polymer 48(6) (2007) 1620-1631. [98] N. Evenepoel, S. Wen, M. Tilahun Tsehaye, B. Van der Bruggen, Potential of DMSO as greener solvent for PES ultra‐and nanofiltration membrane preparation, Journal of Applied Polymer Science 135(28) (2018) 46494. [99] V. Moghimifar, A. Raisi, A. Aroujalian, Surface modification of polyethersulfone ultrafiltration membranes by corona plasma-assisted coating TiO2 nanoparticles, Journal of Membrane Science 461 (2014) 69-80. [100] J. Tomaschke, Interfacial composite membranes, III/Membrane Preparation (2000) 3319-3330. [101] S. Sridhar, B. Smitha, S. Mayor, B. Prathab, T. Aminabhavi, Gas permeation properties of polyamide membrane prepared by interfacial polymerization, Journal of materials science 42(22) (2007) 9392-9401. [102] U. Kalsoom, P.N. Nesterenko, B. Paull, Current and future impact of 3D printing on the separation sciences, TrAC Trends in Analytical Chemistry (2018). [103] B. Gross, S.Y. Lockwood, D.M. Spence, Recent advances in analytical chemistry by 3D printing, Analytical chemistry 89(1) (2016) 57-70. [104] T. Femmer, I. Flack, M. Wessling, Additive Manufacturing in Fluid Process Engineering, Chemie Ingenieur Technik (2016). [105] B. Wendel, D. Rietzel, F. Kühnlein, R. Feulner, G. Hülder, E. Schmachtenberg, Additive processing of polymers, Macromolecular materials and engineering 293(10) (2008) 799-809. [106] B.C. Gross, J.L. Erkal, S.Y. Lockwood, C. Chen, D.M. Spence, Evaluation of 3D printing and its potential impact on biotechnology and the chemical sciences, Analytical chemistry 86(7) (2014) 3240-3253. [107] K.V. Wong, A. Hernandez, A review of additive manufacturing, ISRN Mechanical Engineering 2012 (2012). [108] S.C. Ligon, R. Liska, J.r. Stampfl, M. Gurr, R. Mulhaupt, Polymers for 3D printing and customized additive manufacturing, Chemical reviews 117(15) (2017) 10212-10290. [109] E. Lepowsky, S. Tasoglu, 3D printing for drug manufacturing: A perspective on the future of pharmaceuticals, International Journal of Bioprinting 4(1) (2018) 119. [110] S.Y. Hong, Y.C. Kim, M. Wang, H.-I. Kim, D.-Y. Byun, J.-D. Nam, T.-W. Chou, P.M. Ajayan, L. Ci, J. Suhr, Experimental investigation of mechanical properties of UV-Curable 3D printing materials, Polymer 145 (2018) 88-94. [111] A. Camposeo, L. Persano, M. Farsari, D. Pisignano, Additive manufacturing: applications and directions in photonics and optoelectronics, Advanced optical materials 7(1) (2019) 1800419. [112] S. Waheed, J.M. Cabot, N.P. Macdonald, T. Lewis, R.M. Guijt, B. Paull, M.C. Breadmore, 3D printed microfluidic devices: enablers and barriers, Lab on a Chip 16(11) (2016) 1993-2013. [113] A. Waldbaur, H. Rapp, K. Länge, B.E. Rapp, Let there be chip—towards rapid prototyping of microfluidic devices: one-step manufacturing processes, Analytical Methods 3(12) (2011) 2681-2716. [114] R. Van Noort, The future of dental devices is digital, Dental Materials 28(1) (2012) 3-12. [115] N. Bhattacharjee, A. Urrios, S. Kang, A. Folch, The upcoming 3D-printing revolution in microfluidics, Lab on a Chip 16(10) (2016) 1720-1742.

References
Page | 164
[116] J.-Y. Lee, W.S. Tan, J. An, C.K. Chua, C.Y. Tang, A.G. Fane, T.H. Chong, The potential to enhance membrane module design with 3D printing technology, Journal of Membrane Science 499 (2016) 480-490. [117] T. Femmer, A.J. Kuehne, M. Wessling, Estimation of the structure dependent performance of 3-D rapid prototyped membranes, Chemical Engineering Journal 273 (2015) 438-445. [118] B. Guillotin, M. Ali, A. Ducom, S. Catros, V. Keriquel, A. Souquet, M. Remy, J.-C. Fricain, F. Guillemot, Laser-assisted bioprinting for tissue engineering, Biofabrication, Elsevier2013, pp. 95-118. [119] J.M. Kay, R.M. Nedderman, Fluid mechanics and transfer processes, CUP Archive1985. [120] C. de Morais Coutinho, M.C. Chiu, R.C. Basso, A.P.B. Ribeiro, L.A.G. Gonçalves, L.A. Viotto, State of art of the application of membrane technology to vegetable oils: A review, Food Research International 42(5-6) (2009) 536-550. [121] F.A. Dullien, Porous media: fluid transport and pore structure, Academic press2012. [122] I.H. Huisman, B. Dutrê, K.M. Persson, G. Trägårdh, Water permeability in ultrafiltration and microfiltration: Viscous and electroviscous effects, Desalination 113(1) (1997) 95-103. [123] A. Sagle, B. Freeman, Fundamentals of membranes for water treatment, The future of desalination in Texas 2(363) (2004) 137. [124] J. Michalov, Permeability of porous membrane, Chemical Papers 43(1) (1989) 121-130. [125] A.-S. Jönsson, G. Trägårdh, Fundamental principles of ultrafiltration, Chemical Engineering and Processing: Process Intensification 27(2) (1990) 67-81. [126] A. Fane, C. Fell, A. Waters, The relationship between membrane surface pore characteristics and flux for ultrafiltration membranes, Journal of Membrane Science 9(3) (1981) 245-262. [127] P. Apel, Track etching technique in membrane technology, Radiation Measurements 34(1-6) (2001) 559-566. [128] F. Aghili, A.A. Ghoreyshi, A. Rahimpour, M. Rahimnejad, Coating of mixed-matrix membranes with powdered activated carbon for fouling control and treatment of dairy effluent, Process Safety and Environmental Protection 107 (2017) 528-539. [129] N. Zhao, Q. Xie, L. Weng, S. Wang, X. Zhang, J. Xu, Superhydrophobic surface from vapor-induced phase separation of copolymer micellar solution, Macromolecules 38(22) (2005) 8996-8999. [130] A.K. Kota, G. Kwon, W. Choi, J.M. Mabry, A. Tuteja, Hygro-responsive membranes for effective oil–water separation, Nature communications 3 (2012) 1025. [131] S. Agarwal, V. von Arnim, T. Stegmaier, H. Planck, A. Agarwal, Role of surface wettability and roughness in emulsion separation, Separation and Purification Technology 107 (2013) 19-25. [132] A. Cherkasov, Selective ultrafiltration, Journal of membrane science 50(2) (1990) 109-130. [133] I. Cumming, R. Holdich, I. Smith, The rejection of oil by microfiltration of a stabilised kerosene/water emulsion, Journal of Membrane science 169(1) (2000) 147-155. [134] V. Singh, M. Purkait, C. Das, Cross-flow microfiltration of industrial oily wastewater: experimental and theoretical consideration, Separation Science and Technology 46(8) (2011) 1213-1223. [135] J. Mueller, Y. Cen, R.H. Davis, Crossflow microfiltration of oily water, Journal of Membrane Science 129(2) (1997) 221-235.

References
Page | 165
[136] C. Wu, A. Li, L. Li, L. Zhang, H. Wang, X. Qi, Q. Zhang, Treatment of oily water by a poly (vinyl alcohol) ultrafiltration membrane, Desalination 225(1) (2008) 312-321. [137] H. Ohya, J. Kim, A. Chinen, M. Aihara, S. Semenova, Y. Negishi, O. Mori, M. Yasuda, Effects of pore size on separation mechanisms of microfiltration of oily water, using porous glass tubular membrane, Journal of membrane science 145(1) (1998) 1-14. [138] K. Masoudnia, A. Raisi, A. Aroujalian, M. Fathizadeh, Treatment of oily wastewaters using the microfiltration process: Effect of operating parameters and membrane fouling study, Separation Science and Technology 48(10) (2013) 1544-1555. [139] S. Kumar, B. Nandi, C. Guria, A. Mandal, Oil removal from produced water by ultrafiltration using polysulfone membrane, Brazilian Journal of Chemical Engineering 34(2) (2017) 583-596. [140] C. Wu, A. Li, L. Li, L. Zhang, H. Wang, X. Qi, Q. Zhang, Treatment of oily water by a poly (vinyl alcohol) ultrafiltration membrane, Desalination 225(1-3) (2008) 312-321. [141] B. Chakrabarty, A. Ghoshal, M. Purkait, Cross-flow ultrafiltration of stable oil-in-water emulsion using polysulfone membranes, Chemical Engineering Journal 165(2) (2010) 447-456. [142] S.H. Hyun, G.T. Kim, Synthesis of ceramic microfiltration membranes for oil/water separation, Separation science and technology 32(18) (1997) 2927-2943. [143] J. Dickhout, J. Moreno, P. Biesheuvel, L. Boels, R. Lammertink, W. de Vos, Produced water treatment by membranes: A review from a colloidal perspective, Journal of colloid and interface science 487 (2017) 523-534. [144] W. Koros, Y. Ma, T. Shimidzu, Terminology for membranes and membrane processes (IUPAC Recommendations 1996), Pure and Applied Chemistry 68(7) (1996) 1479-1489. [145] D. Rana, T. Matsuura, Surface modifications for antifouling membranes, Chemical reviews 110(4) (2010) 2448-2471. [146] V. Kochkodan, D.J. Johnson, N. Hilal, Polymeric membranes: Surface modification for minimizing (bio) colloidal fouling, Advances in colloid and interface science 206 (2014) 116-140. [147] A. Nabe, E. Staude, G. Belfort, Surface modification of polysulfone ultrafiltration membranes and fouling by BSA solutions, Journal of membrane science 133(1) (1997) 57-72. [148] V. Kochkodan, D.J. Johnson, N. Hilal, Polymeric membranes: Surface modification for minimizing (bio)colloidal fouling, Advances in Colloid and Interface Science 206 (2014) 116-140. [149] P. Janknecht, A.D. Lopes, A.M. Mendes, Removal of industrial cutting oil from oil emulsions by polymeric ultra-and microfiltration membranes, Environmental science & technology 38(18) (2004) 4878-4883. [150] P.M. Williams, Membrane Roughness, Encyclopedia of Membranes (2015) 1-2. [151] Surface Roughness, 2016. http://membranes.edu.au/wiki/index.php/Surface_Roughness. [152] J.M. Dickhout, J. Moreno, P. Biesheuvel, L. Boels, R.G. Lammertink, W.M. de Vos, Produced water treatment by membranes: A review from a colloidal perspective, Journal of colloid and interface science 487 (2017) 523-534. [153] L. Jin, S.L. Ong, H.Y. Ng, Comparison of fouling characteristics in different pore-sized submerged ceramic membrane bioreactors, Water research 44(20) (2010) 5907-5918. [154] D. Johnson, D. Oatley-Radcliffe, N. Hilal, Atomic Force Microscopy (AFM), Membrane characterization, Elsevier2017, pp. 115-144. [155] M. Elimelech, X. Zhu, A.E. Childress, S. Hong, Role of membrane surface morphology in colloidal fouling of cellulose acetate and composite aromatic polyamide reverse osmosis membranes, Journal of membrane science 127(1) (1997) 101-109.

References
Page | 166
[156] E.M. Vrijenhoek, S. Hong, M. Elimelech, Influence of membrane surface properties on initial rate of colloidal fouling of reverse osmosis and nanofiltration membranes, Journal of membrane science 188(1) (2001) 115-128. [157] B. Van der Bruggen, M. Mänttäri, M. Nyström, Drawbacks of applying nanofiltration and how to avoid them: a review, Separation and Purification Technology 63(2) (2008) 251-263. [158] P.M. Williams, Membrane Charge (Zeta Potential) Effect, Encyclopedia of Membranes (2016) 1-2. [159] K. Kato, S. Sano, Y. Ikada, Protein adsorption onto ionic surfaces, Colloids and Surfaces B: Biointerfaces 4(4) (1995) 221-230. [160] A. Broeckmann, J. Busch, T. Wintgens, W. Marquardt, Modeling of pore blocking and cake layer formation in membrane filtration for wastewater treatment, Desalination 189(1-3) (2006) 97-109. [161] P. Gatenholm, C. Fell, A. Fane, Influence of the membrane structure on the composition of the deposit-layer during processing of microbial suspensions, Desalination 70(1-3) (1988) 363-378. [162] G. Van den Berg, C. Smolders, Flux decline in ultrafiltration processes, Desalination 77 (1990) 101-133. [163] R. Field, Fundamentals of fouling, Membranes for water treatment 4 (2010) 1-23. [164] S. Huang, R.H. Ras, X. Tian, Antifouling membranes for oily wastewater treatment: Interplay between wetting and membrane fouling, Current Opinion in Colloid & Interface Science (2018). [165] R. Zhang, Y. Liu, M. He, Y. Su, X. Zhao, M. Elimelech, Z. Jiang, Antifouling membranes for sustainable water purification: strategies and mechanisms, Chemical Society Reviews 45(21) (2016) 5888-5924. [166] W. Chen, Y. Su, L. Zheng, L. Wang, Z. Jiang, The improved oil/water separation performance of cellulose acetate-graft-polyacrylonitrile membranes, Journal of Membrane Science 337(1-2) (2009) 98-105. [167] J. Krizan Milic, A. Muric, I. Petrinic, M. Simonic, Recent developments in membrane treatment of spent cutting-oils: a review, Industrial & Engineering Chemistry Research 52(23) (2013) 7603-7616. [168] Y. Ding, S. Maruf, M. Aghajani, A.R. Greenberg, Surface patterning of polymeric membranes and its effect on antifouling characteristics, Separation Science and Technology 52(2) (2017) 240-257. [169] Y.K. Lee, Y.-J. Won, J.H. Yoo, K.H. Ahn, C.-H. Lee, Flow analysis and fouling on the patterned membrane surface, Journal of membrane science 427 (2013) 320-325. [170] X. Zhao, Y. Su, W. Chen, J. Peng, Z. Jiang, Grafting perfluoroalkyl groups onto polyacrylonitrile membrane surface for improved fouling release property, Journal of membrane science 415 (2012) 824-834. [171] S. Belfer, R. Fainshtain, Y. Purinson, J. Gilron, M. Nyström, M. Mänttäri, Modification of NF membrane properties by in situ redox initiated graft polymerization with hydrophilic monomers, Journal of Membrane Science 239(1) (2004) 55-64. [172] K. Yoon, K. Kim, X. Wang, D. Fang, B.S. Hsiao, B. Chu, High flux ultrafiltration membranes based on electrospun nanofibrous PAN scaffolds and chitosan coating, Polymer 47(7) (2006) 2434-2441. [173] Y. Peng, Z. Guo, Recent advances in biomimetic thin membranes applied in emulsified oil/water separation, Journal of Materials Chemistry A 4(41) (2016) 15749-15770. [174] M. Liu, J. Li, Z. Guo, Polyaniline coated membranes for effective separation of oil-in-water emulsions, Journal of colloid and interface science 467 (2016) 261-270.

References
Page | 167
[175] D.-G. Kim, H. Kang, S. Han, H.J. Kim, J.-C. Lee, Bio-and oil-fouling resistance of ultrafiltration membranes controlled by star-shaped block and random copolymer coatings, RSC Advances 3(39) (2013) 18071-18081. [176] E. Yuliwati, A.F. Ismail, Effect of additives concentration on the surface properties and performance of PVDF ultrafiltration membranes for refinery produced wastewater treatment, Desalination 273(1) (2011) 226-234. [177] S.P. Nunes, K.V. Peinemann, Ultrafiltration membranes from PVDF/PMMA blends, Journal of Membrane Science 73(1) (1992) 25-35. [178] N. Ochoa, M. Masuelli, J. Marchese, Effect of hydrophilicity on fouling of an emulsified oil wastewater with PVDF/PMMA membranes, Journal of Membrane Science 226(1-2) (2003) 203-211. [179] A. Mansourizadeh, A.J. Azad, Preparation of blend polyethersulfone/cellulose acetate/polyethylene glycol asymmetric membranes for oil–water separation, Journal of Polymer Research 21(3) (2014) 375. [180] S. Shen, K. Liu, J. Yang, Y. Li, R. Bai, X. Zhou, Application of a triblock copolymer additive modified polyvinylidene fluoride membrane for effective oil/water separation, Royal Society open science 5(5) (2018) 171979. [181] A. Ahmad, M. Majid, B. Ooi, Functionalized PSf/SiO2 nanocomposite membrane for oil-in-water emulsion separation, Desalination 268(1-3) (2011) 266-269. [182] R.J. Gohari, F. Korminouri, W. Lau, A. Ismail, T. Matsuura, M. Chowdhury, E. Halakoo, M.J. Gohari, A novel super-hydrophilic PSf/HAO nanocomposite ultrafiltration membrane for efficient separation of oil/water emulsion, Separation and purification technology 150 (2015) 13-20. [183] V. Moghimifar, A.E. Livari, A. Raisi, A. Aroujalian, Enhancing the antifouling property of polyethersulfone ultrafiltration membranes using NaX zeolite and titanium oxide nanoparticles, Rsc Advances 5(69) (2015) 55964-55976. [184] A. Pagidi, R. Saranya, G. Arthanareeswaran, A. Ismail, T. Matsuura, Enhanced oil–water separation using polysulfone membranes modified with polymeric additives, Desalination 344 (2014) 280-288. [185] J. Prince, S. Bhuvana, V. Anbharasi, N. Ayyanar, K. Boodhoo, G. Singh, Ultra-wetting graphene-based PES ultrafiltration membrane–a novel approach for successful oil-water separation, Water research 103 (2016) 311-318. [186] J.B. Melbiah, D. Nithya, D. Mohan, Surface modification of polyacrylonitrile ultrafiltration membranes using amphiphilic Pluronic F127/CaCO3 nanoparticles for oil/water emulsion separation, Colloids and Surfaces A: Physicochemical and Engineering Aspects 516 (2017) 147-160. [187] P. Culfaz, M. Haddad, M. Wessling, R. Lammertink, Fouling behavior of microstructured hollow fibers in cross-flow filtrations: Critical flux determination and direct visual observation of particle deposition, Journal of membrane science 372(1) (2011) 210-218. [188] A.M. Peters, R.G. Lammertink, M. Wessling, Comparing flat and micro-patterned surfaces: Gas permeation and tensile stress measurements, Journal of membrane science 320(1-2) (2008) 173-178. [189] R.J. Gohari, W. Lau, T. Matsuura, A. Ismail, Effect of surface pattern formation on membrane fouling and its control in phase inversion process, Journal of membrane science 446 (2013) 326-331. [190] O. Heinz, M. Aghajani, A.R. Greenberg, Y. Ding, Surface-patterning of polymeric membranes: fabrication and performance, Current Opinion in Chemical Engineering 20 (2018) 1-12.

References
Page | 168
[191] S.H. Maruf, L. Wang, A.R. Greenberg, J. Pellegrino, Y. Ding, Use of nanoimprinted surface patterns to mitigate colloidal deposition on ultrafiltration membranes, Journal of membrane science 428 (2013) 598-607. [192] M. Xie, W. Luo, S.R. Gray, Surface pattern by nanoimprint for membrane fouling mitigation: Design, performance and mechanisms, Water research 124 (2017) 238-243. [193] D.-C. Choi, S.-Y. Jung, Y.-J. Won, J.H. Jang, J.-W. Lee, H.-R. Chae, J. Lim, K.H. Ahn, S. Lee, J.-H. Kim, Effect of Pattern Shape on the Initial Deposition of Particles in the Aqueous Phase on Patterned Membranes during Crossflow Filtration, Environmental Science & Technology Letters 4(2) (2017) 66-70. [194] S.Y. Jung, Y.-J. Won, J.H. Jang, J.H. Yoo, K.H. Ahn, C.-H. Lee, Particle deposition on the patterned membrane surface: Simulation and experiments, Desalination 370 (2015) 17-24. [195] I. Kim, D.-C. Choi, J. Lee, H.-R. Chae, J.H. Jang, C.-H. Lee, P.-K. Park, Y.-J. Won, Preparation and application of patterned hollow-fiber membranes to membrane bioreactor for wastewater treatment, Journal of membrane science 490 (2015) 190-196. [196] K. Huang, B. Wang, S. Guo, K. Li, Micropatterned Ultrathin MOF Membranes with Enhanced Molecular Sieving Property, Angewandte Chemie International Edition 57(42) (2018) 13892-13896. [197] W. Choi, C. Lee, Y.J. Won, D. Lee, G.W. Lee, M.G. Shin, B. Chun, T.-S. Kim, H.-D. Park, H.W. Jung, Sharkskin-mimetic desalination membranes with ultralow biofouling, Journal of Materials Chemistry A (2018). [198] D.-C. Choi, S.-Y. Jung, Y.-J. Won, J.H. Jang, J. Lee, H.-R. Chae, K.H. Ahn, S. Lee, P.-K. Park, C.-H. Lee, Three-dimensional hydraulic modeling of particle deposition on the patterned isopore membrane in crossflow microfiltration, Journal of Membrane Science 492 (2015) 156-163. [199] R. Vasudevan, A.J. Kennedy, M. Merritt, F.H. Crocker, R.H. Baney, Microscale patterned surfaces reduce bacterial fouling-microscopic and theoretical analysis, Colloids and Surfaces B: Biointerfaces 117 (2014) 225-232. [200] A.C. Engineering, H. Way, B. Forum, D. DT11, The treatment of oily water by coalescing, Filtration & Separation 29(4) (1992) 295-300. [201] M. Hlavacek, Break-up of oil-in-water emulsions induced by permeation through a microfiltration membrane, Journal of membrane science 102 (1995) 1-7. [202] M. Kukizaki, M. Goto, Demulsification of water-in-oil emulsions by permeation through Shirasu-porous-glass (SPG) membranes, Journal of Membrane Science 322(1) (2008) 196-203. [203] X. Li, D. Hu, L. Cao, C. Yang, Sensitivity of coalescence separation of oil–water emulsions using stainless steel felt enabled by LBL self-assembly and CVD, RSC Advances 5(87) (2015) 71345-71354. [204] N. Kocherginsky, C.L. Tan, W.F. Lu, Demulsification of water-in-oil emulsions via filtration through a hydrophilic polymer membrane, Journal of membrane science 220(1) (2003) 117-128. [205] A. Hong, A. Fane, R. Burford, Factors affecting membrane coalescence of stable oil-in-water emulsions, Journal of membrane science 222(1) (2003) 19-39. [206] N.M.K. Wen-Feng L., Cui-Xin Z., Min-qing Z, A novel method of breaking water in oil emulsions by using microporous membrane, Transactions of Tianjin University 7 7(3) (2001). [207] T. Kawakatsu, R.M. Boom, H. Nabetani, Y. Kikuchi, M. Nakajima, Emulsion breakdown: mechanisms and development of multilayer membrane, AIChE journal 45(5) (1999) 967-975. [208] D. Sun, X. Duan, W. Li, D. Zhou, Demulsification of water-in-oil emulsion by using porous glass membrane, Journal of membrane science 146(1) (1998) 65-72.

References
Page | 169
[209] W. Meon, W. Rommel, E. Blass, Plate separators for dispersed liquid—liquid systems: hydrodynamic coalescence model, Chemical engineering science 48(1) (1993) 159-168. [210] K.R. Mecke, D. Stoyan, Morphology of condensed matter: physics and geometry of spatially complex systems, Springer2008. [211] K. Larsson, Cubic lipid-water phases: structures and biomembrane aspects, The Journal of Physical Chemistry 93(21) (1989) 7304-7314. [212] K. MONKOVA, P. MONKA, I. ZETKOVA, P. HANZL, D. MANDULAK, Three approaches to the gyroid structure modelling as a base of lightweight component produced by additive technology, DEStech Transactions on Computer Science and Engineering (cmsam) (2017). [213] Membranes and Membrane Separation Processes, Ullmann's Encyclopedia of Industrial Chemistry. [214] P.H. Duong, T.-S. Chung, Application of thin film composite membranes with forward osmosis technology for the separation of emulsified oil–water, Journal of Membrane Science 452 (2014) 117-126. [215] A. Al-Shimmery, S. Mazinani, J. Ji, Y.J. Chew, D. Mattia, 3D printed composite membranes with enhanced anti-fouling behaviour, Journal of Membrane Science 574 (2019) 76-85. [216] M.P. Chae, W.M. Rozen, P.G. McMenamin, M.W. Findlay, R.T. Spychal, D.J. Hunter-Smith, Emerging applications of bedside 3D printing in plastic surgery, Frontiers in surgery 2 (2015). [217] E. Sachs, M. Cima, J. Cornie, Three-dimensional printing: rapid tooling and prototypes directly from a CAD model, CIRP Annals-Manufacturing Technology 39(1) (1990) 201-204. [218] D. Dimitrov, K. Schreve, N. De Beer, Advances in three dimensional printing-state of the art and future perspectives, Rapid Prototyping Journal 12(3) (2006) 136-147. [219] C.M.B. Ho, S.H. Ng, K.H.H. Li, Y.-J. Yoon, 3D printed microfluidics for biological applications, Lab on a Chip 15(18) (2015) 3627-3637. [220] P.J. Kitson, S. Glatzel, W. Chen, C.-G. Lin, Y.-F. Song, L. Cronin, 3D printing of versatile reactionware for chemical synthesis, Nature protocols 11(5) (2016) 920-936. [221] J. Garcia, Z. Yang, R. Mongrain, R.L. Leask, K. Lachapelle, 3D printing materials and their use in medical education: a review of current technology and trends for the future, BMJ Simulation and Technology Enhanced Learning 4(1) (2018) 27-40. [222] J.Z. Gul, M. Sajid, M.M. Rehman, G.U. Siddiqui, I. Shah, K.-H. Kim, J.-W. Lee, K.H. Choi, 3D printing for soft robotics–a review, Science and technology of advanced materials 19(1) (2018) 243-262. [223] Y. Lee, J. Han, B. Choi, J. Yoon, J. Park, Y. Kim, J. Lee, D.H. Kim, D.M. Kim, M. Lim, Three-Dimensionally Printed Microelectromechanical Switches, ACS applied materials & interfaces (2018). [224] J. Sun, Z. Peng, L. Yan, J.Y.H. Fuh, G.S. Hong, 3D food printing–an innovative way of mass customization in food fabrication, International Journal of Bioprinting 1(1) (2015). [225] U. Kalsoom, C.K. Hasan, L. Tedone, C. Desire, F. Li, M.C. Breadmore, P.N. Nesterenko, B. Paull, Low-cost passive sampling device with integrated porous membrane produced using multimaterial 3D printing, Analytical chemistry 90(20) (2018) 12081-12089. [226] T. Femmer, A.J. Kuehne, J. Torres-Rendon, A. Walther, M. Wessling, Print your membrane: Rapid prototyping of complex 3D-PDMS membranes via a sacrificial resist, Journal of Membrane Science 478 (2015) 12-18. [227] P. Gao, A.J. Hunter, S. Benavides, M.J. Summe, F. Gao, W.A. Phillip, Template Synthesis of Nanostructured Polymeric Membranes by Inkjet Printing, ACS applied materials & interfaces (2016). [228] S. Yuan, D. Strobbe, J.-P. Kruth, P. Van Puyvelde, B. Van der Bruggen, Super-hydrophobic 3D printed polysulfone membranes with a switchable wettability by self-

References
Page | 170
assembled candle soot for efficient gravity-driven oil/water separation, Journal of Materials Chemistry A 5(48) (2017) 25401-25409. [229] S. Yuan, D. Strobbe, J.-P. Kruth, P. Van Puyvelde, B. Van der Bruggen, Production of polyamide-12 membranes for microfiltration through selective laser sintering, Journal of Membrane Science 525 (2017) 157-162. [230] printspace, Using OpenSCAD for 3D Printing, 2015, August 21. https://printspace.freshdesk.com/support/solutions/articles/5000544004-using-openscad-for-3d-printing. [231] printspace, Circular Parts : Using Loops, Modules, and Conditions In OpenSCAD, 2015, August 21. https://printspace.freshdesk.com/support/solutions/articles/5000544903-circular-parts-using-loops-modules-and-conditions-in-openscad. [232] F.P. Melchels, J. Feijen, D.W. Grijpma, A review on stereolithography and its applications in biomedical engineering, Biomaterials 31(24) (2010) 6121-6130. [233] Y.J. Chew, W. Paterson, D. Wilson, Fluid dynamic gauging: a new tool to study deposition on porous surfaces, Journal of Membrane Science 296(1-2) (2007) 29-41. [234] C. Fee, S. Nawada, S. Dimartino, 3D printed porous media columns with fine control of column packing morphology, Journal of Chromatography A 1333 (2014) 18-24. [235] Y. Chen, C. Ng, Y. Wang, Generation of an STL file from 3D measurement data with user-controlled data reduction, The international journal of advanced manufacturing technology 15(2) (1999) 127-131. [236] Wikipedia, STL (file format), 2019, April 11. https://en.wikipedia.org/wiki/STL_(file_format). [237] J. Taheri-Shakib, A. Shekarifard, H. Naderi, Characterization of the wax precipitation in Iranian crude oil based on Wax Appearance Temperature (WAT): Part 1. The influence of electromagnetic waves, Journal of Petroleum Science and Engineering 161 (2018) 530-540. [238] C.F. Berg, Permeability description by characteristic length, tortuosity, constriction and porosity, Transport in porous media 103(3) (2014) 381-400. [239] Z. Chu, S. Seeger, Multifunctional Hybrid Porous Micro‐/Nanocomposite Materials, Advanced Materials 27(47) (2015) 7775-7781. [240] D.S. Sholl, R.P. Lively, Seven chemical separations to change the world, Nature, 2016, pp. 435-437. [241] Y. Wei, H. Qi, X. Gong, S. Zhao, Specially Wettable Membranes for Oil–Water Separation, Advanced Materials Interfaces 0(0) 1800576. [242] H.J. Tanudjaja, V.V. Tarabara, A.G. Fane, J.W. Chew, Effect of cross-flow velocity, oil concentration and salinity on the critical flux of an oil-in-water emulsion in microfiltration, Journal of Membrane Science 530 (2017) 11-19. [243] M. Padaki, R. Surya Murali, M.S. Abdullah, N. Misdan, A. Moslehyani, M.A. Kassim, N. Hilal, A.F. Ismail, Membrane technology enhancement in oil–water separation. A review, Desalination 357 (2015) 197-207. [244] S. Kasemset, A. Lee, D.J. Miller, B.D. Freeman, M.M. Sharma, Effect of polydopamine deposition conditions on fouling resistance, physical properties, and permeation properties of reverse osmosis membranes in oil/water separation, Journal of Membrane Science 425-426 (2013) 208-216. [245] I.W. Cumming, R.G. Holdich, I.D. Smith, The rejection of oil by microfiltration of a stabilised kerosene/water emulsion, Journal of Membrane Science 169(1) (2000) 147-155. [246] R. Zolfaghari, A. Fakhru’l-Razi, L.C. Abdullah, S.S. Elnashaie, A. Pendashteh, Demulsification techniques of water-in-oil and oil-in-water emulsions in petroleum industry, Separation and Purification Technology 170 (2016) 377-407.

References
Page | 171
[247] W. Choi, E.P. Chan, J.-H. Park, W.-G. Ahn, H.W. Jung, S. Hong, J.S. Lee, J.-Y. Han, S. Park, D.-H. Ko, Nanoscale pillar-enhanced tribological surfaces as antifouling membranes, ACS applied materials & interfaces 8(45) (2016) 31433-31441. [248] J.W. Bae, Y.-H. Cho, Y.-E. Sung, K. Shin, J.Y. Jho, Performance enhancement of polymer electrolyte membrane fuel cell by employing line-patterned Nafion membrane, Journal of Industrial and Engineering Chemistry 18(3) (2012) 876-879. [249] L. Vogelaar, J.N. Barsema, C.J. van Rijn, W. Nijdam, M. Wessling, Phase separation micromolding—PSμM, Advanced materials 15(16) (2003) 1385-1389. [250] Y.-J. Won, S.-Y. Jung, J.-H. Jang, J.-W. Lee, H.-R. Chae, D.-C. Choi, K.H. Ahn, C.-H. Lee, P.-K. Park, Correlation of membrane fouling with topography of patterned membranes for water treatment, Journal of Membrane Science 498 (2016) 14-19. [251] S. Badalov, Y. Oren, C.J. Arnusch, Ink-jet printing assisted fabrication of patterned thin film composite membranes, Journal of Membrane Science 493 (2015) 508-514. [252] N.C. Wardrip, M. Dsouza, M. Urgun-Demirtas, S.W. Snyder, J.A. Gilbert, C.J. Arnusch, Printing-Assisted Surface Modifications of Patterned Ultrafiltration Membranes, ACS Applied Materials & Interfaces 8(44) (2016) 30271-30280. [253] Y.M.J. Chew, W.R. Paterson, D.I. Wilson, Fluid dynamic gauging: A new tool to study deposition on porous surfaces, Journal of Membrane Science 296(1) (2007) 29-41. [254] B. Saini, M.K. Sinha, S.K. Dash, Mitigation of HA, BSA and oil/water emulsion fouling of PVDF Ultrafiltration Membranes by SiO2-g-PEGMA nanoparticles, Journal of Water Process Engineering (2018). [255] R. Pal, Techniques for measuring the composition (oil and water content) of emulsions—a state of the art review, Colloids and Surfaces A: Physicochemical and Engineering Aspects 84(2) (1994) 141-193. [256] I. Sadeghi, A. Aroujalian, A. Raisi, B. Dabir, M. Fathizadeh, Surface modification of polyethersulfone ultrafiltration membranes by corona air plasma for separation of oil/water emulsions, Journal of membrane science 430 (2013) 24-36. [257] R. Jamshidi Gohari, E. Halakoo, W.J. Lau, M.A. Kassim, T. Matsuura, A.F. Ismail, Novel polyethersulfone (PES)/hydrous manganese dioxide (HMO) mixed matrix membranes with improved anti-fouling properties for oily wastewater treatment process, RSC Advances 4(34) (2014) 17587-17596. [258] G. Zhang, J. Jiang, Q. Zhang, X. Zhan, F. Chen, Amphiphilic poly (ether sulfone) membranes for oil/water separation: Effect of sequence structure of the modifier, AIChE Journal 63(2) (2017) 739-750. [259] H. Yamamura, K. Kimura, Y. Watanabe, Mechanism involved in the evolution of physically irreversible fouling in microfiltration and ultrafiltration membranes used for drinking water treatment, Environmental science & technology 41(19) (2007) 6789-6794. [260] Z. Wang, J. Ma, C.Y. Tang, K. Kimura, Q. Wang, X. Han, Membrane cleaning in membrane bioreactors: a review, Journal of membrane science 468 (2014) 276-307. [261] S.S. Madaeni, T. Mohamamdi, M.K. Moghadam, Chemical cleaning of reverse osmosis membranes, Desalination 134(1-3) (2001) 77-82. [262] R.J. Gohari, E. Halakoo, W.J. Lau, M.A. Kassim, T. Matsuura, A.F. Ismail, Novel polyethersulfone (PES)/hydrous manganese dioxide (HMO) mixed matrix membranes with improved anti-fouling properties for oily wastewater treatment process, RSC Advances 4(34) (2014) 17587-17596. [263] J. Yin, J. Zhou, Novel polyethersulfone hybrid ultrafiltration membrane prepared with SiO2-g-(PDMAEMA-co-PDMAPS) and its antifouling performances in oil-in-water emulsion application, Desalination 365 (2015) 46-56. [264] Y.-F. Zhao, P.-B. Zhang, J. Sun, C.-J. Liu, Z. Yi, L.-P. Zhu, Y.-Y. Xu, Versatile antifouling polyethersulfone filtration membranes modified via surface grafting of zwitterionic

References
Page | 172
polymers from a reactive amphiphilic copolymer additive, Journal of colloid and interface science 448 (2015) 380-388. [265] X. Ma, Y. Su, Q. Sun, Y. Wang, Z. Jiang, Enhancing the antifouling property of polyethersulfone ultrafiltration membranes through surface adsorption-crosslinking of poly (vinyl alcohol), Journal of Membrane Science 300(1-2) (2007) 71-78. [266] J. Li, Y. Gu, Coalescence of oil-in-water emulsions in fibrous and granular beds, Separation and Purification Technology 42(1) (2005) 1-13. [267] Y. Mino, Y. Kagawa, T. Ishigami, H. Matsuyama, Numerical simulation of coalescence phenomena of oil-in-water emulsions permeating through straight membrane pore, Colloids and Surfaces A: Physicochemical and Engineering Aspects 491 (2016) 70-77. [268] Y. Si, Q. Fu, X. Wang, J. Zhu, J. Yu, G. Sun, B. Ding, Superelastic and superhydrophobic nanofiber-assembled cellular aerogels for effective separation of oil/water emulsions, ACS nano 9(4) (2015) 3791-3799. [269] A.C. Hong, A.G. Fane, R.P. Burford, The effects of intermittent permeate flow and crossflow on membrane coalescence of oil-in-water emulsions, Desalination 144(1) (2002) 185-191. [270] A. Al-Shimmery, S. Mazinani, J. Ji, Y.M.J. Chew, D. Mattia, 3D printed composite membranes with enhanced anti-fouling behaviour, Journal of Membrane Science 574 (2019) 76-85. [271] N. Sreedhar, N. Thomas, O. Al-Ketan, R. Rowshan, H. Hernandez, R.K.A. Al-Rub, H.A. Arafat, 3D printed feed spacers based on triply periodic minimal surfaces for flux enhancement and biofouling mitigation in RO and UF, Desalination 425 (2018) 12-21. [272] N. Sreedhar, N. Thomas, O. Al-Ketan, R. Rowshan, H.H. Hernandez, R.K.A. Al-Rub, H.A. Arafat, Mass transfer analysis of ultrafiltration using spacers based on triply periodic minimal surfaces: Effects of spacer design, directionality and voidage, Journal of Membrane Science 561 (2018) 89-98. [273] T. Femmer, A.J. Kuehne, M. Wessling, Print your own membrane: direct rapid prototyping of polydimethylsiloxane, Lab on a Chip 14(15) (2014) 2610-2613. [274] P.J. Gandy, S. Bardhan, A.L. Mackay, J. Klinowski, Nodal surface approximations to the P, G, D and I-WP triply periodic minimal surfaces, Chemical physics letters 336(3) (2001) 187-195. [275] E.A. Lord, A.L. Mackay, Periodic minimal surfaces of cubic symmetry, Current Science (2003) 346-362. [276] Y. Deng, M. Mieczkowski, Three-dimensional periodic cubic membrane structure in the mitochondria of amoebaeChaos carolinensis, Protoplasma 203(1-2) (1998) 16-25. [277] S. Nawada, S. Dimartino, C. Fee, Dispersion behavior of 3D-printed columns with homogeneous microstructures comprising differing element shapes, Chemical Engineering Science 164 (2017) 90-98. [278] L. Li, L. Schulte, L.D. Clausen, K.M. Hansen, G.E. Jonsson, S. Ndoni, Gyroid nanoporous membranes with tunable permeability, ACS nano 5(10) (2011) 7754-7766. [279] Y. Jung, S. Torquato, Fluid permeabilities of triply periodic minimal surfaces, Physical Review E 72(5) (2005) 056319. [280] U. Daiminger, W. Nitsch, P. Plucinski, S. Hoffmann, Novel techniques for iol/water separation, Journal of membrane science 99(2) (1995) 197-203. [281] S. Hoffmann, W. Nitsch, Membrane Coalescence for Phase Separation of Oil‐in‐Water Emulsions Stabilized by Surfactants and Dispersed into Smallest Droplets, Chemical engineering & technology 24(1) (2001) 22-27. [282] Z.L. Kiss, L. Talpas, Z. Seres, S. Beszédes, C. Hodúr, Z. László, Treatment of model oily waste water by microfiltration, Periodica Polytechnica. Chemical Engineering 57(1-2) (2013) 21.

References
Page | 173
[283] C. Chiam, M. Nurashiqin, K. Zykamilia, N. Ismail, K. Duduku, S. Rosalam, Coalescence of Oil Droplets using Sponge-like Structure of Polyvinylidene Fluoride Membranes, Journal of Applied Membrane Science & Technology 23(1) (2019). [284] G. Han, S.S. Chan, T.-S. Chung, Forward osmosis (FO) for water reclamation from emulsified oil/water solutions: effects of membrane and emulsion characteristics, ACS Sustainable Chemistry & Engineering 4(9) (2016) 5021-5032. [285] T.Y. Cath, A.E. Childress, M. Elimelech, Forward osmosis: principles, applications, and recent developments, Journal of membrane science 281(1) (2006) 70-87.