Embed Size (px)
Citation preview

3D Urban Mapping: From Pretty Pictures to 3D GIS An Esri® White Paper December 2014

Copyright © 2014 Esri All rights reserved. Printed in the United States of America. The information contained in this document is the exclusive property of Esri. This work is protected under United States copyright law and other international copyright treaties and conventions. No part of this work may be reproduced or transmitted in any form or by any means, electronic or mechanical, including photocopying and recording, or by any information storage or retrieval system, except as expressly permitted in writing by Esri. All requests should be sent to Attention: Contracts and Legal Services Manager, Esri, 380 New York Street, Redlands, CA 92373-8100 USA. The information contained in this document is subject to change without notice. Esri, the Esri globe logo, ArcGIS, CityEngine, ArcGlobe, ArcScene, esri.com, and @esri.com are trademarks, service marks, or registered marks of Esri in the United States, the European Community, or certain other jurisdictions. CityEngine is a registered trademark of Procedural AG and is distributed under license by Esri. Other companies and products or services mentioned herein may be trademarks, service marks, or registered marks of their respective mark owners.

J10269
Esri White Paper i
3D Urban Mapping: From Pretty Pictures to 3D GIS
An Esri White Paper Contents Page
The Dawn of 3D Urban Mapping ................................................................1
Introduction ..................................................................................................1
The History of GIS Data ..............................................................................2
The 3D Mapping Landscape ........................................................................2
Data Sources for 3D Urban Mapping ..........................................................3
Creating Models ...........................................................................................4
Building or Buying Models .........................................................................6
Storing Building Models ..............................................................................6 Applications for 3D Urban Maps ...........................................................7 Case Study: Hawaiian Islands ................................................................8 Case Study: City of Portland ...............................................................10
Summary ....................................................................................................11 Appendix Appendix A: Workflow to Create a Simple 3D City ............................ 12


J10269
Esri White Paper 1
3D Urban Mapping: From Pretty Pictures to 3D GIS
The Dawn of 3D Urban Mapping
The world of urban mapping is changing rapidly. Just a few years ago, it was sufficient to have your city charted in only two dimensions, with features such as roads or building footprints known only in the x/y. However, the reality is the world exists in three dimensions, where roads go up and down and hills and buildings have shapes, heights, volumes, and complex interior infrastructure. Today's urban planners are now challenged to map, understand, and analyze their cities in three dimensions. Many 3D applications, such as building shadowing or storm water runoff studies, are becoming more common. Before any organization can begin the transition to 3D GIS, several key questions need to be answered. The first is probably, "What are the primary applications requiring 3D and who are the users?" Second, "What toolsets and workflows are available to convert existing 2D GIS data to 3D?" And finally, "What will the costs be and what benefits are likely to be achieved?" Once the decision to convert from a 2D to 3D GIS is made, numerous valuable applications become possible, from realistic visualizations to more comprehensive city planning activities such as flood modeling or the visibility impacts of new development. If done correctly, the transition to 3D urban mapping will extend the value, investment, and life span of existing 2D GIS data. With a significant amount of time and money invested creating and maintaining geographic information system (GIS) databases over the past 20 or 30 years, leveraging this vast amount of information is highly desirable as an enterprise moves into the 3D environment. Fortunately, with proper planning, the vast majority of the existing GIS can be utilized going forward.
Introduction One of the most important concepts to be knowledgeable of when planning the development of 3D urban maps is that very different types of maps can be designed and created, often dependent on the intended application requirements and how they will be utilized. Some 3D maps and the associated building models are no more than photo-realistic images of buildings within a geographic area and are, therefore, limited to providing users with the ability to picture how a specific section of a city looks. This can be great for a handful of simple visualization applications but is inadequate for performing many types of 3D spatial analysis. Another possibility is the creation of robust 3D building models, which may not be as visually attractive as the photo-realistic variety but have the ability to be strongly attributed, enabling a variety of GIS analytics to be performed. The 3D urban map and associated building models are enabling the convergence of several established disciplines, including engineering computer-aided drafting (CAD), architectural building information management (BIM), and GIS. A single 3D urban map can now contain detailed building specifications, representations of the physical and

3D Urban Mapping: From Pretty Pictures to 3D GIS
J10269
December 2014 2
functional characteristics of a facility, all tied to a 3D geographic location. This collective urban map, if fully built and attributed, enables a high degree of understanding of the complete urban environment and facilitates an enhanced ability to plan and manage events while providing solid decision making. However, even if partially complete, 3D maps with key attributes enable significant advances over traditional 2D applications. This white paper will provide some background on various types of 3D urban mapping, explore several different approaches to creating a 3D urban map, and examine a number of potential applications. Finally, two case studies will be presented demonstrating how organizations are starting to take advantage of new opportunities enabled with a 3D urban map.
The History of GIS Data
The primary source of the majority of the vector data found in today's GIS databases is imagery, which was used primarily as a backdrop for digitizing. Whether captured from aerial photography or possibly scenes taken from satellites, layers such as building footprints, roads, and terrain were extracted and the imagery often discarded. The result has been a 2D flat representation of geospatial objects, which, although providing a wealth of information, falls short of the rich, 3D perspective more closely matching reality. However, recent technological advances have greatly improved the capability to efficiently extract 3D data from imagery, providing a new source for constructing building models or accurately determining the terrain. These improvements, often referred to as 3D intelligent images, are propelling advances in 3D GIS mapping and driving significant changes throughout the industry.
The 3D Mapping Landscape
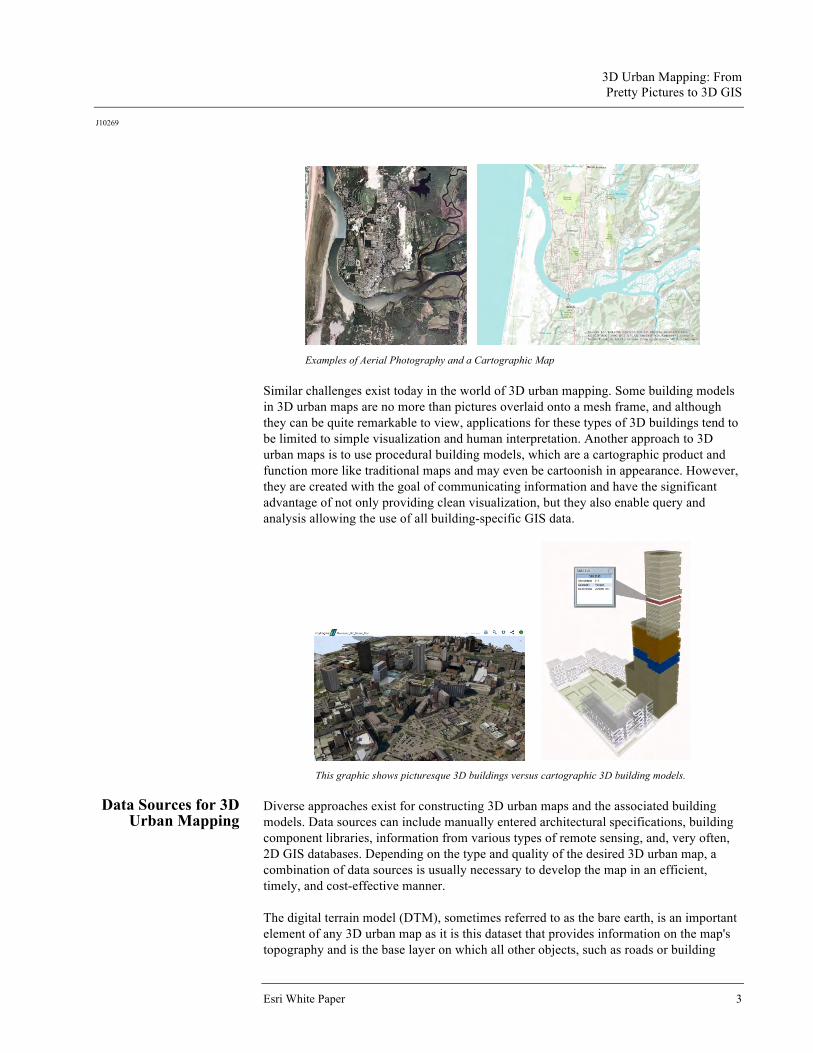
As is so often the case with emerging technologies, several different techniques have been developed and deployed to create and represent an urban landscape in three dimensions. Some methods can quickly construct photo-realistic buildings but have limited use due to their lack of spatial accuracy or detail. Other approaches rely on accurately constructing each building model individually, which can often make sense when representing a city's important "hero buildings," but this methodology becomes nearly impossible to implement if the goal is to build out a city of 20,000 or more structures. A third alternative often relies on high-resolution remote-sensing data, such as imagery or lidar, to define each building's height, volume, and location and often some automation to make the creation of large cities realistic and possible. To better understand the similarities and differences between the various approaches to 3D urban mapping, it is helpful to review some of the differences between an aerial photograph and a traditional 2D cartographic map. While the aerial photograph is a true picture and may be quite beautiful and realistic looking, it is only possible for the photograph to convey a limited amount of information. The cartographic map, on the other hand, which although somewhat cartoonish looking and not necessarily realistic in many aspects, can be designed to communicate a considerable amount of useful information such as road names, zoning, or cultural boundaries such as city limits.
3D Urban Mapping: From Pretty Pictures to 3D GIS
J10269
Esri White Paper 3
Examples of Aerial Photography and a Cartographic Map
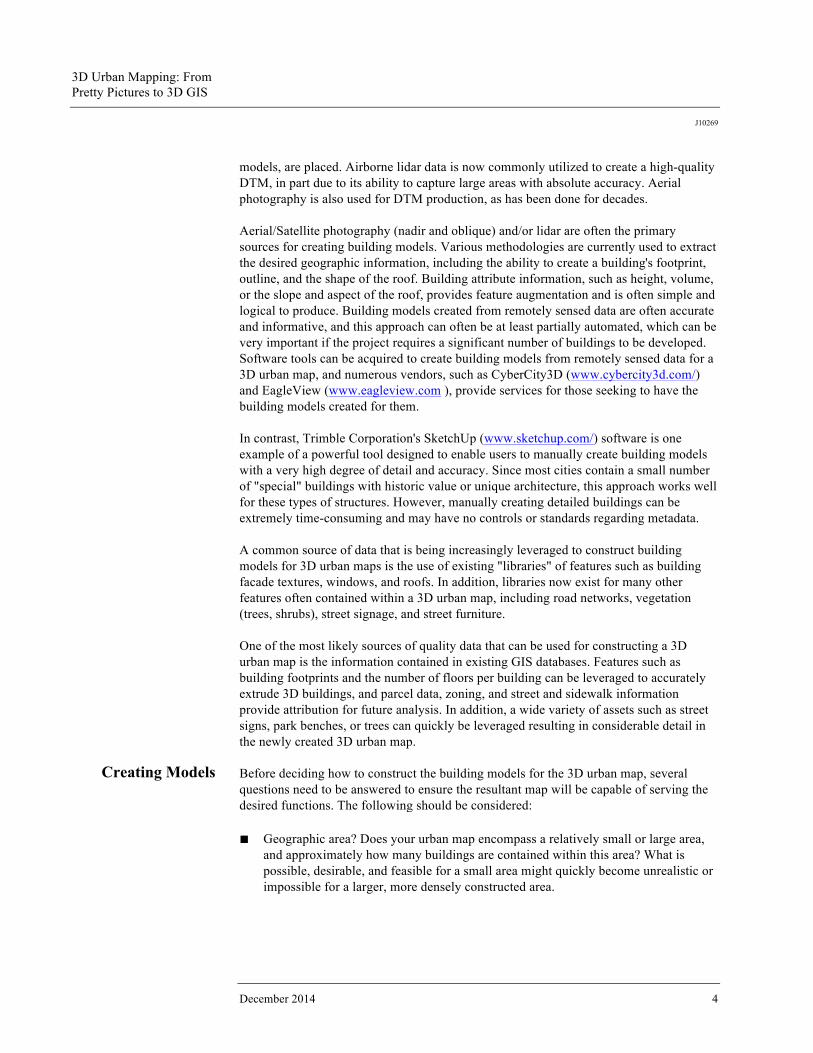
Similar challenges exist today in the world of 3D urban mapping. Some building models in 3D urban maps are no more than pictures overlaid onto a mesh frame, and although they can be quite remarkable to view, applications for these types of 3D buildings tend to be limited to simple visualization and human interpretation. Another approach to 3D urban maps is to use procedural building models, which are a cartographic product and function more like traditional maps and may even be cartoonish in appearance. However, they are created with the goal of communicating information and have the significant advantage of not only providing clean visualization, but they also enable query and analysis allowing the use of all building-specific GIS data.
This graphic shows picturesque 3D buildings versus cartographic 3D building models.
Data Sources for 3D
Urban Mapping Diverse approaches exist for constructing 3D urban maps and the associated building models. Data sources can include manually entered architectural specifications, building component libraries, information from various types of remote sensing, and, very often, 2D GIS databases. Depending on the type and quality of the desired 3D urban map, a combination of data sources is usually necessary to develop the map in an efficient, timely, and cost-effective manner. The digital terrain model (DTM), sometimes referred to as the bare earth, is an important element of any 3D urban map as it is this dataset that provides information on the map's topography and is the base layer on which all other objects, such as roads or building
3D Urban Mapping: From Pretty Pictures to 3D GIS
J10269
December 2014 4
models, are placed. Airborne lidar data is now commonly utilized to create a high-quality DTM, in part due to its ability to capture large areas with absolute accuracy. Aerial photography is also used for DTM production, as has been done for decades. Aerial/Satellite photography (nadir and oblique) and/or lidar are often the primary sources for creating building models. Various methodologies are currently used to extract the desired geographic information, including the ability to create a building's footprint, outline, and the shape of the roof. Building attribute information, such as height, volume, or the slope and aspect of the roof, provides feature augmentation and is often simple and logical to produce. Building models created from remotely sensed data are often accurate and informative, and this approach can often be at least partially automated, which can be very important if the project requires a significant number of buildings to be developed. Software tools can be acquired to create building models from remotely sensed data for a 3D urban map, and numerous vendors, such as CyberCity3D (www.cybercity3d.com/) and EagleView (www.eagleview.com ), provide services for those seeking to have the building models created for them. In contrast, Trimble Corporation's SketchUp (www.sketchup.com/) software is one example of a powerful tool designed to enable users to manually create building models with a very high degree of detail and accuracy. Since most cities contain a small number of "special" buildings with historic value or unique architecture, this approach works well for these types of structures. However, manually creating detailed buildings can be extremely time-consuming and may have no controls or standards regarding metadata. A common source of data that is being increasingly leveraged to construct building models for 3D urban maps is the use of existing "libraries" of features such as building facade textures, windows, and roofs. In addition, libraries now exist for many other features often contained within a 3D urban map, including road networks, vegetation (trees, shrubs), street signage, and street furniture. One of the most likely sources of quality data that can be used for constructing a 3D urban map is the information contained in existing GIS databases. Features such as building footprints and the number of floors per building can be leveraged to accurately extrude 3D buildings, and parcel data, zoning, and street and sidewalk information provide attribution for future analysis. In addition, a wide variety of assets such as street signs, park benches, or trees can quickly be leveraged resulting in considerable detail in the newly created 3D urban map.
Creating Models Before deciding how to construct the building models for the 3D urban map, several questions need to be answered to ensure the resultant map will be capable of serving the desired functions. The following should be considered:
■ Geographic area? Does your urban map encompass a relatively small or large area,
and approximately how many buildings are contained within this area? What is possible, desirable, and feasible for a small area might quickly become unrealistic or impossible for a larger, more densely constructed area.

3D Urban Mapping: From Pretty Pictures to 3D GIS
J10269
Esri White Paper 5
■ Map scale? The answer to this question will impact the level of detail necessary for the building models, where in the past a global or landscape scale was adequate, modern requirements demand city or campus scales.
■ Required accuracies? What is important regarding the accuracy of building locations,
size, and appearance? More does not always translate into better.
■ How will the 3D map be used? Is visualization the primary application, or will spatial analysis be required? Knowing the answer to this question before you begin construction will likely guide many of your decisions throughout the build-out process and likely influence if a photo-realistic or cartographic approach might make the most sense.
■ Future growth plans? Ideally, any project to construct a 3D urban map should
consider growth and maintainability—growth and change within the city itself and increased requirements and applications that may not be required or feasible today.
There are different levels of 3D visualization that can be used for any type of mapmaking.
Once you have determined the key requirements of your urban map, you will need to evaluate the various options for the actual creation of the building models. Numerous trade-offs need to be considered that impact the approach, time, and costs to construct the models. Does the methodology for creating building models need to be scalable, or can each model be handcrafted? Are there regions within the area of coverage where the level of detail (LOD) needs to be significantly greater than the majority of the map, such as the city center or a university campus? Another decision to consider is whether it is desired for the facades of the buildings to be constructed from actual imagery to most accurately represent reality and if it is expected to eliminate foreground objects, such as parked cars, trees, or pedestrians, or if a representative facade obtained from a library and applied to numerous buildings is adequate for the map. If the latter is the case, considerable time and expense can be saved creating the building models. Also, keep in mind that it is not uncommon for several different approaches to be used to create the building models in an urban map. The next consideration is whether the sponsoring organization has the expertise and resources to build its own 3D urban map and building models using available products or if outsourcing the project to a service provider might be desirable. Depending on the size of the project's geographic area and/or the number of buildings to be modeled and their required LOD, various options exist. One possibility is to contract with a service provider and have all the building models created. If an organization desires to build the models in-house, a second option might be to utilize the Esri® ArcGIS® platform, possibly
3D Urban Mapping: From Pretty Pictures to 3D GIS
J10269
December 2014 6
employing software extensions from Esri's partners to create the building models. These options are discussed below and in the appendix at the end of this paper.
Building or Buying Models
If an organization chooses to create its own building models, software is now available to facilitate the workflow. If a significant number of building models need to be constructed, leveraging automation will likely be critical. The approach and selection of the specific software package to use will greatly depend on the LOD desired and, more importantly, the type and quality of the input datasets available. For example, if building footprints and lidar data are obtainable and the majority of the buildings only need to be LOD1, the workflow described in appendix A using the ArcGIS platform can be utilized to quickly extrude all the buildings automatically with a reasonably high degree of accuracy. If greater building detail (LOD2 or LOD3) is desired for some or all models, the ArcGIS extensions and complementary applications developed by Esri partners might be good options. In addition, Esri Professional Services (800-447-9778 or [email protected]) offers a range of services to assist with 3D project needs, including Esri CityEngine® Jump Start to gain essential skills, build an initial city model, and publish a web scene. Several Esri partners provide complete services to create 3D building models, with the approach and cost, once again, heavily dependent on the availability of source data (i.e., stereo aerial photography or airborne lidar). Also becoming more common in major metropolitan areas is the option to purchase existing building models, which, if available, can save a significant amount of time and money. Since creating 3D urban models is still a fairly new activity for many organizations, it is sometimes desirable to bring in expertise to evaluate the stated goals and uses of the 3D map, and then receive recommendations on the possible approaches available. If new source data needs to be acquired specifically for the creation of the 3D urban map, Esri also has partners that have developed sensor systems to produce the best data possible.
Storing Building Models
Equally important when attempting to understand 3D urban mapping is to obtain an appreciation for the various ways in which the map and associated models can be stored and maintained. An option is to store the information in the KML format. This solution provides robust options for display and visualization and is commonly used when sharing maps and models outside an organization. Other options available for storing building model information provide more robust and defined data structures and are generally referred to as common information models, which are used to "catalog" all pertinent building information. Features such as a building's location, footprint, height, number of floors, windows, roof characteristics, and/or type of building facade are often included. Two common formats include CityGML (www.citygml.org/) by the Open Geospatial Consortium, Inc., and Esri's recently released City Information Model, or 3D-CIM. Several key differences exist between these two formats, and while CityGML has a solid structural base because it was originally designed as a transfer format, it is hard to efficiently search for information such as, how many rooms does the building have?, especially in cases where there are many buildings included. 3D-CIM, on the other hand, is an extensible data structure schema designed for data management and analysis and allows the inclusion of whatever types of data fields that make sense for the building model. It can even include information that is compatible with existing GIS databases.

3D Urban Mapping: From Pretty Pictures to 3D GIS
J10269
Esri White Paper 7
Applications for 3D Urban Maps
Opportunities to utilize 3D urban mapping are increasing rapidly as more cities transition from 2D to 3D GIS. Fortunately, if the map is constructed in such a way that new data can be added as it becomes available, the usefulness of the map will continue to increase as additional applications and workflows are developed. Today's most common applications can be categorized into simulation, urban planning, transportation, real estate, and census. One of the common early uses of 3D urban mapping is simulation for flood modeling, which has grown in importance since Hurricane Katrina in 2005. When building models are combined with accurate terrain data (DTM), simulations can be created that accurately identify areas of risk based on a variety of what-if scenarios. Modeling the environment in 3D can aid in such things as determining the impact of storm surge and assisting in the siting of evacuation routes and centers. Mapping of critical infrastructure, such as electrical distribution, can also be done more accurately in 3D, as well as contingency planning, determining requirements for continuity of operations, and recovery efforts.
While a graph is helpful for understanding the number of buildings that could sustain water damage during a flood, it only tells part of the story.
3D Urban Mapping: From Pretty Pictures to 3D GIS
J10269
December 2014 8
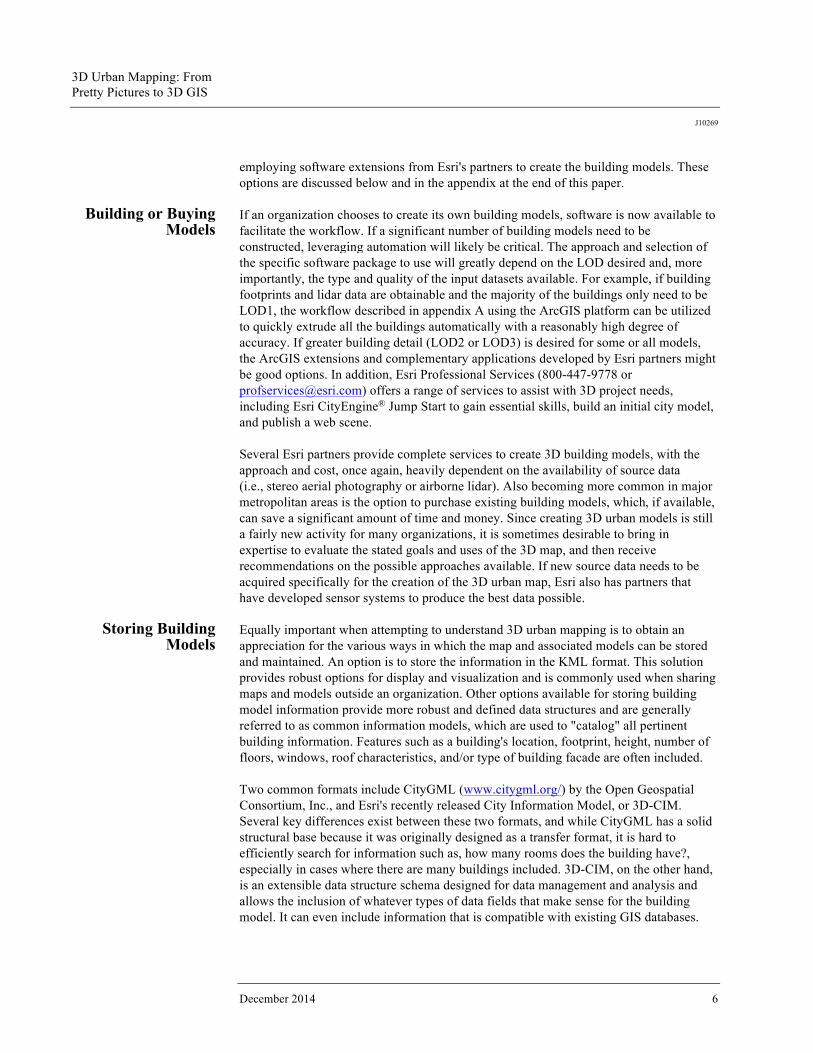
By viewing which buildings are susceptible to flood damage, planners can understand where higher risk is located.
Urban planners have begun to regularly rely on 3D urban maps to support a wide variety of everyday decision making tasks. When the construction of a new structure is proposed, it is now possible to assess the visibility impacts of the new building on the surrounding area. Better understanding the effects of shadow and potential sun exposure to nearby buildings can help determine how best to build a "green" building. And as highlighted in a case study from the City and County of Honolulu below, identifying a single building or group of building's potential for solar power use has now become feasible and practical. Real estate organizations are also beginning to leverage the information contained within a 3D urban map to enhance marketing opportunities and obtain competitive advantages. One powerful example is providing line-of-sight visualization of the view in any direction from any location within the building. These visualizations are now possible using only a web browser. Another popular capability is to display office lease vacancies by location within the building using semitransparent 3D building models.
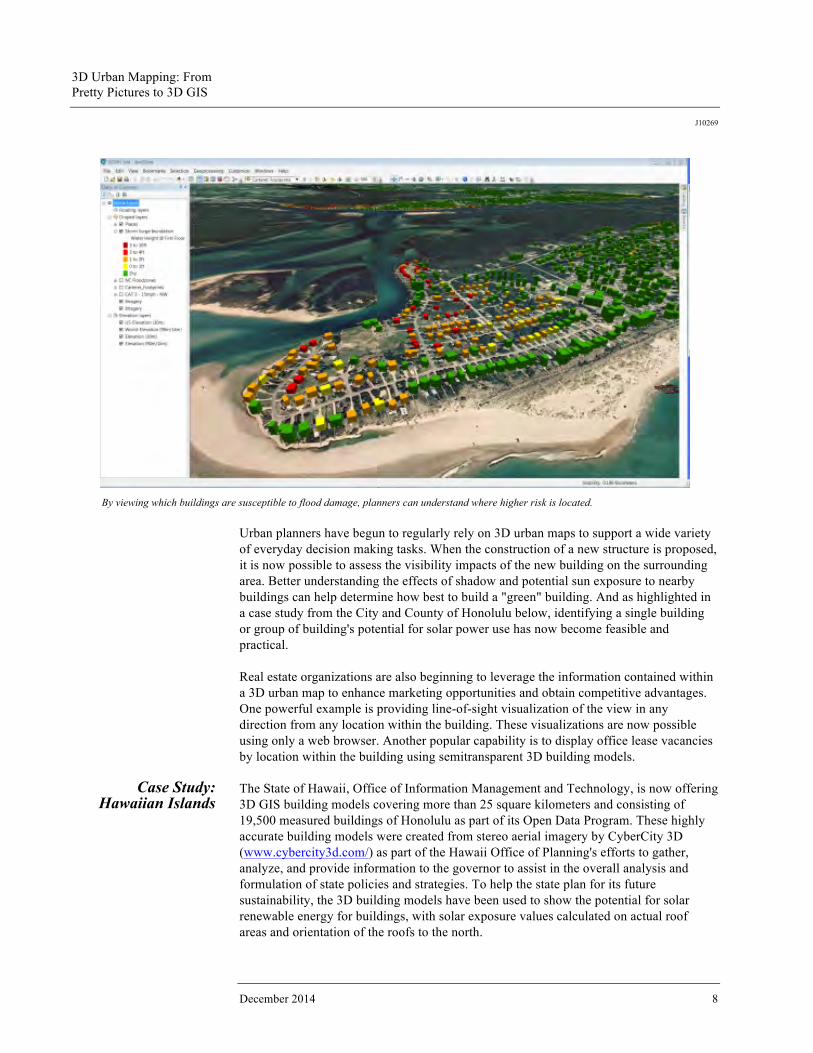
Case Study: Hawaiian Islands
The State of Hawaii, Office of Information Management and Technology, is now offering 3D GIS building models covering more than 25 square kilometers and consisting of 19,500 measured buildings of Honolulu as part of its Open Data Program. These highly accurate building models were created from stereo aerial imagery by CyberCity 3D (www.cybercity3d.com/) as part of the Hawaii Office of Planning's efforts to gather, analyze, and provide information to the governor to assist in the overall analysis and formulation of state policies and strategies. To help the state plan for its future sustainability, the 3D building models have been used to show the potential for solar renewable energy for buildings, with solar exposure values calculated on actual roof areas and orientation of the roofs to the north.

3D Urban Mapping: From Pretty Pictures to 3D GIS
J10269
Esri White Paper 9
More than 25 square kilometers of buildings have been measured for potential for solar renewable energy, including residential buildings.
A second use of the building models is estimating a building's storm water runoff by calculating the number of gallons of runoff from one inch of rainfall on the building's total roof surface.
Red roofs indicate a high potential for solar energy; yellow represent; fair potentials and blue, poor. The City and County of Honolulu is also currently using the 3D buildings in combination with Esri's ArcGIS and CityEngine software technologies for a variety of purposes and projects. Applications to date include visualizing possible urban growth scenarios, assessing regulatory height policies, and the production of line-of-sight analyses for public safety purposes. In addition, the 3D building models have been used to help visualize the urban and natural landscapes of Honolulu and the entire Island of Oahu.
3D Urban Mapping: From Pretty Pictures to 3D GIS
J10269
December 2014 10
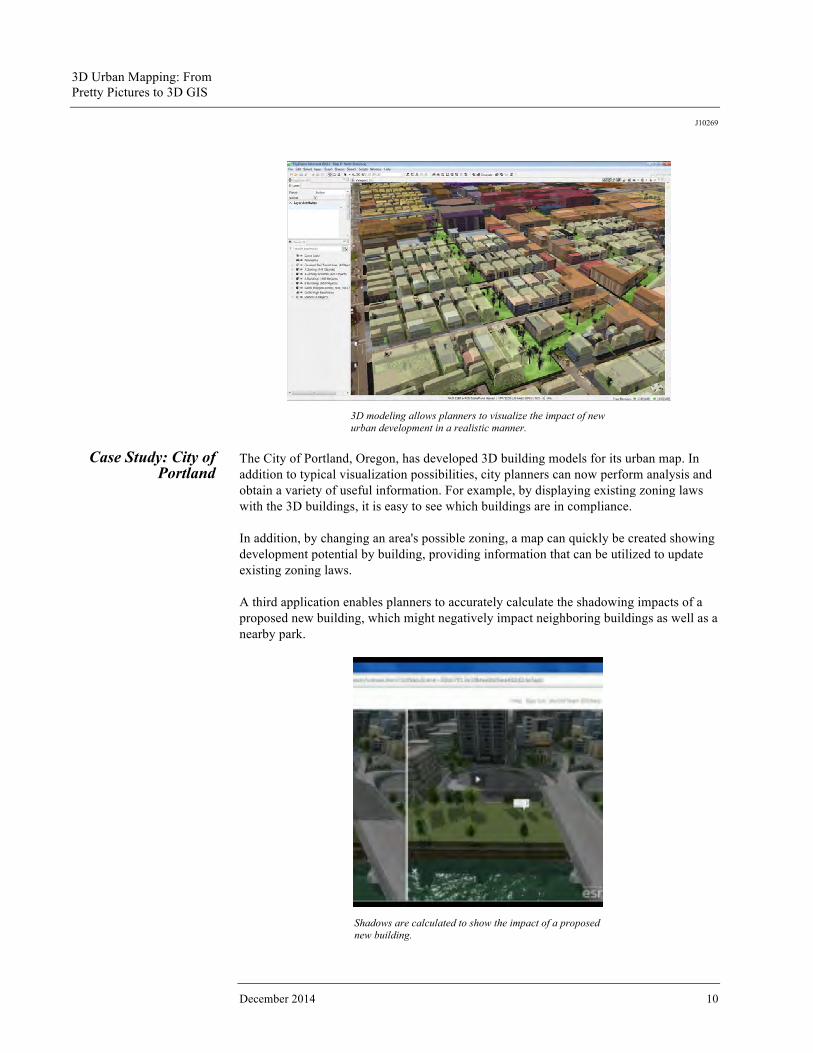
3D modeling allows planners to visualize the impact of new urban development in a realistic manner.
Case Study: City of
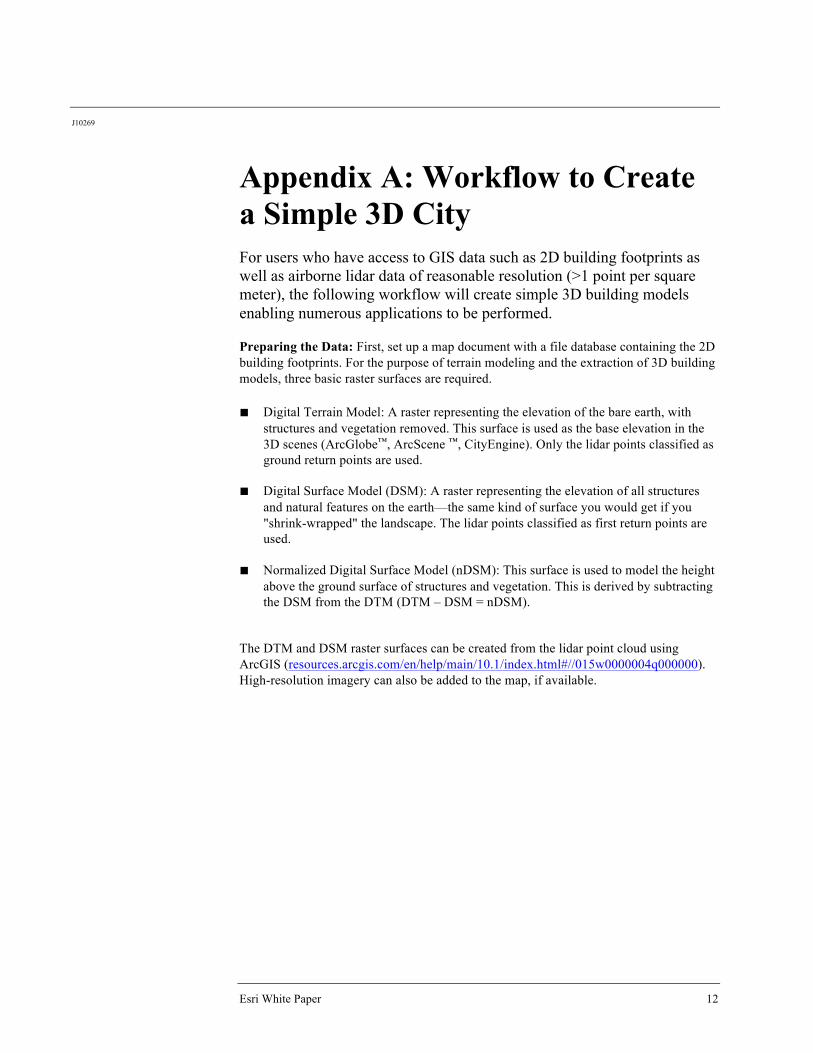
Portland The City of Portland, Oregon, has developed 3D building models for its urban map. In addition to typical visualization possibilities, city planners can now perform analysis and obtain a variety of useful information. For example, by displaying existing zoning laws with the 3D buildings, it is easy to see which buildings are in compliance. In addition, by changing an area's possible zoning, a map can quickly be created showing development potential by building, providing information that can be utilized to update existing zoning laws. A third application enables planners to accurately calculate the shadowing impacts of a proposed new building, which might negatively impact neighboring buildings as well as a nearby park.
Shadows are calculated to show the impact of a proposed new building.

3D Urban Mapping: From Pretty Pictures to 3D GIS
J10269
Esri White Paper 11
Summary The journey of going from a 2D to 3D urban map will take time. There are numerous real-world challenges to overcome; however, with realistic requirements and proper planning, predictable results can be obtained and the significant investment in the existing GIS leveraged and maintained. One of the most significant short-term challenges will be for organizations to obtain an understanding of the different types of 3D building models and the benefits and shortcomings of each. Depending on the types of data available, such as aerial photography, lidar, or vector GIS data like building footprints, various options exist for in-house production or service bureaus to efficiently construct the models for the 3D urban map. Applications have begun to leverage the enhanced information content of the 3D GIS, providing return on investment (ROI) that can be calculated and measured. Urban planners are one of the first groups to benefit from this enhanced form of GIS, but emergency planning organizations and real estate professionals will also quickly make use of these new capabilities. In addition, the 3D GIS is no longer trapped on the desktop and can be shared via the Internet and standard web browsers allowing consumers to utilize this visual information source without having to purchase and download any specialized software. And mobile devices such as smartphones and tablets can also use these highly visual maps, enabling applications to be created that could not have been imagined just a few years ago. Without a doubt, 3D GIS and urban mapping are here to stay.
J10269
Esri White Paper 12
Appendix A: Workflow to Create a Simple 3D City For users who have access to GIS data such as 2D building footprints as well as airborne lidar data of reasonable resolution (>1 point per square meter), the following workflow will create simple 3D building models enabling numerous applications to be performed. Preparing the Data: First, set up a map document with a file database containing the 2D building footprints. For the purpose of terrain modeling and the extraction of 3D building models, three basic raster surfaces are required. ■ Digital Terrain Model: A raster representing the elevation of the bare earth, with
structures and vegetation removed. This surface is used as the base elevation in the 3D scenes (ArcGlobe™, ArcScene ™, CityEngine). Only the lidar points classified as ground return points are used.
■ Digital Surface Model (DSM): A raster representing the elevation of all structures and natural features on the earth—the same kind of surface you would get if you "shrink-wrapped" the landscape. The lidar points classified as first return points are used.
■ Normalized Digital Surface Model (nDSM): This surface is used to model the height above the ground surface of structures and vegetation. This is derived by subtracting the DSM from the DTM (DTM – DSM = nDSM).
The DTM and DSM raster surfaces can be created from the lidar point cloud using ArcGIS (resources.arcgis.com/en/help/main/10.1/index.html#//015w0000004q000000). High-resolution imagery can also be added to the map, if available.

3D Urban Mapping: From Pretty Pictures to 3D GIS
J10269
Esri White Paper 13
Determining the Elevation of the Buildings: After successfully creating the raster surfaces as described, the next step is to determine the elevation of the buildings by generating a set of random sample points for each building footprint. Elevation information from the nDSM raster elevation surface can now be added to each sample point and stored in the building feature class.
Extruding 3D Building Models: Now that all the random points have an elevation, or z-value, the next step is to get the average or mean elevation for each building, which is done using the ArcGIS Summary Statistics tool. Now that the Building footprint layer has height formation, Esri CityEngine can be used to generate the 3D buildings.
To download the complete step-by-step workflow, including a sample dataset, please visit http://esriurl.com/3dmapsworkflow.

Printed in USA
Contact Esri
380 New York Street Redlands, California 92373-8100 usa
1 800 447 9778 t 909 793 2853 f 909 793 5953 [email protected] esri.com
Offices worldwide esri.com/locations
Esri inspires and enables people to positively impact their future through a deeper, geographic understanding of the changing world around them.
Governments, industry leaders, academics, and nongovernmental
organizations trust us to connect them with the analytic knowledge
they need to make the critical decisions that shape the planet. For
more than 40 years, Esri has cultivated collaborative relationships
with partners who share our commitment to solving earth’s most
pressing challenges with geographic expertise and rational resolve.
Today, we believe that geography is at the heart of a more resilient
and sustainable future. Creating responsible products and solutions
drives our passion for improving quality of life everywhere.