Embed Size (px)
Citation preview

7/30/2019 3_Maathuis
http://slidepdf.com/reader/full/3maathuis 1/6
21Geocarto International, Vol. 21, No. 1, March 2006 E-mail: [email protected]
Published by Geocarto International Centre, G.P.O. Box 4122, Hong Kong. Website: http://www.geocarto.com
Digital Elevation Model Based Hydro-processing
B.H.P. MaathuisDepartment of Water Resources
International Institute for Geo-information Science and Earth Observation (ITC)
PO Box 6, 7500 AA Enschede, the Netherlands
E-mail: [email protected]
L. Wang MSc
Unit Geo Software Development
International Institute for Geo-information Science and Earth Observation (ITC)
PO Box 6, 7500 AA Enschede, the Netherlands
Abstract
The article describes a newly implemented routine, called DEM hydro-processing, which was added to the overallcapabilities of the ILWIS-GIS package developed at ITC. A few novel approaches have been incorporated within the
package allowing the user to derive a realistic river and basin schematization, e.g. being able to deal with closed
basins or lakes in combination with a user defined construction of topology and extraction of a river network using
variable drainage thresholds. A large number of attributes are computed assisting efficient hydrological model input
preparation or terrain evaluation in a more general sense. Information obtained through other generic (GIS or
Remote Sensing based) functions available within ILWIS, e.g. classified land cover map or screen digitized sections
of the river network in flat areas, can be easily incorporated and used to effectively schematize and parameterize a
model area under consideration. As example a SRTM-based DEM is selected as this dataset has a near global
coverage at a resolution suitable for hydrological analysis of larger river basins.
Introduction
In order to perform distributed or even lumped rainfall -
runoff modelling a multitude of information is needed. Part
of the necessary model input can now be provided through
processing and analysis of a Digital Elevation Model (DEM)
in combination with information extracted from other
remotely sensed images of a selected model area. One of the
most recent near global elevation data sets is the one recorded
during the 11 day Shuttle Radar Topographic Mission based
on a C-band interferometric radar configuration. This
information, representing the radar reflective surface (whichmay be vegetation, man-made features or bare earth!), was
collected in 2000 and is now available at a horizontal spatial
resolution of 90 metres (averaged from 30 by 30 metres) at
vertical increments of I metre. The data can be downloaded
freely (http://srtm.usgs.gov), unzipped, mosaiced and
processed. As for arid and semi-arid areas the reflective
surface mostly represents the actual ground surface, the
main limitations of the dataset is that there are often small
areas having data voids which need to be corrected prior to
further processing. Next to this source of elevation data also
existing contour or point elevation information can be used
as well as optical stereoscopic, lidar or other interferometric
based remote sensing instruments to produce a DEM. Forextraction of elevation from remote sensing dedicated
software packages are required but most GIS packages have
routines for point or contour line interpolation.
To work effectively with raster based elevation
information a new routine has been developed using ILWIS,
a GIS and RS package developed at ITC (http://www.itc.nl/
ilwis). This DEM hydro-processing module supports further
DEM processing to obtain a full raster and vector based
(including topology) schematization of the (sub) catchments
and drainage network, coupled with additional hydrological
relevant parameters. The basis is formed by the Deterministic
- 8 flow direction procedure. Additional, more complex
algorithms may be added in the future. The hydro modulefacilitates closed basin processing, DEM optimization
procedures to incorporate river bathymetric as e.g. the SRTM
radar signal is opaque for water bodies (optionally
incorporation of drainage parameters from a table), a
topological optimization routine to handle lakes, allows
assignment of multiple drainage thresholds (e.g. based on a
reclassified geological map or internal relief map if only a
DEM is available). The drainage network and catchment
tables generated can be easily linked using common table ID
columns and can be exported to be incorporated in other
packages. Furthermore drainage network and catchment
segmentation can be aggregated - merged using different
stream orders (e.g. for more generic up scaling purposes) orby user defined drainage outlet locations and the resulting

7/30/2019 3_Maathuis
http://slidepdf.com/reader/full/3maathuis 2/6
22
network can be extracted to provide further hydrological
model input. A number of compound indices, using e.g. flow
accumulation area and slope or river network and flow
direction maps, can be calculated. Finally, other raster based
information, e.g. obtained from a soil map or classified
satellite image can be crossed with the catchment map and
the cross table shows relevant (aggregated) statistical
information as well as Horton plots. It supports latitude -
longitude coordinates as well as metric projections.
DEM Hydro-processing
The several routines that have been developed are discussed
in more detail below. One of the criteria for development was
that next to the elevation data set itself also information
acquired from remote sensing images, if necessary, can be
incorporated and up scaling for comparison with data derived
from low resolution (meteo) satellites could be facilitated.
Not all of these functions had to be developed as ILWIS is
already offering a substantial capability for GIS-RS data
processing. For example the raw I by I degree latitude /
longitude SRTM derived elevation data sets can be imported,
georeferenced, resampled from geographic coordinates to a
metric coordinate system (e.g. UTM). Also the problem of
resolving the undefined values can be handled using a kriging
operation. This procedure returns a raster map with estimations
for the undefined values, which are weighted average values,
similar to a moving average operation. The weight factors are
determined using a user specified semi-variogram model, the
distribution of input pixels are calculated in such a way that
they minimize the estimation error in each of the outputpixels. The estimated or predicted values are thus a linear
combination of the input values and have a minimum
estimation error. An optional error map contains the standard
errors of the estimates for quality control purposes (Unit Geo
Software Development ITC, 2001).
Flow Determination
This set of routines facilitates the necessary pre-processing
steps to derive a hydrological consistent flow network.
Currently only the Deterministic-8 model is implemented,
more advanced models, such as the D-Infinity (Tarboton,
1997) or the Mass Flux algorithm (RIVIX, 2004) are under
consideration. The flow extraction process allows the
occurrences of undefined areas, representing e.g. closed
basins, glacial lakes, depressions (sinkholes) within a
limestone area or manmade features like reservoirs. These
areas are therefore not modified during the fill sink routine.
The flow accumulation computation stops at these locations
and at a later stage, manually, the topology can be adapted to
represent proper flow connection. Relevant features that
represent actual topology can be extracted from satellite
images (through screen digitizing) and the DEM may be
adapted at these locations.
Flow modificationTo obtain a hydrological consistent raster based elevation
representation additional modifications are often required as
the elevation value assigned to a pixel is an averaged
representation only. Furthermore, due to raster resolution in
relation to the drainage network or valley width (land surface
discritization does not allow representation of features smaller
than the pixel size) or intrinsic properties of the sensor that
acquired the DEM (reflective surface instead of the actual
ground surface as is the case with active sensors derived raw
elevation models) additional pre-processing is necessary. To
overcome the resolution problem more detailed elevation
raster data can be obtained from larger scale aerial
photographs or optical stereo satellite images (Aster, Spot-5
HRS or the Alos Prism when operational). Well established
photogrammetric principles can be applied for parallax based
elevation extraction. For active sensors filtering routines can
be applied, excluding (iteratively) those points or pixels
situated above the terrain prior to (a new) interpolation of the
remaining on-terrain points.
Despite these approaches the bathymetric information of the stream network and lakes is often still not available. A
DEM optimization routine, similar to the Agree-DEM method
(Maidment et al, 2000, 2002) is therefore used here as well.
General values for all segments or linkage of the drainage
segments (extracted through satellite image interpretation)
with a table containing the width and depth parameters
according to e.g. Strahler order can be used for DEM
modification purposes.
Another option available is called Topological
Optimization. Here topological consistency can be obtained
for those areas having undefined DEM values (representing
lakes or a reservoir). A (straight) line can be constructedfrom e.g. the lake inlet to outlet in a down flow direction,
along this line the down flow pixels are added to the flow
direction map and the drainage pixels will be added to the
basic drainage network map during a later stage. For flat
areas the satellite image based drainage can be extracted and
through this manual intervention also the parallel drainage
line occurrences in flat areas can be corrected.
First a default network can be generated. This can be
superimposed on a satellite image. A comparative analysis
shows the areas needing manual adaptation. The flow
modification routines are therefore fully utilizing the remote
sensing information that is mostly at disposal to the analyst
in order to overcome some of the imperfect areas in an
elevation model.
Variable threshold computation
Packages that allow hydro parameter extraction (e.g. the
Hydro-tools and TauDem Arcgis extensions, Rivertools,
Digem, Arcviews HEC-GeoHMS extension, see references
for Internet addresses) use a fixed flow accumulation
threshold. Once this threshold value is exceeded a drainage
line is identified resulting in a rather homogeneous drainage
network. Here a different approach is followed justified by
the fact that the type of geology and soil are important
factors influencing the drainage density in a basin. If ageological or a soil map is available the units of this map can
7/30/2019 3_Maathuis
http://slidepdf.com/reader/full/3maathuis 3/6
23
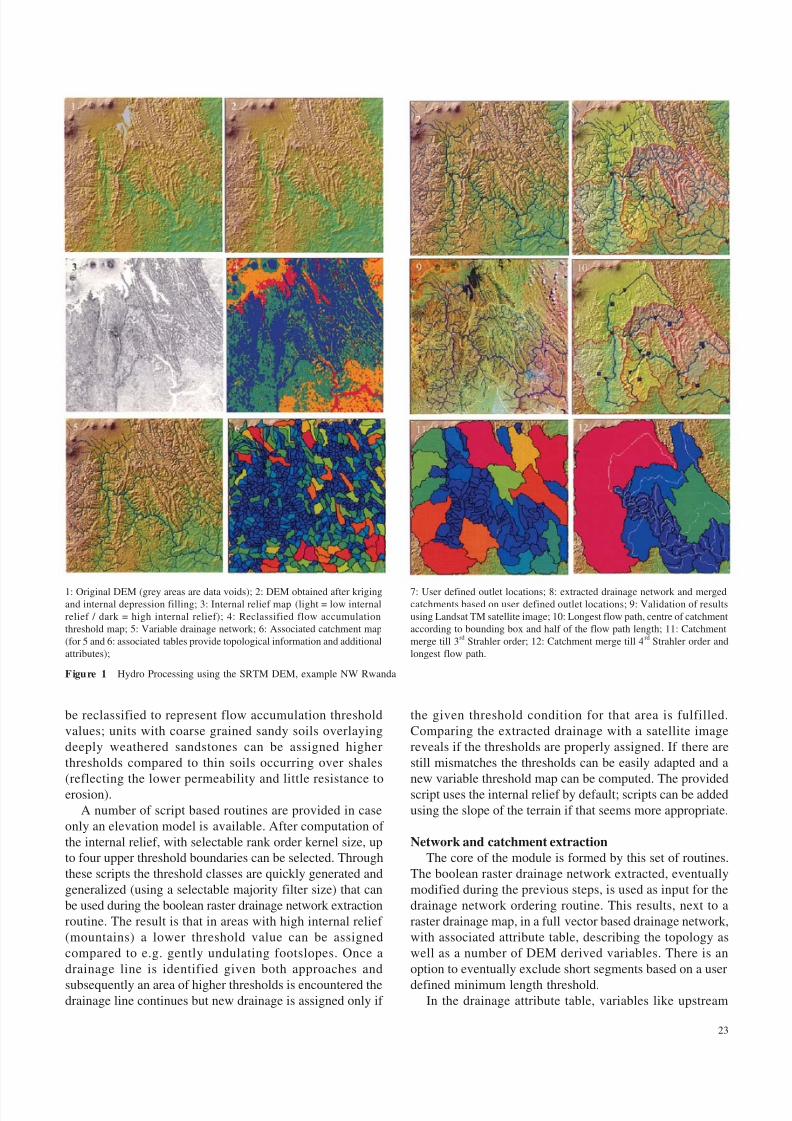
Figure 1 Hydro Processing using the SRTM DEM, example NW Rwanda
1: Original DEM (grey areas are data voids); 2: DEM obtained after krigingand internal depression filling; 3: Internal relief map (light = low internal
relief / dark = high internal relief); 4: Reclassified flow accumulation
threshold map; 5: Variable drainage network; 6: Associated catchment map
(for 5 and 6: associated tables provide topological information and additional
attributes);
7: User defined outlet locations; 8: extracted drainage network and mergedcatchments based on user defined outlet locations; 9: Validation of results
using Landsat TM satellite image; 10: Longest flow path, centre of catchment
according to bounding box and half of the flow path length; 11: Catchment
merge till 3rd
Strahler order; 12: Catchment merge till 4rd
Strahler order and
longest flow path.
be reclassified to represent flow accumulation threshold
values; units with coarse grained sandy soils overlaying
deeply weathered sandstones can be assigned higher
thresholds compared to thin soils occurring over shales
(reflecting the lower permeability and little resistance to
erosion).
A number of script based routines are provided in case
only an elevation model is available. After computation of
the internal relief, with selectable rank order kernel size, up
to four upper threshold boundaries can be selected. Through
these scripts the threshold classes are quickly generated and
generalized (using a selectable majority filter size) that can
be used during the boolean raster drainage network extraction
routine. The result is that in areas with high internal relief
(mountains) a lower threshold value can be assigned
compared to e.g. gently undulating footslopes. Once a
drainage line is identified given both approaches and
subsequently an area of higher thresholds is encountered thedrainage line continues but new drainage is assigned only if
the given threshold condition for that area is fulfilled.
Comparing the extracted drainage with a satellite image
reveals if the thresholds are properly assigned. If there are
still mismatches the thresholds can be easily adapted and a
new variable threshold map can be computed. The provided
script uses the internal relief by default; scripts can be added
using the slope of the terrain if that seems more appropriate.
Network and catchment extraction
The core of the module is formed by this set of routines.
The boolean raster drainage network extracted, eventually
modified during the previous steps, is used as input for the
drainage network ordering routine. This results, next to a
raster drainage map, in a full vector based drainage network,
with associated attribute table, describing the topology as
well as a number of DEM derived variables. There is an
option to eventually exclude short segments based on a user
defined minimum length threshold.In the drainage attribute table, variables like upstream

7/30/2019 3_Maathuis
http://slidepdf.com/reader/full/3maathuis 4/6
24
Figure 2 Manual flow adaptation through lakes
Figure 3 Compound DEM derived parameters
1: Overland flow length map (the darker the tone the longer the overland flow length); 2: Wetness
index map (dark = zones of saturation, bright = runoff generation areas); 3: Sediment transport index
map (dark: potential sediment source areas, bright: potential sediment deposition areas); 4: Stream
power index map (darker tone indicates increasing stream power).
and downstream coordinates, their
corresponding elevations are given, next
to length of segment, distance between
the two nodes, slope along the stream,
slope taken along a straight line between
the two nodes (both in degree and
percentage), sinuosity (ratio between
drainage length and straight distance),
upstream drainage length, Strahler and
Shreve order. Topology is given as
l inkage be tween ups t ream and
downstream drainage linkage ID(‘s).
Another variable, called StrahlerClass
is provided and can be used for
cartographic representation purposes,
linking colour and line thickness to the
Strahler order.
In the next step for each identified
drainage line the correspondingcatchment area is extracted. The raster
and polygon based catchment maps have
identical ID’s compared to the drainage
network and the associated table also
provides a number of variables such as
the catchment area, perimeter, total
upstream area, longest flow path length,
centre of the catchment according to a
rectangular bounding box or according
to half the distance of the longest flow
path length. Topological linkage is given
by the upstream and downstream locatedcatchment(s). Additionally a column
gives the linkage with the drainage
segment.
Another option available is the
catchment merge. Using Strahler or
Shreve orders the lower order
catchments can be merged to a higher
order, which might be useful for basin
scaling - data assimilation type of
studies. Additionally using a point map
with outlet locations the catchments
situated upstream of these outlets can
be extracted and the longest flow path
vector can optionally be computed. A
new attribute table describing these
extracted catchments is provided,
having the same attributes as those given
for the individual catchments.
The raster and vector maps as well
as the tables generated can be exported
to other formats for incorporation into
other software routines.
Compound parameter extraction
Routines are given here to computea number of maps that are relevant with

7/30/2019 3_Maathuis
http://slidepdf.com/reader/full/3maathuis 5/6
25
respect to watershed management, soil erosion and conservation type of
studies. The overland flow length computes the distance to the river network
according to the flow direction map. The wetness index sets catchment area
in relation to the slope gradient. This is basically the famous w = 1n ( As /
tan ( B ) ) (Beven and Moore, 1993). An idea of the spatial distribution and
zones of saturation or variable sources for runoff generation is obtained.
The stream power index is the product of catchment area and slope and
could be used to identify suitable locations for soil conservation measures
to reduce the effect of concentrated surface runoff. Finally, the sediment
transport index accounts for the effect of topography on erosion. The two-
dimensional catchment area is used instead of the one-dimensional slope
length factor as in the Universal Soil Loss Equation. The equations for the
indices applied are those given by Burrough and McDonnell (1998).
Statistical parameter extraction
Here a number of functions are given to provide relevant statistical
information of the extracted river and catchment network. The Horton plots
show the relationship between Strahler order and total number of Strahler
order stream segments for a given order, average length per Strahler order
and average catchment area per Strahler order, as well as the bifurcation,
channel length and stream area ratio’s (by means of a least square regressionline). The results can be graphically displayed plotting the Strahler order on
the X axis and the number of drainage
channels, stream length and stream area on a
log transformed Y axis. According to Horton’s
law the values obtained should plot along a
straight line (Chow et al, 1988); this is another
indicator that the parameters used for drainage
extraction are properly selected. Especially
when performing catchment merge operations
using Strahler orders, reference to the original
Horton plot might be relevant. Next to this a
number of scripts are provided assisting
computation of other frequently used statistics,
such as the construction of cumulative
hypsometric curve for a given catchment or
through a crossing operation with a classified
soil or land cover map to obtain the percentage
coverage of each class within a selected
catchment. Also all extracted catchments can
be crossed with e.g. the elevation model andaggregate statistics (mean, minimum, standard
deviation, etc) are computed and appended to
the catchment table. Also here, satellite derived
information can be used for hydrological
parameterization.
DEM Hydro-processing examples
It is not feasible, given the large number
of spatial and tabular data sets that are created
using this module, to show them all. Therefore
the figures presented show a selected numberof results. Within the help function of the
developed software the routines applied are
described in detail.
As sample DEM a number of SRTM I by I
degree tiles are imported and processed
covering most of Rwanda. Figure 1 shows,
from a subset, the results obtained when the
lakes in the northern portion of the DEM are
not considered and are modified using a filling
operation. From the DEM it is apparent that
the different geological setting warrants
multiple flow accumulation thresholds and
therefore the internal relief is reclassified into
four threshold classes and subsequently used
as input for the drainage extraction. Based on
a number of user specified outlet locations the
catchments are merged and the drainage is
extracted. These results can be validated using
a satellite image as background. Relevant
parameters given in the tables, such as centre
of catchment, can be transformed into point
maps and visualized. To find suitable outlet
locations for catchment merging the Strahler
or Shreve order merge can be performed first.
Catchments are merged based on the drainageorder selected; their outlets can be used for a
Figure 4 Hydro parameterization for setting boundary conditions

7/30/2019 3_Maathuis
http://slidepdf.com/reader/full/3maathuis 6/6
26
user defined merge in a later stage ensuring that the upper
catchments are of similar Strahler or Shreve magnitude.
Figure 2 demonstrates the added flow processing
flexibility. Within the lake, an area that is undefined within
the original elevation model, an artificial defined flow
direction network is generated though the incorporation of a
user defined set of digitized stream segments, the first point
of the digitized segment(s) is regarded as the upstream
location and the last point is the outlet location. For these
added segments the flow direction map is adapted and the
new drainage network extracted ensures a consistent
(downstream) network and topology. Not all drainage lines
identified during the default drainage extraction are extended;
some only cover a very small portion of the lake basin
drainage area. Furthermore the area draining directly into
the lake can be extracted as well. This type of manual
interference provides the user more flexibility for drainage
network generation and catchment extraction. Given the fact
that the DEM used has undefined values some of the attributesin the tables, especially those depending on DEM derived
information, need manual adjustment.
When dealing with a closed basin the DEM representing
the lake area can also be assigned an undefined area and is
therefore not treated during a fill operation, ensuring that the
rivers drain into the lake.
Figure 3 shows the results of a number of DEM derived
compound parameters useful to analyze the energy potential
based on the terrain configuration. The overland flow length
is a function of the criteria used when computing the drainage
network; the larger the thresholds the less dense the drainage
network, therefore the longer the overland flow length path.Figure 4 is based on information derived from the produced
tables and a number of attributes are used here to produce for
a small upstream catchment, using the SCS unit hydrograph
approach, a storm hydrograph. This information can be
directly used to define boundary conditions needed as input
within other models.
The statistical routines implemented are not further
elaborated over here as well as a more detailed description of
the attributes provided.
Conclusion
The DEM hydro-processing module described here is
offering new features enhancing the flexibility to extract a
full topologically based hydrologic network and relevant
associated attributes. Through the use of multiple drainage
thresholds, eventually verified using a satellite backdrop
image, a realistic hydro-network can be produced. Through
the added option of topological flow modification also
hydrological more complex areas might be handled.
Aggregation can be performed using Strahler or Shreve
orders as well as through user defined outlet locations. The
spatial and tabular data can be in / exported to a number of
common used data formats facilitating easy parameterization
of hydrological models. As the SRTM DEM has a nearglobal coverage the routine allows efficient hydro
parameterization for those areas as well. Distortions of the
elevation model have to be corrected prior to the hydro-
processing. Within the Ilwis package, one of the most
common shortcomings, the data voids, can be handled. Next
to this, relevant land cover related elevation uncertainties
can be adapted using elevation correction factors based on
classified satellite image land cover maps. The pre-processed
elevation model can then be used as input for the hydro-
processing module.
Although some of the routines implemented are
computational intensive, great effort was made to efficiently
use available resources to ensure shortest possible processing
time, but the fill-sink operation and the drainage network
ordering routine still take some time. A help function provides
additional information on how to implement the developed
routines; also a tutorial is currently being prepared.
The module will be further developed to handle other
flow direction algorithms in the future. Also for some selected
hydrological models data transformation into the modelformat is envisaged. The described functionality will be
included in the new release of the Ilwis software.
References
Beven, K., Moore, I.D. editors (1993): Terrain analysis and distributed
modelling in hydrology. Wiley and Sons, Chichester, England.
ISBN 0-471-93886-6.
Burrough, P.A., McDonnell, R.A. (1998): Principles of Geographical
Information Systems. Oxford University Press Inc., New York.
ISBN: 0-19-823366-3.
Maidment, D.R. (2002): Arc Hydro, GIS for Water Resources. ESRI,
Redlands, California, USA. ISBN: 1-58948034-1.
Maidment, D.R., Djokic, D. (2000): Hydrologic and Hydraulic
Modeling Support with Geographical Information Systems . ESRI,
Redlands, California, USA. ISBN: 927378100.
RIVIX, LLC (2004): RiverTools, Topographic and River Network
Analysis. User’s Guide, RiverTools Vers ion 3. 0. March 2004
Edition. RIVIX Limited Liability Company.
Tarboton, D.G. (1997): “A new method for the determination of flow
directions and upslope areas in grid digital elevation models”.
Water Resources Research, 33(2), 309319.
Chow V.T., Maidment, D.R., Mays, L.W. (1988): Applied Hydrology.
McGraw-Hill Book Co, Singapore. ISBN 0-07-100174-3. pp 166-
170.Unit Geo Software Development ITC (2001): ILWIS 3. 0 Academic,
User’s Guide. ITC, Enschede, The Netherlands.
Internet-references
Arc Hydrotools, Digem, Hec-GeoHMS,Rivertools, TauDem (due to
the transient nature of many Internet web sites, some of these
references may no longer be active):
Are Hydrotools: http://www.crwr.utexas.edu/giswr/hydro/index.html
Digem: http://www.geogr.uni-goettingen.de/pg/saga/digem/index.html
Hec-Geo-HMS: http://www.hec.usace.army.mil/software/hec-hms/
hechms-geohms.htmI
Rivertools; http://www.rivertools.com/
TauDem: htlp://moose.cee.usu.edu/taudem/taudem.html


