Embed Size (px)
Citation preview
3Q 2020MKB Group Flash Report presentation
Budapest, 26 November 2020
2
We kindly draw your attention to that in this presentation MKB Bank’s underlying
financial performance presented – if not stated otherwise – using adjusted
financial figures (alternative performance measurement indicators – APM).
For definition and calculation methodology of alternative performance
measurement indicators please refer to 3Q Flash Report chapter 4.1 – Financial
indicators.
This presentation is to support the understanding of the underlying financial
performance of MKB Group and it is a close and inseparable part of the 3Q 2020
Flash Report.
3
Executive summary Business environment
Financials at a glance MKB Group
Adjusted Profit After Tax, Total Comprehensive Income
Profit and Loss, KPIs
Capital position
Business income
General administrative expenses
Portfolio quality
Business segments results
Corporate segment
Retail segment
Leasing segment
Investments and Treasury activities
Annexes
Strategic Partners’ Performances
Abbreviations
Disclaimer
26.11.2020Executive summary
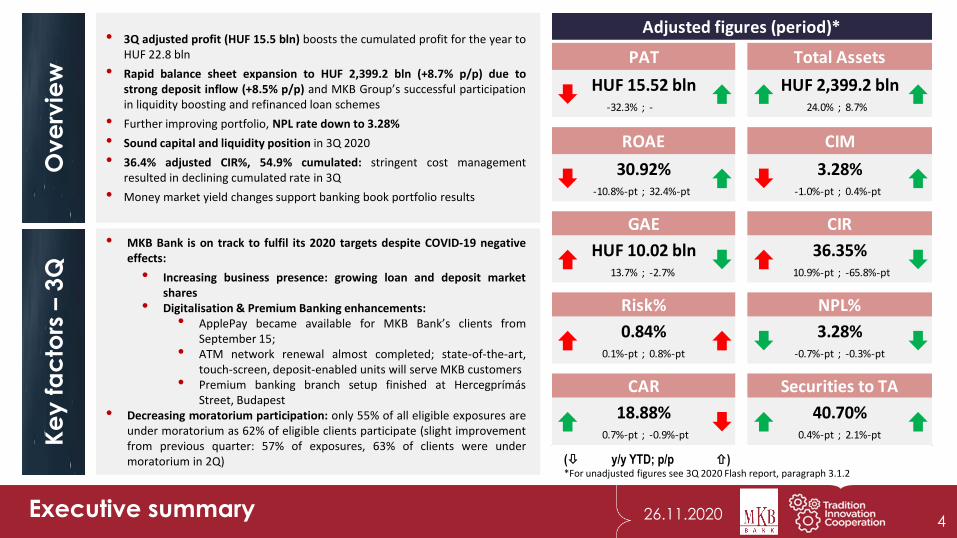
• MKB Bank is on track to fulfil its 2020 targets despite COVID-19 negativeeffects:
• Increasing business presence: growing loan and deposit marketshares
• Digitalisation & Premium Banking enhancements:• ApplePay became available for MKB Bank’s clients from
September 15;• ATM network renewal almost completed; state-of-the-art,
touch-screen, deposit-enabled units will serve MKB customers• Premium banking branch setup finished at Hercegprímás
Street, Budapest• Decreasing moratorium participation: only 55% of all eligible exposures are
under moratorium as 62% of eligible clients participate (slight improvementfrom previous quarter: 57% of exposures, 63% of clients were undermoratorium in 2Q)
Ke
y f
ac
tors
–3
Q
• 3Q adjusted profit (HUF 15.5 bln) boosts the cumulated profit for the year toHUF 22.8 bln
• Rapid balance sheet expansion to HUF 2,399.2 bln (+8.7% p/p) due tostrong deposit inflow (+8.5% p/p) and MKB Group’s successful participationin liquidity boosting and refinanced loan schemes
• Further improving portfolio, NPL rate down to 3.28%
• Sound capital and liquidity position in 3Q 2020
• 36.4% adjusted CIR%, 54.9% cumulated: stringent cost managementresulted in declining cumulated rate in 3Q
• Money market yield changes support banking book portfolio results
Ove
rvie
w
4
( y/y YTD; p/p )*For unadjusted figures see 3Q 2020 Flash report, paragraph 3.1.2
-32.3% ; - 24.0% ; 8.7%
-10.8%-pt ; 32.4%-pt -1.0%-pt ; 0.4%-pt
13.7% ; -2.7% 10.9%-pt ; -65.8%-pt
0.1%-pt ; 0.8%-pt -0.7%-pt ; -0.3%-pt
0.7%-pt ; -0.9%-pt 0.4%-pt ; 2.1%-pt
CAR
18.88%
Securities to TA
40.70%
Risk%
0.84%
NPL%
3.28%
GAE
HUF 10.02 bln
CIR
36.35%
ROAE CIM
30.92%
3.28%
Adjusted figures (period)*
PAT
HUF 15.52 bln
Total Assets
HUF 2,399.2 bln
26.11.2020 5
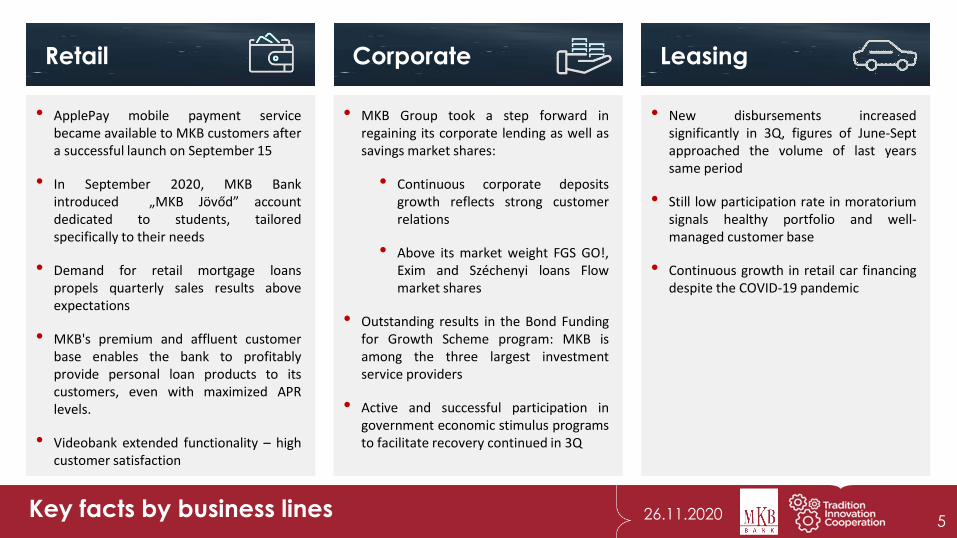
• ApplePay mobile payment servicebecame available to MKB customers aftera successful launch on September 15
• In September 2020, MKB Bankintroduced „MKB Jövőd” accountdedicated to students, tailoredspecifically to their needs
• Demand for retail mortgage loanspropels quarterly sales results aboveexpectations
• MKB's premium and affluent customerbase enables the bank to profitablyprovide personal loan products to itscustomers, even with maximized APRlevels.
• Videobank extended functionality – highcustomer satisfaction
Key facts by business lines
Retail
• MKB Group took a step forward inregaining its corporate lending as well assavings market shares:
• Continuous corporate depositsgrowth reflects strong customerrelations
• Above its market weight FGS GO!,Exim and Széchenyi loans Flowmarket shares
• Outstanding results in the Bond Fundingfor Growth Scheme program: MKB isamong the three largest investmentservice providers
• Active and successful participation ingovernment economic stimulus programsto facilitate recovery continued in 3Q
Corporate
• New disbursements increasedsignificantly in 3Q, figures of June-Septapproached the volume of last yearssame period
• Still low participation rate in moratoriumsignals healthy portfolio and well-managed customer base
• Continuous growth in retail car financingdespite the COVID-19 pandemic
Leasing
26.11.2020 6Post closing events
Acquisition process termination: MKB Bank terminated examining the possibility and conditions of acquiring ashareholding stake in two Croatia based banking institutions: Slatinska banka d.d. and Croatia banka d.d. withoutsubmitting any offers
Hungarian Bankholding Ltd. will launch as planned. On the 30th of October, key owners of Takarék Group, MKBBank Plc., and Budapest Bank Group signed an investment and shareholders’ agreement as a confirmation of theirformer letter of intent and decided to transfer their shares into the joint holding company.
At the same time, the management of Magyar Bankholding also started its operation. Key personnel: dr. Zsolt Barna(Chairman of the Board of Directors), József Vida (CEO), and members of the Board of Directors: dr. Ádám Balog, dr.Koppány Lélfai and dr. Attila Tajthy
Changes in top management: dr. Ádám Balog, President and CEO of MKB Bank resigned with the effect of31.12.2020. MKB Bank’s General Meeting is to nominate the new president on 14.12.2020
According to the Proposed resolution of the General Meeting (published on 23 November 2020): „The GeneralMeeting elects dr. Zsolt Barna as the Chief Executive Officer of MKB Bank Plc. as of 1 January 2021”
26.11.2020 7Post closing events
Awards, new debit cards:
• MKB Bank and MKB-Pannónia Asset Management received a numerous awards at Blochamps Capital PrivateBanking Hungary ceremony: Business Development Award, Junior Private Banking Prize, Managed Asset Prize toOne Customer and also the Asset Management of the year prize
• On 20 November MKB kicked off its latest card campaign by announcing its „metal card” product, targeting thepremium customer segment. Customers signing up for the new product will be invited to be involved in thedevelopment process. The new card will provide a unique and outstanding customer experience and will bemade of metal, building on the experience of fintech companies. MKB Platinum Metal and MKB World EliteMetal card products are expected to be available to customers in the first half of next year
COVID-19:
• Partial lockdown: New measures were introduced to fight the second wave of COVID-19: mass gatherings andfamily gathering with more than 10 people are forbidden, classes in secondary schools and in higher educationhas to go online, certain shops have to close at 7 p.m., and a partial lockdown is in effect from 8 p.m. to 5. a.m.
• Moratorium extension: On 20 October, Hungarian Parliament extended the moratorium on repayment due tothe COVID-19 to certain key social groups and companies in financial difficulties until 30 June 2021. MKB Bankexpects the effects of the elongation to be booked in 4Q 2020
• FGS Go!: The Monetary Council expended the budget of the FGS Go! Program by HUF 1,000 bln at its meeting on17 November 2020
• Operating environment: normal, but safe branch operation throughout the network, working from home asBAU for non-front colleagues
Executive summary
Business environment Financials at a glance MKB Group
Adjusted Profit After Tax, Total Comprehensive Income
Profit and Loss, KPIs
Capital position
Business income
General administrative expenses
Portfolio quality
Business segments results
Corporate segment
Retail segment
Leasing segment
Investments and Treasury activities
Annexes
Strategic Partners’ Performances
Abbreviations
Disclaimer
8
26.11.2020
310
320
330
340
350
360
370
01.0
1.20
19
01.0
2.20
19
01.0
3.20
19
01.0
4.20
19
01.0
5.20
19
01.0
6.20
19
01.0
7.20
19
01.0
8.20
19
01.0
9.20
19
01.1
0.20
19
01.1
1.20
19
01.1
2.20
19
01.0
1.20
20
01.0
2.20
20
01.0
3.20
20
01.0
4.20
20
01.0
5.20
20
01.0
6.20
20
01.0
7.20
20
01.0
8.20
20
01.0
9.20
20
01.1
0.20
20
01.1
1.20
20
7
8
9
10
11
31.0
1.20
19
28.0
2.20
19
31.0
3.20
19
30.0
4.20
19
31.0
5.20
19
30.0
6.20
19
31.0
7.20
19
31.0
8.20
19
30.0
9.20
19
31.1
0.20
19
30.1
1.20
19
31.1
2.20
19
31.0
1.20
20
29.0
2.20
20
31.0
3.20
20
30.0
4.20
20
31.0
5.20
20
30.0
6.20
20
31.0
7.20
20
31.0
8.20
20
30.0
9.20
20
3,4
9,1
0
2
4
6
8
10
12
14
16
18
31.0
1.20
19
28.0
2.20
19
31.0
3.20
19
30.0
4.20
19
31.0
5.20
19
30.0
6.20
19
31.0
7.20
19
31.0
8.20
19
30.0
9.20
19
31.1
0.20
19
30.1
1.20
19
31.1
2.20
19
31.0
1.20
20
29.0
2.20
20
31.0
3.20
20
30.0
4.20
20
31.0
5.20
20
30.0
6.20
20
31.0
7.20
20
31.0
8.20
20
30.0
9.20
20
3,8
3,9
4
4,1
4,2
4,3
4,4
4,5
4,6
-15
-10
-5
0
5
10
31.1
2.20
18
31.0
3.20
19
30.0
6.20
19
30.0
9.20
19
31.1
2.20
19
31.0
3.20
20
30.0
6.20
20
30.0
9.20
20
0
5
10
15
20
25
31.0
1.20
19
28.0
2.20
19
31.0
3.20
19
30.0
4.20
19
31.0
5.20
19
30.0
6.20
19
31.0
7.20
19
30.0
8.20
19
30.0
9.20
19
31.1
0.20
19
30.1
1.20
19
31.1
2.20
19
31.0
1.20
20
29.0
2.20
20
31.0
3.20
20
30.0
4.20
20
31.0
5.20
20
30.0
6.20
20
31.0
7.20
20
31.0
8.20
20
30.0
9.20
20
Deposit Bond Fund Government securities
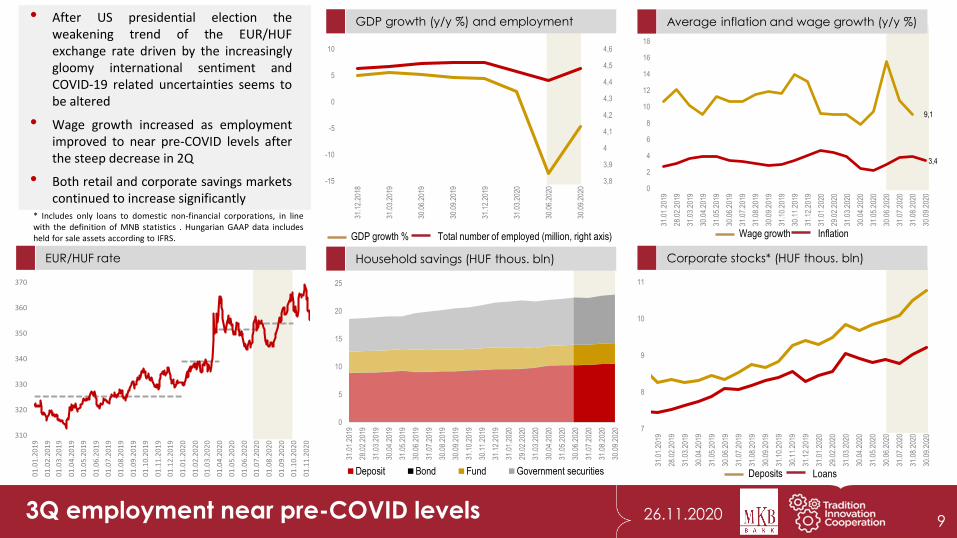
• After US presidential election theweakening trend of the EUR/HUFexchange rate driven by the increasinglygloomy international sentiment andCOVID-19 related uncertainties seems tobe altered
• Wage growth increased as employmentimproved to near pre-COVID levels afterthe steep decrease in 2Q
• Both retail and corporate savings marketscontinued to increase significantly
9
* Includes only loans to domestic non-financial corporations, in linewith the definition of MNB statistics . Hungarian GAAP data includesheld for sale assets according to IFRS.
3Q employment near pre-COVID levels
Household savings (HUF thous. bln) Corporate stocks* (HUF thous. bln)
GDP growth (y/y %) and employment Average inflation and wage growth (y/y %)
EUR/HUF rate
GDP growth % Total number of employed (million, right axis) Wage growth Inflation
Deposits Loans
26.11.2020
0
0,5
1
1,5
2
2,5
O/N 1M 3M 6M 9M 1Y 2Y 3Y 4Y 5Y 6Y 7Y 8Y 9Y 10Y 12Y 15Y
31.12.2019 31.03.2020 30.06.2020 30.09.2020
-0,75
-0,25
0,25
0,75
1,25
1,75
01.0
1.20
19
01.0
2.20
19
01.0
3.20
19
01.0
4.20
19
01.0
5.20
19
01.0
6.20
19
01.0
7.20
19
01.0
8.20
19
01.0
9.20
19
01.1
0.20
19
01.1
1.20
19
01.1
2.20
19
01.0
1.20
20
01.0
2.20
20
01.0
3.20
20
01.0
4.20
20
01.0
5.20
20
01.0
6.20
20
01.0
7.20
20
01.0
8.20
20
01.0
9.20
20
01.1
0.20
20
3 years 5 years 10 years
0,0
0,2
0,4
0,6
0,8
1,0
1,2
01.0
1.20
19
01.0
2.20
19
01.0
3.20
19
01.0
4.20
19
01.0
5.20
19
01.0
6.20
19
01.0
7.20
19
01.0
8.20
19
01.0
9.20
19
01.1
0.20
19
01.1
1.20
19
01.1
2.20
19
01.0
1.20
20
01.0
2.20
20
01.0
3.20
20
01.0
4.20
20
01.0
5.20
20
01.0
6.20
20
01.0
7.20
20
01.0
8.20
20
01.0
9.20
20
01.1
0.20
20
NBH base rate (%) 3M BUBOR (%)
10
End of quarter ÁKK benchmark yields
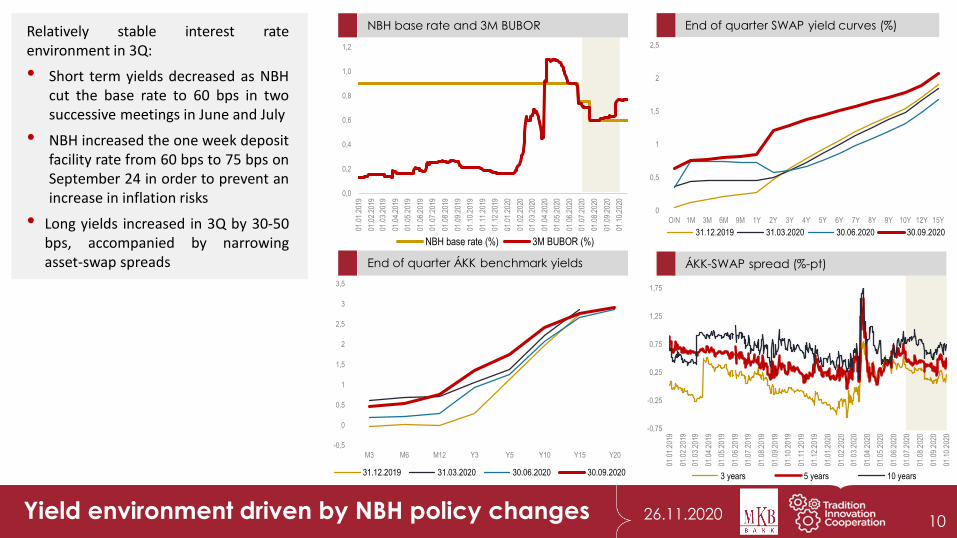
Relatively stable interest rateenvironment in 3Q:
• Short term yields decreased as NBHcut the base rate to 60 bps in twosuccessive meetings in June and July
• NBH increased the one week depositfacility rate from 60 bps to 75 bps onSeptember 24 in order to prevent anincrease in inflation risks
• Long yields increased in 3Q by 30-50bps, accompanied by narrowingasset-swap spreads
NBH base rate and 3M BUBOR End of quarter SWAP yield curves (%)
ÁKK-SWAP spread (%-pt)
Yield environment driven by NBH policy changes
-0,5
0
0,5
1
1,5
2
2,5
3
3,5
M3 M6 M12 Y3 Y5 Y10 Y15 Y20
31.12.2019 31.03.2020 30.06.2020 30.09.2020
11
Executive summary
Business environment
Financials at a glance MKB GroupAdjusted Profit After Tax, Total Comprehensive Income
Profit and Loss, KPIs
Capital position
Business income
General administrative expenses
Portfolio quality
Business segments results
Corporate segment
Retail segment
Leasing segment
Investments and Treasury activities
Annexes
Strategic Partners’ Performances
Abbreviations
Disclaimer
26.11.2020 12
Technical
correctionsBusiness corrections
Adjusted PATBanking tax
0.143.28
COVID-19 costs
PAT COVID-19 risk costs
Branch closure
0.02
Dividend
0.91
Donation
0.73
4.850.42
IFRS16 effect
22.76
13.29
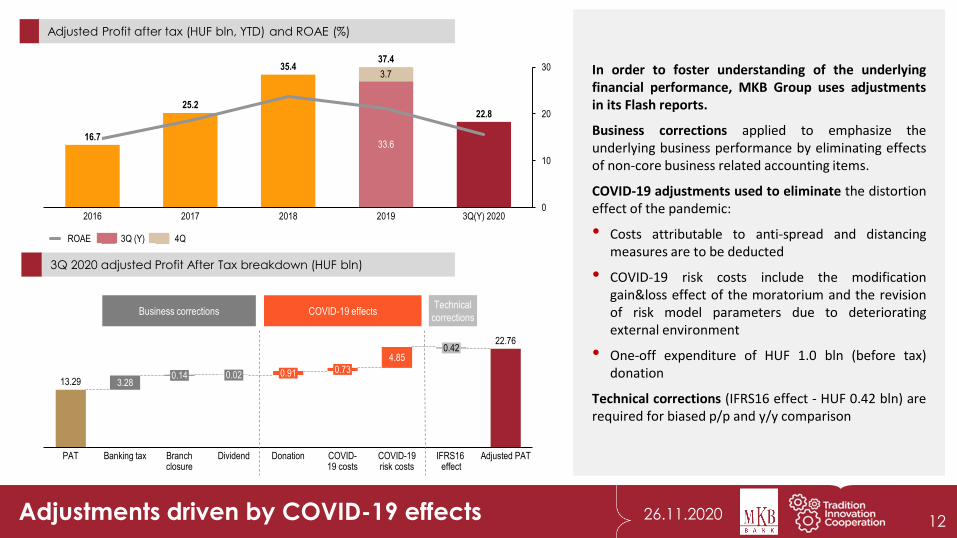
In order to foster understanding of the underlyingfinancial performance, MKB Group uses adjustmentsin its Flash reports.
Business corrections applied to emphasize theunderlying business performance by eliminating effectsof non-core business related accounting items.
COVID-19 adjustments used to eliminate the distortioneffect of the pandemic:
• Costs attributable to anti-spread and distancingmeasures are to be deducted
• COVID-19 risk costs include the modificationgain&loss effect of the moratorium and the revisionof risk model parameters due to deterioratingexternal environment
• One-off expenditure of HUF 1.0 bln (before tax)donation
Technical corrections (IFRS16 effect - HUF 0.42 bln) arerequired for biased p/p and y/y comparison
COVID-19 effects
Adjustments driven by COVID-19 effects
0
10
20
3035.4
16.7
2017
3.7
2016 3Q(Y) 2020
37.4
2018
33.6
2019
25.222.8
ROAE 4Q3Q (Y)
Adjusted Profit after tax (HUF bln, YTD) and ROAE (%)
3Q 2020 adjusted Profit After Tax breakdown (HUF bln)
26.11.2020
-0.1-3.1 -3.3
-6.0
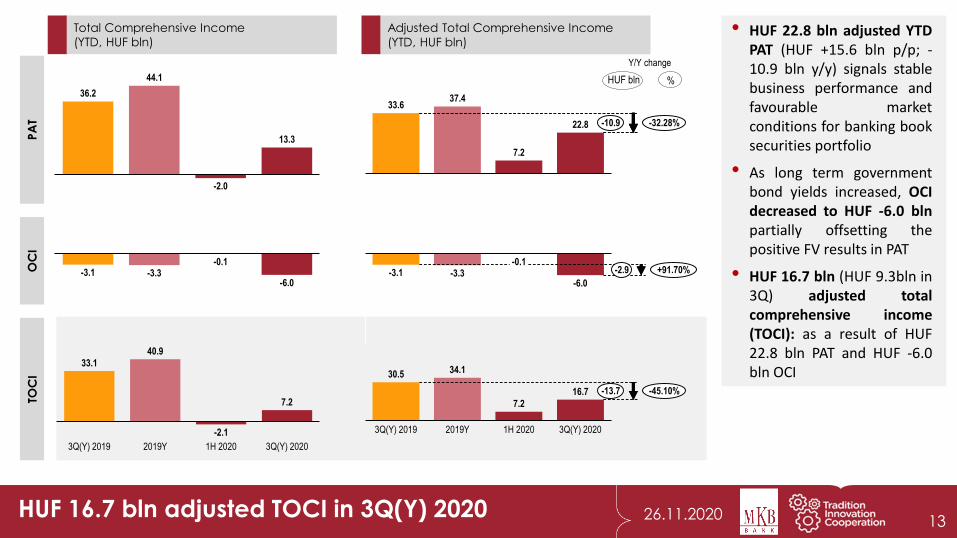
• HUF 22.8 bln adjusted YTDPAT (HUF +15.6 bln p/p; -10.9 bln y/y) signals stablebusiness performance andfavourable marketconditions for banking booksecurities portfolio
• As long term governmentbond yields increased, OCIdecreased to HUF -6.0 blnpartially offsetting thepositive FV results in PAT
• HUF 16.7 bln (HUF 9.3bln in3Q) adjusted totalcomprehensive income(TOCI): as a result of HUF22.8 bln PAT and HUF -6.0bln OCI
Adjusted Total Comprehensive Income
(YTD, HUF bln)
Total Comprehensive Income
(YTD, HUF bln)
2019Y3Q(Y) 2019 1H 2020
40.9
3Q(Y) 2020
7.2
33.1
-2.1
36.2
44.1
-2.0
13.3
33.637.4
7.2
22.8 -10.9 -32.28%
OC
IP
AT
TOC
I
%
HUF 16.7 bln adjusted TOCI in 3Q(Y) 2020
HUF bln
Y/Y change
13
-3.3-3.1-0.1
-6.0
-2.9 +91.70%
1H 20203Q(Y) 2019
7.2
2019Y 3Q(Y) 2020
30.5 34.1
16.7 -45.10%-13.7
14
Executive summary
Business environment
Financials at a glance MKB GroupAdjusted Profit After Tax, Total Comprehensive Income
Profit and Loss, KPIs
Capital position
Business income
General administrative expenses
Portfolio quality
Business segments results
Corporate segment
Retail segment
Leasing segment
Investments and Treasury activities
Annexes
Strategic Partners’ Performances
Abbreviations
Disclaimer
26.11.2020
Y/Y (Y) P/P Y/Y (P)
3Q 3Q(Y) 4Q(Y) 2Q 3Q 3Q(Y) % % %
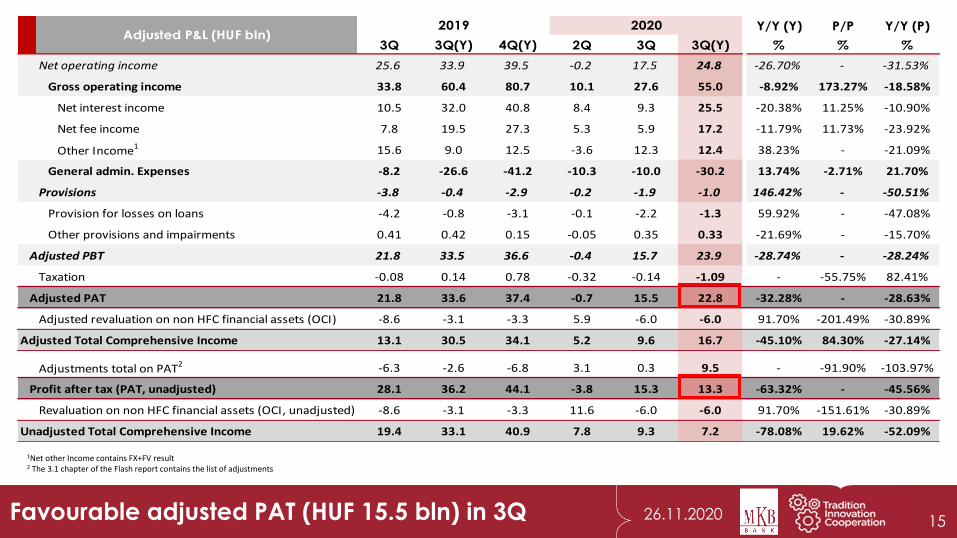
Net operating income 25.6 33.9 39.5 -0.2 17.5 24.8 -26.70% - -31.53%
Gross operating income 33.8 60.4 80.7 10.1 27.6 55.0 -8.92% 173.27% -18.58%
Net interest income 10.5 32.0 40.8 8.4 9.3 25.5 -20.38% 11.25% -10.90%
Net fee income 7.8 19.5 27.3 5.3 5.9 17.2 -11.79% 11.73% -23.92%
Other Income1 15.6 9.0 12.5 -3.6 12.3 12.4 38.23% - -21.09%
General admin. Expenses -8.2 -26.6 -41.2 -10.3 -10.0 -30.2 13.74% -2.71% 21.70%
Provisions -3.8 -0.4 -2.9 -0.2 -1.9 -1.0 146.42% - -50.51%
Provision for losses on loans -4.2 -0.8 -3.1 -0.1 -2.2 -1.3 59.92% - -47.08%
Other provisions and impairments 0.41 0.42 0.15 -0.05 0.35 0.33 -21.69% - -15.70%
Adjusted PBT 21.8 33.5 36.6 -0.4 15.7 23.9 -28.74% - -28.24%
Taxation -0.08 0.14 0.78 -0.32 -0.14 -1.09 - -55.75% 82.41%
Adjusted PAT 21.8 33.6 37.4 -0.7 15.5 22.8 -32.28% - -28.63%
Adjusted revaluation on non HFC financial assets (OCI) -8.6 -3.1 -3.3 5.9 -6.0 -6.0 91.70% -201.49% -30.89%
Adjusted Total Comprehensive Income 13.1 30.5 34.1 5.2 9.6 16.7 -45.10% 84.30% -27.14%
Adjustments total on PAT2 -6.3 -2.6 -6.8 3.1 0.3 9.5 - -91.90% -103.97%
Profit after tax (PAT, unadjusted) 28.1 36.2 44.1 -3.8 15.3 13.3 -63.32% - -45.56%
Revaluation on non HFC financial assets (OCI, unadjusted) -8.6 -3.1 -3.3 11.6 -6.0 -6.0 91.70% -151.61% -30.89%
Unadjusted Total Comprehensive Income 19.4 33.1 40.9 7.8 9.3 7.2 -78.08% 19.62% -52.09%
2019Adjusted P&L (HUF bln)
2020
Favourable adjusted PAT (HUF 15.5 bln) in 3Q
1Net other Income contains FX+FV result2 The 3.1 chapter of the Flash report contains the list of adjustments
15
26.11.2020
Ad
just
ed
PA
TR
isk c
ost
G
AE
GO
I
1Q 20203Q 2019 3Q 20204Q 2019 2Q 2020
21.8
3.77.9
-0.7
15.5 -28.6%-6.2
3Q 2019 4Q 2019 1Q 2020 2Q 2020 3Q 2020
2.24.2
-1.0
0.12.2 -47.1%-2.0
2Q 20203Q 2019 4Q 2019 1Q 2020 3Q 2020
8.2
14.6
9.9 10.3 10.0+21.7%+1.8
3Q 20203Q 2019 4Q 2019 1Q 2020 2Q 2020
33.8
20.217.4
10.1
27.6 -18.6%-6.3
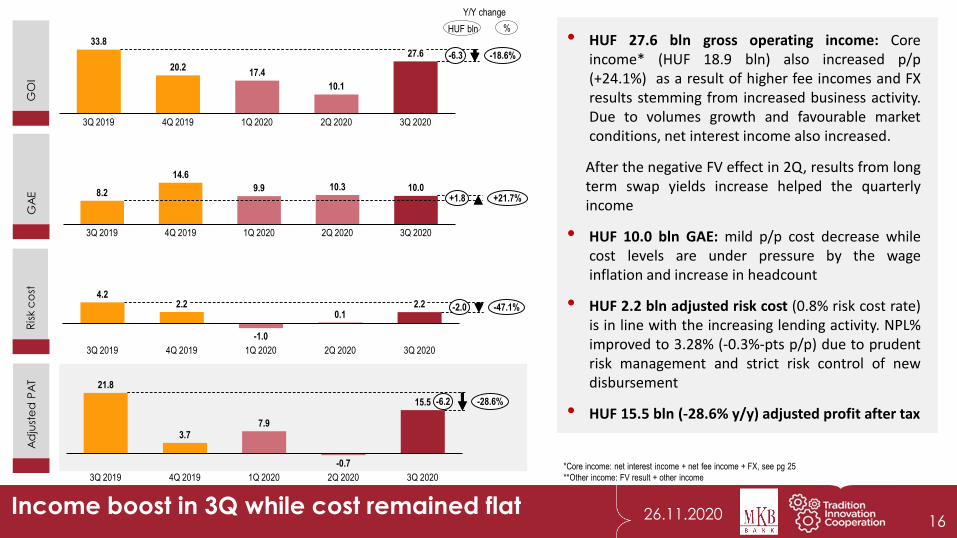
Income boost in 3Q while cost remained flat
%HUF bln
Y/Y change
16
• HUF 27.6 bln gross operating income: Coreincome* (HUF 18.9 bln) also increased p/p(+24.1%) as a result of higher fee incomes and FXresults stemming from increased business activity.Due to volumes growth and favourable marketconditions, net interest income also increased.
After the negative FV effect in 2Q, results from longterm swap yields increase helped the quarterlyincome
• HUF 10.0 bln GAE: mild p/p cost decrease whilecost levels are under pressure by the wageinflation and increase in headcount
• HUF 2.2 bln adjusted risk cost (0.8% risk cost rate)is in line with the increasing lending activity. NPL%improved to 3.28% (-0.3%-pts p/p) due to prudentrisk management and strict risk control of newdisbursement
• HUF 15.5 bln (-28.6% y/y) adjusted profit after tax
*Core income: net interest income + net fee income + FX, see pg 25
**Other income: FV result + other income
26.11.2020
Y/Y P/P YTD
3Q 4Q 2Q 3Q % % %
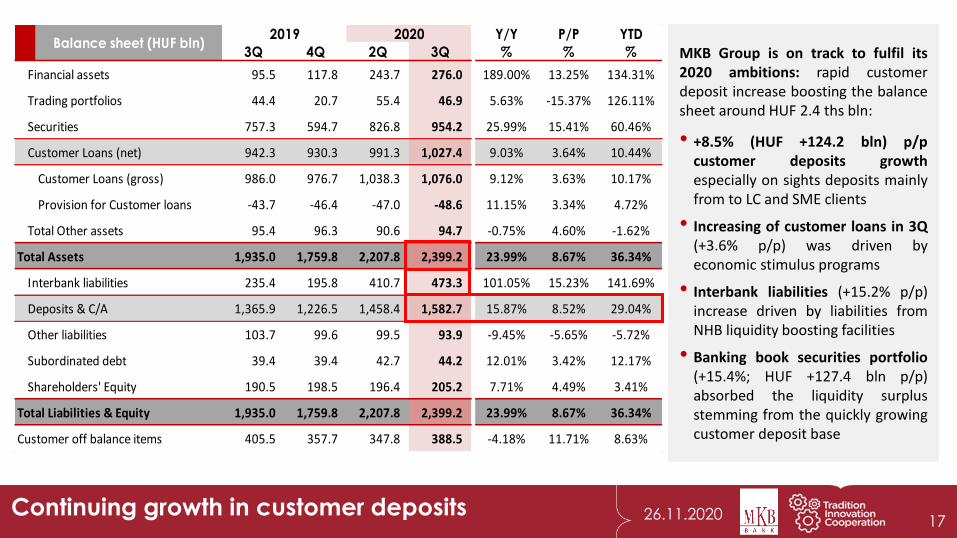
Financial assets 95.5 117.8 243.7 276.0 189.00% 13.25% 134.31%
Trading portfolios 44.4 20.7 55.4 46.9 5.63% -15.37% 126.11%
Securities 757.3 594.7 826.8 954.2 25.99% 15.41% 60.46%
Customer Loans (net) 942.3 930.3 991.3 1,027.4 9.03% 3.64% 10.44%
Customer Loans (gross) 986.0 976.7 1,038.3 1,076.0 9.12% 3.63% 10.17%
Provision for Customer loans -43.7 -46.4 -47.0 -48.6 11.15% 3.34% 4.72%
Total Other assets 95.4 96.3 90.6 94.7 -0.75% 4.60% -1.62%
Total Assets 1,935.0 1,759.8 2,207.8 2,399.2 23.99% 8.67% 36.34%
Interbank liabilities 235.4 195.8 410.7 473.3 101.05% 15.23% 141.69%
Deposits & C/A 1,365.9 1,226.5 1,458.4 1,582.7 15.87% 8.52% 29.04%
Other liabilities 103.7 99.6 99.5 93.9 -9.45% -5.65% -5.72%
Subordinated debt 39.4 39.4 42.7 44.2 12.01% 3.42% 12.17%
Shareholders' Equity 190.5 198.5 196.4 205.2 7.71% 4.49% 3.41%
Total Liabilities & Equity 1,935.0 1,759.8 2,207.8 2,399.2 23.99% 8.67% 36.34%
Customer off balance items 405.5 357.7 347.8 388.5 -4.18% 11.71% 8.63%
Balance sheet (HUF bln)2019 2020
Continuing growth in customer deposits17
MKB Group is on track to fulfil its2020 ambitions: rapid customerdeposit increase boosting the balancesheet around HUF 2.4 ths bln:
• +8.5% (HUF +124.2 bln) p/pcustomer deposits growthespecially on sights deposits mainlyfrom to LC and SME clients
• Increasing of customer loans in 3Q(+3.6% p/p) was driven byeconomic stimulus programs
• Interbank liabilities (+15.2% p/p)increase driven by liabilities fromNHB liquidity boosting facilities
• Banking book securities portfolio(+15.4%; HUF +127.4 bln p/p)absorbed the liquidity surplusstemming from the quickly growingcustomer deposit base
26.11.2020
3Q 3Q(Y) 4Q(Y) 2Q 3Q 3Q(Y)
Profitability
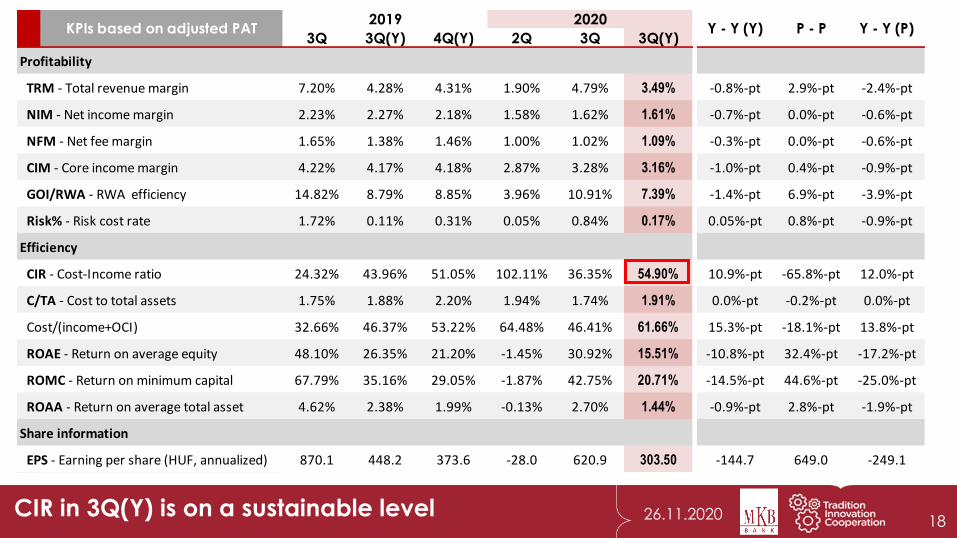
TRM - Total revenue margin 7.20% 4.28% 4.31% 1.90% 4.79% 3.49% -0.8%-pt 2.9%-pt -2.4%-pt
NIM - Net income margin 2.23% 2.27% 2.18% 1.58% 1.62% 1.61% -0.7%-pt 0.0%-pt -0.6%-pt
NFM - Net fee margin 1.65% 1.38% 1.46% 1.00% 1.02% 1.09% -0.3%-pt 0.0%-pt -0.6%-pt
CIM - Core income margin 4.22% 4.17% 4.18% 2.87% 3.28% 3.16% -1.0%-pt 0.4%-pt -0.9%-pt
GOI/RWA - RWA efficiency 14.82% 8.79% 8.85% 3.96% 10.91% 7.39% -1.4%-pt 6.9%-pt -3.9%-pt
Risk% - Risk cost rate 1.72% 0.11% 0.31% 0.05% 0.84% 0.17% 0.05%-pt 0.8%-pt -0.9%-pt
Efficiency
CIR - Cost-Income ratio 24.32% 43.96% 51.05% 102.11% 36.35% 54.90% 10.9%-pt -65.8%-pt 12.0%-pt
C/TA - Cost to total assets 1.75% 1.88% 2.20% 1.94% 1.74% 1.91% 0.0%-pt -0.2%-pt 0.0%-pt
Cost/(income+OCI) 32.66% 46.37% 53.22% 64.48% 46.41% 61.66% 15.3%-pt -18.1%-pt 13.8%-pt
ROAE - Return on average equity 48.10% 26.35% 21.20% -1.45% 30.92% 15.51% -10.8%-pt 32.4%-pt -17.2%-pt
ROMC - Return on minimum capital 67.79% 35.16% 29.05% -1.87% 42.75% 20.71% -14.5%-pt 44.6%-pt -25.0%-pt
ROAA - Return on average total asset 4.62% 2.38% 1.99% -0.13% 2.70% 1.44% -0.9%-pt 2.8%-pt -1.9%-pt
Share information
EPS - Earning per share (HUF, annualized) 870.1 448.2 373.6 -28.0 620.9 303.50 -144.7 649.0 -249.1
KPIs based on adjusted PAT2019
Y - Y (Y) P - P Y - Y (P)2020
CIR in 3Q(Y) is on a sustainable level18
26.11.2020
Y - Y (Y) P - P Y - Y (period)
3Q 3Q(Y) 4Q(Y) 2Q 3Q 3Q(Y) %-pt %-pt %-pt
Profitability
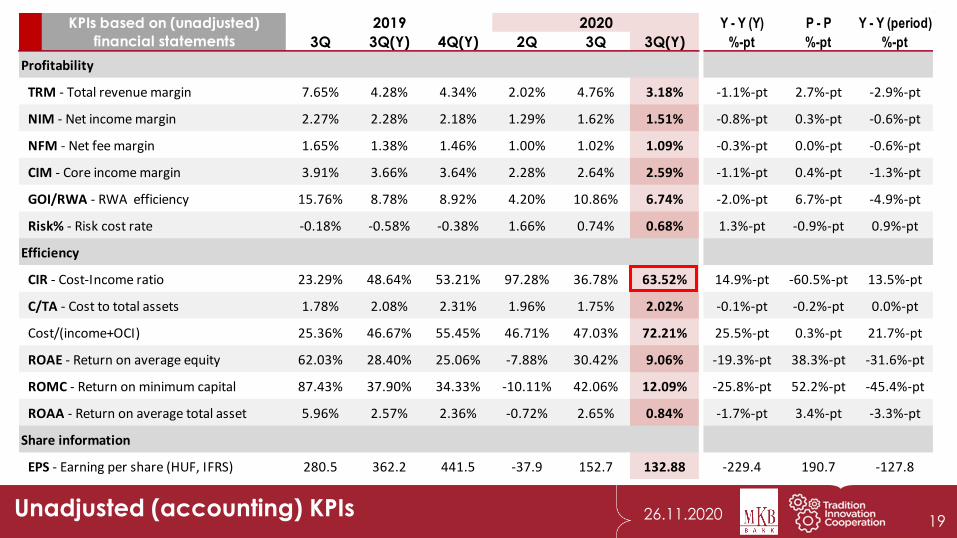
TRM - Total revenue margin 7.65% 4.28% 4.34% 2.02% 4.76% 3.18% -1.1%-pt 2.7%-pt -2.9%-pt
NIM - Net income margin 2.27% 2.28% 2.18% 1.29% 1.62% 1.51% -0.8%-pt 0.3%-pt -0.6%-pt
NFM - Net fee margin 1.65% 1.38% 1.46% 1.00% 1.02% 1.09% -0.3%-pt 0.0%-pt -0.6%-pt
CIM - Core income margin 3.91% 3.66% 3.64% 2.28% 2.64% 2.59% -1.1%-pt 0.4%-pt -1.3%-pt
GOI/RWA - RWA efficiency 15.76% 8.78% 8.92% 4.20% 10.86% 6.74% -2.0%-pt 6.7%-pt -4.9%-pt
Risk% - Risk cost rate -0.18% -0.58% -0.38% 1.66% 0.74% 0.68% 1.3%-pt -0.9%-pt 0.9%-pt
Efficiency
CIR - Cost-Income ratio 23.29% 48.64% 53.21% 97.28% 36.78% 63.52% 14.9%-pt -60.5%-pt 13.5%-pt
C/TA - Cost to total assets 1.78% 2.08% 2.31% 1.96% 1.75% 2.02% -0.1%-pt -0.2%-pt 0.0%-pt
Cost/(income+OCI) 25.36% 46.67% 55.45% 46.71% 47.03% 72.21% 25.5%-pt 0.3%-pt 21.7%-pt
ROAE - Return on average equity 62.03% 28.40% 25.06% -7.88% 30.42% 9.06% -19.3%-pt 38.3%-pt -31.6%-pt
ROMC - Return on minimum capital 87.43% 37.90% 34.33% -10.11% 42.06% 12.09% -25.8%-pt 52.2%-pt -45.4%-pt
ROAA - Return on average total asset 5.96% 2.57% 2.36% -0.72% 2.65% 0.84% -1.7%-pt 3.4%-pt -3.3%-pt
Share information
EPS - Earning per share (HUF, IFRS) 280.5 362.2 441.5 -37.9 152.7 132.88 -229.4 190.7 -127.8
2020KPIs based on (unadjusted)
financial statements
2019
Unadjusted (accounting) KPIs19
26.11.2020
3Q 4Q 2Q 3Q
Volume KPIs
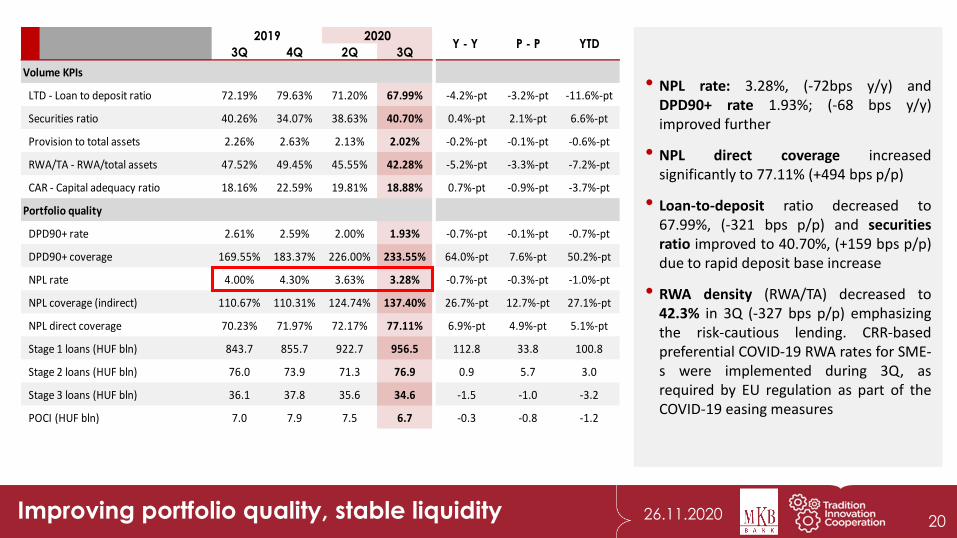
LTD - Loan to deposit ratio 72.19% 79.63% 71.20% 67.99% -4.2%-pt -3.2%-pt -11.6%-pt
Securities ratio 40.26% 34.07% 38.63% 40.70% 0.4%-pt 2.1%-pt 6.6%-pt
Provision to total assets 2.26% 2.63% 2.13% 2.02% -0.2%-pt -0.1%-pt -0.6%-pt
RWA/TA - RWA/total assets 47.52% 49.45% 45.55% 42.28% -5.2%-pt -3.3%-pt -7.2%-pt
CAR - Capital adequacy ratio 18.16% 22.59% 19.81% 18.88% 0.7%-pt -0.9%-pt -3.7%-pt
Portfolio quality
DPD90+ rate 2.61% 2.59% 2.00% 1.93% -0.7%-pt -0.1%-pt -0.7%-pt
DPD90+ coverage 169.55% 183.37% 226.00% 233.55% 64.0%-pt 7.6%-pt 50.2%-pt
NPL rate 4.00% 4.30% 3.63% 3.28% -0.7%-pt -0.3%-pt -1.0%-pt
NPL coverage (indirect) 110.67% 110.31% 124.74% 137.40% 26.7%-pt 12.7%-pt 27.1%-pt
NPL direct coverage 70.23% 71.97% 72.17% 77.11% 6.9%-pt 4.9%-pt 5.1%-pt
Stage 1 loans (HUF bln) 843.7 855.7 922.7 956.5 112.8 33.8 100.8
Stage 2 loans (HUF bln) 76.0 73.9 71.3 76.9 0.9 5.7 3.0
Stage 3 loans (HUF bln) 36.1 37.8 35.6 34.6 -1.5 -1.0 -3.2
POCI (HUF bln) 7.0 7.9 7.5 6.7 -0.3 -0.8 -1.2
YTD2019 2020
Y - Y P - P
Improving portfolio quality, stable liquidity 20
• NPL rate: 3.28%, (-72bps y/y) andDPD90+ rate 1.93%; (-68 bps y/y)improved further
• NPL direct coverage increasedsignificantly to 77.11% (+494 bps p/p)
• Loan-to-deposit ratio decreased to67.99%, (-321 bps p/p) and securitiesratio improved to 40.70%, (+159 bps p/p)due to rapid deposit base increase
• RWA density (RWA/TA) decreased to42.3% in 3Q (-327 bps p/p) emphasizingthe risk-cautious lending. CRR-basedpreferential COVID-19 RWA rates for SME-s were implemented during 3Q, asrequired by EU regulation as part of theCOVID-19 easing measures
21
Executive summary
Business environment
Financials at a glance MKB Group
Adjusted Profit After Tax, Total Comprehensive Income
Profit and Loss, KPIs
Capital positionBusiness income
General administrative expenses
Portfolio quality
Business segments results
Corporate segment
Retail segment
Leasing segment
Investments and Treasury activities
Annexes
Strategic Partners’ Performances
Abbreviations
Disclaimer
26.11.2020Improving capital position due to positive unadjusted TOCI
Capital (HUF bln)
2018
36.2
21.7
-6.6
-0.5
3Q 2019
39.3
-6.013.3
Profit or Loss for the year
Final consolidation
of subsidiaries
13.3
9.5
83.0
21.7
100.0
3Q 2020
-2.0-6.8
83.5
100.0
2Q 2020
-12.8
44.1
25.1
100.0 100.0
21.7
125.4140.4
158.2
190.5
198.5
205.2
6.6
108.0
2016
2.4
100.0
2015
-12.5
21.7
Revaluation reserve
21.7
100.0
39.2
19.2
-2.9
20192017
21.7
-3.5
14.8
100.0
21.7
-6.7
196.4
+4.49%
Profit or Loss for the year Subscribed capital
Revaluation reserve of AFS securities Capital reserve
Retained earnings
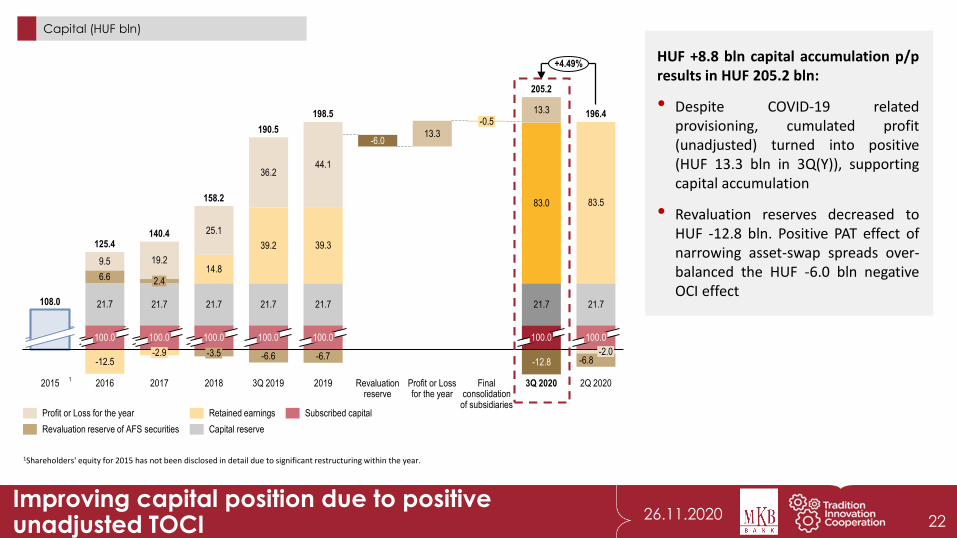
HUF +8.8 bln capital accumulation p/presults in HUF 205.2 bln:
• Despite COVID-19 relatedprovisioning, cumulated profit(unadjusted) turned into positive(HUF 13.3 bln in 3Q(Y)), supportingcapital accumulation
• Revaluation reserves decreased toHUF -12.8 bln. Positive PAT effect ofnarrowing asset-swap spreads over-balanced the HUF -6.0 bln negativeOCI effect
1Shareholders' equity for 2015 has not been disclosed in detail due to significant restructuring within the year.
1
22
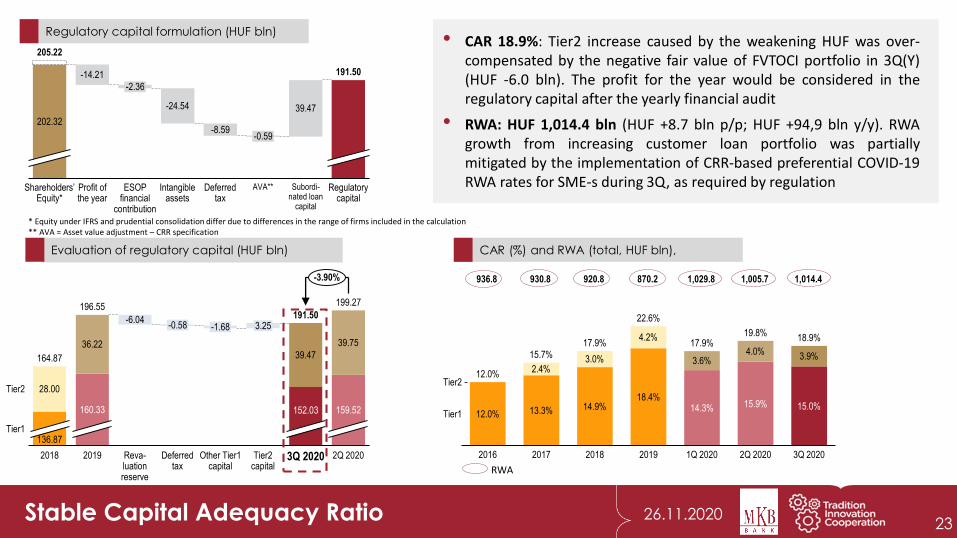
26.11.2020Stable Capital Adequacy Ratio
CAR (%) and RWA (total, HUF bln),
• CAR 18.9%: Tier2 increase caused by the weakening HUF was over-compensated by the negative fair value of FVTOCI portfolio in 3Q(Y)(HUF -6.0 bln). The profit for the year would be considered in theregulatory capital after the yearly financial audit
• RWA: HUF 1,014.4 bln (HUF +8.7 bln p/p; HUF +94,9 bln y/y). RWAgrowth from increasing customer loan portfolio was partiallymitigated by the implementation of CRR-based preferential COVID-19RWA rates for SME-s during 3Q, as required by regulation
870.2920.8 1,014.4936.8 930.8 1,029.8 1,005.7
Evaluation of regulatory capital (HUF bln)
Regulatory capital formulation (HUF bln)
RWA
Regulatory capital
-2.36
202.32
-24.54
Deferred tax
Intangible assets
-8.59
Profit of the year
-0.59
Subordi-nated loan
capital
-14.21 191.50
Shareholders’ Equity*
AVA**
39.47
205.22
ESOP financial
contribution
* Equity under IFRS and prudential consolidation differ due to differences in the range of firms included in the calculation** AVA = Asset value adjustment – CRR specification
Tier1
2019
-1.68
Tier2 capital
2018
3.25-0.58
3Q 2020
39.47
152.03
39.75
159.52
2Q 2020
Tier2
Reva-luation reserve
-6.04
160.33
164.87
196.55191.50
Deferred tax
36.22
136.87
Other Tier1 capital
28.00
199.27
-3.90%
23
12.0%
3Q 20202016
2.4%
14.9%13.3%
2018
3.0%
2017 2Q 2020
15.9%
4.2%
3.6%
18.4%
2019
17.9%
14.3%
1Q 2020
4.0%3.9%
19.8%
15.0%
Tier2
Tier1
12.0%
15.7%
22.6%
17.9%18.9%
24
Executive summary
Business environment
Financials at a glance MKB Group
Adjusted Profit After Tax, Total Comprehensive Income
Profit and Loss, KPIs
Capital position
Business incomeGeneral administrative expenses
Portfolio quality
Business segments results
Corporate segment
Retail segment
Leasing segment
Investments and Treasury activities
Annexes
Strategic Partners’ Performances
Abbreviations
Disclaimer
26.11.2020
4Q 20193Q 2019 2Q 20201Q 2020 3Q 2020
10.58.8
7.8 8.49.3
+0.9
Ne
t in
tere
st
inc
om
e
Ne
t fe
e
inc
om
eC
ore
inc
om
e
2Q 20203Q 2019 3Q 20204Q 2019 1Q 2020
19.8 19.615.8 15.2
18.9
+3.7
0.3
5.2
0.3
5.76.9 7.5
4Q 2019
0.9
3Q 20203Q 2019 1Q 2020
0.1
2Q 2020
5.6
0.3
7.8 7.8
5.36.0 5.9
+0.4
Net fee - government securities trading commission Government securities trading commission
Exte
nd
ed
oth
er
inc
om
e*
4Q 2019
-4.1
-8.6 -6.0
2Q 2020
-4.2-3.4
17.4
3Q 2019
12.04.7
-0.1 -5.1
3Q 2020
6.7
-6.0
1Q 2020
-0.95.9
-3.3+2.0
*other income + FV + OCI
3.284.22 4.24 3.35 2.87
CIM
0.55.4 -4.4 0.8 2.7
Improving GOI components in 3Q
HUF bln
P/P change
25
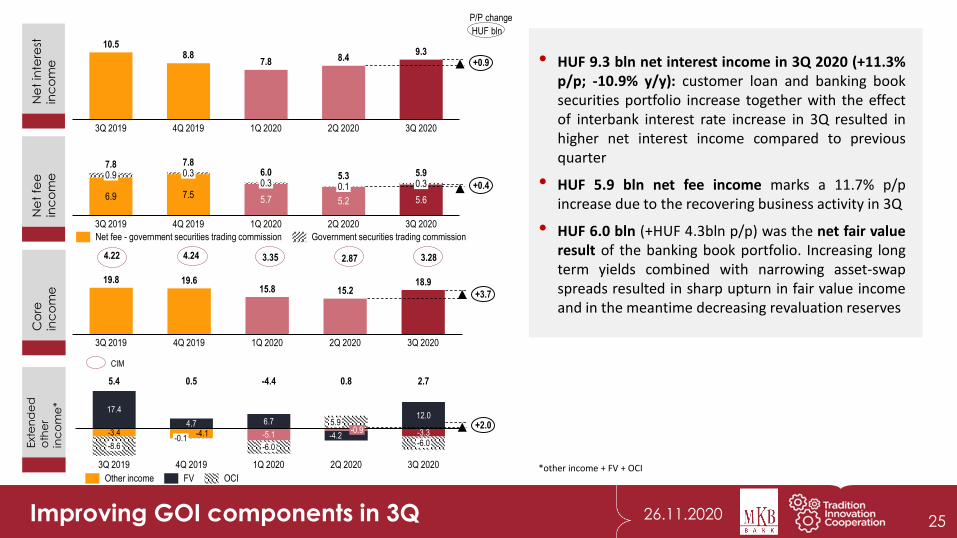
• HUF 9.3 bln net interest income in 3Q 2020 (+11.3%p/p; -10.9% y/y): customer loan and banking booksecurities portfolio increase together with the effectof interbank interest rate increase in 3Q resulted inhigher net interest income compared to previousquarter
• HUF 5.9 bln net fee income marks a 11.7% p/pincrease due to the recovering business activity in 3Q
• HUF 6.0 bln (+HUF 4.3bln p/p) was the net fair valueresult of the banking book portfolio. Increasing longterm yields combined with narrowing asset-swapspreads resulted in sharp upturn in fair value incomeand in the meantime decreasing revaluation reserves
Other income FV OCI
26
Executive summary
Business environment
Financials at a glance MKB Group
Adjusted Profit After Tax, Total Comprehensive Income
Profit and Loss, KPIs
Capital position
Business income
General administrative expensesPortfolio quality
Business segments results
Corporate segment
Retail segment
Leasing segment
Investments and Treasury activities
Annexes
Strategic Partners’ Performances
Abbreviations
Disclaimer
26.11.2020
1.79%
2.24%
2016
2.11%
20.2
1Q 20202017 2018
2.20%
2019
2.09%1.94%
2Q 2020
1.74%
3Q 2020
18.722.3 22.2 21.7 20.7 21.1
2,0051,8921,982 1,953 1,958 1,940 1,970
Cost efficiency (period) and headcount (FTE)
57.57%
73.48%
20192017
54.16%
57.40%
2016
51.05%55.03%
2018
56.90%
69.53%
1Q 2020
77.37%
2Q 2020
54.90%
3Q 2020
CIR
CIR w/o COVID-19 effect adjustements
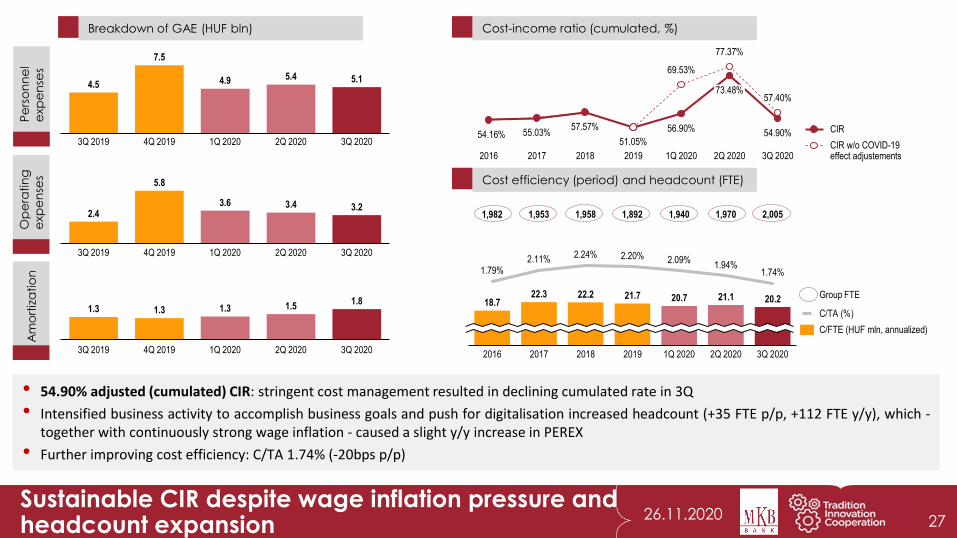
• 54.90% adjusted (cumulated) CIR: stringent cost management resulted in declining cumulated rate in 3Q
• Intensified business activity to accomplish business goals and push for digitalisation increased headcount (+35 FTE p/p, +112 FTE y/y), which -together with continuously strong wage inflation - caused a slight y/y increase in PEREX
• Further improving cost efficiency: C/TA 1.74% (-20bps p/p)
C/TA (%)
C/FTE (HUF mln, annualized)
4.5
7.5
3Q 2019 4Q 2019 1Q 2020
4.9
2Q 2020 3Q 2020
5.4 5.1
5.8
2.4
4Q 20193Q 2019 1Q 2020 2Q 2020
3.2
3Q 2020
3.6 3.4
1.3
3Q 2019 4Q 2019
1.3
1Q 2020 2Q 2020
1.3
3Q 2020
1.51.8
Op
era
tin
g
exp
en
ses
Pe
rso
nn
el
exp
en
ses
Am
ort
iza
tio
nBreakdown of GAE (HUF bln)
Group FTE
Cost-income ratio (cumulated, %)
Sustainable CIR despite wage inflation pressure and headcount expansion 27
28
Executive summary
Business environment
Financials at a glance MKB Group
Adjusted Profit After Tax, Total Comprehensive Income
Profit and Loss, KPIs
Capital position
Business income
General administrative expenses
Portfolio qualityBusiness segments results
Corporate segment
Retail segment
Leasing segment
Investments and Treasury activities
Annexes
Strategic Partners’ Performances
Abbreviations
Disclaimer
26.11.2020NPL rate improves again in 3Q
12.0%
6.0%
0.0%
2.0%
10.0%
4.0%
8.0%
3.6%
NP
L %
1Q 2020
4.0%
3Q 2019
4.3%
4Q 2019
3.9%
2Q 2020
137.4%
74.1%
3.3%
3Q 2020
110.7%
70.2%
110.3%
72.0%
113.0%124.7%
72.2% 77.1%
NPL% Indirect NPL coverage Direct NPL coverage
0.0%
5.0%
10.0%
4Q 2019
2.59%
3Q 2019
188.23%
DP
DP
90+ rate
2.61% 2.35%
1Q 2020
2.00%
2Q 2020
1.93%
226.00%
3Q 2020
169.55%183.37%
233.55%
DPD90+ rateDPD90+ coverage
3.0%
2.0%
-1.0%
1.0%
0.0%
4Q 2019
2.22
4.20
0.12
3Q 2019 1Q 2020 2Q 2020 3Q 2020
2.24
-1.04
Adjusted risk cost rate
Unadjusted risk cost rate
Adjusted risk cost
Adjusted risk cost (HUF bln) and rate (%)
DPD90+ coverage and DPD 90+ rateNPL coverage and NPL rate (IFRS*)
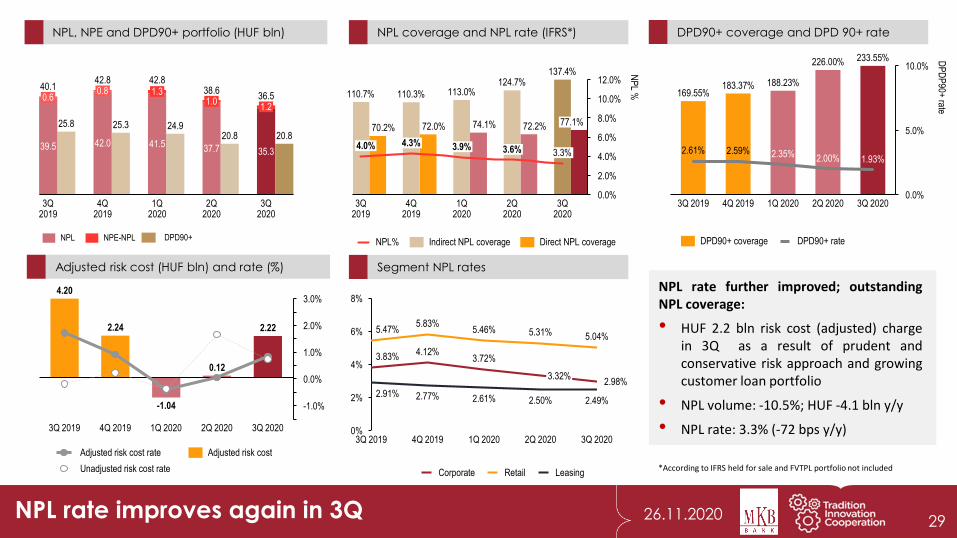
NPL rate further improved; outstandingNPL coverage:
• HUF 2.2 bln risk cost (adjusted) chargein 3Q as a result of prudent andconservative risk approach and growingcustomer loan portfolio
• NPL volume: -10.5%; HUF -4.1 bln y/y
• NPL rate: 3.3% (-72 bps y/y)
NPL, NPE and DPD90+ portfolio (HUF bln)
39.5
0.6
42.0
3Q 2019
0.8
4Q 2019
41.5
1.3
1Q 2020
37.7
1.0
25.3
2Q 2020
35.3
1.2
3Q 2020
40.1
25.8
42.8 42.8
24.9
38.6
20.8
36.5
20.8
NPL NPE-NPL DPD90+
Segment NPL rates
0%
2%
4%
6%
8%
2.50%
5.47%
2Q 2020
3.83%
2.91%
1Q 2020
2.77% 2.61%
3Q 2019
4.12%
5.83%
4Q 2019
3.72%
5.46%
3.32%
5.31%
2.49%
2.98%
5.04%
3Q 2020
Corporate Retail Leasing*According to IFRS held for sale and FVTPL portfolio not included
29
30
Executive summary
Business environment
Financials at a glance MKB Group
Adjusted Profit After Tax, Total Comprehensive Income
Profit and Loss, KPIs
Capital position
Business income
General administrative expenses
Portfolio quality
Business segments resultsCorporate segment
Retail segment
Leasing segment
Investments and Treasury activities
Annexes
Strategic Partners’ Performances
Abbreviations
Disclaimer
26.11.2020
Breakdown of gross customer loans1
(HUF bln)Breakdown of deposits 1,2
(HUF bln)
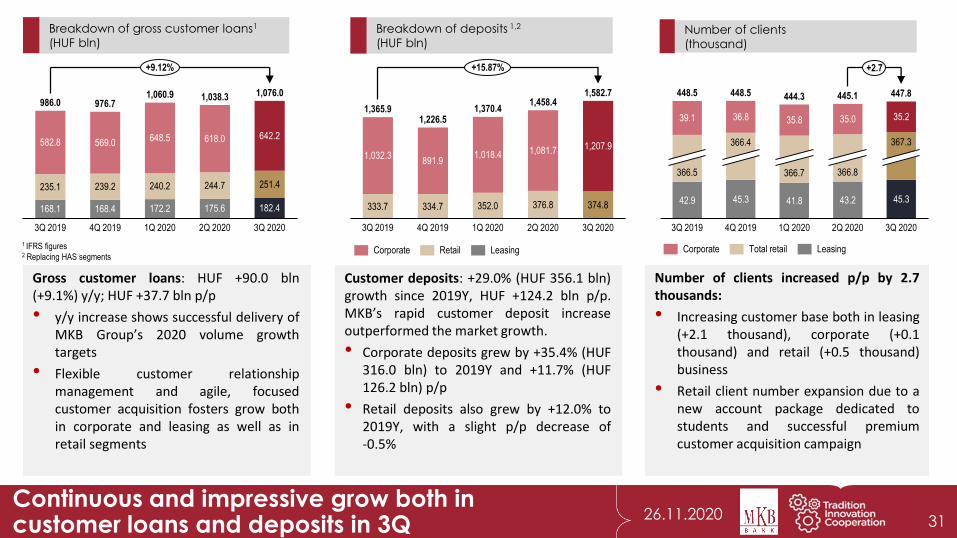
Gross customer loans: HUF +90.0 bln(+9.1%) y/y; HUF +37.7 bln p/p
• y/y increase shows successful delivery ofMKB Group’s 2020 volume growthtargets
• Flexible customer relationshipmanagement and agile, focusedcustomer acquisition fosters grow bothin corporate and leasing as well as inretail segments
582.8 569.0
239.2235.1
168.1
4Q 20193Q 2019
168.4
2Q 2020
648.5
240.2
172.2
1Q 2020
618.0
244.7
175.6
642.2
251.4
1,076.0
182.4
3Q 2020
986.0 976.71,060.9 1,038.3
+9.12%
333.7
4Q 2019
1,370.4
1,207.91,032.3
334.7
3Q 2019
891.91,018.4
352.0
1Q 2020
1,081.7
376.8
2Q 2020
374.8
3Q 2020
1,365.91,226.5
1,458.41,582.7
+15.87%
3Q 2020
448.5
367.3
36.8
448.5
3Q 2019
39.1
366.5
42.9 41.8
366.4
45.3
35.8
445.1
35.0
366.8
447.8
4Q 2019 1Q 2020
366.7
43.2
2Q 2020
35.2
45.3
444.3
+2.7
Number of clients
(thousand)
1 IFRS figures2 Replacing HAS segments
Continuous and impressive grow both in customer loans and deposits in 3Q
Corporate Retail Leasing
31
Number of clients increased p/p by 2.7thousands:
• Increasing customer base both in leasing(+2.1 thousand), corporate (+0.1thousand) and retail (+0.5 thousand)business
• Retail client number expansion due to anew account package dedicated tostudents and successful premiumcustomer acquisition campaign
LeasingCorporate Total retail
Customer deposits: +29.0% (HUF 356.1 bln)growth since 2019Y, HUF +124.2 bln p/p.MKB’s rapid customer deposit increaseoutperformed the market growth.
• Corporate deposits grew by +35.4% (HUF316.0 bln) to 2019Y and +11.7% (HUF126.2 bln) p/p
• Retail deposits also grew by +12.0% to2019Y, with a slight p/p decrease of-0.5%
32
Executive summary
Business environment
Financials at a glance MKB Group
Adjusted Profit After Tax, Total Comprehensive Income
Profit and Loss, KPIs
Capital position
Business income
General administrative expenses
Portfolio quality
Business segments resultsCorporate segment
Retail segment
Leasing segment
Investments and Treasury activities
Annexes
Strategic Partners’ Performances
Abbreviations
Disclaimer
26.11.2020
296.3296.4
28.1
4.89%
3Q 2019
28.1
100.1
4Q 2019
4.98%5.22%
27.6
137.2
270.8
36.3
218.3
5.13%
27.3
36.3
131.7
2Q 2020
4.99%
459.429.8
234.9
101.8
36.3
427.0
28.1
3Q 20201Q 2020
28.8424.5
471.8441.7
130.3194.7
3Q 2019
6.85%
4Q 2019
5.80%6.55% 6.87%
1Q 2020 2Q 2020
7.19%
683.6
3Q 2020
592.7545.8
644.4
774.0
+13.21%
4.23%
25.8
6.60%
3Q 2019
3.97%
1.94%
4Q 2019
2.64%
1Q 2020 2Q 2020 3Q 2020
29.7
15.4
21.4
57.6
Gross corporate loans* breakdown (HUF bln) and
market share** (%)
Corporate loan disbursement* (HUF bln) and
market share** (%)
Market share
Micro
Reclassified to large 2Q
Reclassified to large 1Q
SME
Large
Corporate deposit* (HUF bln) and market
share** (%)
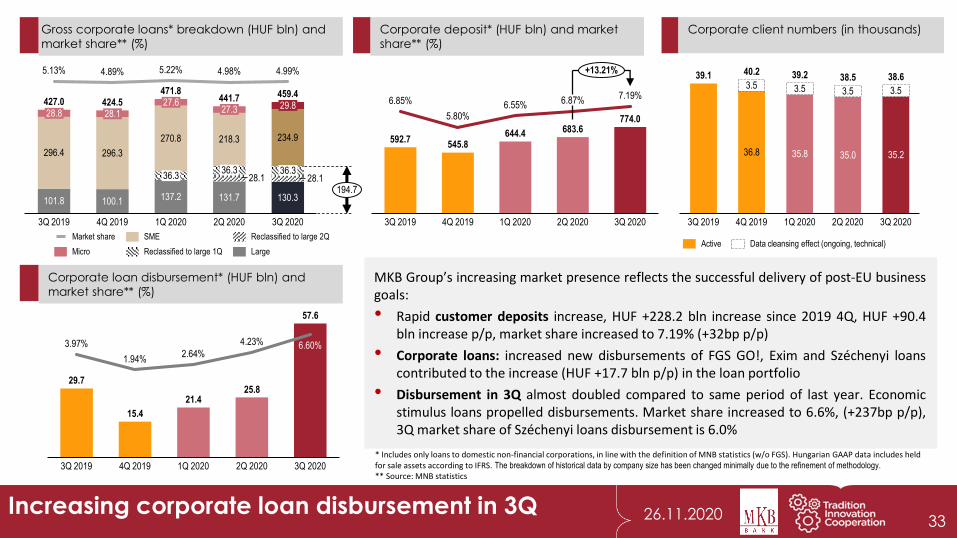
MKB Group’s increasing market presence reflects the successful delivery of post-EU businessgoals:
• Rapid customer deposits increase, HUF +228.2 bln increase since 2019 4Q, HUF +90.4bln increase p/p, market share increased to 7.19% (+32bp p/p)
• Corporate loans: increased new disbursements of FGS GO!, Exim and Széchenyi loanscontributed to the increase (HUF +17.7 bln p/p) in the loan portfolio
• Disbursement in 3Q almost doubled compared to same period of last year. Economicstimulus loans propelled disbursements. Market share increased to 6.6%, (+237bp p/p),3Q market share of Széchenyi loans disbursement is 6.0%
Corporate client numbers (in thousands)
36.8
3Q 2019 1Q 2020
3.5 3.5
4Q 2019
39.2
35.8
3Q 2020
35.0
39.1
3.5
2Q 2020
35.2
3.5
40.238.5 38.6
* Includes only loans to domestic non-financial corporations, in line with the definition of MNB statistics (w/o FGS). Hungarian GAAP data includes held for sale assets according to IFRS. The breakdown of historical data by company size has been changed minimally due to the refinement of methodology.
** Source: MNB statistics
33
Active Data cleansing effect (ongoing, technical)
Increasing corporate loan disbursement in 3Q
34
Executive summary
Business environment
Financials at a glance MKB Group
Adjusted Profit After Tax, Total Comprehensive Income
Profit and Loss, KPIs
Capital position
Business income
General administrative expenses
Portfolio quality
Business segments resultsCorporate segment
Retail segment
Leasing segment
Investments and Treasury activities
Annexes
Strategic Partners’ Performances
Abbreviations
Disclaimer
26.11.2020
23,036,0 42,1 46,9 51,7
4Q 2019
3.24%
200.9
237.6
3.32%
204.4
3Q 2019
195.9
3.33%
3Q 2020
247.5
2Q 2020
3.21%
195.5
236.9
3.15%
195.8
227.4
242.8
1Q 2020
24,7 22,3 22,5 21,8 22,7
4Q 2019
303.2
3.13%3.19%
3.10%
258.4
3Q 2019
3.10%3.02%
264.2
286.5
326.7 327.8
2Q 2020
305.1304.9
3Q 2020
280.7
283.1
1Q 2020
+1.1
Retail gross loans1 (HUF bln) and market share2
(%)
SecuredMarket share Unsecured&other
Deposits 1 (HUF bln) and market share 2
(%)
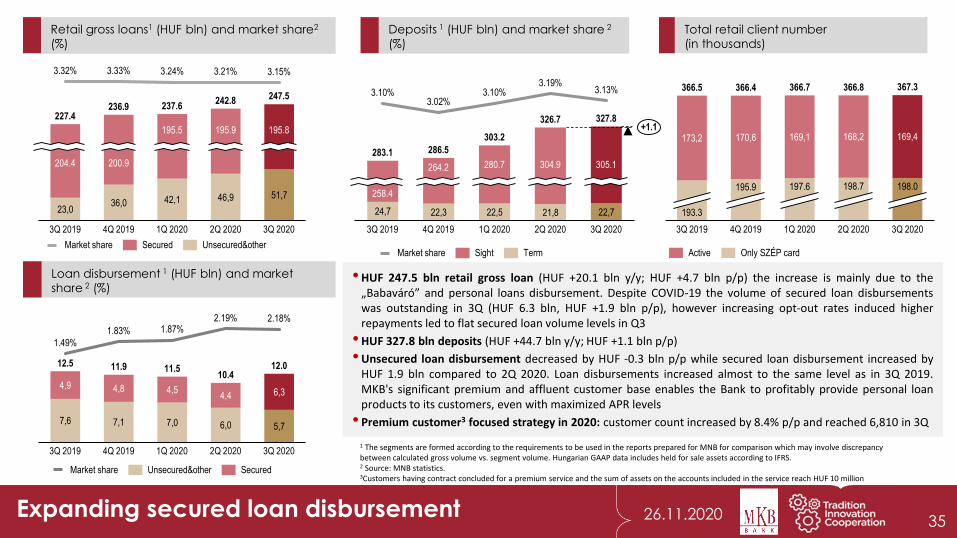
•HUF 247.5 bln retail gross loan (HUF +20.1 bln y/y; HUF +4.7 bln p/p) the increase is mainly due to the„Babaváró” and personal loans disbursement. Despite COVID-19 the volume of secured loan disbursementswas outstanding in 3Q (HUF 6.3 bln, HUF +1.9 bln p/p), however increasing opt-out rates induced higherrepayments led to flat secured loan volume levels in Q3
•HUF 327.8 bln deposits (HUF +44.7 bln y/y; HUF +1.1 bln p/p)
•Unsecured loan disbursement decreased by HUF -0.3 bln p/p while secured loan disbursement increased byHUF 1.9 bln compared to 2Q 2020. Loan disbursements increased almost to the same level as in 3Q 2019.MKB's significant premium and affluent customer base enables the Bank to profitably provide personal loanproducts to its customers, even with maximized APR levels
• Premium customer3 focused strategy in 2020: customer count increased by 8.4% p/p and reached 6,810 in 3Q
Total retail client number
(in thousands)
173,2 170,6 169,1 168,2 169,4
195.9
366.8366.5
198.7
2Q 2020 3Q 2020
366.4 366.7 367.3
3Q 2019
198.0
193.3
197.6
4Q 2019 1Q 2020
Market share TermSight
Expanding secured loan disbursement
7,6 7,1 7,0 6,0 5,7
4,9 4,8 4,54,4 6,3
11.5
1.49%
12.0
1.83%
3Q 2019 4Q 2019
1.87%
1Q 2020
2.19%
2Q 2020
2.18%
3Q 2020
12.5 11.910.4
Unsecured&otherMarket share Secured
Loan disbursement 1 (HUF bln) and market
share 2 (%)
Active Only SZÉP card
1 The segments are formed according to the requirements to be used in the reports prepared for MNB for comparison which may involve discrepancy between calculated gross volume vs. segment volume. Hungarian GAAP data includes held for sale assets according to IFRS. 2 Source: MNB statistics.3Customers having contract concluded for a premium service and the sum of assets on the accounts included in the service reach HUF 10 million
35
26.11.2020
Un
sec
ure
d lo
an
s
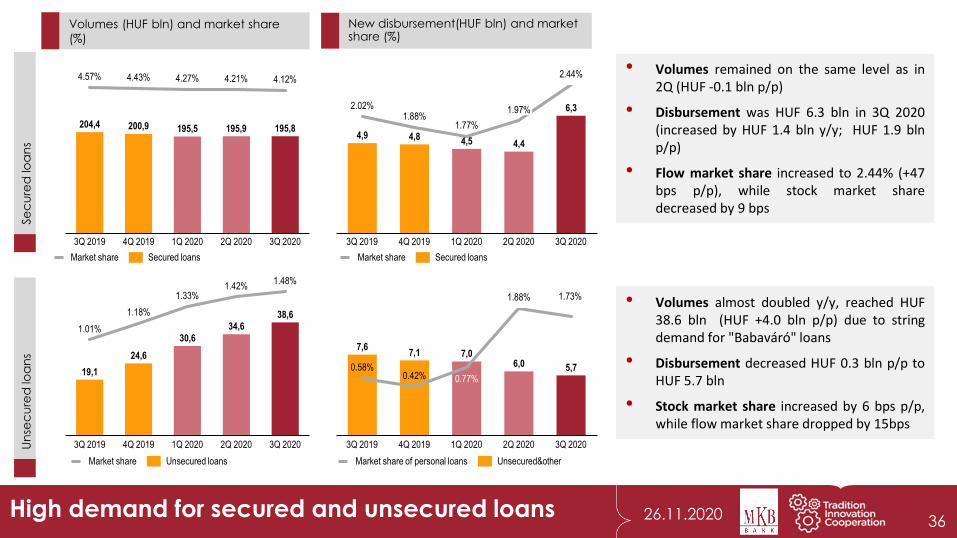
• Volumes remained on the same level as in2Q (HUF -0.1 bln p/p)
• Disbursement was HUF 6.3 bln in 3Q 2020(increased by HUF 1.4 bln y/y; HUF 1.9 blnp/p)
• Flow market share increased to 2.44% (+47bps p/p), while stock market sharedecreased by 9 bps
Se
cu
red
loa
ns
High demand for secured and unsecured loans
204,4 200,9 195,5 195,9 195,8
1Q 2020
4.57%
3Q 2019
4.21%4.43%
4Q 2019
4.27%
2Q 2020
4.12%
3Q 2020
Market share Secured loans
19,1
24,6
30,6
34,638,6
1.01%
3Q 2019 4Q 2019
1.33%
1.18%
1Q 2020
1.42%
2Q 2020
1.48%
3Q 2020
4,9 4,8 4,5 4,4
6,31.97%
1Q 2020
1.77%
2.02%
4Q 20193Q 2019
1.88%
2Q 2020
2.44%
3Q 2020
7,67,1 7,0
6,0 5,70.58%
4Q 20193Q 2019 2Q 2020
0.42% 0.77%
1Q 2020
1.88% 1.73%
3Q 2020
• Volumes almost doubled y/y, reached HUF38.6 bln (HUF +4.0 bln p/p) due to stringdemand for "Babaváró" loans
• Disbursement decreased HUF 0.3 bln p/p toHUF 5.7 bln
• Stock market share increased by 6 bps p/p,while flow market share dropped by 15bps
Market share Secured loans
Unsecured&otherMarket share of personal loans
Volumes (HUF bln) and market share
(%)
New disbursement(HUF bln) and market share (%)
Market share Unsecured loans
36
37
Executive summary
Business environment
Financials at a glance MKB Group
Adjusted Profit After Tax, Total Comprehensive Income
Profit and Loss, KPIs
Capital position
Business income
General administrative expenses
Portfolio quality
Business segments resultsCorporate segment
Retail segment
Leasing segment
Investments and Treasury activities
Annexes
Strategic Partners’ Performances
Abbreviations
Disclaimer
26.11.2020
Active clients (in thousands)Gross volumes by customers (HUF bln)
25.5
42.9
17.2
0.1
3Q 2019 4Q 2019
18.2
26.9
45.3
0.1
16.5
25.2 26.7
0.1
1Q 2020
17.3
25.8
0.1
2Q 2020
18.4
0.1
43.2
3Q 2020
41.845.3
172.2
130.1
1Q 2020
10.8
26.5
130.2 134.6 139.4
10.8
2Q 2020
168.131.7
11.3
168.4
4Q 2019
175.6
182.4
10.2
28.129.3
132.1
3Q 2019
30.2
11.3
3Q 2020
+8.50%
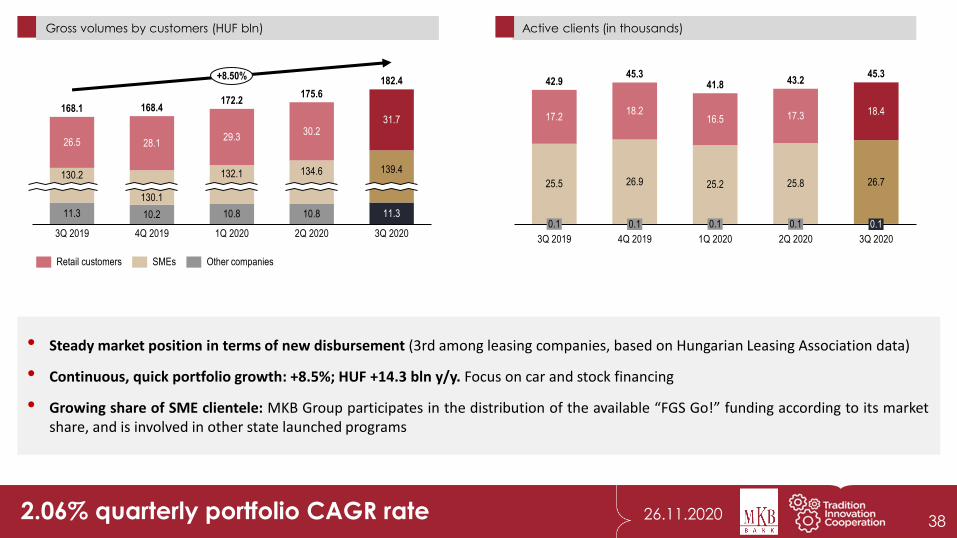
2.06% quarterly portfolio CAGR rate 38
• Steady market position in terms of new disbursement (3rd among leasing companies, based on Hungarian Leasing Association data)
• Continuous, quick portfolio growth: +8.5%; HUF +14.3 bln y/y. Focus on car and stock financing
• Growing share of SME clientele: MKB Group participates in the distribution of the available “FGS Go!” funding according to its marketshare, and is involved in other state launched programs
Retail customers SMEs Other companies
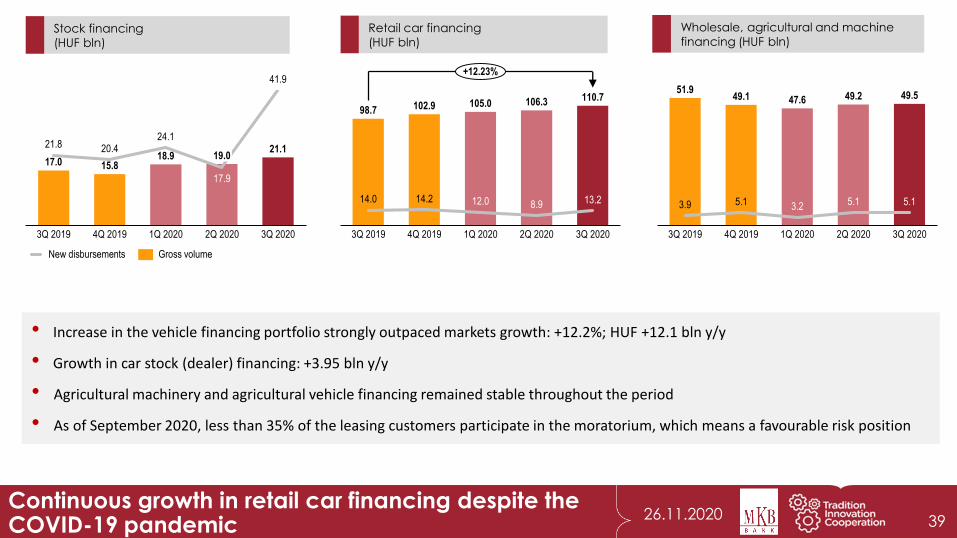
26.11.2020Continuous growth in retail car financing despite the COVID-19 pandemic
Retail car financing
(HUF bln)Stock financing
(HUF bln)
Wholesale, agricultural and machine
financing (HUF bln)
20.4
17.9
21.8
1Q 2020
15.8
3Q 20203Q 2019
24.1
2Q 2020
41.9
4Q 2019
17.018.9 19.0
21.1
New disbursements Gross volume
2Q 2020
12.014.0 14.2
3Q 2019 1Q 20204Q 2019
8.9
98.7
13.2
3Q 2020
102.9 105.0 106.3 110.7
+12.23%
5.1
1Q 2020
3.9
3Q 2019
3.25.1
4Q 2019
49.5
2Q 2020
5.1
3Q 2020
51.949.1 47.6 49.2
39
• Increase in the vehicle financing portfolio strongly outpaced markets growth: +12.2%; HUF +12.1 bln y/y
• Growth in car stock (dealer) financing: +3.95 bln y/y
• Agricultural machinery and agricultural vehicle financing remained stable throughout the period
• As of September 2020, less than 35% of the leasing customers participate in the moratorium, which means a favourable risk position
40
Executive summary
Business environment
Financials at a glance MKB Group
Adjusted Profit After Tax, Total Comprehensive Income
Profit and Loss, KPIs
Capital position
Business income
General administrative expenses
Portfolio quality
Business segments resultsCorporate segment
Retail segment
Leasing segment
Investments and Treasury activities
Annexes
Strategic Partners’ Performances
Abbreviations
Disclaimer

26.11.2020
283,1 286,5 303,2 326,7 327,8
13,0141,5 137,8 121,6 127,6 125,5
349,8 369,8 377,5 383,7 390,3
3.72%3.82%
7.5
781.9
3.74%
3Q 2019
11.3
4Q 2019
3.74%
10.1
1Q 2020
3.78%
805.4
11.7
2Q 2020 3Q 2020
812.4849.7 856.6
Market share
FundsDeposits
Government securitiesBonds
Retail savings (HUF bln) and market
share** (%)• Corporate savings increased to HUF 1.673,5 bln in
3Q (6.1% p/p), driven mostly by deposits inflow,while bond stock decreased
• Government bonds are still the customer’s firstchoice within retail savings: HUF 6.6 bln increasep/p. Market share remained almost stable (-6bpsp/p)
Corporate savings increase drives deposits
891,9
125,0
358,9401,5
371,5369,1
337,01,489.1
3Q 2019
1,673.5
1,018.4
82.5
1,032.3
103.1
4Q 2019 1Q 2020
99.2
1,081.7
2Q 2020
101.1
1,207.9
3Q 2020
1,418.31,473.61,577.6
+6.1%
Deposits
Bonds
Funds
Government securities
Corporate* savings (HUF bln)
Treasury sales*** and trading income (HUF bln)
* Non-financial and financial corporates
** Source: MNB;
***Treasury products and securities
distribution;
41
3Q 2019 4Q 2019 3Q 20201Q 2020 2Q 2020
2.50
3.16 3.243.49
3.05-3.6%
• The stock market volatility remained high in 3Qtherefore the turnover of securities and theresulting revenue were at a similarly high level as inthe previous quarter
• Due to the temporary easing of COVID-19, theturnover of customer FX exchange productsincreased, raising the revenue and profitability oftreasury activities
• Increasing yields had a slightly negative FVTPLrevaluation impact on the profitability of theproprietary trading portfolio
42
Executive summary
Business environment
Financials at a glance MKB Group
Adjusted Profit After Tax, Total Comprehensive Income
Profit and Loss, KPIs
Capital position
Business income
General administrative expenses
Portfolio quality
Business segments results
Corporate segment
Retail segment
Leasing segment
Investments and Treasury activities
AnnexesStrategic Partners’ Performances
Abbreviations
Disclaimer
26.11.2020
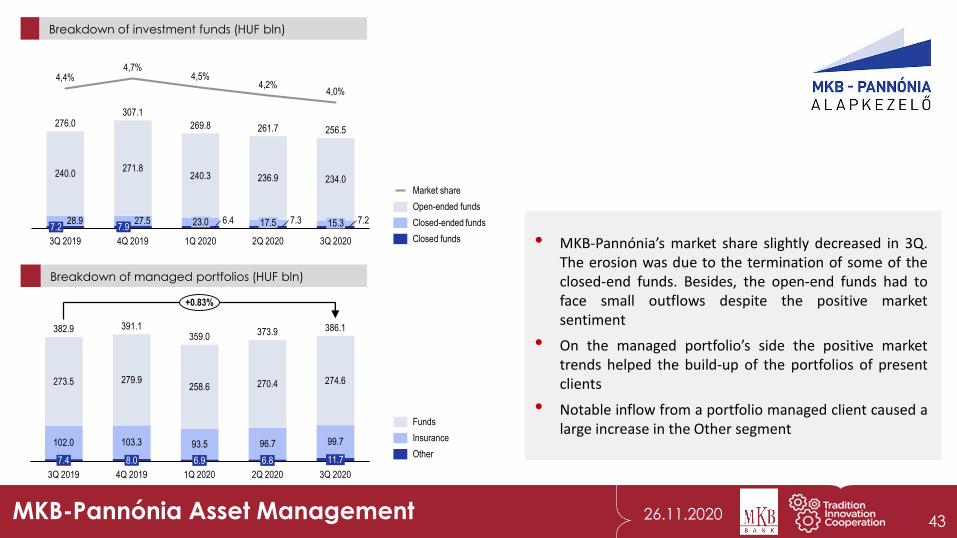
Breakdown of investment funds (HUF bln)
Breakdown of managed portfolios (HUF bln)
• MKB-Pannónia’s market share slightly decreased in 3Q.The erosion was due to the termination of some of theclosed-end funds. Besides, the open-end funds had toface small outflows despite the positive marketsentiment
• On the managed portfolio’s side the positive markettrends helped the build-up of the portfolios of presentclients
• Notable inflow from a portfolio managed client caused alarge increase in the Other segment
102.0 103.3
8.0
273.5
7.4
359.0
6.86.9
279.9
4Q 2019
11.7
3Q 2019
258.6
93.5
1Q 2020
270.4
96.7
2Q 2020
386.1
274.6
99.7
3Q 2020
382.9 391.1373.9
+0.83%
Funds
Other
Insurance
MKB-Pannónia Asset Management
4,4%4,7%
4,5%4,2%
4,0%
27.5
240.0
28.9
236.9271.8
7.2
3Q 2019
7.9
4Q 2019 2Q 2020
240.3
1Q 2020
23.0 6.4
276.0
17.5 7.3
234.0
15.3 7.2
261.7269.8
3Q 2020
307.1
256.5
Market share
Open-ended funds
Closed-ended funds
Closed funds
43
26.11.2020
3Q 2019
13.614.8
3Q 20204Q 2019 1Q 2020 2Q 2020
14.813.6 14.0
Breakdown of total fund assets (HUF bln)
Total fund assets (HUF bln)
153.2
127.8
19.318.8
135.1
3Q 2020
20.0
146.6
1Q 2020
133.7
19.5
2Q 2020
131.4
155.1158.5
150.7
138.2
20.3
4Q 20193Q 2019
Voluntary Pension Fund Private Pension Fund
Number of members (thousand pax)
Number of members (thousand pax)
MKB Funds
78.5
3Q 2020
3.73.7
1Q 2020
82.6
2Q 20204Q 2019
80.4
3Q 2019
3.7
84.283.4
82.2 81.6
3.7
78.9
3.7
78.0
79.7
207.3
4Q 20193Q 2019 1Q 2020
206.5
2Q 2020
208.9
3Q 2020
205.8 205.5
44
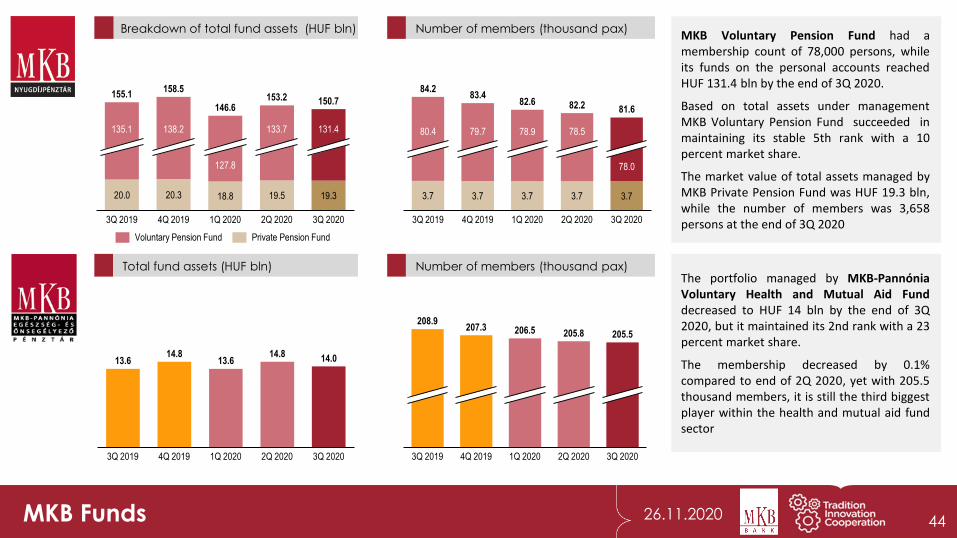
MKB Voluntary Pension Fund had amembership count of 78,000 persons, whileits funds on the personal accounts reachedHUF 131.4 bln by the end of 3Q 2020.
Based on total assets under managementMKB Voluntary Pension Fund succeeded inmaintaining its stable 5th rank with a 10percent market share.
The market value of total assets managed byMKB Private Pension Fund was HUF 19.3 bln,while the number of members was 3,658persons at the end of 3Q 2020
The portfolio managed by MKB-PannóniaVoluntary Health and Mutual Aid Funddecreased to HUF 14 bln by the end of 3Q2020, but it maintained its 2nd rank with a 23percent market share.
The membership decreased by 0.1%compared to end of 2Q 2020, yet with 205.5thousand members, it is still the third biggestplayer within the health and mutual aid fundsector
45
Executive summary
Business environment
Financials at a glance MKB Group
Adjusted Profit After Tax, Total Comprehensive Income
Profit and Loss, KPIs
Capital position
Business income
General administrative expenses
Portfolio quality
Business segments results
Corporate segment
Retail segment
Leasing segment
Investments and Treasury activities
AnnexesStrategic Partners’ Performances
Abbreviations
Disclaimer
26.11.2020Abbreviations 46
MKB Group y/y Year on year
p/p Period on period
bp Basis point
CAGR Compounded Annual Growth Rate
(Y), YTD Year to date data
NPL Non performing loans
NPE Non performing exposures
DPD90+ Days past due over 90 days
MNB, NBH Magyar Nemzeti Bank (the Central Bank of Hungary) POCI Purchased or Originated Credit Impaired Asset
PAT Profit after tax ROE, ROAE Return on average equity
PBT Profit before tax ROMC Return on minimum capital
GOI Gross Operating Income ROA, ROAA Return on average total asset
GAE General Administrative Expenses CIR Cost-to-income ratio
OCI Other comprenesive income TRM Total revenue margin
TOCI Total other comprenesive income NIM Net interest margin
FX FX result NFM Net fee margin
FV Revaluation result CIM Core income margin
IRS Interest rate swap CAR Capital adequacy ratio
TA Total assets LTD Loans to deposits
RWA Risk weighted assets EPS Earning per share
Covered loans Home Loans + Free-to-Use Mortgages AVA Asset value adjustment – CRR specification
FVTOCI Fair value through OCI MÁP+ Hungarian Governmental Securities+
FVTPL Fair value through P&L ÁKK
FTE Full time equivalent
NHP FGS, Funding for Growth Scheme
KSH Hungarian Central Statistical Office
AFR Instant payment system implementation project to comply with NBH
requirements
Hitreg Loan registry requirements of NBH
PSD2 Payment serv ice directive 2
MKB, MKB Bank,
MKB Group
EU commitments Required range of certain EU Commitments marked in brackets, as defined
in the following public document:
https://ec.europa.eu/competition/state_aid/cases/261437/261437_1721348
_166_2.pdf
Please note that specific targets were set within the displayed ranges.
Price of government bond reference yields determined daily by the
National Debt Management Center (ÁKK)
47
Executive summary
Business environment
Financials at a glance MKB Group
Adjusted Profit After Tax, Total Comprehensive Income
Profit and Loss, KPIs
Capital position
Business income
General administrative expenses
Portfolio quality
Business segments results
Corporate segment
Retail segment
Leasing segment
Investments and Treasury activities
Annexes
Strategic Partners’ Performances
Abbreviations
Disclaimer
26.11.2020
DISCLAIMER
This presentation contains statements that are, or maybe deemed to be, “forward-looking statements” which are
prospective in nature. Such statements are qualified in their entirety by the inherent risks and uncertainties surrounding
future expectations. Forward looking statements are not based on historical facts, but rather on current predictions,
expectations, beliefs, opinions, plans, objectives, goals, intentions and projections about future events, results of
operations, prospects, financial condition and discussions of strategy.
By their nature, forward-looking statements involve known and unknown risks and uncertainties, many of which are
beyond the control of MKB Bank. Forward-looking statements are not guarantees of future performance and may and
often do differ materially from actual results. Neither MKB Bank nor any of its subsidiaries or members of its management
bodies, directors, officers or advisers, provides any representation, assurance or guarantee that the occurrence of the
events expressed or implied in any forward-looking statements in this presentation will actually occur. You are cautioned
not to place undue reliance on these forward-looking statements which only speak as of the date of this presentation.
Other than in accordance with its legal or regulatory obligations, MKB Bank is not under any obligation and MKB Bank
and its subsidiaries expressly disclaim any intention, obligation or undertaking to update or revise any forward-looking
statements, whether as a result of new information, future events or otherwise. This presentation shall not, under any
circumstances, create any implication that there has been no change in the business or affairs of MKB Bank since the date
of this presentation nor that the information contained herein is correct as at any time subsequent to its date.
This presentation does not constitute or form part of any offer to purchase or subscribe for any securities. The making of this
presentation does not constitute a recommendation regarding any securities.
The distribution of this presentation in other jurisdictions may be restricted by law and persons into whose possession this
presentation comes should inform themselves about, and observe any such restrictions. Any failure to comply with these
restrictions may constitute a violation of the laws of other jurisdictions.
The information contained in this presentation is provided as of the date of this presentation and is subject to change
without notice.
Investor Relations
Email: [email protected]: 0036-1-268-8004www.mkb.hu/investor
48