Embed Size (px)
Citation preview


Conference Call – 3Q06 Results


Profarma is the fastest growing wholesale distributor of pharmaceutical and personal care products in Brazil
Pharmaceutical Manufacturers Drug Retailers
• 8 Distribution Centers• > 9,100 Orders Daily• Additional Value Added Services
# 120 manufacturersserved by Profarma
# 23,800Points-of-Sale
Supplied by Profarma
SCPR
SP
MGGO
BA
RJES
DF
Distribution Centers
Profarma’s Overview

Key Player
Strong Financial
Performance
Multiple Growth
Opportunities
Proven Track Record
Experienced Management
Team
Positive Sector Dynamics
Investiment thesis

- Profarma’s IPO inaugurates company’s new moment
- Trade of 17.8 million common shares at R$ 22.50
- Gross funding of R$ 401.0 million
- Primary Offer of R$ 310.5 million
- 3Q06 Gross Revenues of R$529 million, 16.4% growth over 3Q05
- Net Income totaled R$ 4.2 million, 20.8% more than in the 3Q05.
- Adjusted EBITDA reached R$ 19.1 million, 11.4% up year-on-year.
Highlights – 3Q05 vs. 3Q06

Gross Revenues Growth R$ Million
823 1,030 1,18434
60103
185
252307
59
101131
2003 2004 2005
873 985
757622925397125
9M2005 9M2006
312 361
283180903547
3Q05 3Q06
25.1%
12.9% 16.4%
1,102
1,4431,725 1,274
1,439455
529

Net Income R$ Million
8.08.9
9M2005 9M2006
3.54.2
3Q05 3Q06
12.0% 20.8%
33.6%
10.6
70.5%
5.9
Net Income, excluding expenses related to the IPO
Net Income

Adjusted EBITDA Adjusted EBITDA (R$ Million)
% of Net Revenues
47.1 61.635.7
2003 2004 2005
48.742.8
9M2005 9M2006
19.117.1
3Q05 3Q06
3.7% 4.1%3.6%
2003 2004 2005
3.8% 3.8%
9M2005 9M2006
4.3% 4.1%
3Q05 3Q06
31.4% 13.8% 11.4%

Operating Expenses% of Net Revenues
General & Administratives
2.14%2.46%
2.02%2.34%
Comercial & Marketing2.34%
2.21% 2.24%2.22%
Logistics & Distribution
2.44%
2.71%2.92% 2.88%
2.23% 2.14%
9M2005 9M2006
General and Administratives
2.51%2.34%
2.44%2.93%
9M2005 9M2006Comercial and Marketing Logistics and Distribution
2.16% 1.94%
3Q05 3Q06
2.83% 2.50%
2.40%2.49%
3Q05 3Q06
6.27%7.56%
9M2005 9M2006
Operating Expenses
7.01% 6.38%
3Q05 3Q06
Operating Expenses7.43%
6.27%
7.11%6.45%
2003 2004 2005 9M2006
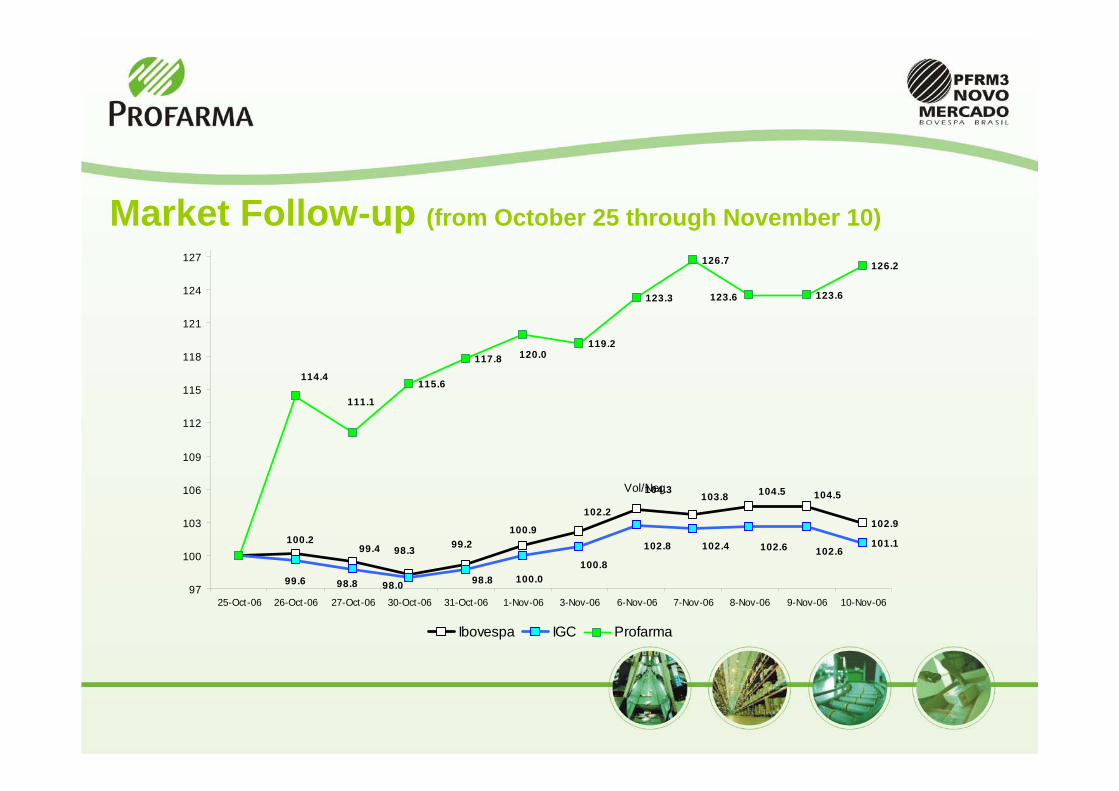
Market Follow-up (from October 25 through November 10)
Vol/Neg
102.9
101.1
115.6
117.8119.2
123.3
126.7
123.6
126.2
104.5104.5103.8104.3
99.4 98.3100.2 99.2
100.9
102.2
102.6102.4 102.6102.8
98.8 98.099.6 100.098.8100.8
123.6
111.1
114.4
120.0
97
100
103
106
109
112
115
118
121
124
127
25-Oct-06 26-Oct-06 27-Oct-06 30-Oct-06 31-Oct-06 1-Nov-06 3-Nov-06 6-Nov-06 7-Nov-06 8-Nov-06 9-Nov-06 10-Nov-06
Ibovespa IGC Profarma


![TSKB 3Q07 IR Presentation[1].ppt · 3Q07 BRSA RESULTS INVESTOR PRESENTATION. TSKB BANKING SECTOR vs TSKB APPENDICES 3. ... (000 USD) 3Q06 3Q07 Change Adj. Net Interest Income 82,829](https://img.pdfslide.net/doc/110x75/5f3cb90e3398b3456406d2bb/tskb-3q07-ir-presentation1-3q07-brsa-results-investor-presentation-tskb-banking.jpg)