Embed Size (px)
Citation preview
3Q15 Earnings Release
November 13, 2015 Page 1 of 28
3Q15 CONSOLIDATED EARNINGS RELEASE
2015
3Q15 Earnings Release
November 13, 2015 Page 2 of 28
EARNINGS CONFERENCE CALL
AGENDA
IN PORTUGUESE Monday (November 16, 2015)
11:00 a.m. (São Paulo) 8:00 a.m. (US Eastern Time) Dial in: +55 (11) 3193-1001
Code: ARTERIS Replay: from November 16 to
November 22 Dial in: +55 (11) 3193-1012
Code: 2241890#
IN ENGLISH (Simultaneous Translation)
Monday (November 16, 2015) 11:00 a.m. (São Paulo)
8:00 a.m. (US Eastern Time) Dial in: +55 (11) 3193-1001
Code: ARTERIS Replay: from November 16 to
November 22 Dial in: +55 (11) 3193-1012
Code: 2580766#
PUBLIC PRESENTATION (in Portuguese only)
Tuesday (November 17, 2015) 9:00 a.m. (São Paulo)
RSVP: [email protected]
WEBCAST Live audio webcast available at
www.ccall.com.br/arteris/3t15.htm with replay available on the
Company’s website after the event.
BM&FBovespa: ARTR3 Bloomberg: ARTR3 BZ Thomson Reuters: ARTR.BR Update on November 12, 2015 Closing Price: R$9.43 per share Market Cap: R$3.2 billion
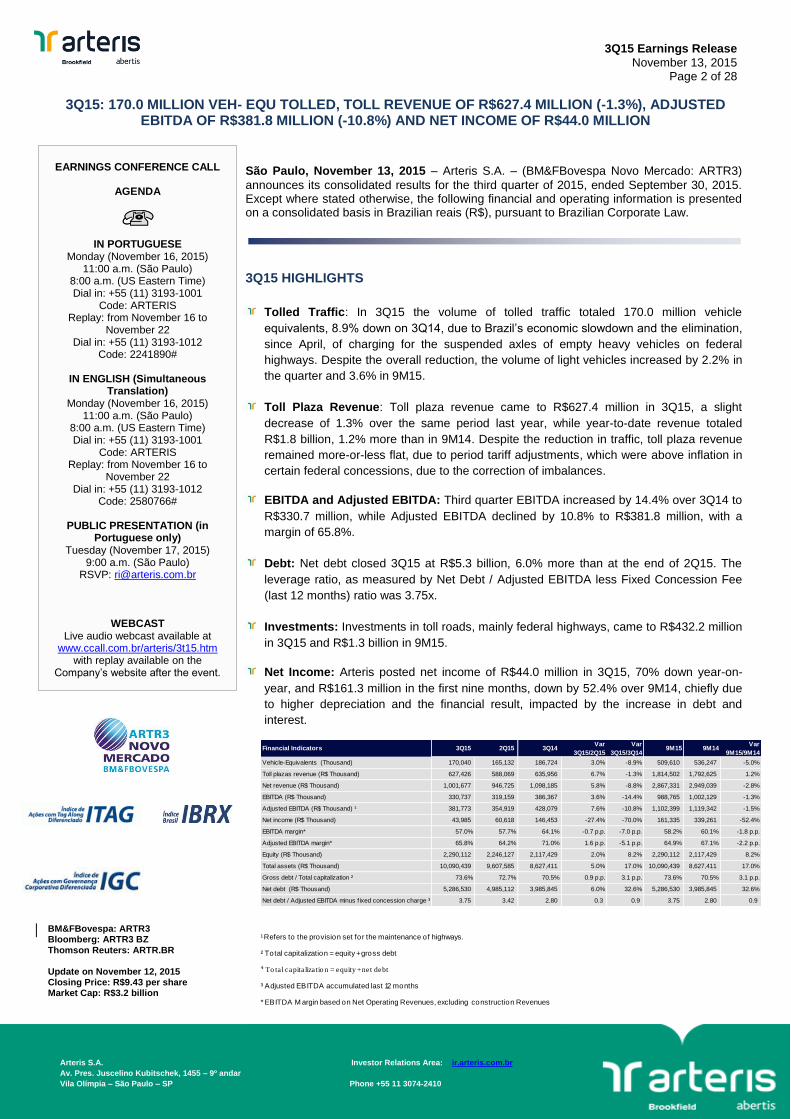
São Paulo, November 13, 2015 – Arteris S.A. – (BM&FBovespa Novo Mercado: ARTR3)
announces its consolidated results for the third quarter of 2015, ended September 30, 2015. Except where stated otherwise, the following financial and operating information is presented on a consolidated basis in Brazilian reais (R$), pursuant to Brazilian Corporate Law.
3Q15 HIGHLIGHTS
Tolled Traffic: In 3Q15 the volume of tolled traffic totaled 170.0 million vehicle
equivalents, 8.9% down on 3Q14, due to Brazil’s economic slowdown and the elimination,
since April, of charging for the suspended axles of empty heavy vehicles on federal
highways. Despite the overall reduction, the volume of light vehicles increased by 2.2% in
the quarter and 3.6% in 9M15.
Toll Plaza Revenue: Toll plaza revenue came to R$627.4 million in 3Q15, a slight
decrease of 1.3% over the same period last year, while year-to-date revenue totaled
R$1.8 billion, 1.2% more than in 9M14. Despite the reduction in traffic, toll plaza revenue
remained more-or-less flat, due to period tariff adjustments, which were above inflation in
certain federal concessions, due to the correction of imbalances.
EBITDA and Adjusted EBITDA: Third quarter EBITDA increased by 14.4% over 3Q14 to
R$330.7 million, while Adjusted EBITDA declined by 10.8% to R$381.8 million, with a
margin of 65.8%.
Debt: Net debt closed 3Q15 at R$5.3 billion, 6.0% more than at the end of 2Q15. The
leverage ratio, as measured by Net Debt / Adjusted EBITDA less Fixed Concession Fee
(last 12 months) ratio was 3.75x.
Investments: Investments in toll roads, mainly federal highways, came to R$432.2 million
in 3Q15 and R$1.3 billion in 9M15.
Net Income: Arteris posted net income of R$44.0 million in 3Q15, 70% down year-on-
year, and R$161.3 million in the first nine months, down by 52.4% over 9M14, chiefly due
to higher depreciation and the financial result, impacted by the increase in debt and
interest.
3Q15: 170.0 MILLION VEH- EQU TOLLED, TOLL REVENUE OF R$627.4 MILLION (-1.3%), ADJUSTED EBITDA OF R$381.8 MILLION (-10.8%) AND NET INCOME OF R$44.0 MILLION
Arteris S.A. Investor Relations Area: ir.arteris.com.br
Av. Pres. Juscelino Kubitschek, 1455 – 9º andar
Vila Olímpia – São Paulo – SP Phone +55 11 3074-2410
CEP 04534-013
¹ Refers to the provision set for the maintenance of highways.
² Total capitalization = equity + gross debt
⁴ To ta l capita liza tio n = equity + net debt
³ Adjusted EBITDA accumulated last 12 months
* EBITDA M argin based on Net Operating Revenues, excluding construction Revenues
Financial Indicators 3Q15 2Q15 3Q14Var
3Q15/2Q15
Var
3Q15/3Q149M15 9M14
Var
9M15/9M14
Vehicle-Equivalents (Thousand) 170,040 165,132 186,724 3.0% -8.9% 509,610 536,247 -5.0%
Toll plazas revenue (R$ Thousand) 627,426 588,069 635,956 6.7% -1.3% 1,814,502 1,792,625 1.2%
Net revenue (R$ Thousand) 1,001,677 946,725 1,098,185 5.8% -8.8% 2,867,331 2,949,039 -2.8%
EBITDA (R$ Thousand) 330,737 319,159 386,367 3.6% -14.4% 988,765 1,002,129 -1.3%
Adjusted EBITDA (R$ Thousand) ¹ 381,773 354,919 428,079 7.6% -10.8% 1,102,399 1,119,342 -1.5%
Net income (R$ Thousand) 43,985 60,618 146,453 -27.4% -70.0% 161,335 339,261 -52.4%
EBITDA margin* 57.0% 57.7% 64.1% -0.7 p.p. -7.0 p.p. 58.2% 60.1% -1.8 p.p.
Adjusted EBITDA margin* 65.8% 64.2% 71.0% 1.6 p.p. -5.1 p.p. 64.9% 67.1% -2.2 p.p.
Equity (R$ Thousand) 2,290,112 2,246,127 2,117,429 2.0% 8.2% 2,290,112 2,117,429 8.2%
Total assets (R$ Thousand) 10,090,439 9,607,585 8,627,411 5.0% 17.0% 10,090,439 8,627,411 17.0%
Gross debt / Total capitalization ² 73.6% 72.7% 70.5% 0.9 p.p. 3.1 p.p. 73.6% 70.5% 3.1 p.p.
Net debt (R$ Thousand) 5,286,530 4,985,112 3,985,845 6.0% 32.6% 5,286,530 3,985,845 32.6%
Net debt / Adjusted EBITDA minus f ixed concession charge ³ 3.75 3.42 2.80 0.3 0.9 3.75 2.80 0.9
3Q15 Earnings Release
November 13, 2015 Page 3 of 28
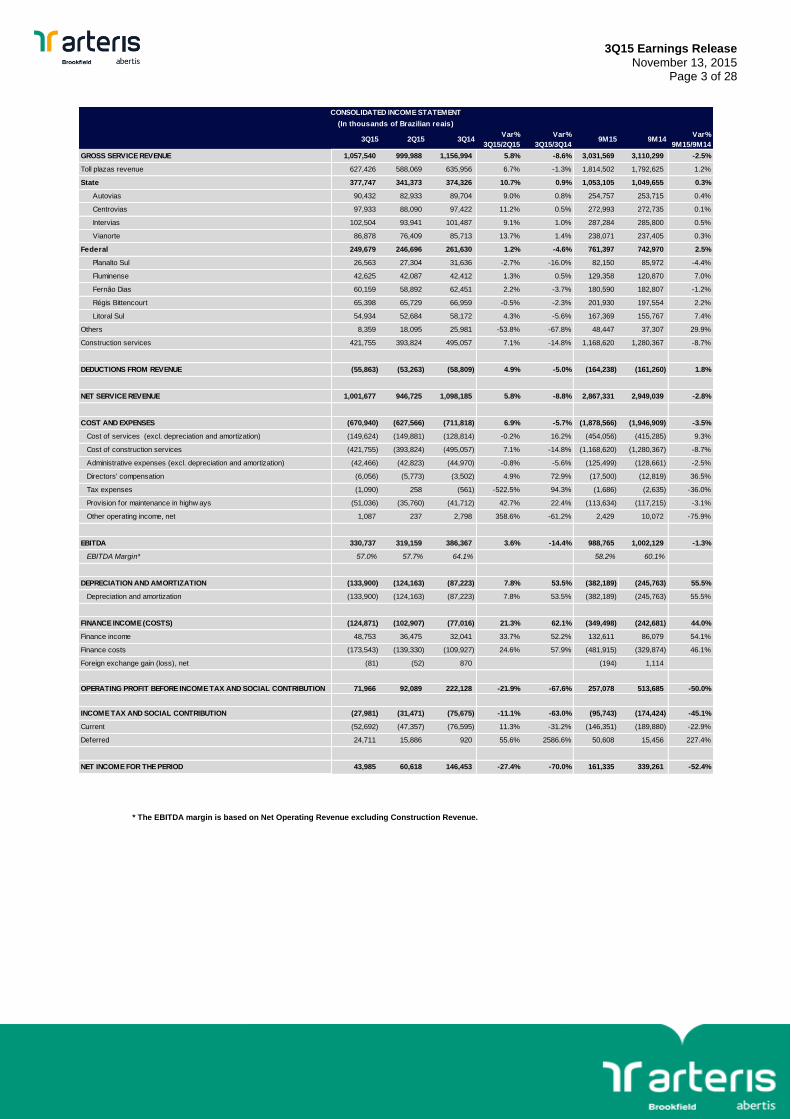
* The EBITDA margin is based on Net Operating Revenue excluding Construction Revenue.
3Q15 2Q15 3Q14Var%
3Q15/2Q15
Var%
3Q15/3Q149M15 9M14
Var%
9M15/9M14
GROSS SERVICE REVENUE 1,057,540 999,988 1,156,994 5.8% -8.6% 3,031,569 3,110,299 -2.5%
Toll plazas revenue 627,426 588,069 635,956 6.7% -1.3% 1,814,502 1,792,625 1.2%
State 377,747 341,373 374,326 10.7% 0.9% 1,053,105 1,049,655 0.3%
Autovias 90,432 82,933 89,704 9.0% 0.8% 254,757 253,715 0.4%
Centrovias 97,933 88,090 97,422 11.2% 0.5% 272,993 272,735 0.1%
Intervias 102,504 93,941 101,487 9.1% 1.0% 287,284 285,800 0.5%
Vianorte 86,878 76,409 85,713 13.7% 1.4% 238,071 237,405 0.3%
Federal 249,679 246,696 261,630 1.2% -4.6% 761,397 742,970 2.5%
Planalto Sul 26,563 27,304 31,636 -2.7% -16.0% 82,150 85,972 -4.4%
Fluminense 42,625 42,087 42,412 1.3% 0.5% 129,358 120,870 7.0%
Fernão Dias 60,159 58,892 62,451 2.2% -3.7% 180,590 182,807 -1.2%
Régis Bittencourt 65,398 65,729 66,959 -0.5% -2.3% 201,930 197,554 2.2%
Litoral Sul 54,934 52,684 58,172 4.3% -5.6% 167,369 155,767 7.4%
Others 8,359 18,095 25,981 -53.8% -67.8% 48,447 37,307 29.9%
Construction services 421,755 393,824 495,057 7.1% -14.8% 1,168,620 1,280,367 -8.7%
DEDUCTIONS FROM REVENUE (55,863) (53,263) (58,809) 4.9% -5.0% (164,238) (161,260) 1.8%
NET SERVICE REVENUE 1,001,677 946,725 1,098,185 5.8% -8.8% 2,867,331 2,949,039 -2.8%
COST AND EXPENSES (670,940) (627,566) (711,818) 6.9% -5.7% (1,878,566) (1,946,909) -3.5%
Cost of services (excl. depreciation and amortization) (149,624) (149,881) (128,814) -0.2% 16.2% (454,056) (415,285) 9.3%
Cost of construction services (421,755) (393,824) (495,057) 7.1% -14.8% (1,168,620) (1,280,367) -8.7%
Administrative expenses (excl. depreciation and amortization) (42,466) (42,823) (44,970) -0.8% -5.6% (125,499) (128,661) -2.5%
Directors' compensation (6,056) (5,773) (3,502) 4.9% 72.9% (17,500) (12,819) 36.5%
Tax expenses (1,090) 258 (561) -522.5% 94.3% (1,686) (2,635) -36.0%
Provision for maintenance in highw ays (51,036) (35,760) (41,712) 42.7% 22.4% (113,634) (117,215) -3.1%
Other operating income, net 1,087 237 2,798 358.6% -61.2% 2,429 10,072 -75.9%
EBITDA 330,737 319,159 386,367 3.6% -14.4% 988,765 1,002,129 -1.3%
EBITDA Margin* 57.0% 57.7% 64.1% 58.2% 60.1%
DEPRECIATION AND AMORTIZATION (133,900) (124,163) (87,223) 7.8% 53.5% (382,189) (245,763) 55.5%
Depreciation and amortization (133,900) (124,163) (87,223) 7.8% 53.5% (382,189) (245,763) 55.5%
FINANCE INCOME (COSTS) (124,871) (102,907) (77,016) 21.3% 62.1% (349,498) (242,681) 44.0%
Finance income 48,753 36,475 32,041 33.7% 52.2% 132,611 86,079 54.1%
Finance costs (173,543) (139,330) (109,927) 24.6% 57.9% (481,915) (329,874) 46.1%
Foreign exchange gain (loss), net (81) (52) 870 (194) 1,114
OPERATING PROFIT BEFORE INCOME TAX AND SOCIAL CONTRIBUTION 71,966 92,089 222,128 -21.9% -67.6% 257,078 513,685 -50.0%
INCOME TAX AND SOCIAL CONTRIBUTION (27,981) (31,471) (75,675) -11.1% -63.0% (95,743) (174,424) -45.1%
Current (52,692) (47,357) (76,595) 11.3% -31.2% (146,351) (189,880) -22.9%
Deferred 24,711 15,886 920 55.6% 2586.6% 50,608 15,456 227.4%
NET INCOME FOR THE PERIOD 43,985 60,618 146,453 -27.4% -70.0% 161,335 339,261 -52.4%
CONSOLIDATED INCOME STATEMENT
(In thousands of Brazilian reais)
3Q15 Earnings Release
November 13, 2015 Page 4 of 28
59%
40%
1%
Toll
Construction
Others
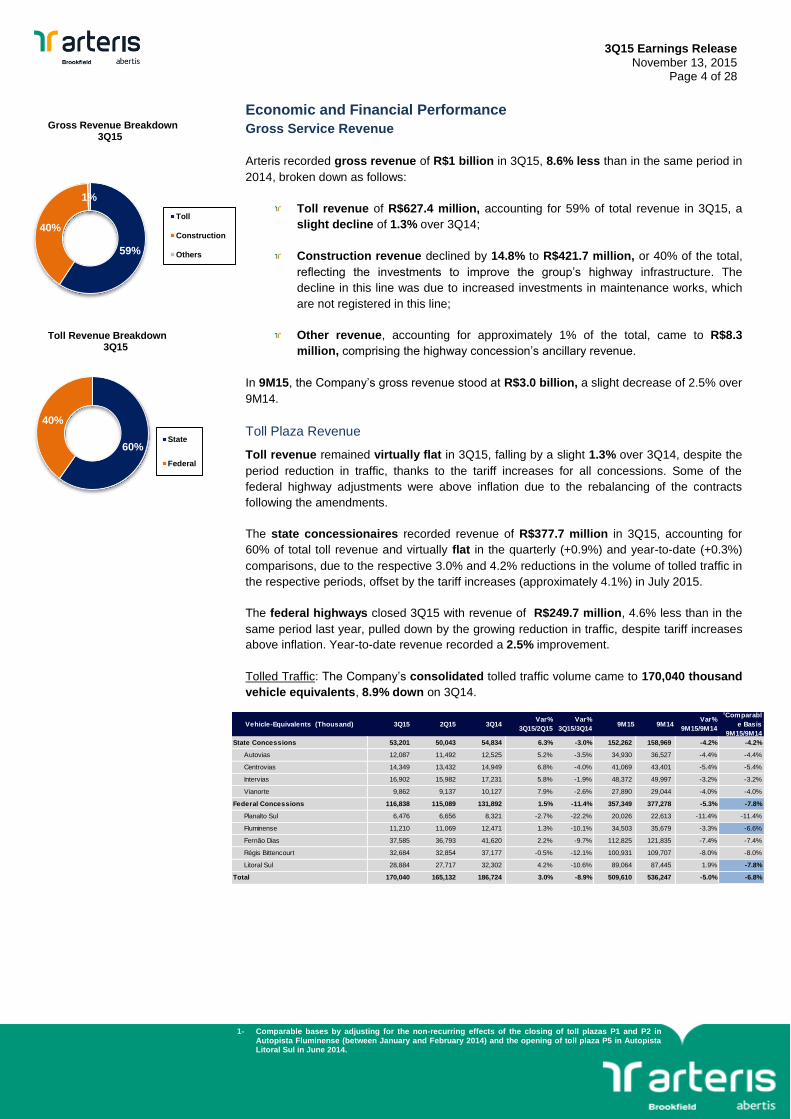
Gross Revenue Breakdown 3Q15
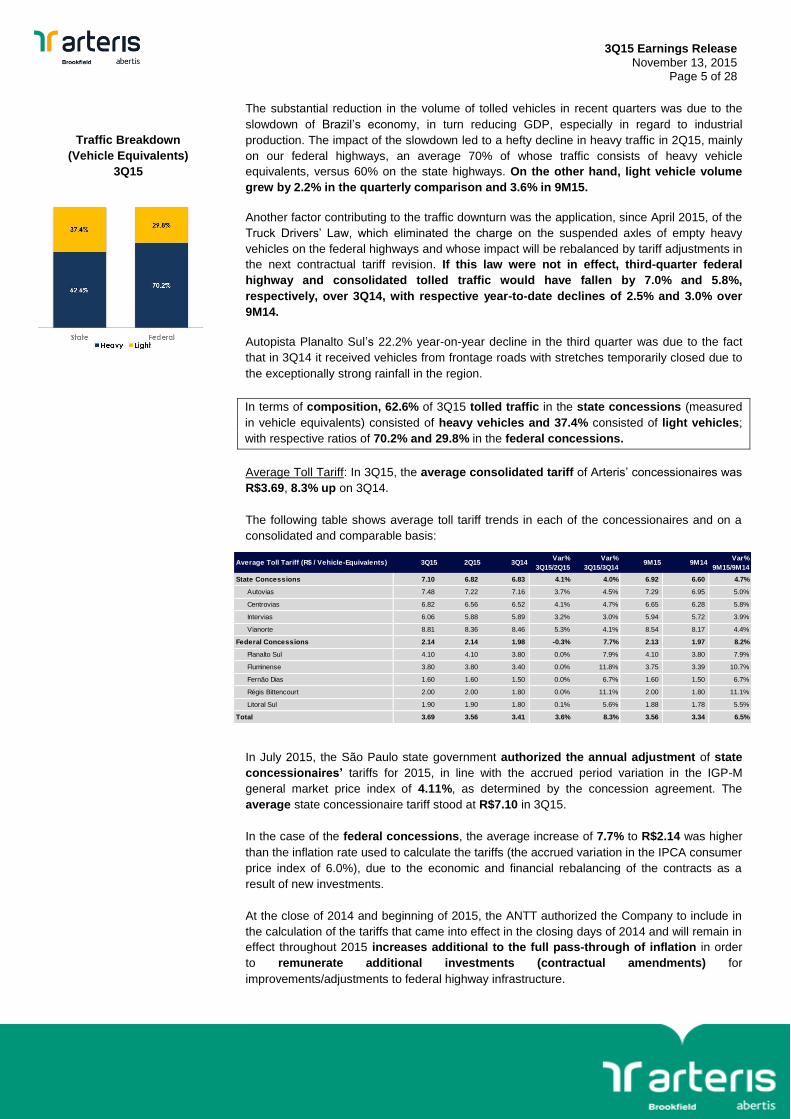
Toll Revenue Breakdown 3Q15
Economic and Financial Performance
Gross Service Revenue
Arteris recorded gross revenue of R$1 billion in 3Q15, 8.6% less than in the same period in
2014, broken down as follows:
Toll revenue of R$627.4 million, accounting for 59% of total revenue in 3Q15, a
slight decline of 1.3% over 3Q14;
Construction revenue declined by 14.8% to R$421.7 million, or 40% of the total,
reflecting the investments to improve the group’s highway infrastructure. The
decline in this line was due to increased investments in maintenance works, which
are not registered in this line;
Other revenue, accounting for approximately 1% of the total, came to R$8.3
million, comprising the highway concession’s ancillary revenue.
In 9M15, the Company’s gross revenue stood at R$3.0 billion, a slight decrease of 2.5% over
9M14.
Toll Plaza Revenue
Toll revenue remained virtually flat in 3Q15, falling by a slight 1.3% over 3Q14, despite the
period reduction in traffic, thanks to the tariff increases for all concessions. Some of the
federal highway adjustments were above inflation due to the rebalancing of the contracts
following the amendments.
The state concessionaires recorded revenue of R$377.7 million in 3Q15, accounting for
60% of total toll revenue and virtually flat in the quarterly (+0.9%) and year-to-date (+0.3%)
comparisons, due to the respective 3.0% and 4.2% reductions in the volume of tolled traffic in
the respective periods, offset by the tariff increases (approximately 4.1%) in July 2015.
The federal highways closed 3Q15 with revenue of R$249.7 million, 4.6% less than in the
same period last year, pulled down by the growing reduction in traffic, despite tariff increases
above inflation. Year-to-date revenue recorded a 2.5% improvement.
Tolled Traffic: The Company’s consolidated tolled traffic volume came to 170,040 thousand
vehicle equivalents, 8.9% down on 3Q14.
1- Comparable bases by adjusting for the non-recurring effects of the closing of toll plazas P1 and P2 in Autopista Fluminense (between January and February 2014) and the opening of toll plaza P5 in Autopista Litoral Sul in June 2014.
60%
40%
State
Federal
Vehicle-Equivalents (Thousand) 3Q15 2Q15 3Q14Var%
3Q15/2Q15
Var%
3Q15/3Q149M15 9M14
Var%
9M15/9M14
1Comparabl
e Basis
9M15/9M14
State Concessions 53,201 50,043 54,834 6.3% -3.0% 152,262 158,969 -4.2% -4.2%
Autovias 12,087 11,492 12,525 5.2% -3.5% 34,930 36,527 -4.4% -4.4%
Centrovias 14,349 13,432 14,949 6.8% -4.0% 41,069 43,401 -5.4% -5.4%
Intervias 16,902 15,982 17,231 5.8% -1.9% 48,372 49,997 -3.2% -3.2%
Vianorte 9,862 9,137 10,127 7.9% -2.6% 27,890 29,044 -4.0% -4.0%
Federal Concessions 116,838 115,089 131,892 1.5% -11.4% 357,349 377,278 -5.3% -7.8%
Planalto Sul 6,476 6,656 8,321 -2.7% -22.2% 20,026 22,613 -11.4% -11.4%
Fluminense 11,210 11,069 12,471 1.3% -10.1% 34,503 35,679 -3.3% -6.6%
Fernão Dias 37,585 36,793 41,620 2.2% -9.7% 112,825 121,835 -7.4% -7.4%
Régis Bittencourt 32,684 32,854 37,177 -0.5% -12.1% 100,931 109,707 -8.0% -8.0%
Litoral Sul 28,884 27,717 32,302 4.2% -10.6% 89,064 87,445 1.9% -7.8%
Total 170,040 165,132 186,724 3.0% -8.9% 509,610 536,247 -5.0% -6.8%
3Q15 Earnings Release
November 13, 2015 Page 5 of 28
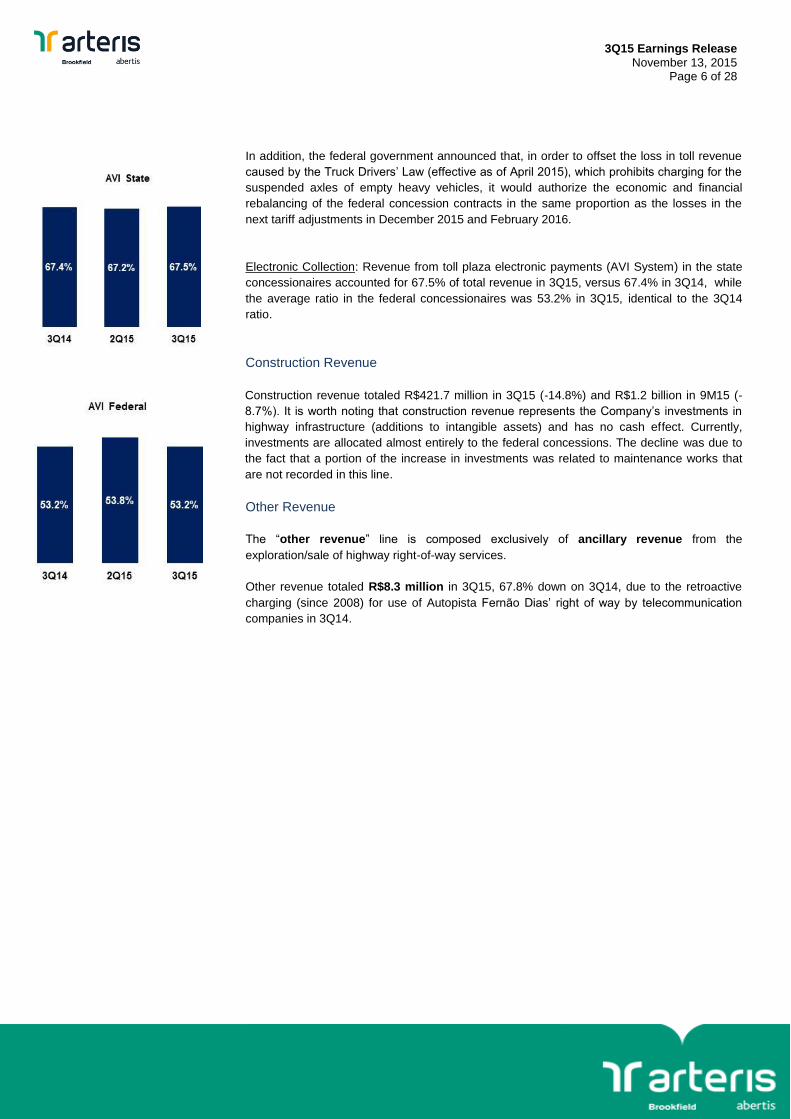
Traffic Breakdown
(Vehicle Equivalents)
3Q15
The substantial reduction in the volume of tolled vehicles in recent quarters was due to the
slowdown of Brazil’s economy, in turn reducing GDP, especially in regard to industrial
production. The impact of the slowdown led to a hefty decline in heavy traffic in 2Q15, mainly
on our federal highways, an average 70% of whose traffic consists of heavy vehicle
equivalents, versus 60% on the state highways. On the other hand, light vehicle volume
grew by 2.2% in the quarterly comparison and 3.6% in 9M15.
Another factor contributing to the traffic downturn was the application, since April 2015, of the
Truck Drivers’ Law, which eliminated the charge on the suspended axles of empty heavy
vehicles on the federal highways and whose impact will be rebalanced by tariff adjustments in
the next contractual tariff revision. If this law were not in effect, third-quarter federal
highway and consolidated tolled traffic would have fallen by 7.0% and 5.8%,
respectively, over 3Q14, with respective year-to-date declines of 2.5% and 3.0% over
9M14.
Autopista Planalto Sul’s 22.2% year-on-year decline in the third quarter was due to the fact
that in 3Q14 it received vehicles from frontage roads with stretches temporarily closed due to
the exceptionally strong rainfall in the region.
In terms of composition, 62.6% of 3Q15 tolled traffic in the state concessions (measured
in vehicle equivalents) consisted of heavy vehicles and 37.4% consisted of light vehicles;
with respective ratios of 70.2% and 29.8% in the federal concessions.
Average Toll Tariff: In 3Q15, the average consolidated tariff of Arteris’ concessionaires was
R$3.69, 8.3% up on 3Q14.
The following table shows average toll tariff trends in each of the concessionaires and on a
consolidated and comparable basis:
In July 2015, the São Paulo state government authorized the annual adjustment of state
concessionaires’ tariffs for 2015, in line with the accrued period variation in the IGP-M
general market price index of 4.11%, as determined by the concession agreement. The
average state concessionaire tariff stood at R$7.10 in 3Q15.
In the case of the federal concessions, the average increase of 7.7% to R$2.14 was higher
than the inflation rate used to calculate the tariffs (the accrued variation in the IPCA consumer
price index of 6.0%), due to the economic and financial rebalancing of the contracts as a
result of new investments.
At the close of 2014 and beginning of 2015, the ANTT authorized the Company to include in
the calculation of the tariffs that came into effect in the closing days of 2014 and will remain in
effect throughout 2015 increases additional to the full pass-through of inflation in order
to remunerate additional investments (contractual amendments) for
improvements/adjustments to federal highway infrastructure.
Average Toll Tariff (R$ / Vehicle-Equivalents) 3Q15 2Q15 3Q14Var%
3Q15/2Q15
Var%
3Q15/3Q149M15 9M14
Var%
9M15/9M14
State Concessions 7.10 6.82 6.83 4.1% 4.0% 6.92 6.60 4.7%
Autovias 7.48 7.22 7.16 3.7% 4.5% 7.29 6.95 5.0%
Centrovias 6.82 6.56 6.52 4.1% 4.7% 6.65 6.28 5.8%
Intervias 6.06 5.88 5.89 3.2% 3.0% 5.94 5.72 3.9%
Vianorte 8.81 8.36 8.46 5.3% 4.1% 8.54 8.17 4.4%
Federal Concessions 2.14 2.14 1.98 -0.3% 7.7% 2.13 1.97 8.2%
Planalto Sul 4.10 4.10 3.80 0.0% 7.9% 4.10 3.80 7.9%
Fluminense 3.80 3.80 3.40 0.0% 11.8% 3.75 3.39 10.7%
Fernão Dias 1.60 1.60 1.50 0.0% 6.7% 1.60 1.50 6.7%
Régis Bittencourt 2.00 2.00 1.80 0.0% 11.1% 2.00 1.80 11.1%
Litoral Sul 1.90 1.90 1.80 0.1% 5.6% 1.88 1.78 5.5%
Total 3.69 3.56 3.41 3.6% 8.3% 3.56 3.34 6.5%
3Q15 Earnings Release
November 13, 2015 Page 6 of 28
In addition, the federal government announced that, in order to offset the loss in toll revenue
caused by the Truck Drivers’ Law (effective as of April 2015), which prohibits charging for the
suspended axles of empty heavy vehicles, it would authorize the economic and financial
rebalancing of the federal concession contracts in the same proportion as the losses in the
next tariff adjustments in December 2015 and February 2016.
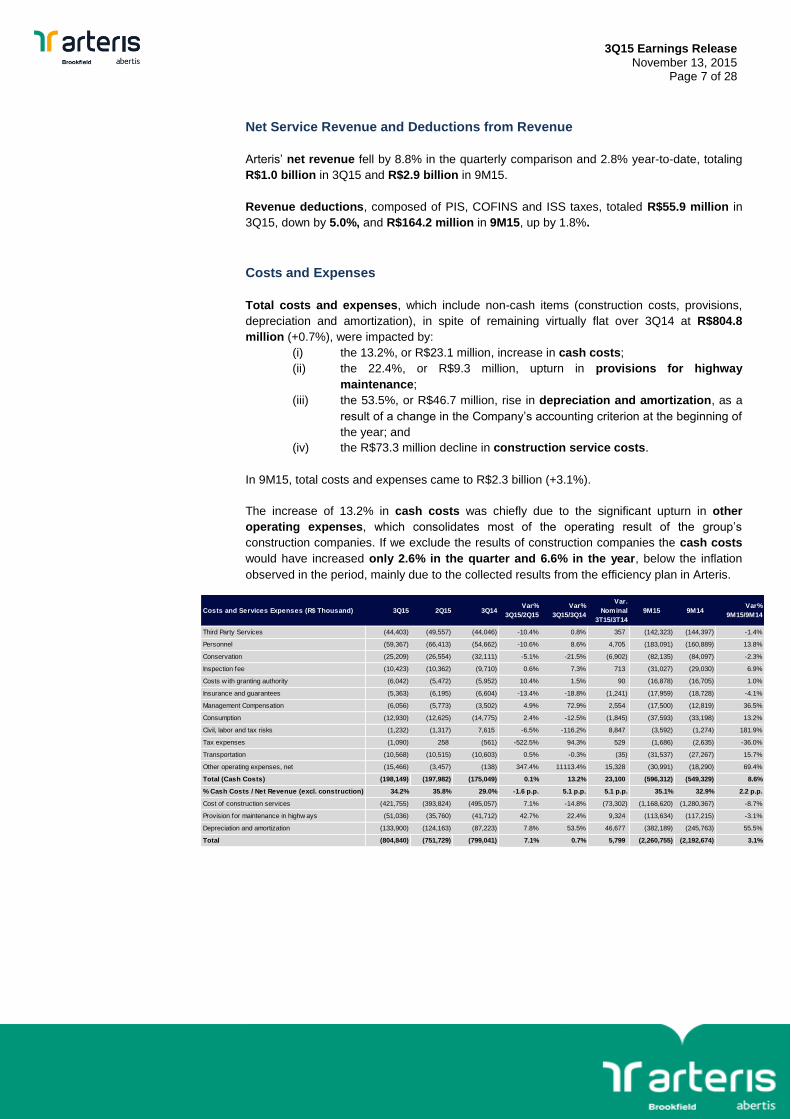
Electronic Collection: Revenue from toll plaza electronic payments (AVI System) in the state
concessionaires accounted for 67.5% of total revenue in 3Q15, versus 67.4% in 3Q14, while
the average ratio in the federal concessionaires was 53.2% in 3Q15, identical to the 3Q14
ratio.
Construction Revenue
Construction revenue totaled R$421.7 million in 3Q15 (-14.8%) and R$1.2 billion in 9M15 (-
8.7%). It is worth noting that construction revenue represents the Company’s investments in
highway infrastructure (additions to intangible assets) and has no cash effect. Currently,
investments are allocated almost entirely to the federal concessions. The decline was due to
the fact that a portion of the increase in investments was related to maintenance works that
are not recorded in this line.
Other Revenue
The “other revenue” line is composed exclusively of ancillary revenue from the
exploration/sale of highway right-of-way services.
Other revenue totaled R$8.3 million in 3Q15, 67.8% down on 3Q14, due to the retroactive
charging (since 2008) for use of Autopista Fernão Dias’ right of way by telecommunication
companies in 3Q14.
3Q15 Earnings Release
November 13, 2015 Page 7 of 28
Net Service Revenue and Deductions from Revenue
Arteris’ net revenue fell by 8.8% in the quarterly comparison and 2.8% year-to-date, totaling
R$1.0 billion in 3Q15 and R$2.9 billion in 9M15.
Revenue deductions, composed of PIS, COFINS and ISS taxes, totaled R$55.9 million in
3Q15, down by 5.0%, and R$164.2 million in 9M15, up by 1.8%.
Costs and Expenses
Total costs and expenses, which include non-cash items (construction costs, provisions,
depreciation and amortization), in spite of remaining virtually flat over 3Q14 at R$804.8
million (+0.7%), were impacted by:
(i) the 13.2%, or R$23.1 million, increase in cash costs;
(ii) the 22.4%, or R$9.3 million, upturn in provisions for highway
maintenance;
(iii) the 53.5%, or R$46.7 million, rise in depreciation and amortization, as a
result of a change in the Company’s accounting criterion at the beginning of
the year; and
(iv) the R$73.3 million decline in construction service costs.
In 9M15, total costs and expenses came to R$2.3 billion (+3.1%).
The increase of 13.2% in cash costs was chiefly due to the significant upturn in other
operating expenses, which consolidates most of the operating result of the group’s
construction companies. If we exclude the results of construction companies the cash costs
would have increased only 2.6% in the quarter and 6.6% in the year, below the inflation
observed in the period, mainly due to the collected results from the efficiency plan in Arteris.
Costs and Services Expenses (R$ Thousand) 3Q15 2Q15 3Q14Var%
3Q15/2Q15
Var%
3Q15/3Q14
Var.
Nominal
3T15/3T14
9M15 9M14Var%
9M15/9M14
Third Party Services (44,403) (49,557) (44,046) -10.4% 0.8% 357 (142,323) (144,397) -1.4%
Personnel (59,367) (66,413) (54,662) -10.6% 8.6% 4,705 (183,091) (160,889) 13.8%
Conservation (25,209) (26,554) (32,111) -5.1% -21.5% (6,902) (82,135) (84,097) -2.3%
Inspection fee (10,423) (10,362) (9,710) 0.6% 7.3% 713 (31,027) (29,030) 6.9%
Costs w ith granting authority (6,042) (5,472) (5,952) 10.4% 1.5% 90 (16,878) (16,705) 1.0%
Insurance and guarantees (5,363) (6,195) (6,604) -13.4% -18.8% (1,241) (17,959) (18,728) -4.1%
Management Compensation (6,056) (5,773) (3,502) 4.9% 72.9% 2,554 (17,500) (12,819) 36.5%
Consumption (12,930) (12,625) (14,775) 2.4% -12.5% (1,845) (37,593) (33,198) 13.2%
Civil, labor and tax risks (1,232) (1,317) 7,615 -6.5% -116.2% 8,847 (3,592) (1,274) 181.9%
Tax expenses (1,090) 258 (561) -522.5% 94.3% 529 (1,686) (2,635) -36.0%
Transportation (10,568) (10,515) (10,603) 0.5% -0.3% (35) (31,537) (27,267) 15.7%
Other operating expenses, net (15,466) (3,457) (138) 347.4% 11113.4% 15,328 (30,991) (18,290) 69.4%
Total (Cash Costs) (198,149) (197,982) (175,049) 0.1% 13.2% 23,100 (596,312) (549,329) 8.6%
% Cash Costs / Net Revenue (excl. construction) 34.2% 35.8% 29.0% -1.6 p.p. 5.1 p.p. 5.1 p.p. 35.1% 32.9% 2.2 p.p.
Cost of construction services (421,755) (393,824) (495,057) 7.1% -14.8% (73,302) (1,168,620) (1,280,367) -8.7%
Provision for maintenance in highw ays (51,036) (35,760) (41,712) 42.7% 22.4% 9,324 (113,634) (117,215) -3.1%
Depreciation and amortization (133,900) (124,163) (87,223) 7.8% 53.5% 46,677 (382,189) (245,763) 55.5%
Total (804,840) (751,729) (799,041) 7.1% 0.7% 5,799 (2,260,755) (2,192,674) 3.1%
3Q15 Earnings Release
November 13, 2015 Page 8 of 28
The main variations in cash costs between the periods were as follows:
Third-party services: Third-party services remained virtually flat over 3Q14 at
R$44.4 million (+0.8%), and declined by 1.4% year-on-year in 9M15 to R$142.3
million, due to the insourcing of Autovias’ previously outsourced toll collectors at the
close of 2014 and Autopista Planalto Sul’s collectors in April 2015, costs that have
been booked under personnel costs since then, in addition to the initiatives of the
group’s ongoing program to increase efficiency, including the renegotiation of
service provision contracts and the implementation of an electronic auction system
for hiring third parties.
Personnel: Personnel costs came to R$59.4 million in 3Q15 (+8.6%) and R$183.1
million in 9M15 (+13.8%), the upturns being due to the insourcing of Autovias’ and
Autopista Planalto Sul’s previously outsourced toll collectors. The number of
engineering area professionals also increased at Autopistas Litoral Sul and
Fluminense, due to the intensification of the works on the Florianópolis Beltway and
the duplication of the BR-101, respectively. This line was also impacted by
severance pay for certain employees whose jobs were outsourced. Intervias, for
example, outsourced a number of its pre-hospital treatment team. In addition, the
state concessions restructured their engineering areas to optimize resources and
reduce costs, given that the degree of maturity of these concessions permits such
restructuring. These operational changes were the result of internal analyses and
decisions and were designed to make Arteris more efficient in terms of current
investments.
Conservation: Conservation costs fell 21.5% over 3Q14, to R$25.2 million. This is a
variable cost which depends on the period volume of highway repaving and
infrastructure works, and the weather conditions in the regions where the works are
taking place. It is also worth noting the improvement in the cost of contracting these
services due to the electronic auction system for hiring third parties. These costs
totaled R$82.1 million in 9M15, 2.3% down on 9M14.
Inspection: These amounts are paid by the federal highways to the granting
authority (ANTT) and are adjusted annually in accordance with the IPCA consumer
price index. These fees totaled R$10.4 million in 3Q15, 7.3% more than in the same
period the year before, and R$31.0 million in 9M15, 6.9% up year-on-year.
Costs with the granting authority: These refer to the transfer of 1.5% of the gross
toll revenue of the state concessionaires to the granting authority in the state of São
Paulo (ARTESP), totaling R$6.0 million in 3Q15.
Insurance and Guarantees: These costs, which basically refer to insurance policies
related to engineering risk, fleet risk and performance bonds, totaled R$5.4 million in
3Q15, 18.8% down on 3Q14, due to more effective contract renewal negotiations. In
9M15, this item totaled R$17.9 million, 4.1% down on 9M14.
3Q15 Earnings Release
November 13, 2015 Page 9 of 28
Management Compensation: Management compensation totaled R$6.0 million in
3Q15, higher than in 3Q14 due to the reorganization of the Company’s
organizational structure, including the exit of two members of the holding company’s
statutory Board of Executive Officers in 3Q14.
Consumption: This line includes expenses related to telephony; lighting and other
electricity expenses of the business units, toll plazas and highway stretches;
administrative materials (such as office supplies); signage materials (such as traffic
cones and special signs); and materials used in traffic campaigns (pamphlets and
booklets). The 12.5% downturn over 3Q14 was due to tighter control over expenses
with signage materials and materials used in traffic campaigns, given that they had
increased in 3Q14. Consumption expenses totaled R$37.6 million in 9M15, 13.2%
more than in 9M14.
Civil, Labor and Tax Risks: The amounts in this item refer to expectations of a
probable loss in lawsuits involving Arteris and its subsidiaries. These costs totaled
R$0.7 million in 3Q15 and R$3.1 million in 9M15.
Transportation: This line includes expenses related to fuel consumption and rental
and maintenance of the light vehicle fleet (traffic inspection, administrative vehicles
and own rescue vehicles) and heavy vehicle fleet (tow trucks, water tankers, fire
trucks and animal capture trucks, among others) of all of the group’s
concessionaires. In 3Q15, these costs came to R$10.6 million, virtually flat over
3Q14 (-0.3%). In 9M15, there was a 15.7% year-on-year increase to R$31.5 million.
The government-imposed upturn in fuel prices has been negatively impacting this
line throughout the year, as has the expansion of the Company’s fleet to comply with
the services required by the concession agreements.
Other operating expenses: These refer to the result of the works of the group’s
construction companies, provided exclusively to Arteris, as well as other items
related to the operation of the Company’s concessionaires. The result of the group’s
construction companies accounts for the “other operating expenses” line and is
variable in nature, depending on the volume of works contracted by the
concessionaires to outsourced firms. These expenses totaled R$15.9 million in
3Q15, R$15.8 million more than in 3Q14, chiefly due to the R$18.2 million decline in
the operating margin of the construction subsidiaries, from a positive R$14.7 million
in 3Q14 to a negative R$3.5 million in 3Q15. In 9M15, these expenses increased by
72.1% to R$31.5 million.
3Q15 Earnings Release
November 13, 2015 Page 10 of 28
The main changes in non-cash costs were:
Construction costs: These costs, which are related to the accounting recognition of
the Company’s investments in intangible assets, almost all of which allocated to
federal highway infrastructure improvements, totaled R$421.7 million in 3Q15
(-14.8%) and R$1.2 billion in 9M15 (-8.7%).
Provisions for maintenance: These costs totaled R$51.0 million in 3Q15, up by
22.4%, and refer to the constitution of reserves related to future disbursements for
paving maintenance and renewal on the highways under concession. The Company
adjusts these provisions every quarter as it reviews and updates expectations
regarding the timing and amount of these disbursements. In 9M15, the amount
provisioned totaled R$113.6 million, 3.1% down on the same period last year.
Depreciation and amortization: Depreciation and amortization are related to the
adoption of IFRS rules, which require the complete amortization of intangible assets
by the end of the concession period. In 2015, the Company changed the criterion for
amortizing its intangible assets from the traffic curve method to the straight line
method. This change was responsible for the 53.5% upturn in the Company’s
amortizations, which increased from R$87.2 million in 3Q14 to R$133.9 million in
3Q15. In 9M15, this line came to R$382.2 million, 55.5% more than in 9M14.
3Q15 Earnings Release
November 13, 2015 Page 11 of 28
EBITDA and Adjusted EBITDA
Arteris reported EBITDA of R$330.7 million in 3Q15, 14.4% down on 3Q14, while EBITDA
adjusted for provisions for highway maintenance, which does not have a cash effect, totaled
R$381.8 million in 3Q15, 10.8% down year-on-year. The EBITDA margin declined by 7.0 p.p.
in 3Q15 and the adjusted EBITDA margin fell by 5.1p.p.
The main factors that reduced adjusted EBITDA by R$46.3 million (-10.8%) were as follows:
(i) Reduced toll revenue due to the economic crisis and the Truck Drivers’ Law;
(ii) The R$17.6 million decline in other revenue, following the recognition of non-
recurring revenue in 3Q14 due to the retroactive charge for the use of the right
of way by telecommunication companies;
(iii) The R$23.1 million upturn in cash costs, as already explained.
* The EBITDA Margin and the adjusted EBITDA Margin are based on Net Operating Revenue excluding Construction Revenue.
¹ EBITDA is Earnings before Interest, Taxes, Depreciation and Amortization, an operating performance indicator. EBITDA is not a measure
adopted in accounting standards and does not represent cash flow for the periods presented and therefore should not be considered an
alternative to cash flow as an indicator of liquidity. EBITDA does not have a standardized meaning and therefore cannot be compared to the
EBITDA of other companies.
² Includes adjustments related to reversals of the provision for highway maintenance (accounting pronouncement ICPC 01).
It is important to note that Arteris’ consolidated EBITDA is composed not only of the results
of its state and federal concessionaires, but also includes the structures of its holding
company and construction companies.
In order to permit a better analysis of the Company’s operating result, the table below gives
a breakdown of Adjusted EBITDA.
3Q15 2Q15 3Q14Var%
3Q15/2Q15
Var%
3Q15/3Q149M15 9M14
Var%
9M15/9M14
NET REVENUE 1,001,677 946,725 1,098,185 5.8% -8.8% 2,867,331 2,949,039 -2.8%
Cost and expenses (excl. depreciation and amortization) (670,940) (627,566) (711,818) 6.9% -5.7% (1,878,566) (1,946,911) -3.5%
EBITDA ¹ 330,737 319,159 386,367 3.6% -14.4% 988,765 1,002,127 -1.3%
EBITDA Margin* 57.0% 57.7% 64.1% -0.7 p.p. -7.0 p.p. 58.2% 60.1% -1.8 p.p.
(+) Provision for maintenance in highw ays 51,036 35,760 41,712 42.7% 22.4% 113,634 117,215 -3.1%
Adjusted EBITDA ² 381,773 354,919 428,079 7.6% -10.8% 1,102,399 1,119,342 -1.5%
Adjusted EBITDA Margin* 65.8% 64.2% 71.0% 1.6 p.p. -5.1 p.p. 64.9% 67.1% -2.2 p.p.
EBITDA
(In thousands of Brazilian reais)
Ebitda Ajustado (R$ Mil) 3Q15 2Q15 3Q14Var%
3Q15/2Q15
Var%
3Q15/3Q149M15 9M14
Var%
9M15/9M14
Ebitda Ajustado - Consolidado 381,773 354,919 428,079 7.6% -10.8% 1,102,399 1,119,342 -1.5%
Estaduais 281,543 245,308 279,411 14.8% 0.8% 769,311 778,063 -1.1%
Federais 106,841 103,086 133,267 3.6% -19.8% 335,756 326,261 2.9%
Holding (3,120) (1,137) 720 174.4% -533.3% (6,410) 1,640 -490.9%
Construtoras (3,491) 7,662 14,681 -145.6% -123.8% 3,742 13,378 -72.0%
3Q15 Earnings Release
November 13, 2015 Page 12 of 28
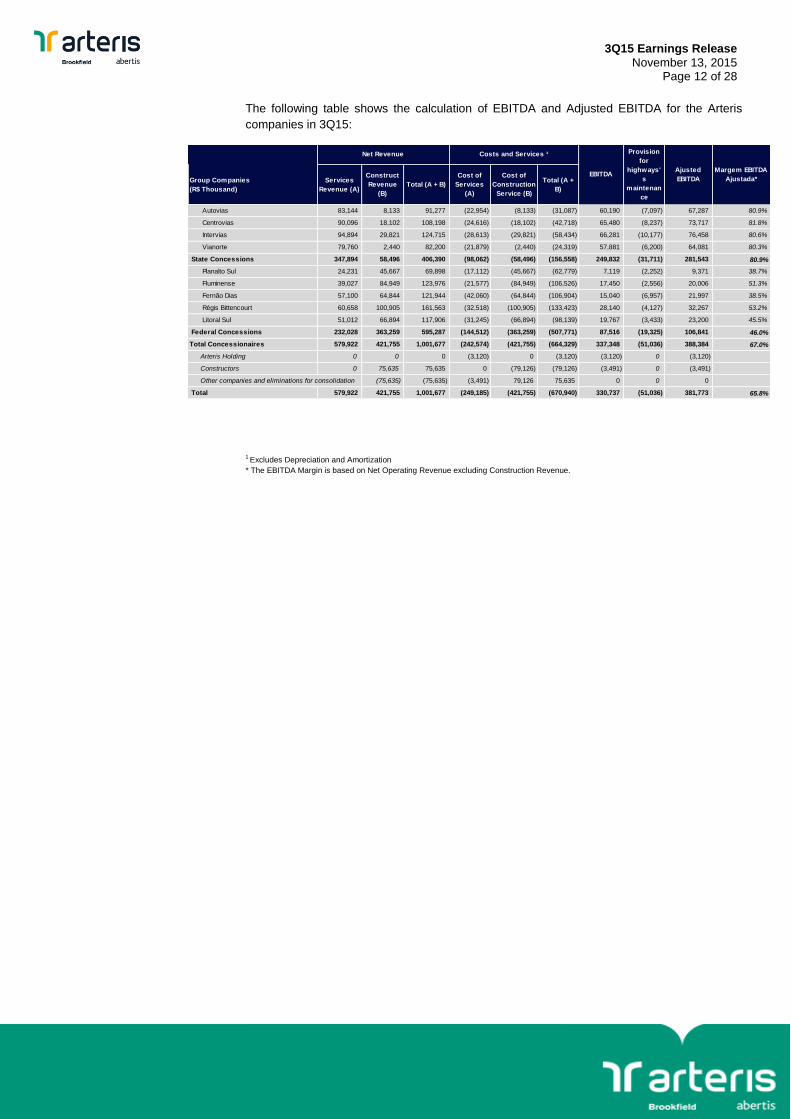
The following table shows the calculation of EBITDA and Adjusted EBITDA for the Arteris
companies in 3Q15:
1 Excludes Depreciation and Amortization
* The EBITDA Margin is based on Net Operating Revenue excluding Construction Revenue.
Indicadores Financeiros 4T14 3T14 4T13Var%
4T14/3T14
Var%
4T14/4T132014 2013
Var%
2014/2013
Veículos equivalentes (Mil) 190.048 186.724 184.980 1,8% 2,7% 726.295 717.096 1,3%
Receita de pedágio (R$ Mil) 639.226 635.956 603.834 0,5% 5,9% 2.431.851 2.300.436 5,7%
Receita líquida (R$ Mil) 1.069.094 1.098.185 940.690 -2,6% 13,6% 4.018.133 3.377.474 19,0%
EBITDA (R$ Mil) 354.953 386.367 328.659 -8,1% 8,0% 1.357.080 1.232.769 10,1%
EBITDA Ajustado (R$ Mil) ¹ 383.201 428.079 374.227 -10,5% 2,4% 1.502.543 1.428.798 5,2%
Lucro líquido (R$ Mil) 117.604 146.453 137.618 -19,7% -14,5% 456.864 466.341 -2,0%
Margem EBITDA* 60,0% 64,1% 58,9% -4,1 p.p. 1,0 p.p. 60,0% 58,2% 1,8 p.p.
Margem EBITDA ajustado* 64,7% 71,0% 67,1% -6,2 p.p. -2,4 p.p. 66,5% 67,4% -1,0 p.p.
Patrimônio líquido (R$ Mil) 2.128.781 2.117.429 1.879.573 0,5% 13,3% 2.128.781 1.879.573 13,3%
Ativos totais (R$ Mil) 9.607.477 8.627.411 7.369.011 11,4% 30,4% 9.607.477 7.369.011 30,4%
Dívida bruta / Capitalização total ² 74,0% 70,5% 68,7% 3,5 p.p. 5,3 p.p. 74,0% 68,7% 0,1 p.p.
Dívida líquida 4.382.817 3.985.845 3.083.830 10,0% 42,1% 4.382.817 3.083.830 42,1%
Dívida líquida / EBITDA ajustado excl. ônus f ixo ³ 3,1 2,8 2,3 0,3 0,8 3,1 2,3 0,3
Group Companies
(R$ Thousand)
Services
Revenue (A)
Construct
Revenue
(B)
Total (A + B)
Cost of
Services
(A)
Cost of
Construction
Service (B)
Total (A +
B)
Autovias 83,144 8,133 91,277 (22,954) (8,133) (31,087) 60,190 (7,097) 67,287 80.9%
Centrovias 90,096 18,102 108,198 (24,616) (18,102) (42,718) 65,480 (8,237) 73,717 81.8%
Intervias 94,894 29,821 124,715 (28,613) (29,821) (58,434) 66,281 (10,177) 76,458 80.6%
Vianorte 79,760 2,440 82,200 (21,879) (2,440) (24,319) 57,881 (6,200) 64,081 80.3%
State Concessions 347,894 58,496 406,390 (98,062) (58,496) (156,558) 249,832 (31,711) 281,543 80.9%
Planalto Sul 24,231 45,667 69,898 (17,112) (45,667) (62,779) 7,119 (2,252) 9,371 38.7%
Fluminense 39,027 84,949 123,976 (21,577) (84,949) (106,526) 17,450 (2,556) 20,006 51.3%
Fernão Dias 57,100 64,844 121,944 (42,060) (64,844) (106,904) 15,040 (6,957) 21,997 38.5%
Régis Bittencourt 60,658 100,905 161,563 (32,518) (100,905) (133,423) 28,140 (4,127) 32,267 53.2%
Litoral Sul 51,012 66,894 117,906 (31,245) (66,894) (98,139) 19,767 (3,433) 23,200 45.5%
Federal Concessions 232,028 363,259 595,287 (144,512) (363,259) (507,771) 87,516 (19,325) 106,841 46.0%
Total Concessionaires 579,922 421,755 1,001,677 (242,574) (421,755) (664,329) 337,348 (51,036) 388,384 67.0%
Arteris Holding 0 0 0 (3,120) 0 (3,120) (3,120) 0 (3,120)
Constructors 0 75,635 75,635 0 (79,126) (79,126) (3,491) 0 (3,491)
Other companies and eliminations for consolidation (75,635) (75,635) (3,491) 79,126 75,635 0 0 0
Total 579,922 421,755 1,001,677 (249,185) (421,755) (670,940) 330,737 (51,036) 381,773 65.8%
Ajusted
EBITDA
Costs and Services ¹
Margem EBITDA
Ajustada*
Net Revenue
EBITDA
Provision
for
highways'
s
maintenan
ce
3Q15 Earnings Release
November 13, 2015 Page 13 of 28
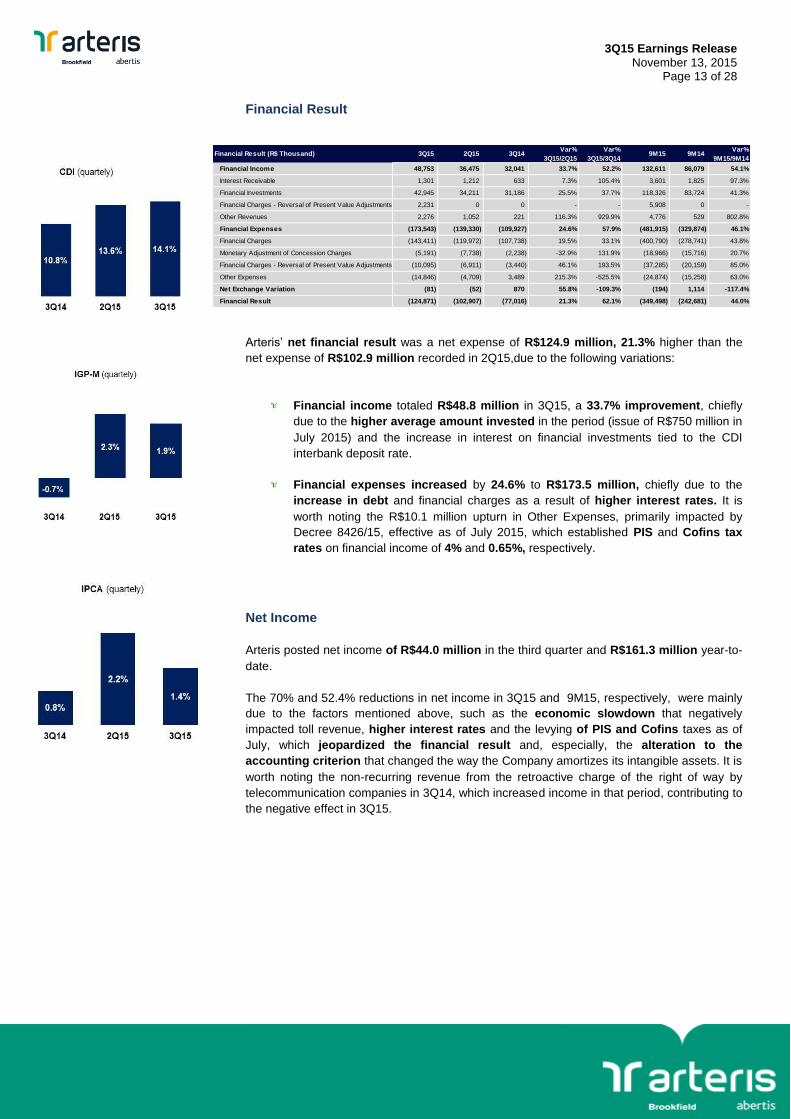
Financial Result
Arteris’ net financial result was a net expense of R$124.9 million, 21.3% higher than the
net expense of R$102.9 million recorded in 2Q15,due to the following variations:
Financial income totaled R$48.8 million in 3Q15, a 33.7% improvement, chiefly
due to the higher average amount invested in the period (issue of R$750 million in
July 2015) and the increase in interest on financial investments tied to the CDI
interbank deposit rate.
Financial expenses increased by 24.6% to R$173.5 million, chiefly due to the
increase in debt and financial charges as a result of higher interest rates. It is
worth noting the R$10.1 million upturn in Other Expenses, primarily impacted by
Decree 8426/15, effective as of July 2015, which established PIS and Cofins tax
rates on financial income of 4% and 0.65%, respectively.
Net Income
Arteris posted net income of R$44.0 million in the third quarter and R$161.3 million year-to-
date.
The 70% and 52.4% reductions in net income in 3Q15 and 9M15, respectively, were mainly
due to the factors mentioned above, such as the economic slowdown that negatively
impacted toll revenue, higher interest rates and the levying of PIS and Cofins taxes as of
July, which jeopardized the financial result and, especially, the alteration to the
accounting criterion that changed the way the Company amortizes its intangible assets. It is
worth noting the non-recurring revenue from the retroactive charge of the right of way by
telecommunication companies in 3Q14, which increased income in that period, contributing to
the negative effect in 3Q15.
Financial Result (R$ Thousand) 3Q15 2Q15 3Q14Var%
3Q15/2Q15
Var%
3Q15/3Q149M15 9M14
Var%
9M15/9M14
Financial Income 48,753 36,475 32,041 33.7% 52.2% 132,611 86,079 54.1%
Interest Receivable 1,301 1,212 633 7.3% 105.4% 3,601 1,825 97.3%
Financial Investments 42,945 34,211 31,186 25.5% 37.7% 118,326 83,724 41.3%
Financial Charges - Reversal of Present Value Adjustments 2,231 0 0 - - 5,908 0 -
Other Revenues 2,276 1,052 221 116.3% 929.9% 4,776 529 802.8%
Financial Expenses (173,543) (139,330) (109,927) 24.6% 57.9% (481,915) (329,874) 46.1%
Financial Charges (143,411) (119,972) (107,738) 19.5% 33.1% (400,790) (278,741) 43.8%
Monetary Adjustment of Concession Charges (5,191) (7,738) (2,238) -32.9% 131.9% (18,966) (15,716) 20.7%
Financial Charges - Reversal of Present Value Adjustments (10,095) (6,911) (3,440) 46.1% 193.5% (37,285) (20,159) 85.0%
Other Expenses (14,846) (4,709) 3,489 215.3% -525.5% (24,874) (15,258) 63.0%
Net Exchange Variation (81) (52) 870 55.8% -109.3% (194) 1,114 -117.4%
Financial Result (124,871) (102,907) (77,016) 21.3% 62.1% (349,498) (242,681) 44.0%
3Q15 Earnings Release
November 13, 2015 Page 14 of 28
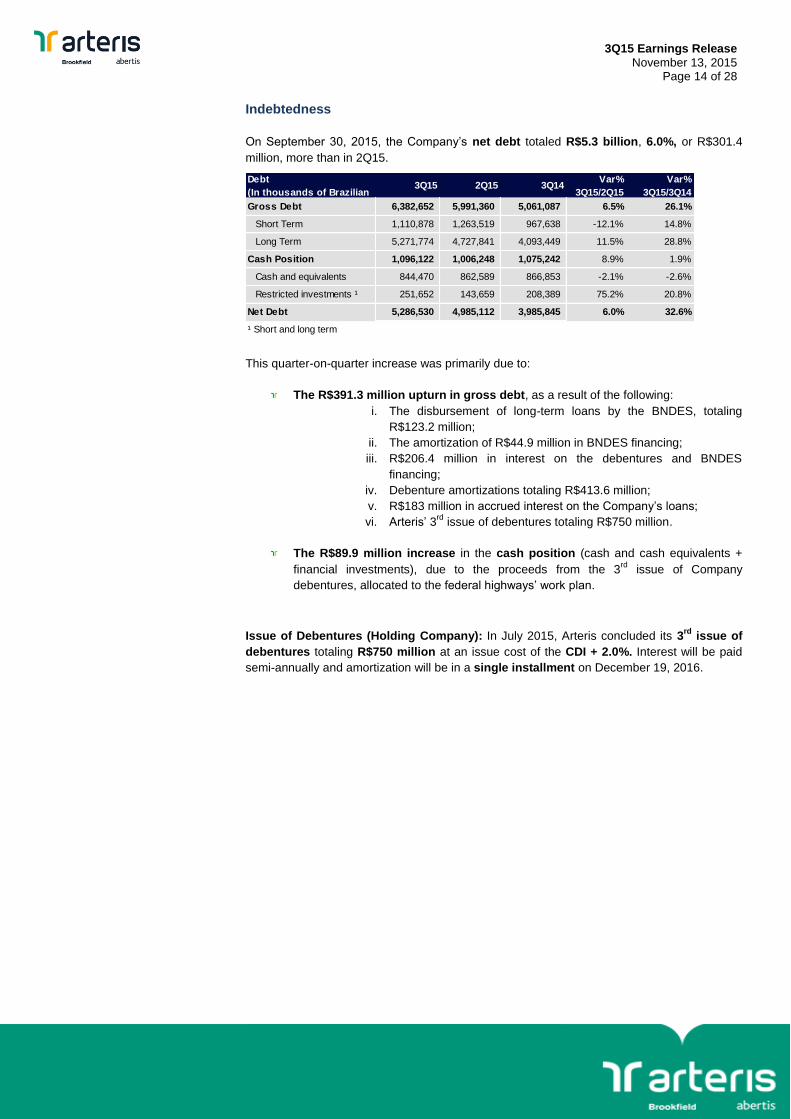
Indebtedness
On September 30, 2015, the Company’s net debt totaled R$5.3 billion, 6.0%, or R$301.4
million, more than in 2Q15.
This quarter-on-quarter increase was primarily due to:
The R$391.3 million upturn in gross debt, as a result of the following:
i. The disbursement of long-term loans by the BNDES, totaling
R$123.2 million;
ii. The amortization of R$44.9 million in BNDES financing;
iii. R$206.4 million in interest on the debentures and BNDES
financing;
iv. Debenture amortizations totaling R$413.6 million;
v. R$183 million in accrued interest on the Company’s loans;
vi. Arteris’ 3rd
issue of debentures totaling R$750 million.
The R$89.9 million increase in the cash position (cash and cash equivalents +
financial investments), due to the proceeds from the 3rd
issue of Company
debentures, allocated to the federal highways’ work plan.
Issue of Debentures (Holding Company): In July 2015, Arteris concluded its 3rd
issue of
debentures totaling R$750 million at an issue cost of the CDI + 2.0%. Interest will be paid
semi-annually and amortization will be in a single installment on December 19, 2016.
Debt
(In thousands of Brazilian 3Q15 2Q15 3Q14
Var%
3Q15/2Q15
Var%
3Q15/3Q14
Gross Debt 6,382,652 5,991,360 5,061,087 6.5% 26.1%
Short Term 1,110,878 1,263,519 967,638 -12.1% 14.8%
Long Term 5,271,774 4,727,841 4,093,449 11.5% 28.8%
Cash Position 1,096,122 1,006,248 1,075,242 8.9% 1.9%
Cash and equivalents 844,470 862,589 866,853 -2.1% -2.6%
Restricted investments ¹ 251,652 143,659 208,389 75.2% 20.8%
Net Debt 5,286,530 4,985,112 3,985,845 6.0% 32.6%
¹ Short and long term
3Q15 Earnings Release
November 13, 2015 Page 15 of 28
BNDES Financing: Arteris receives long-term loans from the Brazilian Development Bank
(BNDES) to finance federal concession investment programs. All five federal
concessionaires have already received approval for long-term financing lines,
guaranteeing the funds needed to implement the main contractual construction
projects.
Up to September 30, 2015 approximately R$3.4 billion in BNDES funding had been
disbursed, leaving R$325 million still available.
More details on the Company’s debt profile are shown below:
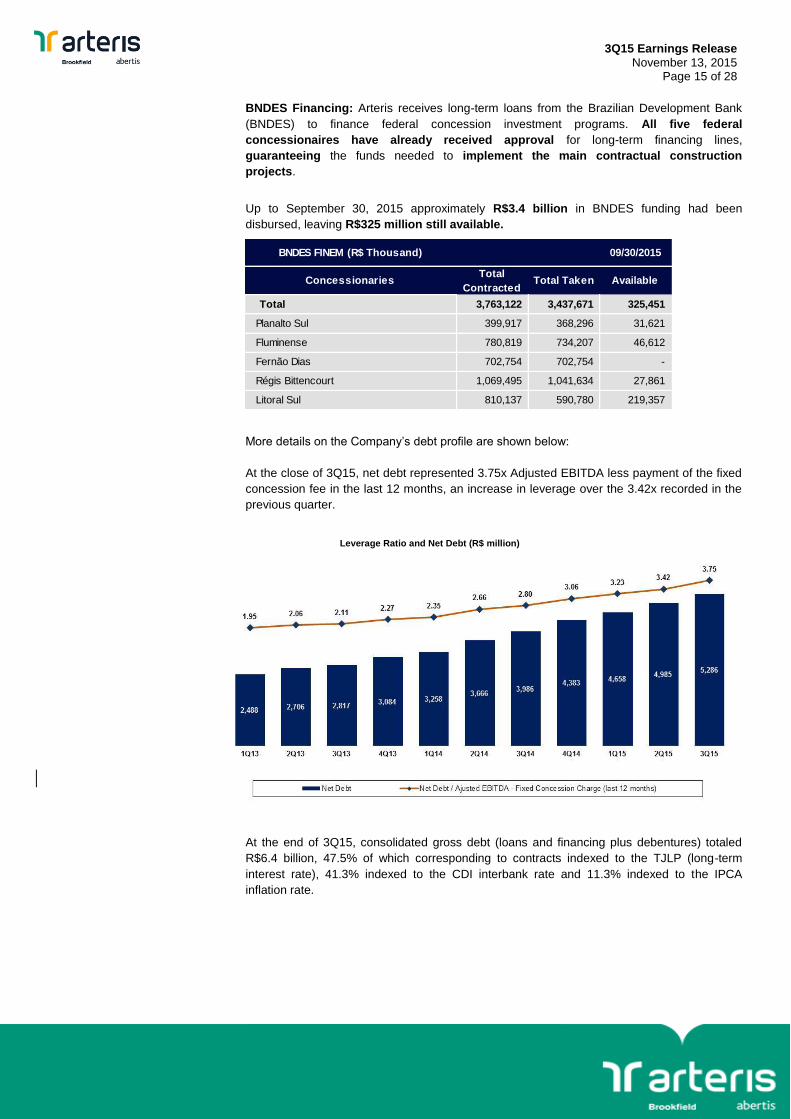
At the close of 3Q15, net debt represented 3.75x Adjusted EBITDA less payment of the fixed
concession fee in the last 12 months, an increase in leverage over the 3.42x recorded in the
previous quarter.
Leverage Ratio and Net Debt (R$ million)
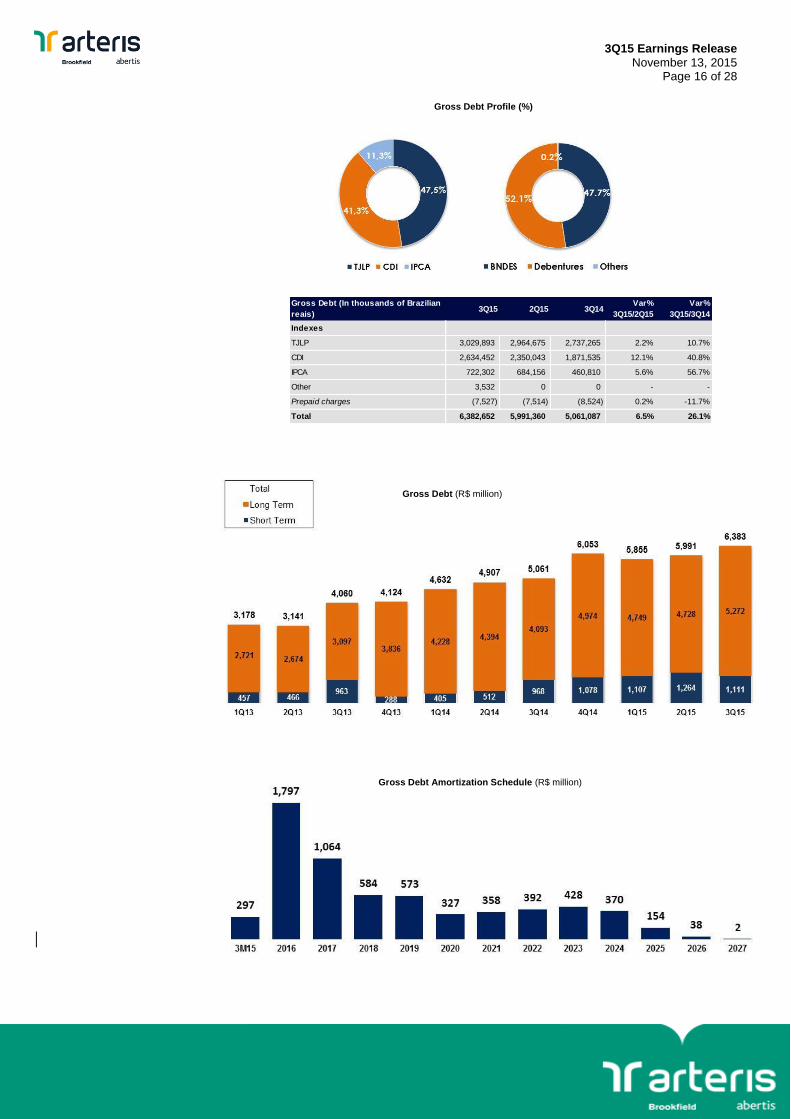
At the end of 3Q15, consolidated gross debt (loans and financing plus debentures) totaled
R$6.4 billion, 47.5% of which corresponding to contracts indexed to the TJLP (long-term
interest rate), 41.3% indexed to the CDI interbank rate and 11.3% indexed to the IPCA
inflation rate.
BNDES FINEM (R$ Thousand) 09/30/2015
ConcessionariesTotal
ContractedTotal Taken Available
Total 3,763,122 3,437,671 325,451
Planalto Sul 399,917 368,296 31,621
Fluminense 780,819 734,207 46,612
Fernão Dias 702,754 702,754 -
Régis Bittencourt 1,069,495 1,041,634 27,861
Litoral Sul 810,137 590,780 219,357
3Q15 Earnings Release
November 13, 2015 Page 16 of 28
Gross Debt Profile (%)
Gross Debt (R$ million)
Gross Debt Amortization Schedule (R$ million)
Gross Debt (In thousands of Brazilian
reais)3Q15 2Q15 3Q14
Var%
3Q15/2Q15
Var%
3Q15/3Q14
Indexes
TJLP 3,029,893 2,964,675 2,737,265 2.2% 10.7%
CDI 2,634,452 2,350,043 1,871,535 12.1% 40.8%
IPCA 722,302 684,156 460,810 5.6% 56.7%
Other 3,532 0 0 - -
Prepaid charges (7,527) (7,514) (8,524) 0.2% -11.7%
Total 6,382,652 5,991,360 5,061,087 6.5% 26.1%
3Q15 Earnings Release
November 13, 2015 Page 17 of 28
Fixed Concession Fee paid to the Concession Authority (State
Concessionaires)
In accordance with the concession contracts, the state concessionaires must pay the
concession authority a fixed fee in exchange for granting the concession. This amount totaled
R$19.3 million in 3Q15.
The variation in the amount of the fixed concession fee between the periods (+4.1% on average) is due to the annual adjustment of the
amounts due by the variation in the IGP-M inflation index in the last 12 months, which occurs on the same date as the annual tariff
adjustment of the state concessionaires.
On September 30, 2015, the nominal amount and the number of monthly installments to be
paid in regard to the fixed concession charge were as follows:
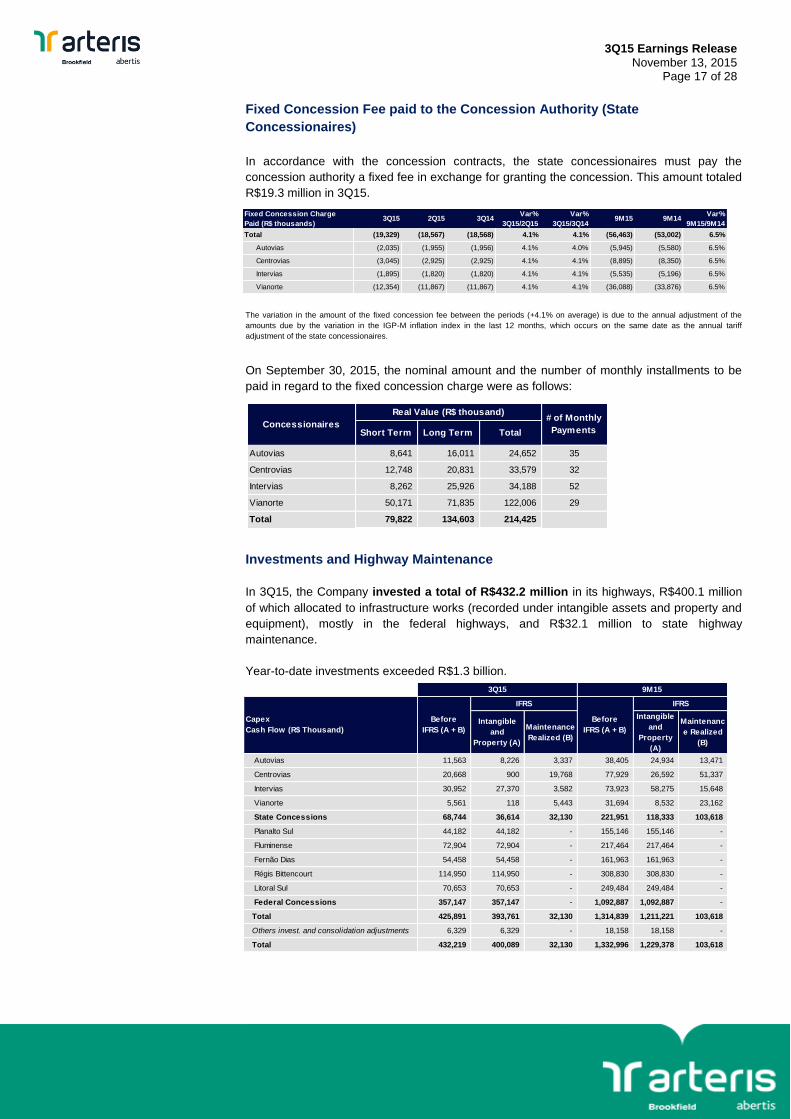
Investments and Highway Maintenance
In 3Q15, the Company invested a total of R$432.2 million in its highways, R$400.1 million
of which allocated to infrastructure works (recorded under intangible assets and property and
equipment), mostly in the federal highways, and R$32.1 million to state highway
maintenance.
Year-to-date investments exceeded R$1.3 billion.
Fixed Concession Charge
Paid (R$ thousands)3Q15 2Q15 3Q14
Var%
3Q15/2Q15
Var%
3Q15/3Q149M15 9M14
Var%
9M15/9M14
Total (19,329) (18,567) (18,568) 4.1% 4.1% (56,463) (53,002) 6.5%
Autovias (2,035) (1,955) (1,956) 4.1% 4.0% (5,945) (5,580) 6.5%
Centrovias (3,045) (2,925) (2,925) 4.1% 4.1% (8,895) (8,350) 6.5%
Intervias (1,895) (1,820) (1,820) 4.1% 4.1% (5,535) (5,196) 6.5%
Vianorte (12,354) (11,867) (11,867) 4.1% 4.1% (36,088) (33,876) 6.5%
Short Term Long Term Total
Autovias 8,641 16,011 24,652 35
Centrovias 12,748 20,831 33,579 32
Intervias 8,262 25,926 34,188 52
Vianorte 50,171 71,835 122,006 29
Total 79,822 134,603 214,425
Concessionaires
Real Value (R$ thousand)# of Monthly
Payments
Intangible
and
Property (A)
Maintenance
Realized (B)
Intangible
and
Property
(A)
Maintenanc
e Realized
(B)
Autovias 11,563 8,226 3,337 38,405 24,934 13,471
Centrovias 20,668 900 19,768 77,929 26,592 51,337
Intervias 30,952 27,370 3,582 73,923 58,275 15,648
Vianorte 5,561 118 5,443 31,694 8,532 23,162
State Concessions 68,744 36,614 32,130 221,951 118,333 103,618
Planalto Sul 44,182 44,182 - 155,146 155,146 -
Fluminense 72,904 72,904 - 217,464 217,464 -
Fernão Dias 54,458 54,458 - 161,963 161,963 -
Régis Bittencourt 114,950 114,950 - 308,830 308,830 -
Litoral Sul 70,653 70,653 - 249,484 249,484 -
Federal Concessions 357,147 357,147 - 1,092,887 1,092,887 -
Total 425,891 393,761 32,130 1,314,839 1,211,221 103,618
Others invest. and consolidation adjustments 6,329 6,329 - 18,158 18,158 -
Total 432,219 400,089 32,130 1,332,996 1,229,378 103,618
3Q15 9M15
Capex
Cash Flow (R$ Thousand)
Before
IFRS (A + B)
IFRS
Before
IFRS (A + B)
IFRS
3Q15 Earnings Release
November 13, 2015 Page 18 of 28
Avenida do Contorno
(Autopista Fluminense)
Duplication of BR101-RJ / Macaé –
Campos (Autopista Fluminense)
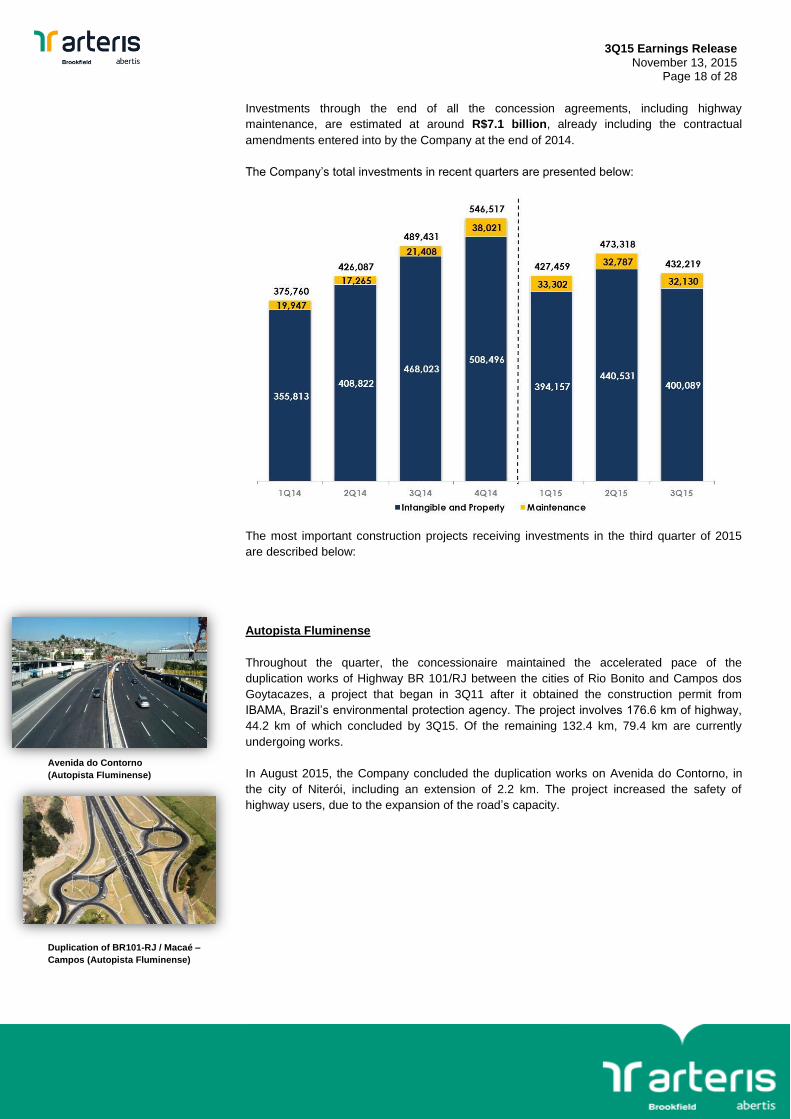
Investments through the end of all the concession agreements, including highway
maintenance, are estimated at around R$7.1 billion, already including the contractual
amendments entered into by the Company at the end of 2014.
The Company’s total investments in recent quarters are presented below:
The most important construction projects receiving investments in the third quarter of 2015
are described below:
Autopista Fluminense
Throughout the quarter, the concessionaire maintained the accelerated pace of the
duplication works of Highway BR 101/RJ between the cities of Rio Bonito and Campos dos
Goytacazes, a project that began in 3Q11 after it obtained the construction permit from
IBAMA, Brazil’s environmental protection agency. The project involves 176.6 km of highway,
44.2 km of which concluded by 3Q15. Of the remaining 132.4 km, 79.4 km are currently
undergoing works.
In August 2015, the Company concluded the duplication works on Avenida do Contorno, in
the city of Niterói, including an extension of 2.2 km. The project increased the safety of
highway users, due to the expansion of the road’s capacity.
3Q15 Earnings Release
November 13, 2015 Page 19 of 28
Betim Beltway
(Autopista Fernão Dias)
Duplication of Serra do Cafezal
(Autopista Régis Bittencourt)
Duplication of BR-116/PR
(Autopista Planalto Sul)
Florianópolis Beltway (Autopista Litoral
Sul)
Access to Ribeirão Preto (Autovias and
Vianorte)
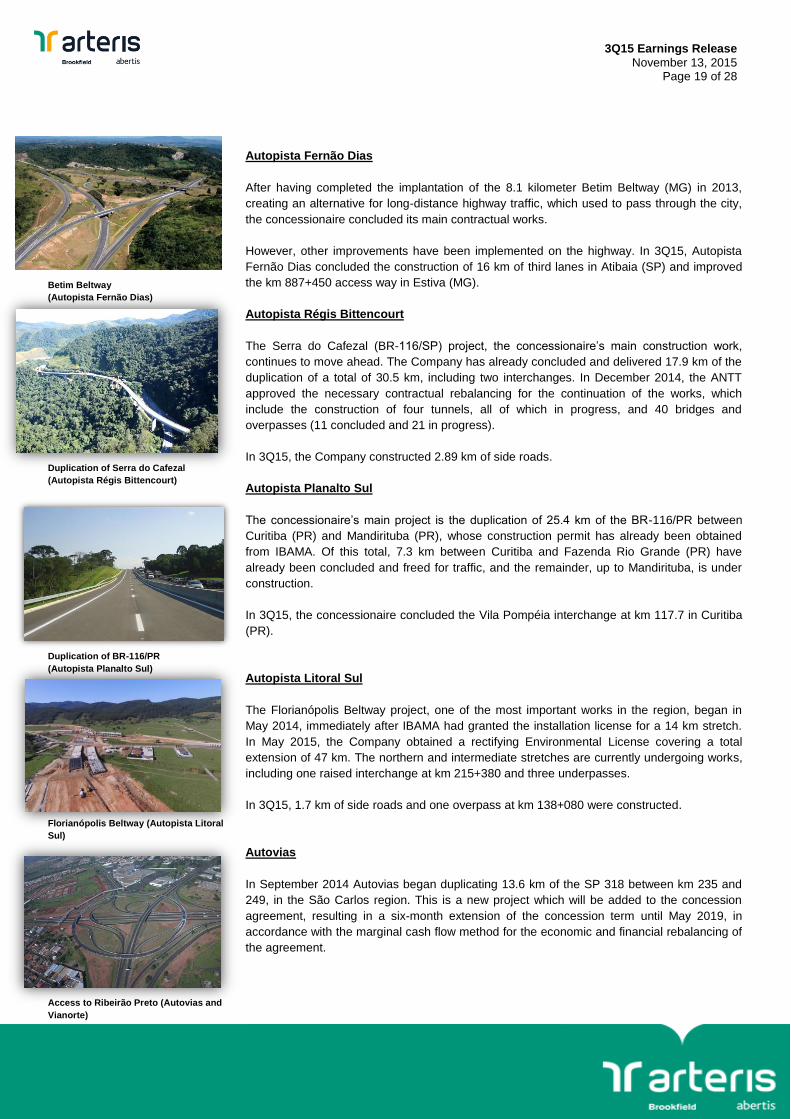
Autopista Fernão Dias
After having completed the implantation of the 8.1 kilometer Betim Beltway (MG) in 2013,
creating an alternative for long-distance highway traffic, which used to pass through the city,
the concessionaire concluded its main contractual works.
However, other improvements have been implemented on the highway. In 3Q15, Autopista
Fernão Dias concluded the construction of 16 km of third lanes in Atibaia (SP) and improved
the km 887+450 access way in Estiva (MG).
Autopista Régis Bittencourt
The Serra do Cafezal (BR-116/SP) project, the concessionaire’s main construction work,
continues to move ahead. The Company has already concluded and delivered 17.9 km of the
duplication of a total of 30.5 km, including two interchanges. In December 2014, the ANTT
approved the necessary contractual rebalancing for the continuation of the works, which
include the construction of four tunnels, all of which in progress, and 40 bridges and
overpasses (11 concluded and 21 in progress).
In 3Q15, the Company constructed 2.89 km of side roads.
Autopista Planalto Sul
The concessionaire’s main project is the duplication of 25.4 km of the BR-116/PR between
Curitiba (PR) and Mandirituba (PR), whose construction permit has already been obtained
from IBAMA. Of this total, 7.3 km between Curitiba and Fazenda Rio Grande (PR) have
already been concluded and freed for traffic, and the remainder, up to Mandirituba, is under
construction.
In 3Q15, the concessionaire concluded the Vila Pompéia interchange at km 117.7 in Curitiba
(PR).
Autopista Litoral Sul
The Florianópolis Beltway project, one of the most important works in the region, began in
May 2014, immediately after IBAMA had granted the installation license for a 14 km stretch.
In May 2015, the Company obtained a rectifying Environmental License covering a total
extension of 47 km. The northern and intermediate stretches are currently undergoing works,
including one raised interchange at km 215+380 and three underpasses.
In 3Q15, 1.7 km of side roads and one overpass at km 138+080 were constructed.
Autovias
In September 2014 Autovias began duplicating 13.6 km of the SP 318 between km 235 and
249, in the São Carlos region. This is a new project which will be added to the concession
agreement, resulting in a six-month extension of the concession term until May 2019, in
accordance with the marginal cash flow method for the economic and financial rebalancing of
the agreement.
3Q15 Earnings Release
November 13, 2015 Page 20 of 28
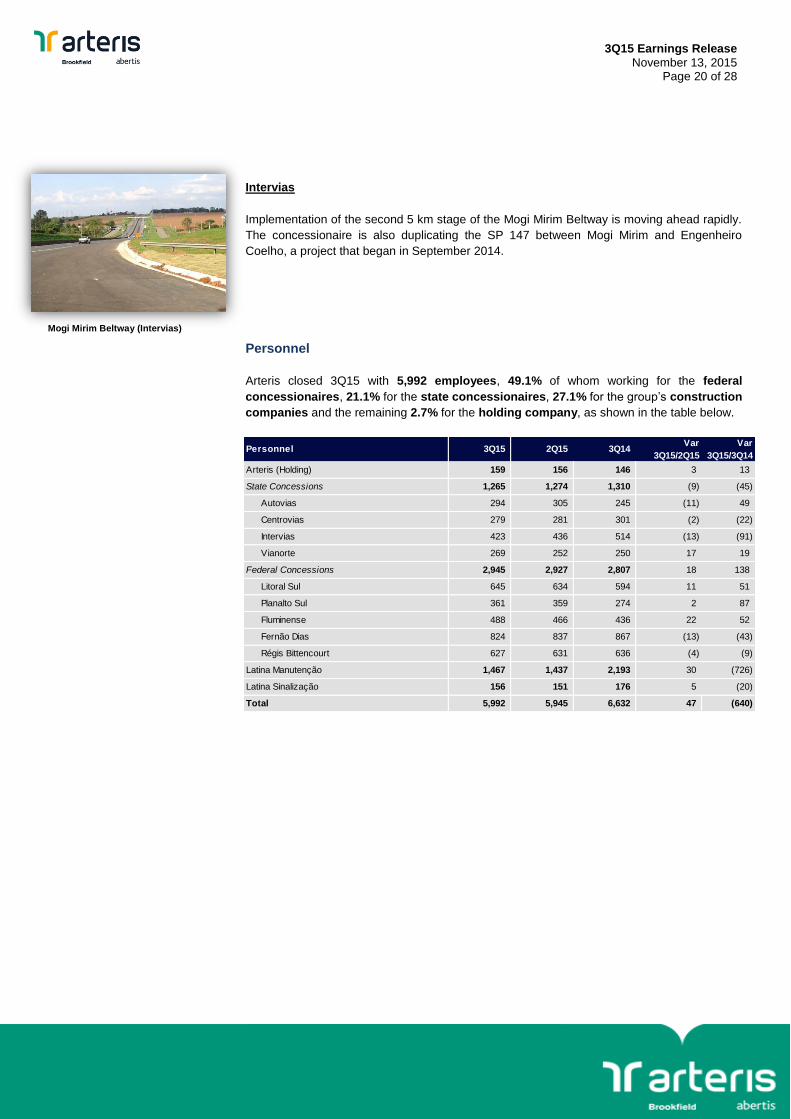
Mogi Mirim Beltway (Intervias)
Intervias
Implementation of the second 5 km stage of the Mogi Mirim Beltway is moving ahead rapidly.
The concessionaire is also duplicating the SP 147 between Mogi Mirim and Engenheiro
Coelho, a project that began in September 2014.
Personnel
Arteris closed 3Q15 with 5,992 employees, 49.1% of whom working for the federal
concessionaires, 21.1% for the state concessionaires, 27.1% for the group’s construction
companies and the remaining 2.7% for the holding company, as shown in the table below.
Personnel 3Q15 2Q15 3Q14Var
3Q15/2Q15
Var
3Q15/3Q14
Arteris (Holding) 159 156 146 3 13
State Concessions 1,265 1,274 1,310 (9) (45)
Autovias 294 305 245 (11) 49
Centrovias 279 281 301 (2) (22)
Intervias 423 436 514 (13) (91)
Vianorte 269 252 250 17 19
Federal Concessions 2,945 2,927 2,807 18 138
Litoral Sul 645 634 594 11 51
Planalto Sul 361 359 274 2 87
Fluminense 488 466 436 22 52
Fernão Dias 824 837 867 (13) (43)
Régis Bittencourt 627 631 636 (4) (9)
Latina Manutenção 1,467 1,437 2,193 30 (726)
Latina Sinalização 156 151 176 5 (20)
Total 5,992 5,945 6,632 47 (640)
3Q15 Earnings Release
November 13, 2015 Page 21 of 28
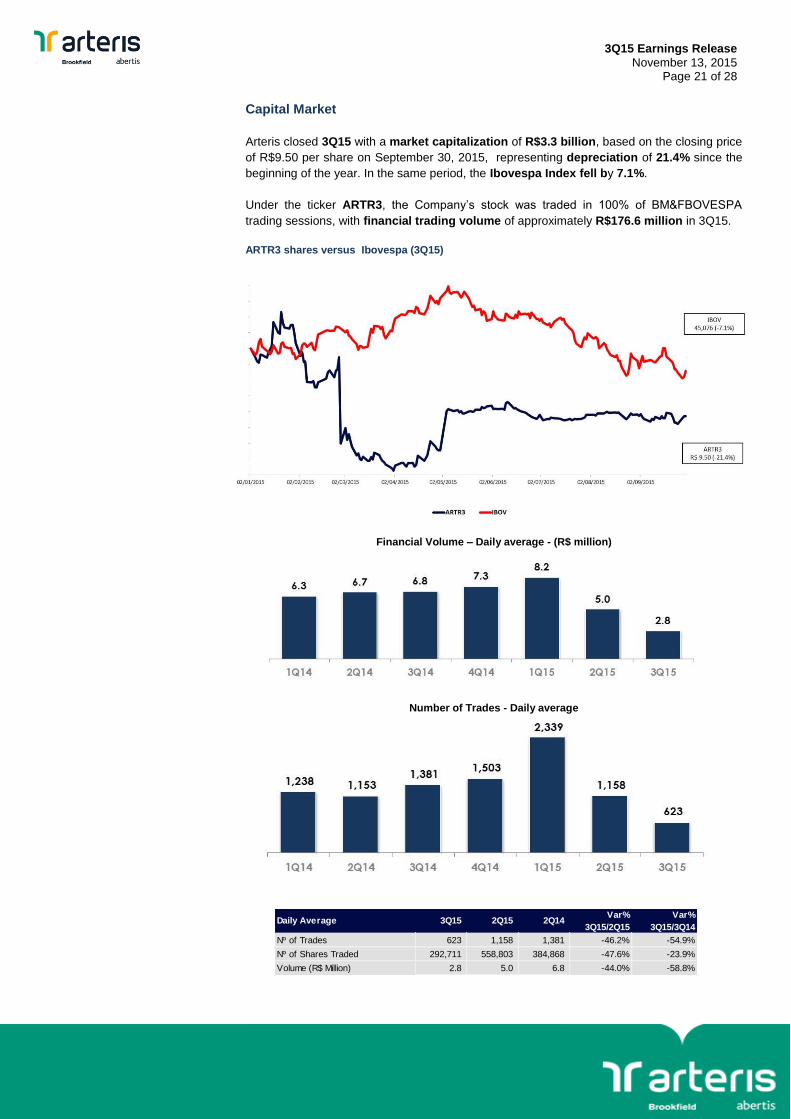
Capital Market
Arteris closed 3Q15 with a market capitalization of R$3.3 billion, based on the closing price
of R$9.50 per share on September 30, 2015, representing depreciation of 21.4% since the
beginning of the year. In the same period, the Ibovespa Index fell by 7.1%.
Under the ticker ARTR3, the Company’s stock was traded in 100% of BM&FBOVESPA
trading sessions, with financial trading volume of approximately R$176.6 million in 3Q15.
ARTR3 shares versus Ibovespa (3Q15)
Financial Volume – Daily average - (R$ million)
Number of Trades - Daily average
Daily Average 3Q15 2Q15 2Q14Var%
3Q15/2Q15
Var%
3Q15/3Q14
Nº of Trades 623 1,158 1,381 -46.2% -54.9%
Nº of Shares Traded 292,711 558,803 384,868 -47.6% -23.9%
Volume (R$ Million) 2.8 5.0 6.8 -44.0% -58.8%
3Q15 Earnings Release
November 13, 2015 Page 22 of 28
Public Tender Offer for the Acquisition of Shares
On April 30, 2015, Arteris informed the market of its controlling shareholder’s intention to hold
a Public Tender Offer for the Acquisition of Arteris Shares with a view to cancelling the
Company’s registration as a category A publicly-held company and delisting it from the Novo
Mercado.
On August 25, 2015 the Company held an Extraordinary Shareholders’ Meeting to select a
specialized company to prepare an appraisal report of the Company’s shares from a list of
three and elected Banco BNP Paribas Brasil S.A. On September 22, Arteris received the
appraisal report from Banco BNP Paribas Brasil S.A., which assessed the economic value of
Company shares at between R$8.74 and R$9.55.
On September 23, 2015, Arteris received a correspondence from its controlling shareholder,
Participes en Brasil S.A., stating that the Company would proceed with the Public Tender
Offer in accordance with the terms and conditions already disclosed to the market, given that
the economic value disclosed by the report was lower than the R$10.15 per share announced
on April 30, 2015.
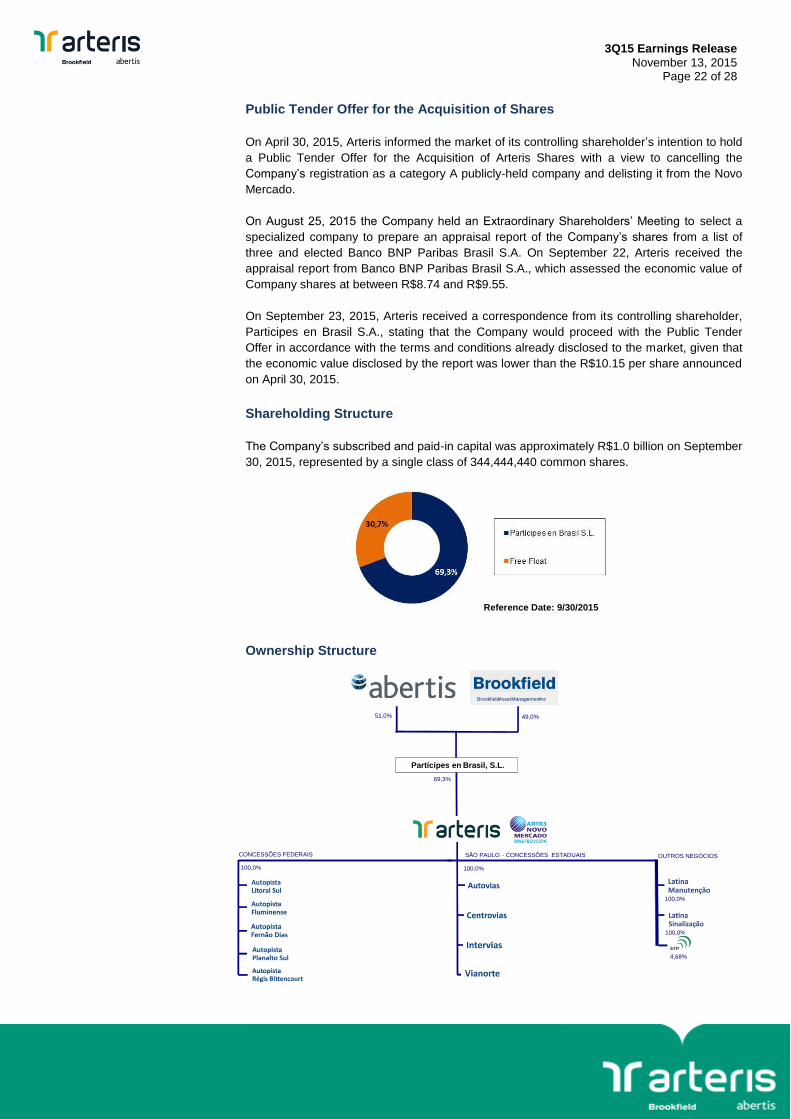
Shareholding Structure
The Company’s subscribed and paid-in capital was approximately R$1.0 billion on September
30, 2015, represented by a single class of 344,444,440 common shares.
Reference Date: 9/30/2015
Ownership Structure
69,3%
100,0%
100,0%
4,68%
100,0% 100,0%
Partícipes en Brasil, S.L.
CONCESSÕES FEDERAIS SÃO PAULO - CONCESSÕES ESTADUAIS OUTROS NEGÓCIOS
51,0% 49,0%
Brookfield Asset Management Inc
3Q15 Earnings Release
November 13, 2015 Page 23 of 28
Portfolio of Concession Assets
Key data on our concession portfolio is presented below:
Information disclosed by Abertis
The quarterly financial and operating information related to Arteris disclosed by Abertis is not
necessarily identical to that reported by the Company, as IFRS rules in Brazil are somewhat
different from those reported by Abertis. Abertis also includes in its results certain impacts
related to the booking of the acquisition of Participes en Brasil S.L., which owns 69.3% of
Arteris.
The table below shows the traffic trends of the Company’s concessionaires as measured by
ADT (Average Daily Traffic Intensity), a concept normally used by Abertis to measure traffic
performance. ADT represents the concessionaires’ average daily traffic volume in absolute
vehicle terms and is calculated by taking the average daily number of vehicles in each toll
plaza, weighted by the extension of the highway in kilometers.
Concessionaires Km Toll Plazas
Fixed
Concession
Charge
Payment
Maturity
Concession
Maturity
Contract
Index
State Concessions
Autovias 316.6 5 Aug-18 May-19 IGP-M
Centrovias 218.2 5 Jun-18 Jun-19 IGP-M
Intervias 375.7 9 Feb-20 Jan-28 IGP-M
Vianorte 236.6 4 Mar-18 Mar-18 IGP-M
Federal Concessions
Planalto Sul 412.7 5 n.a. Feb-33 IPCA
Fluminense 320.1 5 n.a. Feb-33 IPCA
Fernão Dias 562.1 8 n.a. Feb-33 IPCA
Régis Bittencourt 401.6 6 n.a. Feb-33 IPCA
Litoral Sul 405.9 5 n.a. Feb-33 IPCA
ADT 3Q15 3Q14 Var% 9M15 9M14 Var%
State 12,635 12,796 -1.3% 12,448 12,687 -1.9%
Autovias 11,998 12,248 -2.0% 11,926 12,143 -1.8%
Centrovias 14,813 14,803 0.1% 14,621 14,816 -1.3%
Intervias 10,392 10,537 -1.4% 10,224 10,407 -1.8%
Vianorte 15,085 15,268 -1.2% 14,716 15,075 -2.4%
Federal 20,741 21,247 -2.4% 21,166 21,399 -1.1%
Planalto Sul 6,681 7,414 -9.9% 6,796 7,127 -4.6%
Fluminense 15,721 16,288 -3.5% 16,152 16,508 -2.2%
Fernão Dias 25,333 25,473 -0.5% 25,025 25,424 -1.6%
Régis Bittencourt 21,108 21,941 -3.8% 21,471 22,188 -3.2%
Litoral Sul 32,188 32,684 -1.5% 34,014 33,415 1.8%
Total 17,869 18,264 -2.2% 18,077 18,324 -1.3%
3Q15 Earnings Release
November 13, 2015 Page 24 of 28
Corporate Profile
Arteris is a Brazilian highway concession company with more kilometers under management
than any of its peers. Through its nine concessionaires – Autovias, Centrovias, Intervias,
Vianorte, Autopista Fernão Dias, Autopista Fluminense, Autopista Litoral Sul, Autopista
Planalto Sul and Autopista Régis Bittencourt – Arteris manages 3,250 kilometers in the states
of São Paulo, Rio de Janeiro, Minas Gerais, Paraná and Santa Catarina. Arteris is a publicly-
held company with shares listed in the Novo Mercado trading segment of the BM&FBovespa.
The Company is controlled by Abertis and Brookfield Motorways. More information can be
found at: ri.arteris.com.br
This release contains forward-looking statements relating to the business prospects, estimates of
operating and financial results and growth prospects of Arteris. These are merely projections and as such
are based exclusively on the expectations of Arteris’ management concerning the future of the business
and its continued access to capital to fund the Company’s business plan. Such forward-looking
statements depend substantially on changes in market conditions, government regulations, competitive
pressures, and the performance of the Brazilian economy and the industry and are therefore subject to
change without prior notice.
3Q15 Earnings Release
November 13, 2015 Page 25 of 28
APPENDIX 1
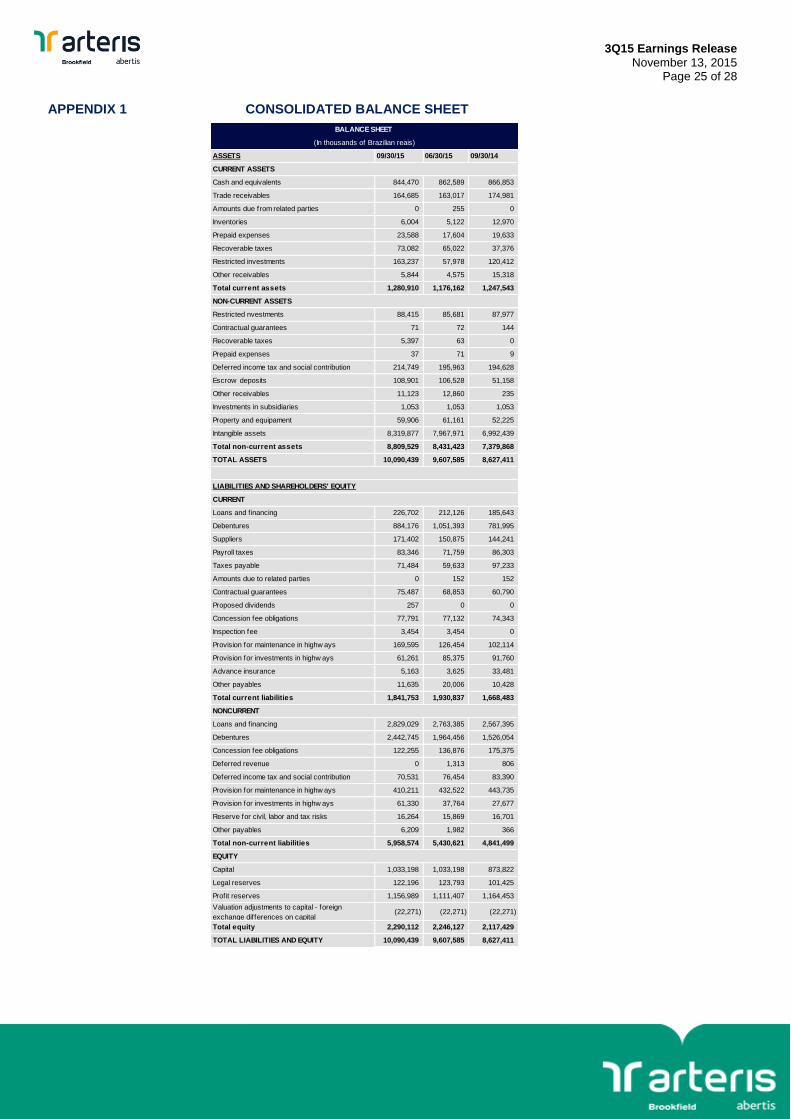
CONSOLIDATED BALANCE SHEET
ASSETS 09/30/15 06/30/15 09/30/14
CURRENT ASSETS
Cash and equivalents 844,470 862,589 866,853
Trade receivables 164,685 163,017 174,981
Amounts due from related parties 0 255 0
Inventories 6,004 5,122 12,970
Prepaid expenses 23,588 17,604 19,633
Recoverable taxes 73,082 65,022 37,376
Restricted investments 163,237 57,978 120,412
Other receivables 5,844 4,575 15,318
Total current assets 1,280,910 1,176,162 1,247,543
NON-CURRENT ASSETS
Restricted nvestments 88,415 85,681 87,977
Contractual guarantees 71 72 144
Recoverable taxes 5,397 63 0
Prepaid expenses 37 71 9
Deferred income tax and social contribution 214,749 195,963 194,628
Escrow deposits 108,901 106,528 51,158
Other receivables 11,123 12,860 235
Investments in subsidiaries 1,053 1,053 1,053
Property and equipament 59,906 61,161 52,225
Intangible assets 8,319,877 7,967,971 6,992,439
Total non-current assets 8,809,529 8,431,423 7,379,868
TOTAL ASSETS 10,090,439 9,607,585 8,627,411
LIABILITIES AND SHAREHOLDERS' EQUITY
CURRENT
Loans and f inancing 226,702 212,126 185,643
Debentures 884,176 1,051,393 781,995
Suppliers 171,402 150,875 144,241
Payroll taxes 83,346 71,759 86,303
Taxes payable 71,484 59,633 97,233
Amounts due to related parties 0 152 152
Contractual guarantees 75,487 68,853 60,790
Proposed dividends 257 0 0
Concession fee obligations 77,791 77,132 74,343
Inspection fee 3,454 3,454 0
Provision for maintenance in highw ays 169,595 126,454 102,114
Provision for investments in highw ays 61,261 85,375 91,760
Advance insurance 5,163 3,625 33,481
Other payables 11,635 20,006 10,428
Total current liabilities 1,841,753 1,930,837 1,668,483
NONCURRENT
Loans and f inancing 2,829,029 2,763,385 2,567,395
Debentures 2,442,745 1,964,456 1,526,054
Concession fee obligations 122,255 136,876 175,375
Deferred revenue 0 1,313 806
Deferred income tax and social contribution 70,531 76,454 83,390
Provision for maintenance in highw ays 410,211 432,522 443,735
Provision for investments in highw ays 61,330 37,764 27,677
Reserve for civil, labor and tax risks 16,264 15,869 16,701
Other payables 6,209 1,982 366
Total non-current liabilities 5,958,574 5,430,621 4,841,499
EQUITY
Capital 1,033,198 1,033,198 873,822
Legal reserves 122,196 123,793 101,425
Profit reserves 1,156,989 1,111,407 1,164,453
Valuation adjustments to capital - foreign
exchange differences on capital(22,271) (22,271) (22,271)
Total equity 2,290,112 2,246,127 2,117,429
TOTAL LIABILITIES AND EQUITY 10,090,439 9,607,585 8,627,411
BALANCE SHEET
(In thousands of Brazilian reais)
3Q15 Earnings Release
November 13, 2015 Page 26 of 28
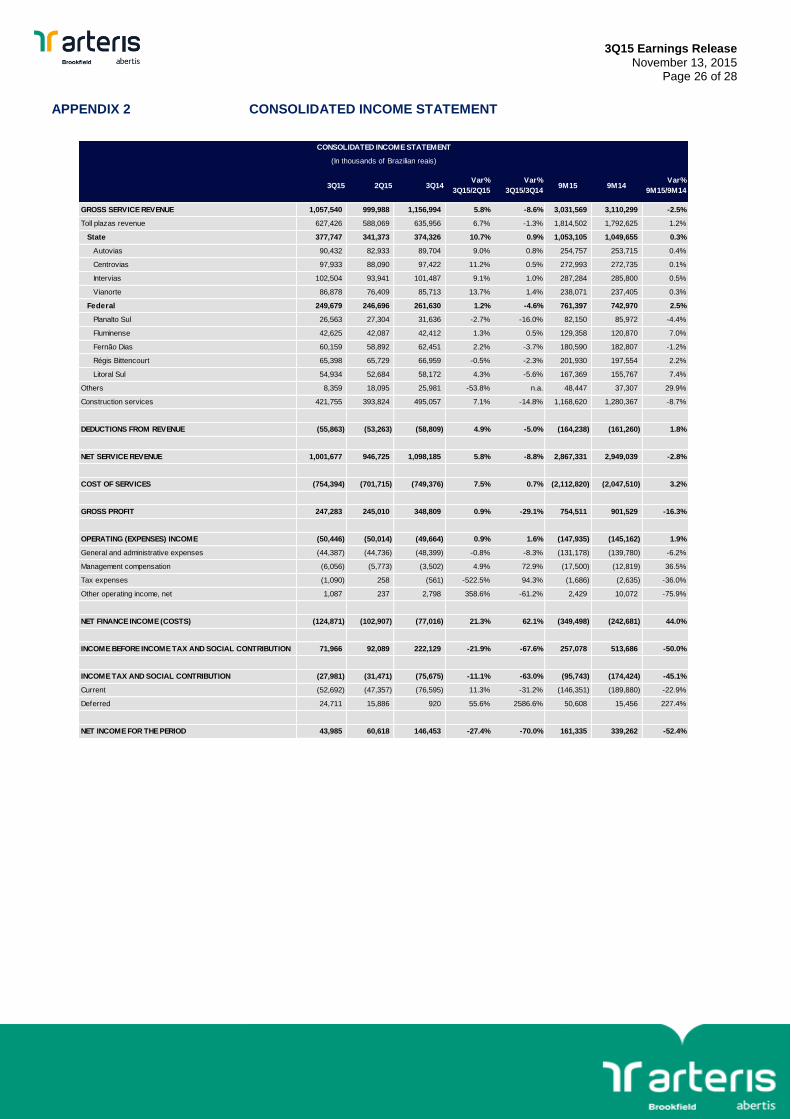
APPENDIX 2
CONSOLIDATED INCOME STATEMENT
3Q15 2Q15 3Q14
Var%
3Q15/2Q15
Var%
3Q15/3Q149M15 9M14
Var%
9M15/9M14
GROSS SERVICE REVENUE 1,057,540 999,988 1,156,994 5.8% -8.6% 3,031,569 3,110,299 -2.5%
Toll plazas revenue 627,426 588,069 635,956 6.7% -1.3% 1,814,502 1,792,625 1.2%
State 377,747 341,373 374,326 10.7% 0.9% 1,053,105 1,049,655 0.3%
Autovias 90,432 82,933 89,704 9.0% 0.8% 254,757 253,715 0.4%
Centrovias 97,933 88,090 97,422 11.2% 0.5% 272,993 272,735 0.1%
Intervias 102,504 93,941 101,487 9.1% 1.0% 287,284 285,800 0.5%
Vianorte 86,878 76,409 85,713 13.7% 1.4% 238,071 237,405 0.3%
Federal 249,679 246,696 261,630 1.2% -4.6% 761,397 742,970 2.5%
Planalto Sul 26,563 27,304 31,636 -2.7% -16.0% 82,150 85,972 -4.4%
Fluminense 42,625 42,087 42,412 1.3% 0.5% 129,358 120,870 7.0%
Fernão Dias 60,159 58,892 62,451 2.2% -3.7% 180,590 182,807 -1.2%
Régis Bittencourt 65,398 65,729 66,959 -0.5% -2.3% 201,930 197,554 2.2%
Litoral Sul 54,934 52,684 58,172 4.3% -5.6% 167,369 155,767 7.4%
Others 8,359 18,095 25,981 -53.8% n.a. 48,447 37,307 29.9%
Construction services 421,755 393,824 495,057 7.1% -14.8% 1,168,620 1,280,367 -8.7%
DEDUCTIONS FROM REVENUE (55,863) (53,263) (58,809) 4.9% -5.0% (164,238) (161,260) 1.8%
NET SERVICE REVENUE 1,001,677 946,725 1,098,185 5.8% -8.8% 2,867,331 2,949,039 -2.8%
COST OF SERVICES (754,394) (701,715) (749,376) 7.5% 0.7% (2,112,820) (2,047,510) 3.2%
GROSS PROFIT 247,283 245,010 348,809 0.9% -29.1% 754,511 901,529 -16.3%
OPERATING (EXPENSES) INCOME (50,446) (50,014) (49,664) 0.9% 1.6% (147,935) (145,162) 1.9%
General and administrative expenses (44,387) (44,736) (48,399) -0.8% -8.3% (131,178) (139,780) -6.2%
Management compensation (6,056) (5,773) (3,502) 4.9% 72.9% (17,500) (12,819) 36.5%
Tax expenses (1,090) 258 (561) -522.5% 94.3% (1,686) (2,635) -36.0%
Other operating income, net 1,087 237 2,798 358.6% -61.2% 2,429 10,072 -75.9%
NET FINANCE INCOME (COSTS) (124,871) (102,907) (77,016) 21.3% 62.1% (349,498) (242,681) 44.0%
INCOME BEFORE INCOME TAX AND SOCIAL CONTRIBUTION 71,966 92,089 222,129 -21.9% -67.6% 257,078 513,686 -50.0%
INCOME TAX AND SOCIAL CONTRIBUTION (27,981) (31,471) (75,675) -11.1% -63.0% (95,743) (174,424) -45.1%
Current (52,692) (47,357) (76,595) 11.3% -31.2% (146,351) (189,880) -22.9%
Deferred 24,711 15,886 920 55.6% 2586.6% 50,608 15,456 227.4%
NET INCOME FOR THE PERIOD 43,985 60,618 146,453 -27.4% -70.0% 161,335 339,262 -52.4%
(In thousands of Brazilian reais)
CONSOLIDATED INCOME STATEMENT
3Q15 Earnings Release
November 13, 2015 Page 27 of 28
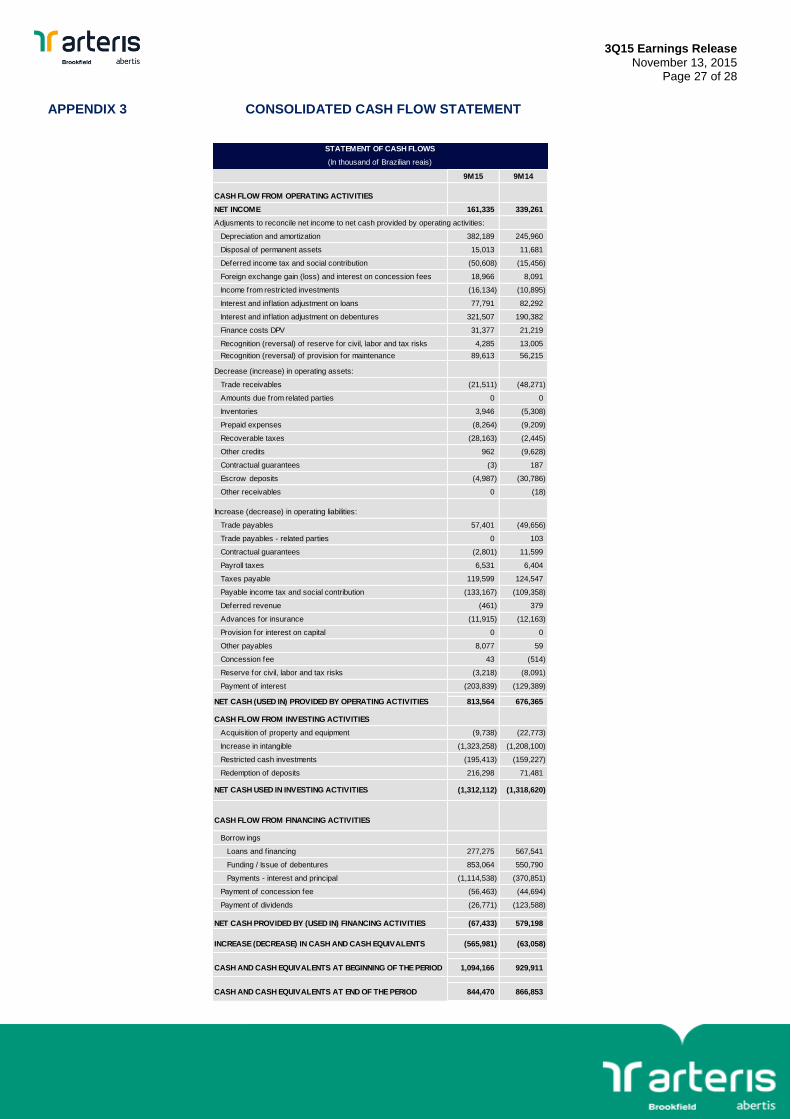
APPENDIX 3
CONSOLIDATED CASH FLOW STATEMENT
9M15 9M14
CASH FLOW FROM OPERATING ACTIVITIES
NET INCOME 161,335 339,261
Adjusments to reconcile net income to net cash provided by operating activities:
Depreciation and amortization 382,189 245,960
Disposal of permanent assets 15,013 11,681
Deferred income tax and social contribution (50,608) (15,456)
Foreign exchange gain (loss) and interest on concession fees 18,966 8,091
Income from restricted investments (16,134) (10,895)
Interest and inflation adjustment on loans 77,791 82,292
Interest and inflation adjustment on debentures 321,507 190,382
Finance costs DPV 31,377 21,219
Recognition (reversal) of reserve for civil, labor and tax risks 4,285 13,005
Recognition (reversal) of provision for maintenance 89,613 56,215
Decrease (increase) in operating assets:
Trade receivables (21,511) (48,271)
Amounts due from related parties 0 0
Inventories 3,946 (5,308)
Prepaid expenses (8,264) (9,209)
Recoverable taxes (28,163) (2,445)
Other credits 962 (9,628)
Contractual guarantees (3) 187
Escrow deposits (4,987) (30,786)
Other receivables 0 (18)
Increase (decrease) in operating liabilities:
Trade payables 57,401 (49,656)
Trade payables - related parties 0 103
Contractual guarantees (2,801) 11,599
Payroll taxes 6,531 6,404
Taxes payable 119,599 124,547
Payable income tax and social contribution (133,167) (109,358)
Deferred revenue (461) 379
Advances for insurance (11,915) (12,163)
Provision for interest on capital 0 0
Other payables 8,077 59
Concession fee 43 (514)
Reserve for civil, labor and tax risks (3,218) (8,091)
Payment of interest (203,839) (129,389)
NET CASH (USED IN) PROVIDED BY OPERATING ACTIVITIES 813,564 676,365
CASH FLOW FROM INVESTING ACTIVITIES
Acquisition of property and equipment (9,738) (22,773)
Increase in intangible (1,323,258) (1,208,100)
Restricted cash investments (195,413) (159,227)
Redemption of deposits 216,298 71,481
NET CASH USED IN INVESTING ACTIVITIES (1,312,112) (1,318,620)
CASH FLOW FROM FINANCING ACTIVITIES
Borrow ings
Loans and f inancing 277,275 567,541
Funding / Issue of debentures 853,064 550,790
Payments - interest and principal (1,114,538) (370,851)
Payment of concession fee (56,463) (44,694)
Payment of dividends (26,771) (123,588)
NET CASH PROVIDED BY (USED IN) FINANCING ACTIVITIES (67,433) 579,198
INCREASE (DECREASE) IN CASH AND CASH EQUIVALENTS (565,981) (63,058)
CASH AND CASH EQUIVALENTS AT BEGINNING OF THE PERIOD 1,094,166 929,911
CASH AND CASH EQUIVALENTS AT END OF THE PERIOD 844,470 866,853
STATEMENT OF CASH FLOWS
(In thousand of Brazilian reais)
3Q15 Earnings Release
November 13, 2015 Page 28 of 28
GLOSSARY Adjustment to Present Value: On December 28, 2007, Federal Law 11,638 was enacted, which amended, revoked and introduced new
provisions to Brazilian Corporate Law, most notably Chapter XV concerning accounting matters, with the law coming into force on January 1, 2008. The main purpose of the new law was to update Brazilian Corporate Law to enable the convergence of generally accepted accounting practices in Brazil with International Financial Reporting Standards (IFRS), as well as to allow new rules and procedures to be issued by the Securities and Exchange Commission of Brazil (CVM), in accordance with international accounting standards.
Complementing this process, the CVM, through Instruction 469 dated May 2, 2008, instructed publicly traded companies on the disclosure and accounting treatment of certain changes introduced by Federal Law 11,638/07. The main changes introduced by Federal Law 11,638/07 that impact the Company's standalone and consolidated Quarterly Financial Information include the mandatory valuation of significant long-term assets and liabilities, such as "Concession Rights" and "Concession Fee Obligations", at present value (Adjustment to Present Value). Previously the Company accounted "Concession Rights" and "Concession Fee Obligations" at their nominal value. The effects from the adjustments to present value from "Concession Rights" and "Concession Fee Obligations" that occurred up to December 31, 2007 were accounted directly under Equity in 2008. As of January 1, 2008, the effects of the adjustments to present value have been accounted directly in the quarterly income statements. Monetary Restatement of the Fixed Concession Fee: The concession contracts between the state concessionaires and the concession authority establish that the monthly payments of the fixed concession fee be adjusted by the IGP-M index every July 1
st, which is the same
date on which the tolls are adjusted by the same index. State Concessionaires: Specific Purpose Companies created by the winners of the bidding process with which the Concession Contracts were signed which have the specific corporate purpose of maintaining, conserving and operating state highways. State Concessionaires are regulated by the São Paulo State Public Transportation Services Regulatory Agency (ARTESP). Arteris currently manages four state concessionaires in the state of São Paulo (Autovias, Centrovias, Intervias and Vianorte). Federal Concessionaires: Specific Purpose Companies created by the winners of the bidding process with which the Concession
Contracts were signed which have the specific corporate purpose of maintaining, conserving and operating federal highways. Federal Concessionaires are regulated by the National Road Transportation Agency (ANTT). Arteris currently operates five federal concessionaires in Brazil: (Autopista Planalto Sul, Autopista Fluminense, Autopista Fernão Dias, Autopista Régis Bittencourt and Autopista Litoral Su). Costs with the Concession Authority: These are payments that have been stipulated in the concession contracts. These costs are composed of: expenses with the "Variable Fee" for state concessions, which corresponds to 3% of gross revenue at the concessions Autovias, Centrovias and Vianorte, plus 3% of toll revenue and 25% of ancillary revenue; and by costs with "Inspection Funds" and "Technological Development" at the federal concessions, which are adjusted annually by the IPCA inflation index. EBITDA and EBITDA Margin: EBITDA is Earnings before Interest, Taxes, Depreciation and Amortization. An operating performance
indicator also known for its Portuguese acronym LAJIDA. EBITDA is not a measure adopted in accounting standards and does not represent cash flow for the periods presented and therefore should not be considered an alternative to cash flow as an indicator of liquidity. EBITDA does not have a standardized meaning and therefore cannot be compared to the EBITDA of other companies. EBITDA Margin is the ratio between net operating revenue excluding construction revenue and EBITDA. Adjusted EBITDA and Adjusted EBITDA Margin: EBITDA adjusted by the reversal of the provisions for road maintenance. The Company believes adjusted EBITDA is the best way to show its operating cash flow. Adjusted EBITDA Margin is the ratio between net operating revenue excluding construction revenue and Adjusted EBITDA. Leverage Ratio: The leverage ratio is defined as Net Debt (Gross Debt less Cash and Cash Equivalents) divided by Adjusted EBITDA (adjusted by the reversal of the provision for maintenance), less the Fixed Concession Fee in cash flow. The lower the leverage ratio, the greater the amount of funding that can be raised in credit markets. Fixed Concession Fee: In accordance with our concession contracts, the state concessionaires must pay the concession authority a fixed fee in exchange for the granting of the concession. The contracts also establish that the amount for the fixed fee must be settled in monthly payments over the duration of the concession period. We have opted to account the value of the grant of concession under assets and the total amount payable to the concession authority for the fixed concession fee under liabilities. Electronic Toll Collection /AVI System: The AVI system is an electronic payment system used on our highways. Drivers who use the AVI
system have an electronic sensor mounted on their windshield that enables the system to recognize the category of vehicle that they are driving. As they pass through the toll plaza lane, antennae capture the signals emitted and the sensors record the vehicle's presence and calculate the total amount owed, without the driver having to stop the vehicle. Concession authority: The federal, state or local government or federal district that is responsible for the public service, prior to the execution of works or otherwise, that is the subject matter of concession or permission. (Federal Law 8,987 of 1995 - Article 2 -CF. Article 1). The concessionaire has access to operate the infrastructure to provide the public services on behalf of the concession authority pursuant to the contractual conditions. The concession authority relies on the regulatory agencies (ARTESP in the state of São Paulo and ANTT for the federal government) to monitor and inspect the transportation services delegated and to regulate the highway concession program. Provision for Maintenance: Estimated spending required to settle the current obligations to maintain infrastructure at the operating levels stipulated in the contract, considering the wear caused by use. The Concessionaire must constitute a provision based on its best estimate of the spending required to maintain a certain level of service or to recuperate infrastructure to operating conditions prior to returning the assets to the concession authority at the end of the concession period, as stipulated in the contract. Toll Adjustments: As established in the concession contracts in the state of São Paulo, tolls are readjusted every July based on the
variation in inflation measured by the IGP-M index in the 12-month period ending on May 31. On July 1, 2013, the IGP-M index will be replaced by the IPCA index as the basis for adjustment. The economic and financial imbalances resulting from the change in index will be evaluated once every two years and be rebalanced in relation to the contract duration transpired. Toll adjustments at the federal concessions are based on the variation in inflation measured by the IPCA index published by the Brazilian Geography and Statistics Institute (IBGE) in the period from the month preceding the base date in the toll proposal presentation, i.e., June 2007, to the month preceding the date on which tolls began to be collected. After this first adjustment, all subsequent adjustments take place annually and are also based on the cumulative variation in the IPCA index in the 12 months since the previous adjustment. Construction Revenue and Costs: These are non-cash accounting entries under the new rules implemented by IFRS that seek to translate
the amount of investment the Company makes in intangible assets. The amount recorded as construction revenue is exactly the same as the amount recorded as construction cost, i.e. it does not affect the Company's results. Vehicle Equivalents: Vehicle equivalent unit (VEU) is used as the basis for charging tolls. A passenger vehicle is considered a vehicle
equivalent and a commercial vehicle (such as a truck or bus) is calculated by the number of axles, with each axle counting as one passenger vehicle. One passenger vehicle is equivalent to one axle on a commercial vehicle.