Embed Size (px)
Citation preview
LaSalle LOGIPORT REIT2-1-1 Otemachi, Chiyoda-ku, Tokyo, Japan
3rd Fiscal Period Semi-Annual ReportMarch 1, 2017 to August 31, 2017
Delivering Prime Logistics Investment to the Japanese REIT Market
Executive Director’s Message 2
Property and Corporate Level Income Statement, DPU Summary, and Yield Summary 4
Future Growth StrategiesExternal Growth Strategy 6
Internal Growth Strategy 8
Financial Strategy 10
The LaSalle Group’s Commitment to Sustainability 12
Recognizing the Importance of Sustainability 14
Findings So Far 16
PortfolioPortfolio Summary 18
Details of Portfolio 20
About LaSalle Inc. 26LaSalle Group’s Professional Support Contributes to Greater Unitholder Value 28Operation and Governance Emphasizing Unitholders’ Interests and Transparency 30Decision Making Flowchart for Related Party Transactions 31Risk Factors 32Financial Section Balance Sheets 36Statements of Income 37Statements of Changes in Net Assets 38Statements of Cash Flows 39Notes to Financial Statements 40Independent Auditor’s Report 52Investor Information 53
Table of Contents
Note: All of the figures above are as of August 31, 2017, the end of the 3rd fiscal period.
Portfolio Size
9 properties Total Assets Under Management
(“AUM”)
173.4 bn yenOccupancy Rate
98.6%
Tokyo Area Concentration
100.0%Total Debt
71.03 bn yenLoan to Value (“LTV”) Ratio
38.6%
Operating Revenues
5,234 mn yenOperating Income
2,739 mn yenNet Income
2,429 mn yen
Distribution Per Unit (“DPU”)
2,379 yenEarnings Per Unit (“EPU”)
2,209 yenDPU in Excess of Earnings
170 yen
Financial Highlights for 3rd Fiscal Period(March 1, 2017 - August 31, 2017)
1LaSalle LOGIPORT REIT
of LLR to control assets that have partial leasing risk re-maining, thereby enabling it to control these properties at a discounted price, while warehousing these assets in bridge vehicles during the re-lease up phases. Once a property has achieved stabilization, LLR completes the acquisition. With this kind of ingenuity, even as property prices continue to surge, LLR is planning to acquire properties that maintain net operating income (“NOI”) yields that are in line with its existing portfolio. As an update to the current status of these properties with preferential negotiation rights, lease up at the bridge fund level has steadily progressed, and all four properties have now achieved 100% stabilization. Therefore, the groundwork towards acquisition by LLR is nearly complete.
In addition, in terms of external growth, preferential nego-tiation rights have been obtained through a new LaSalle fund (the “New LaSalle Fund”) vehicle that is a LaSalle Investment Management Japan K.K. (“LaSalle K.K.” or the “Sponsor”) affiliated private real estate fund called Japan Logistics Fund IV, which will effectively perform as a feeder fund to LLR. Please refer to LLR’s press release posted on October 31, 2017 for further details.
LLR continues to adhere to its investment policy and busi-ness plan of investing in prime logistics facilities in areas well suited for logistics with global and local support from LaSalle Investment Management Inc. (“LaSalle Inc.”) along with its various subsidiaries including LaSalle K.K. and LLR’s asset management arm, LaSalle REIT Advisors K.K. (“LRA” or the “Asset Manager”) which collectively make up LLR’s extensive network (the “LaSalle Group”). LLR is proud to operate with transparent and clear governance at a level that exceeds requirements. It is essential that LLR continue with this strategy while continuing to commit skilled professionals to deliver on promises.
Thank you for your continued support of LLR’s mandate. I look forward to reporting again in six months’ time.
Thank you for your continued support of LaSalle LOGI-PORT REIT (“LLR”). As the Executive Director of LLR, I am proud to report strong results for the 3rd fiscal period.
Over the past six months, the transactions market for fully stabilized prime logistics has continued on an upward trend, where the market has witnessed several deals that have traded at or near a 4% cap rate, culminating with a large, prime, and well-located asset in the Yoko-hama submarket trading at a 3.8% cap rate. Now that the market has crossed the sub-4% cap rate threshold, LLR believes with even greater conviction that this pace of cap rate compression is certain to slow down. These all-time-low cap rates coupled with a negative interest rate environment are proving to be challenging for a J-REIT like LLR to acquire stabilized properties; however, with some degree of ingenuity, LLR remains confident of being able to continue to acquire assets that are in the current mid-4% cap rate range.
Amid this environment where the capital markets remain remarkably liquid, there is a shortage of assets coming to market, which is one of the primary reasons for the continued uptick in prices. Currently, despite this chal-lenging environment to acquire and externally grow assets under management (“AUM”), LLR remains disciplined and patient as it looks to make selective acquisitions with an eye toward capitalizing on those owner-operators that begin to struggle on the leasing front as more and more excess supply comes to market.
Within LLR’s existing portfolio of assets, the average oc-cupancy rate achieved throughout the fiscal period was 98.5%. The initial budget assumed an average occupancy of 97.8%. Thus, from an internal growth perspective, LLR outperformed the budget by 0.7%. When doing a deeper dive on the portfolio, the warehouse spaces throughout
LLR’s nine properties are currently 100% occupied and it is only the office component of some facilities which remain vacant.
As for LLR’s activities during this fiscal period, LOGIPORT Kawagoe was acquired and incorporated into the portfolio at the beginning of the 3rd fiscal period on March 1, 2017. LLR capitalized the transaction utilizing only debt to finance the acquisition, thus, LLR’s loan to value (“LTV”) increased from 34.3% to 38.6%. AUM increased from 161.4 billion yen to 173.4 billion yen.
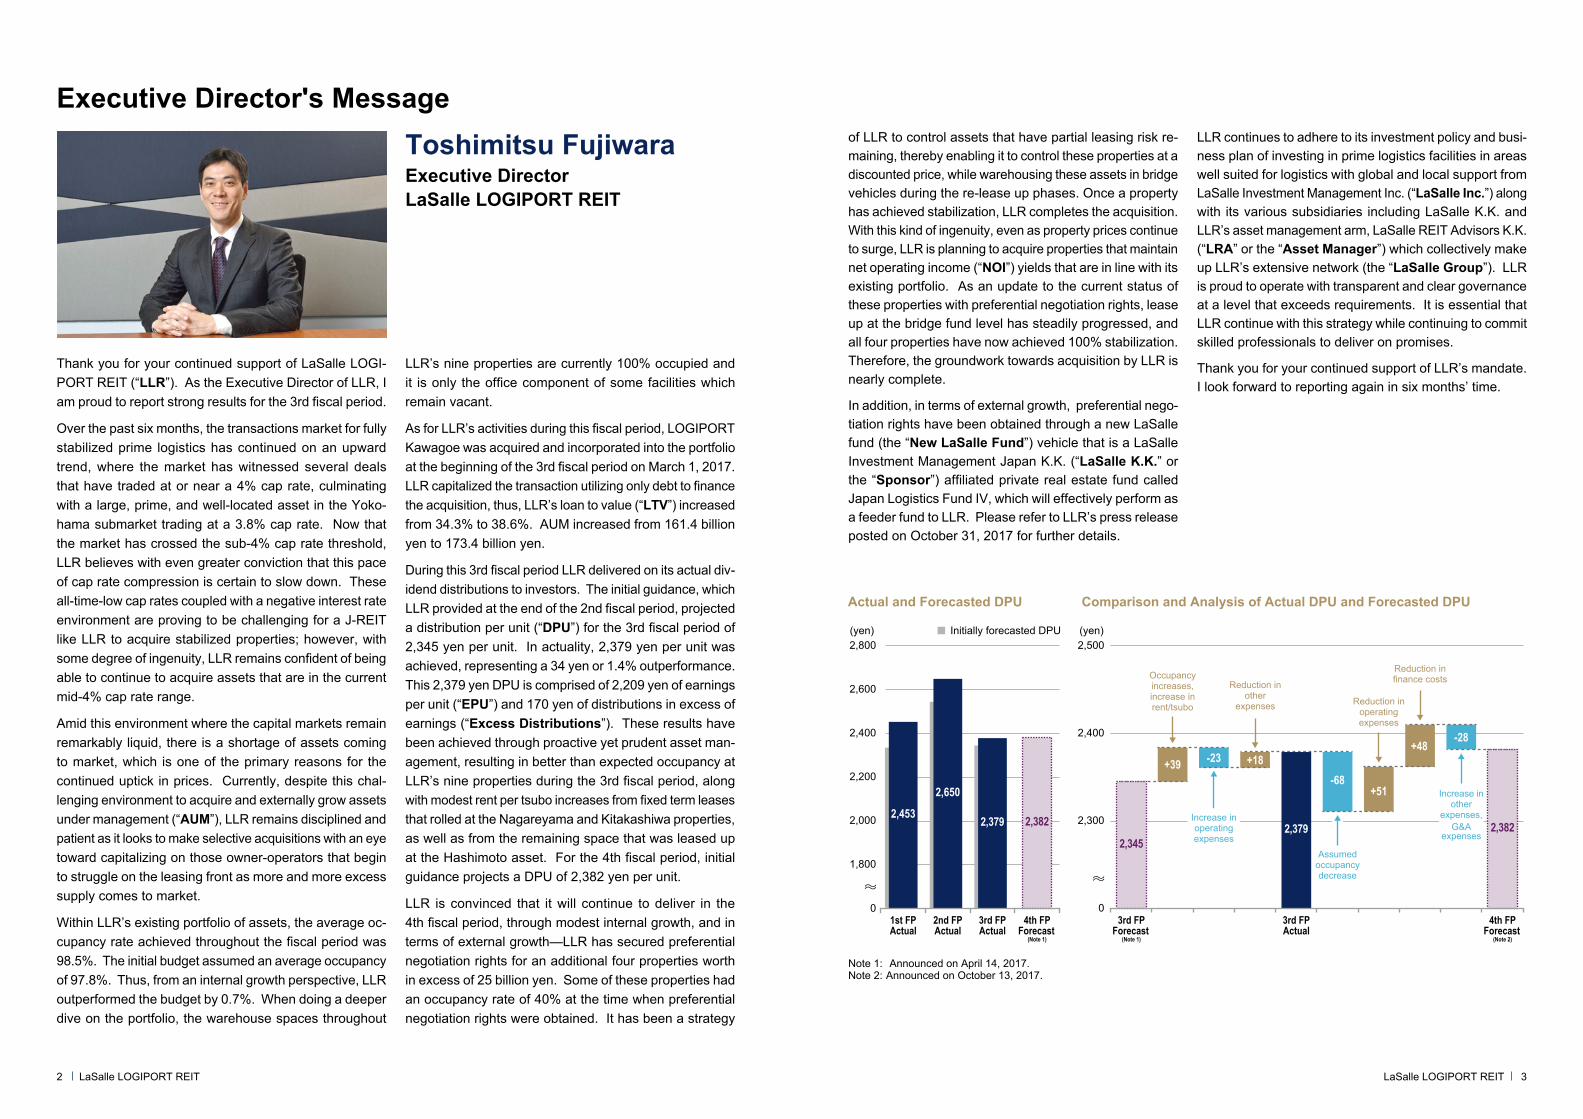
During this 3rd fiscal period LLR delivered on its actual div-idend distributions to investors. The initial guidance, which LLR provided at the end of the 2nd fiscal period, projected a distribution per unit (“DPU”) for the 3rd fiscal period of 2,345 yen per unit. In actuality, 2,379 yen per unit was achieved, representing a 34 yen or 1.4% outperformance. This 2,379 yen DPU is comprised of 2,209 yen of earnings per unit (“EPU”) and 170 yen of distributions in excess of earnings (“Excess Distributions”). These results have been achieved through proactive yet prudent asset man-agement, resulting in better than expected occupancy at LLR’s nine properties during the 3rd fiscal period, along with modest rent per tsubo increases from fixed term leases that rolled at the Nagareyama and Kitakashiwa properties, as well as from the remaining space that was leased up at the Hashimoto asset. For the 4th fiscal period, initial guidance projects a DPU of 2,382 yen per unit.
LLR is convinced that it will continue to deliver in the 4th fiscal period, through modest internal growth, and in terms of external growth—LLR has secured preferential negotiation rights for an additional four properties worth in excess of 25 billion yen. Some of these properties had an occupancy rate of 40% at the time when preferential negotiation rights were obtained. It has been a strategy
Executive Director's MessageToshimitsu FujiwaraExecutive DirectorLaSalle LOGIPORT REIT
2 3LaSalle LOGIPORT REIT LaSalle LOGIPORT REIT
Actual and Forecasted DPU Comparison and Analysis of Actual DPU and Forecasted DPU
Note 1: Announced on April 14, 2017.Note 2: Announced on October 13, 2017.
0
2,300
2,400
2,500(yen)(yen)
Increase in operating expenses
Reduction inoperating expenses
Reduction in other
expenses
Reduction in finance costs
Increase in other
expenses,G&A
expenses
Assumed occupancy decrease
Occupancy increases,increase in rent/tsubo
4th FPForecast
(Note 1)
3rd FPForecast
(Note 1)
3rd FPActual
4th FPForecast
(Note 2)
3rd FPActual
1st FPActual
2nd FPActual
1,800
2,000
2,200
2,400
2,600
2,800
0
2,453 2,382
2,3452,382
2,650
2,379 2,379
+39-68
+51
-23 +18+48
-28
Initially forecasted DPU
Property and Corporate Level Income Statement, DPU Summary, and Yield Summary
(in millions of yen unless otherwise specified) 2nd FPactuals
3rd FPactualsProperty Level
RevenuesRENT + CAM + PARKING + Other income 4,594 4,939Utilities reimbursables 258 295OPERATING REVENUES 4,853 5,234
Operating expensesOutsourced contract costs -266 -342Utilities expense -232 -280Repair and maintenance -58 -127Property taxes 0 -402Other expenses -33 -34Total operating expenses -589 -1,185
NOI 4,263 4,049Depreciation expense -583 -625NOI AFTER DEPRECIATION EXPENSE 3,680 3,424
Corporate LevelOperating expensesAsset management fee -633 -591Asset custody/administrative fee -24 -27Directors compensation -4 -4Independent auditor’s fee -10 -10Other operating expenses -53 -53Corporate level operating expenses -724 -685
OPERATING INCOME 2,956 2,739
Non-operating incomeInterest income receivable 0 0
Non-operating expensesInterest expense -180 -199Interest expense from investment corporation bonds -1 -14
Amortization of deferred establishment expenses -4 -4Amortization of investment corporation bonds Issuance costs -1 -3
Financing related expenses -31 -88Non-operating expenses -216 -308
ORDINARY INCOME 2,740 2,430Investment corporation taxes -1 -1Prior period carry forward 1 0NET INCOME 2,739 2,429
DPU Summary
Net income 2,739 2,429Number of outstanding units (million) 1.1 1.1EPU (yen per unit) 2,491 2,209
Depreciation expense 583 62530% of depreciation 175 188Number of outstanding units (million) 1.1 1.1DISTRIBUTIONS IN EXCESS OF EPU (yen per unit) 159 170
DPU BREAKDOWNEPU (yen per unit) 2,491 2,209EXCESS DISTRIBUTIONS (yen per unit) 159 170DPU (yen per unit) 2,650 2,379
Yield SummaryNOI (annualized) 8,098NOI after depreciation expense (annualized) 6,847
Acquisition price 173,390 (1)NOI yield 4.63%After depreciation NOI yield 3.92%
Tangible fixed asset book value 174,484 (2)
Appraisal value 184,440 (3)Unrealized capital gain 9,956 (3)–(2)=(4)Unrealized capital gain 5.4% (4)/(3)
4 LaSalle LOGIPORT REIT
Expansion of existing tenants’ material handling equipment.Increased air conditioning use.
Increase in leasing fees due to contract renewal that was pushed up in timing.Additional property management and building management fees due to acquisition of LOGIPORT Kawagoe.
Contingent repair items were not implemented.Allocations between repair and maintenance, and capital expenditures.
Property taxes began getting expensed through the profits and losses for the 8 IPO properties beginning in the 3rd FP.
Straight line depreciation method. However, 2nd FP is for 8 properties while 3rd FP is factoring for 9 properties. Hence the increase.
Increased due to acquisition of LOGIPORT Kawagoe which was capitalized by using debt to finance the acquisition.
Increased due to additional issuance of investment corpo-ration bonds.
Asset management fee increased due to increase in AUM, however, overall the asset management fee decreased due to property taxes getting expensed which lowered ordinary income.
While the acquisition of LOGIPORT Kawagoe increased rev-enues, the expensing of property taxes for the 8 IPO assets is what underlies the difference between 2nd FP and 3rd FP.
Amount which underlies EPU made available for distributions to unitholders.
Additional revenue from LOGIPORT Kawagoe acquired at the start of 3rd FP.Outperformance of occupancy relative to guidance (98.5% vs. 97.8%).
Acquisition price is the purchase price for each of the trust beneficiary interests as shown in the purchase agreement of the relevant property.
Reflects the 3rd FP’s carrying book value amount.
Appraisal value represents the value as of August 31, 2017.
Future Growth Strategies
Toshiaki FukaiLaSalle REIT Advisors K.K.
Interview withthe Chief Investment Officer
Note: Simulation assumes that additional acquisitions occur while maintaining the same NOI yield as the existing portfolio.
8 properties161.4 bn yen
4 propertiesin excess of 25 bn yen(currently stabilized)
9 properties173.4 bn yen
8 propertiesin development
(GFA 400,000m2)
External Growth StageUtilizing Debt Capacity
2017~2018
External Growth Stagevia follow on PO
2018~2020
Aug. 20161st FP
Aug. 20173rd FP
2017 – 2018External Growth StageUtilizing Debt Capacity
2018 – 2020External Growth Stage
via Follow-on PO
2020
300 bn yen
2,202 yen
2,620 yen (Note)
2,394 yen
LTV 45%(20 bn yen in
additional acquisitions)
+8.7%+8.7%
+9.4%+9.4%
Preferential Negotiation Rights Secured
Existing LaSalle Fund
60 bn yen of seed assets secured
Exclusivity granted to LLR
NewLaSalle Fund
Asset Size
Stabilized DPU Simulation
Continued External Growth
I joined LRA on September 1, 2017. Prior to LRA, I was with Mitsubishi Corp.-UBS Realty Inc. (“MCUBS”) for 14 years, where my most recent role was as an Executive Officer, as the Head of the Industrial Division and the Head of Planning and Coordination on behalf of the Industrial & Infrastructure Investment Corporation REIT (“IIF”).
Q2 As the new Chief Investment Officer for LRA, do you intend to change the course of the current investment policy of LLR?
In the immediate future, no. I believe that LLR has a disciplined approach to acquisitions and given the ample pipeline on the horizon that will come from the four deals with preferential negotiation rights as well as from the New LaSalle Fund, I do not intend to change LLR’s course. That said, as the cap rate environment for stabilized proper-ties remains so tight, LLR may need to incorporate more creative methods when it comes to acquisitions from third parties, which go beyond the current scope of strategies of buying at a discount via a partial leasing risk strategy.
Q3 Now that you are a part of the LaSalle Group, what would you say are the differences rel-ative to your experience at IIF?
Well, while it has only been two months since starting, I would say that my initial impression is that I am positively surprised by the strength and efforts exhibited through LaSalle K.K.’s internal leasing capabilities. Given how LLR prefers operating and managing multi-tenanted logistics facilities, I am impressed by the level of depth of LLR’s tenant base, both in terms of third-party logistics (“3PL”)
distribution companies, as well as the end user tenants who stand behind the 3PL operators. With that type of strength and in-house knowledge, I can now understand why LLR is able to take measured and calculated risks across certain markets, where others may struggle in both lease up of new developments and maintaining high oc-cupancy levels.
Q4 LLR’s investment units are trading at a premium to market value (at the end of August 2017 the unit price was 110,000 yen and the net asset value (“NAV”) per unit was 105,321 yen, implying a price to NAV (“P/NAV”) of 1.04x). Are you satisfied with how the market views LLR’s unit price and can you give examples of how valuation would be impacted going forward?
Despite 60% of the listed J-REITs currently trading at a P/NAV below 1.0x, LLR is happily in the minority that still trades at a premium. While it is appreciated that investors view LLR as a J-REIT with strong potential growth, LLR still believes that its units trade at a relative discount to its immediate peers, so no, I would say that I am not sat-isfied with where the units are currently trading. In order to continue to bridge the DPU yield gap that continues to exist, I believe LLR needs to stay the course and continue to demonstrate and execute the stated external growth strategy, which should develop a deeper track record and in turn convince more and more investors that LLR is a strong J-REIT with solid growth prospects that is managed by a strong and capable team.
When did you join LRA?Q1
Q5 With the acquisition of LOGIPORT Kawagoe now concluded and incorporated as a part of the portfolio, what does that do for your outlook on stabilized DPU?
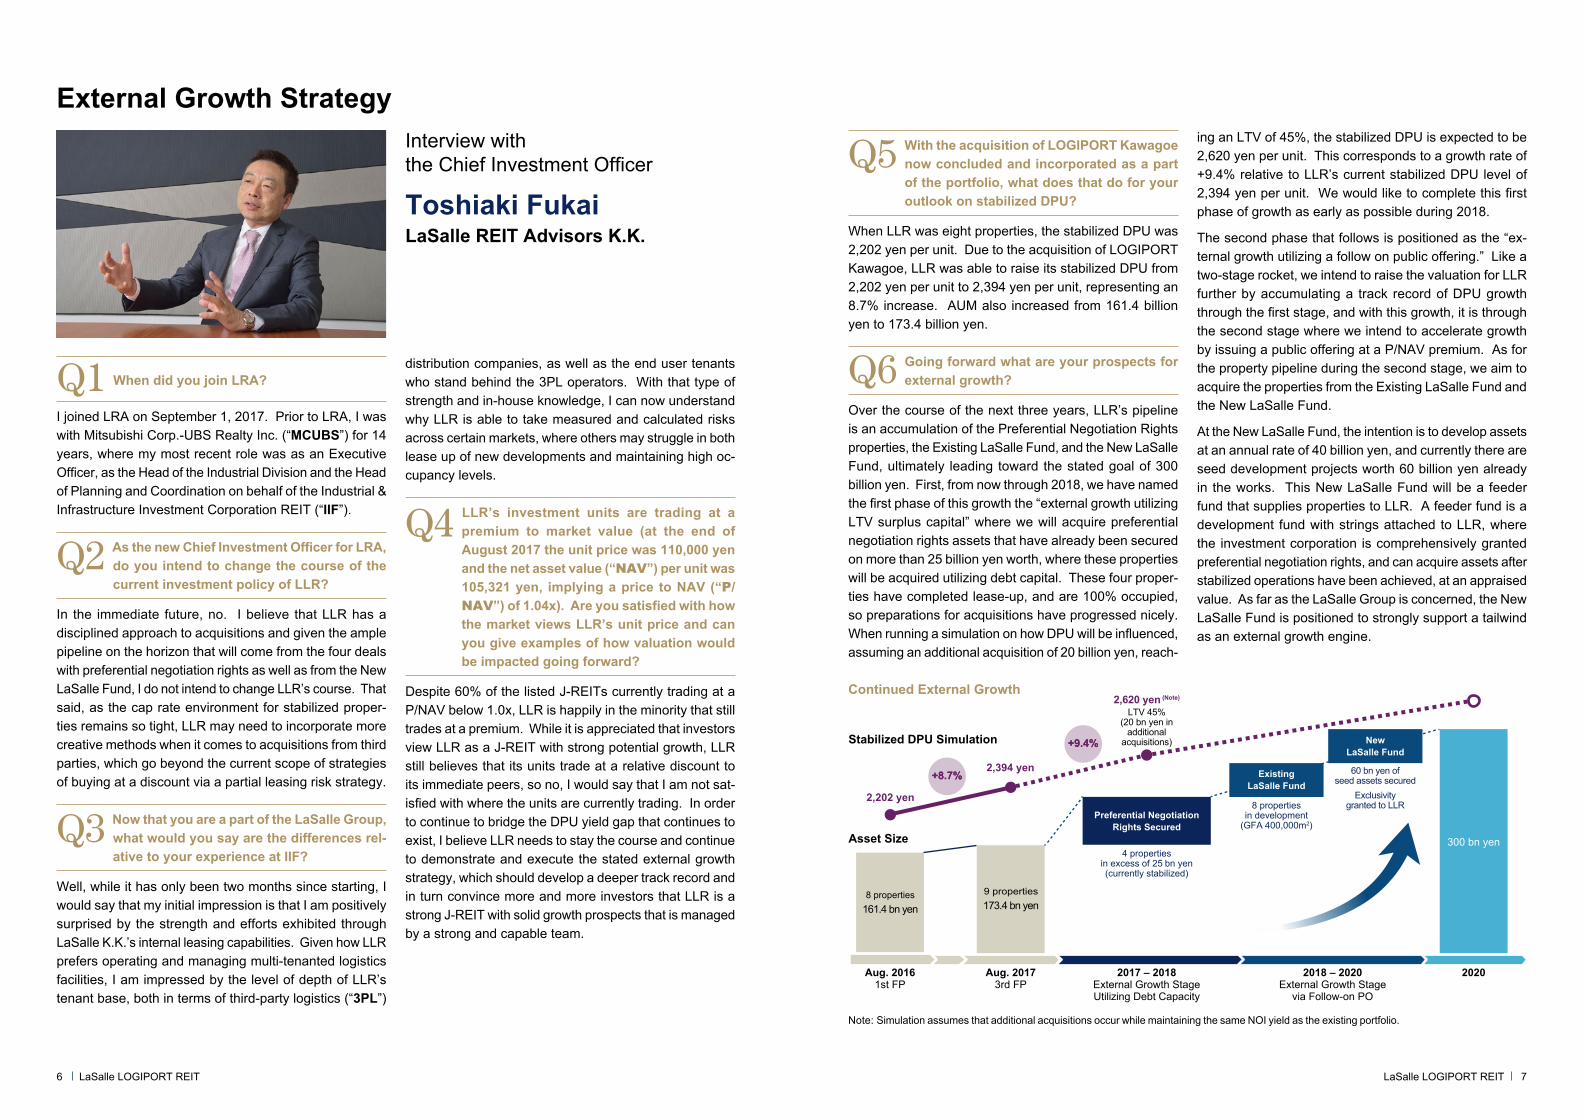
When LLR was eight properties, the stabilized DPU was 2,202 yen per unit. Due to the acquisition of LOGIPORT Kawagoe, LLR was able to raise its stabilized DPU from 2,202 yen per unit to 2,394 yen per unit, representing an 8.7% increase. AUM also increased from 161.4 billion yen to 173.4 billion yen.
Q6 Going forward what are your prospects for external growth?
Over the course of the next three years, LLR’s pipeline is an accumulation of the Preferential Negotiation Rights properties, the Existing LaSalle Fund, and the New LaSalle Fund, ultimately leading toward the stated goal of 300 billion yen. First, from now through 2018, we have named the first phase of this growth the “external growth utilizing LTV surplus capital” where we will acquire preferential negotiation rights assets that have already been secured on more than 25 billion yen worth, where these properties will be acquired utilizing debt capital. These four proper-ties have completed lease-up, and are 100% occupied, so preparations for acquisitions have progressed nicely. When running a simulation on how DPU will be influenced, assuming an additional acquisition of 20 billion yen, reach-
ing an LTV of 45%, the stabilized DPU is expected to be 2,620 yen per unit. This corresponds to a growth rate of +9.4% relative to LLR’s current stabilized DPU level of 2,394 yen per unit. We would like to complete this first phase of growth as early as possible during 2018.
The second phase that follows is positioned as the “ex-ternal growth utilizing a follow on public offering.” Like a two-stage rocket, we intend to raise the valuation for LLR further by accumulating a track record of DPU growth through the first stage, and with this growth, it is through the second stage where we intend to accelerate growth by issuing a public offering at a P/NAV premium. As for the property pipeline during the second stage, we aim to acquire the properties from the Existing LaSalle Fund and the New LaSalle Fund.
At the New LaSalle Fund, the intention is to develop assets at an annual rate of 40 billion yen, and currently there are seed development projects worth 60 billion yen already in the works. This New LaSalle Fund will be a feeder fund that supplies properties to LLR. A feeder fund is a development fund with strings attached to LLR, where the investment corporation is comprehensively granted preferential negotiation rights, and can acquire assets after stabilized operations have been achieved, at an appraised value. As far as the LaSalle Group is concerned, the New LaSalle Fund is positioned to strongly support a tailwind as an external growth engine.
External Growth Strategy
6 7LaSalle LOGIPORT REIT LaSalle LOGIPORT REIT
Internal Growth Strategy
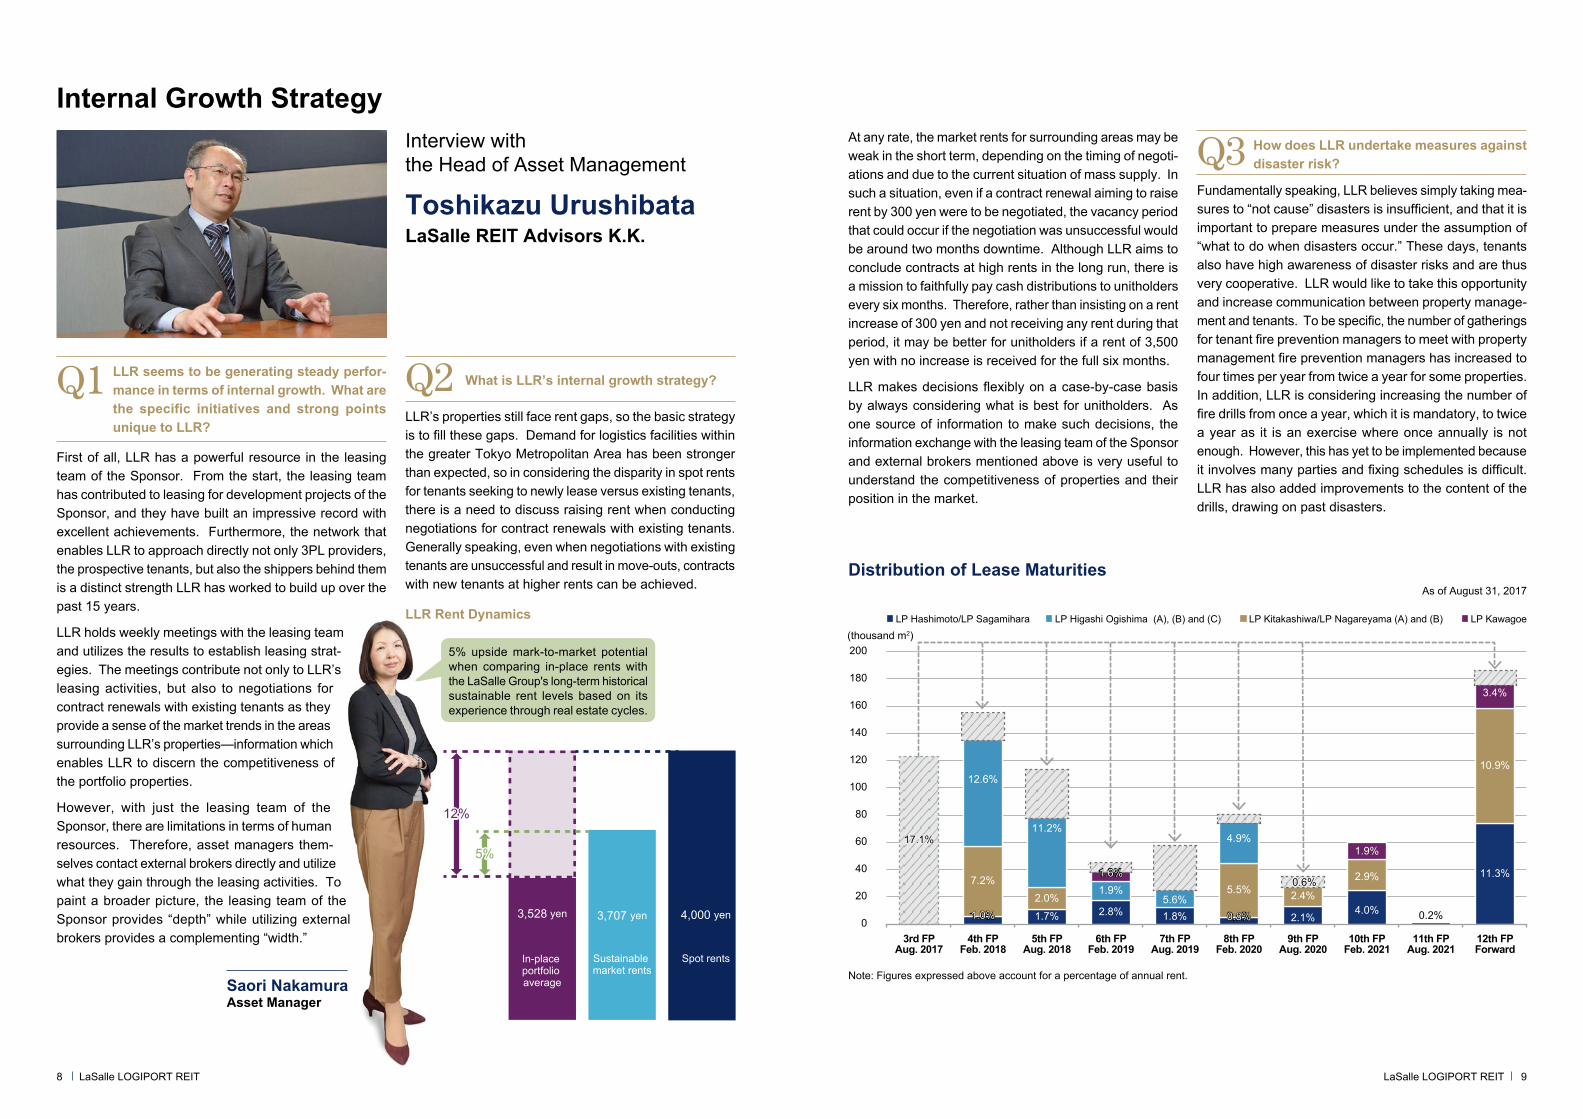
Toshikazu UrushibataLaSalle REIT Advisors K.K.
Interview withthe Head of Asset Management
Q1 LLR seems to be generating steady perfor-mance in terms of internal growth. What are the specific initiatives and strong points unique to LLR?
First of all, LLR has a powerful resource in the leasing team of the Sponsor. From the start, the leasing team has contributed to leasing for development projects of the Sponsor, and they have built an impressive record with excellent achievements. Furthermore, the network that enables LLR to approach directly not only 3PL providers, the prospective tenants, but also the shippers behind them is a distinct strength LLR has worked to build up over the past 15 years.
LLR holds weekly meetings with the leasing team and utilizes the results to establish leasing strat-egies. The meetings contribute not only to LLR’s leasing activities, but also to negotiations for contract renewals with existing tenants as they provide a sense of the market trends in the areas surrounding LLR’s properties—information which enables LLR to discern the competitiveness of the portfolio properties.
However, with just the leasing team of the Sponsor, there are limitations in terms of human resources. Therefore, asset managers them-selves contact external brokers directly and utilize what they gain through the leasing activities. To paint a broader picture, the leasing team of the Sponsor provides “depth” while utilizing external brokers provides a complementing “width.”
What is LLR’s internal growth strategy?Q2LLR’s properties still face rent gaps, so the basic strategy is to fill these gaps. Demand for logistics facilities within the greater Tokyo Metropolitan Area has been stronger than expected, so in considering the disparity in spot rents for tenants seeking to newly lease versus existing tenants, there is a need to discuss raising rent when conducting negotiations for contract renewals with existing tenants. Generally speaking, even when negotiations with existing tenants are unsuccessful and result in move-outs, contracts with new tenants at higher rents can be achieved.
Fundamentally speaking, LLR believes simply taking mea-sures to “not cause” disasters is insufficient, and that it is important to prepare measures under the assumption of “what to do when disasters occur.” These days, tenants also have high awareness of disaster risks and are thus very cooperative. LLR would like to take this opportunity and increase communication between property manage-ment and tenants. To be specific, the number of gatherings for tenant fire prevention managers to meet with property management fire prevention managers has increased to four times per year from twice a year for some properties. In addition, LLR is considering increasing the number of fire drills from once a year, which it is mandatory, to twice a year as it is an exercise where once annually is not enough. However, this has yet to be implemented because it involves many parties and fixing schedules is difficult. LLR has also added improvements to the content of the drills, drawing on past disasters.
How does LLR undertake measures against disaster risk?Q3
At any rate, the market rents for surrounding areas may be weak in the short term, depending on the timing of negoti-ations and due to the current situation of mass supply. In such a situation, even if a contract renewal aiming to raise rent by 300 yen were to be negotiated, the vacancy period that could occur if the negotiation was unsuccessful would be around two months downtime. Although LLR aims to conclude contracts at high rents in the long run, there is a mission to faithfully pay cash distributions to unitholders every six months. Therefore, rather than insisting on a rent increase of 300 yen and not receiving any rent during that period, it may be better for unitholders if a rent of 3,500 yen with no increase is received for the full six months.
LLR makes decisions flexibly on a case-by-case basis by always considering what is best for unitholders. As one source of information to make such decisions, the information exchange with the leasing team of the Sponsor and external brokers mentioned above is very useful to understand the competitiveness of properties and their position in the market.
Saori NakamuraAsset Manager
8 9LaSalle LOGIPORT REIT LaSalle LOGIPORT REIT
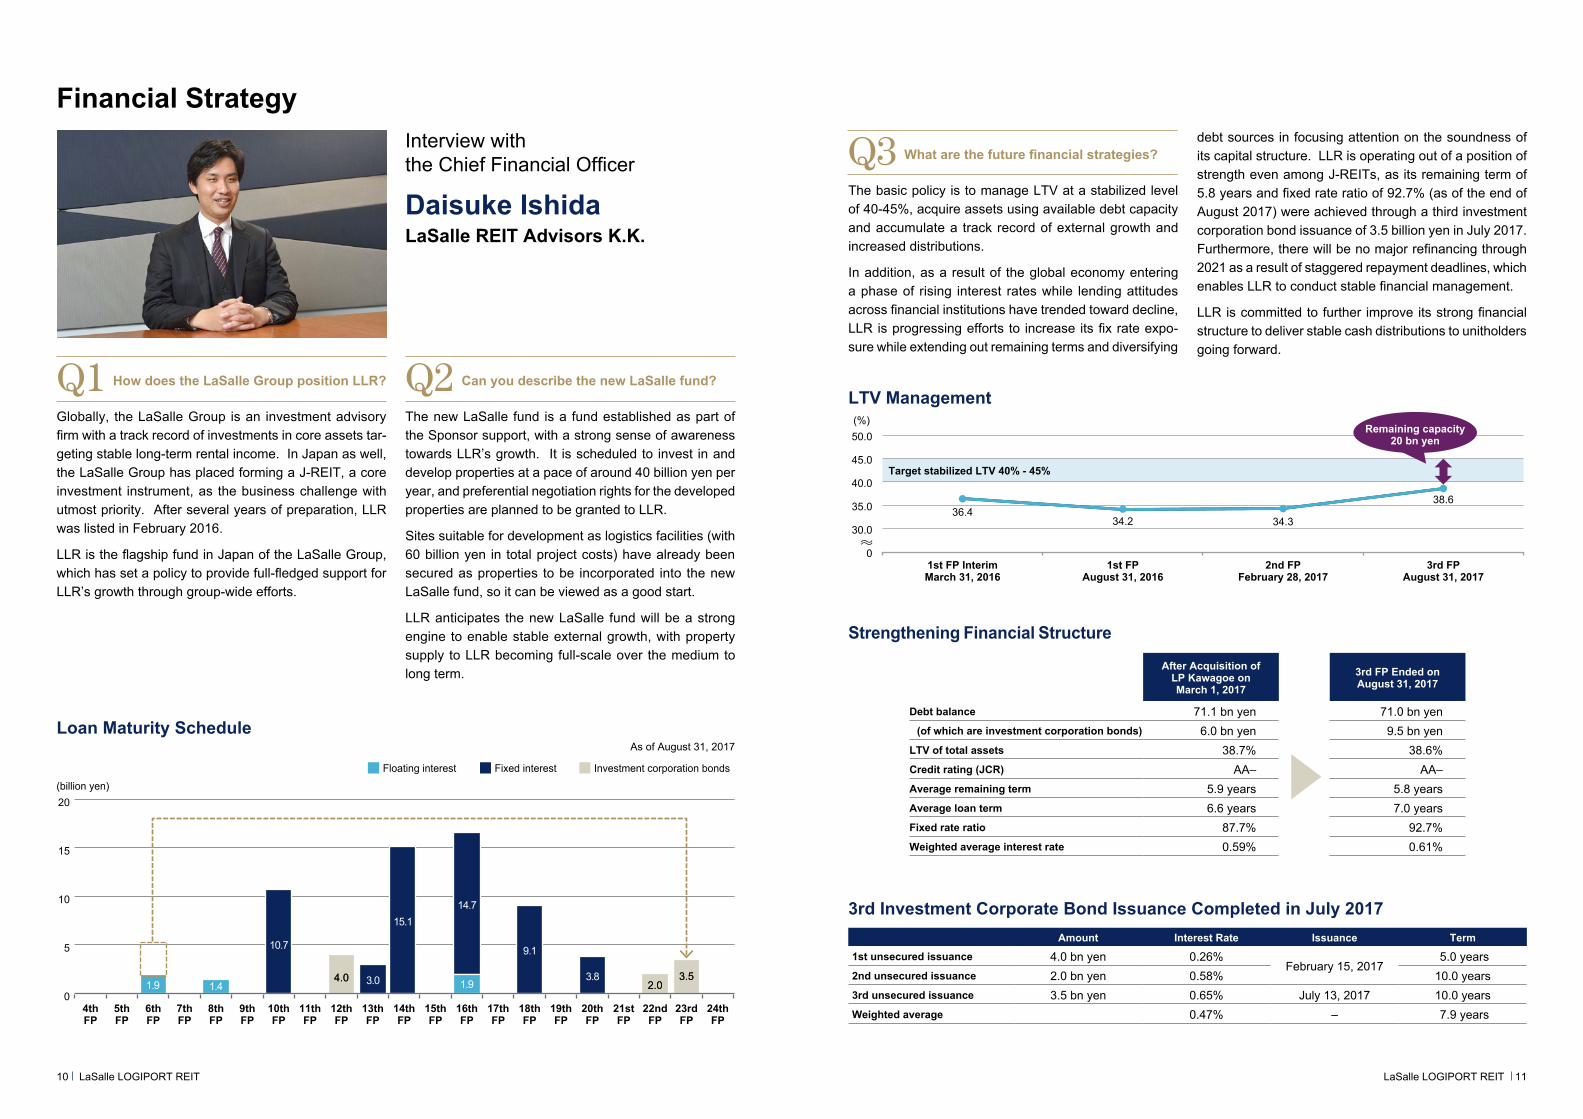
As of August 31, 2017
Distribution of Lease Maturities
(thousand m2)LP Hashimoto/LP Sagamihara LP Kitakashiwa/LP Nagareyama (A) and (B) LP KawagoeLP Higashi Ogishima (A), (B) and (C)
0
20
40
60
80
100
120
140
160
180
200
17.1%17.1%
1.0%1.0% 1.7% 2.8% 1.8% 0.8%0.8% 2.1%4.0% 0.2%
11.3%7.2%
2.0%5.5% 2.4%
2.9%
10.9%12.6%
11.2%
1.9%5.6%
4.9%1.9%1.9%
3.4%
1.6%1.6%0.6%0.6%
3rd FPAug. 2017
4th FPFeb. 2018
5th FPAug. 2018
6th FPFeb. 2019
7th FPAug. 2019
8th FPFeb. 2020
9th FPAug. 2020
10th FPFeb. 2021
11th FPAug. 2021
12th FPForward
Note: Figures expressed above account for a percentage of annual rent.
LLR Rent Dynamics
3,528 yen 4,000 yen3,707 yen
12%12%
5%5%
In-place portfolio average
Sustainable market rents
Spot rents
5% upside mark-to-market potential when comparing in-place rents with the LaSalle Group's long-term historical sustainable rent levels based on its experience through real estate cycles.
Financial Strategy
Daisuke IshidaLaSalle REIT Advisors K.K.
Interview withthe Chief Financial Officer
0
5
10
15
20
24thFP
23rdFP
22ndFP
21stFP
20thFP
19thFP
18thFP
17thFP
16thFP
15thFP
14thFP
13thFP
12thFP
11thFP
10thFP
9thFP
8thFP
7thFP
6thFP
5thFP
4thFP
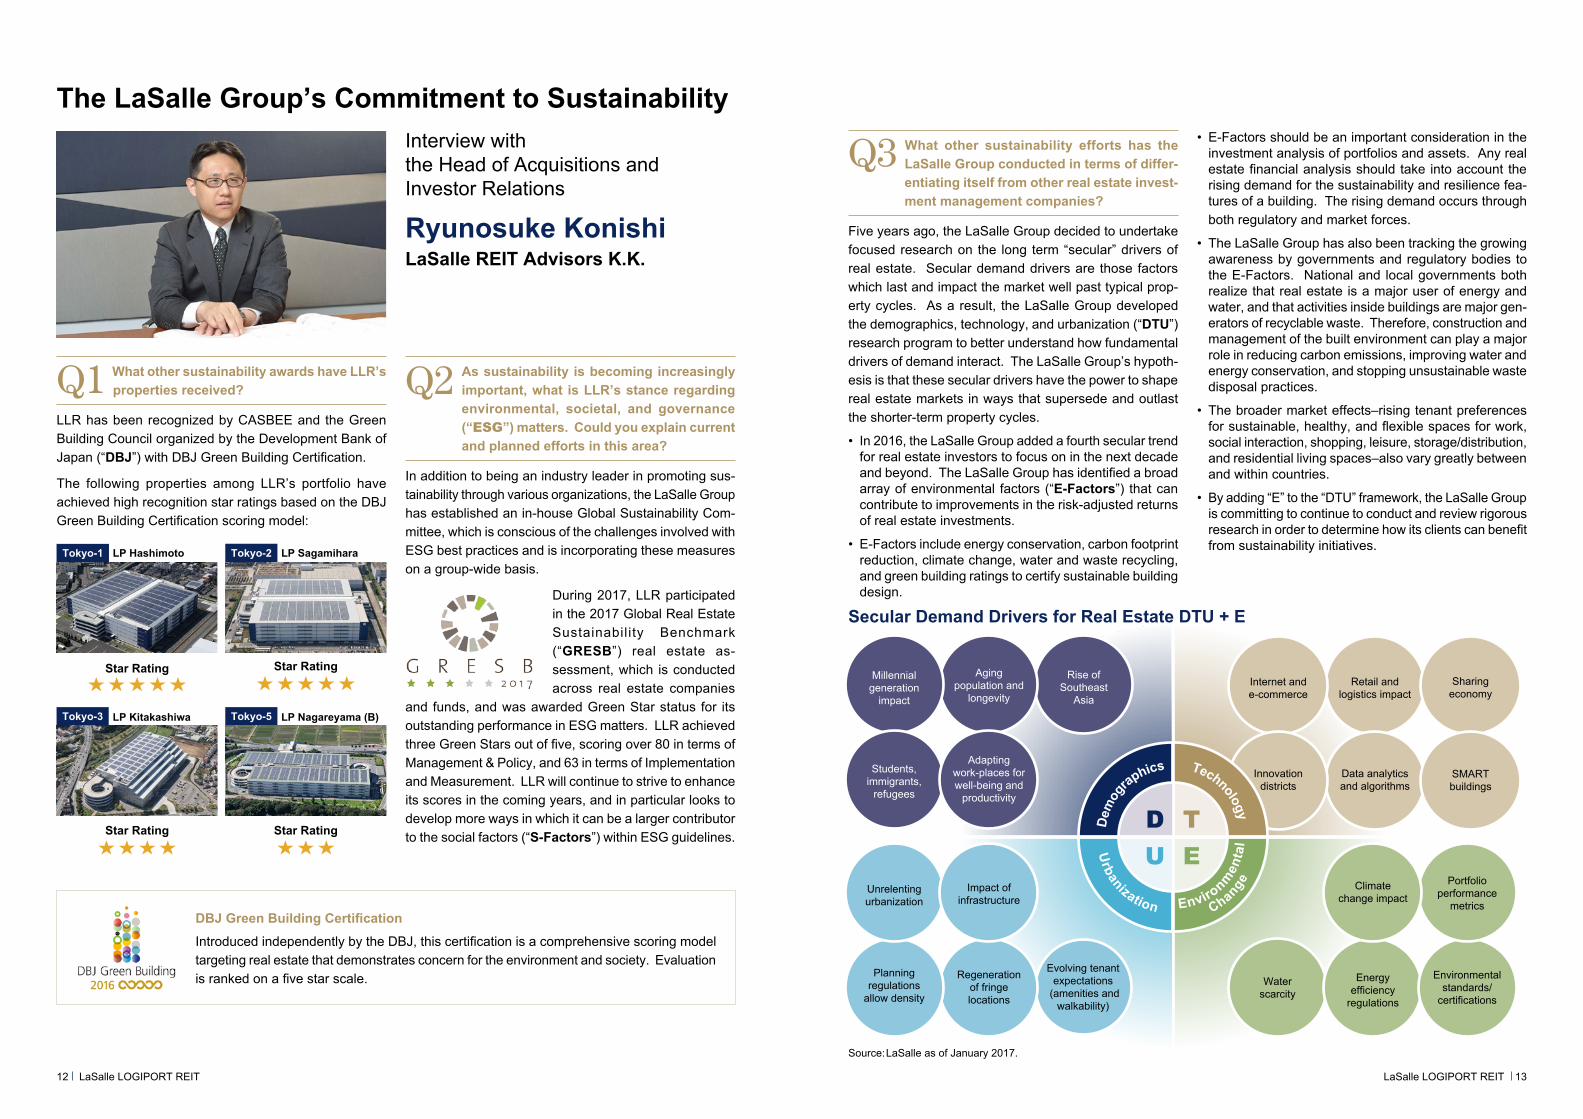
Fixed interestFloating interest Investment corporation bonds
(billion yen)
14.7
9.1
3.82.02.0
3.53.5
15.1
3.0
10.7
4.04.01.9 1.4 1.9
Loan Maturity ScheduleAs of August 31, 2017
3rd Investment Corporate Bond Issuance Completed in July 2017Amount Interest Rate Issuance Term
1st unsecured issuance 4.0 bn yen 0.26%February 15, 2017
5.0 years2nd unsecured issuance 2.0 bn yen 0.58% 10.0 years3rd unsecured issuance 3.5 bn yen 0.65% July 13, 2017 10.0 yearsWeighted average 0.47% – 7.9 years
Strengthening Financial Structure
After Acquisition ofLP Kawagoe on March 1, 2017
3rd FP Ended on August 31, 2017
Debt balance 71.1 bn yen 71.0 bn yen(of which are investment corporation bonds) 6.0 bn yen 9.5 bn yen
LTV of total assets 38.7% 38.6%Credit rating (JCR) AA– AA–Average remaining term 5.9 years 5.8 yearsAverage loan term 6.6 years 7.0 yearsFixed rate ratio 87.7% 92.7%Weighted average interest rate 0.59% 0.61%
Globally, the LaSalle Group is an investment advisory firm with a track record of investments in core assets tar-geting stable long-term rental income. In Japan as well, the LaSalle Group has placed forming a J-REIT, a core investment instrument, as the business challenge with utmost priority. After several years of preparation, LLR was listed in February 2016.
LLR is the flagship fund in Japan of the LaSalle Group, which has set a policy to provide full-fledged support for LLR’s growth through group-wide efforts.
How does the LaSalle Group position LLR?Q1 Can you describe the new LaSalle fund?Q2 The new LaSalle fund is a fund established as part of the Sponsor support, with a strong sense of awareness towards LLR’s growth. It is scheduled to invest in and develop properties at a pace of around 40 billion yen per year, and preferential negotiation rights for the developed properties are planned to be granted to LLR.
Sites suitable for development as logistics facilities (with 60 billion yen in total project costs) have already been secured as properties to be incorporated into the new LaSalle fund, so it can be viewed as a good start.
LLR anticipates the new LaSalle fund will be a strong engine to enable stable external growth, with property supply to LLR becoming full-scale over the medium to long term.
The basic policy is to manage LTV at a stabilized level of 40-45%, acquire assets using available debt capacity and accumulate a track record of external growth and increased distributions.
In addition, as a result of the global economy entering a phase of rising interest rates while lending attitudes across financial institutions have trended toward decline, LLR is progressing efforts to increase its fix rate expo-sure while extending out remaining terms and diversifying
debt sources in focusing attention on the soundness of its capital structure. LLR is operating out of a position of strength even among J-REITs, as its remaining term of 5.8 years and fixed rate ratio of 92.7% (as of the end of August 2017) were achieved through a third investment corporation bond issuance of 3.5 billion yen in July 2017. Furthermore, there will be no major refinancing through 2021 as a result of staggered repayment deadlines, which enables LLR to conduct stable financial management.
LLR is committed to further improve its strong financial structure to deliver stable cash distributions to unitholders going forward.
What are the future financial strategies?Q3
0
30.0
35.0
40.0
45.0
50.0
36.434.2 34.3
38.6
Remaining capacity20 bn yen
(%)
1st FP InterimMarch 31, 2016
1st FPAugust 31, 2016
2nd FPFebruary 28, 2017
3rd FPAugust 31, 2017
Target stabilized LTV 40% - 45%
LTV Management
10 11LaSalle LOGIPORT REIT LaSalle LOGIPORT REIT
The LaSalle Group’s Commitment to Sustainability
Ryunosuke KonishiLaSalle REIT Advisors K.K.
Interview withthe Head of Acquisitions and Investor Relations
Sharing economy
Millennial generation
impact
Aging population and
longevity
Rise of Southeast
Asia
Students, immigrants,
refugees
Adapting work-places for well-being and
productivity
Unrelenting urbanization
Planning regulations
allow density
Impact of infrastructure
Internet and e-commerce
Regeneration of fringe locations
Evolving tenant expectations
(amenities and walkability)
Climate change impact
Water scarcity
Portfolio performance
metrics
Energy efficiency
regulations
Environmental standards/
certifications
Retail andlogistics impact
Innovationdistricts
SMART buildings
Data analytics and algorithms
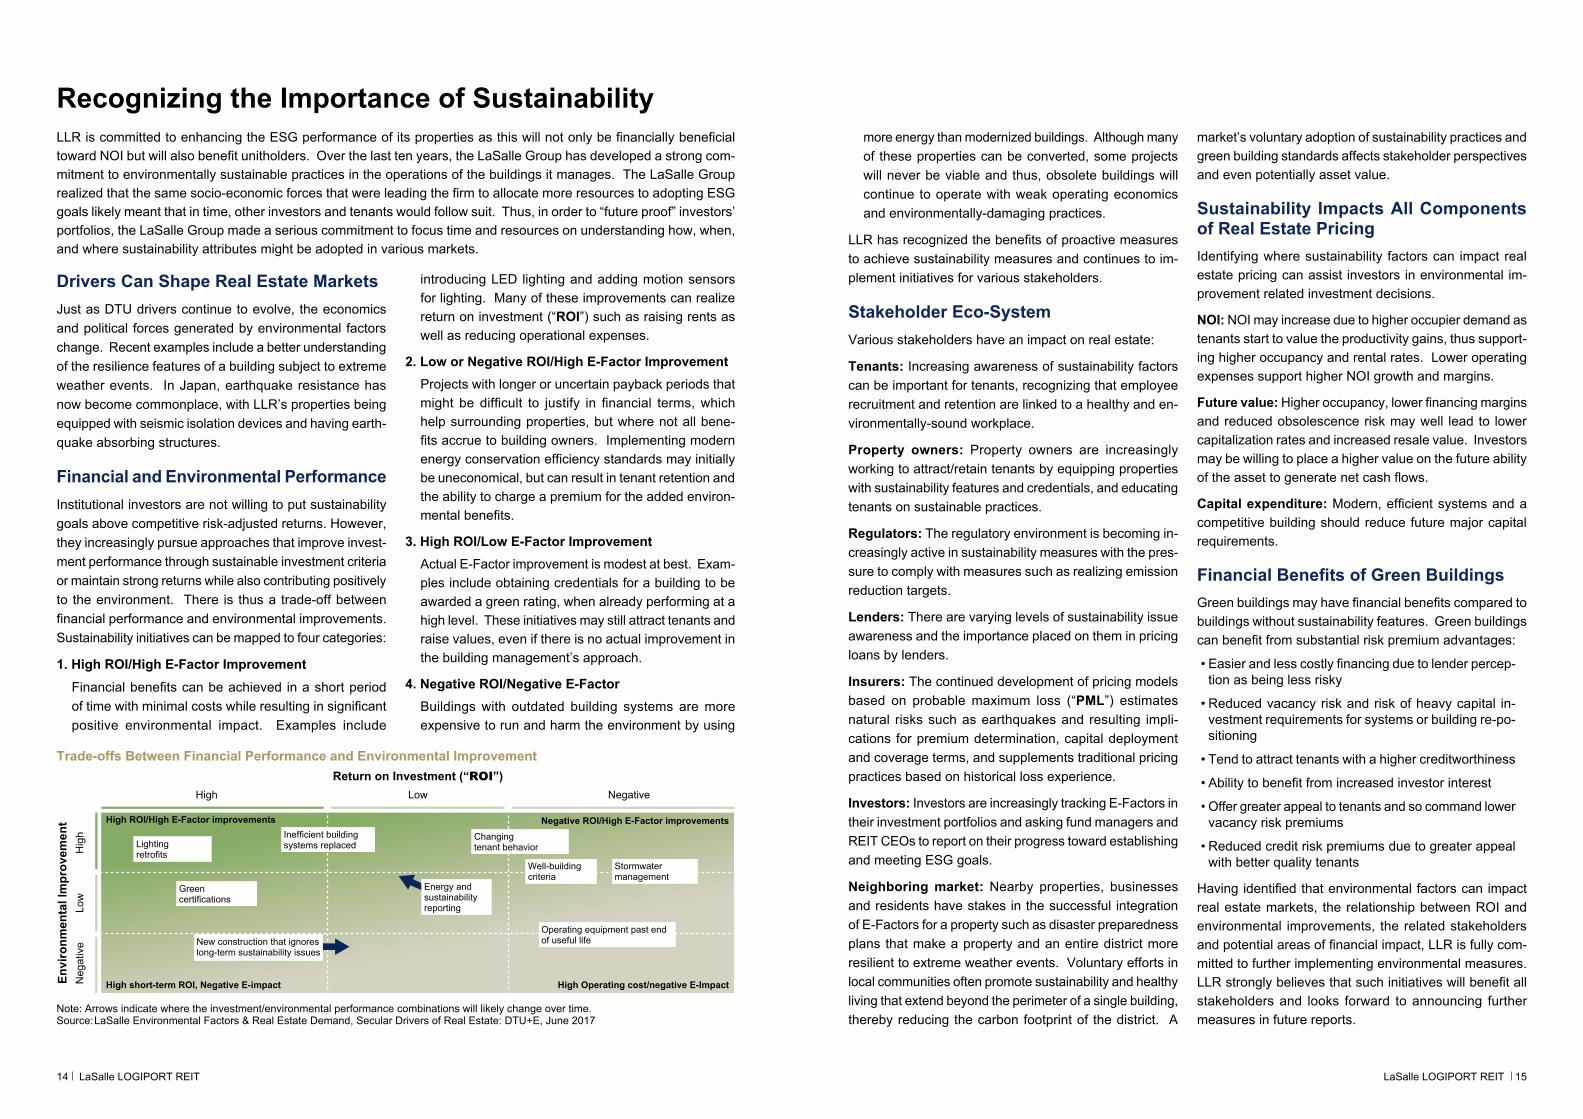
D TU E
Dem
og
raphics
Environm
enta
l
Change
Technology
Urbanization
Q2 As sustainability is becoming increasingly important, what is LLR’s stance regarding environmental, societal, and governance (“ESG”) matters. Could you explain current and planned efforts in this area?
In addition to being an industry leader in promoting sus-tainability through various organizations, the LaSalle Group has established an in-house Global Sustainability Com-mittee, which is conscious of the challenges involved with ESG best practices and is incorporating these measures on a group-wide basis.
During 2017, LLR participated in the 2017 Global Real Estate Sustainability Benchmark (“GRESB”) real estate as-sessment, which is conducted across real estate companies
and funds, and was awarded Green Star status for its outstanding performance in ESG matters. LLR achieved three Green Stars out of five, scoring over 80 in terms of Management & Policy, and 63 in terms of Implementation and Measurement. LLR will continue to strive to enhance its scores in the coming years, and in particular looks to develop more ways in which it can be a larger contributor to the social factors (“S-Factors”) within ESG guidelines.
Q3 What other sustainability efforts has the LaSalle Group conducted in terms of differ-entiating itself from other real estate invest-ment management companies?
Five years ago, the LaSalle Group decided to undertake focused research on the long term “secular” drivers of real estate. Secular demand drivers are those factors which last and impact the market well past typical prop-erty cycles. As a result, the LaSalle Group developed the demographics, technology, and urbanization (“DTU”) research program to better understand how fundamental drivers of demand interact. The LaSalle Group’s hypoth-esis is that these secular drivers have the power to shape real estate markets in ways that supersede and outlast the shorter-term property cycles.
• In 2016, the LaSalle Group added a fourth secular trend for real estate investors to focus on in the next decade and beyond. The LaSalle Group has identified a broad array of environmental factors (“E-Factors”) that can contribute to improvements in the risk-adjusted returns of real estate investments.
• E-Factors include energy conservation, carbon footprint reduction, climate change, water and waste recycling, and green building ratings to certify sustainable building design.
• E-Factors should be an important consideration in the investment analysis of portfolios and assets. Any real estate financial analysis should take into account the rising demand for the sustainability and resilience fea-tures of a building. The rising demand occurs through both regulatory and market forces.
• The LaSalle Group has also been tracking the growing awareness by governments and regulatory bodies to the E-Factors. National and local governments both realize that real estate is a major user of energy and water, and that activities inside buildings are major gen-erators of recyclable waste. Therefore, construction and management of the built environment can play a major role in reducing carbon emissions, improving water and energy conservation, and stopping unsustainable waste disposal practices.
• The broader market effects–rising tenant preferences for sustainable, healthy, and flexible spaces for work, social interaction, shopping, leisure, storage/distribution, and residential living spaces–also vary greatly between and within countries.
• By adding “E” to the “DTU” framework, the LaSalle Group is committing to continue to conduct and review rigorous research in order to determine how its clients can benefit from sustainability initiatives.
Q1 What other sustainability awards have LLR’s properties received?
LLR has been recognized by CASBEE and the Green Building Council organized by the Development Bank of Japan (“DBJ”) with DBJ Green Building Certification.
The following properties among LLR’s portfolio have achieved high recognition star ratings based on the DBJ Green Building Certification scoring model:
LP HashimotoTokyo-1
Star Rating Star Rating
LP SagamiharaTokyo-2
Star Rating
LP KitakashiwaTokyo-3
Star Rating
LP Nagareyama (B)Tokyo-5
DBJ Green Building Certification
Introduced independently by the DBJ, this certification is a comprehensive scoring model targeting real estate that demonstrates concern for the environment and society. Evaluation is ranked on a five star scale.
Secular Demand Drivers for Real Estate DTU + E
Source: LaSalle as of January 2017.
12 13LaSalle LOGIPORT REIT LaSalle LOGIPORT REIT
Recognizing the Importance of Sustainability
Drivers Can Shape Real Estate MarketsJust as DTU drivers continue to evolve, the economics and political forces generated by environmental factors change. Recent examples include a better understanding of the resilience features of a building subject to extreme weather events. In Japan, earthquake resistance has now become commonplace, with LLR’s properties being equipped with seismic isolation devices and having earth-quake absorbing structures.
Financial and Environmental PerformanceInstitutional investors are not willing to put sustainability goals above competitive risk-adjusted returns. However, they increasingly pursue approaches that improve invest-ment performance through sustainable investment criteria or maintain strong returns while also contributing positively to the environment. There is thus a trade-off between financial performance and environmental improvements. Sustainability initiatives can be mapped to four categories:
1. High ROI/High E-Factor ImprovementFinancial benefits can be achieved in a short period of time with minimal costs while resulting in significant positive environmental impact. Examples include
introducing LED lighting and adding motion sensors for lighting. Many of these improvements can realize return on investment (“ROI”) such as raising rents as well as reducing operational expenses.
2. Low or Negative ROI/High E-Factor ImprovementProjects with longer or uncertain payback periods that might be difficult to justify in financial terms, which help surrounding properties, but where not all bene-fits accrue to building owners. Implementing modern energy conservation efficiency standards may initially be uneconomical, but can result in tenant retention and the ability to charge a premium for the added environ-mental benefits.
3. High ROI/Low E-Factor Improvement Actual E-Factor improvement is modest at best. Exam-ples include obtaining credentials for a building to be awarded a green rating, when already performing at a high level. These initiatives may still attract tenants and raise values, even if there is no actual improvement in the building management’s approach.
4. Negative ROI/Negative E-Factor Buildings with outdated building systems are more expensive to run and harm the environment by using
LLR is committed to enhancing the ESG performance of its properties as this will not only be financially beneficial toward NOI but will also benefit unitholders. Over the last ten years, the LaSalle Group has developed a strong com-mitment to environmentally sustainable practices in the operations of the buildings it manages. The LaSalle Group realized that the same socio-economic forces that were leading the firm to allocate more resources to adopting ESG goals likely meant that in time, other investors and tenants would follow suit. Thus, in order to “future proof” investors’ portfolios, the LaSalle Group made a serious commitment to focus time and resources on understanding how, when, and where sustainability attributes might be adopted in various markets.
more energy than modernized buildings. Although many of these properties can be converted, some projects will never be viable and thus, obsolete buildings will continue to operate with weak operating economics and environmentally-damaging practices.
LLR has recognized the benefits of proactive measures to achieve sustainability measures and continues to im-plement initiatives for various stakeholders.
Stakeholder Eco-System Various stakeholders have an impact on real estate:
Tenants: Increasing awareness of sustainability factors can be important for tenants, recognizing that employee recruitment and retention are linked to a healthy and en-vironmentally-sound workplace.
Property owners: Property owners are increasingly working to attract/retain tenants by equipping properties with sustainability features and credentials, and educating tenants on sustainable practices.
Regulators: The regulatory environment is becoming in-creasingly active in sustainability measures with the pres-sure to comply with measures such as realizing emission reduction targets.
Lenders: There are varying levels of sustainability issue awareness and the importance placed on them in pricing loans by lenders.
Insurers: The continued development of pricing models based on probable maximum loss (“PML”) estimates natural risks such as earthquakes and resulting impli-cations for premium determination, capital deployment and coverage terms, and supplements traditional pricing practices based on historical loss experience.
Investors: Investors are increasingly tracking E-Factors in their investment portfolios and asking fund managers and REIT CEOs to report on their progress toward establishing and meeting ESG goals.
Neighboring market: Nearby properties, businesses and residents have stakes in the successful integration of E-Factors for a property such as disaster preparedness plans that make a property and an entire district more resilient to extreme weather events. Voluntary efforts in local communities often promote sustainability and healthy living that extend beyond the perimeter of a single building, thereby reducing the carbon footprint of the district. A
market’s voluntary adoption of sustainability practices and green building standards affects stakeholder perspectives and even potentially asset value.
Sustainability Impacts All Components of Real Estate PricingIdentifying where sustainability factors can impact real estate pricing can assist investors in environmental im-provement related investment decisions.
NOI: NOI may increase due to higher occupier demand as tenants start to value the productivity gains, thus support-ing higher occupancy and rental rates. Lower operating expenses support higher NOI growth and margins.
Future value: Higher occupancy, lower financing margins and reduced obsolescence risk may well lead to lower capitalization rates and increased resale value. Investors may be willing to place a higher value on the future ability of the asset to generate net cash flows.
Capital expenditure: Modern, efficient systems and a competitive building should reduce future major capital requirements.
Financial Benefits of Green BuildingsGreen buildings may have financial benefits compared to buildings without sustainability features. Green buildings can benefit from substantial risk premium advantages:
• Easier and less costly financing due to lender percep-tion as being less risky
• Reduced vacancy risk and risk of heavy capital in-vestment requirements for systems or building re-po-sitioning
• Tend to attract tenants with a higher creditworthiness
• Ability to benefit from increased investor interest
• Offer greater appeal to tenants and so command lower vacancy risk premiums
• Reduced credit risk premiums due to greater appeal with better quality tenants
Having identified that environmental factors can impact real estate markets, the relationship between ROI and environmental improvements, the related stakeholders and potential areas of financial impact, LLR is fully com-mitted to further implementing environmental measures. LLR strongly believes that such initiatives will benefit all stakeholders and looks forward to announcing further measures in future reports.
High Low
Return on Investment (“ROI”)Negative
Envi
ronm
enta
l Im
prov
emen
t H
igh
Low
Neg
ativ
e
High ROI/High E-Factor improvements Negative ROI/High E-Factor improvements
High Operating cost/negative E-ImpactHigh short-term ROI, Negative E-impact
Trade-offs Between Financial Performance and Environmental Improvement
Note: Arrows indicate where the investment/environmental performance combinations will likely change over time.Source: LaSalle Environmental Factors & Real Estate Demand, Secular Drivers of Real Estate: DTU+E, June 2017
Lighting retrofits
Inefficient building systems replaced
Operating equipment past end of useful life
Stormwater management
Well-building criteria
Changing tenant behavior
Green certifications
New construction that ignores long-term sustainability issues
Energy and sustainability reporting
14 15LaSalle LOGIPORT REIT LaSalle LOGIPORT REIT
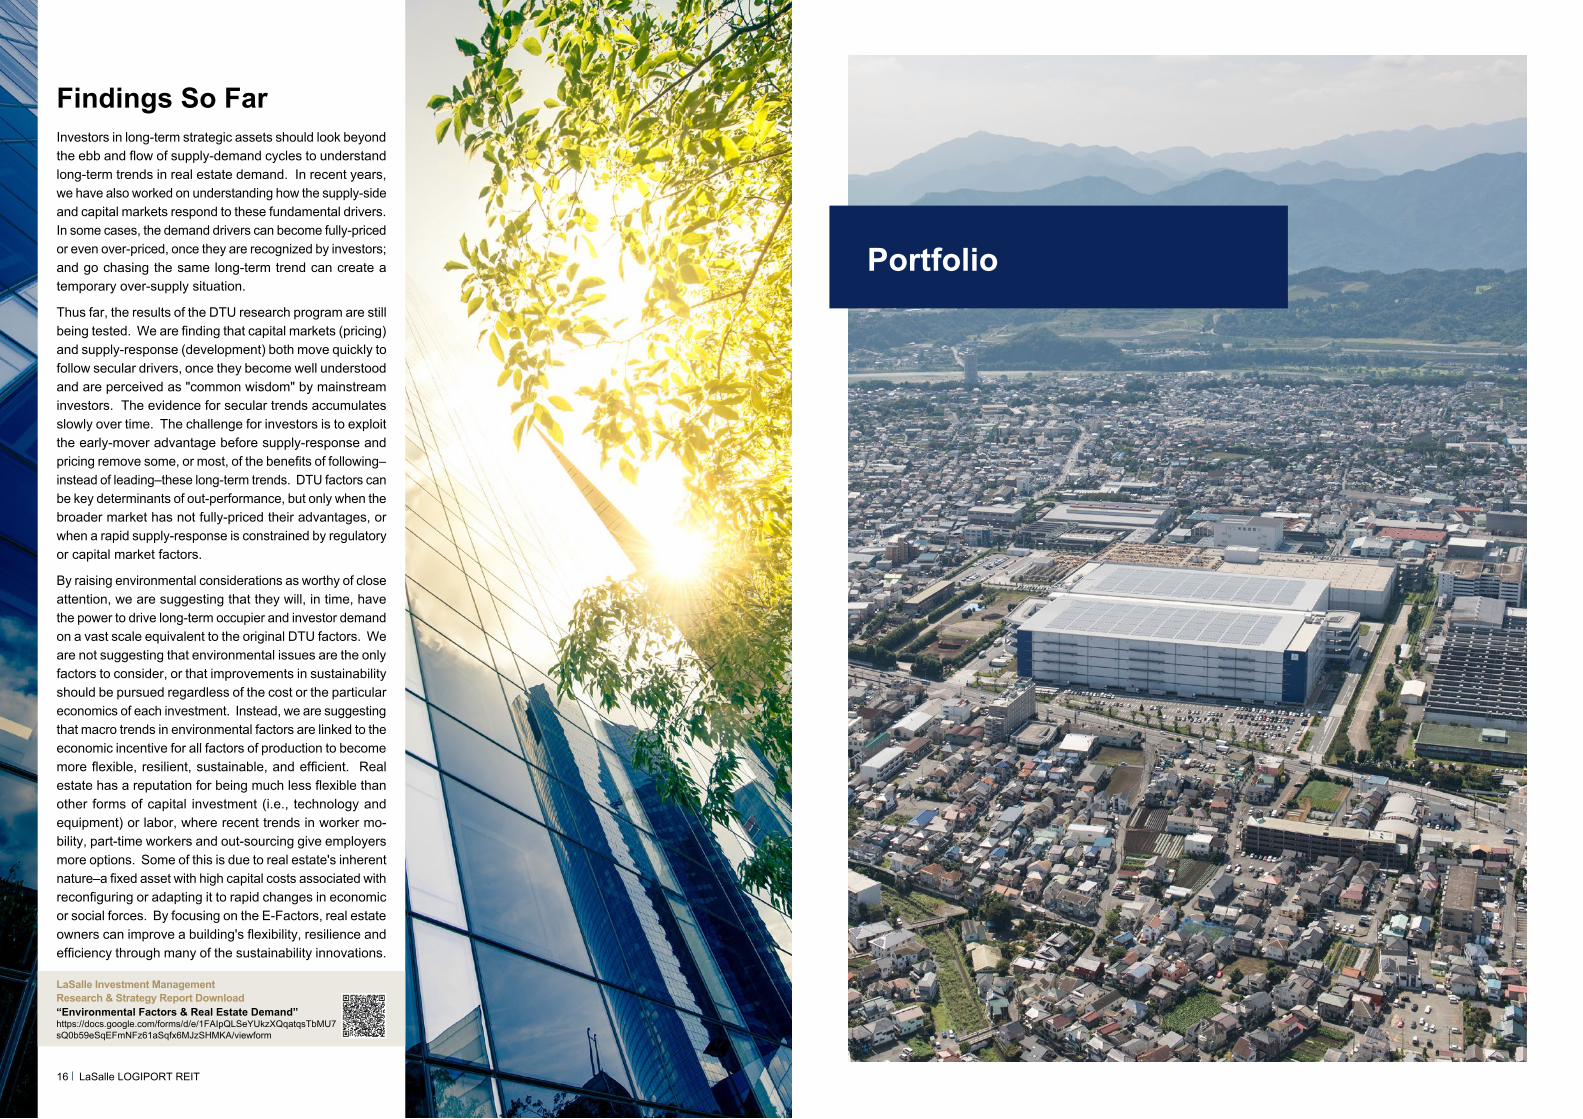
Findings So FarInvestors in long-term strategic assets should look beyond the ebb and flow of supply-demand cycles to understand long-term trends in real estate demand. In recent years, we have also worked on understanding how the supply-side and capital markets respond to these fundamental drivers. In some cases, the demand drivers can become fully-priced or even over-priced, once they are recognized by investors; and go chasing the same long-term trend can create a temporary over-supply situation.
Thus far, the results of the DTU research program are still being tested. We are finding that capital markets (pricing) and supply-response (development) both move quickly to follow secular drivers, once they become well understood and are perceived as "common wisdom" by mainstream investors. The evidence for secular trends accumulates slowly over time. The challenge for investors is to exploit the early-mover advantage before supply-response and pricing remove some, or most, of the benefits of following–instead of leading–these long-term trends. DTU factors can be key determinants of out-performance, but only when the broader market has not fully-priced their advantages, or when a rapid supply-response is constrained by regulatory or capital market factors.
By raising environmental considerations as worthy of close attention, we are suggesting that they will, in time, have the power to drive long-term occupier and investor demand on a vast scale equivalent to the original DTU factors. We are not suggesting that environmental issues are the only factors to consider, or that improvements in sustainability should be pursued regardless of the cost or the particular economics of each investment. Instead, we are suggesting that macro trends in environmental factors are linked to the economic incentive for all factors of production to become more flexible, resilient, sustainable, and efficient. Real estate has a reputation for being much less flexible than other forms of capital investment (i.e., technology and equipment) or labor, where recent trends in worker mo-bility, part-time workers and out-sourcing give employers more options. Some of this is due to real estate's inherent nature–a fixed asset with high capital costs associated with reconfiguring or adapting it to rapid changes in economic or social forces. By focusing on the E-Factors, real estate owners can improve a building's flexibility, resilience and efficiency through many of the sustainability innovations.
16 LaSalle LOGIPORT REIT
LaSalle Investment Management Research & Strategy Report Download“Environmental Factors & Real Estate Demand” https://docs.google.com/forms/d/e/1FAIpQLSeYUkzXQqatqsTbMU7sQ0b59eSqEFmNFz61aSqfx6MJzSHMKA/viewform
Portfolio
With
in a
60k
m ra
dius
from
JR
Toky
o St
ation
With
in a
60k
m ra
dius
from
JR
Toky
o St
ation
Toky
o Ar
ea
Saitama Saitama
Kanagawa Kanagawa
ChibaChiba
TokyoTokyo
Port of TokyoPort of Tokyo
Haneda AirportHaneda Airport
Port of YokohamaPort of Yokohama
Tokyo Gaikan Expressway
Tokyo Gaikan Expressway
Joban Expressway
Joban Expressway
JR Tokyo StationJR Tokyo Station
Narita International
Airport
Narita International
Airport
Route 16Route 16
Tomei Expressway
Tomei Expressway
Higashi-Kanto Expressway
Higashi-Kanto ExpresswayChuo
ExpresswayChuo
Expressway
Kanetsu Expressway
Kanetsu Expressway
Tohoku Expressway
Tohoku ExpresswayMetropolitan
Inter City ExpresswayMetropolitan
Inter City Expressway
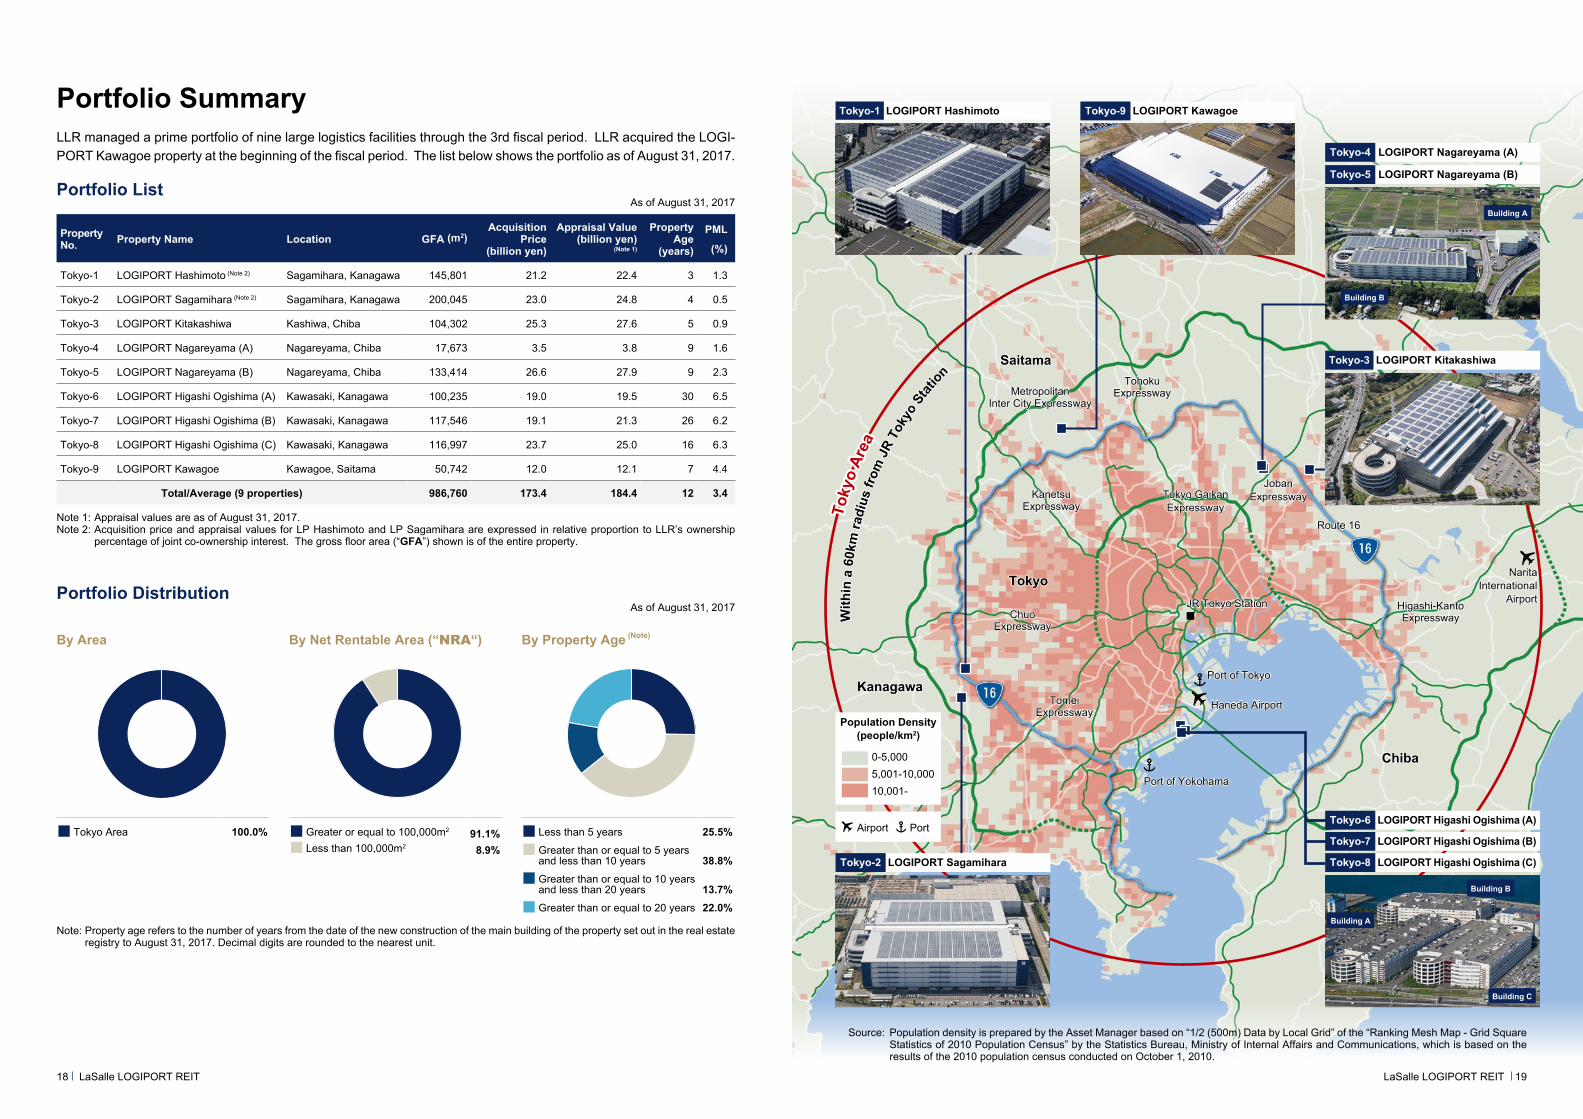
Source: Population density is prepared by the Asset Manager based on “1/2 (500m) Data by Local Grid” of the “Ranking Mesh Map - Grid Square Statistics of 2010 Population Census” by the Statistics Bureau, Ministry of Internal Affairs and Communications, which is based on the results of the 2010 population census conducted on October 1, 2010.
Portfolio Summary
By Area By Net Rentable Area (“NRA“) By Property Age (Note)
Portfolio Distribution
Population Density (people/km2)
0-5,0005,001-10,00010,001-
Airport Port
Note: Property age refers to the number of years from the date of the new construction of the main building of the property set out in the real estate registry to August 31, 2017. Decimal digits are rounded to the nearest unit.
As of August 31, 2017
Tokyo Area 100.0% Greater or equal to 100,000m2 91.1%Less than 100,000m2 8.9%
Less than 5 years 25.5% Greater than or equal to 5 years and less than 10 years 38.8%Greater than or equal to 10 years and less than 20 years 13.7%Greater than or equal to 20 years 22.0%
LLR managed a prime portfolio of nine large logistics facilities through the 3rd fiscal period. LLR acquired the LOGI-PORT Kawagoe property at the beginning of the fiscal period. The list below shows the portfolio as of August 31, 2017.
Portfolio List
Property No. Property Name Location GFA (m2)
Acquisition Price
(billion yen)
Appraisal Value (billion yen)
(Note 1)
Property Age
(years)
PML
(%)
Tokyo-1 LOGIPORT Hashimoto (Note 2) Sagamihara, Kanagawa 145,801 21.2 22.4 3 1.3
Tokyo-2 LOGIPORT Sagamihara (Note 2) Sagamihara, Kanagawa 200,045 23.0 24.8 4 0.5
Tokyo-3 LOGIPORT Kitakashiwa Kashiwa, Chiba 104,302 25.3 27.6 5 0.9
Tokyo-4 LOGIPORT Nagareyama (A) Nagareyama, Chiba 17,673 3.5 3.8 9 1.6
Tokyo-5 LOGIPORT Nagareyama (B) Nagareyama, Chiba 133,414 26.6 27.9 9 2.3
Tokyo-6 LOGIPORT Higashi Ogishima (A) Kawasaki, Kanagawa 100,235 19.0 19.5 30 6.5
Tokyo-7 LOGIPORT Higashi Ogishima (B) Kawasaki, Kanagawa 117,546 19.1 21.3 26 6.2
Tokyo-8 LOGIPORT Higashi Ogishima (C) Kawasaki, Kanagawa 116,997 23.7 25.0 16 6.3
Tokyo-9 LOGIPORT Kawagoe Kawagoe, Saitama 50,742 12.0 12.1 7 4.4
Total/Average (9 properties) 986,760 173.4 184.4 12 3.4
Note 1: Appraisal values are as of August 31, 2017. Note 2: Acquisition price and appraisal values for LP Hashimoto and LP Sagamihara are expressed in relative proportion to LLR’s ownership
percentage of joint co-ownership interest. The gross floor area (“GFA”) shown is of the entire property.
As of August 31, 2017
18 19LaSalle LOGIPORT REIT LaSalle LOGIPORT REIT
LOGIPORT KitakashiwaTokyo-3
LOGIPORT SagamiharaTokyo-2
LOGIPORT Higashi Ogishima (A)Tokyo-6
LOGIPORT Higashi Ogishima (B)Tokyo-7
LOGIPORT Higashi Ogishima (C)Tokyo-8
Building A
Building B
Building C
LOGIPORT HashimotoTokyo-1
LOGIPORT Nagareyama (A)Tokyo-4
LOGIPORT Nagareyama (B)Tokyo-5
Building A
Building B
LOGIPORT KawagoeTokyo-9
Details of Portfolio
LOGIPORT HashimotoTokyo-1 55% trust co-ownership interest
T oky
o G
aikan
T oky
o G
aikan
Exp
ressw
ay
Exp
ressw
ay16
51
127
16
16
16
126
51
51
51
51
6
125
125
125
125
16
4
17
17
17
16 17
16
16
129
16
16
16
16
20
1
4
14
15
14
Higashi Kanto ExpresswayHigashi Kanto Expressway
Port of Tokyo Port of Tokyo Tokyo
DisneylandResort
Tokyo DisneylandResort
Haneda AirportHaneda Airport
Narita International Airport
Narita International Airport
Tokyo Tokyo Shinjuku Shinjuku Tachikawa Tachikawa
Oizumi IC
Oizumi IC Nerima
JCTNerimaJCT
MachidaMachida
HashimotoHashimoto
Sagami-hara ICSagami-hara IC
KamimizoKamimizo
Omiya Omiya KawagoeKawagoe
Yono IC Yono IC Kawagoe IC Kawagoe IC
Tsurugashima IC Tsurugashima IC
Kawashima IC Kawashima IC
Tohoku ExpresswayTohoku Expressway
Kawaguchi JCTKawaguchi JCT
Iwaki ICIwaki IC
Kukishiraoka ICKukishiraoka IC
Misato ICMisato IC
Nagareyama ICNagareyama IC
IchikawaIchikawaFunabashiFunabashi
MatsudoMatsudo
Ichikawa ICIchikawa IC
KitakashiwaKitakashiwa
Kashiwa ICKashiwa IC
ShinagawaShinagawa
Hodogaya ICHodogaya IC
KawasakiKawasaki
YokohamaYokohama
Ebina JCTEbina JCT
Atsugi IC
Atsugi IC
YokohamaMachida ICYokohamaMachida IC
Hachioji JCTHachioji JCT
Hachioji Hachioji
Hachioji ICHachioji IC
Port of Yokohama Port of Yokohama
Tokyo Bay Aqua-LineTokyo Bay Aqua-Line
Metropolitan Expressway Bayshore Route
Metropolitan Expressway Bayshore RouteSagamihara
-aikawa ICSagamihara-aikawa IC
Kanetsu
ExpresswayKanetsu
Expressway
SagamiharaSagamihara
LOGIPORT Sagamihara
T oky
o G
aikan
T oky
o G
aikan
Exp
ressw
ay
Exp
ressw
ay16
51
127
16
16
16
126
51
51
51
51
6
125
125
125
125
16
4
17
17
17
16 17
16
16
129
16
16
16
16
20
1
4
14
15
14
Higashi Kanto ExpresswayHigashi Kanto Expressway
Port of Tokyo Port of Tokyo Tokyo
DisneylandResort
Tokyo DisneylandResort
Haneda AirportHaneda Airport
Narita International Airport
Narita International Airport
Tokyo Tokyo Shinjuku Shinjuku Tachikawa Tachikawa
Oizumi IC
Oizumi IC Nerima
JCTNerimaJCT
MachidaMachida
HashimotoHashimoto
Sagami-hara ICSagami-hara IC
KamimizoKamimizo
Omiya Omiya KawagoeKawagoe
Yono IC Yono IC Kawagoe IC Kawagoe IC
Tsurugashima IC Tsurugashima IC
Kawashima IC Kawashima IC
Tohoku ExpresswayTohoku Expressway
Kawaguchi JCTKawaguchi JCT
Iwaki ICIwaki IC
Kukishiraoka ICKukishiraoka IC
Misato ICMisato IC
Nagareyama ICNagareyama IC
IchikawaIchikawaFunabashiFunabashi
MatsudoMatsudo
Ichikawa ICIchikawa IC
KitakashiwaKitakashiwa
Kashiwa ICKashiwa IC
ShinagawaShinagawa
Hodogaya ICHodogaya IC
KawasakiKawasaki
YokohamaYokohama
Ebina JCTEbina JCT
Atsugi IC
Atsugi IC
YokohamaMachida ICYokohamaMachida IC
Hachioji JCTHachioji JCT
Hachioji Hachioji
Hachioji ICHachioji IC
Port of Yokohama Port of Yokohama
Tokyo Bay Aqua-LineTokyo Bay Aqua-Line
Metropolitan Expressway Bayshore Route
Metropolitan Expressway Bayshore RouteSagamihara
-aikawa ICSagamihara-aikawa IC
Kanetsu
ExpresswayKanetsu
Expressway
SagamiharaSagamiharaLOGIPORT Hashimoto
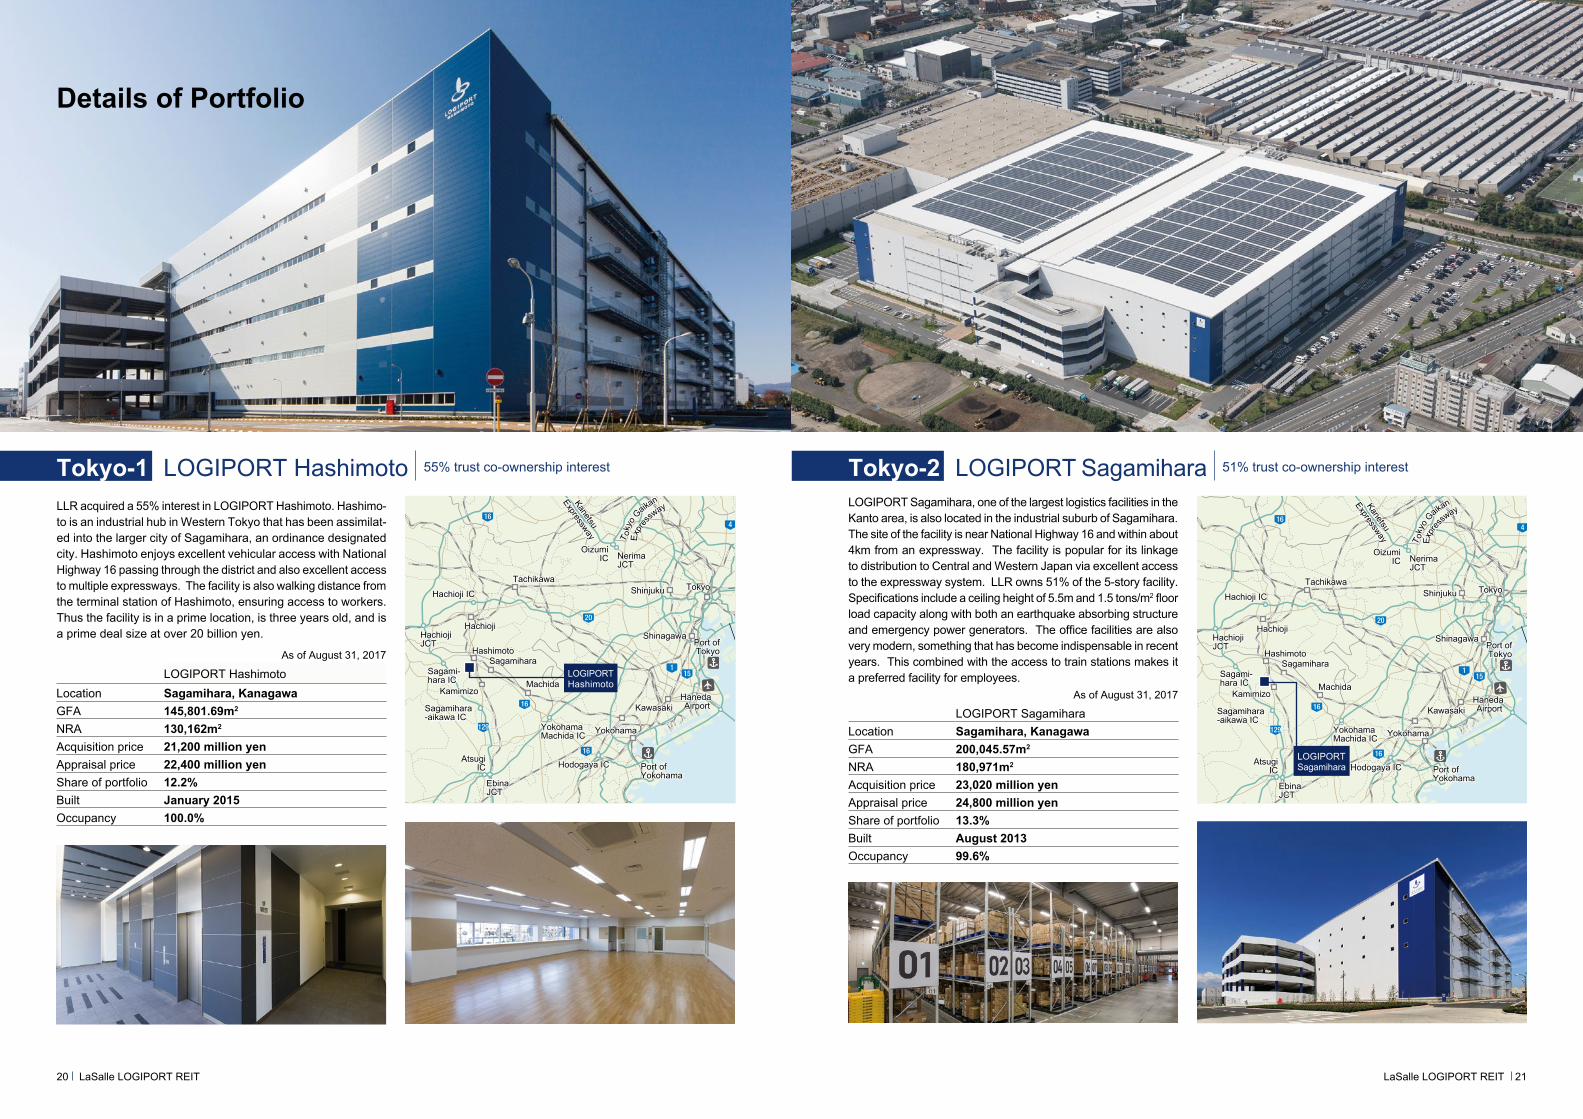
LLR acquired a 55% interest in LOGIPORT Hashimoto. Hashimo-to is an industrial hub in Western Tokyo that has been assimilat-ed into the larger city of Sagamihara, an ordinance designated city. Hashimoto enjoys excellent vehicular access with National Highway 16 passing through the district and also excellent access to multiple expressways. The facility is also walking distance from the terminal station of Hashimoto, ensuring access to workers. Thus the facility is in a prime location, is three years old, and is a prime deal size at over 20 billion yen.
LOGIPORT HashimotoLocation Sagamihara, KanagawaGFA 145,801.69m2 NRA 130,162m2 Acquisition price 21,200 million yenAppraisal price 22,400 million yenShare of portfolio 12.2%Built January 2015Occupancy 100.0%
As of August 31, 2017
LOGIPORT Sagamihara, one of the largest logistics facilities in the Kanto area, is also located in the industrial suburb of Sagamihara. The site of the facility is near National Highway 16 and within about 4km from an expressway. The facility is popular for its linkage to distribution to Central and Western Japan via excellent access to the expressway system. LLR owns 51% of the 5-story facility. Specifications include a ceiling height of 5.5m and 1.5 tons/m2 floor load capacity along with both an earthquake absorbing structure and emergency power generators. The office facilities are also very modern, something that has become indispensable in recent years. This combined with the access to train stations makes it a preferred facility for employees.
LOGIPORT SagamiharaLocation Sagamihara, KanagawaGFA 200,045.57m2
NRA 180,971m2
Acquisition price 23,020 million yenAppraisal price 24,800 million yenShare of portfolio 13.3%Built August 2013Occupancy 99.6%
As of August 31, 2017
LOGIPORT SagamiharaTokyo-2 51% trust co-ownership interest
20 21LaSalle LOGIPORT REIT LaSalle LOGIPORT REIT
Details of Portfolio
Building ABuilding B
LOGIPORT KitakashiwaTokyo-3 LOGIPORT Nagareyama (A) and (B)Tokyo-4 and Tokyo-5
T oky
o G
aikan
T oky
o G
aikan
Exp
ressw
ay
Exp
ressw
ay16
51
127
16
16
16
126
51
51
51
51
6
125
125
125
125
16
4
17
17
17
16 17
16
16
129
16
16
16
16
20
1
4
14
15
14
Higashi Kanto ExpresswayHigashi Kanto Expressway
Port of Tokyo Port of Tokyo Tokyo
DisneylandResort
Tokyo DisneylandResort
Haneda AirportHaneda Airport
Narita International Airport
Narita International Airport
Tokyo Tokyo Shinjuku Shinjuku Tachikawa Tachikawa
Oizumi IC
Oizumi IC Nerima
JCTNerimaJCT
MachidaMachida
HashimotoHashimoto
Sagami-hara ICSagami-hara IC
KamimizoKamimizo
Omiya Omiya KawagoeKawagoe
Yono IC Yono IC Kawagoe IC Kawagoe IC
Tsurugashima IC Tsurugashima IC
Kawashima IC Kawashima IC
Tohoku ExpresswayTohoku Expressway
Kawaguchi JCTKawaguchi JCT
Iwaki ICIwaki IC
Kukishiraoka ICKukishiraoka IC
Misato ICMisato IC
Nagareyama ICNagareyama IC
IchikawaIchikawaFunabashiFunabashi
MatsudoMatsudo
Ichikawa ICIchikawa IC
KitakashiwaKitakashiwa
Kashiwa ICKashiwa IC
ShinagawaShinagawa
Hodogaya ICHodogaya IC
KawasakiKawasaki
YokohamaYokohama
Ebina JCTEbina JCT
Atsugi IC
Atsugi IC
YokohamaMachida ICYokohamaMachida IC
Hachioji JCTHachioji JCT
Hachioji Hachioji
Hachioji ICHachioji IC
Port of Yokohama Port of Yokohama
Tokyo Bay Aqua-LineTokyo Bay Aqua-Line
Metropolitan Expressway Bayshore Route
Metropolitan Expressway Bayshore RouteSagamihara
-aikawa ICSagamihara-aikawa IC
Kanetsu
ExpresswayKanetsu
Expressway
SagamiharaSagamihara
LOGIPORT Nagareyama(A) and (B)
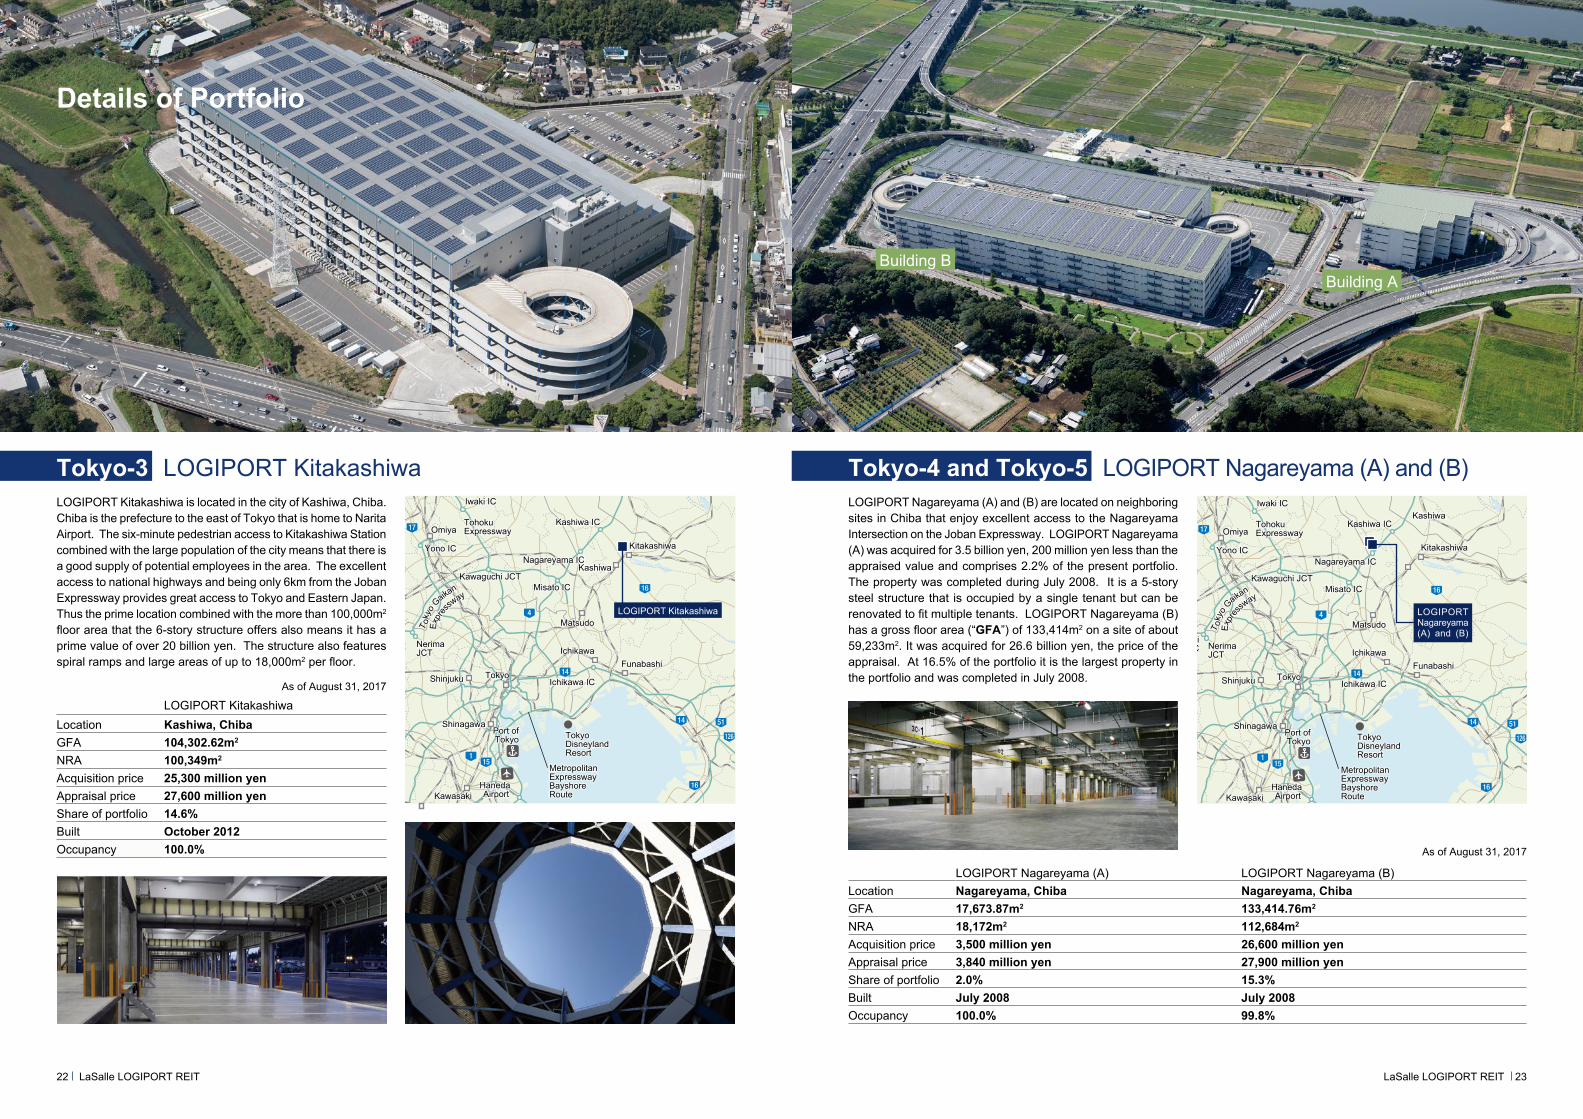
KashiwaLOGIPORT Nagareyama (A) and (B) are located on neighboring sites in Chiba that enjoy excellent access to the Nagareyama Intersection on the Joban Expressway. LOGIPORT Nagareyama (A) was acquired for 3.5 billion yen, 200 million yen less than the appraised value and comprises 2.2% of the present portfolio. The property was completed during July 2008. It is a 5-story steel structure that is occupied by a single tenant but can be renovated to fit multiple tenants. LOGIPORT Nagareyama (B) has a gross floor area (“GFA”) of 133,414m2 on a site of about 59,233m2. It was acquired for 26.6 billion yen, the price of the appraisal. At 16.5% of the portfolio it is the largest property in the portfolio and was completed in July 2008.
LOGIPORT Nagareyama (A) LOGIPORT Nagareyama (B) Location Nagareyama, Chiba Nagareyama, ChibaGFA 17,673.87m2 133,414.76m2
NRA 18,172m2 112,684m2
Acquisition price 3,500 million yen 26,600 million yenAppraisal price 3,840 million yen 27,900 million yenShare of portfolio 2.0% 15.3%Built July 2008 July 2008Occupancy 100.0% 99.8%
LOGIPORT Kitakashiwa is located in the city of Kashiwa, Chiba. Chiba is the prefecture to the east of Tokyo that is home to Narita Airport. The six-minute pedestrian access to Kitakashiwa Station combined with the large population of the city means that there is a good supply of potential employees in the area. The excellent access to national highways and being only 6km from the Joban Expressway provides great access to Tokyo and Eastern Japan. Thus the prime location combined with the more than 100,000m2 floor area that the 6-story structure offers also means it has a prime value of over 20 billion yen. The structure also features spiral ramps and large areas of up to 18,000m2 per floor.
LOGIPORT KitakashiwaLocation Kashiwa, ChibaGFA 104,302.62m2 NRA 100,349m2
Acquisition price 25,300 million yenAppraisal price 27,600 million yenShare of portfolio 14.6% Built October 2012Occupancy 100.0%
As of August 31, 2017
As of August 31, 2017
22 23LaSalle LOGIPORT REIT LaSalle LOGIPORT REIT
T oky
o G
aikan
T oky
o G
aikan
Exp
ressw
ay
Exp
ressw
ay16
51
127
16
16
16
126
51
51
51
51
6
125
125
125
125
16
4
17
17
17
16 17
16
16
129
16
16
16
16
20
1
4
14
15
14
Higashi Kanto ExpresswayHigashi Kanto Expressway
Port of Tokyo Port of Tokyo Tokyo
DisneylandResort
Tokyo DisneylandResort
Haneda AirportHaneda Airport
Narita International Airport
Narita International Airport
Tokyo Tokyo Shinjuku Shinjuku Tachikawa Tachikawa
Oizumi IC
Oizumi IC Nerima
JCTNerimaJCT
MachidaMachida
HashimotoHashimoto
Sagami-hara ICSagami-hara IC
KamimizoKamimizo
Omiya Omiya KawagoeKawagoe
Yono IC Yono IC Kawagoe IC Kawagoe IC
Tsurugashima IC Tsurugashima IC
Kawashima IC Kawashima IC
Tohoku ExpresswayTohoku Expressway
Kawaguchi JCTKawaguchi JCT
Iwaki ICIwaki IC
Kukishiraoka ICKukishiraoka IC
Misato ICMisato IC
Nagareyama ICNagareyama IC
IchikawaIchikawaFunabashiFunabashi
MatsudoMatsudo
Ichikawa ICIchikawa IC
KitakashiwaKitakashiwa
Kashiwa ICKashiwa IC
ShinagawaShinagawa
Hodogaya ICHodogaya IC
KawasakiKawasaki
YokohamaYokohama
Ebina JCTEbina JCT
Atsugi IC
Atsugi IC
YokohamaMachida ICYokohamaMachida IC
Hachioji JCTHachioji JCT
Hachioji Hachioji
Hachioji ICHachioji IC
Port of Yokohama Port of Yokohama
Tokyo Bay Aqua-LineTokyo Bay Aqua-Line
Metropolitan Expressway Bayshore Route
Metropolitan Expressway Bayshore RouteSagamihara
-aikawa ICSagamihara-aikawa IC
Kanetsu
ExpresswayKanetsu
Expressway
SagamiharaSagamihara
LOGIPORT Kitakashiwa
Kashiwa
Building C
Building A
Building B
LOGIPORT Higashi Ogishima (A), (B), and (C)Tokyo-6, Tokyo-7 and Tokyo-8 LOGIPORT KawagoeTokyo-9
T oky
o G
aikan
T oky
o G
aikan
Exp
ressw
ay
Exp
ressw
ay16
51
127
16
16
16
126
51
51
51
51
6
125
125
125
125
16
4
17
17
17
16 17
16
16
129
16
16
16
16
20
1
4
14
15
14
Higashi Kanto ExpresswayHigashi Kanto Expressway
Port of Tokyo Port of Tokyo Tokyo
DisneylandResort
Tokyo DisneylandResort
Haneda AirportHaneda Airport
Narita International Airport
Narita International Airport
Tokyo Tokyo Shinjuku Shinjuku Tachikawa Tachikawa
Oizumi IC
Oizumi IC Nerima
JCTNerimaJCT
MachidaMachida
HashimotoHashimoto
Sagami-hara ICSagami-hara IC
KamimizoKamimizo
Omiya Omiya KawagoeKawagoe
Yono IC Yono IC Kawagoe IC Kawagoe IC
Tsurugashima IC Tsurugashima IC
Kawashima IC Kawashima IC
Tohoku ExpresswayTohoku Expressway
Kawaguchi JCTKawaguchi JCT
Iwaki ICIwaki IC
Kukishiraoka ICKukishiraoka IC
Misato ICMisato IC
Nagareyama ICNagareyama IC
IchikawaIchikawaFunabashiFunabashi
MatsudoMatsudo
Ichikawa ICIchikawa IC
KitakashiwaKitakashiwa
Kashiwa ICKashiwa IC
ShinagawaShinagawa
Hodogaya ICHodogaya IC
KawasakiKawasaki
YokohamaYokohama
Ebina JCTEbina JCT
Atsugi IC
Atsugi IC
YokohamaMachida ICYokohamaMachida IC
Hachioji JCTHachioji JCT
Hachioji Hachioji
Hachioji ICHachioji IC
Port of Yokohama Port of Yokohama
Tokyo Bay Aqua-LineTokyo Bay Aqua-Line
Metropolitan Expressway Bayshore Route
Metropolitan Expressway Bayshore Route
�Chuo Expressway�Chuo Expressway
TomeiExpressway
TomeiExpressway
Shin-YokohamaShin-Yokohama
Daisan-Keihin Road
Daisan-Keihin Road
LOGIPORT Kawagoe
T oky
o G
aikan
T oky
o G
aikan
Exp
ressw
ay
Exp
ressw
ay16
51
127
16
16
16
126
51
51
51
51
6
125
125
125
125
16
4
17
17
17
16 17
16
16
129
16
16
16
16
20
1
4
14
15
14
Higashi Kanto ExpresswayHigashi Kanto Expressway
Port of Tokyo Port of Tokyo Tokyo
DisneylandResort
Tokyo DisneylandResort
Haneda AirportHaneda Airport
Narita International Airport
Narita International Airport
Tokyo Tokyo Shinjuku Shinjuku Tachikawa Tachikawa
Oizumi JCTOizumi JCT
MachidaMachidaSagami-hara ICSagami-hara IC
KamimizoKamimizo
Omiya Omiya Tohoku ExpresswayTohoku Expressway
Kawaguchi ICKawaguchi IC
Misato ICMisato IC
Nagareyama ICNagareyama ICKashiwaKashiwa
IchikawaIchikawa
MatsudoMatsudo
Ichikawa ICIchikawa IC
KitakashiwaKitakashiwa
Kashiwa ICKashiwa IC
ShinagawaShinagawa
Hodogaya ICHodogaya IC
KawasakiKawasaki
YokohamaYokohama
Ebina JCTEbina JCT
Atsugi IC
Atsugi IC
YokohamaMachida ICYokohamaMachida IC
Hachioji JCTHachioji JCT
Hachioji Hachioji
Hachioji ICHachioji IC
Port of Yokohama Port of Yokohama
Tokyo Bay Aqua-LineTokyo Bay Aqua-Line
Metropolitan Expressway Bayshore Route
Metropolitan Expressway Bayshore RouteSagamihara
-aikawa ICSagamihara-aikawa IC
�Chuo Expressway�Chuo Expressway
TomeiExpressway
TomeiExpressway
Shin-YokohamaShin-Yokohama
Daisan-Keihin Road
Daisan-Keihin Road
LOGIPORTK Higashi Ogishima (A), (B) and (C)
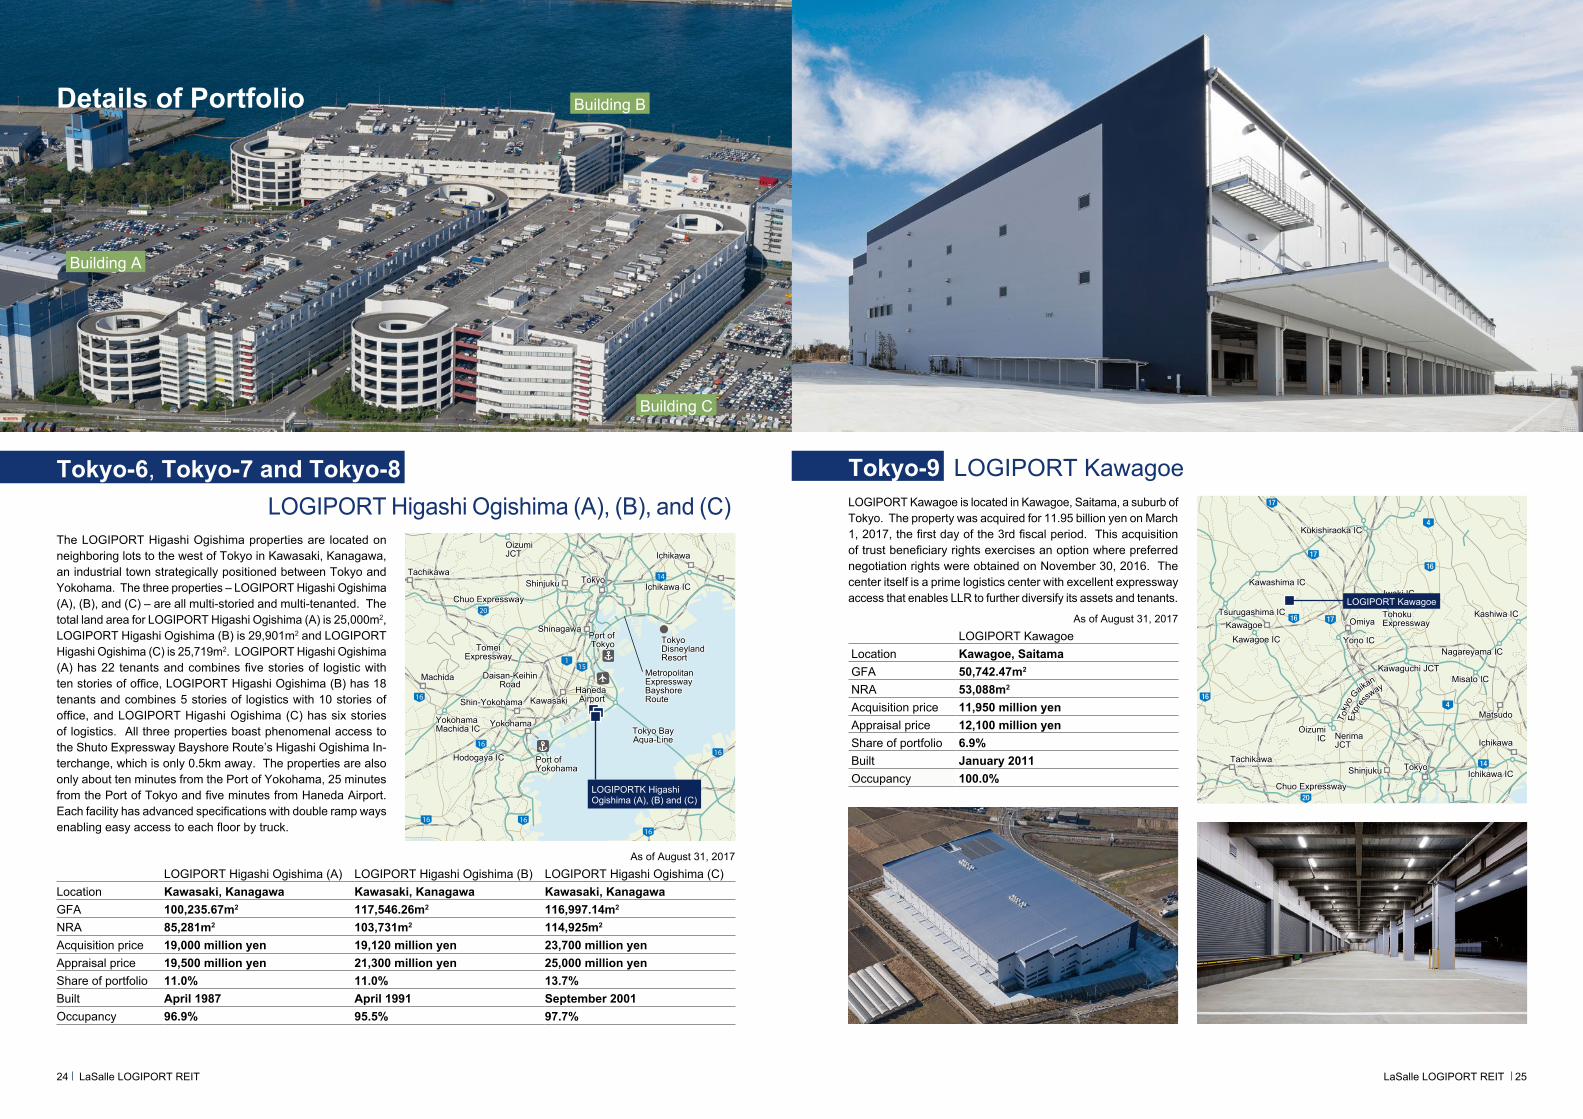
LOGIPORT Kawagoe is located in Kawagoe, Saitama, a suburb of Tokyo. The property was acquired for 11.95 billion yen on March 1, 2017, the first day of the 3rd fiscal period. This acquisition of trust beneficiary rights exercises an option where preferred negotiation rights were obtained on November 30, 2016. The center itself is a prime logistics center with excellent expressway access that enables LLR to further diversify its assets and tenants.
The LOGIPORT Higashi Ogishima properties are located on neighboring lots to the west of Tokyo in Kawasaki, Kanagawa, an industrial town strategically positioned between Tokyo and Yokohama. The three properties – LOGIPORT Higashi Ogishima (A), (B), and (C) – are all multi-storied and multi-tenanted. The total land area for LOGIPORT Higashi Ogishima (A) is 25,000m2, LOGIPORT Higashi Ogishima (B) is 29,901m2 and LOGIPORT Higashi Ogishima (C) is 25,719m2. LOGIPORT Higashi Ogishima (A) has 22 tenants and combines five stories of logistic with ten stories of office, LOGIPORT Higashi Ogishima (B) has 18 tenants and combines 5 stories of logistics with 10 stories of office, and LOGIPORT Higashi Ogishima (C) has six stories of logistics. All three properties boast phenomenal access to the Shuto Expressway Bayshore Route’s Higashi Ogishima In-terchange, which is only 0.5km away. The properties are also only about ten minutes from the Port of Yokohama, 25 minutes from the Port of Tokyo and five minutes from Haneda Airport. Each facility has advanced specifications with double ramp ways enabling easy access to each floor by truck.
LOGIPORT Higashi Ogishima (A) LOGIPORT Higashi Ogishima (B) LOGIPORT Higashi Ogishima (C)Location Kawasaki, Kanagawa Kawasaki, Kanagawa Kawasaki, KanagawaGFA 100,235.67m2 117,546.26m2 116,997.14m2 NRA 85,281m2 103,731m2 114,925m2 Acquisition price 19,000 million yen 19,120 million yen 23,700 million yenAppraisal price 19,500 million yen 21,300 million yen 25,000 million yenShare of portfolio 11.0% 11.0% 13.7% Built April 1987 April 1991 September 2001Occupancy 96.9% 95.5% 97.7%
As of August 31, 2017
LOGIPORT KawagoeLocation Kawagoe, SaitamaGFA 50,742.47m2 NRA 53,088m2 Acquisition price 11,950 million yenAppraisal price 12,100 million yenShare of portfolio 6.9%Built January 2011Occupancy 100.0%
As of August 31, 2017
24 25LaSalle LOGIPORT REIT LaSalle LOGIPORT REIT
Details of Portfolio
AUM by Product Type AUM by Country AUM by Sector
Market capApprox. $4.6 bn (listed on the NYSE)
280Officesin in
80Countries
77,000Employees
LaSalle Inc. Asia AUMAs of June 30, 2017
As of December 31, 2016
As of June 30, 2017
As of December 31, 2016
LaSalle Inc. Global AUM
AUM by Property SectorAUM by Region and Securities Business
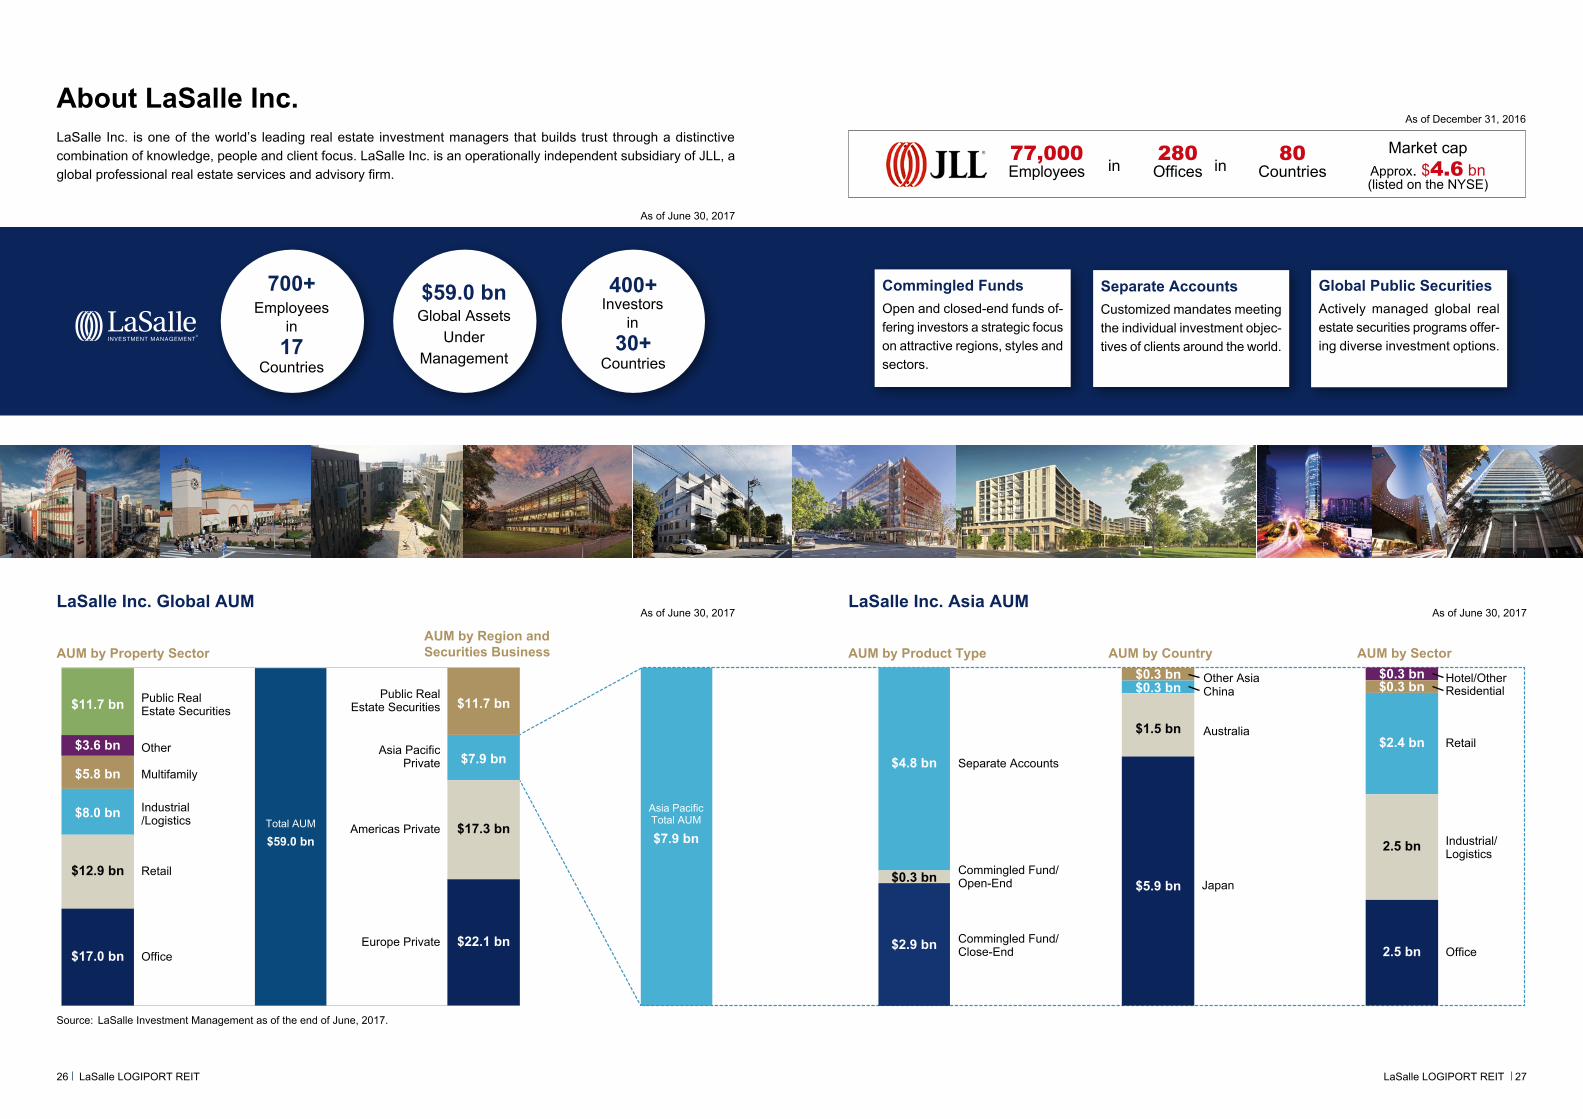
Source: LaSalle Investment Management as of the end of June, 2017.
As of June 30, 2017
Public Real Estate Securities
Other
Multifamily
Industrial/Logistics
Retail
Office
Total AUM
$59.0 bn
$11.7 bn
$7.9 bn
$17.3 bn
$22.1 bn
Public Real Estate Securities
Asia Pacific Private
Americas Private
Europe Private
Asia PacificTotal AUM
$7.9 bn
$0.3 bn
$2.9 bn
$4.8 bn Separate Accounts
Commingled Fund/Open-End
Commingled Fund/Close-End
$0.3 bn Other Asia$0.3 bn China
Australia
Japan
Hotel/OtherResidential
Retail
Industrial/Logistics
Office
$11.7 bn
$3.6 bn
$5.8 bn
$8.0 bn
$12.9 bn
$17.0 bn
$1.5 bn
$5.9 bn
$0.3 bn$0.3 bn
$2.4 bn
2.5 bn
2.5 bn
Separate AccountsCustomized mandates meeting the individual investment objec-tives of clients around the world.
Global Public SecuritiesActively managed global real estate securities programs offer-ing diverse investment options.
700+Employees
in17
Countries
400+Investors
in30+
Countries
$59.0 bnGlobal Assets
UnderManagement
Commingled FundsOpen and closed-end funds of-fering investors a strategic focus on attractive regions, styles and sectors.
LaSalle Inc. is one of the world’s leading real estate investment managers that builds trust through a distinctive combination of knowledge, people and client focus. LaSalle Inc. is an operationally independent subsidiary of JLL, a global professional real estate services and advisory firm.
About LaSalle Inc.
26 27LaSalle LOGIPORT REIT LaSalle LOGIPORT REIT
Proven Logistics Developer and Investor since 2003 (selective)
Wakasu 25,052m2
Jul. 2003
Ichikawa Shiohama66,297m2
Sep. 2004
LP Osaka 135,822m2
Feb. 2005
LP Kashiwa 148,453m2
Sep. 2004
LP Kawasaki160,218m2
Mar. 2005
Hamura42,870m2
Mar. 2007
Sodegaura 50,963m2
Aug. 2006
LP Hokkaido 19,041m2
Aug. 2008
Daiei Kawasaki69,064m2
Oct. 2007
Hiroshima 9,795m2
Dec. 2007
LP Island Hakata City 48,852m2
Mar. 2008
Development
Investment
Logistics development fund vintages
2003
Logistics facilities investment begins in Japan
2004
LaSalle Japan Logistics Fund I established
2007
LaSalle Japan Logistics Fund II established
2017
LaSalle Japan Logistics Fund IV established
Sep. 2004
First inland multi-tenanted logistics property
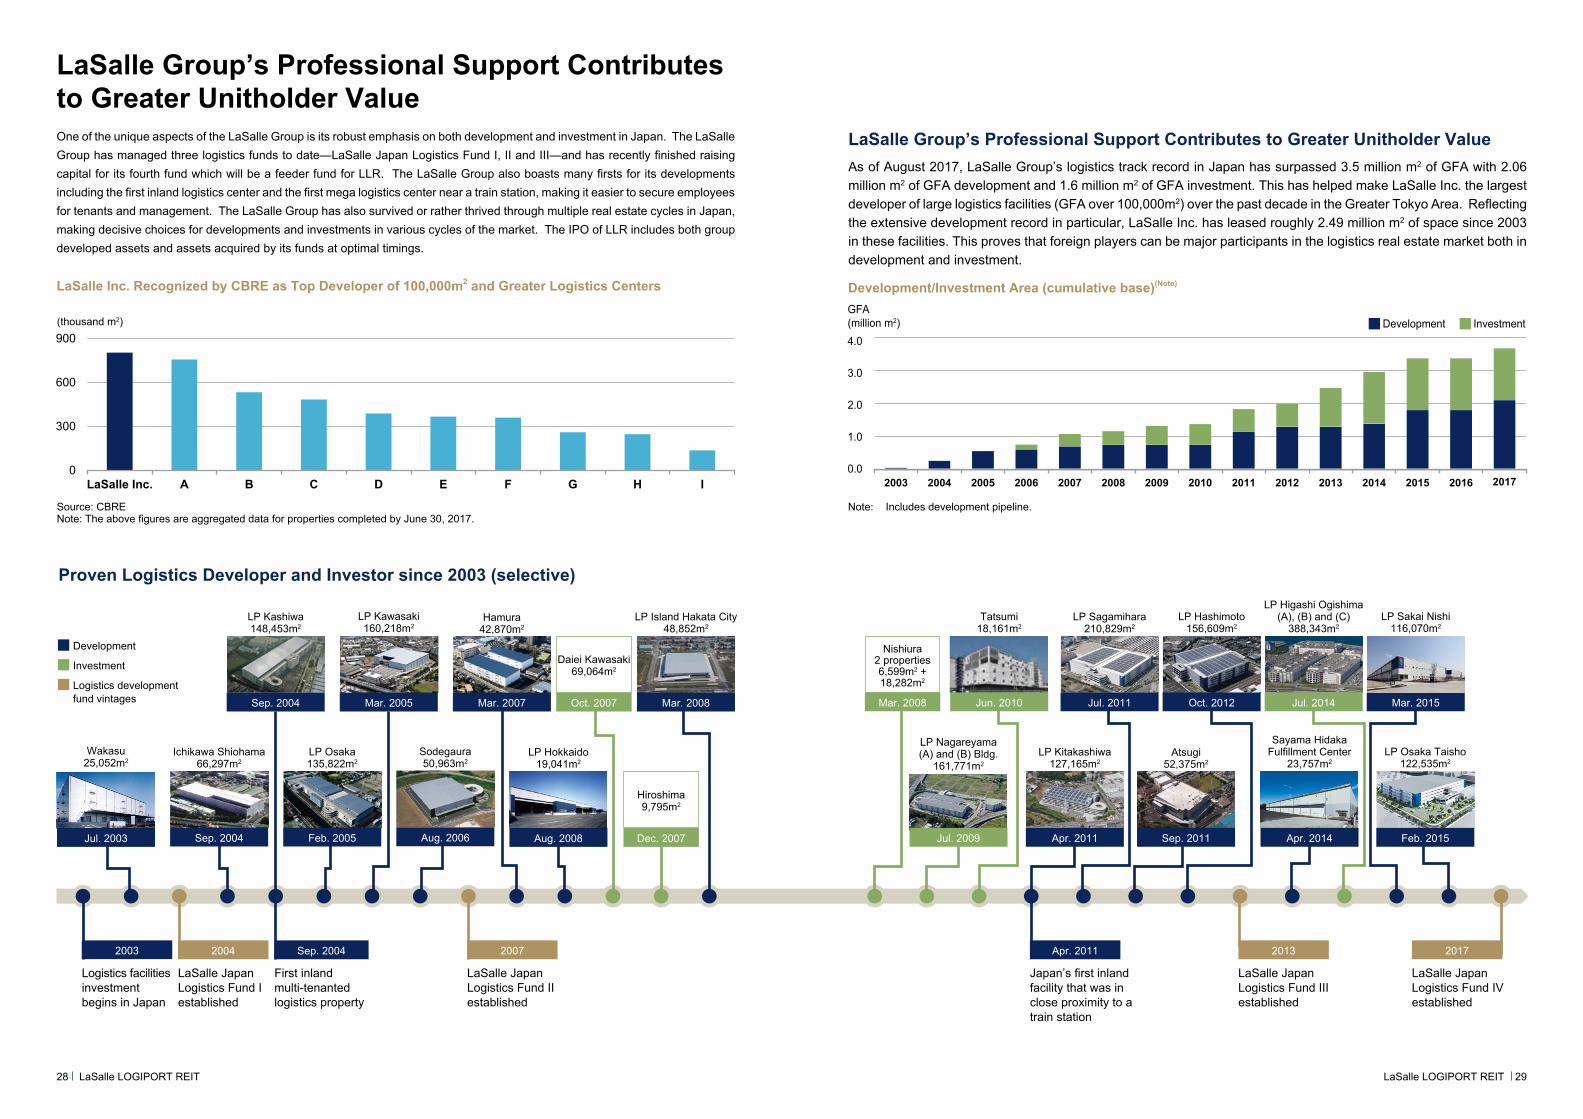
LaSalle Group’s Professional Support Contributes to Greater Unitholder ValueAs of August 2017, LaSalle Group’s logistics track record in Japan has surpassed 3.5 million m2 of GFA with 2.06 million m2 of GFA development and 1.6 million m2 of GFA investment. This has helped make LaSalle Inc. the largest developer of large logistics facilities (GFA over 100,000m2) over the past decade in the Greater Tokyo Area. Reflecting the extensive development record in particular, LaSalle Inc. has leased roughly 2.49 million m2 of space since 2003 in these facilities. This proves that foreign players can be major participants in the logistics real estate market both in development and investment.
0.0
1.0
2.0
3.0
4.0
GFA(million m2) InvestmentDevelopment
2003 2004 2005 2006 2007 2008 2009 2010 2011 2012 2013 2014 2015 2016 2017
Development/Investment Area (cumulative base)(Note)
Note: Includes development pipeline.
LaSalle Group’s Professional Support Contributes to Greater Unitholder ValueOne of the unique aspects of the LaSalle Group is its robust emphasis on both development and investment in Japan. The LaSalle Group has managed three logistics funds to date—LaSalle Japan Logistics Fund I, II and III—and has recently finished raising capital for its fourth fund which will be a feeder fund for LLR. The LaSalle Group also boasts many firsts for its developments including the first inland logistics center and the first mega logistics center near a train station, making it easier to secure employees for tenants and management. The LaSalle Group has also survived or rather thrived through multiple real estate cycles in Japan, making decisive choices for developments and investments in various cycles of the market. The IPO of LLR includes both group developed assets and assets acquired by its funds at optimal timings.
LaSalle Inc. Recognized by CBRE as Top Developer of 100,000m2 and Greater Logistics Centers
(thousand m2)
0
300
600
900
LaSalle Inc. A B C D E F G H I
Source: CBRE Note: The above figures are aggregated data for properties completed by June 30, 2017.
28 29LaSalle LOGIPORT REIT LaSalle LOGIPORT REIT
LP Nagareyama(A) and (B) Bldg.
161,771m2
Jul. 2009
LP Kitakashiwa 127,165m2
Apr. 2011
Atsugi52,375m2
Sep. 2011
Sayama Hidaka Fulfillment Center
23,757m2
Apr. 2014
LP Osaka Taisho122,535m2
Feb. 2015
2013
LaSalle Japan Logistics Fund III established
Apr. 2011
Japan’s first inland facility that was in close proximity to a train station
Tatsumi 18,161m2
Jun. 2010
Nishiura2 properties6,599m2 + 18,282m2
Mar. 2008
LP Hashimoto 156,609m2
Oct. 2012
LP Sagamihara210,829m2
Jul. 2011
LP Higashi Ogishima(A), (B) and (C)
388,343m2
Jul. 2014 Mar. 2015
LP Sakai Nishi116,070m2
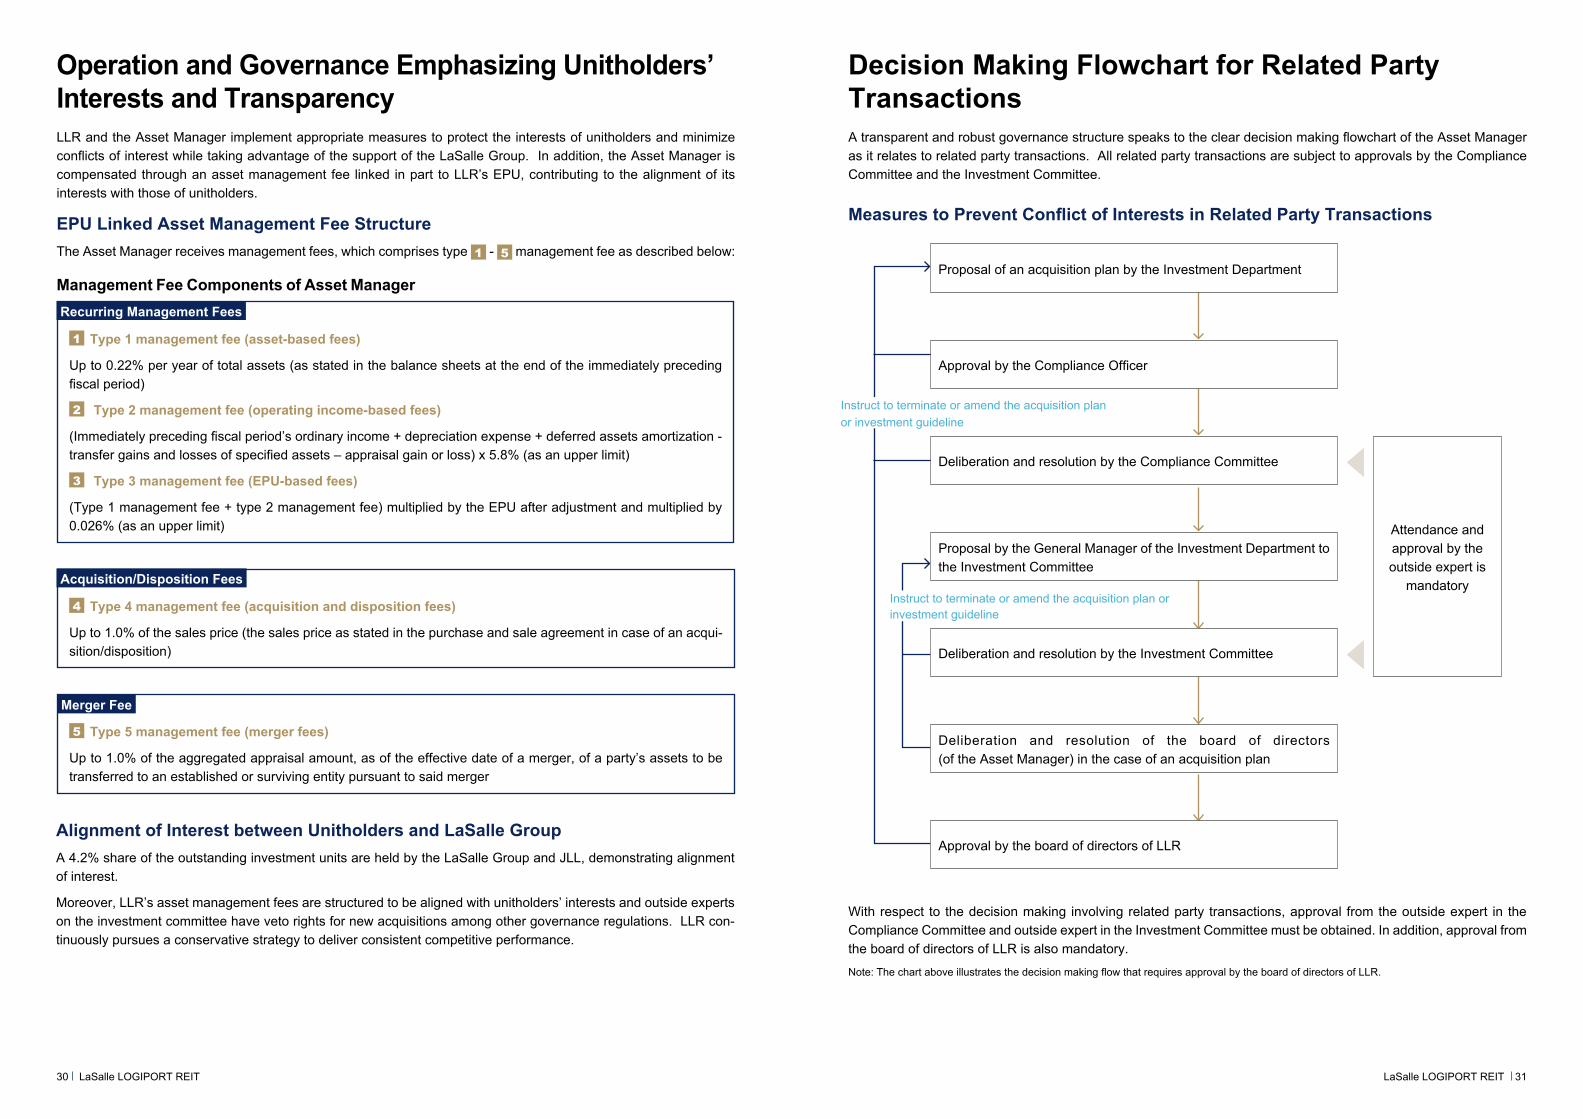
Decision Making Flowchart for Related Party TransactionsA transparent and robust governance structure speaks to the clear decision making flowchart of the Asset Manager as it relates to related party transactions. All related party transactions are subject to approvals by the Compliance Committee and the Investment Committee.
Measures to Prevent Conflict of Interests in Related Party Transactions
With respect to the decision making involving related party transactions, approval from the outside expert in the Compliance Committee and outside expert in the Investment Committee must be obtained. In addition, approval from the board of directors of LLR is also mandatory.
Note: The chart above illustrates the decision making flow that requires approval by the board of directors of LLR.
Attendance and approval by the outside expert is
mandatory
Instruct to terminate or amend the acquisition plan or investment guideline
Instruct to terminate or amend the acquisition plan or investment guideline
Proposal of an acquisition plan by the Investment Department
Approval by the Compliance Officer
Deliberation and resolution by the Compliance Committee
Proposal by the General Manager of the Investment Department to the Investment Committee
Deliberation and resolution by the Investment Committee
Deliberation and resolution of the board of directors (of the Asset Manager) in the case of an acquisition plan
Approval by the board of directors of LLR
Operation and Governance Emphasizing Unitholders’ Interests and TransparencyLLR and the Asset Manager implement appropriate measures to protect the interests of unitholders and minimize conflicts of interest while taking advantage of the support of the LaSalle Group. In addition, the Asset Manager is compensated through an asset management fee linked in part to LLR’s EPU, contributing to the alignment of its interests with those of unitholders.
EPU Linked Asset Management Fee StructureThe Asset Manager receives management fees, which comprises type 1 - 5 management fee as described below:
Management Fee Components of Asset Manager
Alignment of Interest between Unitholders and LaSalle GroupA 4.2% share of the outstanding investment units are held by the LaSalle Group and JLL, demonstrating alignment of interest.
Moreover, LLR’s asset management fees are structured to be aligned with unitholders’ interests and outside experts on the investment committee have veto rights for new acquisitions among other governance regulations. LLR con-tinuously pursues a conservative strategy to deliver consistent competitive performance.
4 Type 4 management fee (acquisition and disposition fees)
Up to 1.0% of the sales price (the sales price as stated in the purchase and sale agreement in case of an acqui-sition/disposition)
Acquisition/Disposition Fees
5 Type 5 management fee (merger fees)
Up to 1.0% of the aggregated appraisal amount, as of the effective date of a merger, of a party’s assets to be transferred to an established or surviving entity pursuant to said merger
Merger Fee
1 Type 1 management fee (asset-based fees)
Up to 0.22% per year of total assets (as stated in the balance sheets at the end of the immediately preceding fiscal period)
2 Type 2 management fee (operating income-based fees)
(Immediately preceding fiscal period’s ordinary income + depreciation expense + deferred assets amortization - transfer gains and losses of specified assets – appraisal gain or loss) x 5.8% (as an upper limit)
3 Type 3 management fee (EPU-based fees)
(Type 1 management fee + type 2 management fee) multiplied by the EPU after adjustment and multiplied by 0.026% (as an upper limit)
Recurring Management Fees
30 31LaSalle LOGIPORT REIT LaSalle LOGIPORT REIT
Risk Factors• Decreases in tenant leaseholder deposits and/or security deposits may increase LLR’s funding costs.• LLR’s lack of control over operating costs may adversely affect its business.• LLR may lose rental revenues in the event of lease terminations, decreased lease renewals, or the default of a tenant
as a result of financial difficulty or insolvency, and is exposed to the risk of careless or imprudent management of properties by tenants.
• Master lease agreements expose LLR to certain risks.• The cost of complying with regulations applicable to LLR’s properties could adversely affect the results of its operations.• LLR relies on expert appraisals and engineering, environmental and seismic reports, which are subject to significant
uncertainties.• LLR relies on industry and market data that are subject to significant uncertainties.• LLR’s buildings may violate earthquake resistance or other building codes, and any such buildings may collapse in even
minor earthquakes or may be required to be strengthened or demolished by LLR at significant expense.• The environmental assessments of properties made prior to ownership may not uncover all environmental liabilities,
and Japanese laws subject property owners to strict environmental liabilities.• LLR may incur additional costs due to preferential purchase rights, rights of first refusal or other similar rights held by
lessees or tenants.• Entering into forward commitment contracts or contracts to purchase properties under development may expose LLR
to contractual penalties and market risks.• LLR may be exposed to regulatory and financial risks related to climate change.• LLR’s success depends on the performance of service providers to which LLR is required to assign various key functions.• LLR’s performance depends on the efforts of key personnel of the Asset Manager.• Unitholders have limited control over changes in LLR’s investment policies.• J-REITs and their asset managers are subject to tight supervision by the regulatory authorities.• LLR’s failure to satisfy a complex series of requirements pursuant to Japanese tax regulations would disqualify itself
from certain taxation benefits and significantly reduce cash distributions to its unitholders.• If the Japanese tax authorities disagree with the interpretations of the Japanese tax laws and regulations LLR used for
prior periods, LLR may be forced to pay additional taxes for those periods.• LLR may not be able to benefit from reductions in certain real estate taxes enjoyed by qualified J-REITs.• Changes in Japanese tax laws may significantly increase the LLR’s tax burden.• LLR expects to be treated as a “passive foreign investment company” for U.S. federal income tax purposes.• Unitholders may be subject to U.S. Foreign Account Tax Compliance Act (“FATCA”) withholding tax after 2018.
Legal and Regulatory Risks• LLR’s ownership rights in some properties may be declared invalid or limited.• LLR may lose its rights in a property LLR intended to acquire if the purchase of the property is characterized as a
secured financing.• LLR’s leasehold or subleasehold rights may be terminated or may not be asserted against a third party in some cases.• Some of LLR’s properties may be held in the form of a property or trust co-ownership interest, and LLR’s rights relating
to such properties may be affected by the intentions of other co-owners.• LLR may hold interests in some properties through preferred shares of Japanese special purpose companies (tokutei
mokuteki kaisha) in the future, and illiquidity in the market for such shares may limit LLR’s ability to sell its interest, and the rights relating to the properties held by such special purposes companies may be limited.
• LLR may hold interests in some properties through Japanese anonymous association (tokumei kumiai) agreements, and LLR’s rights relating to such properties may be limited.
• LLR owns all of its properties through trust beneficiary interests and may suffer losses as a trust beneficiary.• There are important differences regarding the rights of unitholders in a J-REIT compared to those of shareholders in
a corporation.• The Alternative Investment Fund Managers Directive (“AIFMD”) may negatively affect LLR’s ability to market its units
within the European Economic Area (“EEA”) and increase compliance costs associated with the marketing of LLR’s units in the EEA.
• LLR’s units may be deemed to constitute “plan assets” for Employee Retirement Income Security Act (“ERISA”) pur-poses, which may lead to the rescission of certain transactions, tax or fiduciary liability and it being held in violation of ERISA requirements.
An investment in LLR’s units includes significant risks. The principal risks include the following.
Property and Business Risks• LLR has a limited operating history.• The Asset Manager has limited experience in operating a J-REIT.• LLR’s financial forecasts and other targets are necessarily speculative and subject to uncertainties.• Any adverse conditions in the Japanese economy could adversely affect LLR.• LLR’s strategy of investing in logistics facilities may entail risks uncommon to other J-REITs that invest in a broader
range of real estate or real estate-related assets.• LLR may not be able to acquire properties to execute its growth and investment strategy in a manner that is accretive
to earnings, and the scope of the pipeline support provided by the Sponsor is limited to the provision of information at the Sponsor’s discretion.
• Illiquidity in the real estate market may limit LLR’s ability to grow or adjust its portfolio.• The past experience of the LaSalle Group in the Japanese real estate market is not an indicator or guarantee of LLR’s
future results.• LLR’s reliance on the Sponsor and other LaSalle Group companies could have a material adverse effect on its business.• There are potential conflicts of interest between LLR and certain LaSalle Group companies, including the Asset Manager,
Sponsor Funds and other JLL group companies.• LLR faces significant competition in seeking tenants and it may be difficult to find replacement tenants.• LLR’s properties may cater to a single tenant, making it difficult to find replacement tenants.• Increases in prevailing market interest rates, including as a result of the Bank of Japan’s additional monetary easing,
could increase LLR’s interest expenses and may result in a decline in the market price of its units.• Seven of the eight properties in LLR’s portfolio each comprise over 10.0% by acquisition price, which could have an
adverse effect on the business, financial condition and results of operation.• LLR may suffer large losses if any of its properties incurs damage from a natural or man-made disaster or in the event
of an accident or disaster stemming from faulty installation or age-related deterioration. - Damage to any one or more of the properties in LLR’s portfolio, due to natural disaster, such as a flood, earthquake, or tsunami, or due to a man-made disaster, such as a fire or accident, could adversely affect LLR’s business, and financial conditions, and result in a decline in operating results. For example, Japan is earthquake-prone and has historically experienced numerous large earthquakes that have resulted in extensive property damage, such as the Great East Japan Earthquake in 2011, which resulted in a tsunami and leakage of radioactive material at the Fukushima nuclear power plants. Furthermore, tenants or the infrastructure and access to LLR properties may be adversely affected by any natural disaster, causing tenants to leave properties or seek lower rents.
- In addition, LLR may be required to compensate its tenants or third parties in the event of an accident or disaster at any of its properties stemming from any faulty installation or age-related deterioration, such as an elevator accident or water leakage, that results in injury, death or other damage to tenants or third parties.
- To the extent reasonably available, LLR intends to carry casualty insurance covering all of its properties for many types of casualty losses with policy specification and insured limits that LLR believes are adequate and appropriate under the current circumstances. In particular, LLR will consider obtaining earthquake insurance coverage for those properties with a PML due to an earthquake, exceeding 15%, which currently does not apply to any of the properties within the existing portfolio of assets under management.
• Any property defect may adversely affect LLR’s financial condition and results of operation.• LLR’s portfolio contains certain properties located on reclaimed land, which is subject to unique risks, including land
liquefaction. • The properties in LLR’s portfolio are concentrated in the Tokyo area, and it may have additional property concentration
in the Osaka area in the future.• Any inability to obtain financing for future acquisitions could adversely affect the growth of LLR’s portfolio.• Liquidity and other limitations on LLR’s activities under debt financing arrangements may adversely affect the business,
financial condition and results of operation.• LLR’s policy to make distributions to unitholders in excess of retained earnings is not commonly employed by other
J-REITs and is thus still subject to uncertainties.• A high LTV ratio may increase exposure to changes in interest rates and have a material adverse effect on results of
operations.• LLR may suffer impairment losses relating to its properties.
32 33LaSalle LOGIPORT REIT LaSalle LOGIPORT REIT
34 LaSalle LOGIPORT REIT
Financial Section
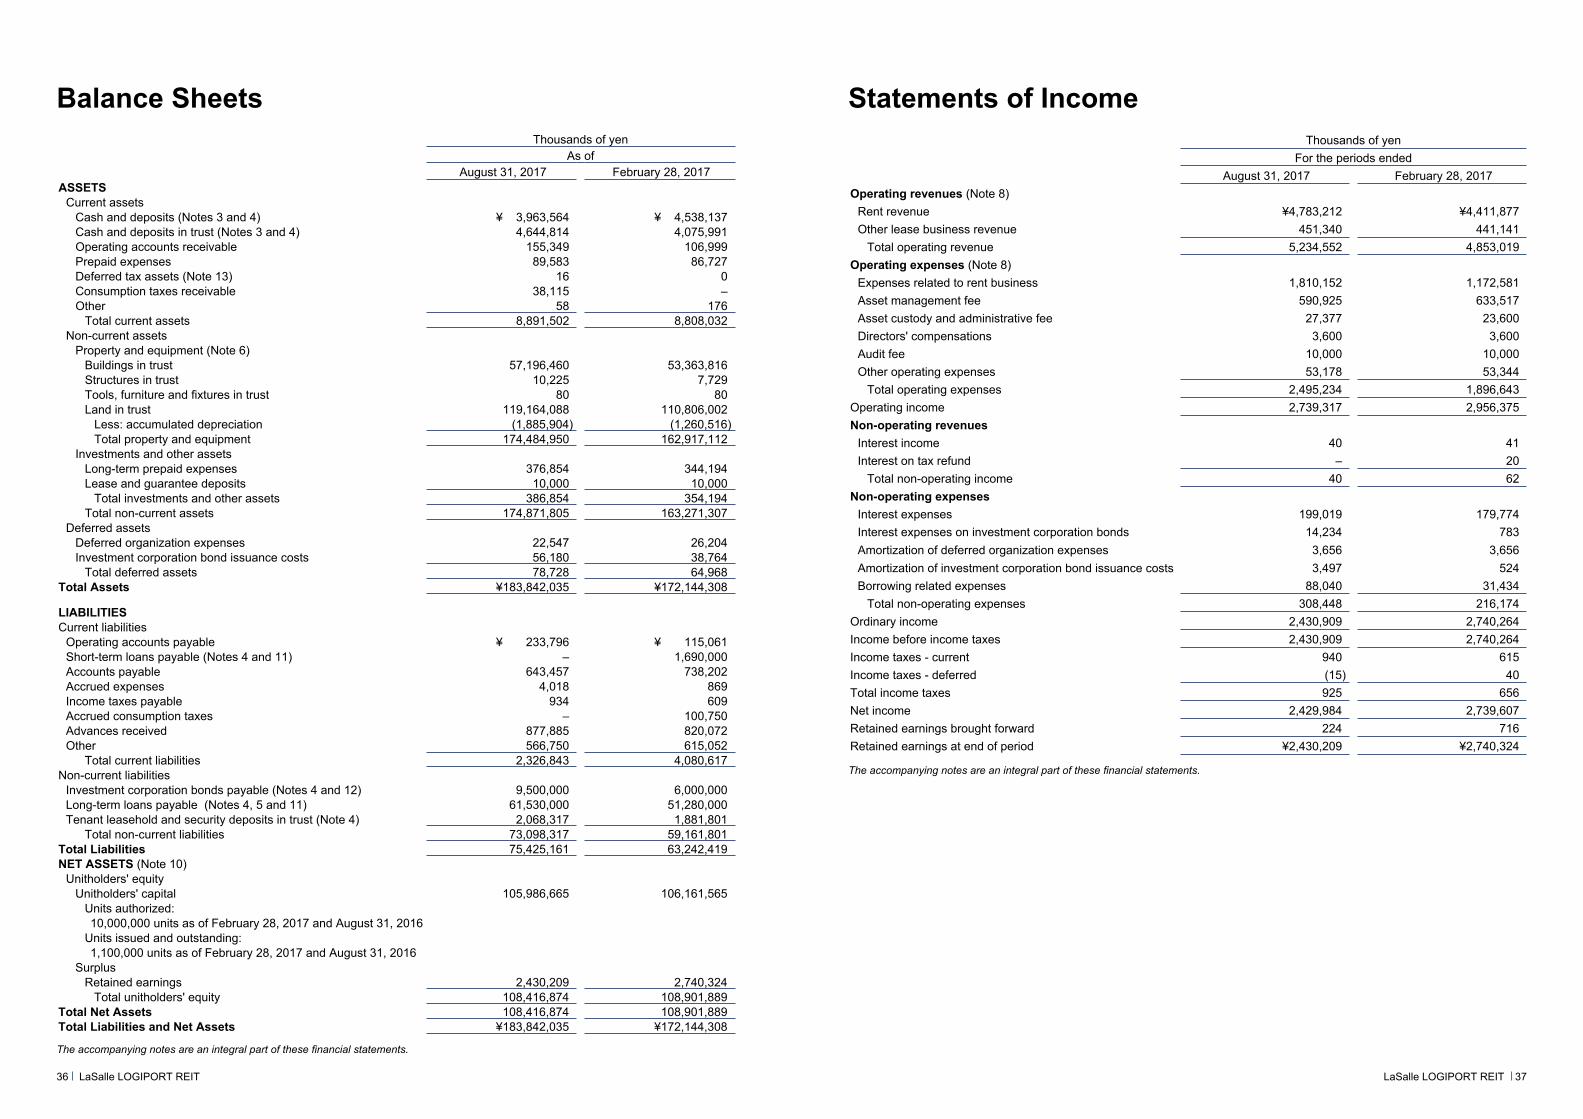
Statements of IncomeBalance SheetsThousands of yen
For the periods ended August 31, 2017 February 28, 2017
Operating revenues (Note 8)Rent revenue ¥4,783,212 ¥4,411,877Other lease business revenue 451,340 441,141
Total operating revenue 5,234,552 4,853,019Operating expenses (Note 8)
Expenses related to rent business 1,810,152 1,172,581Asset management fee 590,925 633,517Asset custody and administrative fee 27,377 23,600Directors' compensations 3,600 3,600Audit fee 10,000 10,000Other operating expenses 53,178 53,344
Total operating expenses 2,495,234 1,896,643Operating income 2,739,317 2,956,375Non-operating revenues
Interest income 40 41Interest on tax refund – 20
Total non-operating income 40 62Non-operating expenses
Interest expenses 199,019 179,774Interest expenses on investment corporation bonds 14,234 783Amortization of deferred organization expenses 3,656 3,656Amortization of investment corporation bond issuance costs 3,497 524Borrowing related expenses 88,040 31,434
Total non-operating expenses 308,448 216,174Ordinary income 2,430,909 2,740,264Income before income taxes 2,430,909 2,740,264Income taxes - current 940 615Income taxes - deferred (15) 40Total income taxes 925 656Net income 2,429,984 2,739,607Retained earnings brought forward 224 716Retained earnings at end of period ¥2,430,209 ¥2,740,324
The accompanying notes are an integral part of these financial statements.
Thousands of yenAs of
August 31, 2017 February 28, 2017ASSETS
Current assetsCash and deposits (Notes 3 and 4) ¥ 3,963,564 ¥ 4,538,137Cash and deposits in trust (Notes 3 and 4) 4,644,814 4,075,991Operating accounts receivable 155,349 106,999Prepaid expenses 89,583 86,727Deferred tax assets (Note 13) 16 0Consumption taxes receivable 38,115 –Other 58 176
Total current assets 8,891,502 8,808,032Non-current assets
Property and equipment (Note 6)Buildings in trust 57,196,460 53,363,816Structures in trust 10,225 7,729Tools, furniture and fixtures in trust 80 80Land in trust 119,164,088 110,806,002
Less: accumulated depreciation (1,885,904) (1,260,516)Total property and equipment 174,484,950 162,917,112
Investments and other assetsLong-term prepaid expenses 376,854 344,194Lease and guarantee deposits 10,000 10,000
Total investments and other assets 386,854 354,194Total non-current assets 174,871,805 163,271,307
Deferred assetsDeferred organization expenses 22,547 26,204Investment corporation bond issuance costs 56,180 38,764
Total deferred assets 78,728 64,968Total Assets ¥183,842,035 ¥172,144,308
LIABILITIESCurrent liabilities
Operating accounts payable ¥ 233,796 ¥ 115,061Short-term loans payable (Notes 4 and 11) – 1,690,000Accounts payable 643,457 738,202Accrued expenses 4,018 869Income taxes payable 934 609Accrued consumption taxes – 100,750Advances received 877,885 820,072Other 566,750 615,052
Total current liabilities 2,326,843 4,080,617Non-current liabilities
Investment corporation bonds payable (Notes 4 and 12) 9,500,000 6,000,000Long-term loans payable (Notes 4, 5 and 11) 61,530,000 51,280,000Tenant leasehold and security deposits in trust (Note 4) 2,068,317 1,881,801
Total non-current liabilities 73,098,317 59,161,801Total Liabilities 75,425,161 63,242,419NET ASSETS (Note 10)
Unitholders' equityUnitholders' capital 105,986,665 106,161,565
Units authorized:10,000,000 units as of February 28, 2017 and August 31, 2016
Units issued and outstanding:1,100,000 units as of February 28, 2017 and August 31, 2016
SurplusRetained earnings 2,430,209 2,740,324
Total unitholders' equity 108,416,874 108,901,889Total Net Assets 108,416,874 108,901,889Total Liabilities and Net Assets ¥183,842,035 ¥172,144,308
The accompanying notes are an integral part of these financial statements.
36 37LaSalle LOGIPORT REIT LaSalle LOGIPORT REIT
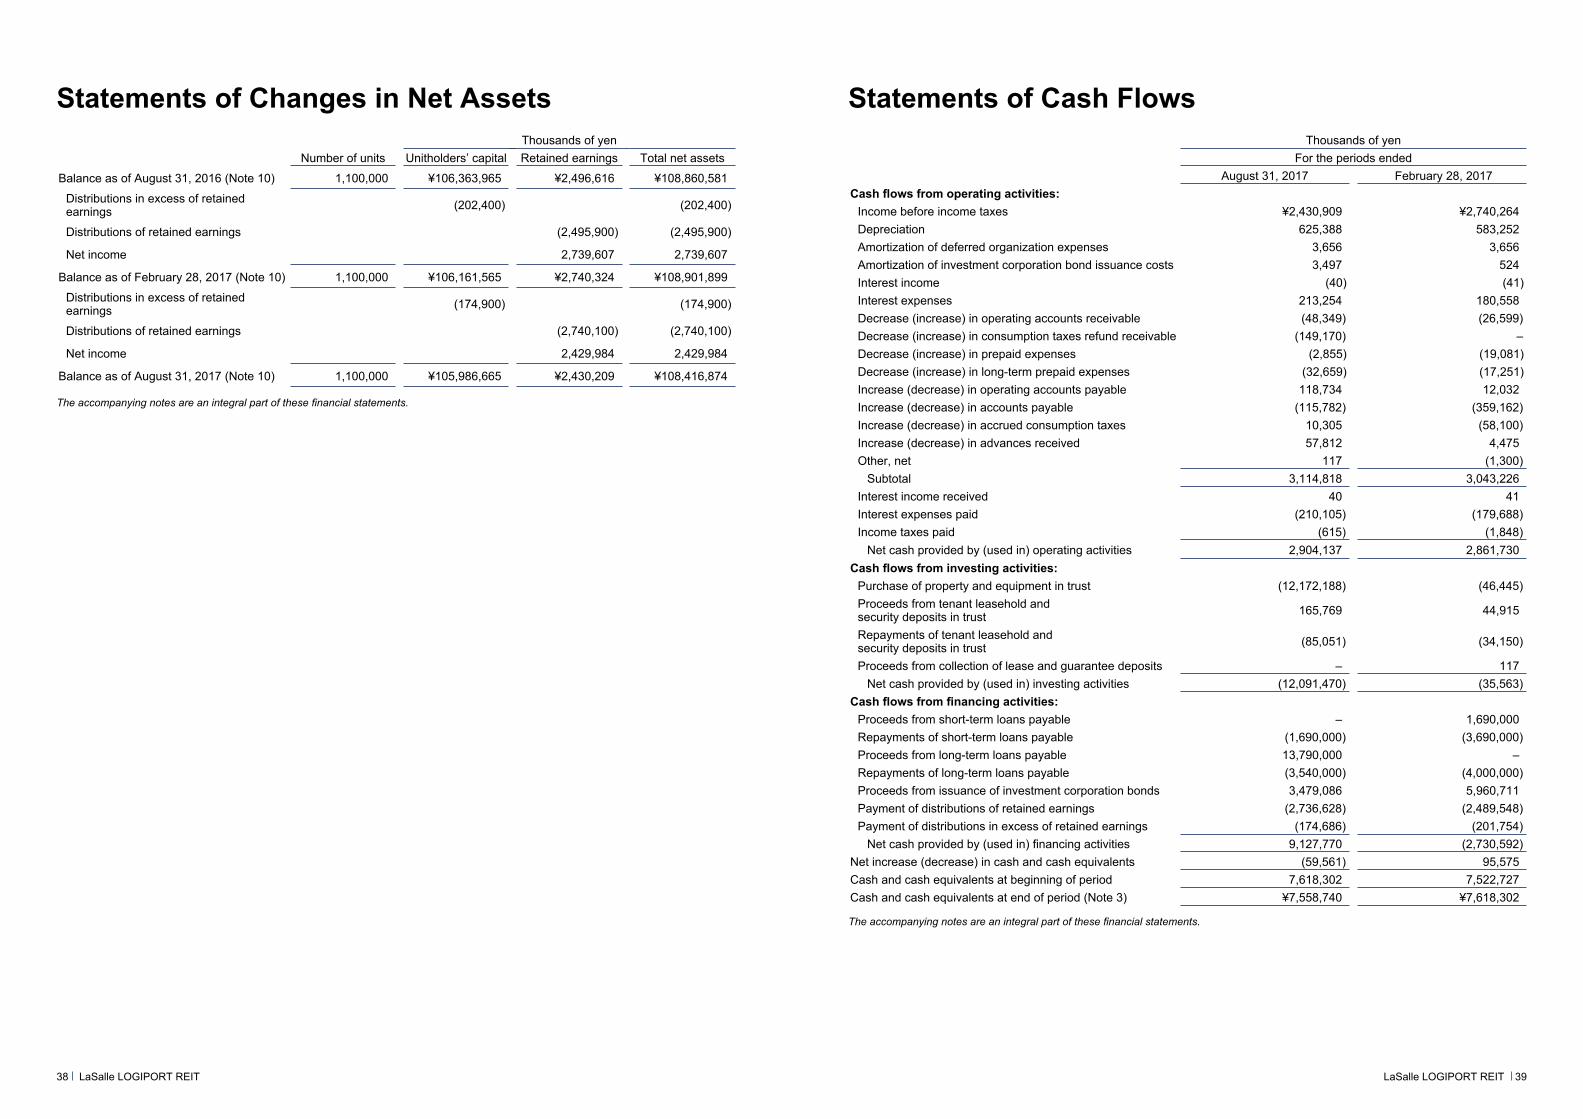
Statements of Changes in Net Assets Statements of Cash FlowsThousands of yen
Number of units Unitholders’ capital Retained earnings Total net assets
Balance as of August 31, 2016 (Note 10) 1,100,000 ¥106,363,965 ¥2,496,616 ¥108,860,581
Distributions in excess of retained earnings (202,400) (202,400)
Distributions of retained earnings (2,495,900) (2,495,900)
Net income 2,739,607 2,739,607
Balance as of February 28, 2017 (Note 10) 1,100,000 ¥106,161,565 ¥2,740,324 ¥108,901,899
Distributions in excess of retained earnings (174,900) (174,900)
Distributions of retained earnings (2,740,100) (2,740,100)
Net income 2,429,984 2,429,984
Balance as of August 31, 2017 (Note 10) 1,100,000 ¥105,986,665 ¥2,430,209 ¥108,416,874
The accompanying notes are an integral part of these financial statements.
Thousands of yenFor the periods ended
August 31, 2017 February 28, 2017Cash flows from operating activities:
Income before income taxes ¥2,430,909 ¥2,740,264Depreciation 625,388 583,252Amortization of deferred organization expenses 3,656 3,656Amortization of investment corporation bond issuance costs 3,497 524Interest income (40) (41) Interest expenses 213,254 180,558Decrease (increase) in operating accounts receivable (48,349) (26,599) Decrease (increase) in consumption taxes refund receivable (149,170) –Decrease (increase) in prepaid expenses (2,855) (19,081) Decrease (increase) in long-term prepaid expenses (32,659) (17,251) Increase (decrease) in operating accounts payable 118,734 12,032Increase (decrease) in accounts payable (115,782) (359,162)Increase (decrease) in accrued consumption taxes 10,305 (58,100)Increase (decrease) in advances received 57,812 4,475Other, net 117 (1,300)
Subtotal 3,114,818 3,043,226Interest income received 40 41Interest expenses paid (210,105) (179,688) Income taxes paid (615) (1,848)
Net cash provided by (used in) operating activities 2,904,137 2,861,730Cash flows from investing activities:
Purchase of property and equipment in trust (12,172,188) (46,445) Proceeds from tenant leasehold and security deposits in trust 165,769 44,915
Repayments of tenant leasehold and security deposits in trust (85,051) (34,150)
Proceeds from collection of lease and guarantee deposits – 117Net cash provided by (used in) investing activities (12,091,470) (35,563)
Cash flows from financing activities:Proceeds from short-term loans payable – 1,690,000Repayments of short-term loans payable (1,690,000) (3,690,000) Proceeds from long-term loans payable 13,790,000 –Repayments of long-term loans payable (3,540,000) (4,000,000)Proceeds from issuance of investment corporation bonds 3,479,086 5,960,711Payment of distributions of retained earnings (2,736,628) (2,489,548)Payment of distributions in excess of retained earnings (174,686) (201,754)
Net cash provided by (used in) financing activities 9,127,770 (2,730,592)Net increase (decrease) in cash and cash equivalents (59,561) 95,575Cash and cash equivalents at beginning of period 7,618,302 7,522,727Cash and cash equivalents at end of period (Note 3) ¥7,558,740 ¥7,618,302
The accompanying notes are an integral part of these financial statements.
38 39LaSalle LOGIPORT REIT LaSalle LOGIPORT REIT
Notes to Financial Statementsd) Investment Unit Issuance Expenses
The full amount of investment unit issuance expenses is recorded as expenses at the time of expenditure.
e) Organization ExpensesAll organization expenses are amortized using the straight-line method over five years.
f) Investment Corporation Bond Issuance CostsInvestment corporation bond issuance costs are amortized using the straight-line method over the respective terms of the bonds.
g) Hedge AccountingLLR enters into derivative transactions in order to hedge against risks defined in its Articles of Incorporation. In compliance with the general risk management policy, LLR uses interest rate swaps for the purpose of hedging its risk exposure associated with interest on variable rate loans payable. Where deferral accounting is generally adopted for hedge transactions, LLR applies deferred hedge accounting. However, special accounting treatment provided under Japanese GAAP is applied to those interest rate swaps that meet the criteria for special accounting treatment. Under the special accounting treatment, interest rate swaps are not measured at fair value, but the differential paid or received amount under the swap agreements is recognized and included in interest expense or income, respectively.
Assessment of the hedge effectiveness has been omitted since all interest rate swaps meet the specific matching criteria under the special accounting treatment.
h) Beneficiary Rights in TrustAs to beneficiary rights in trust, all assets and liabilities for assets in trust, as well as the related income generated and expenses incurred, are recorded in the relevant balance sheets and statements of income accounts.The following material items of assets in trust recognized in the relevant account items are listed separately on the balance sheets.
(i) Cash and deposits in trust (ii) Buildings in trust, structures in trust, tools, furniture and fixtures in trust, land in trust
(iii) Tenant leasehold and security deposits in trust
i) Consumption TaxesTransactions subject to consumption taxes are recorded at amounts exclusive of consumption taxes. Net payable to, or receivable from tax authorities is recognized as consumption taxes payable or receivable on the balance sheets, and net movement is treated as operating cash flows in the statements of cash flows.
3. Cash and Cash EquivalentsThe relationship between cash and cash equivalents in the statements of cash flows and the balance sheets is as follows:
Thousands of yenAs of
August 31, 2017 February 28, 2017Cash and deposits ¥3,963,564 ¥4,538,137Cash and deposits in trust 4,644,814 4,075,991Restricted deposits in trust (Note) (1,049,638) (995,826)Cash and cash equivalents ¥7,558,740 ¥7,618,302
(Note) Restricted deposits held in trust are reserved for the refund of leases and guarantee deposits received from tenants.
a) Cash and Cash EquivalentsCash and cash equivalents consist of cash on hand and cash in trust, floating deposits, deposits in trust and short-term investments that are very liquid and realizable with a maturity of three months or less when purchased, and that are subject to insignificant risks of changes in value.
b) Property and EquipmentDepreciation of property and equipment, including property and equipment in trust, is calculated by the straight-line method over the estimated useful lives as follows:
Buildings 2-79 yearsStructures 10-20 yearsTools, furniture and fixtures 6 years
c) Tax on Property and EquipmentWith respect to property taxes, city planning taxes and depreciable asset taxes, of the tax amount assessed and determined, the amount corresponding to the relevant fiscal period is accounted for as leasing expenses.Of the amounts paid for the acquisition of real estate properties or beneficiary rights in trust of real estate, the amount estimated of property tax is capitalized as part of the acquisition cost of the relevant property instead of being charged as expenses. Capitalized property taxes amounted to 50,089 thousand yen for the period ended August 31, 2017.
1. Organization and Basis of Presentationa) Organization
With LaSalle REIT Advisors K.K. as the organizer, LaSalle LOGIPORT REIT (“LLR”) was established with capital of 150 million yen (1,500 units) on October 9, 2015 pursuant to the Act on Investment Trusts and Investment Corporations (“Investment Trusts Act,” Act. No. 198 of 1951, including subsequent amendments). LLR issued new investment units (1,050,800 units) through a public offering with a payment date of February 16, 2016 and was listed on the J-REIT section of the Tokyo Stock Exchange (Securities Code: 3466) on February 17, 2016. Subsequently, on March 15, 2016, LLR issued new investment units (47,700 units) through a third-party allotment associated with the aforementioned public offering. As a result, the total number of issued and outstanding investment units as of August 31, 2017 is 1,100,000 units.
On February 17, 2016, LLR acquired and began managing eight properties (combined acquisition price of 161,440 million yen). In addition, LLR acquired one property (acquisition price of 11,950 million yen) on March 1, 2017.
These nine properties (with total leasable floor area of 752,117 square-meters) comprise LLR’s asset holdings as of August 31, 2017, and the occupancy rate for the entire portfolio as of August 31, 2017 is 98.6%.
b) Basis of PresentationThe accompanying financial statements have been prepared in accordance with the provisions set forth in the Investment Trusts Act and the Japanese Financial Instruments and Exchange Act and their related accounting regulations. They are also in conformity with accounting principles generally accepted in Japan (hereinafter “Jap-anese GAAP”), which are different in certain aspects as to the application and disclosure requirements from the International Financial Reporting Standards.
The accompanying financial statements have been reformatted and translated into English from the financial statements of LLR prepared in accordance with Japanese GAAP, and filed with the appropriate Local Finance Bureau of the Ministry of Finance as required by the Financial Instruments and Exchange Act. In preparing these financial statements, certain reclassifications and modifications have been made to the financial statements issued domestically in order to present them in a format which is more familiar to readers outside Japan.
As permitted by the regulations under the Financial Instruments and Exchange Act of Japan, amounts of less than one thousand yen have been omitted. As a result, the totals shown in the accompanying financial statements do not necessarily agree with the sums of the individual amounts.
2. Summary of Significant Accounting Policies
40 41LaSalle LOGIPORT REIT LaSalle LOGIPORT REIT
Notes to Financial StatementsThousands of yen
As of February 28, 2017Book value Fair value Difference
(1) Cash and deposits ¥ 4,538,137 ¥ 4,538,137 ¥ –(2) Cash and deposits in trust 4,075,991 4,075,991 –
Total assets ¥ 8,614,128 ¥ 8,614,128 ¥ –(3) Short-term loans payable 1,690,000 1,690,000 –(4) Investment corporation bonds payable 6,000,000 6,012,800 12,800(5) Long-term loans payable 51,280,000 51,885,042 605,042
Total liabilities ¥58,970,000 ¥59,587,842 ¥617,842(6) Derivative transactions ¥ – ¥ – ¥ –
(Note 1) Methods to estimate fair values of financial instruments(1) Cash and deposits and (2) Cash and deposits in trust
Due to the short maturities, the book value of these instruments is deemed to be a reasonable ap-proximation of the fair value, and therefore, the book value is used as the fair value.
(3) Short-term loans payableDue to the short maturities and their variable interest rate, the book value of these instruments is deemed to be a reasonable approximation of the fair value, and therefore, the book value is used as the fair value.
(4) Investment corporation bonds payableThe reference statistical prices disclosed by the Japan Securities Dealers Association are used as the fair value.
(5) Long-term loans payableThe fair value of long-term loans payable is determined based on the present value of contractual cash flows which would be applicable to new loans payable under the same conditions and terms.
(6) Derivative transactionsPlease refer to Note 5, “Derivative Transactions.”
(Note 2) Financial instruments for which fair value is extremely difficult to estimateAs tenant leasehold and security deposits in trust have no observable and available market price, and it is impracticable to reasonably estimate their future cash flows, the fair value is not disclosed.
Thousands of yenAs of
August 31, 2017 February 28, 2017Tenant leasehold and security deposits in trust ¥2,068,317 ¥1,881,801
(Note 3) Redemption schedule for monetary claims after August 31, 2017Thousands of yen
As of August 31, 2017
Due within one year
Due after one to two
years
Due after two to three
years
Due after three to four
years
Due after four to five
years
Due after five years
Cash and deposits ¥3,963,564 ¥ – ¥ – ¥ – ¥ – ¥ –Cash and deposits in trust 4,644,814 – – – – –
Total ¥8,608,378 ¥ – ¥ – ¥ – ¥ – ¥ –
4. Financial Instrumentsa) Detailed Information on Financial Instruments
(i) Policy for Financial InstrumentsAt the time of acquisition of new portfolio assets, LLR procures funds through the issuance of investment units, borrowing from financial institutions or issuing short-term corporate bonds.LLR manages surplus funds as deposits, taking security and liquidity into account with due consideration of market conditions and its own cash flow situation.In addition, LLR uses derivatives transactions to hedge against interest rate fluctuation risks and other risks associated with loans and other funding sources, and does not engage in speculative transactions.
(ii) Financial Instruments, their Risks and Risk Management SystemLLR manages surplus funds as deposits, and although they are exposed to credit risks such as the solvency of the financial institutions where they are deposited, LLR makes deposits carefully for short-term deposit maturities only, taking security and liquidity into account with due consideration of market conditions and its own cash flow situation.
LLR uses borrowings and investment corporation bonds for purposes such as procuring funds for the acquisition of real estate properties, repayment of borrowings and redemption of investment corporation bonds. Although they are exposed to liquidity risks at the time of repayment, LLR mitigates liquidity risk by staggering repayment dates, diversifying its financing sources and securing liquidity, and manages liquidity risk by methods such as preparing cash flow plans. In addition, among borrowings, as some of the loans are in the form of floating rate exposures, exposed to the risk of rising interest rates, LLR endeavors to keep the impact of higher interest payments on operations to a minimum by maintaining a conservative ratio of interest-bearing debt and by increasing the ratio of long-term loans payable in its borrowings.
(iii) Supplemental Explanation Regarding Fair Values of Financial InstrumentsThe fair value of financial instruments include the value based on market prices, but when there is no market price available, the value is determined through a reasonable estimation. Certain assumptions are used in the calculation of their estimated values and thus, when different assumptions are used, the resulting estimated values may be different.
b) Estimated Fair Value of Financial InstrumentsThe book value, fair value and differences between the two values as of August 31, 2017 and February 28, 2017 are as follows. Financial instruments for which the fair value is difficult to estimate are excluded from the following table (see Note 2 below).
Thousands of yenAs of August 31, 2017
Book value Fair value Difference(1) Cash and deposits ¥ 3,963,564 ¥ 3,963,564 ¥ –(2) Cash and deposits in trust 4,644,814 4,644,814 –
Total assets ¥ 8,608,378 ¥ 8,608,378 ¥ –(4) Investment corporation bonds payable 9,500,000 9,556,100 56,100(5) Long-term loans payable 61,530,000 62,109,434 579,434
Total liabilities ¥71,030,000 ¥71,665,534 ¥635,534(6) Derivative transactions ¥ – ¥ – ¥ –
42 43LaSalle LOGIPORT REIT LaSalle LOGIPORT REIT
Notes to Financial StatementsThousands of yen
As of February 28, 2017Contract amount
Hedge accounting method
Type of derivative
Primary hedged item Total Due after
one year Fair value Fair value measurement
Special treatment for interest rate swaps
Interest rate swaps Receive floating/Pay fixed
Long-term loans payable ¥28,690,000 ¥28,690,000 (Note) (Note)
(Note) Interest rate swaps, designated as hedged items, under the special accounting treatment are accounted for as an integral part of long-term loans payable. Therefore, the fair value is included in long-term loans payable disclosed in the aforementioned Note 4, “Financial Instruments, b) Estimated Fair Value of Financial Instru-ments, (5) Long-term loans payable.”
6. Property and EquipmentThe following table summarizes the property and equipment as of August 31, 2017 and February 28, 2017.
Thousands of yenAs of August 31, 2017
At costBeginning balance Increase Decrease Ending balance Accumulated
depreciation Book value
Buildings in trust ¥ 53,363,816 ¥ 3,832,644 ¥ – ¥57,196,460 ¥1,885,276 ¥55,311,184Structures in trust 7,729 2,496 – 10,225 611 9,614Tools, furniture and fixtures in trust 80 – – 80 16 63
Land in trust 110,806,002 8,358,085 – 119,164,088 – 119,164,088Total ¥164,177,628 ¥12,193,226 ¥ – ¥176,370,855 ¥1,885,904 ¥174,484,950
(Note) The increase for the period ended August 31, 2017, was mainly due to the acquisition of property during the period with a total value of 12,126,163 thousand yen.
Thousands of yenAs of February 28, 2017
At costBeginning balance Increase Decrease Ending balance Accumulated
depreciation Book value
Buildings in trust ¥ 53,309,846 ¥53,969 ¥ – ¥ 53,363,816 ¥1,260,220 ¥ 52,103,595Structures in trust 3,459 4,270 – 7,729 285 7,444Tools, furniture and fixtures in trust 80 – – 80 10 70
Land in trust 110,806,002 – – 110,806,002 – 110,806,002Total ¥164,119,389 ¥58,239 ¥ – ¥164,177,628 ¥1,260,516 ¥162,917,112
Redemption schedule for monetary claims after February 28, 2017Thousands of yen
As of February 28, 2017
Due within one year
Due after one to two
years
Due after two to three
years
Due after three to four
years
Due after four to five
years
Due after five years
Cash and deposits ¥4,538,137 ¥ – ¥ – ¥ – ¥ – ¥ –Cash and deposits in trust 4,075,991 – – – – –
Total ¥8,614,128 ¥ – ¥ – ¥ – ¥ – ¥ –
(Note 4) Repayment schedule for investment corporation bonds and long-term loans payable after August 31, 2017.Thousands of yen
As of August 31, 2017
Due within one year
Due after one to two
years
Due after two to three
years
Due after three to four
years
Due after four to five
years
Due after five years
Investment corporation bonds payable ¥ – ¥ – ¥ – ¥ – ¥4,000,000 ¥ 5,500,000
Long-term loans payable – 1,900,000 1,400,000 10,740,000 2,990,000 44,500,000Total ¥ – ¥1,900,000 ¥1,400,000 ¥10,740,000 ¥6,990,000 ¥50,000,000
Repayment schedule for investment corporation bonds, short-term and long-term loans payable after February 28, 2017.
Thousands of yenAs of February 28, 2017
Due within one year
Due after one to two
years
Due after two to three
years
Due after three to four
years
Due after four to five
years
Due after five years
Short-term loans payable ¥1,690,000 ¥ – ¥ – – ¥ – ¥ –Investment corporation bonds payable – – – – 4,000,000 2,000,000
Long-term loans payable – 3,540,000 – 10,740,000 – 37,000,000Total ¥1,690,000 ¥3,540,000 ¥ – ¥10,740,000 ¥4,000,000 ¥39,000,000
5. Derivative TransactionsFor the periods ended August 31, 2017 and February 28, 2017, LLR only utilized interest rate swaps, which qualified for hedge accounting and met the special matching criteria, as described below.
Thousands of yenAs of August 31, 2017
Contract amountHedge
accounting methodType of
derivativePrimary
hedged item Total Due after one year Fair value Fair value
measurementSpecial treatment for interest rate swaps
Interest rate swaps Receive floating/Pay fixed
Long-term loans payable ¥28,690,000 ¥28,690,000 (Note) (Note)
(Note) Interest rate swaps, designated as hedged items, under the special accounting treatment are accounted for as the integral part of long-term loans payable. Therefore, the fair value is included in long-term loans payable disclosed in the aforementioned Note 4, “Financial Instruments, b) Estimated Fair Value of Financial Instru-ments, (5) Long-term loans payable.”
44 45LaSalle LOGIPORT REIT LaSalle LOGIPORT REIT
Notes to Financial Statements9. LeasesThe future minimum rent revenue from tenants, subsequent to fiscal period end, under non-cancelable operating leases of properties is as follows:
Thousands of yenAs of
August 31, 2017 February 28, 2017Due within one year ¥ 6,012,690 ¥ 5,470,786Due after one year 15,731,286 14,267,982Total ¥21,743,976 ¥19,738,768
10. Net Assetsa) Stated Capital
LLR issues only non-par value units in accordance with the Investment Trusts Act of Japan, and all issue amounts of new units are designated as stated capital. LLR maintains at least 50,000 thousand yen as minimum net assets as required by Article 67, Paragraph 4 of the Investment Trusts Act.
b) Unitholders’ CapitalUnitholders’ capital as of August 31, 2017 and February 28, 2017 consists of the following items:
Thousands of yenAs of
August 31, 2017 February 28, 2017Unitholders’ capital, gross ¥106,363,965 ¥106,363,965Deduction from unitholders’ capital;
Accumulated distributions in excess of retained earnings (377,300) (202,400)
Unitholders’ capital ¥105,986,665 ¥106,161,565
c) DistributionsWith regard to the distributions for this fiscal period, in an effort to include LLR’s profit distributions as tax deduct-ible expenses in accordance with Section 1 of Article 67-15 of the Act on Special Taxation Measures Law, the distribution amount represents the entire unappropriated retained earnings for the fiscal period, excluding fractional amounts less than one yen.
YenFor the periods ended
August 31, 2017 February 28, 2017Total Per unit Total Per unit
I Unappropriated retained earnings ¥2,430,209,201 ¥2,740,324,515II Distributions in excess of retained earnings
Deduction from unitholders’ capital 187,000,000 174,900,000III Distributions
Distributions of retained earnings 2,429,900,000 2,209 2,740,100,000 2,491Distributions in excess of retained earnings 187,000,000 170 174,900,000 159
Total distributions 2,616,900,000 2,379 2,915,000,000 2,650IV Retained earnings carried forward ¥ 309,201 ¥ 224,515
Pursuant to the “Distribution Policy” as defined in Article 36, Paragraph 1 of Article 2 of the Articles of Incorporation of LLR, the amount of distributions shall be the amount which does not exceed the amount of profits but exceeds 90% of the distributable profit as defined in Article 67-15 of the Special Taxation Measures Act.
7. Investment and Rental PropertiesLLR owns leased logistics properties mainly in the Tokyo and Osaka areas for the purpose of earning rent income. The opening book value, changes during the fiscal period and the fiscal period end fair value of the properties are as follows:
Thousands of yenFor the periods ended
August 31, 2017 February 28, 2017Book value (Note 1)
Balance at the beginning of the period ¥162,917,112 ¥163,442,126Changes during the period (Note 2) 11,567,837 (525,013)Balance at the end of the period ¥174,484,950 ¥162,917,112
Fair value at the end of the period (Note 3) ¥184,440,000 ¥172,210,000
(Note 1) Book value is calculated by deducting accumulated depreciation from the acquisition cost.(Note 2) The increase for period ended August 31, 2017, was a result of the acquisition of one property during the
period with a total value of 12,126,163 thousand yen, offset slightly by depreciation expenses of 625,388 thousand yen. In addition, the increase for period ended February 28, 2017, was a result of the recognition of depreciation expenses of 583,252 thousand yen.
(Note 3) The fair value at the end of the period is stated at the appraisal value obtained from an independent real estate appraiser.
8. Property-related Revenues and ExpensesThe following table summarizes the revenues and expenses generated from property leasing activities for the periods ended August 31, 2017 and February 28, 2017.
Thousands of yenFor the periods ended
August 31, 2017 February 28, 2017(1) Real estate leasing revenues
Rent revenueRent income ¥4,302,668 ¥3,959,491 Common service fee 480,543 452,386
Total ¥4,783,212 ¥4,411,877Other lease business revenue
Utilities charge reimbursement ¥ 295,057 ¥ 258,777Parking revenue 126,663 117,019Other lease revenues 29,619 65,344
Total ¥ 451,340 ¥ 441,141Total real estate leasing revenues ¥5,234,552 ¥4,853,019
(2) Real estate leasing expensesLeasing expenses
Outsourcing costs ¥ 301,195 ¥ 265,093Utilities expenses 280,081 232,373Taxes and public dues 402,188 –Insurance premiums 9,471 9,835Repair and maintenance 127,811 58,398Depreciation 625,388 583,252Other leasing expenses 64,014 23,627
Total real estate leasing expenses ¥1,810,152 ¥1,172,581(3) Real estate leasing profit ((1) - (2)) ¥3,424,399 ¥3,680,438
46 47LaSalle LOGIPORT REIT LaSalle LOGIPORT REIT
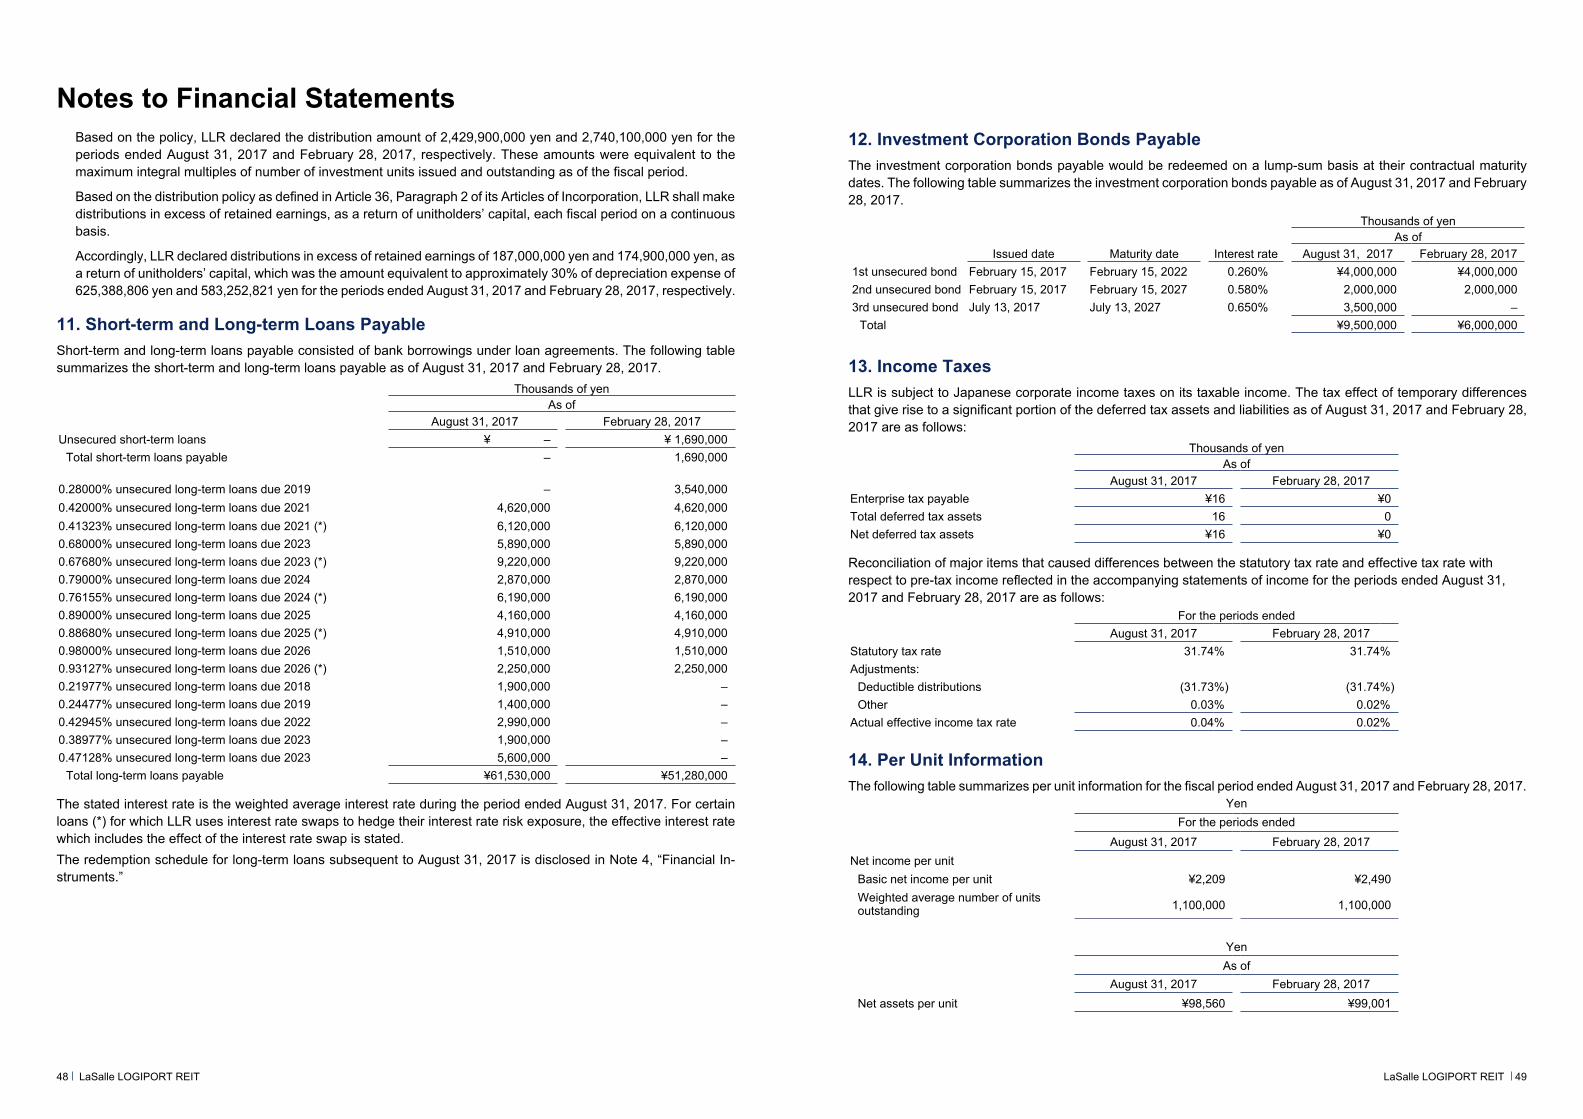
Notes to Financial Statements12. Investment Corporation Bonds PayableThe investment corporation bonds payable would be redeemed on a lump-sum basis at their contractual maturity dates. The following table summarizes the investment corporation bonds payable as of August 31, 2017 and February 28, 2017.
Thousands of yenAs of
Issued date Maturity date Interest rate August 31, 2017 February 28, 20171st unsecured bond February 15, 2017 February 15, 2022 0.260% ¥4,000,000 ¥4,000,0002nd unsecured bond February 15, 2017 February 15, 2027 0.580% 2,000,000 2,000,0003rd unsecured bond July 13, 2017 July 13, 2027 0.650% 3,500,000 –
Total ¥9,500,000 ¥6,000,000
13. Income TaxesLLR is subject to Japanese corporate income taxes on its taxable income. The tax effect of temporary differences that give rise to a significant portion of the deferred tax assets and liabilities as of August 31, 2017 and February 28, 2017 are as follows:
Thousands of yenAs of
August 31, 2017 February 28, 2017Enterprise tax payable ¥16 ¥0Total deferred tax assets 16 0Net deferred tax assets ¥16 ¥0
Reconciliation of major items that caused differences between the statutory tax rate and effective tax rate with respect to pre-tax income reflected in the accompanying statements of income for the periods ended August 31, 2017 and February 28, 2017 are as follows:
For the periods endedAugust 31, 2017 February 28, 2017
Statutory tax rate 31.74% 31.74%Adjustments:
Deductible distributions (31.73%) (31.74%)Other 0.03% 0.02%
Actual effective income tax rate 0.04% 0.02%
14. Per Unit InformationThe following table summarizes per unit information for the fiscal period ended August 31, 2017 and February 28, 2017.
YenFor the periods ended
August 31, 2017 February 28, 2017Net income per unit
Basic net income per unit ¥2,209 ¥2,490Weighted average number of units outstanding 1,100,000 1,100,000
YenAs of
August 31, 2017 February 28, 2017Net assets per unit ¥98,560 ¥99,001
Based on the policy, LLR declared the distribution amount of 2,429,900,000 yen and 2,740,100,000 yen for the periods ended August 31, 2017 and February 28, 2017, respectively. These amounts were equivalent to the maximum integral multiples of number of investment units issued and outstanding as of the fiscal period.
Based on the distribution policy as defined in Article 36, Paragraph 2 of its Articles of Incorporation, LLR shall make distributions in excess of retained earnings, as a return of unitholders’ capital, each fiscal period on a continuous basis.
Accordingly, LLR declared distributions in excess of retained earnings of 187,000,000 yen and 174,900,000 yen, as a return of unitholders’ capital, which was the amount equivalent to approximately 30% of depreciation expense of 625,388,806 yen and 583,252,821 yen for the periods ended August 31, 2017 and February 28, 2017, respectively.
11. Short-term and Long-term Loans PayableShort-term and long-term loans payable consisted of bank borrowings under loan agreements. The following table summarizes the short-term and long-term loans payable as of August 31, 2017 and February 28, 2017.
Thousands of yenAs of
August 31, 2017 February 28, 2017Unsecured short-term loans ¥ – ¥ 1,690,000
Total short-term loans payable – 1,690,000
0.28000% unsecured long-term loans due 2019 – 3,540,0000.42000% unsecured long-term loans due 2021 4,620,000 4,620,0000.41323% unsecured long-term loans due 2021 (*) 6,120,000 6,120,0000.68000% unsecured long-term loans due 2023 5,890,000 5,890,0000.67680% unsecured long-term loans due 2023 (*) 9,220,000 9,220,0000.79000% unsecured long-term loans due 2024 2,870,000 2,870,0000.76155% unsecured long-term loans due 2024 (*) 6,190,000 6,190,0000.89000% unsecured long-term loans due 2025 4,160,000 4,160,0000.88680% unsecured long-term loans due 2025 (*) 4,910,000 4,910,0000.98000% unsecured long-term loans due 2026 1,510,000 1,510,0000.93127% unsecured long-term loans due 2026 (*) 2,250,000 2,250,0000.21977% unsecured long-term loans due 2018 1,900,000 – 0.24477% unsecured long-term loans due 2019 1,400,000 – 0.42945% unsecured long-term loans due 2022 2,990,000 – 0.38977% unsecured long-term loans due 2023 1,900,000 – 0.47128% unsecured long-term loans due 2023 5,600,000 –
Total long-term loans payable ¥61,530,000 ¥51,280,000
The stated interest rate is the weighted average interest rate during the period ended August 31, 2017. For certain loans (*) for which LLR uses interest rate swaps to hedge their interest rate risk exposure, the effective interest rate which includes the effect of the interest rate swap is stated.The redemption schedule for long-term loans subsequent to August 31, 2017 is disclosed in Note 4, “Financial In-struments.”
48 49LaSalle LOGIPORT REIT LaSalle LOGIPORT REIT
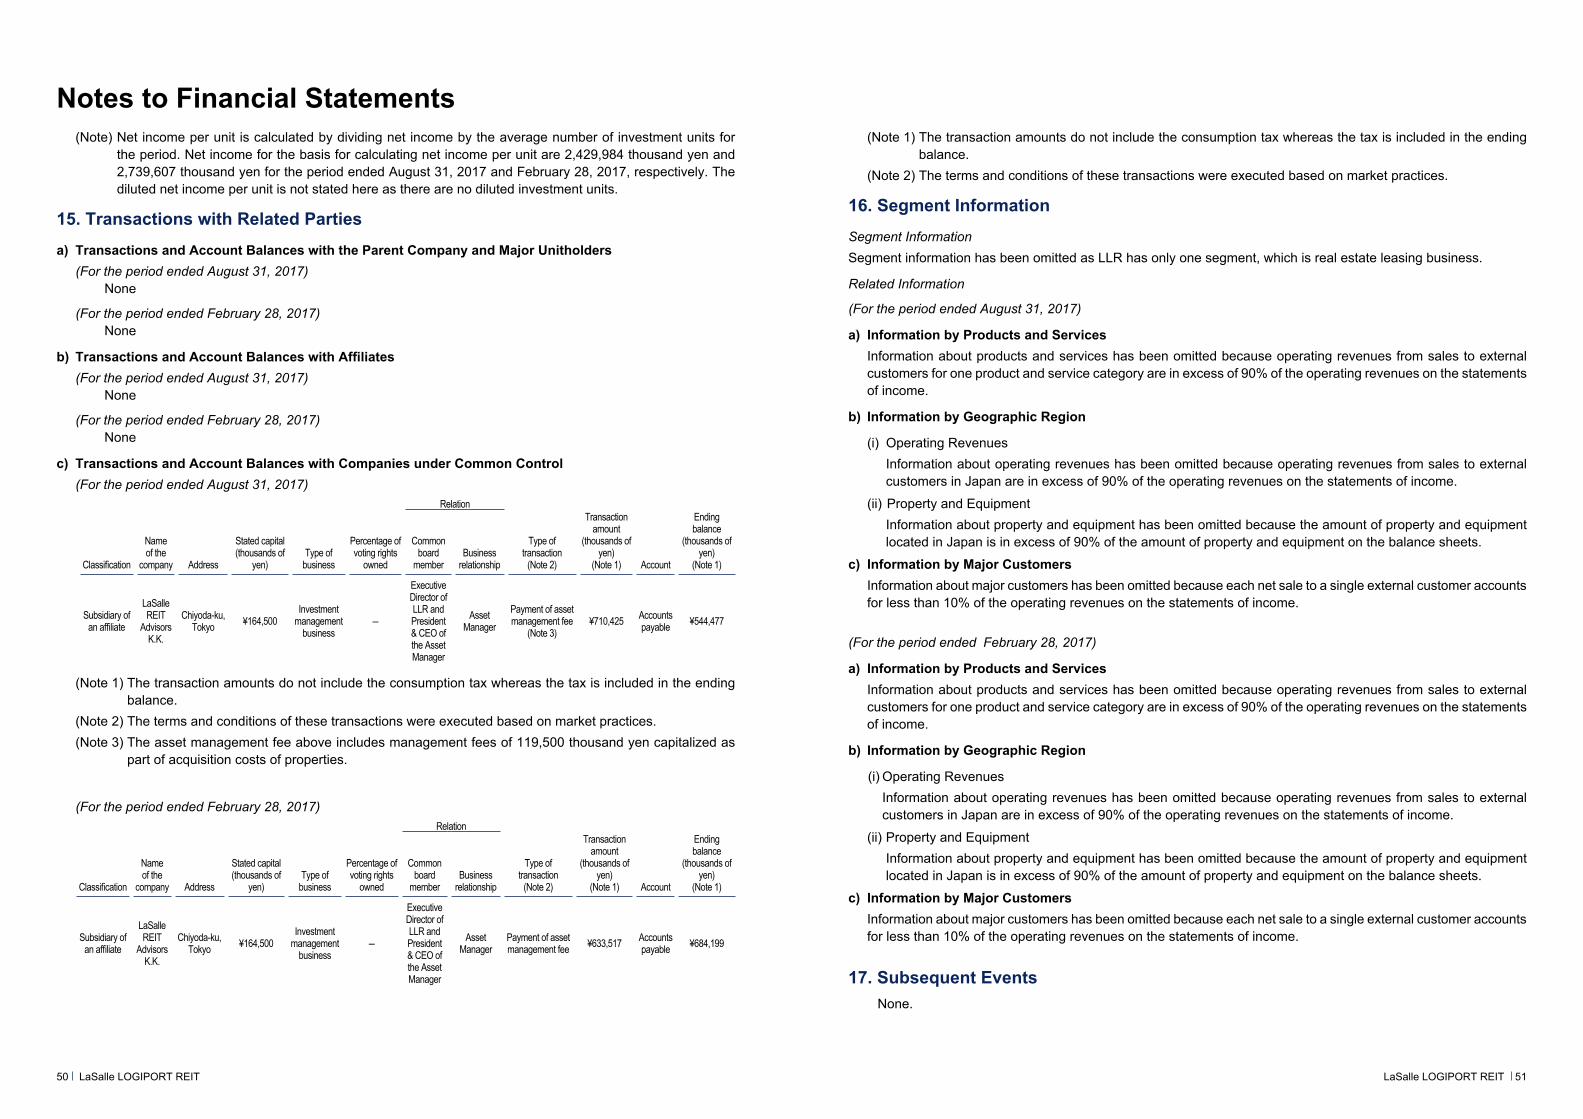
Notes to Financial Statements(Note 1) The transaction amounts do not include the consumption tax whereas the tax is included in the ending
balance.(Note 2) The terms and conditions of these transactions were executed based on market practices.
16. Segment InformationSegment InformationSegment information has been omitted as LLR has only one segment, which is real estate leasing business.
Related Information
(For the period ended August 31, 2017)
a) Information by Products and ServicesInformation about products and services has been omitted because operating revenues from sales to external customers for one product and service category are in excess of 90% of the operating revenues on the statements of income.
b) Information by Geographic Region
(i) Operating Revenues Information about operating revenues has been omitted because operating revenues from sales to external customers in Japan are in excess of 90% of the operating revenues on the statements of income.
(ii) Property and Equipment Information about property and equipment has been omitted because the amount of property and equipment located in Japan is in excess of 90% of the amount of property and equipment on the balance sheets.
c) Information by Major CustomersInformation about major customers has been omitted because each net sale to a single external customer accounts for less than 10% of the operating revenues on the statements of income.
(For the period ended February 28, 2017)
a) Information by Products and ServicesInformation about products and services has been omitted because operating revenues from sales to external customers for one product and service category are in excess of 90% of the operating revenues on the statements of income.
b) Information by Geographic Region
(i) Operating RevenuesInformation about operating revenues has been omitted because operating revenues from sales to external customers in Japan are in excess of 90% of the operating revenues on the statements of income.
(ii) Property and Equipment Information about property and equipment has been omitted because the amount of property and equipment located in Japan is in excess of 90% of the amount of property and equipment on the balance sheets.
c) Information by Major CustomersInformation about major customers has been omitted because each net sale to a single external customer accounts for less than 10% of the operating revenues on the statements of income.
17. Subsequent Events None.
(Note) Net income per unit is calculated by dividing net income by the average number of investment units for the period. Net income for the basis for calculating net income per unit are 2,429,984 thousand yen and 2,739,607 thousand yen for the period ended August 31, 2017 and February 28, 2017, respectively. The diluted net income per unit is not stated here as there are no diluted investment units.
15. Transactions with Related Partiesa) Transactions and Account Balances with the Parent Company and Major Unitholders
(For the period ended August 31, 2017) None
(For the period ended February 28, 2017) None
b) Transactions and Account Balances with Affiliates(For the period ended August 31, 2017)
None
(For the period ended February 28, 2017) None
c) Transactions and Account Balances with Companies under Common Control(For the period ended August 31, 2017)
Relation
Classification
Name of the
company Address
Stated capital(thousands of
yen) Type of
business
Percentage of voting rights
owned
Common board
memberBusiness
relationship
Type of transaction
(Note 2)
Transaction amount
(thousands of yen)
(Note 1) Account
Ending balance
(thousands of yen)
(Note 1)
Subsidiary of an affiliate
LaSalle REIT
Advisors K.K.
Chiyoda-ku, Tokyo ¥164,500
Investment management
business–
Executive Director of LLR and President & CEO of the Asset Manager
Asset Manager
Payment of asset management fee
(Note 3)¥710,425 Accounts
payable ¥544,477
(Note 1) The transaction amounts do not include the consumption tax whereas the tax is included in the ending balance.
(Note 2) The terms and conditions of these transactions were executed based on market practices.(Note 3) The asset management fee above includes management fees of 119,500 thousand yen capitalized as
part of acquisition costs of properties.
(For the period ended February 28, 2017)Relation
Classification
Name of the
company Address
Stated capital(thousands of
yen) Type of
business
Percentage of voting rights
owned
Common board
memberBusiness
relationship
Type of transaction
(Note 2)
Transaction amount
(thousands of yen)
(Note 1) Account
Ending balance
(thousands of yen)
(Note 1)
Subsidiary of an affiliate
LaSalle REIT
Advisors K.K.
Chiyoda-ku, Tokyo ¥164,500
Investment management
business–
Executive Director of LLR and President & CEO of the Asset Manager
Asset Manager
Payment of asset management fee ¥633,517 Accounts
payable ¥684,199
50 51LaSalle LOGIPORT REIT LaSalle LOGIPORT REIT
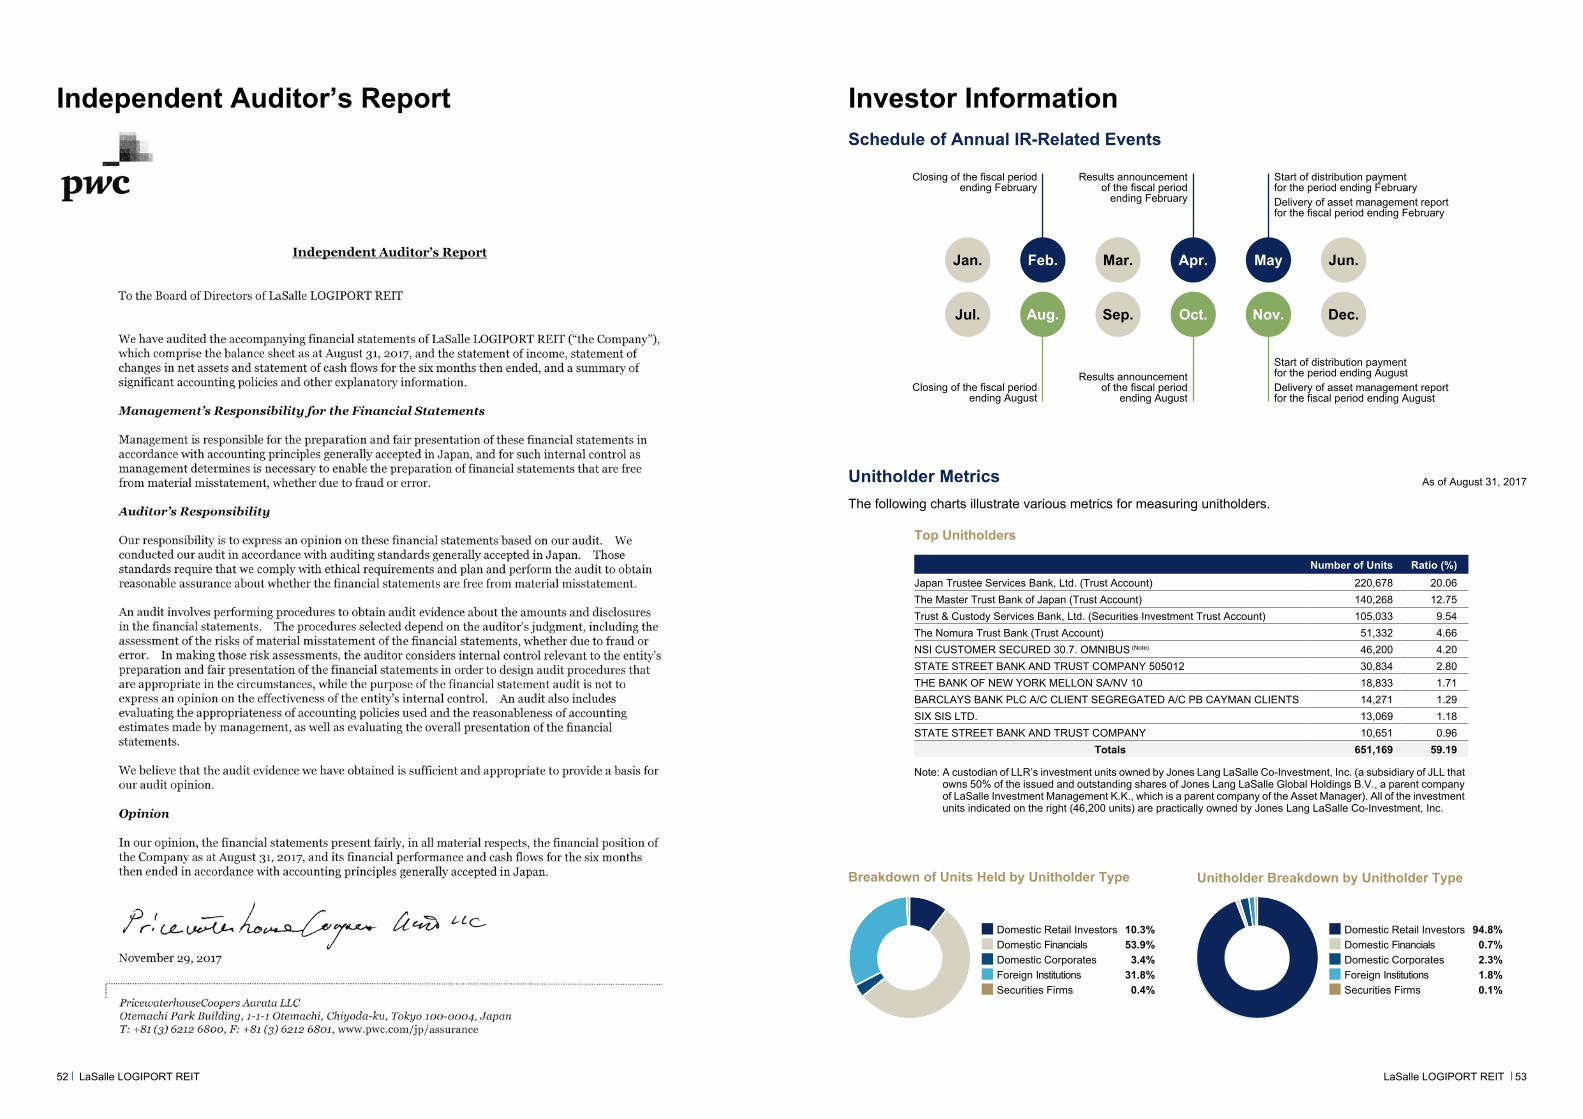
Investor InformationSchedule of Annual IR-Related Events
Jan. Feb. Mar. Jun.Apr. May
Jul. Aug. Sep. Oct. Nov. Dec.
Start of distribution payment for the period ending FebruaryDelivery of asset management report for the fiscal period ending February
Results announcement of the fiscal period
ending August
Closing of the fiscal period ending February
Closing of the fiscal period ending August
Results announcement of the fiscal period
ending February
Start of distribution payment for the period ending AugustDelivery of asset management report for the fiscal period ending August
Breakdown of Units Held by Unitholder Type Unitholder Breakdown by Unitholder Type
Independent Auditor’s Report
Unitholder MetricsThe following charts illustrate various metrics for measuring unitholders.
As of August 31, 2017
Top Unitholders
Number of Units Ratio (%)Japan Trustee Services Bank, Ltd. (Trust Account) 220,678 20.06The Master Trust Bank of Japan (Trust Account) 140,268 12.75Trust & Custody Services Bank, Ltd. (Securities Investment Trust Account) 105,033 9.54The Nomura Trust Bank (Trust Account) 51,332 4.66NSI CUSTOMER SECURED 30.7. OMNIBUS (Note) 46,200 4.20STATE STREET BANK AND TRUST COMPANY 505012 30,834 2.80THE BANK OF NEW YORK MELLON SA/NV 10 18,833 1.71BARCLAYS BANK PLC A/C CLIENT SEGREGATED A/C PB CAYMAN CLIENTS 14,271 1.29SIX SIS LTD. 13,069 1.18STATE STREET BANK AND TRUST COMPANY 10,651 0.96
Totals 651,169 59.19
Note: A custodian of LLR’s investment units owned by Jones Lang LaSalle Co-Investment, Inc. (a subsidiary of JLL that owns 50% of the issued and outstanding shares of Jones Lang LaSalle Global Holdings B.V., a parent company of LaSalle Investment Management K.K., which is a parent company of the Asset Manager). All of the investment units indicated on the right (46,200 units) are practically owned by Jones Lang LaSalle Co-Investment, Inc.
Domestic Retail Investors 10.3%Domestic Financials 53.9%Domestic Corporates 3.4%Foreign Institutions 31.8%Securities Firms 0.4%
Domestic Retail Investors 94.8%Domestic Financials 0.7%Domestic Corporates 2.3%Foreign Institutions 1.8%Securities Firms 0.1%
52 53LaSalle LOGIPORT REIT LaSalle LOGIPORT REIT