Embed Size (px)
Citation preview

3rd Quarter 2005Results
November 17, 2005

1
Sales (in Mio Euro)
749 868
849
797
953
1,006
9m'05 9m'04
-15.6%
-13.7%
Q2
Q1
2,395
2,827-15.3%
Organic growth*
682 702
789 784
722 741
9m'05 9m'04
2,227
-2.8% Q1
Q3
-1.5%
+0.6%
2,193
Total sales
* at constant exchange rates
-16.4%
-2.6%
Q2
Q3

2
Profit and Loss: Key Figures (in Mio Euro)
Q1 '05 Q2 '05 Q3 '05 9m '05 9m '04 % change
Sales 749 849 797 2,395 2,827 -15.3%
Gross Profit 284 316 273 873 1,155 -24.4%
Gross Profit Margin 37.9% 37.2% 34.3% 36.5% 40.9%
Comparison with previous year difficult because of many changes inportfolio: divestitures of Consumer Imaging and Monotype, acquisitionsof Lastra, SOL, GWI and Heartlab
Gross Profit Margin affected by high raw material costs and price erosion
3
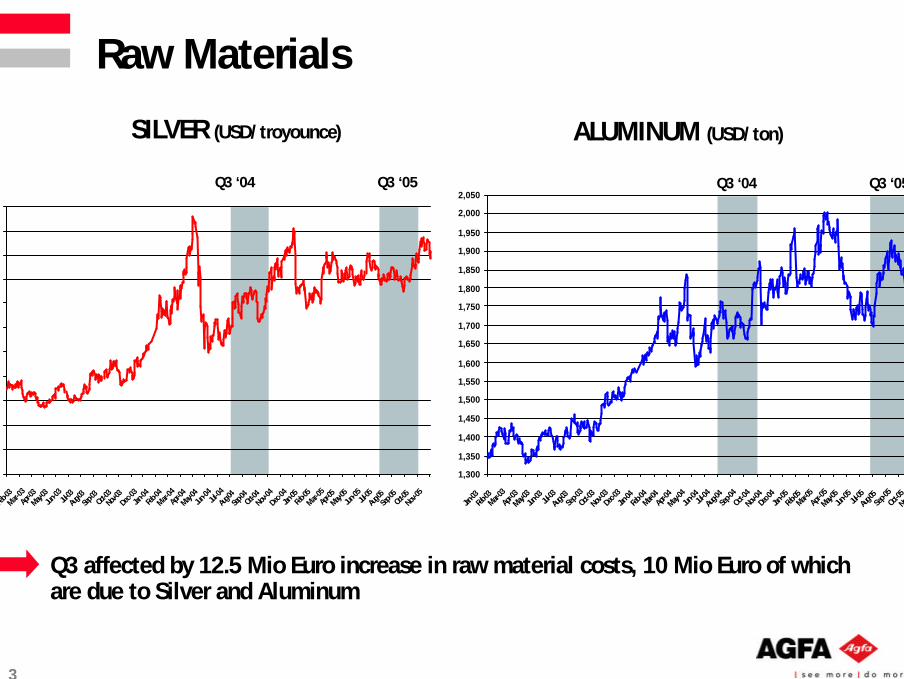
Raw Materials
SILVER (USD/troyounce) ALUMINUM (USD/ton)
Q3 ‘04 Q3 ‘05 Q3 ‘04 Q3 ‘05
1,300
1,350
1,400
1,450
1,500
1,550
1,600
1,650
1,700
1,750
1,800
1,850
1,900
1,950
2,000
2,050
Jan-03
Feb-03
Mar-03
Apr-0
3May-
03Jun
-03 Jul-03Aug
-03Sep
-03Oc
t-03Nov-
03De
c-03Jan
-04Feb
-04Mar-0
4Ap
r-04May-
04Jun
-04Jul-04
Aug-0
4Sep
-04Oct-
04No
v-04De
c-04Jan
-05Feb
-05Mar-0
5Apr-
05
May-05
Jun-05 Jul-
05Aug
-05Sep
-05Oc
t-05No
v-05
3.00
3.50
4.00
4.50
5.00
5.50
6.00
6.50
7.00
7.50
8.00
8.50
Jan-03
Feb-03
Mar-03Ap
r-03May-
03Jun
-03 Jul-03Aug
-03Sep
-03Oct
-03No
v-03Dec-
03Jan
-04Feb
-04Mar-
04Ap
r-04May-
04Jun
-04Jul-04
Aug-04
Sep-04
Oct-04
Nov-04
Dec-04Jan
-05Feb
-05Mar-
05Ap
r-05May-
05Jun
-05Jul-05Aug
-05Sep
-05Oct
-05Nov-
05
Q3 affected by 12.5 Mio Euro increase in raw material costs, 10 Mio Euro of whichare due to Silver and Aluminum

4
Impact of AgfaPhoto Insolvency
l The AgfaPhoto operating entity filed for insolvency on May26th, 2005
l In October 2005, the receiver of AgfaPhoto decided to liquidatethe whole Group, after sale of assets
l Agfa decided to book a provision of 55 mio Euro in Q3 to coverl environmental clean-up costs
l other claims and possible losses
l Agfa also decided to reverse 54 mio Euro of the deferred taxassets related to the CI divestiture
l due to the liquidation of AgfaPhoto, tax losses can only be usedlater than anticipated
l No cash impact

5
Q1 '05 Q2 '05 Q3 '05 9m '05 9m '04 % change
Gross profit 284 316 273 873 1,155 -24.4%
R&D -47 -48 -48 -143 -148 -3.4%
SG&A -197 -211 -193 -601 -738 -18.6%
Other operating items* 1 -3 6 4 -56
EBIT** 41 54 38 133 213 -37.6%
Restructuring charges 1 -6 -19 -24 -53 -54.7%
AgfaPhoto provision - - -55 -55 -430 -87.2%
Operating result 42 48 -36 54 -270 120.0%
Profit and Loss: Key Figures (in Mio Euro)
Quarter sequentially, SG&A expenses decrease by 18 Mio Euro
* 2004 other operating items include goodwill amortizations** before restructuring charges and non recurrent items
6
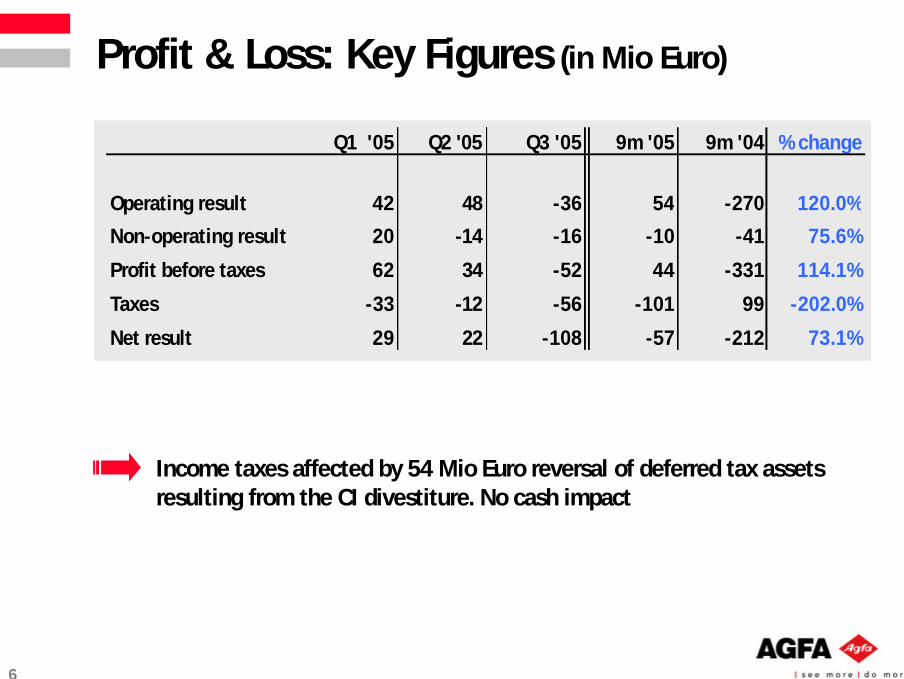
Profit & Loss: Key Figures (in Mio Euro)
Income taxes affected by 54 Mio Euro reversal of deferred tax assetsresulting from the CI divestiture. No cash impact
Q1 '05 Q2 '05 Q3 '05 9m '05 9m '04 % change
Operating result 42 48 -36 54 -270 120.0%
Non-operating result 20 -14 -16 -10 -41 75.6%
Profit before taxes 62 34 -52 44 -331 114.1%
Taxes -33 -12 -56 -101 99 -202.0%
Net result 29 22 -108 -57 -212 73.1%

7
Graphic Systems Sales (in Mio Euro)
Continued strong organic growth in Q3
400 386
422406
446 413
9m'05 9m'04
+8.0%
+3.6%
Q3
Q1
1,2681,205
+5.2%
368 375
419 399
391 379
9m'05 9m'04
1,153
-1.9% Q1
Q2
+2.2%
+5.0%
1,178
* at constant exchange rates
Organic growth*Total sales
Q2
+3.2%+3.9%
Q3
8
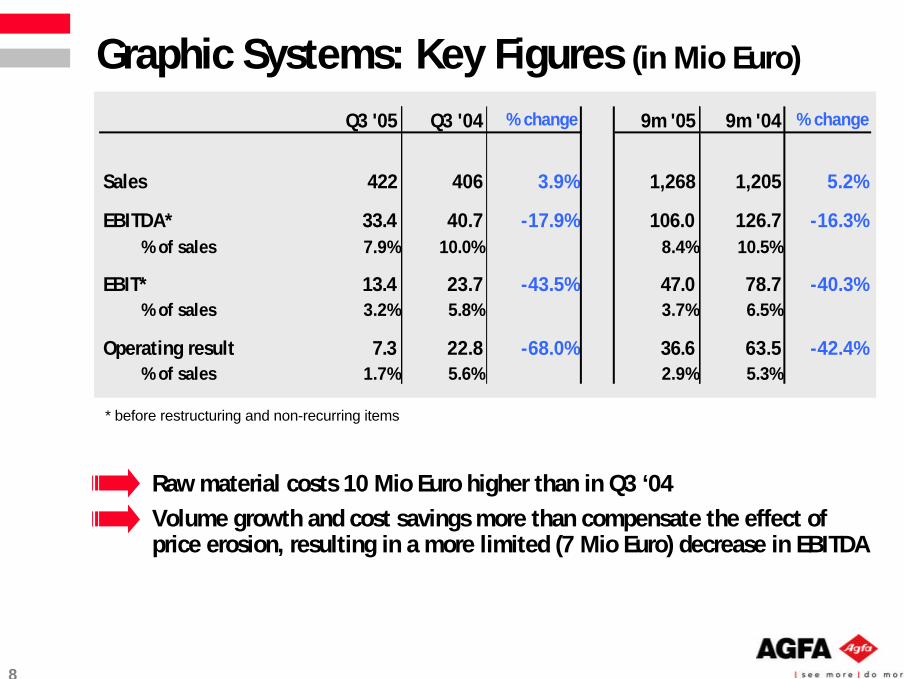
Graphic Systems: Key Figures (in Mio Euro)
* before restructuring and non-recurring items
Q3 '05 Q3 '04 % change 9m '05 9m '04 % change
Sales 422 406 3.9% 1,268 1,205 5.2%
EBITDA* 33.4 40.7 -17.9% 106.0 126.7 -16.3% % of sales 7.9% 10.0% 8.4% 10.5%
EBIT* 13.4 23.7 -43.5% 47.0 78.7 -40.3% % of sales 3.2% 5.8% 3.7% 6.5%
Operating result 7.3 22.8 -68.0% 36.6 63.5 -42.4% % of sales 1.7% 5.6% 2.9% 5.3%
Raw material costs 10 Mio Euro higher than in Q3 ‘04Volume growth and cost savings more than compensate the effect ofprice erosion, resulting in a more limited (7 Mio Euro) decrease in EBITDA
9
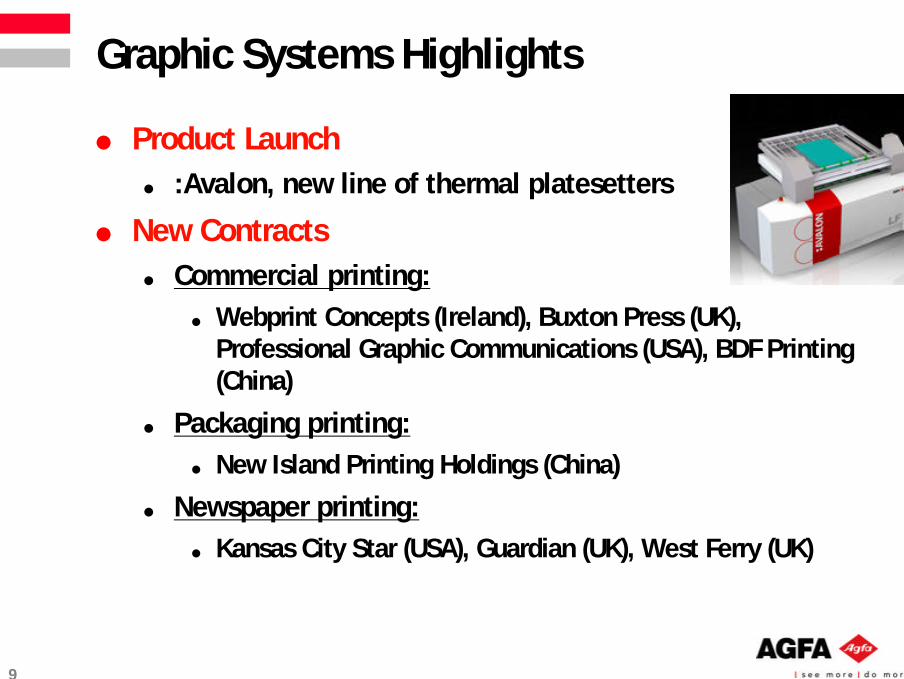
Graphic Systems Highlights
l Product Launchl :Avalon, new line of thermal platesetters
l New Contractsl Commercial printing:
l Webprint Concepts (Ireland), Buxton Press (UK),Professional Graphic Communications (USA), BDF Printing(China)
l Packaging printing:l New Island Printing Holdings (China)
l Newspaper printing:l Kansas City Star (USA), Guardian (UK), West Ferry (UK)

10
Graphic Systems Highlights
l New Contractsl New York Times Company:
l Agfa becomes The NYT Company’s preferredprepress supplier in 5-year strategic alliance
l workflow solutions (:Arkitex)
l violet CtP equipment (:Advantages)
l Expansion of 3-year alliance onconsumables
l Covers all the NYT Company’s newspaperproperties (18), including The New YorkTimes, International Herald Tribune, TheBoston Globe, and The Regional MediaGroup

11
Graphic Systems Highlights
l Milestonesl Sales expectations Print 05 Chicago
largely exceeded
l Over 1,000 customers around the worldare using Agfa's advanced :Sublima XMscreening solution
l 300 printers worldwide turn to Agfa forchemistry-free prepress plate system

12
HealthCare Sales (in Mio Euro)
Sales affected by weak trading environment and higher than expectedprice erosion
305 292
334 331
359 356
9m'05 9m'04
+0.8%
+4.5%
Q2
Q1
998 979+1.9%
277 292
332 356
294331
9m'05 9m'04
979
-5.1% Q1
Q2
-7.8%
-6.7%
903
* at constant exchange rates
Organic growth*Total sales
Q3 Q3
+0.9%-11.2%

13
HealthCare: Key Figures (in Mio Euro)
Results affected by price erosion, higher raw material costs and weakertrading environment in film and printOperating expenses lower
* before restructuring and non-recurring items
Q3 '05 Q3 '04 % change 9m '05 9m '04 % change
Sales 334 331 0.9% 998 979 1.9%
EBITDA* 39.2 72.9 -46.2% 136.7 208.1 -34.3% % of sales 11.7% 22.0% 13.7% 21.3%
EBIT* 22.2 51.9 -57.2% 80.7 149.1 -45.9% % of sales 6.6% 15.7% 8.1% 15.2%
Operating result 12.2 46.8 -73.9% 72.4 136.9 -47.1% % of sales 3.7% 14.1% 7.3% 14.0%

14
Service Revenues as % of HealthCare Sales
10.9% 11.7%14.0%
16.8%
23.3%
30.0%
2001 2002 2003 2004 9m '05 Target
Service revenues represent an increasing share of sales

15
HealthCare Highlights
l Product Launchesl Introduction new cardiology portfolio
in Europe, including the Agfa HeartlabCardiovascular Information System
l DX-S: revolutionary CR digitizer,combining:
l flexibility and cost effectiveness ofCR
l image quality comparable to DR
l high productivity
16
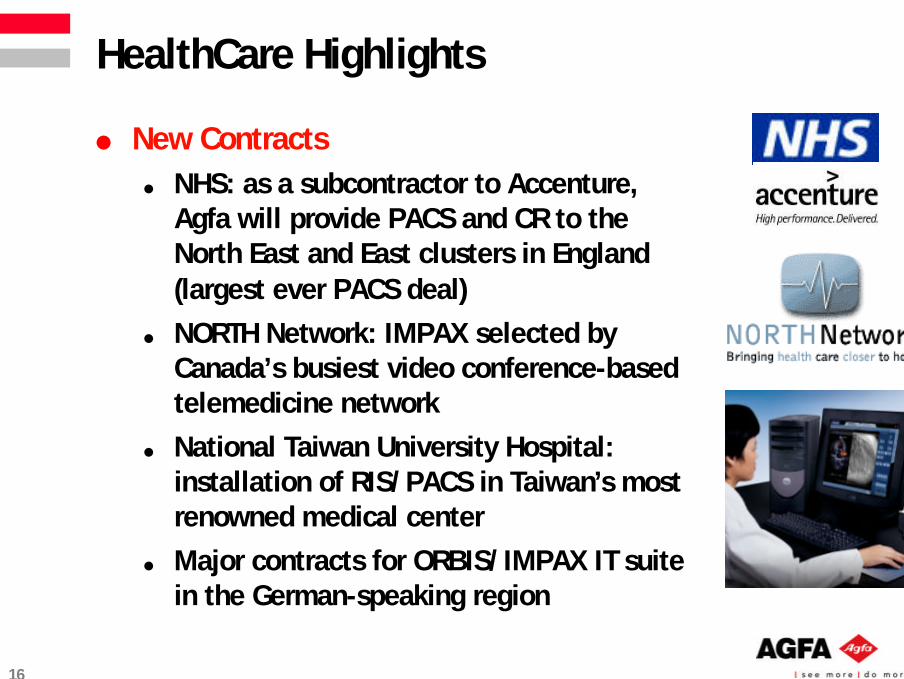
l New Contractsl NHS: as a subcontractor to Accenture,
Agfa will provide PACS and CR to theNorth East and East clusters in England(largest ever PACS deal)
l NORTH Network: IMPAX selected byCanada’s busiest video conference-basedtelemedicine network
l National Taiwan University Hospital:installation of RIS/PACS in Taiwan’s mostrenowned medical center
l Major contracts for ORBIS/IMPAX IT suitein the German-speaking region
HealthCare Highlights

17
l New Contractl Thales Security Systems: Agfa will
provide a complete sub-systemconsisting of equipment, consumablesand materials for the production ofabout 20 million e-ID cards for theMoroccan government
l Also addresses the market of companysecurity systems, including the use ofAgfa’s inkjet technology
Specialty Products

18
Balance Sheet: Key Figures (in Mio Euro)
Total assets increased by more than 600 million Euro, due toconsolidation of GWI and Heartlab
313 310
2,128 2,035
1,569
1,011
981 1,082
3,0292,274
Non-currentassets
Currentassets
Otherassets
Liabilities
Equity
Sept. ‘05
4,0104,010
3,356
Dec. ‘04 Dec. ‘04
LIABILITIESASSETS
Sept. ‘05
3,356

19
576660
231 223
0
200
400
600
800
1000
1200
1400
Sept. '03 Sept. '04 Dec. '04 Sept. '05
131119
107116
369 3684850
0
200
400
600
800
1000
1200
1400
Sept. '03 Sept. '04 Dec. '04 Sept. '05
435 1
68 64
744813225 204
0
200
400
600
800
1000
1200
1400
Sept. '03 Sept. '04 Dec. '04 Sept. '05
8 2 83 8 292
Working Capital: Key Figures (in Mio Euro/days)
INVENTORIESTarget: 100 days
TRADE RECEIVABLESTarget: 70 days
TRADE PAYABLESTarget: 55 days
CI inventories
919
CI receivables CI payables
872 890 874
330277
Compared to Sept. 2004, modest improvement of days of inventories
Days of sales outstanding increased to 92 days
Target for days of trade payables largely exceeded

20
66.5%
41.4%
17.8%
56.0%
17.0%
75.9%74.0%
Dec.'01
Dec.'02
Dec.'03
Dec.'04
March'05
June'05
Sept.'05
Balance Sheet: Key FiguresGEARING RATIO (%)
745
193
Sept. '05 Dec. '04
NET FINANCIAL DEBT (in Mio Euro)
Net financial debt increased mainly due to acquisition of GWI and Heartlab,the dividend payment, the phase out of the securitization of receivables,and the seasonality of working capital

21
Cash Flow: Key Figures (in Mio Euro)
-114
-6
31
-89
Q1 '05 Q2 '05 Q3 '05 9m '05
FREE CASH FLOWNET OPERATING CASH FLOW
Net operating cash flow affected by phase out of securitization ofreceivables (60 Mio Euro) in Q1 and by seasonal build-up of workingcapital
-91
-18
Q1 '05 Q2' 05 9m '05
18
Q3 '05
55
22
Outlook
l Firm indications for a strong year-end
l Strong focus on cost reduction and price erosionremains
l Continue to develop the new businesses of IndustrialInkjet and HealthCare IT

Questions &Answers