Embed Size (px)
Citation preview

TOMRA Systems ASA
22 October 2021© TOMRA
3rd quarter 2021results announcement

HIGHLIGHTS FROM THE QUARTER
2

Key financial highlights
3
Revenues
Gross margin
Operating expenses
EBITA
• Revenues of 2,883 MNOK (2,578 MNOK in third quarter 2020)Adjusted for currency, revenues were:- Up 15% for TOMRA Group- Up 21% in TOMRA Collection- Up 21% in TOMRA Recycling Mining- Up 3% in TOMRA Food
• EBITA of 529 MNOK – up from 501 MNOK in third quarter 2020
Order intake • Order intake 1,359 MNOK in TOMRA Recycling Mining and TOMRA Food- Up 35% compared to third quarter 2020 adjusted for currencies- Positive momentum in all divisions and segments- Order backlog of 2,022 MNOK, up 42% currency adjusted compared to end of third quarter 2020
Cash flow • Cash flow from operations of 596 MNOK – compared to 432 MNOK in third quarter 2020
Other • COVID-19: Still some impact, mainly in TOMRA Food, primarily regarding meeting new customers and cross-border travel• Component shortage is overall under control, but represents a risk
• Gross margin 44% (down from 46% in third quarter 2020)- All divisions slightly down (compared to a strong third quarter 2020)
• Operating expenses of 748 MNOK (676 MNOK in third quarter 2020)- Increased activity level and investments in future-oriented activities

Update on new deposit markets(according to official government statements)
Business update for TOMRA Collection
4
High activity level in the markets
1) https://www.minzp.sk/aktuality/milnik-priprave-zalohoveho-systemu-minister-budaj-predstavil-spravcu-ktory-zavedie-system-zalohovania-pet-flias.html2) https://www.diena.lv/raksts/latvija/zinas/parakstits-ligums-par-atkritumu-depozita-sistemas-ieviesanu-latvija-142552773) https://nos.nl/artikel/2367153-kogel-door-de-kerk-per-31-december-2022-statiegeld-op-blikjes.html
4) https://legeaz.net/monitorul-oficial-955-2021/hg-1074-2021-sistem-garantie-returnare-ambalaje-nereutilizabile5) https://www.premier.vic.gov.au/victoria-set-deliver-cash-cans6) https://www.cga.ct.gov/asp/cgabillstatus/cgabillstatus.asp?selBillType=Bill&bill_num=SB01037&which_year=2021
Latvia – February 2022‒ Latvia introduces a deposit system starting February 1st, 20222).
TOMRA has been selected as reverse vending technology provider.
The Netherlands – December 2022 (expansion)‒ In February 2021, the decision of deposit introduction on cans
was announced3) with start date on December 31st, 2022.
Slovakia – January 2022‒ In September 2020, Slovakia announced implementation of a
deposit system on beverage packaging as of January 1st, 20221).
Scotland – July 2022 (potential delay to 2023)‒ In May 2020, the Scottish Parliament approved DRS regulations
with the commencement date on July 1st, 2022.
Victoria – 2023‒ In April 20215), the government of Victoria announced deposit
introduction with a split responsibility model in 2023.
TOMRA Collection business update
‒ Growth of 38% in Europe compared to third quarter 2020‒ Continued good momentum in Germany‒ Good growth in the Nordics, partly driven by the R1 machine‒ Sales and installations ongoing in Slovakia‒ Temporary lockdown in Australia had a negative effect on the revenues
Connecticut – January 2023 and 2024 (expansion)‒ In June 20216), Connecticut expands deposit to most carbonated
beverages (from 2023) and raises the deposit value from 5 cents to 10 cents (from 2024).
Tesco has selected TOMRA as the supplier of RVMs in Slovakia
TOMRA secures contract with major grocery retailer in Scotland
The R1 machine launched in Denmark and Germany (https://r1.tomra.com/)
First installations in Latvia, preparations on track for go-live in 2022
Romania – 2022/2023‒ In October 2021, Romania passes the government decision4) for
implementing a deposit system in late 2022. Current politicalinstability presents a challenge to the implementation timeline.
Business update for TOMRA Recycling Mining
5
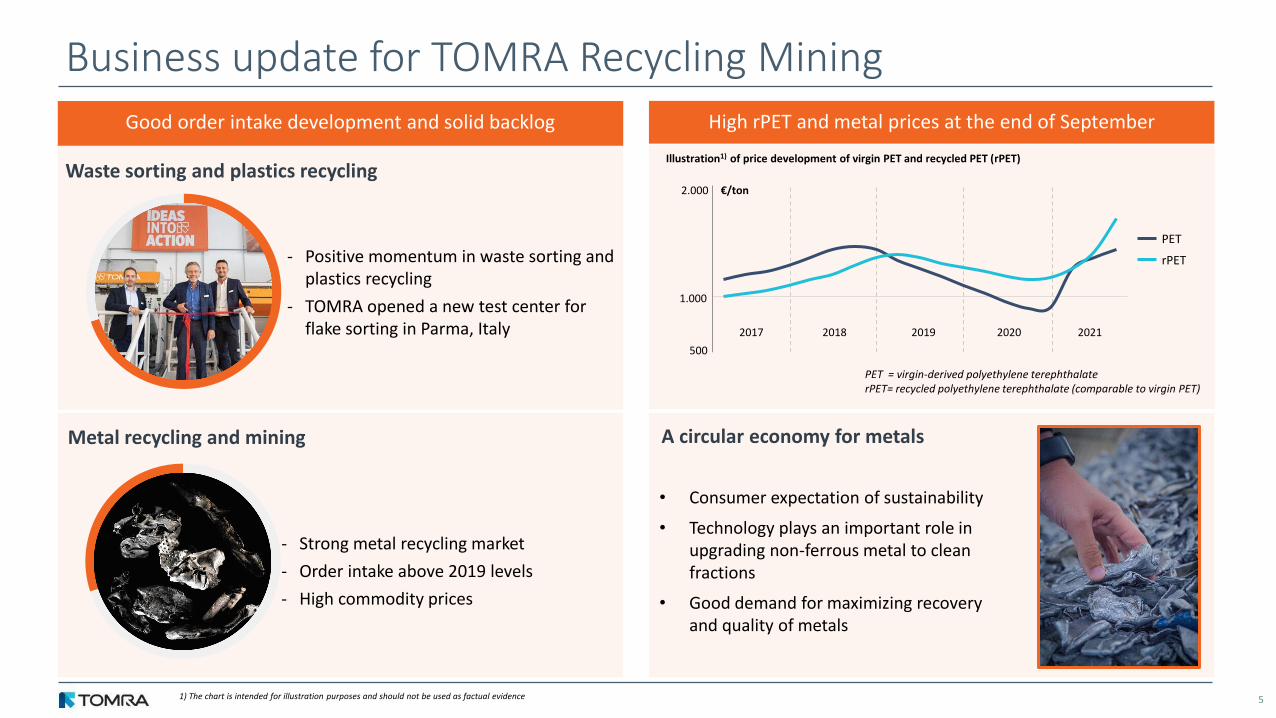
Good order intake development and solid backlog High rPET and metal prices at the end of September
PET
rPET
2017 2018 2019 2020
2.000 €/ton
500
1.000
- Positive momentum in waste sorting and plastics recycling
- TOMRA opened a new test center for flake sorting in Parma, Italy
Waste sorting and plastics recycling
Metal recycling and mining
- Strong metal recycling market
- Order intake above 2019 levels
- High commodity prices
Illustration1) of price development of virgin PET and recycled PET (rPET)
1) The chart is intended for illustration purposes and should not be used as factual evidence
PET = virgin-derived polyethylene terephthalaterPET= recycled polyethylene terephthalate (comparable to virgin PET)
2021
A circular economy for metals
• Consumer expectation of sustainability
• Technology plays an important role in upgrading non-ferrous metal to clean fractions
• Good demand for maximizing recovery and quality of metals
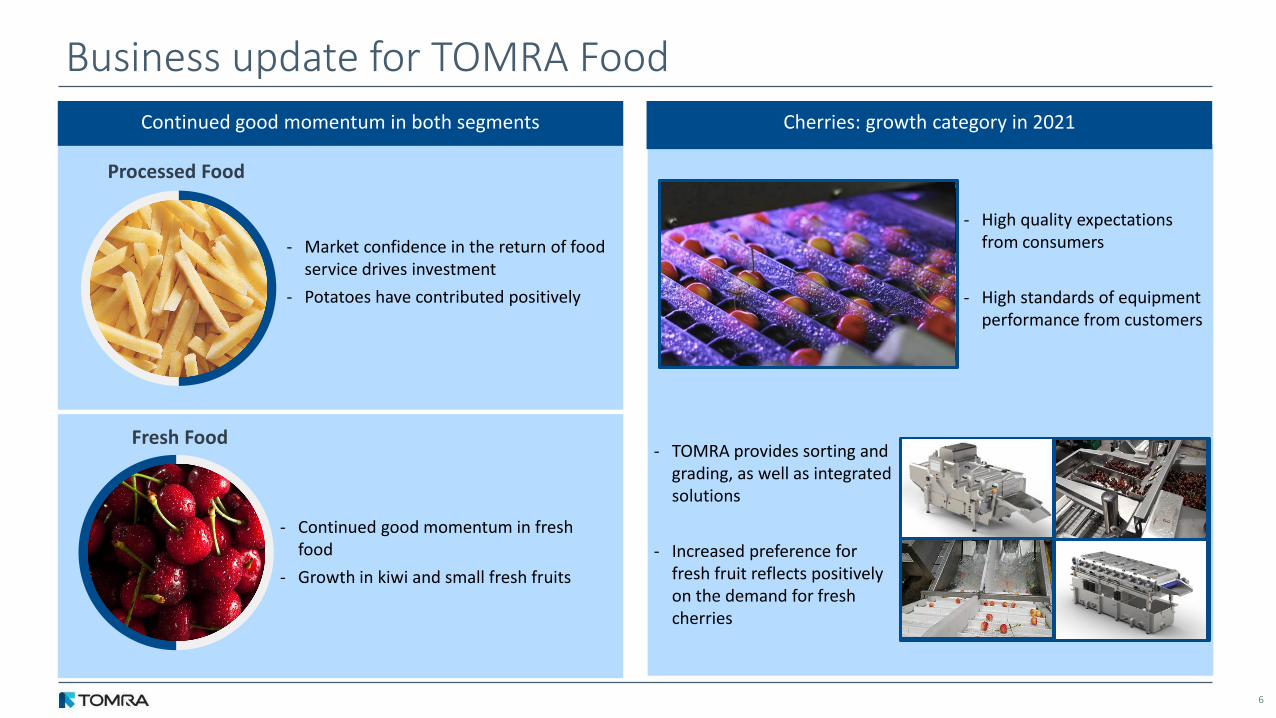
Business update for TOMRA Food
6
Continued good momentum in both segments
- Market confidence in the return of food service drives investment
- Potatoes have contributed positively
- Continued good momentum in fresh food
- Growth in kiwi and small fresh fruits
Fresh Food
Processed Food
Cherries: growth category in 2021
- High quality expectations from consumers
- High standards of equipment performance from customers
- TOMRA provides sorting and grading, as well as integrated solutions
- Increased preference for fresh fruit reflects positively on the demand for fresh cherries

FINANCIALS AND OUTLOOK
7

85
87
89
91
93
95
97
99
101
103
105
jul. 20 okt. 20 jan. 21 apr. 21 jul. 21 okt. 21EUR USD
Currency risk and hedging policy
EUR¹ USD NOK OTHER² TOTAL
Assets 45 % 15 % 10 % 30 % 100 %
Liabilities 55 % 15 % 10 % 20 % 100 %
8
Assets and liabilities per currency:
NOTE: Estimated and rounded figures¹ EUR includes DKK
Revenues Expenses EBITA
EUR* 4.5% 4.0% 7.0%
USD 3.5% 2.5% 8.0%
OTHER2 2.0% 3.0% -4.0%
ALL 10.0% 9.5% 11.0%
10% change in NOK towards other currencies will impact:
HEDGING POLICY
CASHFLOW AND P/L
• TOMRA can hedge up to one year of future predicted cash flows. Gains and losses on these hedges are recorded at the finance line, not influencing EBITA
B/S
• TOMRA only hedges B/S items where exchange rate fluctuations could have P/L impact. Gains and losses on B/S hedging are recorded in accordance with IAS 21 and will normally not have P/L impact
EUR¹ USD NOK OTHER² TOTAL
Revenues 45 % 35 % 0 % 20 % 100 %
Expenses 40 % 25 % 5 % 30 % 100 %
Revenues and expenses per currency:
² Most important: AUD, NZD, RMB, CAD, SEK, GBP and JPY
*Average 3Q21 vs 3Q20Measured against NOK
-4.1%*
-3.2%*
3Q20 4Q20 1Q21 2Q21 3Q21
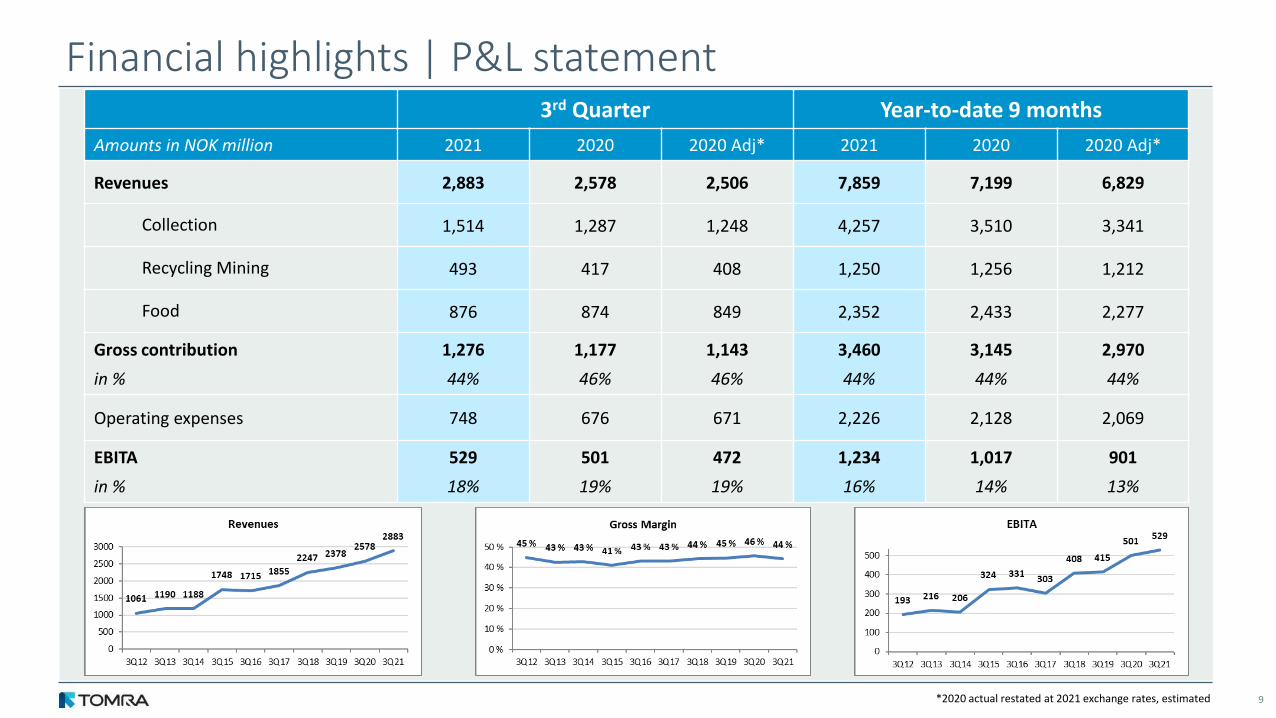
Financial highlights | P&L statement
9
3rd Quarter Year-to-date 9 months
Amounts in NOK million 2021 2020 2020 Adj* 2021 2020 2020 Adj*
Revenues 2,883 2,578 2,506 7,859 7,199 6,829
Collection 1,514 1,287 1,248 4,257 3,510 3,341
Recycling Mining 493 417 408 1,250 1,256 1,212
Food 876 874 849 2,352 2,433 2,277
Gross contribution
in %
1,276
44%
1,177
46%
1,143
46%
3,460
44%
3,145
44%
2,970
44%
Operating expenses 748 676 671 2,226 2,128 2,069
EBITA
in %
529
18%
501
19%
472
19%
1,234
16%
1,017
14%
901
13%
*2020 actual restated at 2021 exchange rates, estimated

TOMRA Collection financials
10
3rd Quarter Year-to-date 9 months
Amounts in NOK million 2021 2020 2020 Adj* 2021 2020 2020 Adj*
Revenues 1,514 1,287 1,249 4,257 3,510 3,341
Northern Europe 196 176 614 555
Europe (ex Northern) 712 481 1,934 1,315
North America 489 485 1,259 1,183
Rest of the world 117 145 450 457
Gross contribution
in %
644
43%
574
45%
556
45%
1,820
43%
1,444
41%
1,376
41%
Operating expenses 307 258 259 949 859 838
EBITA
in %
337
22%
316
25%
297
24%
871
20%
585
17%
538
16%
*2020 actual restated at 2021 exchange rates, estimated
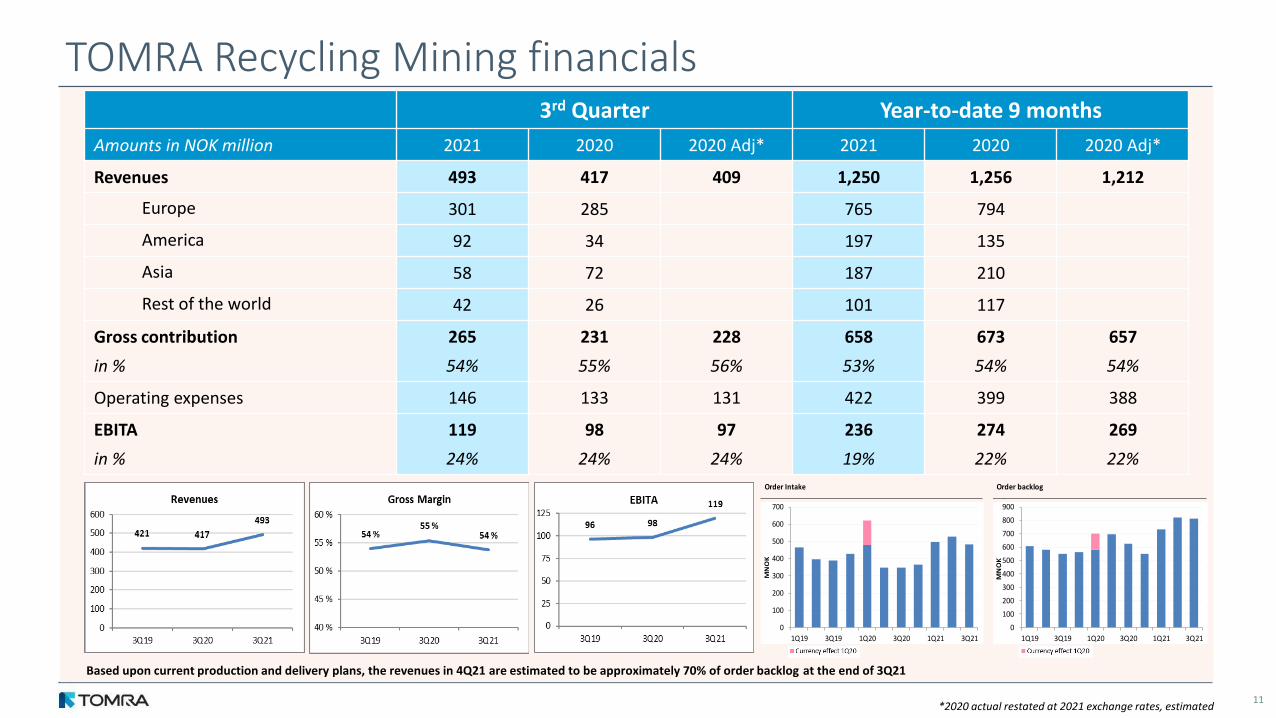
TOMRA Recycling Mining financials
11
3rd Quarter Year-to-date 9 months
Amounts in NOK million 2021 2020 2020 Adj* 2021 2020 2020 Adj*
Revenues 493 417 409 1,250 1,256 1,212
Europe 301 285 765 794
America 92 34 197 135
Asia 58 72 187 210
Rest of the world 42 26 101 117
Gross contribution
in %
265
54%
231
55%
228
56%
658
53%
673
54%
657
54%
Operating expenses 146 133 131 422 399 388
EBITA
in %
119
24%
98
24%
97
24%
236
19%
274
22%
269
22%
Based upon current production and delivery plans, the revenues in 4Q21 are estimated to be approximately 70% of order backlog at the end of 3Q21
*2020 actual restated at 2021 exchange rates, estimated
0
100
200
300
400
500
600
700
1Q19 3Q19 1Q20 3Q20 1Q21 3Q21
MN
OK
Order Intake Order backlog
0
100
200
300
400
500
600
700
800
900
1Q19 3Q19 1Q20 3Q20 1Q21 3Q21
MN
OK
Order backlog

TOMRA Food financials
12
3rd Quarter Year-to-date 9 months
Amounts in NOK million 2021 2020 2020 Adj* 2021 2020 2020 Adj*
Revenues 876 874 849 2,352 2,433 2,277
Europe 295 219 737 681
America 306 407 1,031 1,116
Asia 80 88 191 229
Rest of the world 195 160 393 407
Gross contribution
in %
367
42%
372
43%
359
42%
982
42%
1,028
42%
937
41%
Operating expenses 263 260 256 767 796 769
EBITA
in %
104
12%
112
13%
103
12%
215
9%
232
10%
167
7%
Based upon current production and delivery plans, the revenues in 4Q21 are estimated to be approximately 75% of order backlog at the end of 3Q21
*2020 actual restated at 2021 exchange rates, estimated
0
200
400
600
800
1000
1200
1Q19 3Q19 1Q20 3Q20 1Q21 3Q21
MN
OK
Order Intake
0
200
400
600
800
1000
1200
1400
1Q19 3Q19 1Q20 3Q20 1Q21 3Q21
MN
OK
Order backlog
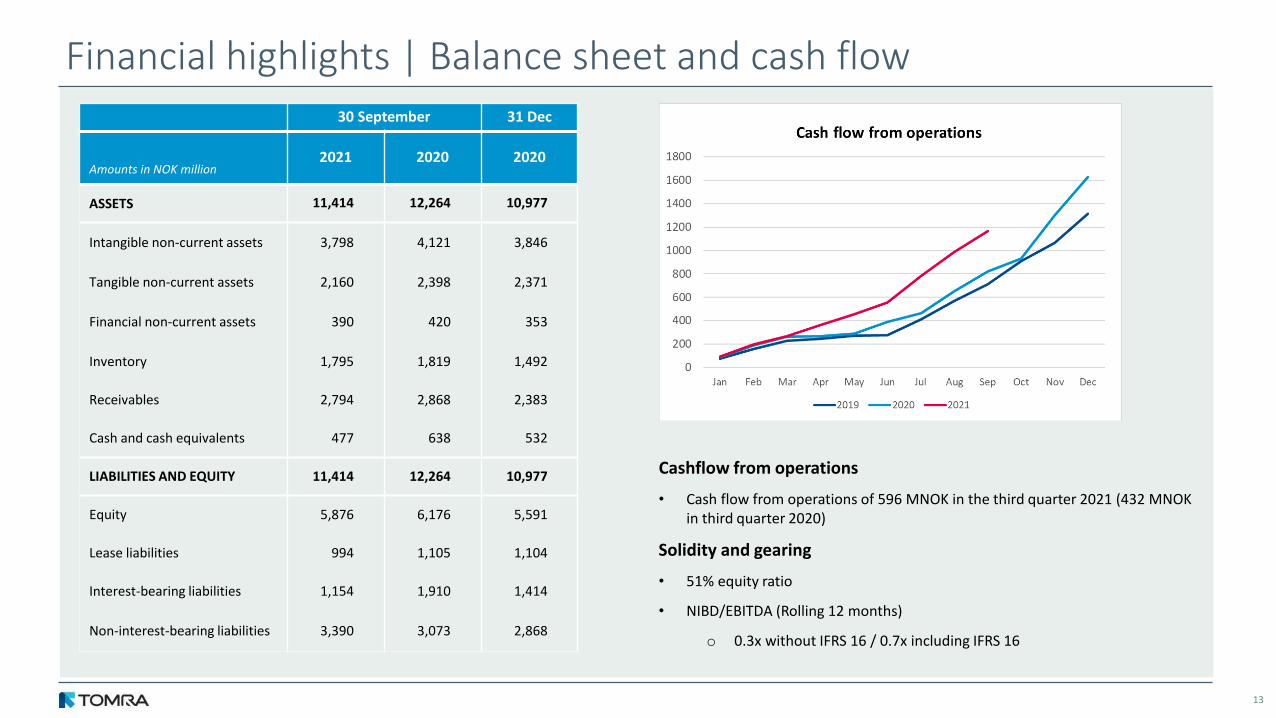
Financial highlights | Balance sheet and cash flow
13
30 September 31 Dec
Amounts in NOK million2021 2020 2020
ASSETS 11,414 12,264 10,977
Intangible non-current assets 3,798 4,121 3,846
Tangible non-current assets 2,160 2,398 2,371
Financial non-current assets 390 420 353
Inventory 1,795 1,819 1,492
Receivables 2,794 2,868 2,383
Cash and cash equivalents 477 638 532
LIABILITIES AND EQUITY 11,414 12,264 10,977
Equity 5,876 6,176 5,591
Lease liabilities 994 1,105 1,104
Interest-bearing liabilities 1,154 1,910 1,414
Non-interest-bearing liabilities 3,390 3,073 2,868
Cashflow from operations
• Cash flow from operations of 596 MNOK in the third quarter 2021 (432 MNOK in third quarter 2020)
Solidity and gearing
• 51% equity ratio
• NIBD/EBITDA (Rolling 12 months)
o 0.3x without IFRS 16 / 0.7x including IFRS 16
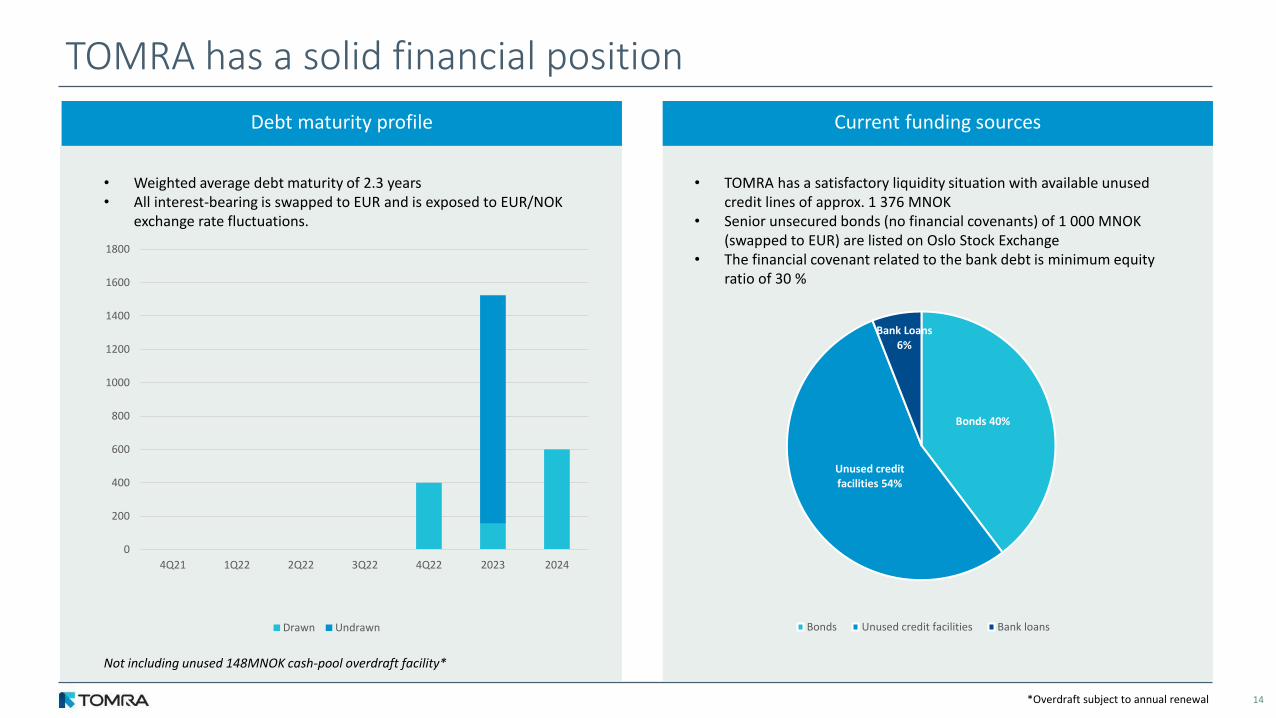
TOMRA has a solid financial position
14
• TOMRA has a satisfactory liquidity situation with available unused credit lines of approx. 1 376 MNOK
• Senior unsecured bonds (no financial covenants) of 1 000 MNOK (swapped to EUR) are listed on Oslo Stock Exchange
• The financial covenant related to the bank debt is minimum equity ratio of 30 %
Debt maturity profile Current funding sources
• Weighted average debt maturity of 2.3 years • All interest-bearing is swapped to EUR and is exposed to EUR/NOK
exchange rate fluctuations.
*Overdraft subject to annual renewal
Not including unused 148MNOK cash-pool overdraft facility*
Bonds 40%
Unused credit facilities 54%
Bank Loans6%
Bonds Unused credit facilities Bank loans
0
200
400
600
800
1000
1200
1400
1600
1800
4Q21 1Q22 2Q22 3Q22 4Q22 2023 2024
Drawn Undrawn

15
EU Taxonomy – preliminary1) assessment
60%
Collection and transport of non-hazardous waste in source segregated fractions
Climate change
mitigation
Manufacture of machinery enabling closed-loop systems, and high-quality wastecollection and waste management2)
Material recovery from non-hazardous waste
Transition to a
circular economy
OBJECTIVESACTIVITIESTOMRA
1) The assessment of Taxonomy-aligned activities is a preliminary indication, and it might change2) Based on the draft criteria presented for public consultation by the Platform on sustainable finance (https://ec.europa.eu/info/publications/210803-sustainable-finance-platform-technical-screening-criteria-taxonomy-report_en), which is not an official Commission document
(a) climate change mitigation
(b) climate change adaptation
(c) sustainable use and protection of water and
marine resources
(d) transition to a circular
economy
(e) pollution prevention and
control
(f) protection and restoration of
biodiversity and ecosystems

Outlook
16
Collection
Currency
• High activity related to preparation for new markets
• Quarterly performance will be dependent upon timing of new initiatives
• Good momentum, still some short-term challenges from COVID-19
• Mid and long-term opportunities in both the fresh and processed food segments
• Reporting in NOK and with some NOK cost base, TOMRA will in general benefit from a weak NOK, particularly measured against EUR
• With significant revenues in USD and costs in EUR, TOMRA Food is exposed to USD/EUR
Food
Recycling Mining
• Positive momentum assumed to continue, still some short term COVID-19 related challenges
• High commodity prices is assumed to drive growth
Supply Chain • Component shortage and supply chain disruptions will continue to be a risk area

17
Q&A
CopyrightThe material in this Document (which may be a presentation, video, brochure or other material), hereafter called Document, including copy, photographs, drawings and other images, remains the property of TOMRA Systems ASA or third-party contributors where appropriate. No part of this Document may be reproduced or used in any form without express written prior permission from TOMRA Systems ASA and applicable acknowledgements. No trademark, copyright or other notice shall be altered or removed from any reproduction
DisclaimerThis Document (which may be a presentation, video, brochure or other material), hereafter called Document, may include and be based on, inter alia, forward-looking information and statements that are subject to risks and uncertainties that could cause actual results to differ. The content of this Document may be based on current expectations, estimates and projections about global economic conditions, including the economic conditions of the regions and industries that are major markets for TOMRA Systems ASA and its subsidiaries and affiliates. These expectations, estimates and projections are generally identifiable by statements containing words such as “expects”, “believes”, “estimates” or similar expressions, if not part of what could be clearly characterized as a demonstration case. Important factors that could cause actual results to differ materially from those expectations include, among others, changes in economic and market conditions in the geographic areas and industries that are or will be major markets for TOMRA Systems ASA. Although TOMRA Systems ASA believes that its expectations and the Document are based upon reasonable assumptions, it can give no assurance that those expectations will be achieved or that the actual results will be as set out in the Document. TOMRA Systems ASA does not guarantee the accuracy, reliability or completeness of the Document, and TOMRA Systems ASA (including its directors, officers and employees) accepts no liability whatsoever for any direct or consequential loss arising from the use of this Document or its contents. TOMRA Systems ASA consists of many legally independent entities, constituting their own separate identities. TOMRA is used as the common brand or trademark for most of these entities. In this Document we may sometimes use “TOMRA”, “TOMRA Systems”, “we” or “us” when we refer to TOMRA Systems ASA companies in general or where no useful purpose is served by identifying any particular TOMRA Company
18