Embed Size (px)
Citation preview
b
3rd Quarter Interim Financial Report
2014
VV Holding AS | Q3 Report 2014 | Page 2
TABLE OF CONTENT
DISCLAIMER ………………………………………..……………………………………………………………………………………. 3
PRESENTATION OF THE GROUP ………………………………………………………………………………………………… 4
COMMENTS BY THE CEO ………………………………………………………………………………………………………….. 6
KEY FINANCIAL FIGURES …………………………………………………………………………………………………………… 7
RESULTS OF OPERATIONS ………………………………………………………………………………………………………… 7
FINANCIAL POSITION ……………………………………………………………………………………………………………….. 9
OPERATING AND FINANCIAL REVIEW …………………………………………………………………………………….. 10
UPDATE OF MATERIAL RISK FACTORS AND EVENTS AFTER REPORTING PERIOD …………………….. 13
CONSOLIDATED INCOME STATEMENT ……………………………………………………………………………………. 14
CONSOLIDATED STATEMENT OF COMPREHENSIVE INCOME ………………………………………………….. 15
CONSOLIDATED BALANCE SHEET ……………………………………………………………………………………………. 16
CONSOLIDATED STATEMENT OF CASH FLOWS ……………………………………………………………………….. 18
CONSOLIDATED STATEMENT OF CHANGES IN EQUITY ……………………………………………………………. 19
NOTES TO THE CONSOLIDATED FINANCIAL STATEMENTS ………………………………………………………. 20
CONTACTS ……………………………………………………………………………………………………………………………… 23
VV Holding AS | Q3 Report 2014 | Page 3
DISCLAIMER
VV Holding AS is providing the following consolidated financial results for the first nine months of 2014 to holders of its NOK 2,325,000,000 Senior Secured Floating Rate Notes due 2019.
This report is for information purposes only and does not constitute an offer to sell or the solicitation of an offer to buy the notes or any other security.
This report includes forward-looking statements which are based on our current expectations and projections about future events. All statements other than statements of historical facts included in this notice, including statements regarding our future financial position, risks and uncertainties related to our business, strategy, capital expenditures, projected costs and our plans and objectives for future operations, including our plans for future costs savings and synergies may be deemed to be forward-looking statements.
Words such as “believe,” “expect,” “anticipate,” “may,” “assume,” “plan,” “intend,” “will,” “should,” “estimate,” “risk” and similar expressions or the negatives of these expressions are intended to identify forward-looking statements. By their nature, forward-looking statements involve known and unknown risks and uncertainties because they relate to events and depend on circumstances that may or may not occur in the future. Forward-looking statements are not guarantees of future performance.
You should not place undue reliance on these forward-looking statements. In addition any forward-looking statements are made only as of the date of this notice, and we do not intend and do not assume any obligation to update any statements set forth in this notice.
VV Holding AS | Q3 Report 2014 | Page 4
PRESENTATION OF THE GROUP
The Norsk Gjenvinning Group is Norway’s leading recycling company offering a wide range of sustainable waste management services and providing secondary raw materials.
Norsk Gjenvinning is present in two markets; upstream and downstream;
In the upstream market, Norsk Gjenvinning provides waste management services to local businesses, the municipal sector and private households in Norway, Sweden, Denmark and the United Kingdom
The downstream markets consist of production/pre-treatment and sales of (i) secondary raw materials, such as recovered paper, plastic and metals to commodity producers in Scandinavia, Europe and Asia and (ii) fuels to waste-to-energy customers in Norway and Sweden
The Group’s vision is to turn waste into the resources needed for the future. Supporting the circular economy, our services encourage turning more and more waste into raw materials and resources needed for the future. The Group’s mission is to work tirelessly to become the most influential recycling company in the Nordic region. Four key values constitute the base of this effort. These four are team spirit, responsibility, proactivity and salesmanship.
The Group has 1,500 employees, 40,000 customers and handles 1.7 million tonnes of waste per year – 40% of which goes to material recycling, 45% to energy recycling and 15% to landfill.
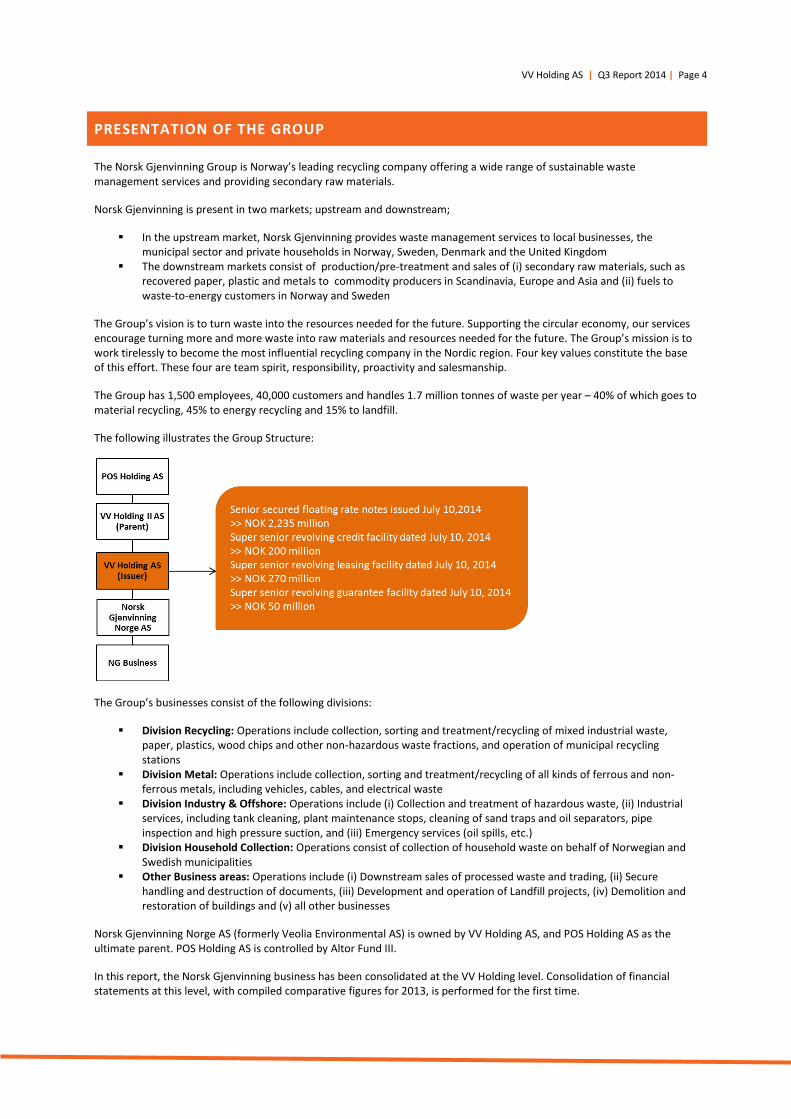
The following illustrates the Group Structure:
The Group’s businesses consist of the following divisions:
Division Recycling: Operations include collection, sorting and treatment/recycling of mixed industrial waste, paper, plastics, wood chips and other non-hazardous waste fractions, and operation of municipal recycling stations
Division Metal: Operations include collection, sorting and treatment/recycling of all kinds of ferrous and non-ferrous metals, including vehicles, cables, and electrical waste
Division Industry & Offshore: Operations include (i) Collection and treatment of hazardous waste, (ii) Industrial services, including tank cleaning, plant maintenance stops, cleaning of sand traps and oil separators, pipe inspection and high pressure suction, and (iii) Emergency services (oil spills, etc.)
Division Household Collection: Operations consist of collection of household waste on behalf of Norwegian and Swedish municipalities
Other Business areas: Operations include (i) Downstream sales of processed waste and trading, (ii) Secure handling and destruction of documents, (iii) Development and operation of Landfill projects, (iv) Demolition and restoration of buildings and (v) all other businesses
Norsk Gjenvinning Norge AS (formerly Veolia Environmental AS) is owned by VV Holding AS, and POS Holding AS as the ultimate parent. POS Holding AS is controlled by Altor Fund III.
In this report, the Norsk Gjenvinning business has been consolidated at the VV Holding level. Consolidation of financial statements at this level, with compiled comparative figures for 2013, is performed for the first time.
VV Holding AS | Q3 Report 2014 | Page 5
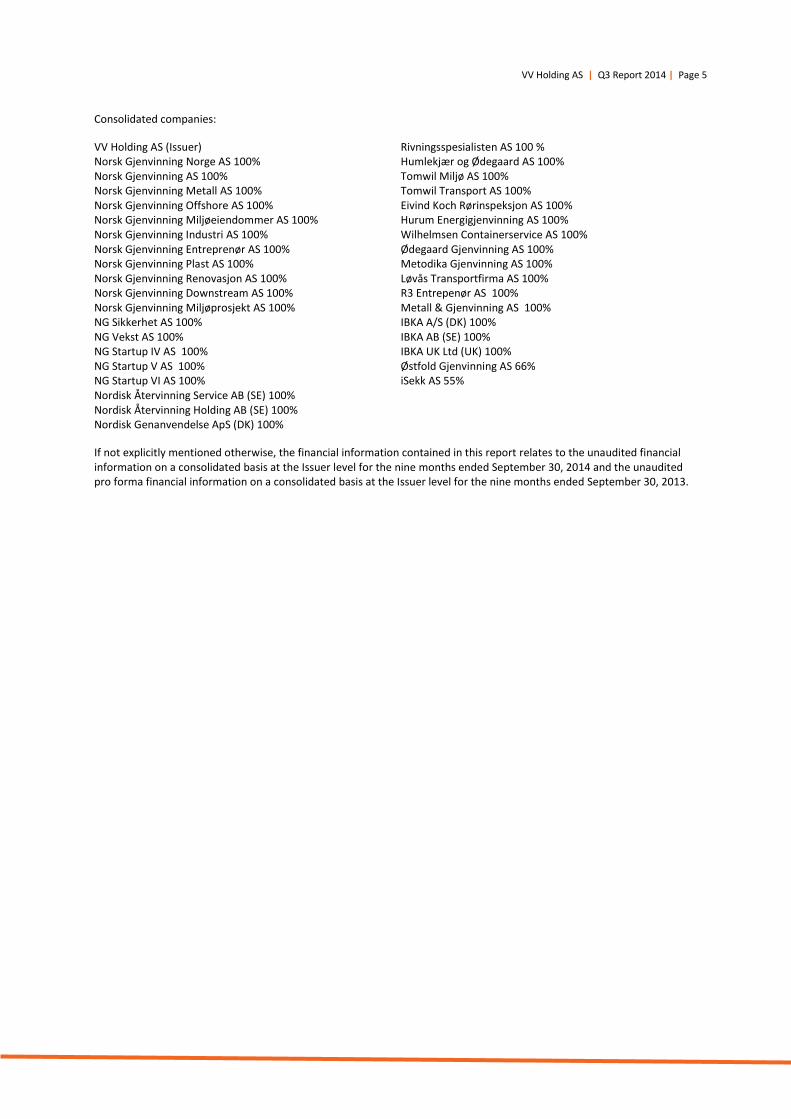
Consolidated companies:
VV Holding AS (Issuer) Norsk Gjenvinning Norge AS 100% Norsk Gjenvinning AS 100% Norsk Gjenvinning Metall AS 100% Norsk Gjenvinning Offshore AS 100% Norsk Gjenvinning Miljøeiendommer AS 100% Norsk Gjenvinning Industri AS 100% Norsk Gjenvinning Entreprenør AS 100% Norsk Gjenvinning Plast AS 100% Norsk Gjenvinning Renovasjon AS 100% Norsk Gjenvinning Downstream AS 100% Norsk Gjenvinning Miljøprosjekt AS 100% NG Sikkerhet AS 100% NG Vekst AS 100% NG Startup IV AS 100% NG Startup V AS 100% NG Startup VI AS 100% Nordisk Återvinning Service AB (SE) 100% Nordisk Återvinning Holding AB (SE) 100% Nordisk Genanvendelse ApS (DK) 100%
Rivningsspesialisten AS 100 % Humlekjær og Ødegaard AS 100% Tomwil Miljø AS 100% Tomwil Transport AS 100% Eivind Koch Rørinspeksjon AS 100% Hurum Energigjenvinning AS 100% Wilhelmsen Containerservice AS 100% Ødegaard Gjenvinning AS 100% Metodika Gjenvinning AS 100% Løvås Transportfirma AS 100% R3 Entrepenør AS 100% Metall & Gjenvinning AS 100% IBKA A/S (DK) 100% IBKA AB (SE) 100% IBKA UK Ltd (UK) 100% Østfold Gjenvinning AS 66% iSekk AS 55%
If not explicitly mentioned otherwise, the financial information contained in this report relates to the unaudited financial information on a consolidated basis at the Issuer level for the nine months ended September 30, 2014 and the unaudited pro forma financial information on a consolidated basis at the Issuer level for the nine months ended September 30, 2013.
VV Holding AS | Q3 Report 2014 | Page 6
COMMENTS BY THE CEO
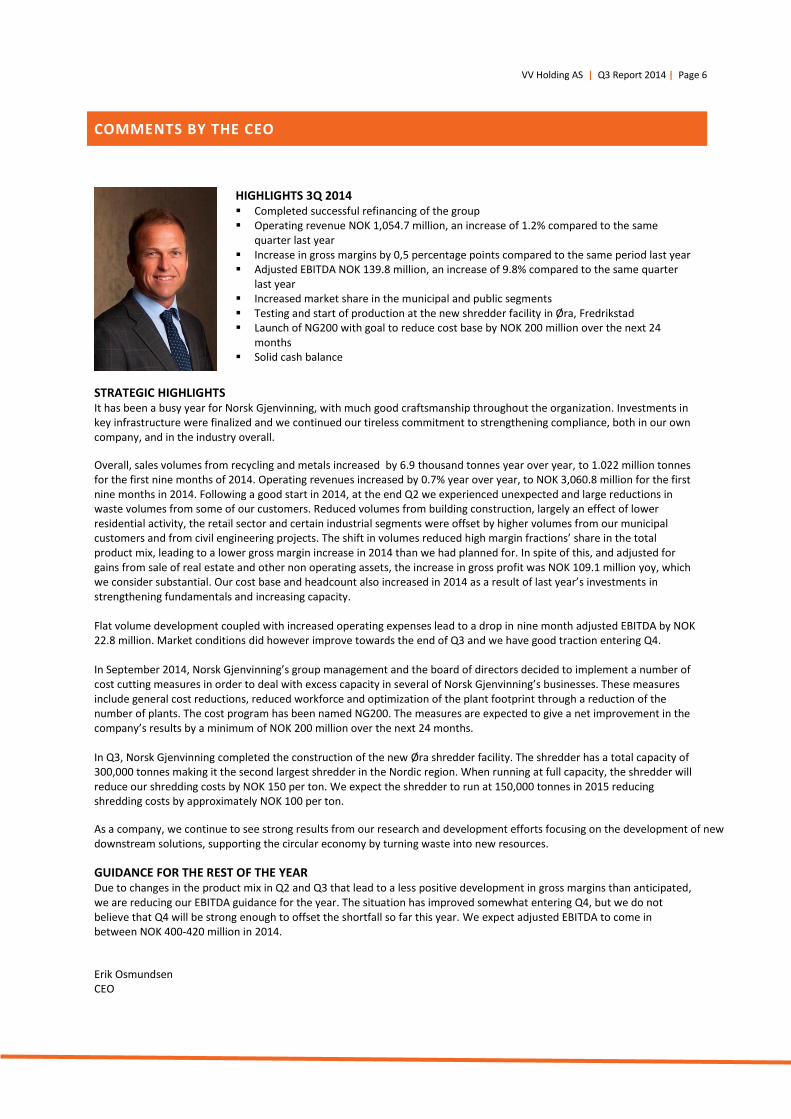
HIGHLIGHTS 3Q 2014 Completed successful refinancing of the group Operating revenue NOK 1,054.7 million, an increase of 1.2% compared to the same
quarter last year Increase in gross margins by 0,5 percentage points compared to the same period last year Adjusted EBITDA NOK 139.8 million, an increase of 9.8% compared to the same quarter
last year Increased market share in the municipal and public segments Testing and start of production at the new shredder facility in Øra, Fredrikstad Launch of NG200 with goal to reduce cost base by NOK 200 million over the next 24
months Solid cash balance
STRATEGIC HIGHLIGHTS It has been a busy year for Norsk Gjenvinning, with much good craftsmanship throughout the organization. Investments in key infrastructure were finalized and we continued our tireless commitment to strengthening compliance, both in our own company, and in the industry overall.
Overall, sales volumes from recycling and metals increased by 6.9 thousand tonnes year over year, to 1.022 million tonnes for the first nine months of 2014. Operating revenues increased by 0.7% year over year, to NOK 3,060.8 million for the first nine months in 2014. Following a good start in 2014, at the end Q2 we experienced unexpected and large reductions in waste volumes from some of our customers. Reduced volumes from building construction, largely an effect of lower residential activity, the retail sector and certain industrial segments were offset by higher volumes from our municipal customers and from civil engineering projects. The shift in volumes reduced high margin fractions’ share in the total product mix, leading to a lower gross margin increase in 2014 than we had planned for. In spite of this, and adjusted for gains from sale of real estate and other non operating assets, the increase in gross profit was NOK 109.1 million yoy, which we consider substantial. Our cost base and headcount also increased in 2014 as a result of last year’s investments in strengthening fundamentals and increasing capacity. Flat volume development coupled with increased operating expenses lead to a drop in nine month adjusted EBITDA by NOK 22.8 million. Market conditions did however improve towards the end of Q3 and we have good traction entering Q4. In September 2014, Norsk Gjenvinning’s group management and the board of directors decided to implement a number of cost cutting measures in order to deal with excess capacity in several of Norsk Gjenvinning’s businesses. These measures include general cost reductions, reduced workforce and optimization of the plant footprint through a reduction of the number of plants. The cost program has been named NG200. The measures are expected to give a net improvement in the company’s results by a minimum of NOK 200 million over the next 24 months. In Q3, Norsk Gjenvinning completed the construction of the new Øra shredder facility. The shredder has a total capacity of 300,000 tonnes making it the second largest shredder in the Nordic region. When running at full capacity, the shredder will reduce our shredding costs by NOK 150 per ton. We expect the shredder to run at 150,000 tonnes in 2015 reducing shredding costs by approximately NOK 100 per ton.
As a company, we continue to see strong results from our research and development efforts focusing on the development of new downstream solutions, supporting the circular economy by turning waste into new resources.
GUIDANCE FOR THE REST OF THE YEAR Due to changes in the product mix in Q2 and Q3 that lead to a less positive development in gross margins than anticipated, we are reducing our EBITDA guidance for the year. The situation has improved somewhat entering Q4, but we do not believe that Q4 will be strong enough to offset the shortfall so far this year. We expect adjusted EBITDA to come in between NOK 400-420 million in 2014.
Erik Osmundsen CEO
VV Holding AS | Q3 Report 2014 | Page 7
KEY FINANCIAL FIGURES
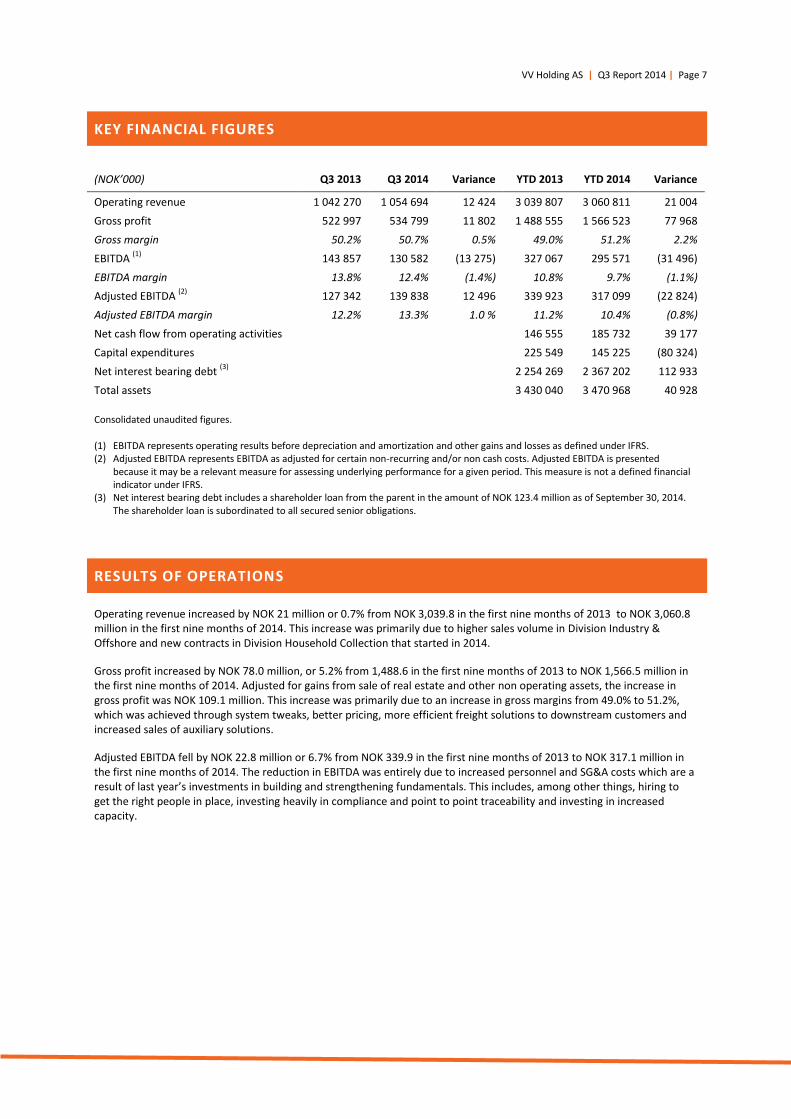
(NOK’000) Q3 2013 Q3 2014 Variance YTD 2013 YTD 2014 Variance
Operating revenue 1 042 270 1 054 694 12 424 3 039 807 3 060 811 21 004
Gross profit 522 997 534 799 11 802 1 488 555 1 566 523 77 968
Gross margin 50.2% 50.7% 0.5% 49.0% 51.2% 2.2%
EBITDA (1)
143 857 130 582 (13 275) 327 067 295 571 (31 496)
EBITDA margin 13.8% 12.4% (1.4%) 10.8% 9.7% (1.1%)
Adjusted EBITDA (2)
127 342 139 838 12 496 339 923 317 099 (22 824)
Adjusted EBITDA margin 12.2% 13.3% 1.0 % 11.2% 10.4% (0.8%)
Net cash flow from operating activities
146 555 185 732 39 177
Capital expenditures
225 549 145 225 (80 324)
Net interest bearing debt (3)
2 254 269 2 367 202 112 933
Total assets
3 430 040 3 470 968 40 928
Consolidated unaudited figures.
(1) EBITDA represents operating results before depreciation and amortization and other gains and losses as defined under IFRS. (2) Adjusted EBITDA represents EBITDA as adjusted for certain non-recurring and/or non cash costs. Adjusted EBITDA is presented
because it may be a relevant measure for assessing underlying performance for a given period. This measure is not a defined financial indicator under IFRS.
(3) Net interest bearing debt includes a shareholder loan from the parent in the amount of NOK 123.4 million as of September 30, 2014. The shareholder loan is subordinated to all secured senior obligations.
RESULTS OF OPERATIONS
Operating revenue increased by NOK 21 million or 0.7% from NOK 3,039.8 in the first nine months of 2013 to NOK 3,060.8 million in the first nine months of 2014. This increase was primarily due to higher sales volume in Division Industry & Offshore and new contracts in Division Household Collection that started in 2014.
Gross profit increased by NOK 78.0 million, or 5.2% from 1,488.6 in the first nine months of 2013 to NOK 1,566.5 million in the first nine months of 2014. Adjusted for gains from sale of real estate and other non operating assets, the increase in gross profit was NOK 109.1 million. This increase was primarily due to an increase in gross margins from 49.0% to 51.2%, which was achieved through system tweaks, better pricing, more efficient freight solutions to downstream customers and increased sales of auxiliary solutions.
Adjusted EBITDA fell by NOK 22.8 million or 6.7% from NOK 339.9 in the first nine months of 2013 to NOK 317.1 million in the first nine months of 2014. The reduction in EBITDA was entirely due to increased personnel and SG&A costs which are a result of last year’s investments in building and strengthening fundamentals. This includes, among other things, hiring to get the right people in place, investing heavily in compliance and point to point traceability and investing in increased capacity.
VV Holding AS | Q3 Report 2014 | Page 8
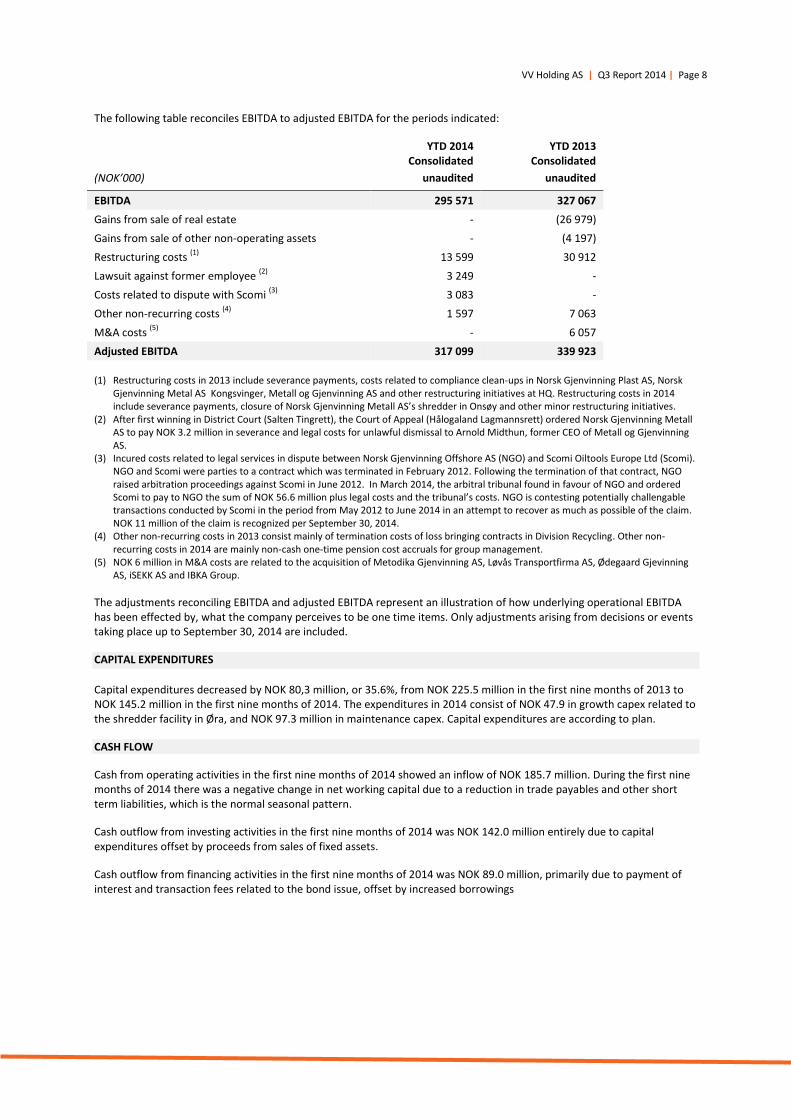
The following table reconciles EBITDA to adjusted EBITDA for the periods indicated:
YTD 2014 YTD 2013 Consolidated Consolidated
(NOK’000) unaudited unaudited
EBITDA 295 571 327 067
Gains from sale of real estate - (26 979)
Gains from sale of other non-operating assets - (4 197)
Restructuring costs (1)
13 599 30 912
Lawsuit against former employee (2)
3 249 -
Costs related to dispute with Scomi (3)
3 083 -
Other non-recurring costs (4)
1 597 7 063
M&A costs (5)
- 6 057
Adjusted EBITDA 317 099 339 923
(1) Restructuring costs in 2013 include severance payments, costs related to compliance clean-ups in Norsk Gjenvinning Plast AS, Norsk Gjenvinning Metal AS Kongsvinger, Metall og Gjenvinning AS and other restructuring initiatives at HQ. Restructuring costs in 2014 include severance payments, closure of Norsk Gjenvinning Metall AS’s shredder in Onsøy and other minor restructuring initiatives.
(2) After first winning in District Court (Salten Tingrett), the Court of Appeal (Hålogaland Lagmannsrett) ordered Norsk Gjenvinning Metall AS to pay NOK 3.2 million in severance and legal costs for unlawful dismissal to Arnold Midthun, former CEO of Metall og Gjenvinning AS.
(3) Incured costs related to legal services in dispute between Norsk Gjenvinning Offshore AS (NGO) and Scomi Oiltools Europe Ltd (Scomi). NGO and Scomi were parties to a contract which was terminated in February 2012. Following the termination of that contract, NGO raised arbitration proceedings against Scomi in June 2012. In March 2014, the arbitral tribunal found in favour of NGO and ordered Scomi to pay to NGO the sum of NOK 56.6 million plus legal costs and the tribunal’s costs. NGO is contesting potentially challengable transactions conducted by Scomi in the period from May 2012 to June 2014 in an attempt to recover as much as possible of the claim. NOK 11 million of the claim is recognized per September 30, 2014.
(4) Other non-recurring costs in 2013 consist mainly of termination costs of loss bringing contracts in Division Recycling. Other non- recurring costs in 2014 are mainly non-cash one-time pension cost accruals for group management.
(5) NOK 6 million in M&A costs are related to the acquisition of Metodika Gjenvinning AS, Løvås Transportfirma AS, Ødegaard Gjevinning AS, iSEKK AS and IBKA Group.
The adjustments reconciling EBITDA and adjusted EBITDA represent an illustration of how underlying operational EBITDA has been effected by, what the company perceives to be one time items. Only adjustments arising from decisions or events taking place up to September 30, 2014 are included.
CAPITAL EXPENDITURES
Capital expenditures decreased by NOK 80,3 million, or 35.6%, from NOK 225.5 million in the first nine months of 2013 to NOK 145.2 million in the first nine months of 2014. The expenditures in 2014 consist of NOK 47.9 in growth capex related to the shredder facility in Øra, and NOK 97.3 million in maintenance capex. Capital expenditures are according to plan.
CASH FLOW
Cash from operating activities in the first nine months of 2014 showed an inflow of NOK 185.7 million. During the first nine months of 2014 there was a negative change in net working capital due to a reduction in trade payables and other short term liabilities, which is the normal seasonal pattern.
Cash outflow from investing activities in the first nine months of 2014 was NOK 142.0 million entirely due to capital expenditures offset by proceeds from sales of fixed assets.
Cash outflow from financing activities in the first nine months of 2014 was NOK 89.0 million, primarily due to payment of interest and transaction fees related to the bond issue, offset by increased borrowings
VV Holding AS | Q3 Report 2014 | Page 9
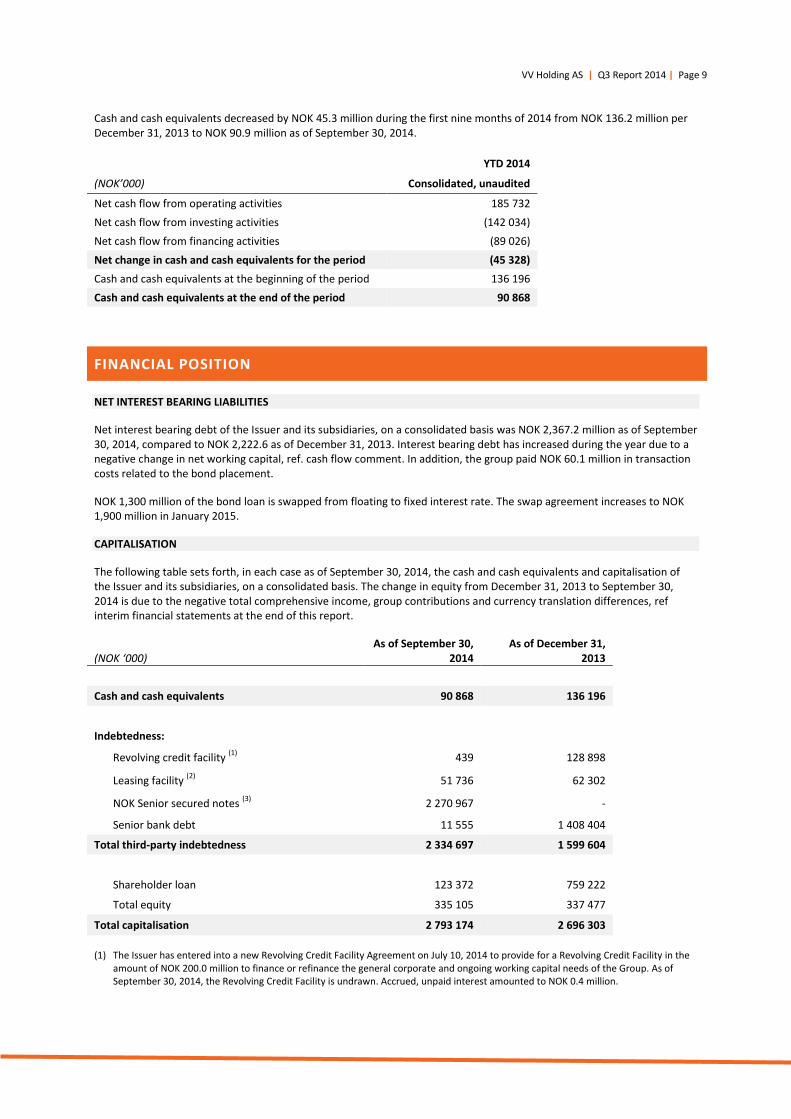
Cash and cash equivalents decreased by NOK 45.3 million during the first nine months of 2014 from NOK 136.2 million per December 31, 2013 to NOK 90.9 million as of September 30, 2014.
YTD 2014
(NOK’000) Consolidated, unaudited
Net cash flow from operating activities 185 732
Net cash flow from investing activities (142 034)
Net cash flow from financing activities (89 026)
Net change in cash and cash equivalents for the period (45 328)
Cash and cash equivalents at the beginning of the period 136 196
Cash and cash equivalents at the end of the period 90 868
FINANCIAL POSITION
NET INTEREST BEARING LIABILITIES
Net interest bearing debt of the Issuer and its subsidiaries, on a consolidated basis was NOK 2,367.2 million as of September 30, 2014, compared to NOK 2,222.6 as of December 31, 2013. Interest bearing debt has increased during the year due to a negative change in net working capital, ref. cash flow comment. In addition, the group paid NOK 60.1 million in transaction costs related to the bond placement.
NOK 1,300 million of the bond loan is swapped from floating to fixed interest rate. The swap agreement increases to NOK 1,900 million in January 2015.
CAPITALISATION
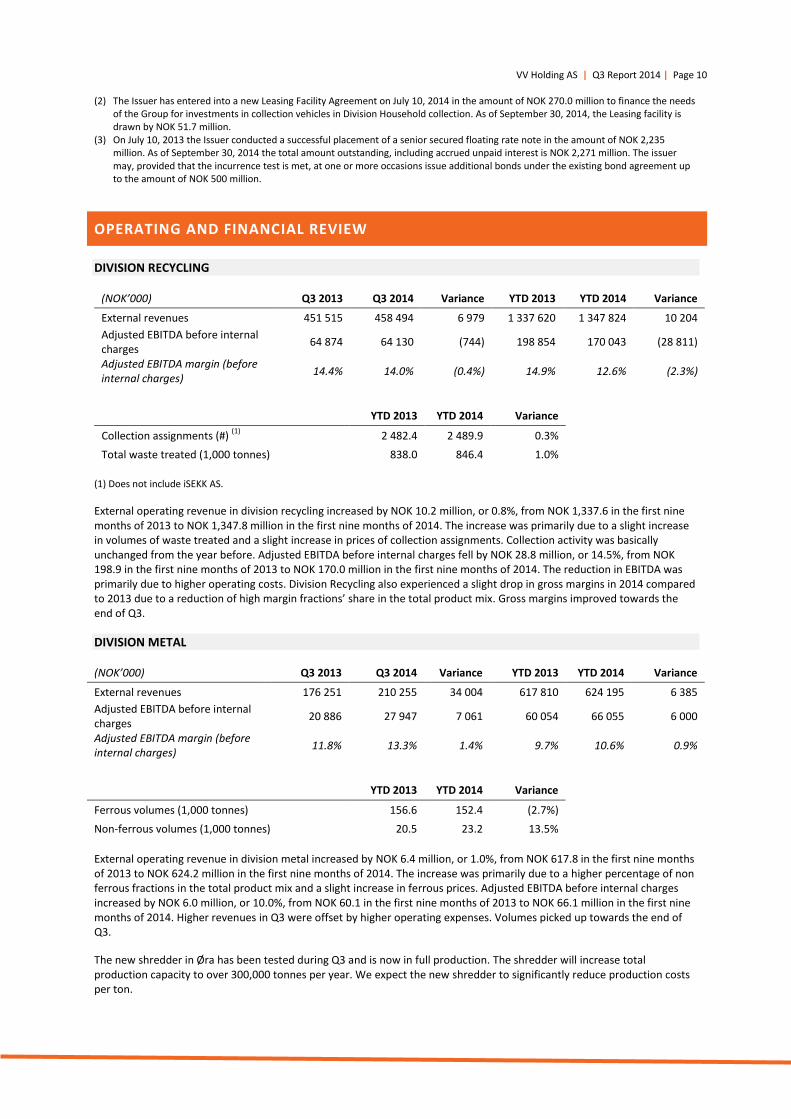
The following table sets forth, in each case as of September 30, 2014, the cash and cash equivalents and capitalisation of the Issuer and its subsidiaries, on a consolidated basis. The change in equity from December 31, 2013 to September 30, 2014 is due to the negative total comprehensive income, group contributions and currency translation differences, ref interim financial statements at the end of this report.
(NOK ‘000)
As of September 30, 2014
As of December 31, 2013
Cash and cash equivalents 90 868 136 196
Indebtedness:
Revolving credit facility
(1) 439 128 898
Leasing facility (2)
51 736 62 302
NOK Senior secured notes (3)
2 270 967 -
Senior bank debt 11 555 1 408 404
Total third-party indebtedness 2 334 697 1 599 604
Shareholder loan 123 372 759 222
Total equity 335 105 337 477
Total capitalisation 2 793 174 2 696 303
(1) The Issuer has entered into a new Revolving Credit Facility Agreement on July 10, 2014 to provide for a Revolving Credit Facility in the amount of NOK 200.0 million to finance or refinance the general corporate and ongoing working capital needs of the Group. As of September 30, 2014, the Revolving Credit Facility is undrawn. Accrued, unpaid interest amounted to NOK 0.4 million.
VV Holding AS | Q3 Report 2014 | Page 10
(2) The Issuer has entered into a new Leasing Facility Agreement on July 10, 2014 in the amount of NOK 270.0 million to finance the needs
of the Group for investments in collection vehicles in Division Household collection. As of September 30, 2014, the Leasing facility is drawn by NOK 51.7 million.
(3) On July 10, 2013 the Issuer conducted a successful placement of a senior secured floating rate note in the amount of NOK 2,235 million. As of September 30, 2014 the total amount outstanding, including accrued unpaid interest is NOK 2,271 million. The issuer may, provided that the incurrence test is met, at one or more occasions issue additional bonds under the existing bond agreement up to the amount of NOK 500 million.
OPERATING AND FINANCIAL REVIEW
DIVISION RECYCLING
(NOK’000) Q3 2013 Q3 2014 Variance YTD 2013 YTD 2014 Variance
External revenues 451 515 458 494 6 979 1 337 620 1 347 824 10 204
Adjusted EBITDA before internal charges
64 874 64 130 (744) 198 854 170 043 (28 811)
Adjusted EBITDA margin (before internal charges)
14.4% 14.0% (0.4%) 14.9% 12.6% (2.3%)
YTD 2013 YTD 2014 Variance
Collection assignments (#) (1)
2 482.4 2 489.9 0.3%
Total waste treated (1,000 tonnes) 838.0 846.4 1.0%
(1) Does not include iSEKK AS.
External operating revenue in division recycling increased by NOK 10.2 million, or 0.8%, from NOK 1,337.6 in the first nine months of 2013 to NOK 1,347.8 million in the first nine months of 2014. The increase was primarily due to a slight increase in volumes of waste treated and a slight increase in prices of collection assignments. Collection activity was basically unchanged from the year before. Adjusted EBITDA before internal charges fell by NOK 28.8 million, or 14.5%, from NOK 198.9 in the first nine months of 2013 to NOK 170.0 million in the first nine months of 2014. The reduction in EBITDA was primarily due to higher operating costs. Division Recycling also experienced a slight drop in gross margins in 2014 compared to 2013 due to a reduction of high margin fractions’ share in the total product mix. Gross margins improved towards the end of Q3.
DIVISION METAL
(NOK’000) Q3 2013 Q3 2014 Variance YTD 2013 YTD 2014 Variance
External revenues 176 251 210 255 34 004 617 810 624 195 6 385
Adjusted EBITDA before internal charges
20 886 27 947 7 061 60 054 66 055 6 000
Adjusted EBITDA margin (before internal charges)
11.8% 13.3% 1.4% 9.7% 10.6% 0.9%
YTD 2013 YTD 2014 Variance
Ferrous volumes (1,000 tonnes) 156.6 152.4 (2.7%)
Non-ferrous volumes (1,000 tonnes) 20.5 23.2 13.5%
External operating revenue in division metal increased by NOK 6.4 million, or 1.0%, from NOK 617.8 in the first nine months of 2013 to NOK 624.2 million in the first nine months of 2014. The increase was primarily due to a higher percentage of non ferrous fractions in the total product mix and a slight increase in ferrous prices. Adjusted EBITDA before internal charges increased by NOK 6.0 million, or 10.0%, from NOK 60.1 in the first nine months of 2013 to NOK 66.1 million in the first nine months of 2014. Higher revenues in Q3 were offset by higher operating expenses. Volumes picked up towards the end of Q3.
The new shredder in Øra has been tested during Q3 and is now in full production. The shredder will increase total production capacity to over 300,000 tonnes per year. We expect the new shredder to significantly reduce production costs per ton.
VV Holding AS | Q3 Report 2014 | Page 11
DIVISION INDUSTRY & OFFSHORE
(NOK’000) Q3 2013 Q3 2014 Variance YTD 2013 YTD 2014 Variance
External revenues 193 378 183 488 (9 890) 466 406 516 139 49 733
Adjusted EBITDA before internal charges
37 272 32 905 (4 367) 79 603 76 683 (2 920)
Adjusted EBITDA margin (before internal charges)
19.3% 17.9% (1.3%) 17.1% 14.9% (2.2%)
External operating revenue in Division Industry & Offshore increased by NOK 49.7 million, or 10.7%, from NOK 466.4 in the first nine months of 2013 to NOK 516.1 million in the first nine months of 2014. The increase was due to the acquisition of IBKA AS in 2013 and increased activity in the offshore sector on the west coast of Norway. Adjusted EBITDA before internal charges fell by NOK 2.9 million, or 3.7%, from NOK 79.6 in the first nine months of 2013 to NOK 76.7 million in the first nine months of 2014. The reduction in EBITDA was due to higher operating costs following the acquisition of IBKA, general cost increases and an upgrade of the customer call center.
DIVISION HOUSEHOLD COLLECTION
(NOK’000) Q3 2013 Q3 2014 Variance YTD 2013 YTD 2014 Variance
External revenues 76 532 88 063 11 531 229 750 250 133 20 383
Adjusted EBITDA before internal charges
12 482 15 160 2 678 33 890 38 747 4 857
Adjusted EBITDA margin (before internal charges)
16.3% 17.2% 0.9% 14.8% 15.5% 0.7%
The household collection division has had an increase in external operating revenues of NOK 20.4 million or 9.0% comparing YTD September 2013 and YTD September 2014. The increase in external revenues relates to higher activity due to start-up of new contracts: IRS Miljø IKS (September 2013), Falkenberg/Varberg (October 2013) and Romerike Avfallsforedling IKS (September 2014), as well as growth in and index regulation of existing contracts. These effects are reduced by the expiration of the Hadeland og Ringerike Avfallsselskap AS (May 2013) and Ålesundregionen interkommunale miljøselskap IKS (September 2013) contracts. The net effect of the changes in the contract portfolio gives a positive contribution to the adjusted EBITDA.
MARKET CONDITIONS
Norsk Gjenvinning seeks to minimize commodity price risk through a very active hedging policy, either by selling on fixed prices or hedging back-to-back on a daily basis. The inventory price risk is related to paper and metals that are discovered in the sorting process of waste (it is not possible to predict these volumes) and the estimation of throughput timing.
DEVELOPMENT IN METAL PRICES
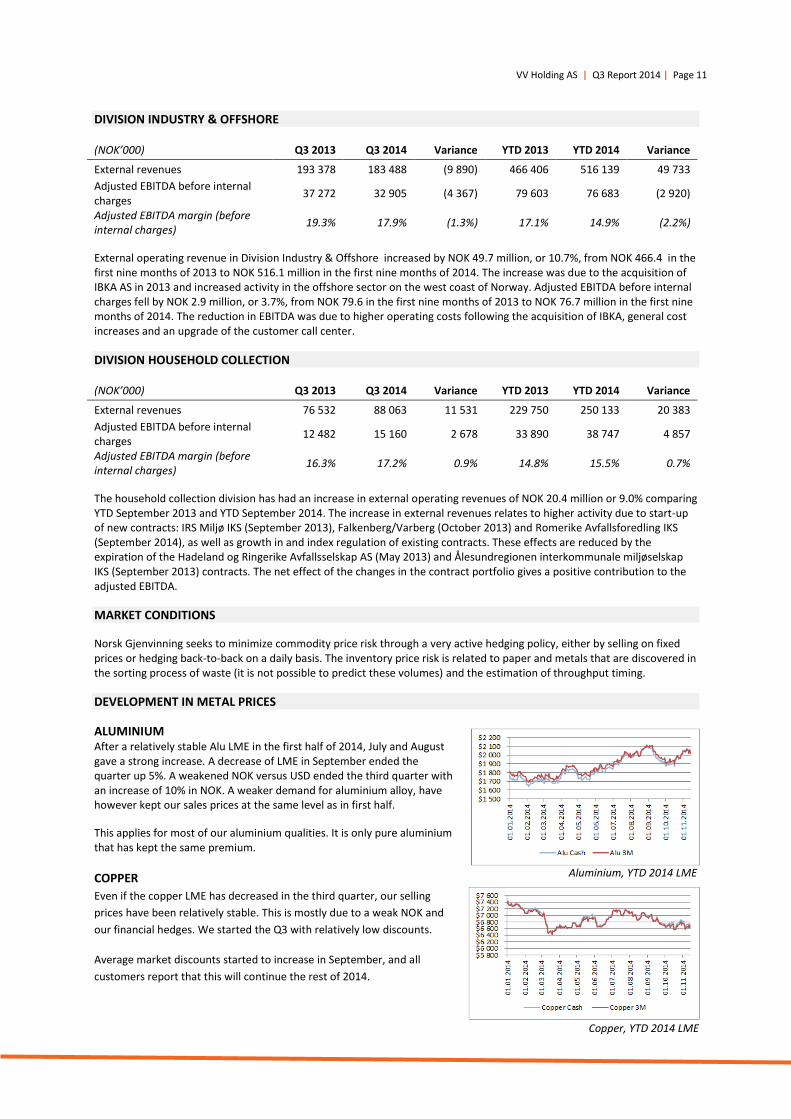
ALUMINIUM After a relatively stable Alu LME in the first half of 2014, July and August gave a strong increase. A decrease of LME in September ended the quarter up 5%. A weakened NOK versus USD ended the third quarter with an increase of 10% in NOK. A weaker demand for aluminium alloy, have however kept our sales prices at the same level as in first half.
This applies for most of our aluminium qualities. It is only pure aluminium that has kept the same premium.
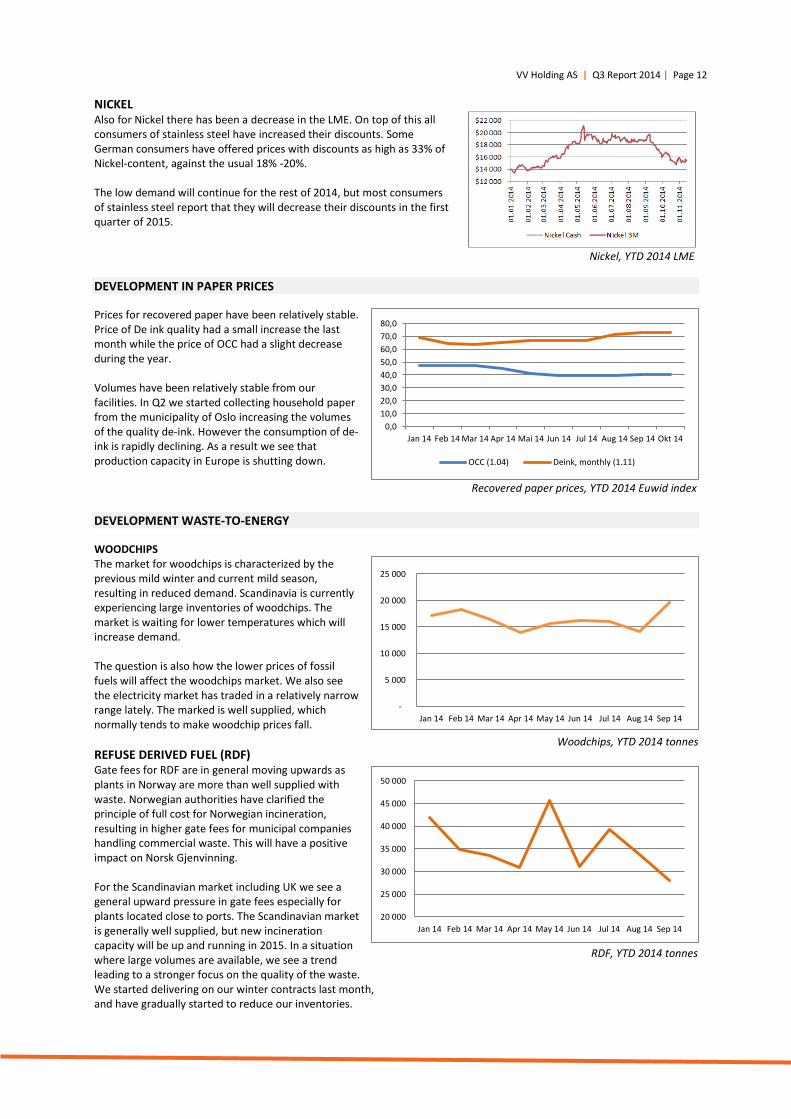
COPPER
Even if the copper LME has decreased in the third quarter, our selling
prices have been relatively stable. This is mostly due to a weak NOK and
our financial hedges. We started the Q3 with relatively low discounts.
Average market discounts started to increase in September, and all
customers report that this will continue the rest of 2014.
Copper, YTD 2014 LME
Aluminium, YTD 2014 LME
VV Holding AS | Q3 Report 2014 | Page 12
NICKEL Also for Nickel there has been a decrease in the LME. On top of this all consumers of stainless steel have increased their discounts. Some German consumers have offered prices with discounts as high as 33% of Nickel-content, against the usual 18% -20%. The low demand will continue for the rest of 2014, but most consumers of stainless steel report that they will decrease their discounts in the first quarter of 2015.
DEVELOPMENT IN PAPER PRICES
Prices for recovered paper have been relatively stable. Price of De ink quality had a small increase the last month while the price of OCC had a slight decrease during the year. Volumes have been relatively stable from our facilities. In Q2 we started collecting household paper from the municipality of Oslo increasing the volumes of the quality de-ink. However the consumption of de-ink is rapidly declining. As a result we see that production capacity in Europe is shutting down.
DEVELOPMENT WASTE-TO-ENERGY
WOODCHIPS The market for woodchips is characterized by the previous mild winter and current mild season, resulting in reduced demand. Scandinavia is currently experiencing large inventories of woodchips. The market is waiting for lower temperatures which will increase demand. The question is also how the lower prices of fossil fuels will affect the woodchips market. We also see the electricity market has traded in a relatively narrow range lately. The marked is well supplied, which normally tends to make woodchip prices fall.
REFUSE DERIVED FUEL (RDF) Gate fees for RDF are in general moving upwards as plants in Norway are more than well supplied with waste. Norwegian authorities have clarified the principle of full cost for Norwegian incineration, resulting in higher gate fees for municipal companies handling commercial waste. This will have a positive impact on Norsk Gjenvinning. For the Scandinavian market including UK we see a general upward pressure in gate fees especially for plants located close to ports. The Scandinavian market is generally well supplied, but new incineration capacity will be up and running in 2015. In a situation where large volumes are available, we see a trend leading to a stronger focus on the quality of the waste. We started delivering on our winter contracts last month, and have gradually started to reduce our inventories.
-
5 000
10 000
15 000
20 000
25 000
Jan 14 Feb 14 Mar 14 Apr 14 May 14 Jun 14 Jul 14 Aug 14 Sep 14
Woodchips, YTD 2014 tonnes
0,0
10,0
20,0
30,0
40,0
50,0
60,0
70,0
80,0
Jan 14 Feb 14 Mar 14 Apr 14 Mai 14 Jun 14 Jul 14 Aug 14 Sep 14 Okt 14
OCC (1.04) Deink, monthly (1.11)
Recovered paper prices, YTD 2014 Euwid index
Nickel, YTD 2014 LME
20 000
25 000
30 000
35 000
40 000
45 000
50 000
Jan 14 Feb 14 Mar 14 Apr 14 May 14 Jun 14 Jul 14 Aug 14 Sep 14
RDF, YTD 2014 tonnes
VV Holding AS | Q3 Report 2014 | Page 13
UPDATE OF MATERIAL RISK FACTORS AND EVENTS AFTER REPORTING PERIOD
With the exception of the update below, no significant changes in risk factors have been identified which will affect the Group through the coming quarter. For additional explanations regarding risks and uncertainties, please refer to the Board of Directors Report section Risk and Risk Management and Note 6 Financial Risk Management in the 2013 Annual Report for POS Holding Group.
SCOMI RECEIVABLE CASE
As disclosed in the 2013 Annual report, Norsk Gjenvinning Offshore (NGO) has been involved in a debt collection case against one of its former partners, Scomi Oiltools Europe Ltd. (Scomi). NGO and Scomi were parties to a contract which was terminated in February 2012. Following the termination of that contract, NGO raised arbitration proceedings against Scomi in June 2012. In March 2014, the arbitral tribunal found in favour of NGO and ordered Scomi to pay to NGO the sum of NOK 56.6 million plus legal costs and the tribunal’s costs. NGO is in the process of contesting potentially challengable transactions conducted by Scomi in the period from May 2012 to June 2014 in an attempt to recover as much as possible of the outstanding amount. NOK 11 million of the claim is recognized in the balance sheet per September 30, 2014.
LITIGATION PROCEEDINGS VS. KLP SKADEFORSIKRING AS
As disclosed in the 2013 Annual report, Norsk Gjenvinning AS (NG) has been involved in litigation proceedings in connection with a fire in NG’s Stavanger facility. The insurer (KLP) notified NG that it would use its right of recourse for payment to the landlord for building damages in the amount of NOK 9.9 million. KLP argued that NG had an objective responsibility for the fire according to the lease agreement. NG had not taken provisions for the claim in its annual accounts based on a legal opinion that the claim was unjustified. In October 2014, the District Court in Stavanger found in favour of KLP and ordered NG to pay the sum of NOK 10.7 million including legal costs and interest to KLP. NG has decided to submit an appeal to the higher court. Following the District Court’s ruling, NG will take a one time non-recurring charge of NOK 10.7 million in Q4 pending final court judgement.
ACQUISITION OF 13 GRUPPEN AS
On October 15, 2014 an NG subsidiary Rivningsspesialisten AS, has completed the acquisition of 13 Gruppen AS. The transaction is designed as a share swap agreement in which the owners of 13 Gruppen will receive a 22.5% ownership stake in Rivningsspesialisten AS as payment for their shares in 13 Gruppen AS. The transaction values the shares in 13 Gruppen AS at NOK 11.6 million. 13 Gruppen will be fully consolidated in Q4 accounts.
NG200
In September 2014, Norsk Gjenvinning’s group management and the board of directors decided to implement a number of cost cutting measures in order to deal with excess capacity in several of Norsk Gjenvinning’s businesses. These measures include general cost reductions, reduced workforce and optimization of the plant footprint through a reduction of the number of plants. The cost program has been named NG200. The measures are expected to give a net improvement in the company’s results by a minimum of NOK 200 million over the next 24 months. A detailed plan for NG200 will be developed in November/December of 2014 and presented in Q4 earnings release. Any necessary charges for non-recurring costs in connection with write-downs and allocations for severance pay, etc will be taken in Q4.
MONGSTAD SPILL
Based on Compliance reporting, Norsk Gjenvinning Norge engaged DNV-GL to investigate the operation in Norsk Gjenvinning Industri (NGI) at our Mongstad Base. A preliminary report in September 2014 shows three different uncontrolled spills of hazardous waste from the processing plant. The spills took place in 2013 and 2014. The company immediately stopped all controlled disposal of hazardous waste from the plant until further notice. The handling of the situation has received credit from the authorities, but may still be fined due to the incidents.
MATERIAL CHANGES IN LIQUIDITY AND CAPITAL RESOURCES
The Group continually analyses its liquidity and capital resources position. The Group has assessed its currently available capital resources and its current liquidity position as satisfactory and not noted any material changes in the current period.
VV Holding AS | Q3 Report 2014 | Page 14
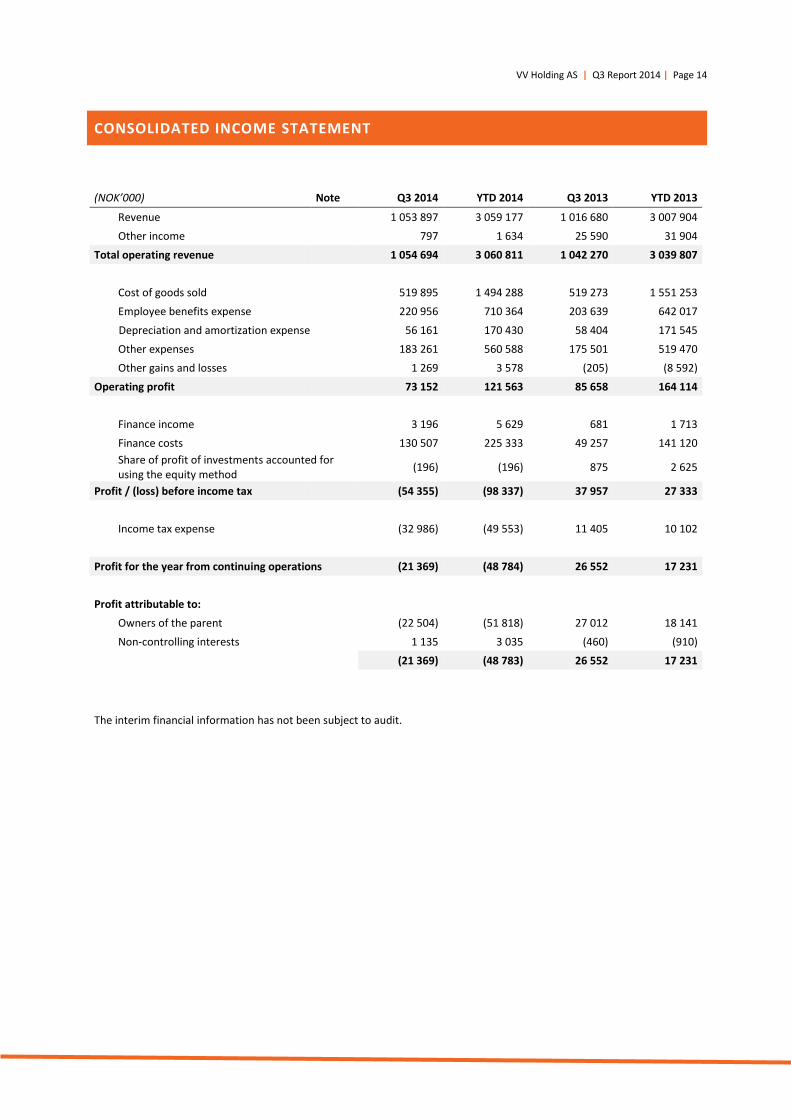
CONSOLIDATED INCOME STATEMENT
(NOK’000) Note Q3 2014 YTD 2014 Q3 2013 YTD 2013
Revenue
1 053 897 3 059 177 1 016 680 3 007 904
Other income
797 1 634 25 590 31 904
Total operating revenue
1 054 694 3 060 811 1 042 270 3 039 807
Cost of goods sold
519 895 1 494 288 519 273 1 551 253
Employee benefits expense
220 956 710 364 203 639 642 017
Depreciation and amortization expense 56 161 170 430 58 404 171 545
Other expenses
183 261 560 588 175 501 519 470
Other gains and losses
1 269 3 578 (205) (8 592)
Operating profit
73 152 121 563 85 658 164 114
Finance income
3 196 5 629 681 1 713
Finance costs
130 507 225 333 49 257 141 120
Share of profit of investments accounted for using the equity method
(196) (196) 875 2 625
Profit / (loss) before income tax
(54 355) (98 337) 37 957 27 333
Income tax expense
(32 986) (49 553) 11 405 10 102
Profit for the year from continuing operations (21 369) (48 784) 26 552 17 231
Profit attributable to:
Owners of the parent
(22 504) (51 818) 27 012 18 141
Non-controlling interests
1 135 3 035 (460) (910)
(21 369) (48 783) 26 552 17 231
The interim financial information has not been subject to audit.
VV Holding AS | Q3 Report 2014 | Page 15
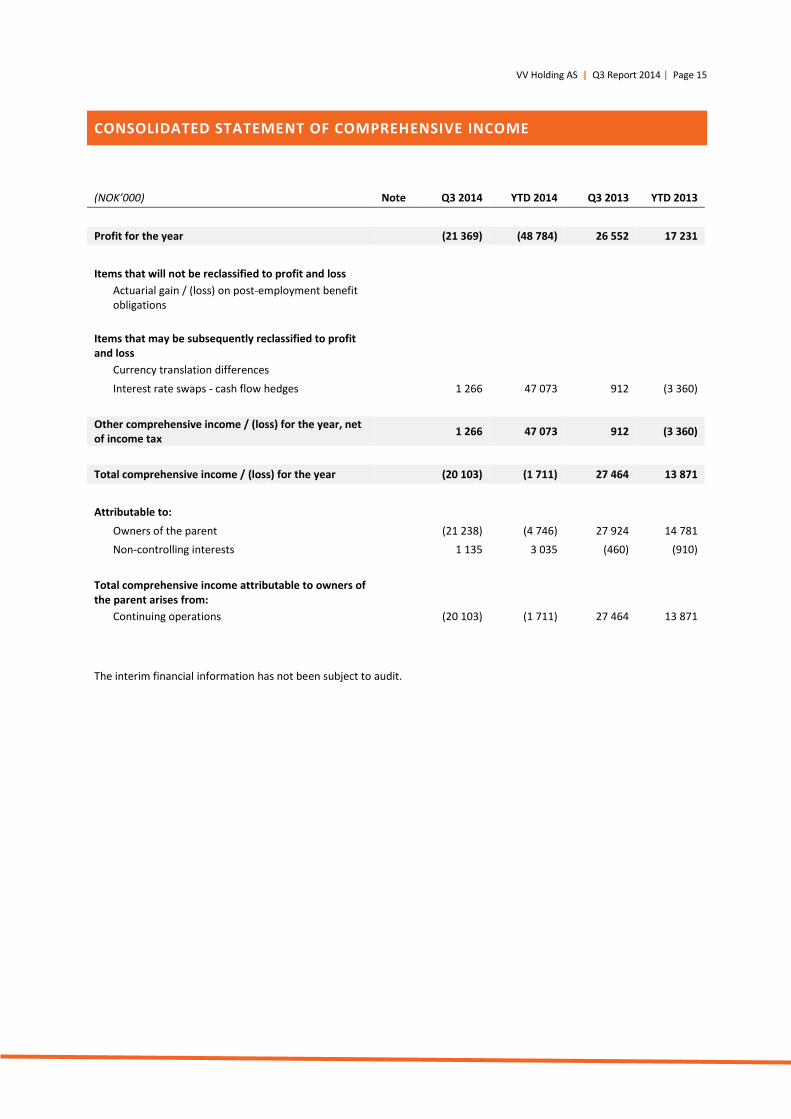
CONSOLIDATED STATEMENT OF COMPREHENSIVE INCOME
(NOK’000) Note Q3 2014 YTD 2014 Q3 2013 YTD 2013
Profit for the year
(21 369) (48 784) 26 552 17 231
Items that will not be reclassified to profit and loss
Actuarial gain / (loss) on post-employment benefit obligations
Items that may be subsequently reclassified to profit and loss
Currency translation differences
Interest rate swaps - cash flow hedges
1 266 47 073 912 (3 360)
Other comprehensive income / (loss) for the year, net of income tax
1 266 47 073 912 (3 360)
Total comprehensive income / (loss) for the year
(20 103) (1 711) 27 464 13 871
Attributable to:
Owners of the parent
(21 238) (4 746) 27 924 14 781
Non-controlling interests
1 135 3 035 (460) (910)
Total comprehensive income attributable to owners of the parent arises from:
Continuing operations
(20 103) (1 711) 27 464 13 871
The interim financial information has not been subject to audit.
VV Holding AS | Q3 Report 2014 | Page 16
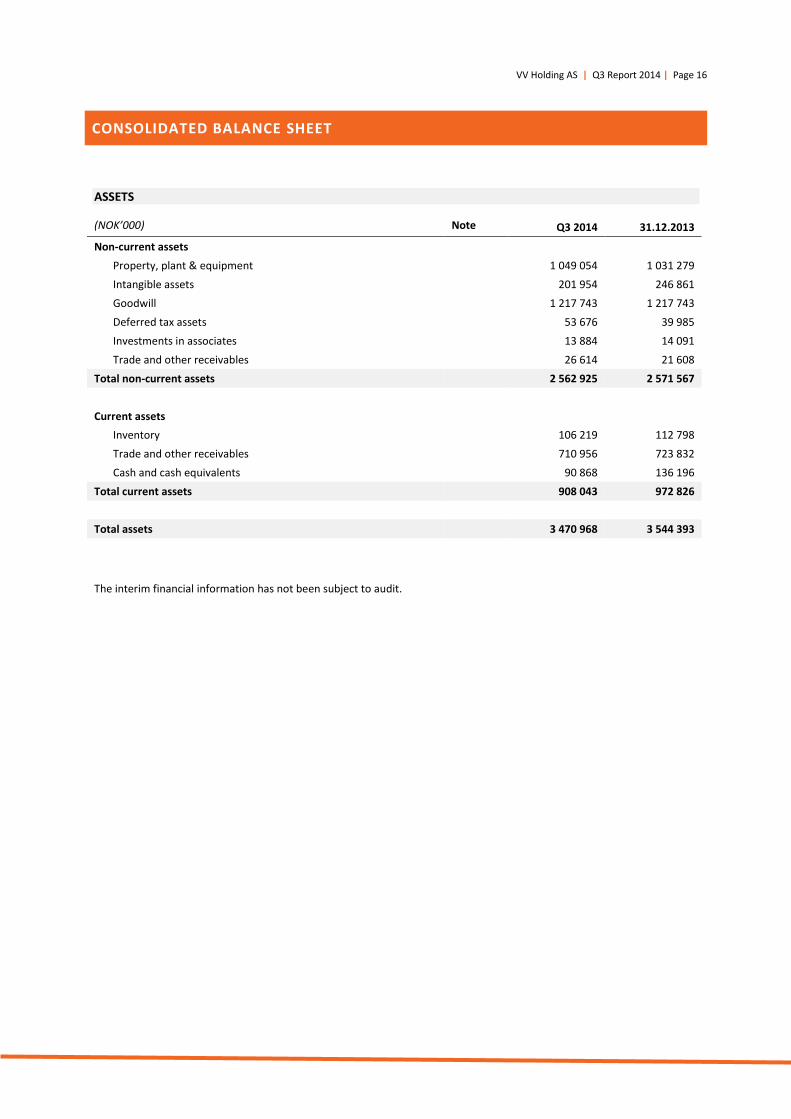
CONSOLIDATED BALANCE SHEET
ASSETS
(NOK’000) Note Q3 2014 31.12.2013
Non-current assets
Property, plant & equipment
1 049 054 1 031 279
Intangible assets
201 954 246 861
Goodwill
1 217 743 1 217 743
Deferred tax assets
53 676 39 985
Investments in associates
13 884 14 091
Trade and other receivables
26 614 21 608
Total non-current assets
2 562 925 2 571 567
Current assets
Inventory
106 219 112 798
Trade and other receivables
710 956 723 832
Cash and cash equivalents
90 868 136 196
Total current assets
908 043 972 826
Total assets
3 470 968 3 544 393
The interim financial information has not been subject to audit.
VV Holding AS | Q3 Report 2014 | Page 17
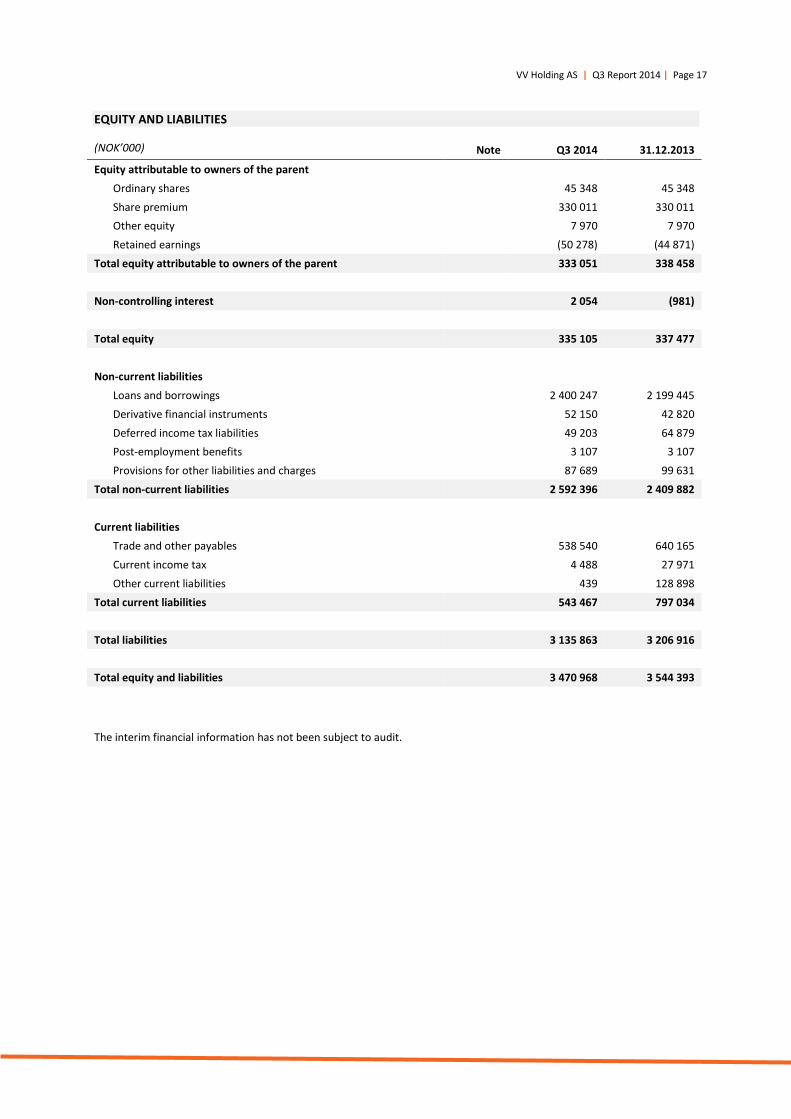
EQUITY AND LIABILITIES
(NOK’000) Note Q3 2014 31.12.2013
Equity attributable to owners of the parent
Ordinary shares
45 348 45 348
Share premium
330 011 330 011
Other equity
7 970 7 970
Retained earnings
(50 278) (44 871)
Total equity attributable to owners of the parent
333 051 338 458
Non-controlling interest
2 054 (981)
Total equity
335 105 337 477
Non-current liabilities
Loans and borrowings
2 400 247 2 199 445
Derivative financial instruments
52 150 42 820
Deferred income tax liabilities
49 203 64 879
Post-employment benefits
3 107 3 107
Provisions for other liabilities and charges
87 689 99 631
Total non-current liabilities
2 592 396 2 409 882
Current liabilities
Trade and other payables
538 540 640 165
Current income tax
4 488 27 971
Other current liabilities
439 128 898
Total current liabilities
543 467 797 034
Total liabilities
3 135 863 3 206 916
Total equity and liabilities
3 470 968 3 544 393
The interim financial information has not been subject to audit.
VV Holding AS | Q3 Report 2014 | Page 18
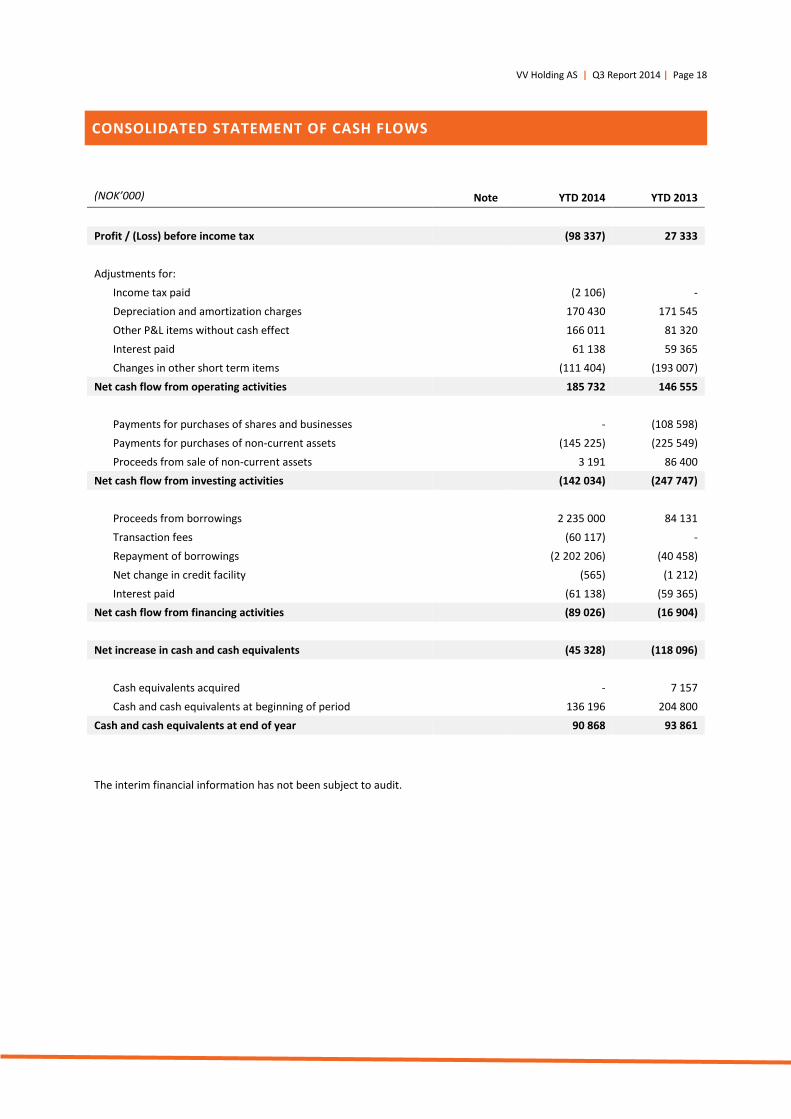
CONSOLIDATED STATEMENT OF CASH FLOWS
(NOK’000) Note YTD 2014 YTD 2013
Profit / (Loss) before income tax
(98 337) 27 333
Adjustments for:
Income tax paid
(2 106) -
Depreciation and amortization charges
170 430 171 545
Other P&L items without cash effect
166 011 81 320
Interest paid
61 138 59 365
Changes in other short term items
(111 404) (193 007)
Net cash flow from operating activities
185 732 146 555
Payments for purchases of shares and businesses
- (108 598)
Payments for purchases of non-current assets
(145 225) (225 549)
Proceeds from sale of non-current assets
3 191 86 400
Net cash flow from investing activities
(142 034) (247 747)
Proceeds from borrowings
2 235 000 84 131
Transaction fees
(60 117) -
Repayment of borrowings
(2 202 206) (40 458)
Net change in credit facility
(565) (1 212)
Interest paid
(61 138) (59 365)
Net cash flow from financing activities
(89 026) (16 904)
Net increase in cash and cash equivalents
(45 328) (118 096)
Cash equivalents acquired
- 7 157
Cash and cash equivalents at beginning of period
136 196 204 800
Cash and cash equivalents at end of year
90 868 93 861
The interim financial information has not been subject to audit.
VV Holding AS | Q3 Report 2014 | Page 19
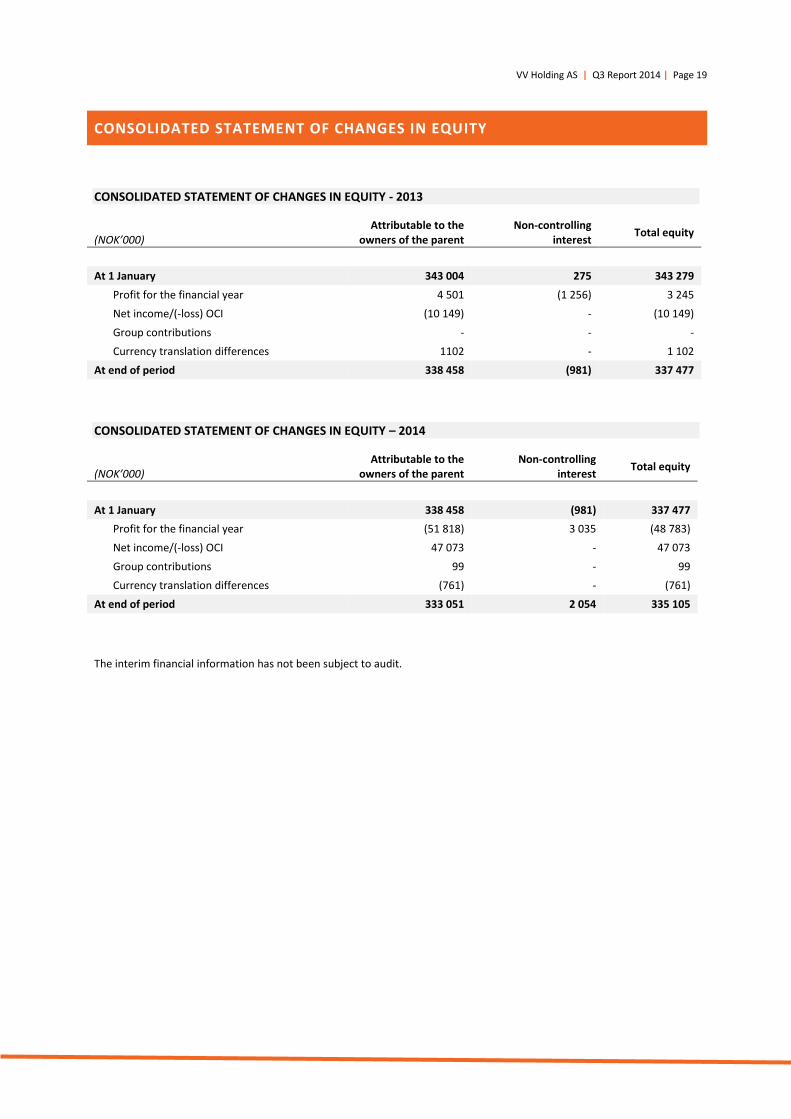
CONSOLIDATED STATEMENT OF CHANGES IN EQUITY
CONSOLIDATED STATEMENT OF CHANGES IN EQUITY - 2013
(NOK’000)
Attributable to the owners of the parent
Non-controlling interest
Total equity
At 1 January 343 004 275 343 279
Profit for the financial year 4 501 (1 256) 3 245
Net income/(-loss) OCI (10 149) - (10 149)
Group contributions - - -
Currency translation differences 1102 - 1 102
At end of period 338 458 (981) 337 477
CONSOLIDATED STATEMENT OF CHANGES IN EQUITY – 2014
(NOK’000)
Attributable to the owners of the parent
Non-controlling interest
Total equity
At 1 January 338 458 (981) 337 477
Profit for the financial year (51 818) 3 035 (48 783)
Net income/(-loss) OCI 47 073 - 47 073
Group contributions 99 - 99
Currency translation differences (761) - (761)
At end of period 333 051 2 054 335 105
The interim financial information has not been subject to audit.
VV Holding AS | Q3 Report 2014 | Page 20
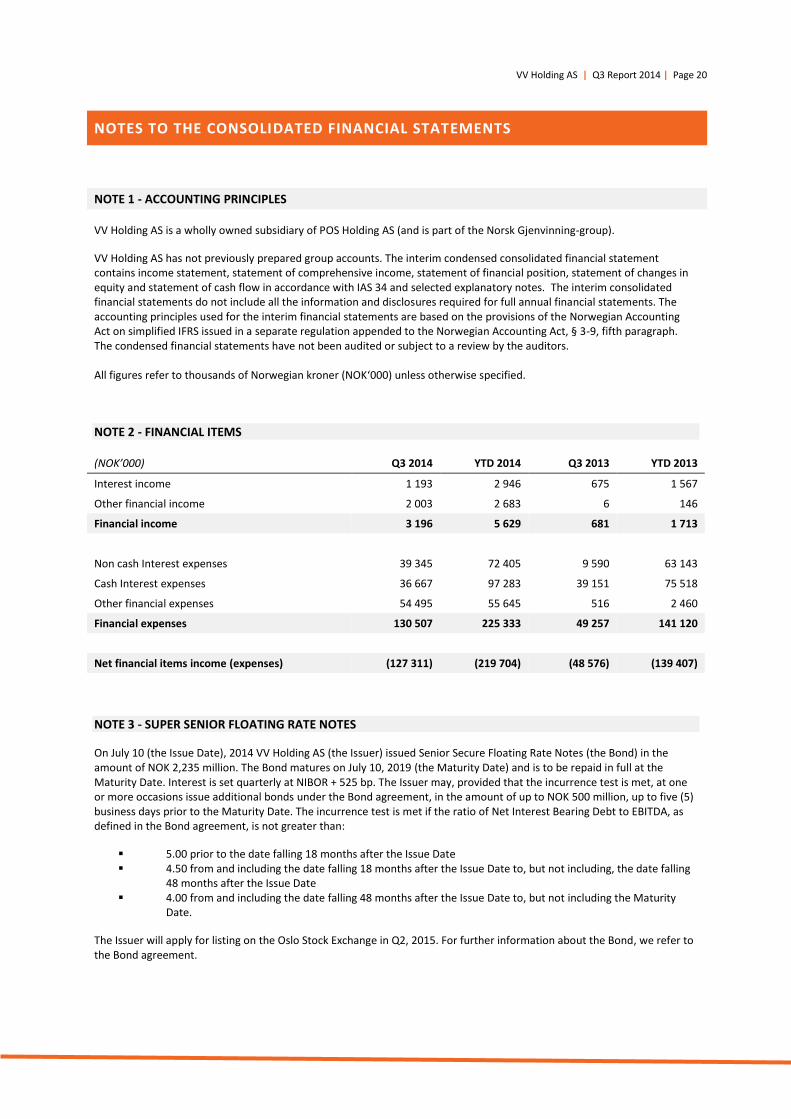
NOTES TO THE CONSOLIDATED FINANCIAL STATEMENTS
NOTE 1 - ACCOUNTING PRINCIPLES
VV Holding AS is a wholly owned subsidiary of POS Holding AS (and is part of the Norsk Gjenvinning-group).
VV Holding AS has not previously prepared group accounts. The interim condensed consolidated financial statement contains income statement, statement of comprehensive income, statement of financial position, statement of changes in equity and statement of cash flow in accordance with IAS 34 and selected explanatory notes. The interim consolidated financial statements do not include all the information and disclosures required for full annual financial statements. The accounting principles used for the interim financial statements are based on the provisions of the Norwegian Accounting Act on simplified IFRS issued in a separate regulation appended to the Norwegian Accounting Act, § 3-9, fifth paragraph. The condensed financial statements have not been audited or subject to a review by the auditors. All figures refer to thousands of Norwegian kroner (NOK‘000) unless otherwise specified.
NOTE 2 - FINANCIAL ITEMS
(NOK’000) Q3 2014 YTD 2014 Q3 2013 YTD 2013
Interest income 1 193 2 946 675 1 567
Other financial income 2 003 2 683 6 146
Financial income 3 196 5 629 681 1 713
Non cash Interest expenses 39 345 72 405 9 590 63 143
Cash Interest expenses 36 667 97 283 39 151 75 518
Other financial expenses 54 495 55 645 516 2 460
Financial expenses 130 507 225 333 49 257 141 120
Net financial items income (expenses) (127 311) (219 704) (48 576) (139 407)
NOTE 3 - SUPER SENIOR FLOATING RATE NOTES
On July 10 (the Issue Date), 2014 VV Holding AS (the Issuer) issued Senior Secure Floating Rate Notes (the Bond) in the amount of NOK 2,235 million. The Bond matures on July 10, 2019 (the Maturity Date) and is to be repaid in full at the Maturity Date. Interest is set quarterly at NIBOR + 525 bp. The Issuer may, provided that the incurrence test is met, at one or more occasions issue additional bonds under the Bond agreement, in the amount of up to NOK 500 million, up to five (5) business days prior to the Maturity Date. The incurrence test is met if the ratio of Net Interest Bearing Debt to EBITDA, as defined in the Bond agreement, is not greater than:
5.00 prior to the date falling 18 months after the Issue Date 4.50 from and including the date falling 18 months after the Issue Date to, but not including, the date falling
48 months after the Issue Date 4.00 from and including the date falling 48 months after the Issue Date to, but not including the Maturity
Date.
The Issuer will apply for listing on the Oslo Stock Exchange in Q2, 2015. For further information about the Bond, we refer to the Bond agreement.
VV Holding AS | Q3 Report 2014 | Page 21
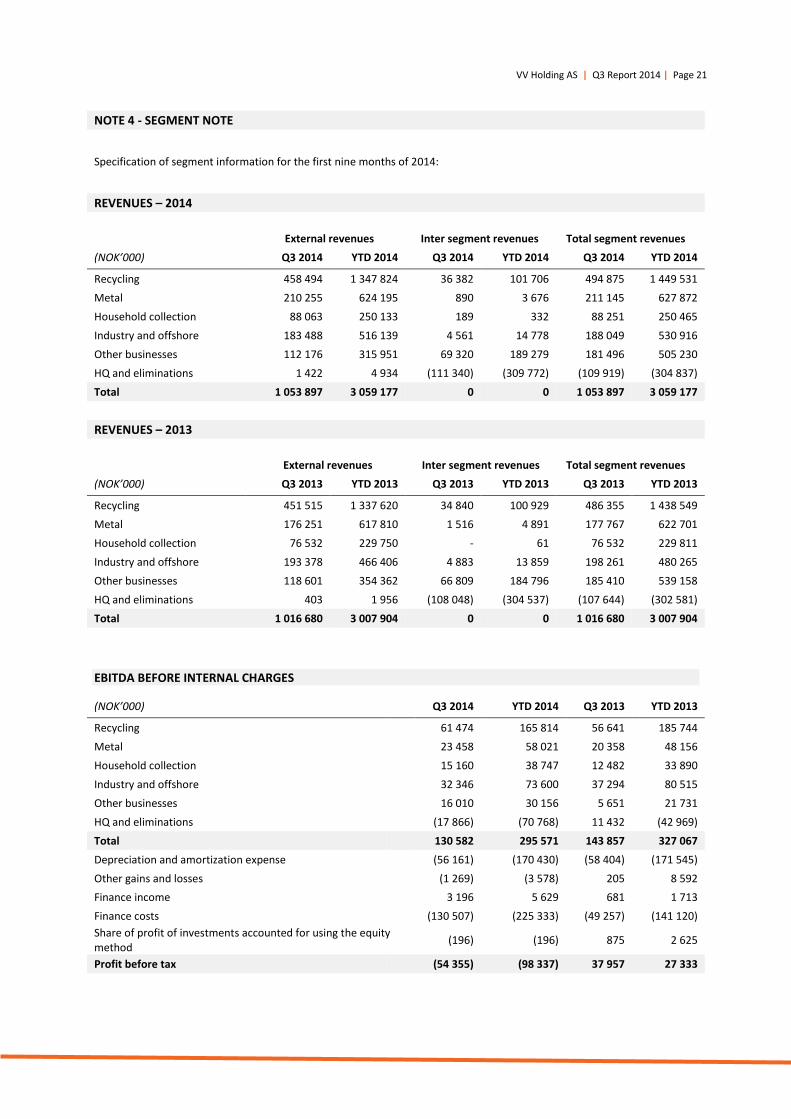
NOTE 4 - SEGMENT NOTE
Specification of segment information for the first nine months of 2014:
REVENUES – 2014
External revenues Inter segment revenues Total segment revenues
(NOK’000) Q3 2014 YTD 2014 Q3 2014 YTD 2014 Q3 2014 YTD 2014
Recycling 458 494 1 347 824 36 382 101 706 494 875 1 449 531
Metal 210 255 624 195 890 3 676 211 145 627 872
Household collection 88 063 250 133 189 332 88 251 250 465
Industry and offshore 183 488 516 139 4 561 14 778 188 049 530 916
Other businesses 112 176 315 951 69 320 189 279 181 496 505 230
HQ and eliminations 1 422 4 934 (111 340) (309 772) (109 919) (304 837)
Total 1 053 897 3 059 177 0 0 1 053 897 3 059 177
REVENUES – 2013
External revenues Inter segment revenues Total segment revenues
(NOK’000) Q3 2013 YTD 2013 Q3 2013 YTD 2013 Q3 2013 YTD 2013
Recycling 451 515 1 337 620 34 840 100 929 486 355 1 438 549
Metal 176 251 617 810 1 516 4 891 177 767 622 701
Household collection 76 532 229 750 - 61 76 532 229 811
Industry and offshore 193 378 466 406 4 883 13 859 198 261 480 265
Other businesses 118 601 354 362 66 809 184 796 185 410 539 158
HQ and eliminations 403 1 956 (108 048) (304 537) (107 644) (302 581)
Total 1 016 680 3 007 904 0 0 1 016 680 3 007 904
EBITDA BEFORE INTERNAL CHARGES
(NOK’000) Q3 2014 YTD 2014 Q3 2013 YTD 2013
Recycling
61 474 165 814 56 641 185 744
Metal
23 458 58 021 20 358 48 156
Household collection
15 160 38 747 12 482 33 890
Industry and offshore
32 346 73 600 37 294 80 515
Other businesses 16 010 30 156 5 651 21 731
HQ and eliminations (17 866) (70 768) 11 432 (42 969)
Total
130 582 295 571 143 857 327 067
Depreciation and amortization expense (56 161) (170 430) (58 404) (171 545)
Other gains and losses (1 269) (3 578) 205 8 592
Finance income 3 196 5 629 681 1 713
Finance costs (130 507) (225 333) (49 257) (141 120)
Share of profit of investments accounted for using the equity method
(196) (196) 875 2 625
Profit before tax
(54 355) (98 337) 37 957 27 333
VV Holding AS | Q3 Report 2014 | Page 22
NOTE 5 - EVENTS AFTER THE REPORTING PERIOD
Events after the reporting period have been described on page 13 and 14 under the heading “Update of material risk factors and events after the reporting period”.
VV Holding AS | Q3 Report 2014 | Page 23
CONTACTS
Dean Zuzic CFO
Phone: +47 414 33 560 [email protected]
Published by Norsk Gjenvinning Norge AS 25 November 2014